Embed Size (px)
Citation preview
Consulting Report for
United Airlines
Liyan Wang
Analytical Tools for Marketers
Dr. Zafar Iqbal, DePaul University
1
Contents
Introduction …………………………………………………………………2
Overview ………………………………………………………………….2
Findings/Recommendations ………………………………………………2
Perceptual Mapping ………………………………………………2
Conjoint Analysis ………………………………………………4
Value Curve Study ………………………………………………5
Conclusion ………………………………………………………………......6
Appendix ……………………………………………………………………7
2
Introduction
United Airlines has been facing a steady erosion of profitability and market share to
Southwest Airlines after its emergence from Chapter 11.
Different analytical techniques were applied in order to solve this problem, including
multidimensional scaling (perceptual mapping), exploratory factor analysis (EFA),
conjoint analysis and value curve study. The data gathering process was both quantitative
in examining records, reports and surveys as well as qualitative through focus group
discussions and authority interviews.
The key objectives of the consultation were to:
Understand the perception of brand and the driving factors that affect performance;
Understand customer value structure in terms of airline choice and create the optimal
product;
Draw a new value curve for United Airlines, summarize with a simple tagline and
show economies of scale for sustainability.
This report is a summary of findings and recommendations.
Overview
United Airlines (commonly referred to as “United”) is the world's largest airline when
measured by number of destinations served. United operates a comprehensive domestic
and international route network, and has significant presence in the Asia-Pacific region.
The main competitors are American Airlines, Delta Air Lines, and Southwest Airlines.
United resurrected the popular “Fly the Friendly Skies” slogan in September 2013. Such
customer-focused campaign is based on feedback from customers that “user-friendly”
means the combination of service, technology and product enhancements. Thus United
designed investments in global route network, new aircraft, onboard features, customer
service and digital channels to be “flyer-friendly.”
Finding/Recommendations
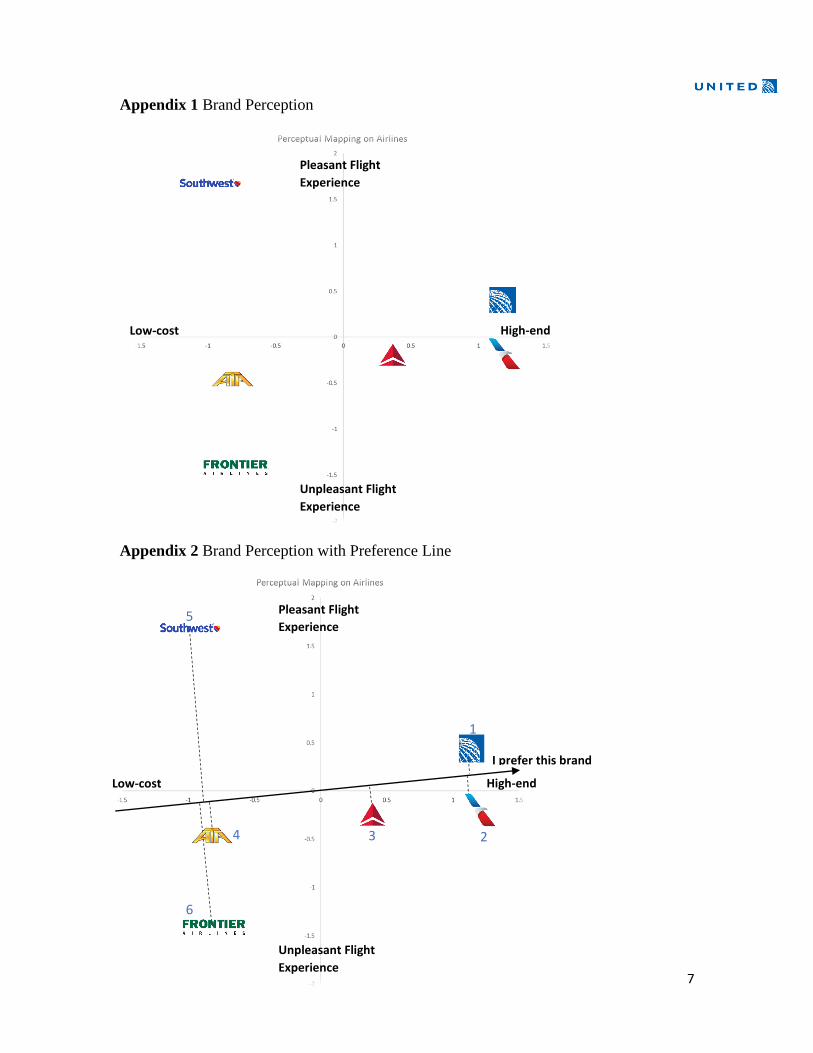
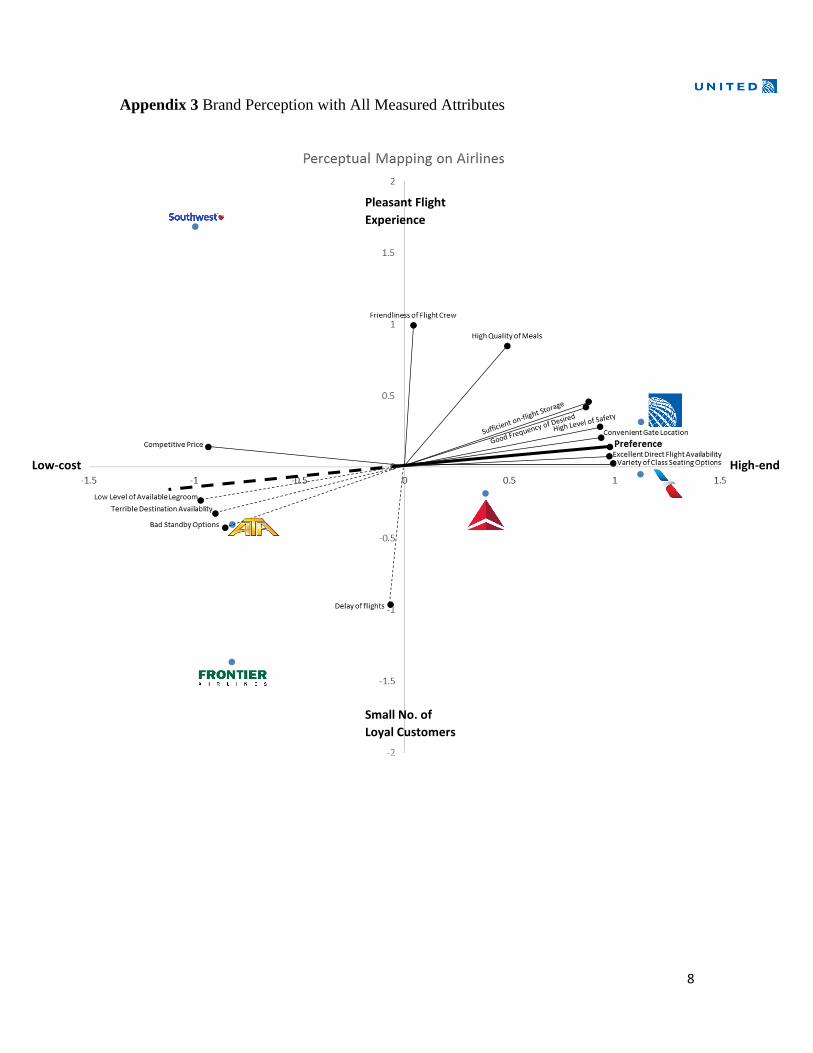
1. Perceptual Mapping
Findings:
United is generally reckoned as expensive and offering somewhat pleasant flight
experience. It is ranked first in the overall preference in light of its outstanding
performance in the following aspects: variety of class seating options, direct flight
availability, convenient gate location, level of available legroom, level of safety, desired
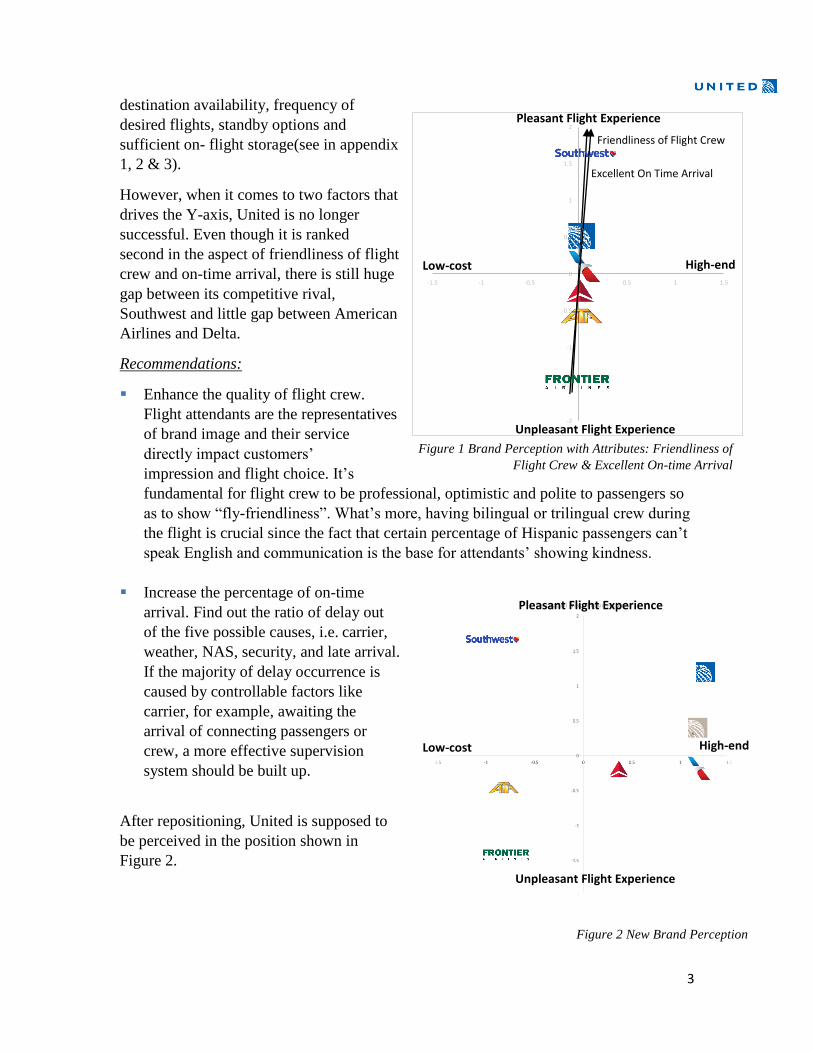
3
destination availability, frequency of
desired flights, standby options and
sufficient on- flight storage(see in appendix
1, 2 & 3).
However, when it comes to two factors that
drives the Y-axis, United is no longer
successful. Even though it is ranked
second in the aspect of friendliness of flight
crew and on-time arrival, there is still huge
gap between its competitive rival,
Southwest and little gap between American
Airlines and Delta.
Recommendations:
Enhance the quality of flight crew.
Flight attendants are the representatives
of brand image and their service
directly impact customers’
impression and flight choice. It’s
fundamental for flight crew to be professional, optimistic and polite to passengers so
as to show “fly-friendliness”. What’s more, having bilingual or trilingual crew during
the flight is crucial since the fact that certain percentage of Hispanic passengers can’t
speak English and communication is the base for attendants’ showing kindness.
Increase the percentage of on-time
arrival. Find out the ratio of delay out
of the five possible causes, i.e. carrier,
weather, NAS, security, and late arrival.
If the majority of delay occurrence is
caused by controllable factors like
carrier, for example, awaiting the
arrival of connecting passengers or
crew, a more effective supervision
system should be built up.
After repositioning, United is supposed to
be perceived in the position shown in
Figure 2.
-2
-1.5
-1
-0.5
0
0.5
1
1.5
2
-1.5 -1 -0.5 0 0.5 1 1.5
High-end Low-cost
Pleasant Flight Experience
Unpleasant Flight Experience
Friendliness of Flight Crew
Figure 1 Brand Perception with Attributes: Friendliness of
Flight Crew & Excellent On-time Arrival
Figure 2 New Brand Perception
Excellent On Time Arrival
High-end
Pleasant Flight Experience
Unpleasant Flight Experience
Low-cost
4
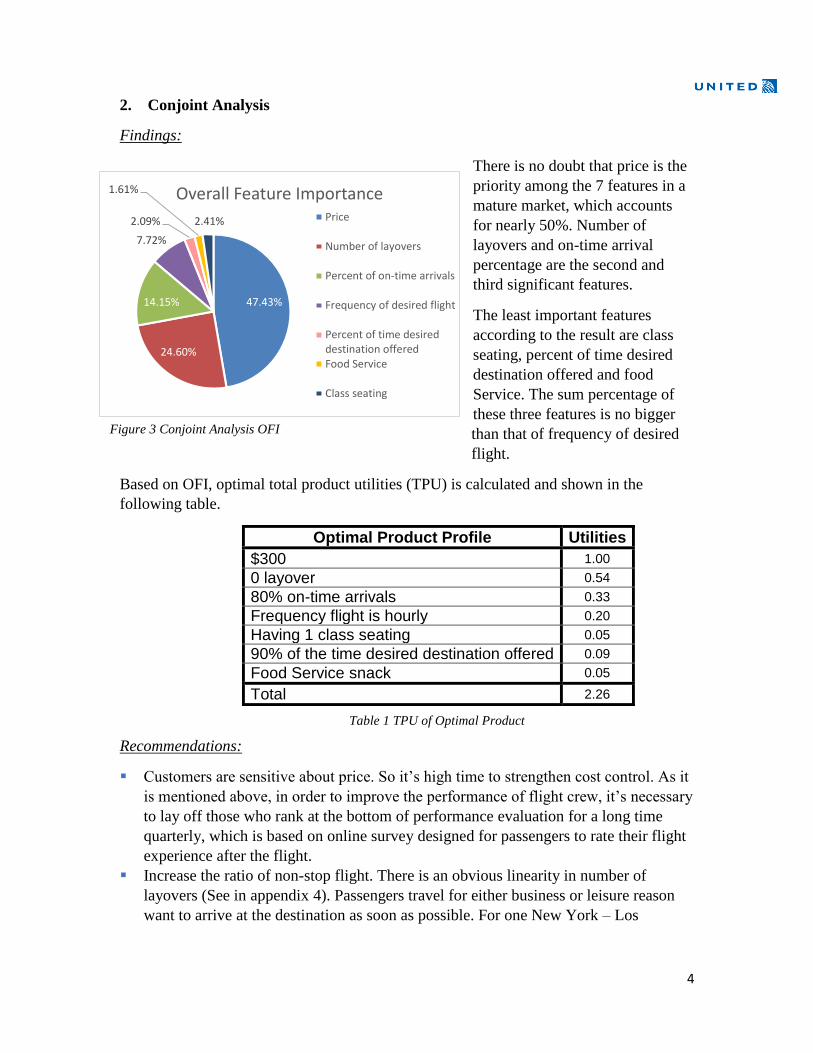
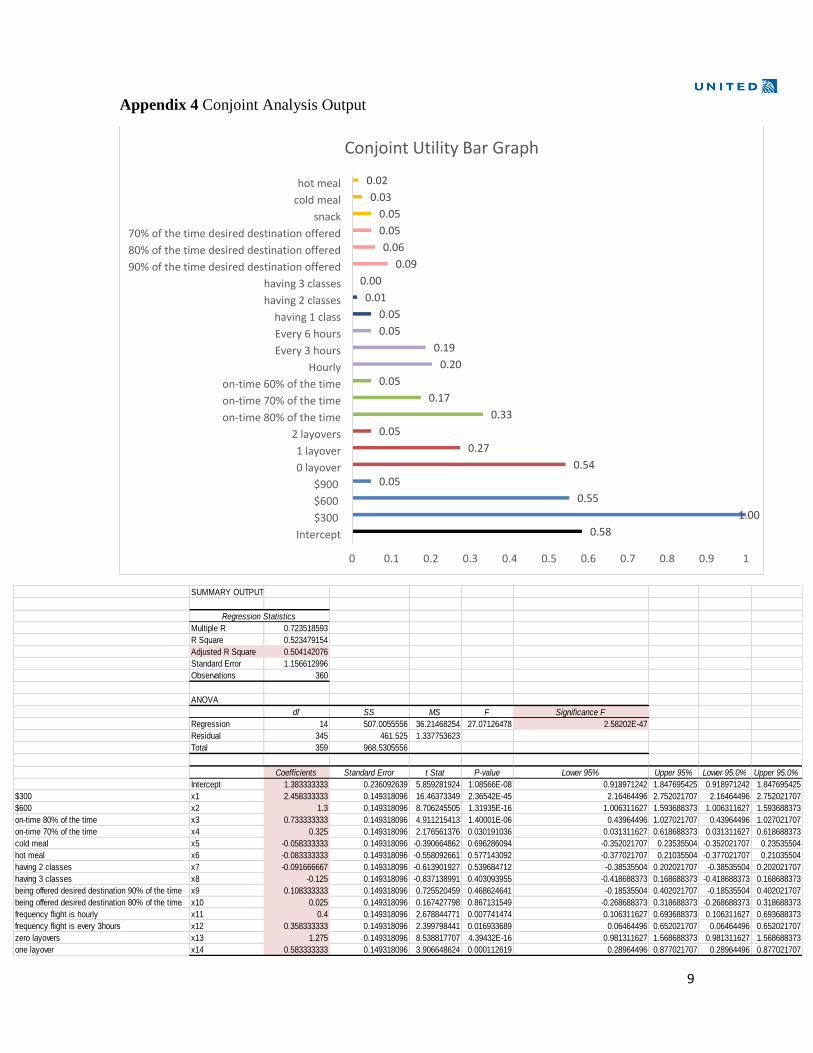
2. Conjoint Analysis
Findings:
There is no doubt that price is the
priority among the 7 features in a
mature market, which accounts
for nearly 50%. Number of
layovers and on-time arrival
percentage are the second and
third significant features.
The least important features
according to the result are class
seating, percent of time desired
destination offered and food
Service. The sum percentage of
these three features is no bigger
than that of frequency of desired
flight.
Based on OFI, optimal total product utilities (TPU) is calculated and shown in the
following table.
Optimal Product Profile Utilities
$300 1.00
0 layover 0.54
80% on-time arrivals 0.33
Frequency flight is hourly 0.20
Having 1 class seating 0.05
90% of the time desired destination offered 0.09
Food Service snack 0.05
Total 2.26
Recommendations:
Customers are sensitive about price. So it’s high time to strengthen cost control. As it
is mentioned above, in order to improve the performance of flight crew, it’s necessary
to lay off those who rank at the bottom of performance evaluation for a long time
quarterly, which is based on online survey designed for passengers to rate their flight
experience after the flight.
Increase the ratio of non-stop flight. There is an obvious linearity in number of
layovers (See in appendix 4). Passengers travel for either business or leisure reason
want to arrive at the destination as soon as possible. For one New York – Los
47.43%
24.60%
14.15%
7.72%
2.09%
1.61%
2.41%
Overall Feature ImportancePrice
Number of layovers
Percent of on-time arrivals
Frequency of desired flight
Percent of time desireddestination offeredFood Service
Class seating
Figure 3 Conjoint Analysis OFI
Table 1 TPU of Optimal Product
5
Angeles flight, 23% (total=65) of the lights provided are non-stop. If United make it
30%, the brand performance will be better.
Reconsider class seating. From the result, customers prefer 1 class to 2-3 class. In the
current United class system, United provides 3 classes: Economy (lowest), Economy
(flexible) and First. Combine Economy (flexible) and First with a new name Valued
which offer the benefit both classes share.
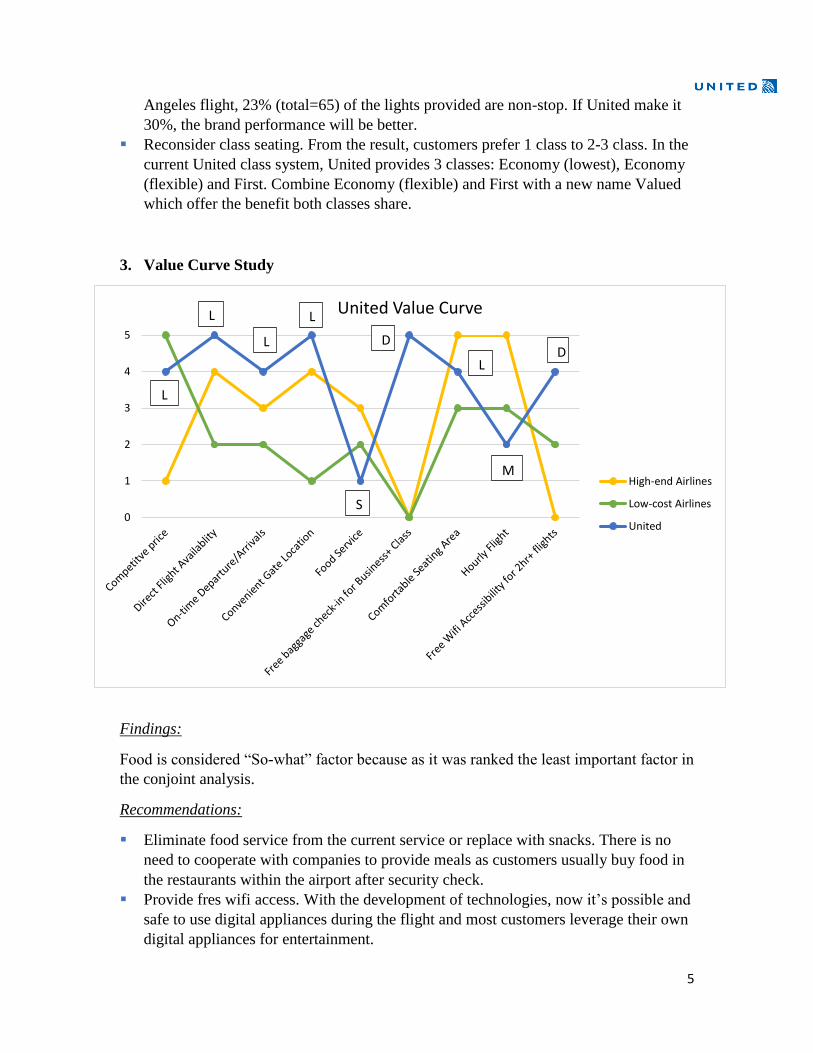
3. Value Curve Study
Findings:
Food is considered “So-what” factor because as it was ranked the least important factor in
the conjoint analysis.
Recommendations:
Eliminate food service from the current service or replace with snacks. There is no
need to cooperate with companies to provide meals as customers usually buy food in
the restaurants within the airport after security check.
Provide fres wifi access. With the development of technologies, now it’s possible and
safe to use digital appliances during the flight and most customers leverage their own
digital appliances for entertainment.
0
1
2
3
4
5
United Value Curve
High-end Airlines
Low-cost Airlines
United
L
L
L
L
L
S
M
D D
6
Offer better membership rewards to valuable loyal members.United now has 5
different classes existing, namely United Economy®, United Business®, United
BusinessFirst®, United First®, United Global FirstSM. By supplying free check-in
baggage service to business plus classes, those who already are members are willing
to enjoy the benefits and recommend to their family members or friends. It’s a free
brand promotion.
Conclusion
There is no need for United to launch a new brand TED. As it is shown in the perceptual
mapping, United is rated first among the popular airlines. The decrease of profit is not
because of competing with fierce competitors like Southwest but spending much
cost/investment on the services which customers don’t care to leverage, such as food
service. In addition, not much differences exist between hourly flight and every 3 hours
flight.
Go only with TED is bold as it will confront Southwest which has aggregated large
number of loyal customers and undoubtedly such movement will impair current United
loyal members, some of whom travel for business and are of great value to the company’s
long-term development and profitability.
As a result, what United needs to change is its investment structure, improve employee
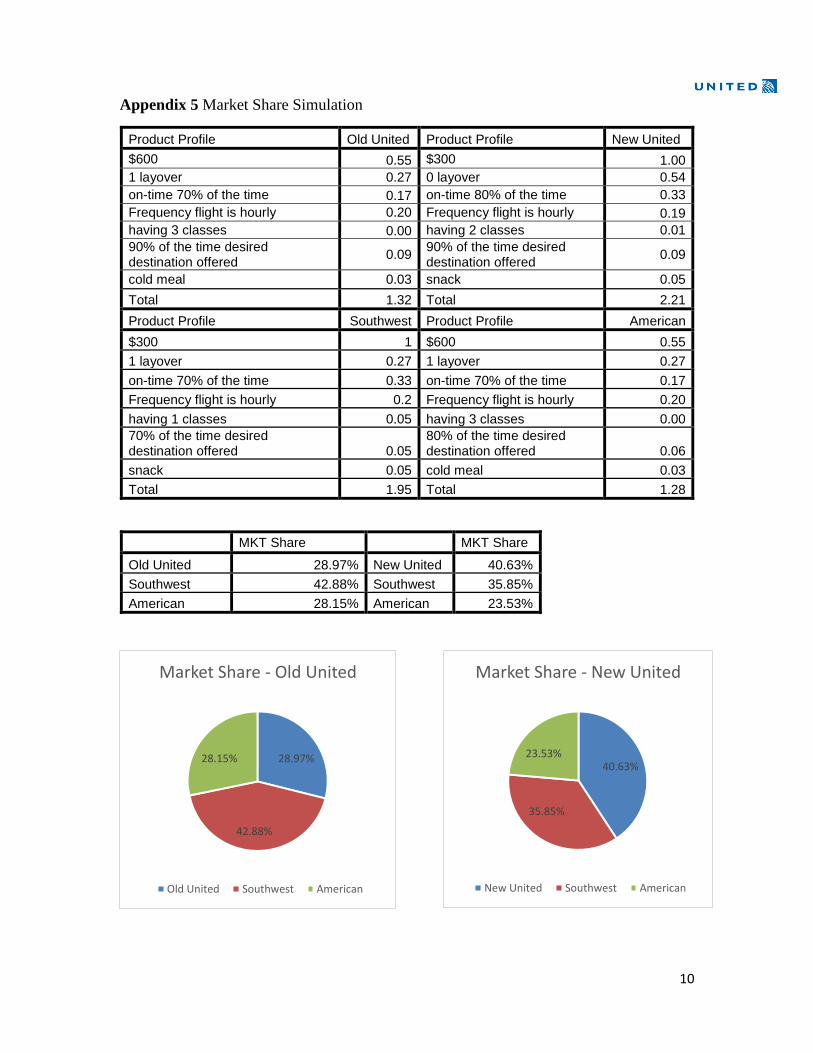
performance and reduce cost. After its change, the market share will increase from
28.97% to 40.63 %( See appendix 5).
7
Appendix 1 Brand Perception
Appendix 2 Brand Perception with Preference Line
High-end
Pleasant Flight
Experience
Unpleasant Flight
Experience
Low-cost
High-end
Pleasant Flight
Experience
Unpleasant Flight
Experience
Low-cost
I prefer this brand
4
5
6
3
1
2
8
Appendix 3 Brand Perception with All Measured Attributes
Low-cost High-end
Pleasant Flight
Experience
Small No. of
Loyal Customers
9
Appendix 4 Conjoint Analysis Output
0.58
1.00
0.55
0.05
0.54
0.27
0.05
0.33
0.17
0.05
0.20
0.19
0.05
0.05
0.01
0.00
0.09
0.06
0.05
0.05
0.03
0.02
0 0.1 0.2 0.3 0.4 0.5 0.6 0.7 0.8 0.9 1
Intercept
$300
$600
$900
0 layover
1 layover
2 layovers
on-time 80% of the time
on-time 70% of the time
on-time 60% of the time
Hourly
Every 3 hours
Every 6 hours
having 1 class
having 2 classes
having 3 classes
90% of the time desired destination offered
80% of the time desired destination offered
70% of the time desired destination offered
snack
cold meal
hot meal
Conjoint Utility Bar Graph
SUMMARY OUTPUT
Regression Statistics
Multiple R 0.723518593
R Square 0.523479154
Adjusted R Square 0.504142076
Standard Error 1.156612996
Observations 360
ANOVA
df SS MS F Significance F
Regression 14 507.0055556 36.21468254 27.07126478 2.58202E-47
Residual 345 461.525 1.337753623
Total 359 968.5305556
Coefficients Standard Error t Stat P-value Lower 95% Upper 95% Lower 95.0% Upper 95.0%
Intercept 1.383333333 0.236092639 5.859281924 1.08566E-08 0.918971242 1.847695425 0.918971242 1.847695425
$300 x1 2.458333333 0.149318096 16.46373349 2.36542E-45 2.16464496 2.752021707 2.16464496 2.752021707
$600 x2 1.3 0.149318096 8.706245505 1.31935E-16 1.006311627 1.593688373 1.006311627 1.593688373
on-time 80% of the time x3 0.733333333 0.149318096 4.911215413 1.40001E-06 0.43964496 1.027021707 0.43964496 1.027021707
on-time 70% of the time x4 0.325 0.149318096 2.176561376 0.030191036 0.031311627 0.618688373 0.031311627 0.618688373
cold meal x5 -0.058333333 0.149318096 -0.390664862 0.696286094 -0.352021707 0.23535504 -0.352021707 0.23535504
hot meal x6 -0.083333333 0.149318096 -0.558092661 0.577143092 -0.377021707 0.21035504 -0.377021707 0.21035504
having 2 classes x7 -0.091666667 0.149318096 -0.613901927 0.539684712 -0.38535504 0.202021707 -0.38535504 0.202021707
having 3 classes x8 -0.125 0.149318096 -0.837138991 0.403093955 -0.418688373 0.168688373 -0.418688373 0.168688373
being offered desired destination 90% of the time x9 0.108333333 0.149318096 0.725520459 0.468624641 -0.18535504 0.402021707 -0.18535504 0.402021707
being offered desired destination 80% of the time x10 0.025 0.149318096 0.167427798 0.867131549 -0.268688373 0.318688373 -0.268688373 0.318688373
frequency flight is hourly x11 0.4 0.149318096 2.678844771 0.007741474 0.106311627 0.693688373 0.106311627 0.693688373
frequency flight is every 3hours x12 0.358333333 0.149318096 2.399798441 0.016933689 0.06464496 0.652021707 0.06464496 0.652021707
zero layovers x13 1.275 0.149318096 8.538817707 4.39432E-16 0.981311627 1.568688373 0.981311627 1.568688373
one layover x14 0.583333333 0.149318096 3.906648624 0.000112619 0.28964496 0.877021707 0.28964496 0.877021707
10
Appendix 5 Market Share Simulation
Product Profile Old United Product Profile New United
$600 0.55 $300 1.00
1 layover 0.27 0 layover 0.54
on-time 70% of the time 0.17 on-time 80% of the time 0.33
Frequency flight is hourly 0.20 Frequency flight is hourly 0.19
having 3 classes 0.00 having 2 classes 0.01
90% of the time desired destination offered
0.09 90% of the time desired destination offered
0.09
cold meal 0.03 snack 0.05
Total 1.32 Total 2.21
Product Profile Southwest Product Profile American
$300 1 $600 0.55
1 layover 0.27 1 layover 0.27
on-time 70% of the time 0.33 on-time 70% of the time 0.17
Frequency flight is hourly 0.2 Frequency flight is hourly 0.20
having 1 classes 0.05 having 3 classes 0.00
70% of the time desired destination offered 0.05
80% of the time desired destination offered 0.06
snack 0.05 cold meal 0.03
Total 1.95 Total 1.28
MKT Share MKT Share
Old United 28.97% New United 40.63%
Southwest 42.88% Southwest 35.85%
American 28.15% American 23.53%
28.97%
42.88%
28.15%
Market Share - Old United
Old United Southwest American
40.63%
35.85%
23.53%
Market Share - New United
New United Southwest American