Embed Size (px)
Citation preview
Box 21060, SE-100 31 Stockholm Box 5302, SE-400 14 Göteborg Valhallavägen 81, Stockholm Aschebergsgatan 44, Göteborg Tel: +46 (0)8 598 563 00 Tel: +46 (0)31 725 62 00 Fax: +46(0)8 598 563 90 Fax: + 46 (0)31 725 62 90
www.ivl.se
REPORT
Life Cycle Assessment of consumer packaging for
liquid food
LCA of Tetra Pak and alternative packaging on the Nordic market
.
Kristian Jelse, Elin Eriksson and Elin Einarson 25 August 2009 Archivenumber:
1
Summary
A comprehensive LCA (Life Cycle Assessment) study on Tetra Pak and alternative packages has been carried out for 24 packaging specifications on four Nordic markets – Denmark, Finland, Norway, and Sweden – resulting in a total of 29 packaging types (including different filler locations and product groups) and 115 packaging systems when applying the packages at the four markets. The study has been performed between December 2008 and August 2009.
The included packages are:
Dairy packaging (1000 ml): Tetra Brik Aseptic Base, Tetra Brik Aseptic Edge, Tetra Brik Base, Tetra Brik Edge, Tetra Rex, Tetra Rex Plus, Gable top with large cap, PET bottle (filled in Germany or locally) and HDPE bottle (filled in Germany or locally).
Juice packaging (1000 ml): Tetra Brik Aseptic Slim, Tetra Gemina Aseptic, Tetra Prisma Aseptic, Tetra Top, Gable top with large cap, Tetra Rex with small cap, PET bottle and HDPE bottle.
Grab & Go packaging (250–500 ml): Tetra Prisma Aseptic, Tetra Brik Aseptic, Tetra Prisma Aseptic, Tetra Top HAAD, APET bottle, Glass bottle, PET bottle (filled in the UK) and HDPE bottle.
Micro Grab & Go packaging (100 ml): Tetra Top Micro and HDPE bottle (filled in France).
Goal and scope
The main goal has been to assess the environmental performance of the individual packaging systems as well as the results of the comparisons of the environmental performance of the packages at each Nordic national market.
The studied packages have been divided into four product categories, each of them providing different functions. The studied products groups and adherent functional units are presented below:
• Dairy packaging (1000 ml): Distribution of 1 litre of milk at retail.
• Juice packaging (1000 ml): Distribution of 1 litre of juice at retail.
• Grab & Go packaging (250–500 ml): Distribution of 0.5 litre of portion-packed beverage at retail.
• Micro Grab & Go pack. (100 ml): Distribution of 0.5 litre of small portion- packed beverage at retail.
The presentation of results for the first three product groups is further divided into ambient and chilled packaging. Direct comparisons between packaging of different product
2
groups or chilled/ambient products should be avoided since they have different requirements based on the type of beverage they contain.
Even though the results from chilled and ambient packaging should not be directly compared, obtaining an indicative result of their relative performance is highly interesting. An attempt has therefore been made to collect data and expand the systems in order to make a comparison of Tetra Brik Base (chilled) and Tetra Brik Aseptic Base (ambient). This is presented as a sensitivity analysis, and should only be seen as a first attempt to compare chilled and ambient products.
The results are presented independently for each market since the main goal of this study is related to the study of packaging options at each market separately, and not as a market comparison.
The LCA covers the cradle to grave perspective from extraction of raw materials to recycling and other types of end of life treatment after consumer use of the packaging. The production of milk, juice or other beverage has not been included in the study since the goal is to assess the environmental impact of packages and not that of the products. Nevertheless, the distribution phase includes the weight of the beverage (about 1 kg per litre), as well as the production and waste management of secondary packaging used during this transport. It should be noted that the results of this study are thus not directly addable to i.e. a carbon footprint of milk. The same prudence against double counting should be taken in relation to what activities of the filler are included in the different product systems.
Any difference in product loss between different packaging is excluded due to lack of data.
The included environmental impact categories are global warming, acidification, eutrophication, photochemical oxidant formation and stratospheric ozone depletion. These are chosen since there is consensus on the characterisation methods, and they are included in e.g. the international EPD (Environmental Product Declaration) system. The characterisation factors used were CML2001, updated in August 2007. The biogenic flows of CO2 (carbon dioxide) were excluded from the calculation of global warming potential as the net effect of uptake and emission is assumed to be zero.
Besides the impact assessment categories, the amount of primary energy used, divided into renewable and non-renewable, as well as a very rough indicator of the amount of water used are presented in the inventory results. Due to the lack of detail on geographical information and water quality, no evaluation of water stress and water quality reduction has been possible, and thus no conclusions have been drawn on the water use inventory data.
As recent data as possible has been collected as an attempt to reflect the current situation on the Nordic market. Site-specific converting data and filling data based on one specific customer on one market were provided by Tetra Pak for the Tetra Pak packages, while process data for alternative packaging was based mainly on database data and data from previous studies.
The study uses average data rather than marginal data. At end of life, system expansion has been used as far as possible in order to avoid allocation.
3
The characterisation results for all four studied Nordic markets are presented in the impact assessment results in the report. The sensitivity of the results to the methodological choices, data gaps, assumptions, data used and other sources of uncertainty have been studied in the interpretation part of the report.
Results
Here, a sample of the characterisation results are presented in comparative diagrams. Due to the vast amount of packaging combinations and impact categories, the focus is on emissions of greenhouse gases. If not otherwise indicated, the filling takes place locally, i.e. in the country where the filled packaging is sold to consumer. The PET and HDPE bottles for dairy products where modelled both as being filled locally and being filled in Germany before transportation to the market.
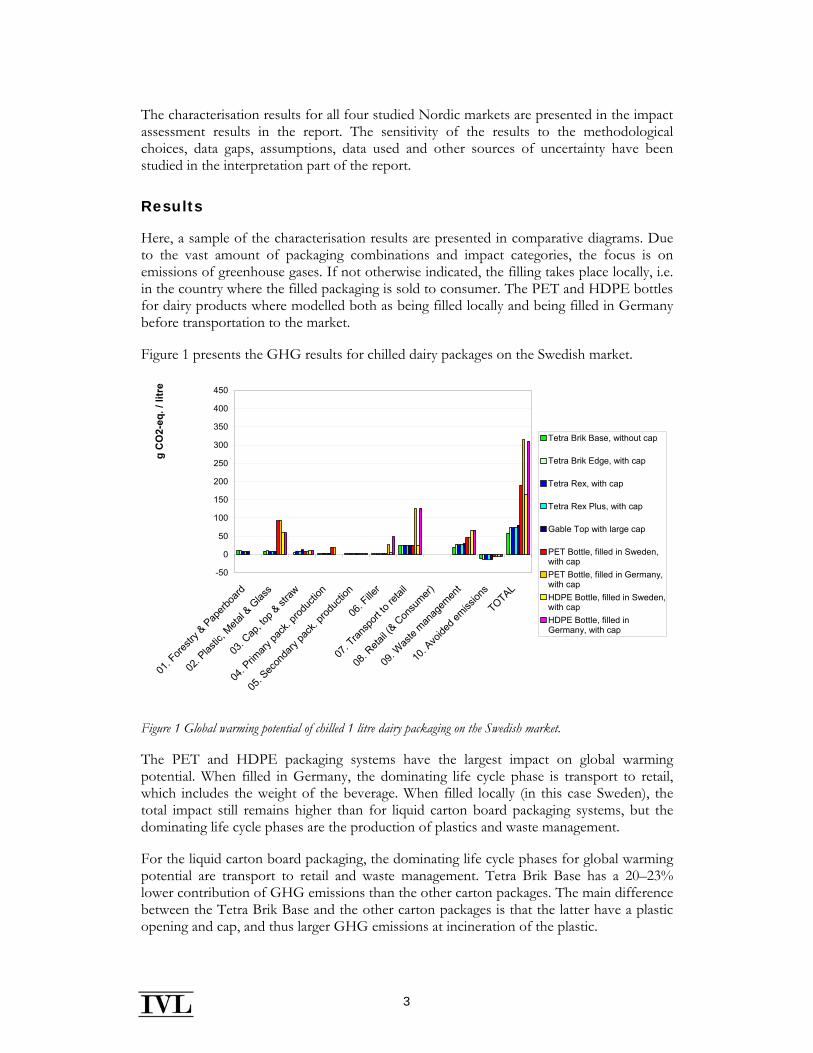
Figure 1 presents the GHG results for chilled dairy packages on the Swedish market.
-50
0
50
100
150
200
250
300
350
400
450
01. F
orestr
y & Pap
erboa
rd
02. P
lastic
, Meta
l & G
lass
03. C
ap, to
p & st
raw
04. P
rimary
pack
. prod
uctio
n
05. S
econ
dary
pack
. prod
uctio
n
06. F
iller
07. T
ransp
ort to
retai
l
08. R
etail (
& Con
sumer)
09. W
aste
manag
emen
t
10. A
voide
d emiss
ions
TOTAL
g C
O2-
eq. /
litr
e
Tetra Brik Base, without cap
Tetra Brik Edge, with cap
Tetra Rex, with cap
Tetra Rex Plus, with cap
Gable Top with large cap
PET Bottle, filled in Sweden,with capPET Bottle, filled in Germany,with capHDPE Bottle, filled in Sweden,with capHDPE Bottle, filled inGermany, with cap
Figure 1 Global warming potential of chilled 1 litre dairy packaging on the Swedish market.
The PET and HDPE packaging systems have the largest impact on global warming potential. When filled in Germany, the dominating life cycle phase is transport to retail, which includes the weight of the beverage. When filled locally (in this case Sweden), the total impact still remains higher than for liquid carton board packaging systems, but the dominating life cycle phases are the production of plastics and waste management.
For the liquid carton board packaging, the dominating life cycle phases for global warming potential are transport to retail and waste management. Tetra Brik Base has a 20–23% lower contribution of GHG emissions than the other carton packages. The main difference between the Tetra Brik Base and the other carton packages is that the latter have a plastic opening and cap, and thus larger GHG emissions at incineration of the plastic.
4
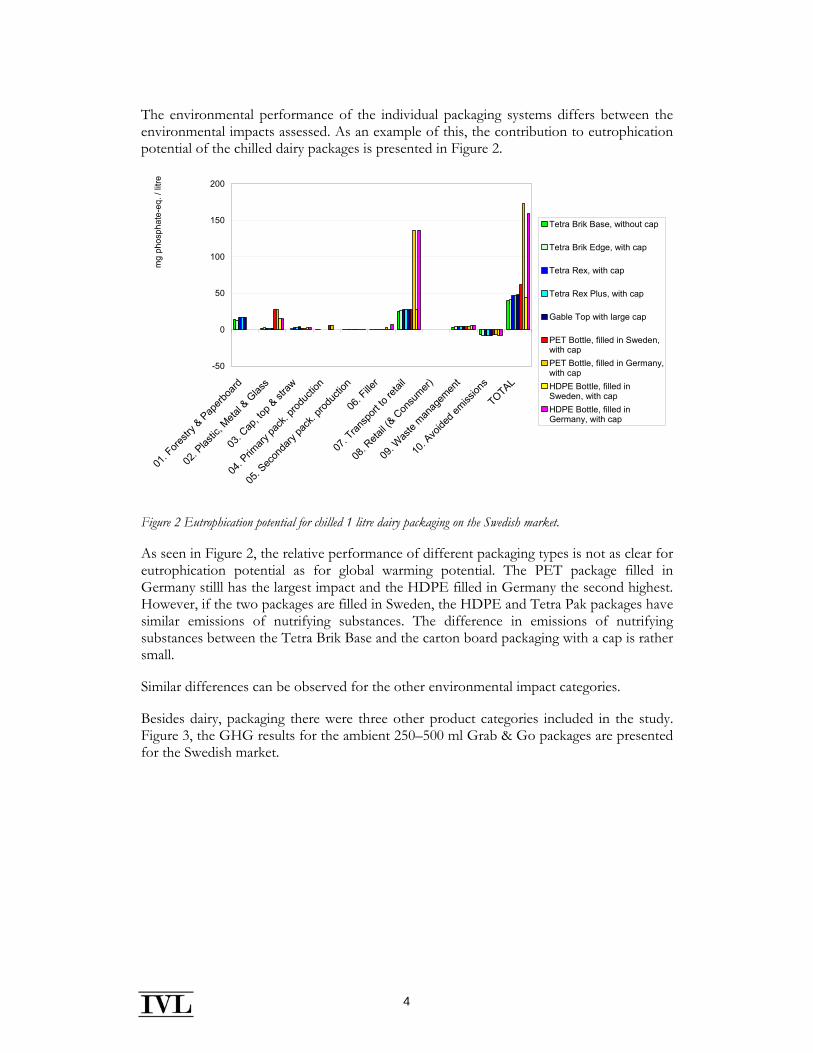
The environmental performance of the individual packaging systems differs between the environmental impacts assessed. As an example of this, the contribution to eutrophication potential of the chilled dairy packages is presented in Figure 2.
-50
0
50
100
150
200
01. F
orestr
y & Pap
erboa
rd
02. P
lastic
, Meta
l & G
lass
03. C
ap, to
p & st
raw
04. P
rimary
pack
. prod
uctio
n
05. S
econ
dary
pack
. prod
uctio
n
06. F
iller
07. T
ransp
ort to
retai
l
08. R
etail (
& Con
sumer)
09. W
aste
manag
emen
t
10. A
voide
d emiss
ions
TOTAL
mg
phos
phat
e-eq
. / li
tre
Tetra Brik Base, without cap
Tetra Brik Edge, with cap
Tetra Rex, with cap
Tetra Rex Plus, with cap
Gable Top with large cap
PET Bottle, filled in Sweden,with capPET Bottle, filled in Germany,with capHDPE Bottle, filled inSweden, with capHDPE Bottle, filled inGermany, with cap
Figure 2 Eutrophication potential for chilled 1 litre dairy packaging on the Swedish market.
As seen in Figure 2, the relative performance of different packaging types is not as clear for eutrophication potential as for global warming potential. The PET package filled in Germany stilll has the largest impact and the HDPE filled in Germany the second highest. However, if the two packages are filled in Sweden, the HDPE and Tetra Pak packages have similar emissions of nutrifying substances. The difference in emissions of nutrifying substances between the Tetra Brik Base and the carton board packaging with a cap is rather small.
Similar differences can be observed for the other environmental impact categories.
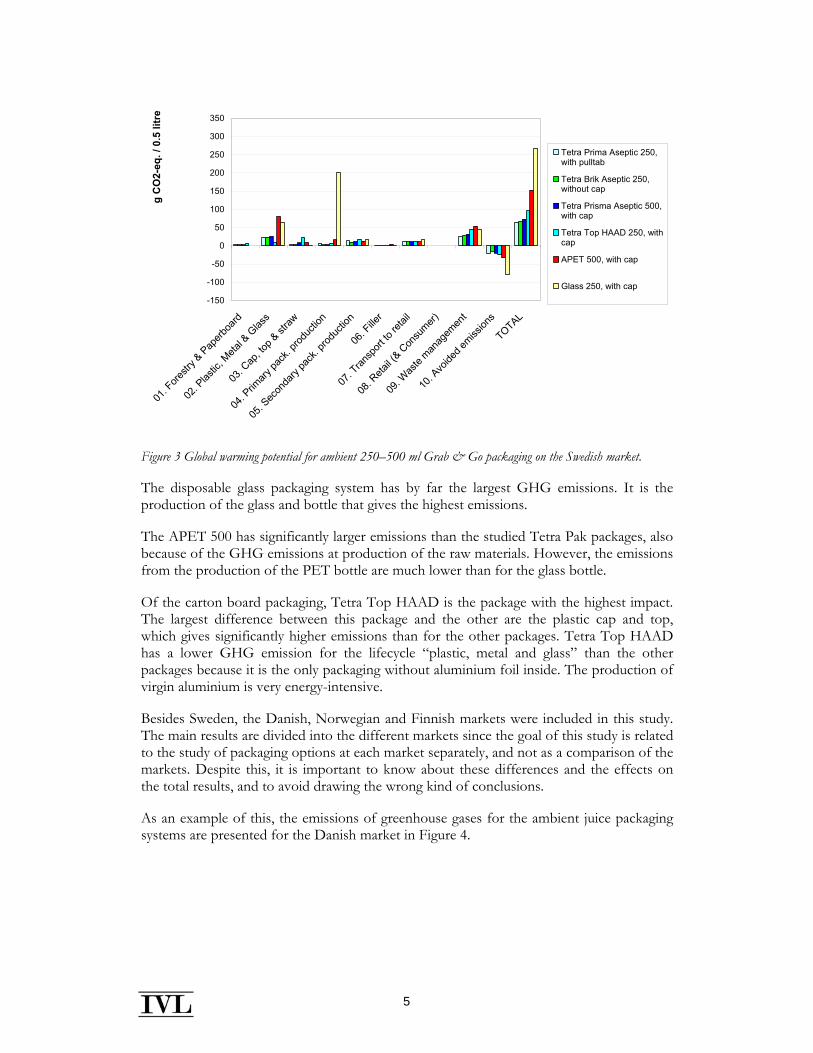
Besides dairy, packaging there were three other product categories included in the study. Figure 3, the GHG results for the ambient 250–500 ml Grab & Go packages are presented for the Swedish market.
5
-150
-100
-50
0
50
100
150
200
250
300
350
01. F
orestr
y & Pap
erboa
rd
02. P
lastic
, Meta
l & G
lass
03. C
ap, to
p & st
raw
04. P
rimary
pack
. prod
uctio
n
05. S
econ
dary
pack
. prod
uctio
n
06. F
iller
07. T
ransp
ort to
retai
l
08. R
etail (
& Con
sumer)
09. W
aste
manag
emen
t
10. A
voide
d emiss
ions
TOTAL
g C
O2-
eq. /
0.5
litr
eTetra Prima Aseptic 250,with pulltab
Tetra Brik Aseptic 250,without cap
Tetra Prisma Aseptic 500,with cap
Tetra Top HAAD 250, withcap
APET 500, with cap
Glass 250, with cap
Figure 3 Global warming potential for ambient 250–500 ml Grab & Go packaging on the Swedish market.
The disposable glass packaging system has by far the largest GHG emissions. It is the production of the glass and bottle that gives the highest emissions.
The APET 500 has significantly larger emissions than the studied Tetra Pak packages, also because of the GHG emissions at production of the raw materials. However, the emissions from the production of the PET bottle are much lower than for the glass bottle.
Of the carton board packaging, Tetra Top HAAD is the package with the highest impact. The largest difference between this package and the other are the plastic cap and top, which gives significantly higher emissions than for the other packages. Tetra Top HAAD has a lower GHG emission for the lifecycle “plastic, metal and glass” than the other packages because it is the only packaging without aluminium foil inside. The production of virgin aluminium is very energy-intensive.
Besides Sweden, the Danish, Norwegian and Finnish markets were included in this study. The main results are divided into the different markets since the goal of this study is related to the study of packaging options at each market separately, and not as a comparison of the markets. Despite this, it is important to know about these differences and the effects on the total results, and to avoid drawing the wrong kind of conclusions.
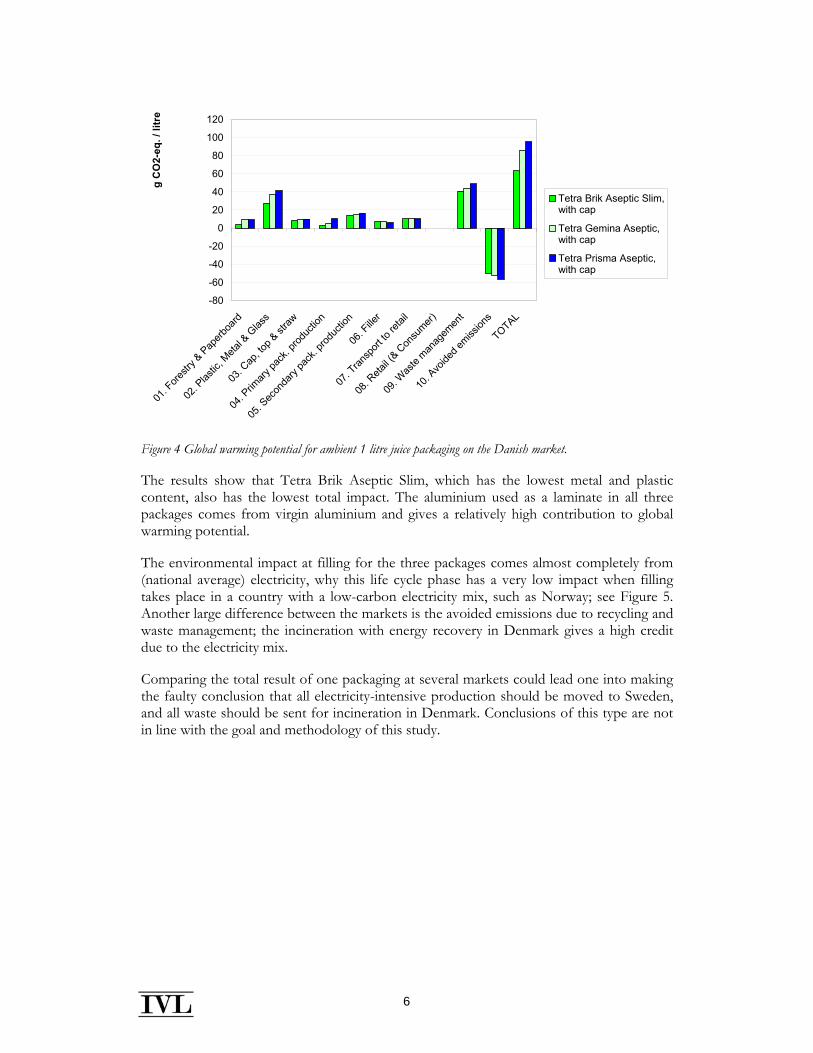
As an example of this, the emissions of greenhouse gases for the ambient juice packaging systems are presented for the Danish market in Figure 4.
6
-80
-60
-40
-20
0
20
40
60
80
100
120
01. F
orestr
y & Pap
erboa
rd
02. P
lastic
, Meta
l & G
lass
03. C
ap, to
p & st
raw
04. P
rimary
pack
. prod
uctio
n
05. S
econ
dary
pack
. prod
uctio
n
06. F
iller
07. T
ransp
ort to
retai
l
08. R
etail (
& Con
sumer)
09. W
aste
manag
emen
t
10. A
voide
d emiss
ions
TOTAL
g C
O2-
eq. /
litr
e
Tetra Brik Aseptic Slim,with cap
Tetra Gemina Aseptic,with cap
Tetra Prisma Aseptic,with cap
Figure 4 Global warming potential for ambient 1 litre juice packaging on the Danish market.
The results show that Tetra Brik Aseptic Slim, which has the lowest metal and plastic content, also has the lowest total impact. The aluminium used as a laminate in all three packages comes from virgin aluminium and gives a relatively high contribution to global warming potential.
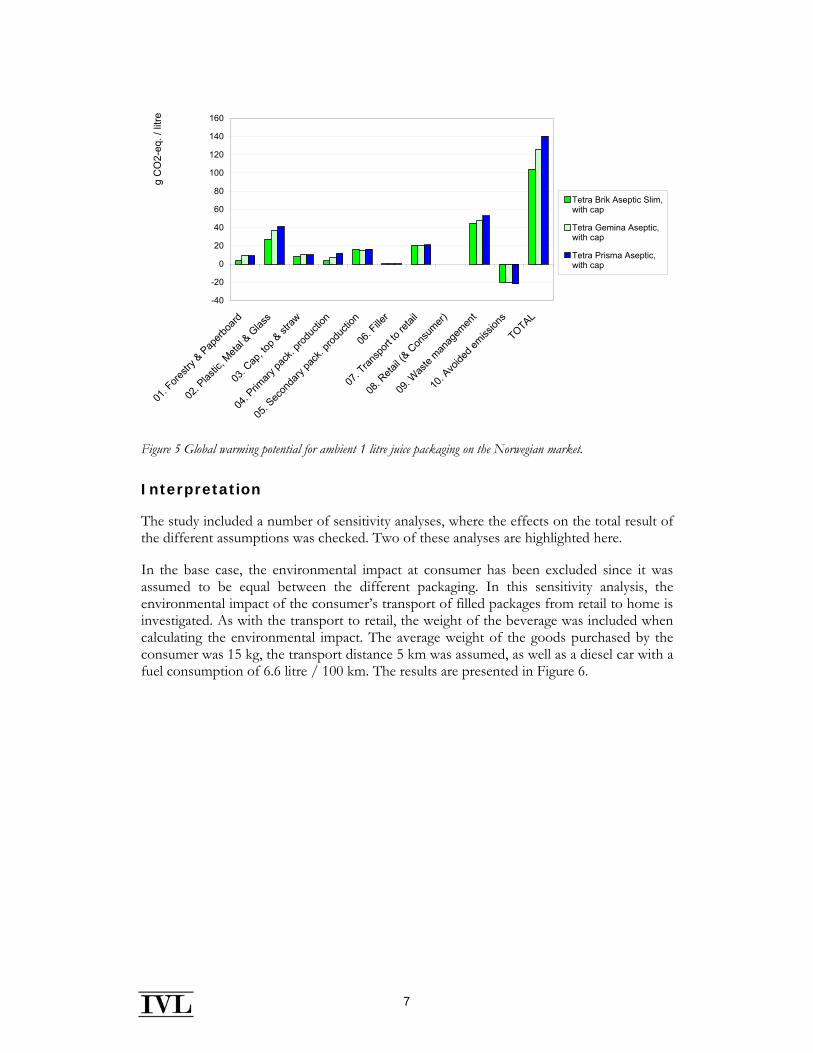
The environmental impact at filling for the three packages comes almost completely from (national average) electricity, why this life cycle phase has a very low impact when filling takes place in a country with a low-carbon electricity mix, such as Norway; see Figure 5. Another large difference between the markets is the avoided emissions due to recycling and waste management; the incineration with energy recovery in Denmark gives a high credit due to the electricity mix.
Comparing the total result of one packaging at several markets could lead one into making the faulty conclusion that all electricity-intensive production should be moved to Sweden, and all waste should be sent for incineration in Denmark. Conclusions of this type are not in line with the goal and methodology of this study.
7
-40
-20
0
20
40
60
80
100
120
140
160
01. F
orestr
y & Pap
erboa
rd
02. P
lastic
, Meta
l & G
lass
03. C
ap, to
p & st
raw
04. P
rimary
pack
. prod
uctio
n
05. S
econ
dary
pack
. prod
uctio
n
06. F
iller
07. T
ransp
ort to
retai
l
08. R
etail (
& Con
sumer)
09. W
aste
manag
emen
t
10. A
voide
d emiss
ions
TOTAL
g C
O2-
eq. /
litre
Tetra Brik Aseptic Slim,with cap
Tetra Gemina Aseptic,with cap
Tetra Prisma Aseptic,with cap
Figure 5 Global warming potential for ambient 1 litre juice packaging on the Norwegian market.
Interpretation
The study included a number of sensitivity analyses, where the effects on the total result of the different assumptions was checked. Two of these analyses are highlighted here.
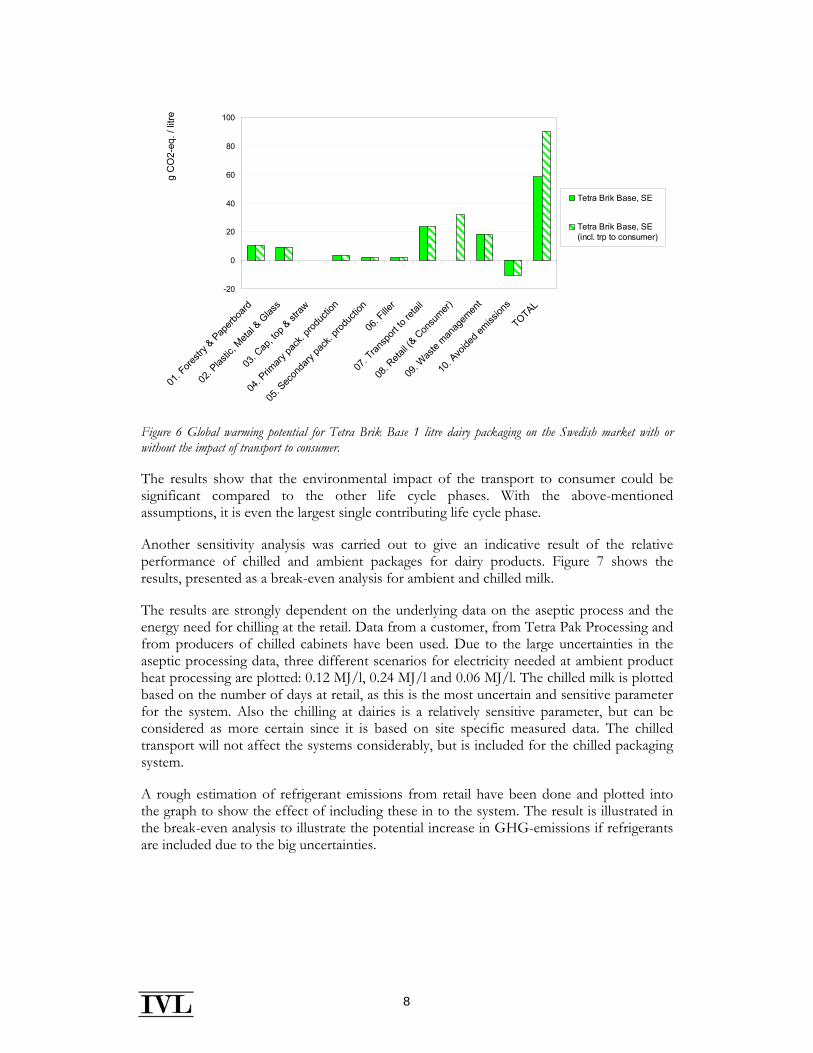
In the base case, the environmental impact at consumer has been excluded since it was assumed to be equal between the different packaging. In this sensitivity analysis, the environmental impact of the consumer’s transport of filled packages from retail to home is investigated. As with the transport to retail, the weight of the beverage was included when calculating the environmental impact. The average weight of the goods purchased by the consumer was 15 kg, the transport distance 5 km was assumed, as well as a diesel car with a fuel consumption of 6.6 litre / 100 km. The results are presented in Figure 6.
8
-20
0
20
40
60
80
100
01. F
orestr
y & Pap
erboa
rd
02. P
lastic
, Meta
l & G
lass
03. C
ap, to
p & st
raw
04. P
rimary
pack
. prod
uctio
n
05. S
econ
dary
pack
. prod
uctio
n
06. F
iller
07. T
ransp
ort to
retai
l
08. R
etail (
& Con
sumer)
09. W
aste
manag
emen
t
10. A
voide
d emiss
ions
TOTAL
g C
O2-
eq. /
litre
Tetra Brik Base, SE
Tetra Brik Base, SE(incl. trp to consumer)
Figure 6 Global warming potential for Tetra Brik Base 1 litre dairy packaging on the Swedish market with or without the impact of transport to consumer.
The results show that the environmental impact of the transport to consumer could be significant compared to the other life cycle phases. With the above-mentioned assumptions, it is even the largest single contributing life cycle phase.
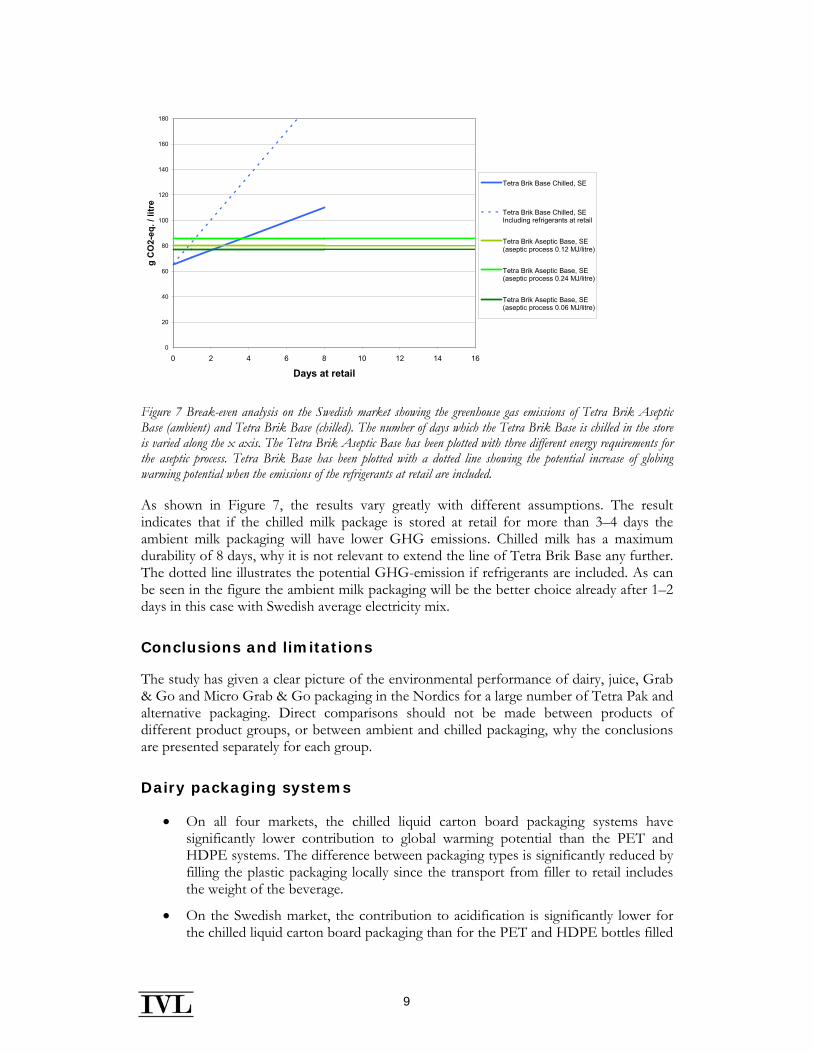
Another sensitivity analysis was carried out to give an indicative result of the relative performance of chilled and ambient packages for dairy products. Figure 7 shows the results, presented as a break-even analysis for ambient and chilled milk.
The results are strongly dependent on the underlying data on the aseptic process and the energy need for chilling at the retail. Data from a customer, from Tetra Pak Processing and from producers of chilled cabinets have been used. Due to the large uncertainties in the aseptic processing data, three different scenarios for electricity needed at ambient product heat processing are plotted: 0.12 MJ/l, 0.24 MJ/l and 0.06 MJ/l. The chilled milk is plotted based on the number of days at retail, as this is the most uncertain and sensitive parameter for the system. Also the chilling at dairies is a relatively sensitive parameter, but can be considered as more certain since it is based on site specific measured data. The chilled transport will not affect the systems considerably, but is included for the chilled packaging system.
A rough estimation of refrigerant emissions from retail have been done and plotted into the graph to show the effect of including these in to the system. The result is illustrated in the break-even analysis to illustrate the potential increase in GHG-emissions if refrigerants are included due to the big uncertainties.
9
0
20
40
60
80
100
120
140
160
180
0 2 4 6 8 10 12 14 16
Days at retail
g C
O2-
eq. /
litr
e
Tetra Brik Base Chilled, SE
Tetra Brik Base Chilled, SEIncluding refrigerants at retail
Tetra Brik Aseptic Base, SE(aseptic process 0.12 MJ/litre)
Tetra Brik Aseptic Base, SE(aseptic process 0.24 MJ/litre)
Tetra Brik Aseptic Base, SE(aseptic process 0.06 MJ/litre)
Figure 7 Break-even analysis on the Swedish market showing the greenhouse gas emissions of Tetra Brik Aseptic Base (ambient) and Tetra Brik Base (chilled). The number of days which the Tetra Brik Base is chilled in the store is varied along the x axis. The Tetra Brik Aseptic Base has been plotted with three different energy requirements for the aseptic process. Tetra Brik Base has been plotted with a dotted line showing the potential increase of globing warming potential when the emissions of the refrigerants at retail are included.
As shown in Figure 7, the results vary greatly with different assumptions. The result indicates that if the chilled milk package is stored at retail for more than 3–4 days the ambient milk packaging will have lower GHG emissions. Chilled milk has a maximum durability of 8 days, why it is not relevant to extend the line of Tetra Brik Base any further. The dotted line illustrates the potential GHG-emission if refrigerants are included. As can be seen in the figure the ambient milk packaging will be the better choice already after 1–2 days in this case with Swedish average electricity mix.
Conclusions and limitations
The study has given a clear picture of the environmental performance of dairy, juice, Grab & Go and Micro Grab & Go packaging in the Nordics for a large number of Tetra Pak and alternative packaging. Direct comparisons should not be made between products of different product groups, or between ambient and chilled packaging, why the conclusions are presented separately for each group.
Dairy packaging systems
• On all four markets, the chilled liquid carton board packaging systems have significantly lower contribution to global warming potential than the PET and HDPE systems. The difference between packaging types is significantly reduced by filling the plastic packaging locally since the transport from filler to retail includes the weight of the beverage.
• On the Swedish market, the contribution to acidification is significantly lower for the chilled liquid carton board packaging than for the PET and HDPE bottles filled
10
in Germany. When filled locally, the HDPE system only has slightly higher emissions of acidifying substances than the liquid carton board systems. The contribution to eutrophication potential is highest for PET and HDPE filled in Germany, while local filling gives about the same result as liquid carton board packaging.
• For chilled plastic bottles on the Swedish market, the dominating life cycle phases for the global warming, acidification and photochemical oxidant formation potential impact categories are:
o Transport to retail for bottles filled in Germany.
o Plastic production and waste management for bottles filled in Sweden.
• For liquid carton board packaging on all four markets, the dominating life cycle phases for global warming potential are:
o Transport to retail and waste management for the chilled liquid carton board systems.
o Plastics and metal production, transport to retail and waste management for the ambient liquid carton board systems.
• On all four markets, Tetra Brik Base has the lowest impact on global warming potential of all chilled Tetra Pak packages. Tear opening (Tetra Brik Base) has 20-30% lower GWP100 than packages with a plastic opening, depending on market.
Juice packaging systems
• On all four markets, the chilled liquid carton board packaging systems have significantly lower contribution to global warming potential than the PET and HDPE systems.
• On the Swedish market, the contribution to photochemical oxidant formation is significantly lower for the chilled liquid carton board packaging than for the PET and HDPE bottles. The contribution to acidification and eutrophication potential is highest for PET, while HDPE has about the same performance as liquid carton board packaging.
• On all markets, Tetra Brik Aseptic Slim has the lowest impact on global warming potential of the ambient juice packaging systems. The production of virgin aluminium gives a relatively high contribution for all three packages.
• On the Swedish market, Tetra Brik Aseptic Slim has the lowest impact on acidification potential, eutrophication potential and photochemical oxidant formation.
Grab & Go packaging systems (250–500 ml):
• On all four markets, the chilled PET 250 ml filled in the United Kingdom has a higher contribution to global warming potential than the HDPE 380 ml system. This is mainly due to the very long transport from filler to retail, which is assumed to be carried out by truck and includes the weight of the beverage. Filling of PET
11
250 locally has not been within the scope of the study, but one could expect that such a change would dramatically reduce the impact of the PET bottle.
• On the Swedish market, the chilled PET 250 ml filled in the United Kingdom has a dramatically higher impact on acidification, eutrophication and photochemical oxidant formation than the HDPE bottle. This is mainly due to the very long transport from filler to retail.
• On the Swedish, Danish and Finnish markets, the disposable glass packaging system has by far the largest GHG emissions of the ambient Grab & Go packaging. It is the production of the glass and bottle that causes the highest emissions. On all four markets, the APET 500 has significantly larger emissions than the studied Tetra Pak packages, also because of the GHG emissions at production of the raw materials.
• On all four markets, Tetra Top HAAD 250 ml is Tetra Pak package with the highest impact on global warming potential. The largest difference between this package and the other are the plastic cap and top, which gives significantly higher emissions than for the other packages.
Micro Grab & Go packaging systems:
• On all four markets, the HDPE 100 ml filled in France has a higher contribution to global warming potential than the Tetra Top Micro system. This is mainly due to the very long transport from filler to retail, which is assumed to be carried out by truck and includes the weight of the beverage. Filling of the HDPE bottle locally has not been within the scope of the study, but one could expect that such a change would dramatically reduce its impact, and change the relative performance of the packages.
• On the Swedish market, the HDPE 100 ml filled in France has a significantly higher contribution to acidification, eutrophication and photochemical oxidant formation than the Tetra Top Micro system. This is mainly due to the very long transport from filler to retail.
The results are divided into the different markets since the goal of this study is related to the study of packaging options at each market separately, and not as a comparison of the markets. Despite this, it is important to know about these differences and the effects on the total results, and to avoid drawing the wrong kind of conclusions.
One difference between the markets is the electricity mix, which affects the environmental impact especially at filling. Another large difference between the markets is the avoided emissions due to recycling and waste management. On the Swedish market, a high recycling rate gives a better environmental performance, while on the Danish market a high rate of incineration with energy recovery gives a better environmental performance.
As for all studies, this LCA have various limitations that are important to remember when interpreting the results. These limitations include the potential difference in product loss between the packaging, the included impact assessment categories and data quality.
12
Recommendations
In addition to the comparison of different packaging types at each market, the study has highlighted the following points for the Tetra Pak packages:
• The amount of plastic used for the top and opening.
• The total weight of the liquid carton board package.
• The amount of secondary packaging such as corrugated board.
• The waste treatment scenario, with a high recycling rate being favourable in most countries, but also incineration with energy recovery being favourable in Denmark.
For all packaging systems, the transport from filler to retail is crucial; filling at the local market gives significantly lower contribution to all studied environmental impacts as compared to filling abroad. This is due to the weight of the beverage being included in the modelling of this transport.
As described in Section 10.2, the scope of this study does not take product loss into account. Any improvements in these points must not cause additional product loss in the life cycle to avoid sub-optimisation and a shift of the environmental burden.
The alternative packages that are filled on the local national market, the plastic and glass production processes are the most contributing part of the product systems.
The recommendations to Tetra Pak based on the results of the study are the following:
• Continue to minimise the amount of plastics used. In this context organic plastics could be an alternative, but they have not been investigated in this study
• Continue to minimise the materials used for each individual packaging system, including also secondary packaging such as corrugated cardboard
• Continue to purchase electricity from renewable sources; so called green electricity, and expand the use to more sites.
• Continue to set targets for material recycling rate, and try to enhance availability of cardboard and paperboard recycling plants as well as collection systems (even though incineration with energy recovery may be favourable at some markets)
13
Table of contents
Summary............................................................................................................................................. 1 Table of contents ............................................................................................................................ 13 1 Introduction .............................................................................................................................. 1 2 Goal of the study ...................................................................................................................... 2 3 Scope .......................................................................................................................................... 3
3.1 Functional unit.................................................................................................................. 3 3.2 Specification of the studied packaging systems ........................................................... 4 3.3 Simplified flowcharts ....................................................................................................... 9 3.4 Secondary packaging...................................................................................................... 13 3.5 Selection of LCA methodology.................................................................................... 14 3.6 System boundaries.......................................................................................................... 15 3.7 Geographical boundaries............................................................................................... 16 3.8 Boundaries in relation to natural systems ................................................................... 16 3.9 Time boundaries............................................................................................................. 17 3.10 Boundaries within the life cycle.................................................................................... 17
3.10.1 Production of electricity and fuels .................................................................... 18 3.10.2 Initial boundaries – non-elementary inputs ..................................................... 19 3.10.3 Initial boundaries – non-elementary outputs................................................... 19 3.10.4 Validation of boundaries .................................................................................... 19 3.10.5 Expansion beyond the investigated life cycles ................................................ 19
3.11 Allocation approaches ................................................................................................... 20 3.11.1 Allocation and assumptions at recycling .......................................................... 21 3.11.2 Co-product allocation ......................................................................................... 23 3.11.3 Cut-offs ................................................................................................................. 23
3.12 Data quality requirements ............................................................................................. 24 3.13 Data from databases ...................................................................................................... 24 3.14 Known data gaps............................................................................................................ 25 3.15 Key assumptions ............................................................................................................ 26
3.15.1 Electricity production ......................................................................................... 26 3.15.2 Waste management.............................................................................................. 28 3.15.3 Incineration with energy recovery..................................................................... 29 3.15.4 Avoided material/products ................................................................................ 29 3.15.5 Emission of greenhouse gases at landfill.......................................................... 29 3.15.6 Fillers ..................................................................................................................... 30 3.15.7 Transportation...................................................................................................... 30
3.16 Selection of impact categories ...................................................................................... 33 3.17 Interpretation methods.................................................................................................. 34
3.17.1 Analysis of differences between the markets................................................... 34 3.17.2 Alternative presentation of avoided emissions................................................ 34 3.17.3 Sensitivity check................................................................................................... 34 3.17.4 Completeness check ............................................................................................ 36 3.17.5 Consistency check................................................................................................ 36
3.18 Critical review procedure .............................................................................................. 36 4 Inventory analysis ................................................................................................................... 37
4.1 Data collection and calculation procedure ................................................................. 37
14
4.2 Packaging specifications ................................................................................................ 37 4.3 Production of liquid packaging board......................................................................... 37 4.4 Production of plastics and metal.................................................................................. 38 4.5 Primary packaging production ..................................................................................... 38 4.6 Filler.................................................................................................................................. 39 4.7 Transport ......................................................................................................................... 39 4.8 Waste management ........................................................................................................ 39 4.9 Inventory results............................................................................................................. 40
5 Characterisation results for Sweden..................................................................................... 41 5.1 Dairy packaging Chilled................................................................................................. 41 5.2 Dairy packaging Ambient.............................................................................................. 46 5.3 Juice packaging Chilled.................................................................................................. 50 5.4 Juice packaging Ambient............................................................................................... 55 5.5 Grab & Go Chilled ........................................................................................................ 59 5.6 Grab & Go Ambient ..................................................................................................... 63 5.7 Micro Grab & Go .......................................................................................................... 68
6 Characterisation results for Denmark.................................................................................. 72 6.1 Dairy packaging Chilled................................................................................................. 72 6.2 Dairy packaging Ambient.............................................................................................. 74 6.3 Juice packaging Chilled.................................................................................................. 75 6.4 Juice packaging Ambient............................................................................................... 77 Grab & Go Chilled..................................................................................................................... 78 6.5 Grab & Go Ambient ..................................................................................................... 79 6.6 Micro Grab & Go .......................................................................................................... 81
7 Characterisation results for Finland..................................................................................... 82 7.1 Dairy packaging Chilled................................................................................................. 82 7.2 Dairy packaging Ambient.............................................................................................. 84 7.3 Juice packaging Chilled.................................................................................................. 85 7.4 Juice packaging Ambient............................................................................................... 87 7.5 Grab & Go Chilled ........................................................................................................ 88 7.6 Grab & Go Ambient ..................................................................................................... 89 7.7 Micro Grab & Go .......................................................................................................... 91
8 Characterisation results for Norway .................................................................................... 92 8.1 Dairy packaging Chilled................................................................................................. 92 8.2 Dairy packaging Ambient.............................................................................................. 94 8.3 Juice packaging Chilled.................................................................................................. 95 8.4 Juice packaging Ambient............................................................................................... 97 8.5 Grab & Go Chilled ........................................................................................................ 98 8.6 Grab & Go Ambient ..................................................................................................... 99 8.7 Micro Grab & Go ........................................................................................................ 101
9 Interpretation of the results ................................................................................................ 102 9.1 Analysis of differences between the markets ........................................................... 102 9.2 Alternative presentation of avoided emissions ........................................................ 104 9.3 Sensitivity analysis ........................................................................................................ 107
9.3.1 Marginal electricity ................................................................................................. 107 9.3.2 Distribution distance.............................................................................................. 107 9.3.3 PET replacing virgin/recycled material 100/0 .................................................. 108 9.3.4 Methane formation at landfill ............................................................................... 109 9.3.5 Delayed carbon emissions..................................................................................... 110
15
9.3.6 Transport from retail to consumer ...................................................................... 110 9.3.7 Norwegian district heating approximation ......................................................... 111 9.3.8 Tetra Top with smaller cap................................................................................... 112 9.3.9 Ambient versus chilled milk ................................................................................. 113
9.4 Completeness check..................................................................................................... 116 9.5 Consistency check ........................................................................................................ 118
10 Conclusions, limitations and recommendations .......................................................... 119 10.1 Conclusions................................................................................................................... 119 10.2 Limitations..................................................................................................................... 121 10.3 Recommendations........................................................................................................ 122
11 References.......................................................................................................................... 123 Appendix A: Introduction to life cycle assessment ..................................................................... 1 Appendix B: Inventory results for Sweden................................................................................... 7 Appendix C: Stratospheric ozone depletion potential............................................................... 16
1
1 Introduction
Tetra Pak has used LCA (Life Cycle Assessment) for several years in order to analyse its new packaging developments as well as existing packaging at different markets. In this study, four national markets in the Nordic countries are studied: Denmark, Finland, Norway and Sweden, here referred to as “the Nordics”.
The same packages may be filled and used in different markets in the Nordics, and thus end up in different recycling schemes and waste treatment systems depending in which country the consumption has taken place. LCA results and conclusions from one market and not necessarily valid in another since transport distances, recycling rates, waste treatment alternatives, etc. differ between the countries. A certain package may be favourable at one market with e.g. a high recycling rate, but may have a lower environmental performance at another market with e.g. a higher rate of landfill. Tetra Pak wants to identify the differences in the environmental performance of the different studied packages for each market. In order to calculate the results for such a large number of systems, a modular approach for liquid carton board packaging has been used, where the life cycle has been divided into life cycle phases or “modules”, enabling faster modelling of different combinations of packaging materials, carton mills, converting sites, filling location, distribution transport and waste management.
This study aims to fill the need for modelling a vast number of combinations by constructing a flexible LCA software model for the Nordic market, and using it to assess the environmental performance of 115 Tetra Pak and alternative packaging systems of packaging of 24 different packaging specifications. The study has been carried out by IVL Swedish Environmental Research Institute on behalf of, and in co-operation with, Tetra Pak from December 2008 until July 2009. The report has been critically reviewed by a third party critical review panel.
Alternative packaging systems have also been included in this study in order for Tetra Pak to be able to compare its own products with examples of alternative products. However, the alternative packages have only been studied in a generic way, without a dialogue with the producers at this point. Therefore, one of the roles of the critical review panel has been to check the assumptions and methodologies applied, so that the comparisons are made fair and consistent. Underestimates of the environmental impact of the alternative packages have been used rather than overestimates.
A group of experts within Tetra Pak has contributed by an extensive data collection, as well as been taking part of the different phases of the LCA, thereby guaranteeing the market relevance of the studied packaging systems for the Nordic market, the relevance of assumptions and relevance of methodological choices. IVL has chosen the methodologies used, however based on a dialogue with the Tetra Pak experts.
2
2 Goal of the study
The goal of the study is to calculate and compare the environmental performance of packaging with 24 different packaging specifications on four Nordic markets – Denmark, Finland, Norway and Sweden – resulting in a total of 29 packaging types (including different filler locations and packages used for both juice and milk) and 115 packaging systems (when applying the different packaging types at the four markets).
Of the 24 packaging specifications, 16 are manufactured by Tetra Pak and the remaining are alternative packages of liquid carton board, plastics and glass. The liquid carton board systems are modelled using a so-called modular approach, which gives flexibility for further studies.
The main objectives are to:
• Perform a critical reviewed comparative LCA on a number of Tetra Pak one litre dairy packages, one litre juice packages and Grab & Go packages of smaller sizes and present the environmental performance of the selected combinations of Tetra Pak packages, sites and local markets
• Compare the environmental performance of the Tetra Pak packaging with that of selected alternative, i.e. non-Tetra Pak packaging including PET, HDPE and glass packages.
• Construct a model for the package life cycle systems from raw material production to recycling and waste treatment for the Danish, Finnish, Norwegian and Swedish markets, by using a so-called modular approach, divided into life cycle phases.
• Perform sensitivity analyses of the environmental impact result, in order to identify the most contributing parts of the life cycles and the most important environmental impacts for the different packages.
• Try to identify a break-even point between ambient packaging, including a thin aluminium layer, and chilled packaging. A comparison will be carried out of the environmental impact of the chilling of the product in the dairy, transport to retail and in the retail, as compared to the environmental impact of the production of the aluminium and the extra heating process of the ambient product. Only the greenhouse gas emissions will be studied here.
• Identify possible improvement areas of the studied packaging systems through the supply chain that would be of interest for further analyses.
The studied packages have been divided into four product categories:
• Dairy packaging, 1000 ml (6 unique packaging specifications, and 3 that were modelled for both dairy and juice) used for milk and other dairy products.
• Juice packaging, 1000 ml (5 unique packaging specifications, and 3 that were modelled for both dairy and juice) used for fruit juice made from concentrate or fresh fruits.
3
• Grab & Go packaging, 250–500 ml (8 unique packaging specifications) used for different fruit juices, yoghurts, smoothies or other beverages.
• Micro Grab & Go packaging, 100 ml (2 unique packaging specifications), used for different fruit juices, yoghurts, vitamin “shots” or other beverages.
The presentation of results for the first three product groups are further divided into ambient and chilled packaging. Direct comparisons between packaging of different product groups or chilled/ambient products should be avoided since they have different requirements based on the type of beverage they contain.
In the case of Grab & Go packaging of 250–500 ml, comparisons are made between packaging of different sizes by scaling the results to the functional unit of 0.5 litres. This should be taken into consideration when interpreting the results.
Even though the results from chilled and ambient packaging should not be directly compared, obtaining an indicative result of their relative performance is highly interesting. An attempt has therefore been made to collect data and expand the systems in order to make a comparison of Tetra Brik Base (chilled) and Tetra Brik Aseptic Base (ambient). This is presented as a sensitivity analysis, and should only be seen as a first attempt to compare chilled and ambient products.
Any difference in product loss between different packaging is excluded due to lack of data. This exclusion is further discussed in the interpretation.
The study is performed according to the international standard of LCA, ISO 14044. The results will be used internally to increase the knowledge of the environmental impact of Tetra Pak’s products as compared to alternative packaging and for identification of the parts of the life cycle that contribute most to the total environmental impact, and externally for discussions with customers, other stakeholders and general public.
3 Scope
In this section, the scope of the study is described.
3.1 Functional unit
The functional unit describes the function provided by the product system, and serves as a basis of comparison between the different systems. This study includes different product groups, which store beverages with different requirements, and thus, different functional units have been used:
• Dairy packaging, 1000 ml: Distribution of 1 litre of milk at retail.
• Juice packaging, 1000 ml: Distribution of 1 litre of juice at retail.
• Grab & Go packaging, 250–500 ml: Distribution of 0.5 litre of portion-packed beverage at retail.
4
• Micro Grab & Go pack., 100 ml: Distribution of 0.5 litre of small portion- packed beverage at retail.
No comparisons should be made between packaging systems for different product groups – milk, juice and Grab & Go packages – since the products and functions are quite different.
The results are presented independently for each market since the main goal of this study is related to the study of packaging options at each market separately, and not as a market comparison.
3.2 Specification of the studied packaging systems
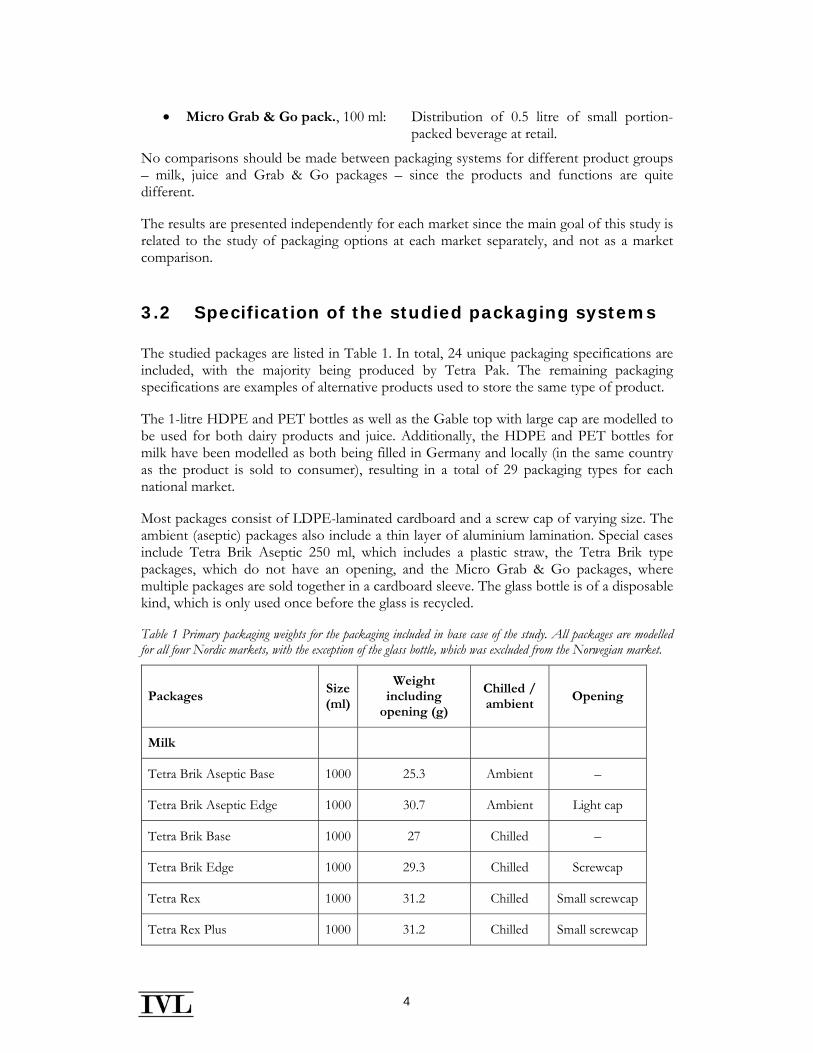
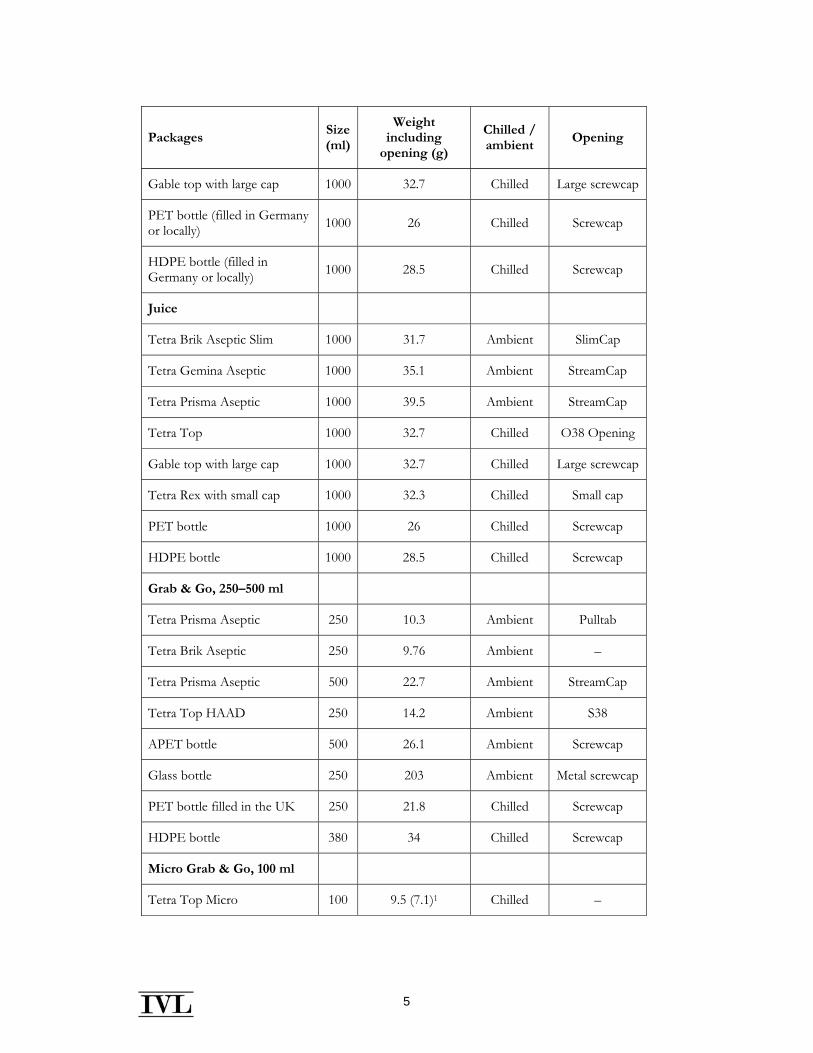
The studied packages are listed in Table 1. In total, 24 unique packaging specifications are included, with the majority being produced by Tetra Pak. The remaining packaging specifications are examples of alternative products used to store the same type of product.
The 1-litre HDPE and PET bottles as well as the Gable top with large cap are modelled to be used for both dairy products and juice. Additionally, the HDPE and PET bottles for milk have been modelled as both being filled in Germany and locally (in the same country as the product is sold to consumer), resulting in a total of 29 packaging types for each national market.
Most packages consist of LDPE-laminated cardboard and a screw cap of varying size. The ambient (aseptic) packages also include a thin layer of aluminium lamination. Special cases include Tetra Brik Aseptic 250 ml, which includes a plastic straw, the Tetra Brik type packages, which do not have an opening, and the Micro Grab & Go packages, where multiple packages are sold together in a cardboard sleeve. The glass bottle is of a disposable kind, which is only used once before the glass is recycled.
Table 1 Primary packaging weights for the packaging included in base case of the study. All packages are modelled for all four Nordic markets, with the exception of the glass bottle, which was excluded from the Norwegian market.
Packages Size (ml)
Weight including
opening (g)
Chilled / ambient
Opening
Milk
Tetra Brik Aseptic Base 1000 25.3 Ambient –
Tetra Brik Aseptic Edge 1000 30.7 Ambient Light cap
Tetra Brik Base 1000 27 Chilled –
Tetra Brik Edge 1000 29.3 Chilled Screwcap
Tetra Rex 1000 31.2 Chilled Small screwcap
Tetra Rex Plus 1000 31.2 Chilled Small screwcap
5
Packages Size (ml)
Weight including
opening (g)
Chilled / ambient
Opening
Gable top with large cap 1000 32.7 Chilled Large screwcap
PET bottle (filled in Germany or locally) 1000 26 Chilled Screwcap
HDPE bottle (filled in Germany or locally) 1000 28.5 Chilled Screwcap
Juice
Tetra Brik Aseptic Slim 1000 31.7 Ambient SlimCap
Tetra Gemina Aseptic 1000 35.1 Ambient StreamCap
Tetra Prisma Aseptic 1000 39.5 Ambient StreamCap
Tetra Top 1000 32.7 Chilled O38 Opening
Gable top with large cap 1000 32.7 Chilled Large screwcap
Tetra Rex with small cap 1000 32.3 Chilled Small cap
PET bottle 1000 26 Chilled Screwcap
HDPE bottle 1000 28.5 Chilled Screwcap
Grab & Go, 250–500 ml
Tetra Prisma Aseptic 250 10.3 Ambient Pulltab
Tetra Brik Aseptic 250 9.76 Ambient –
Tetra Prisma Aseptic 500 22.7 Ambient StreamCap
Tetra Top HAAD 250 14.2 Ambient S38
APET bottle 500 26.1 Ambient Screwcap
Glass bottle 250 203 Ambient Metal screwcap
PET bottle filled in the UK 250 21.8 Chilled Screwcap
HDPE bottle 380 34 Chilled Screwcap
Micro Grab & Go, 100 ml
Tetra Top Micro 100 9.5 (7.1)1 Chilled –
6
Packages Size (ml)
Weight including
opening (g)
Chilled / ambient
Opening
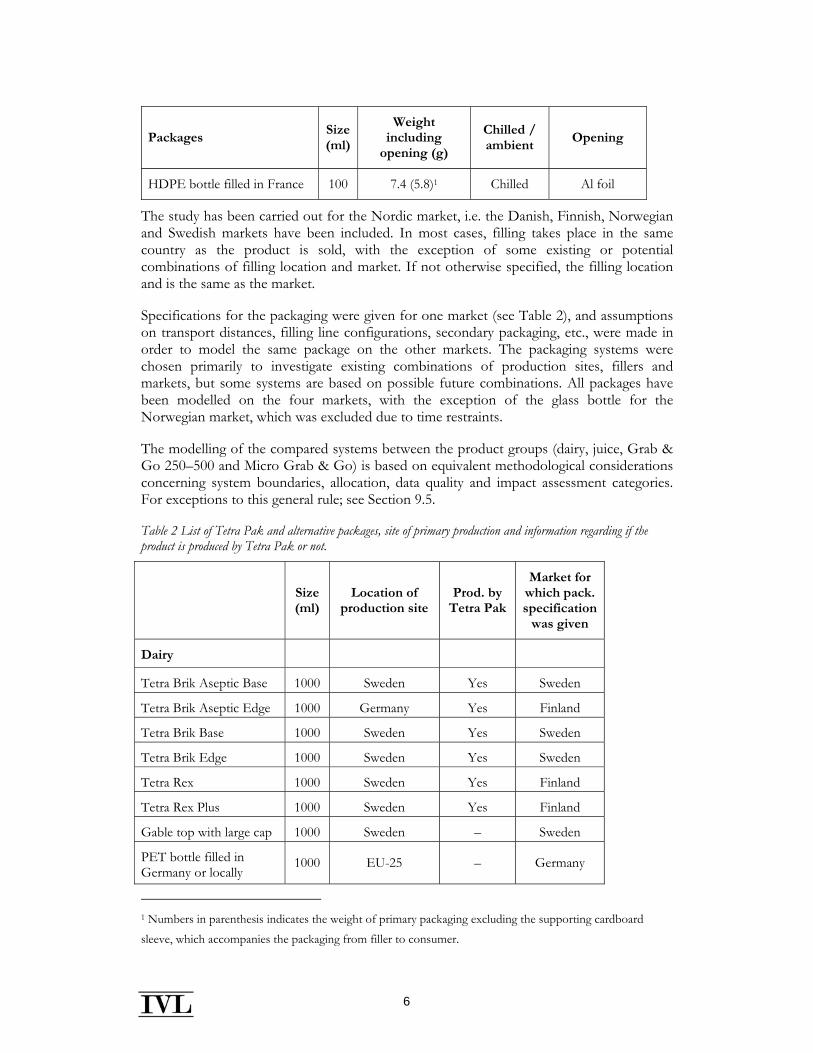
HDPE bottle filled in France 100 7.4 (5.8)1 Chilled Al foil
The study has been carried out for the Nordic market, i.e. the Danish, Finnish, Norwegian and Swedish markets have been included. In most cases, filling takes place in the same country as the product is sold, with the exception of some existing or potential combinations of filling location and market. If not otherwise specified, the filling location and is the same as the market.
Specifications for the packaging were given for one market (see Table 2), and assumptions on transport distances, filling line configurations, secondary packaging, etc., were made in order to model the same package on the other markets. The packaging systems were chosen primarily to investigate existing combinations of production sites, fillers and markets, but some systems are based on possible future combinations. All packages have been modelled on the four markets, with the exception of the glass bottle for the Norwegian market, which was excluded due to time restraints.
The modelling of the compared systems between the product groups (dairy, juice, Grab & Go 250–500 and Micro Grab & Go) is based on equivalent methodological considerations concerning system boundaries, allocation, data quality and impact assessment categories. For exceptions to this general rule; see Section 9.5.
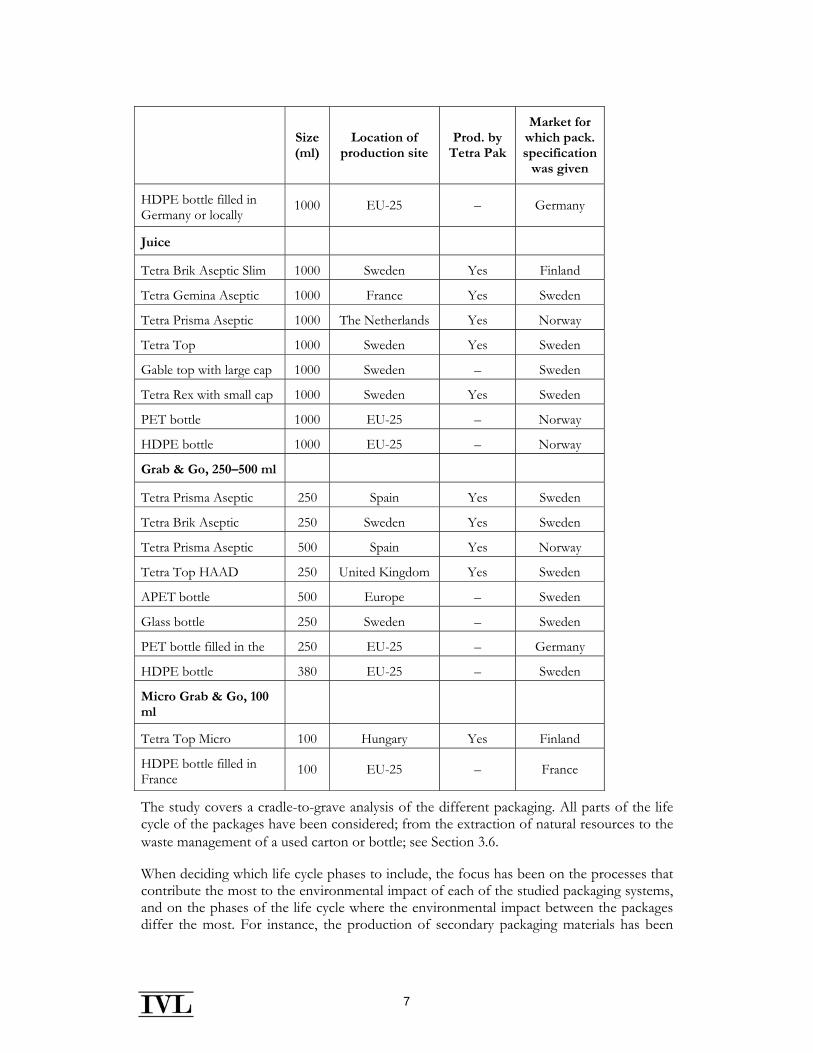
Table 2 List of Tetra Pak and alternative packages, site of primary production and information regarding if the product is produced by Tetra Pak or not.
Size (ml)
Location of production site
Prod. by Tetra Pak
Market for which pack. specification
was given
Dairy
Tetra Brik Aseptic Base 1000 Sweden Yes Sweden
Tetra Brik Aseptic Edge 1000 Germany Yes Finland
Tetra Brik Base 1000 Sweden Yes Sweden
Tetra Brik Edge 1000 Sweden Yes Sweden
Tetra Rex 1000 Sweden Yes Finland
Tetra Rex Plus 1000 Sweden Yes Finland
Gable top with large cap 1000 Sweden – Sweden
PET bottle filled in Germany or locally
1000 EU-25 – Germany
1 Numbers in parenthesis indicates the weight of primary packaging excluding the supporting cardboard sleeve, which accompanies the packaging from filler to consumer.
7
Size (ml)
Location of production site
Prod. by Tetra Pak
Market for which pack. specification
was given
HDPE bottle filled in Germany or locally
1000 EU-25 – Germany
Juice
Tetra Brik Aseptic Slim 1000 Sweden Yes Finland
Tetra Gemina Aseptic 1000 France Yes Sweden
Tetra Prisma Aseptic 1000 The Netherlands Yes Norway
Tetra Top 1000 Sweden Yes Sweden
Gable top with large cap 1000 Sweden – Sweden
Tetra Rex with small cap 1000 Sweden Yes Sweden
PET bottle 1000 EU-25 – Norway
HDPE bottle 1000 EU-25 – Norway
Grab & Go, 250–500 ml
Tetra Prisma Aseptic 250 Spain Yes Sweden
Tetra Brik Aseptic 250 Sweden Yes Sweden
Tetra Prisma Aseptic 500 Spain Yes Norway
Tetra Top HAAD 250 United Kingdom Yes Sweden
APET bottle 500 Europe – Sweden
Glass bottle 250 Sweden – Sweden
PET bottle filled in the 250 EU-25 – Germany
HDPE bottle 380 EU-25 – Sweden
Micro Grab & Go, 100 ml
Tetra Top Micro 100 Hungary Yes Finland
HDPE bottle filled in France
100 EU-25 – France
The study covers a cradle-to-grave analysis of the different packaging. All parts of the life cycle of the packages have been considered; from the extraction of natural resources to the waste management of a used carton or bottle; see Section 3.6.
When deciding which life cycle phases to include, the focus has been on the processes that contribute the most to the environmental impact of each of the studied packaging systems, and on the phases of the life cycle where the environmental impact between the packages differ the most. For instance, the production of secondary packaging materials has been
8
included since the amounts and types of secondary packaging differ between the different packages.
The production of milk, juice or other beverage products has not been included in the study, since the goal is to assess the environmental impact of packages and not that of the products. Nevertheless, the weight of the beverage is included in the distribution transport from the filler to the retailers in order to reflect the influence of the distribution phase in relation to other life cycle phases. It should be noted that the results of this study are thus not directly addable to i.e. a carbon footprint of milk. The same prudence against double counting should be taken in relation to what activities of the filler are included in the different product systems.
Any difference in product loss between different packaging is excluded due to lack of data. Furthermore, in earlier studies it has been very difficult to identify the loss allocated to the different packages. Therefore, the potential impact on product loss of such factors such as differences in size of screw cap is not analysed.
In the base case, the retail and the energy use for refrigeration at retail are not included. However, this is investigated in a sensitivity analysis. In addition, the consumer transport of filled packages from retail to the consumer has been included in a sensitivity analysis, but not in the base case. The consumer’s use of energy for refrigeration at home is not included in the base case; but discussed in the interpretation part of the report.
The consumer transport of the packages to the collection scheme is included, since the consumer transport to the collection scheme can be seen as the recycling system. For the treatment of municipal solid waste (MSW), however, there are door-to door collection schemes, why no consumer transport is included for the packages that go to MSW treatment.
9
3.3 Simplified flowcharts
In this section, simplified flow charts of the investigated systems are presented.
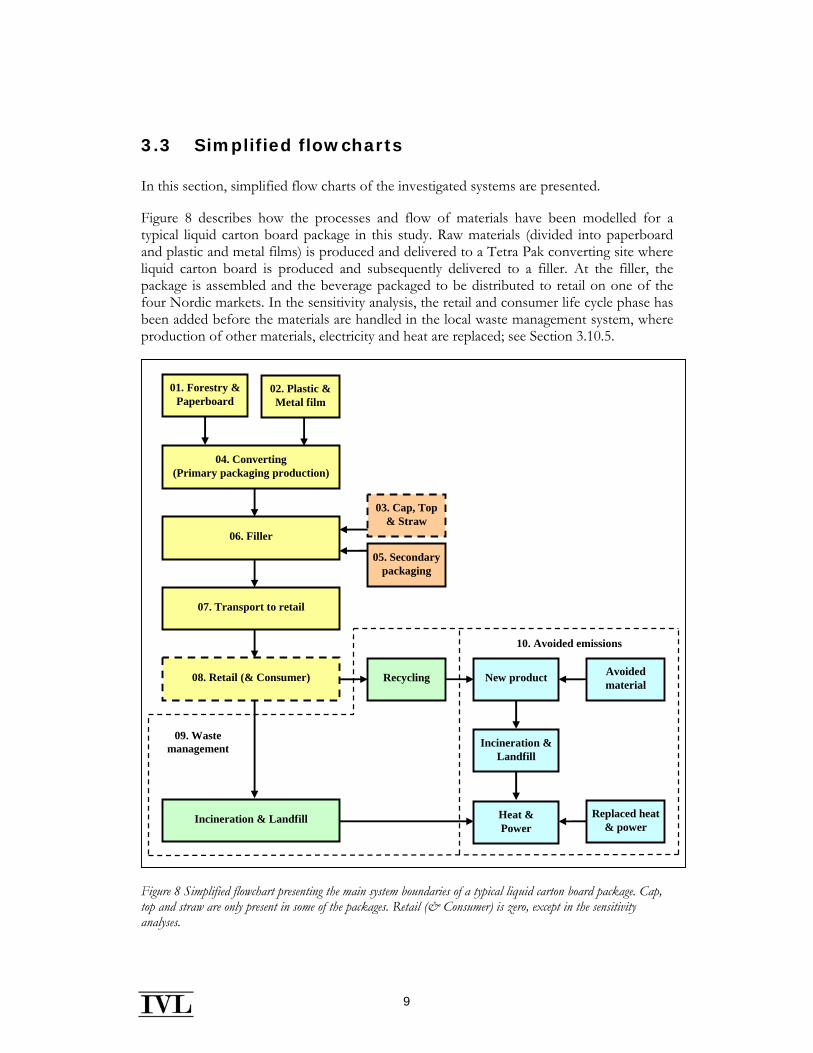
Figure 8 describes how the processes and flow of materials have been modelled for a typical liquid carton board package in this study. Raw materials (divided into paperboard and plastic and metal films) is produced and delivered to a Tetra Pak converting site where liquid carton board is produced and subsequently delivered to a filler. At the filler, the package is assembled and the beverage packaged to be distributed to retail on one of the four Nordic markets. In the sensitivity analysis, the retail and consumer life cycle phase has been added before the materials are handled in the local waste management system, where production of other materials, electricity and heat are replaced; see Section 3.10.5.
Figure 8 Simplified flowchart presenting the main system boundaries of a typical liquid carton board package. Cap, top and straw are only present in some of the packages. Retail (& Consumer) is zero, except in the sensitivity analyses.
01. Forestry & Paperboard
02. Plastic & Metal film
03. Cap, Top& Straw
04. Converting (Primary packaging production)
05. Secondary packaging
06. Filler
07. Transport to retail
08. Retail (& Consumer)
Incineration & Landfill
Recycling New product
Heat & Power
Avoided material
09. Waste management
10. Avoided emissions
Replaced heat & power
Incineration & Landfill
10
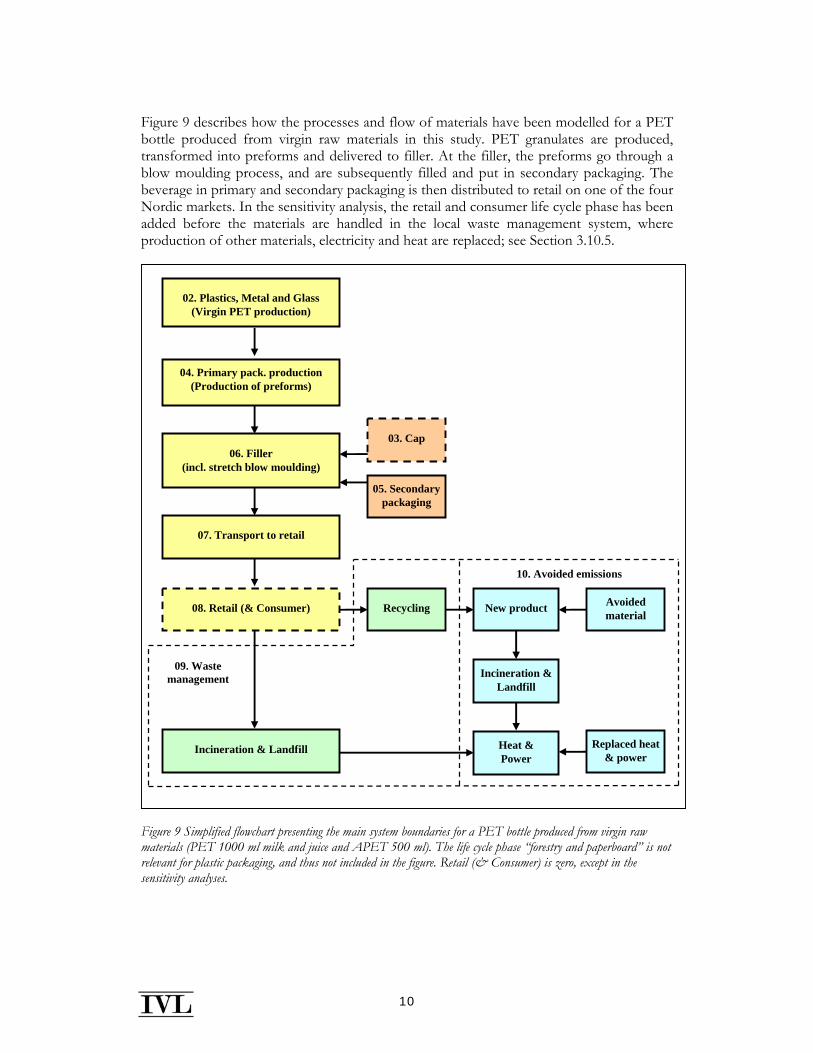
Figure 9 describes how the processes and flow of materials have been modelled for a PET bottle produced from virgin raw materials in this study. PET granulates are produced, transformed into preforms and delivered to filler. At the filler, the preforms go through a blow moulding process, and are subsequently filled and put in secondary packaging. The beverage in primary and secondary packaging is then distributed to retail on one of the four Nordic markets. In the sensitivity analysis, the retail and consumer life cycle phase has been added before the materials are handled in the local waste management system, where production of other materials, electricity and heat are replaced; see Section 3.10.5.
Figure 9 Simplified flowchart presenting the main system boundaries for a PET bottle produced from virgin raw materials (PET 1000 ml milk and juice and APET 500 ml). The life cycle phase “forestry and paperboard” is not relevant for plastic packaging, and thus not included in the figure. Retail (& Consumer) is zero, except in the sensitivity analyses.
04. Primary pack. production (Production of preforms)
03. Cap
05. Secondary packaging
06. Filler (incl. stretch blow moulding)
07. Transport to retail
02. Plastics, Metal and Glass (Virgin PET production)
08. Retail (& Consumer)
Incineration & Landfill
Recycling New product
Heat & Power
Avoided material
09. Waste management
10. Avoided emissions
Replaced heat & power
Incineration & Landfill
11
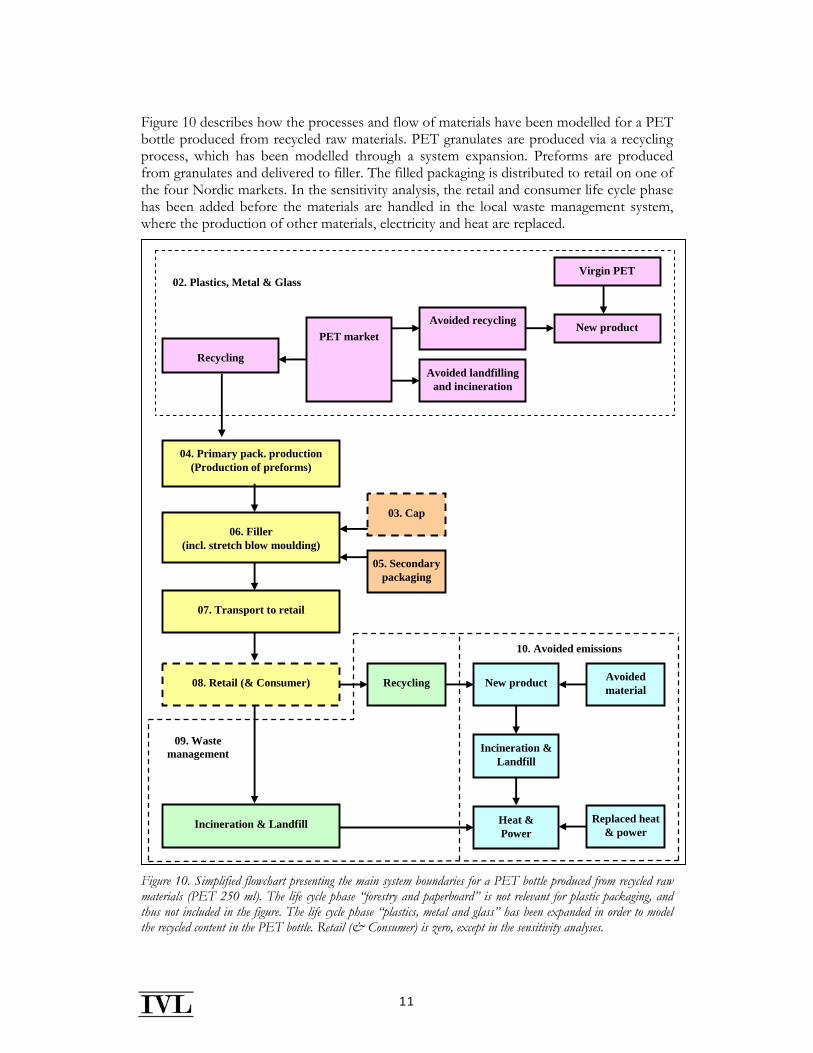
Figure 10 describes how the processes and flow of materials have been modelled for a PET bottle produced from recycled raw materials. PET granulates are produced via a recycling process, which has been modelled through a system expansion. Preforms are produced from granulates and delivered to filler. The filled packaging is distributed to retail on one of the four Nordic markets. In the sensitivity analysis, the retail and consumer life cycle phase has been added before the materials are handled in the local waste management system, where the production of other materials, electricity and heat are replaced.
Figure 10. Simplified flowchart presenting the main system boundaries for a PET bottle produced from recycled raw materials (PET 250 ml). The life cycle phase “forestry and paperboard” is not relevant for plastic packaging, and thus not included in the figure. The life cycle phase “plastics, metal and glass” has been expanded in order to model the recycled content in the PET bottle. Retail (& Consumer) is zero, except in the sensitivity analyses.
04. Primary pack. production (Production of preforms)
03. Cap
05. Secondary packaging
06. Filler (incl. stretch blow moulding)
07. Transport to retail
Recycling
08. Retail (& Consumer)
Incineration & Landfill
Recycling New product
Heat & Power
Avoided material
09. Waste management
10. Avoided emissions
Replaced heat & power
Incineration & Landfill
PET market
Virgin PET
Avoided landfilling and incineration
02. Plastics, Metal & Glass
Avoided recycling New product
12
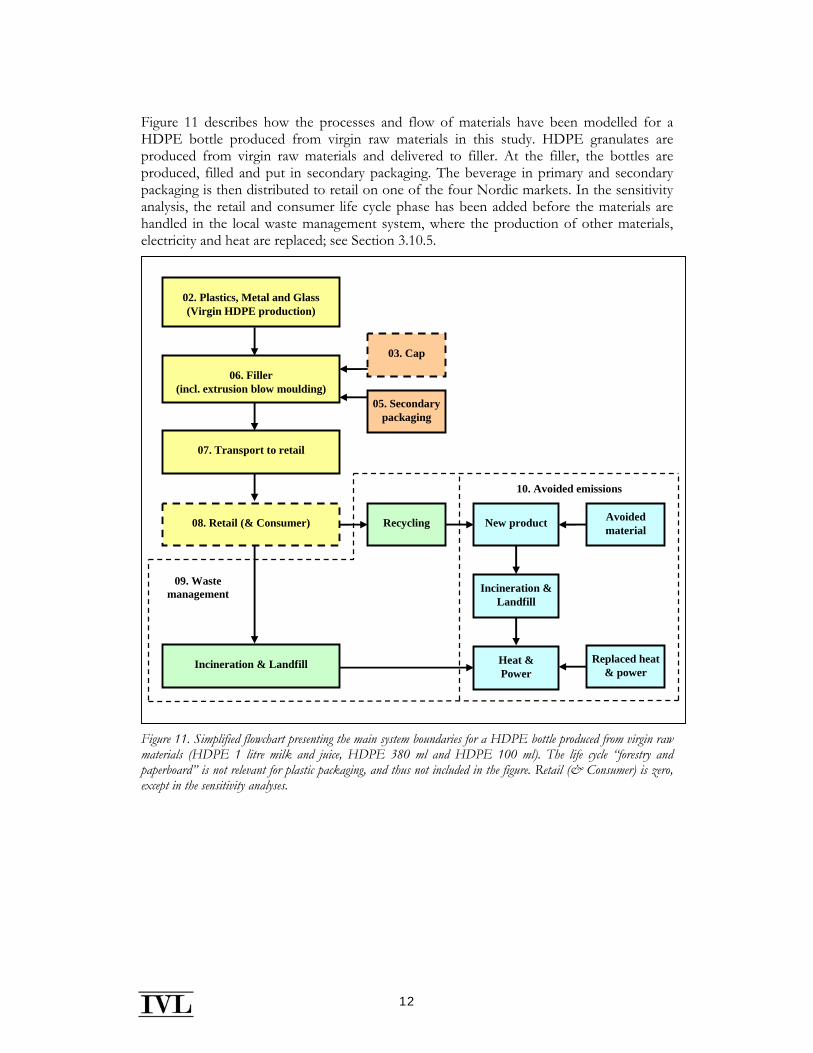
Figure 11 describes how the processes and flow of materials have been modelled for a HDPE bottle produced from virgin raw materials in this study. HDPE granulates are produced from virgin raw materials and delivered to filler. At the filler, the bottles are produced, filled and put in secondary packaging. The beverage in primary and secondary packaging is then distributed to retail on one of the four Nordic markets. In the sensitivity analysis, the retail and consumer life cycle phase has been added before the materials are handled in the local waste management system, where the production of other materials, electricity and heat are replaced; see Section 3.10.5.
Figure 11. Simplified flowchart presenting the main system boundaries for a HDPE bottle produced from virgin raw materials (HDPE 1 litre milk and juice, HDPE 380 ml and HDPE 100 ml). The life cycle “forestry and paperboard” is not relevant for plastic packaging, and thus not included in the figure. Retail (& Consumer) is zero, except in the sensitivity analyses.
03. Cap
05. Secondary packaging
06. Filler (incl. extrusion blow moulding)
07. Transport to retail
02. Plastics, Metal and Glass (Virgin HDPE production)
08. Retail (& Consumer)
Incineration & Landfill
Recycling New product
Heat & Power
Avoided material
09. Waste management
10. Avoided emissions
Replaced heat & power
Incineration & Landfill
13
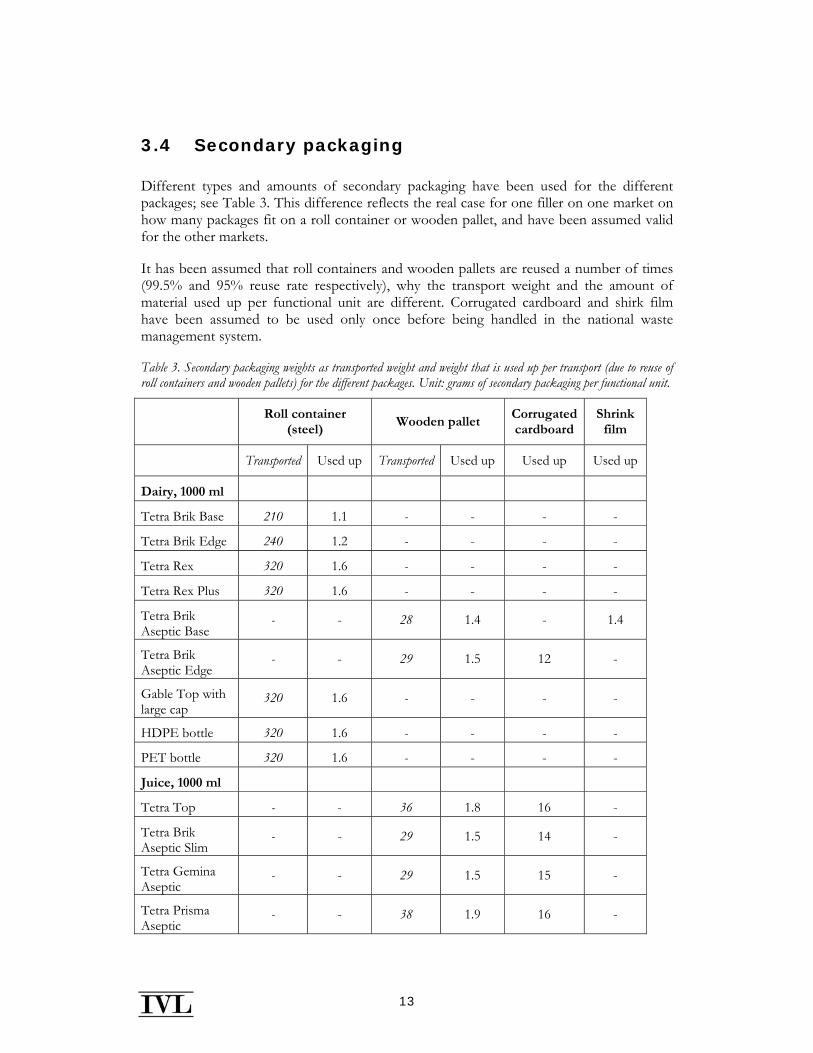
3.4 Secondary packaging
Different types and amounts of secondary packaging have been used for the different packages; see Table 3. This difference reflects the real case for one filler on one market on how many packages fit on a roll container or wooden pallet, and have been assumed valid for the other markets.
It has been assumed that roll containers and wooden pallets are reused a number of times (99.5% and 95% reuse rate respectively), why the transport weight and the amount of material used up per functional unit are different. Corrugated cardboard and shirk film have been assumed to be used only once before being handled in the national waste management system.
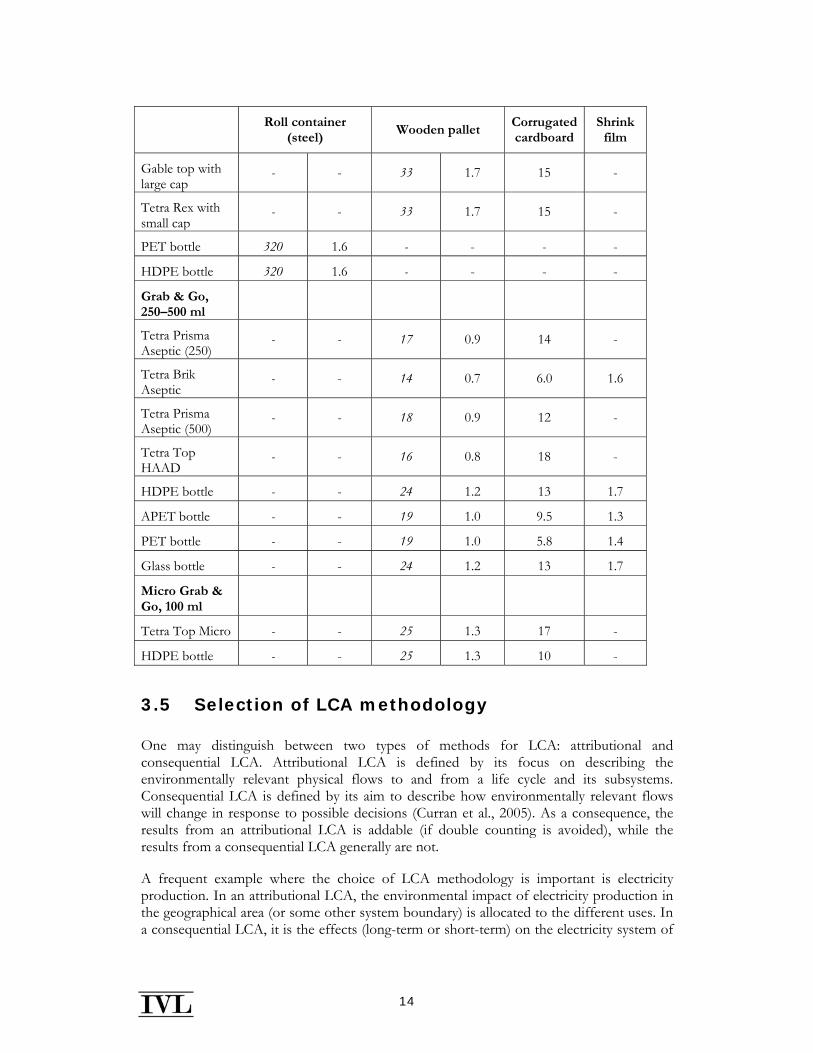
Table 3. Secondary packaging weights as transported weight and weight that is used up per transport (due to reuse of roll containers and wooden pallets) for the different packages. Unit: grams of secondary packaging per functional unit.
Roll container
(steel) Wooden pallet
Corrugated cardboard
Shrink film
Transported Used up Transported Used up Used up Used up
Dairy, 1000 ml
Tetra Brik Base 210 1.1 - - - -
Tetra Brik Edge 240 1.2 - - - -
Tetra Rex 320 1.6 - - - -
Tetra Rex Plus 320 1.6 - - - -
Tetra Brik Aseptic Base
- - 28 1.4 - 1.4
Tetra Brik Aseptic Edge
- - 29 1.5 12 -
Gable Top with large cap
320 1.6 - - - -
HDPE bottle 320 1.6 - - - -
PET bottle 320 1.6 - - - -
Juice, 1000 ml
Tetra Top - - 36 1.8 16 -
Tetra Brik Aseptic Slim
- - 29 1.5 14 -
Tetra Gemina Aseptic
- - 29 1.5 15 -
Tetra Prisma Aseptic
- - 38 1.9 16 -
14
Roll container
(steel) Wooden pallet
Corrugated cardboard
Shrink film
Gable top with large cap
- - 33 1.7 15 -
Tetra Rex with small cap
- - 33 1.7 15 -
PET bottle 320 1.6 - - - -
HDPE bottle 320 1.6 - - - -
Grab & Go, 250–500 ml
Tetra Prisma Aseptic (250)
- - 17 0.9 14 -
Tetra Brik Aseptic
- - 14 0.7 6.0 1.6
Tetra Prisma Aseptic (500)
- - 18 0.9 12 -
Tetra Top HAAD
- - 16 0.8 18 -
HDPE bottle - - 24 1.2 13 1.7
APET bottle - - 19 1.0 9.5 1.3
PET bottle - - 19 1.0 5.8 1.4
Glass bottle - - 24 1.2 13 1.7
Micro Grab & Go, 100 ml
Tetra Top Micro - - 25 1.3 17 -
HDPE bottle - - 25 1.3 10 -
3.5 Selection of LCA methodology
One may distinguish between two types of methods for LCA: attributional and consequential LCA. Attributional LCA is defined by its focus on describing the environmentally relevant physical flows to and from a life cycle and its subsystems. Consequential LCA is defined by its aim to describe how environmentally relevant flows will change in response to possible decisions (Curran et al., 2005). As a consequence, the results from an attributional LCA is addable (if double counting is avoided), while the results from a consequential LCA generally are not.
A frequent example where the choice of LCA methodology is important is electricity production. In an attributional LCA, the environmental impact of electricity production in the geographical area (or some other system boundary) is allocated to the different uses. In a consequential LCA, it is the effects (long-term or short-term) on the electricity system of
15
an increase/decrease in electricity use that is applied, i.e. the marginal electricity production technology.
The choice between the two types of LCA methodology is further discussed by Ekvall et al. (2005), where the terms retrospective/prospective LCA are used instead of attributional/consequential LCA.
In this study, attributional LCA methodology is used as far as possible. System expansion has been applied at waste management, assuming e.g. that average electricity and heat are substituted. For information on how electricity production is handled in the model, see Section 3.15.1.
3.6 System boundaries
An LCA should include all processes contributing significantly to the environmental impacts of the system investigated. In this study, it is important to include all life cycle phases in which there are significant differences between the systems, but also the processes that contribute significantly to the environmental impact of each of the studied product systems.
In the calculations and presentation of the environmental impact of the packages, the following life cycle phases have been used:
1. Forestry & Paperboard: Forestry operations and liquid packaging board production, including the transport to primary packaging production (not applicable for plastic and glass packaging).
2. Plastics, Metals & Glass: Extraction of natural resources and production of raw materials (except liquid packaging board), including transport to primary packaging production. For the glass bottles, this step includes the extraction of raw materials for virgin glass and the recycling process for inputs to glass bottle production.
3. Cap, Top & Straw: Production and transport of plastics and metal raw materials for cap, top and straw (not applicable for all packages).
4. Primary packaging production: Production of primary packaging, including waste management of production waste as well as avoided emissions according to the system expansion at recycling and incineration with energy recovery. This life cycle phase also includes the transport of empty primary packaging to the filling site. For HDPE packaging, plastic granulates are delivered directly to the filler, and thus this step is not relevant. Due to the format of data for the glass bottle, this life cycle step takes glass raw materials and bottle-grade recycled glass as inputs.
5. Secondary packaging production: Production of secondary packaging (and in some cases tertiary packaging), such as corrugated cardboard trays, plastic films and wooden pallets for the transport of filled packages to retail. The production of cardboard sleeve for Micro Grab & Go packaging is also included in this step.
6. Filler: Filling of the packages at dairy or corresponding site for juice, including electricity, water and peroxide use for usage and cleaning of the filling line. This includes not only the filling machine itself, but other machines in the line, such as
16
conveyor belts and palletisers. For PET and HDPE bottles, stretch blow moulding and extrusion blow moulding respectively is included in this step.
7. Transport to retail: Transport by truck of filled primary and secondary packages to retail, also referred to as “distribution”. This life cycle phase includes the weight of the beverage, but excludes energy use for chilling in the base case.
8. Retail (& Consumer): The environmental impact is assumed to be zero at retail and consumer in the base case, but this life cycle phase has been included since it is studied in the sensitivity analyses.
9. Waste management: Includes the disposal of primary and secondary packaging; recycling, incineration and landfill.
10. Avoided emissions: Avoided emissions due to system expansion at recycling and incineration with energy recovery. The avoided “emissions” includes both avoided energy production (power and district heating) as well as avoided alternative production of materials.
The subsequent sections describe the system boundaries in further detail, including what has been excluded from the different life cycle phases.
3.7 Geographical boundaries
Since the purpose of the study is to reflect conditions on the Nordic market; i.e., the LCA concerns use of packages in Sweden, Norway, Denmark and Finland, only packages that are used, or has potential to be used, on the Nordic market are included.
Within the studied systems, some processes are located outside the Nordic countries, e.g., the production of some of the raw materials and some of the primary packaging. These processes have been modelled as such and included in the study.
Data on production of virgin PET, HDPE, LLDPE, LDPE and PP are based on data from Plastics Europe (Boustead, 2005), where European average production data for each specific plastic are used. In these studies, the electricity production data is based on weighted national averages.
Furthermore, data on production of primary aluminium production, rolling of sheets and recycling of the aluminium that is collected in open loop used in the study are European average data, based on information from European Aluminium Association (2008).
All environmental impact categories used in this study have a global scope, i.e. the geographical location of the emissions is not important to link emission and related (potential) environmental effect.
3.8 Boundaries in relation to natural systems
The cradle of the life cycle is nature. The boundary between nature and the product life cycle is crossed when the materials, such as crude oil, are extracted from the ground. The
17
grave of the life cycle is the soil (after human activity has ceased, and landfill gas emissions and leakage production are minimal), the air (e.g., emissions from combustion of fuels) or water (e.g., water emissions from wastewater treatment).
At incineration of waste, the emissions to air and the ashes or waste generated from the incineration process are included. The landfilling of the ashes however is not included. The ash is therefore a non-elementary outflow from the system, i.e., an outflow not followed to the boundary between technosphere and nature (here stated as non-elementary waste). There are also other non-elementary outflows, e.g. from databases used for upstream processes, such as Plastics Europe.
3.9 Time boundaries
The study aims at describing the current situation of different packages, and thus as recent data as possible has been collected. For site-specific data from Tetra Pak, an average over three years of production (2005–2007) has been used to compensate for year-to-year fluctuations. As a result of this, the amount of electricity used is an average for 2005–2007. However, the electricity production technology used for the Tetra Pak converting processes is based on the contract with the electricity suppliers of 2008 to reflect the current situation as closely as possible.
In the assessment of the greenhouse gas emissions and their impact on global warming, a 100-year perspective has been used on global warming potential. The choice of a 100-year period is the most common perspective used in LCAs and discussions about global warming, but one should note that it is often somewhat arbitrarily chosen.
The emissions from landfill are cut off after a 100-year period. The remaining carbon content of cardboard products could be accounted for as storage of biogenic carbon in ground. This alternative methodology for the biogenic carbon balance is investigated in the sensitivity analysis.
3.10 Boundaries within the life cycle
Boundaries within the life cycle describe where in the life cycle different environmental burdens are accounted for as inputs or outputs and the aggregation level of the presented data.
For practical reasons, some extracting processes have been summarised with other production processes downstream into aggregated ”cradle-to-gate” data sets, presented as one process. This is often due to the way data are presented in literature and databases.
Data on the converting processes from Tetra Pak include all activities at the different production sites, covering as well the lighting and heating of buildings as the converting production. The output from the different converting sites is reported internally by Tetra Pak as the annual production of a number of standard packages, and thus this has been used in this study. The energy demand, water use, as well as the process-specific emissions
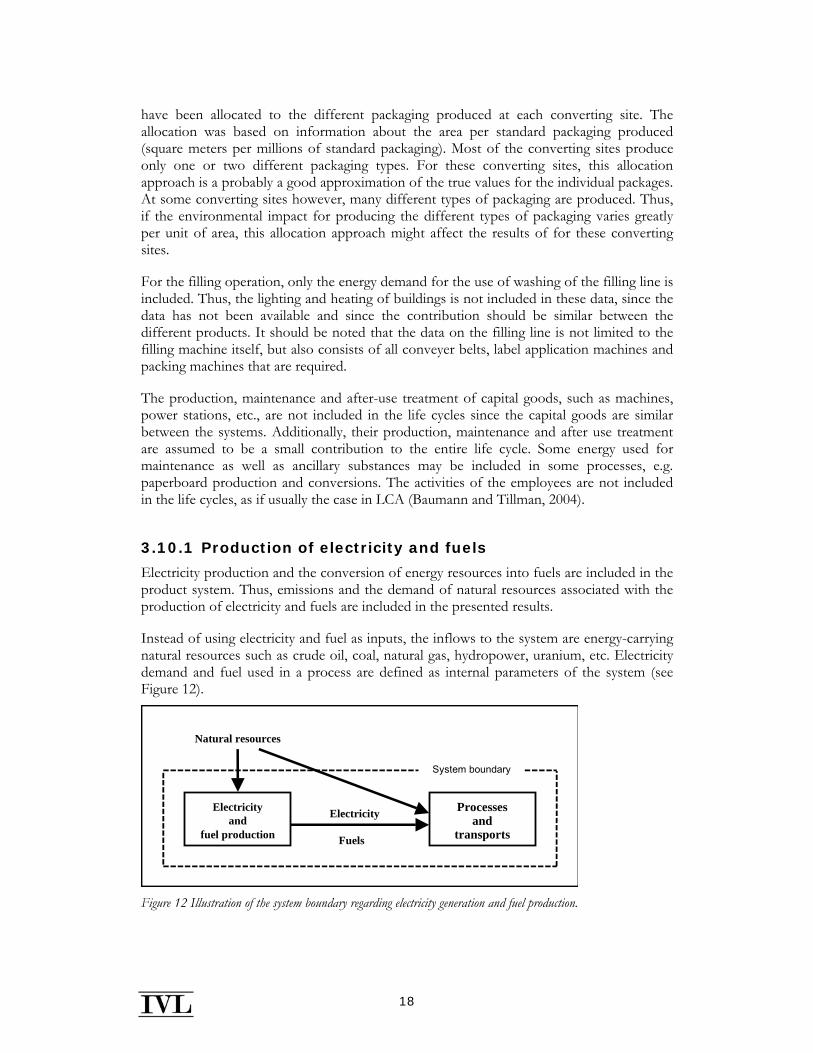
18
have been allocated to the different packaging produced at each converting site. The allocation was based on information about the area per standard packaging produced (square meters per millions of standard packaging). Most of the converting sites produce only one or two different packaging types. For these converting sites, this allocation approach is a probably a good approximation of the true values for the individual packages. At some converting sites however, many different types of packaging are produced. Thus, if the environmental impact for producing the different types of packaging varies greatly per unit of area, this allocation approach might affect the results of for these converting sites.
For the filling operation, only the energy demand for the use of washing of the filling line is included. Thus, the lighting and heating of buildings is not included in these data, since the data has not been available and since the contribution should be similar between the different products. It should be noted that the data on the filling line is not limited to the filling machine itself, but also consists of all conveyer belts, label application machines and packing machines that are required.
The production, maintenance and after-use treatment of capital goods, such as machines, power stations, etc., are not included in the life cycles since the capital goods are similar between the systems. Additionally, their production, maintenance and after use treatment are assumed to be a small contribution to the entire life cycle. Some energy used for maintenance as well as ancillary substances may be included in some processes, e.g. paperboard production and conversions. The activities of the employees are not included in the life cycles, as if usually the case in LCA (Baumann and Tillman, 2004).
3.10.1 Production of electricity and fuels
Electricity production and the conversion of energy resources into fuels are included in the product system. Thus, emissions and the demand of natural resources associated with the production of electricity and fuels are included in the presented results.
Instead of using electricity and fuel as inputs, the inflows to the system are energy-carrying natural resources such as crude oil, coal, natural gas, hydropower, uranium, etc. Electricity demand and fuel used in a process are defined as internal parameters of the system (see Figure 12).
System boundary
Processes and
transports
Electricity and
fuel production
Electricity
Natural resources
Fuels
Figure 12 Illustration of the system boundary regarding electricity generation and fuel production.
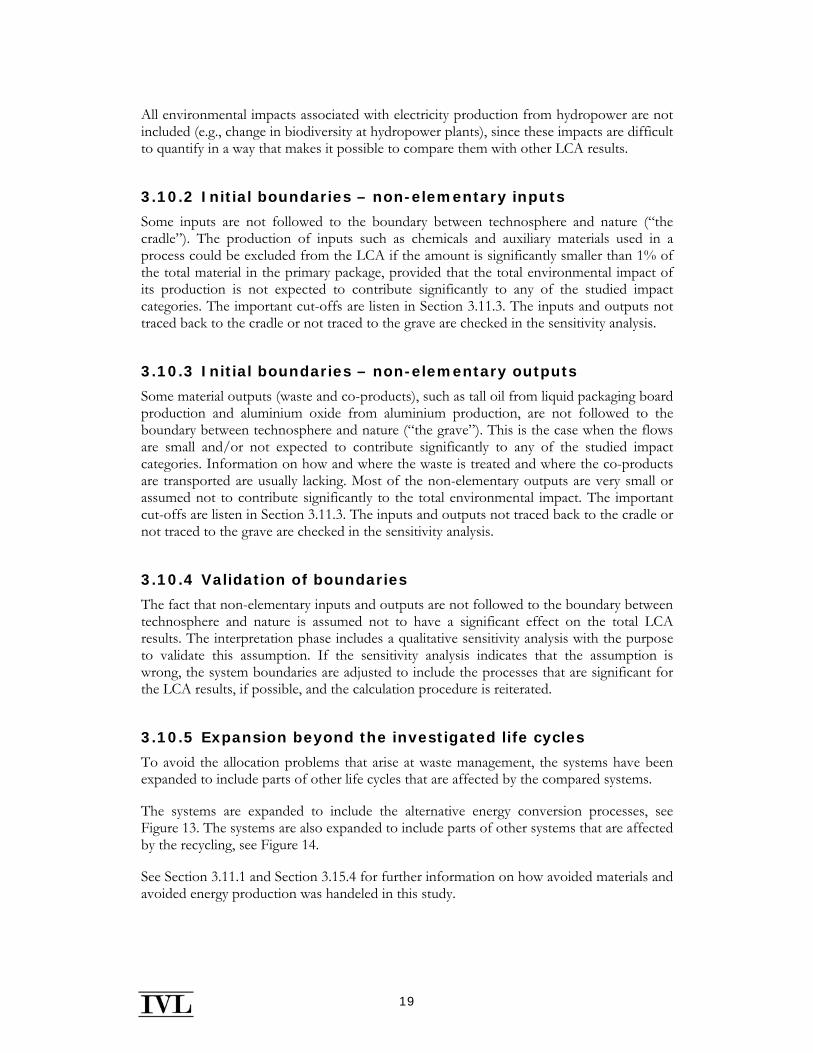
19
All environmental impacts associated with electricity production from hydropower are not included (e.g., change in biodiversity at hydropower plants), since these impacts are difficult to quantify in a way that makes it possible to compare them with other LCA results.
3.10.2 Initial boundaries – non-elementary inputs
Some inputs are not followed to the boundary between technosphere and nature (“the cradle”). The production of inputs such as chemicals and auxiliary materials used in a process could be excluded from the LCA if the amount is significantly smaller than 1% of the total material in the primary package, provided that the total environmental impact of its production is not expected to contribute significantly to any of the studied impact categories. The important cut-offs are listen in Section 3.11.3. The inputs and outputs not traced back to the cradle or not traced to the grave are checked in the sensitivity analysis.
3.10.3 Initial boundaries – non-elementary outputs
Some material outputs (waste and co-products), such as tall oil from liquid packaging board production and aluminium oxide from aluminium production, are not followed to the boundary between technosphere and nature (“the grave”). This is the case when the flows are small and/or not expected to contribute significantly to any of the studied impact categories. Information on how and where the waste is treated and where the co-products are transported are usually lacking. Most of the non-elementary outputs are very small or assumed not to contribute significantly to the total environmental impact. The important cut-offs are listen in Section 3.11.3. The inputs and outputs not traced back to the cradle or not traced to the grave are checked in the sensitivity analysis.
3.10.4 Validation of boundaries
The fact that non-elementary inputs and outputs are not followed to the boundary between technosphere and nature is assumed not to have a significant effect on the total LCA results. The interpretation phase includes a qualitative sensitivity analysis with the purpose to validate this assumption. If the sensitivity analysis indicates that the assumption is wrong, the system boundaries are adjusted to include the processes that are significant for the LCA results, if possible, and the calculation procedure is reiterated.
3.10.5 Expansion beyond the investigated life cycles
To avoid the allocation problems that arise at waste management, the systems have been expanded to include parts of other life cycles that are affected by the compared systems.
The systems are expanded to include the alternative energy conversion processes, see Figure 13. The systems are also expanded to include parts of other systems that are affected by the recycling, see Figure 14.
See Section 3.11.1 and Section 3.15.4 for further information on how avoided materials and avoided energy production was handeled in this study.
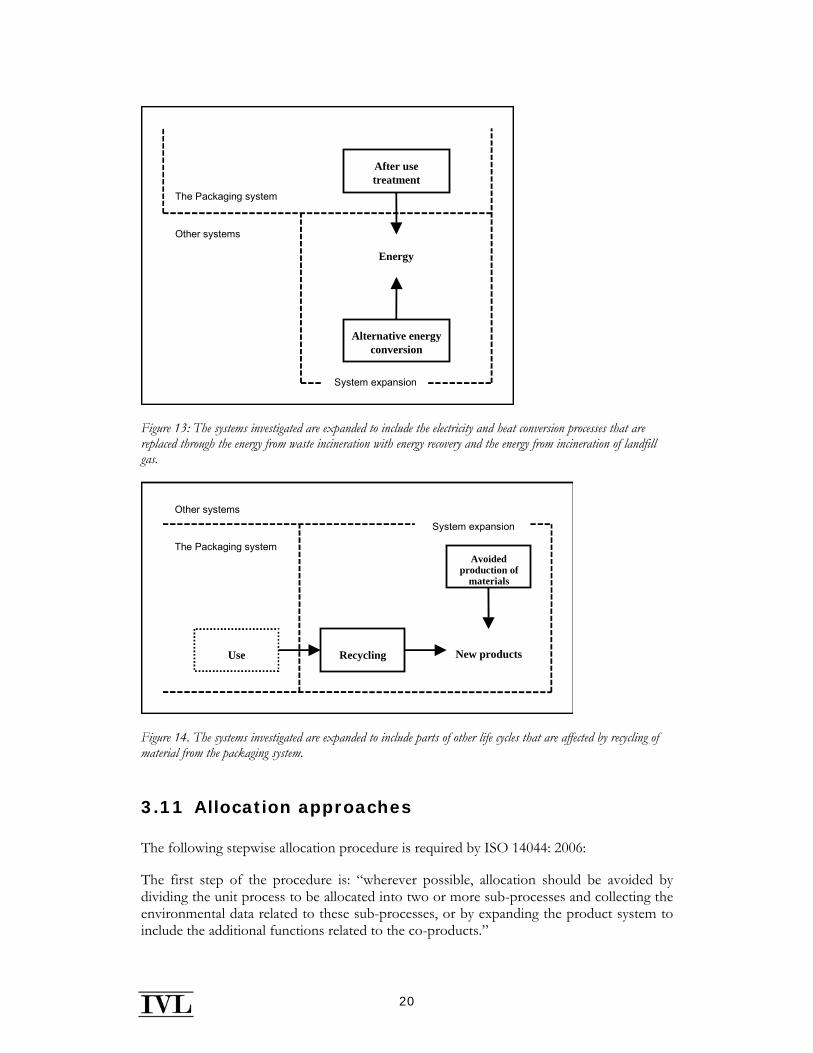
20
After usetreatment
Alternative energyconversion
Energy
The Packaging system
Other systems
System expansion
Figure 13: The systems investigated are expanded to include the electricity and heat conversion processes that are replaced through the energy from waste incineration with energy recovery and the energy from incineration of landfill gas.
System expansion
Other systems
The Packaging system
Recycling New products
Avoidedproduction of
materials
Use
Figure 14. The systems investigated are expanded to include parts of other life cycles that are affected by recycling of material from the packaging system.
3.11 Allocation approaches
The following stepwise allocation procedure is required by ISO 14044: 2006:
The first step of the procedure is: “wherever possible, allocation should be avoided by dividing the unit process to be allocated into two or more sub-processes and collecting the environmental data related to these sub-processes, or by expanding the product system to include the additional functions related to the co-products.”
21
The second step of the procedure recommended by ISO 14044: 2006 is: “where allocation cannot be avoided, the inputs and outputs of the system should be partitioned between its different products or functions in a way which reflects the underlying physical causal relationships between them; i.e. they should reflect the way in which the inputs and outputs are changed by quantitative changes in the products and functions delivered by the system.”
The third and final step of the ISO procedure is: “where physical causal relationships alone cannot be established or used as the basis for the allocation, the inputs should be allocated between the products and functions in a way that reflects other relationships between them.” For example, input and output data might be allocated between co-products in proportion to the economic value of the products. Note that ISO 14044 does not require that “other relationships” should be causal relationships.
The allocation principles and procedures described above also apply to reuse and recycling situations.
Changes in the inherent properties of the material shall be taken into account. In addition, particularly for the recovery process between the original and subsequent product system, the system boundary shall be identified and explained, ensuring that the allocation principles are observed as described above. However, in these situations, additional elaboration is needed for the following reasons:
• reuse and recycling may imply that the inputs and outputs associated with unit processes for extraction and processing of raw materials, recycling and final disposal of products are to be shared between the different product systems,
• reuse and recycling may change the inherent properties of materials in subsequent use, and
• specific care should be taken when defining system boundary with regard to recovery processes.
The allocation procedures used in this project are described in Section 3.11.1– 3.11.3.
3.11.1 Allocation and assumptions at recycling
Several allocation procedures are applicable for re-use and recycling.
The recycling of material from the systems investigated has primarily been modelled as replacing other products/materials in open loop. Due to the format of given data, glass recycling after use was modelled in closed loop. This method might provide a benefit for the glass bottle systems.
Material, which is collected for recycling after use in a packaging, enters a market where it competes with virgin material as well as recycled material from other systems. Here it is assumed assume that the recycled packages are used for production of new products. The recycled material is assumed to replace a mix of virgin material and recycled material from other products, depending on the case, see Figure 15.
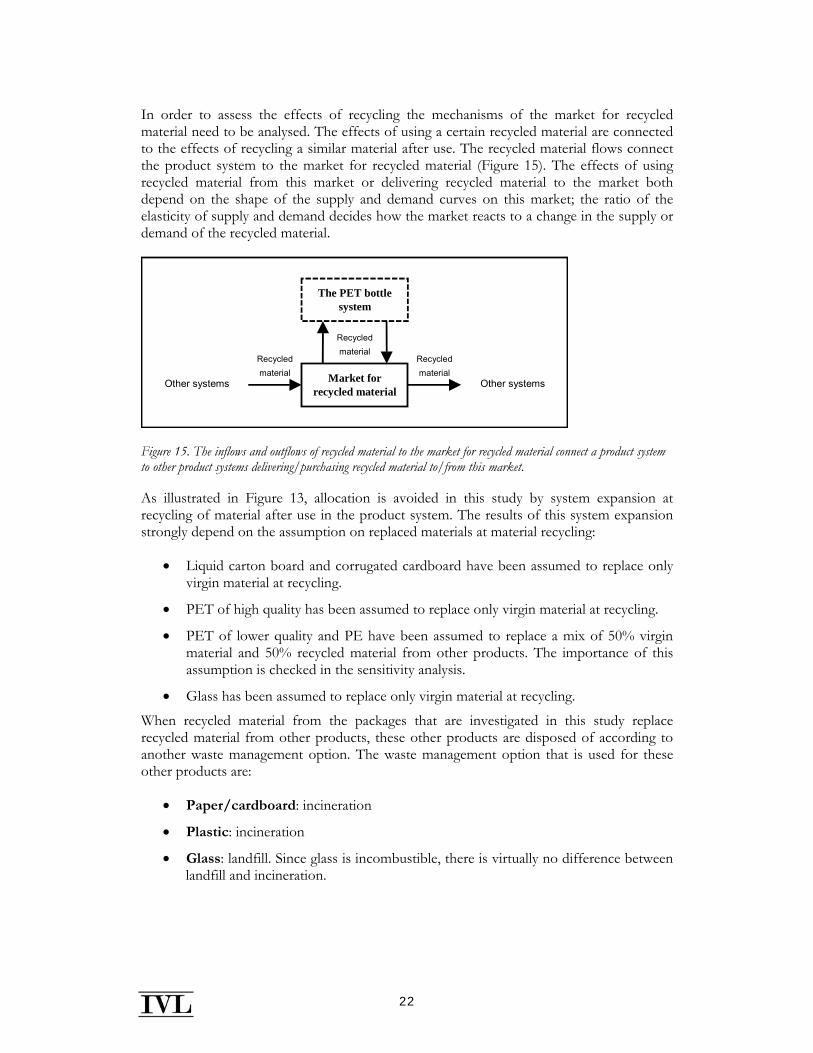
22
In order to assess the effects of recycling the mechanisms of the market for recycled material need to be analysed. The effects of using a certain recycled material are connected to the effects of recycling a similar material after use. The recycled material flows connect the product system to the market for recycled material (Figure 15). The effects of using recycled material from this market or delivering recycled material to the market both depend on the shape of the supply and demand curves on this market; the ratio of the elasticity of supply and demand decides how the market reacts to a change in the supply or demand of the recycled material.
The PET bottlesystem
Market forrecycled material
Recycledmaterial
Recycledmaterial
Recycledmaterial
Other systems Other systems
Figure 15. The inflows and outflows of recycled material to the market for recycled material connect a product system to other product systems delivering/purchasing recycled material to/from this market.
As illustrated in Figure 13, allocation is avoided in this study by system expansion at recycling of material after use in the product system. The results of this system expansion strongly depend on the assumption on replaced materials at material recycling:
• Liquid carton board and corrugated cardboard have been assumed to replace only virgin material at recycling.
• PET of high quality has been assumed to replace only virgin material at recycling.
• PET of lower quality and PE have been assumed to replace a mix of 50% virgin material and 50% recycled material from other products. The importance of this assumption is checked in the sensitivity analysis.
• Glass has been assumed to replace only virgin material at recycling.
When recycled material from the packages that are investigated in this study replace recycled material from other products, these other products are disposed of according to another waste management option. The waste management option that is used for these other products are:
• Paper/cardboard: incineration
• Plastic: incineration
• Glass: landfill. Since glass is incombustible, there is virtually no difference between landfill and incineration.
23
3.11.2 Co-product allocation
When the amount of co-products is very small (typically less than 1% of the weight of the primary packaging) and when the economic value of the co-products is very low, the effects on other life cycles will be cut off from the system. These co-products are reported as non-elementary outflows from the system investigated, see Section 3.11.3.
The allocation between different products from the producers of the liquid packaging board is performed by the producers.
The data on production of PET, LDPE, LLDPE, HDPE and PP are based on reports from Plastics Europe (Boustead, 2005). These data are not adequately disaggregated to allow recalculation according to this interpretation. In spite of this, this data has been used rather than older, disaggregated data from other sources. The use of aggregated Plastics Europe data might have significant effects on the total LCA results for the systems heavily dependent on these plastics.
The data on production of aluminium are based on European Aluminium Association (2008). In these EAA data, allocation has been avoided as much as possible through expanding the system boundaries. The only significant allocation cases concern two upstream processes; the production of caustic soda (NaOH used in the alumina production), where mass allocation has been applied, and the production of electricity with co-generation of steam, where allocation has been made based on exergy. The district heat and electricity produced at waste incineration in the EAA data on aluminium production has been re-introduced in the life cycle inventory model, reducing the energy input accordingly (energetic closed-loop recycling). Such energy input from incineration is however very limited (less than 1%).
The allocation between different packaging produced at Tetra Pak is performed by Tetra Pak, and is based on the area of the different products (see Section 3.10).
As illustrated in Figure 13, the systems have been expanded through subtracting the alternative energy conversion that is avoided through waste incineration in the product systems. The effect of this system expansion strongly depends on what energy sources are assumed to be replaced by the energy produced at waste incineration.
Data on PET and PE recycling were handled as an aggregated process where both plastics are produced. An allocation based on mass on the products was performed.
3.11.3 Cut-offs
The following cut-offs have been made:
• Bark (used as biogenic fuel) at the pulp and liquid packaging board plant has not been traced back to the forest.
• Co-products from liquid packaging board production, such as tall oil and turpentine have not been followed to the grave.
• Co-products from aluminium production, e.g. aluminium oxide have not been followed to the grave.
24
• Cardboard put to landfill and stored in ground after 100 years has been cut-off.
• The printing ink is of unknown type has not been traced to the cradle. Although the weight makes up less than 0.7% of the total weight of the packaging, its mass has been added to the total weight of liquid carton board packages for posterity.
• Heat from incineration at waste management of converting in non-Nordic countries has not been traced to the grave, i.e. no credit is given due to replaced district heating, if any.
For a list of data gaps, see Section 3.14. Important data gaps are analysed in Section 9.4
3.12 Data quality requirements
For liquid packaging board packages, company-specific data from Tetra Pak and the liquid packaging board suppliers to Tetra Pak have been used as far as possible. Literature and database data has been used as a complement. As recent data as possible has been used in the study.
For alternative packages, typical package sizes and weights have been used. However, no site-specific data have been possible to collect. These products’ life cycles are thus constructed from literature and public data on raw materials production, conversion process filling, etc, and are based on typical package concepts on the Nordic market or neighbouring countries. An aims has been to use underestimates of the environmental impact of alternative packages rather than overestimates.
When possible, data has been compared to alternative sources to assure a realistic order of magnitude.
When the characterisation results were calculated, it was apparent that data on emissions that contribute to stratospheric ozone depletion are attached with large uncertainties. Most of the emissions are part of the upstream energy data and other data sets without corresponding emissions in the site-specific data. The validity and temporal relevance of data are thus uncertain. Because of the mentioned uncertainties, the results are presented separately and no conclusions are drawn from them.
3.13 Data from databases
Table 4 shows the database data used. For recycling processes, production of chemicals, production of glass, tinplated coil, energy and transport, and waste management, data from the IVL database have been used.
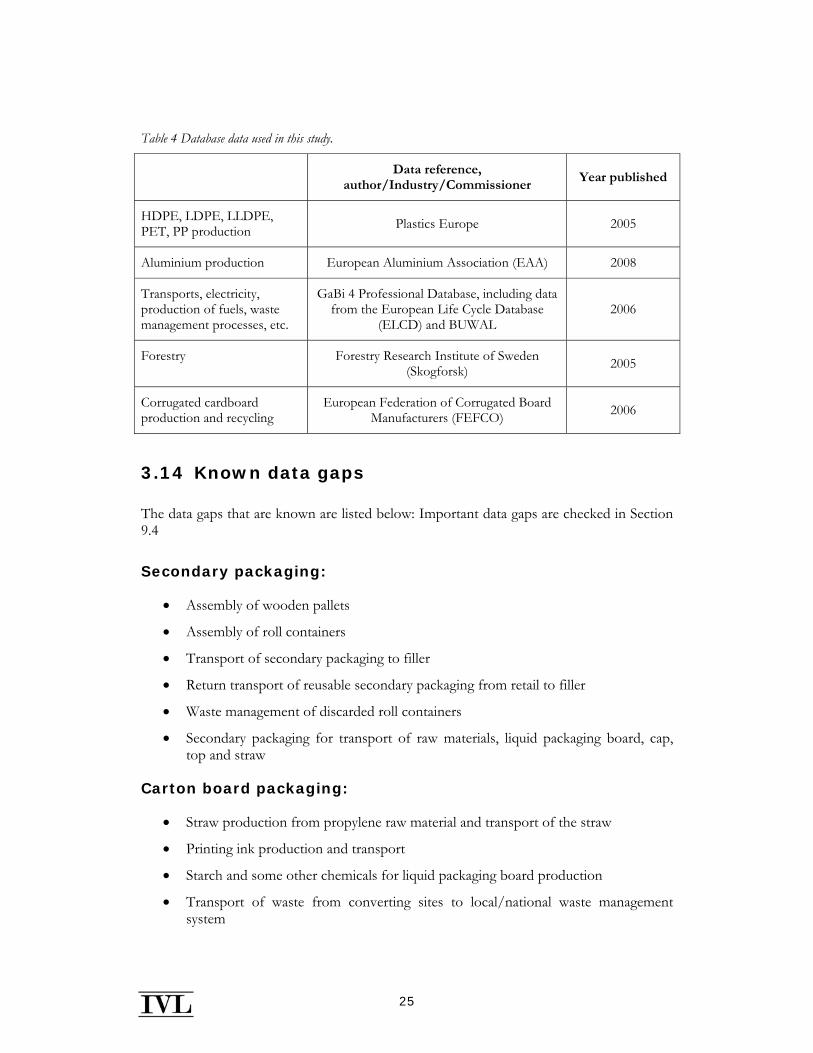
25
Table 4 Database data used in this study.
Data reference, author/Industry/Commissioner
Year published
HDPE, LDPE, LLDPE, PET, PP production Plastics Europe 2005
Aluminium production European Aluminium Association (EAA) 2008
Transports, electricity, production of fuels, waste management processes, etc.
GaBi 4 Professional Database, including data from the European Life Cycle Database
(ELCD) and BUWAL 2006
Forestry Forestry Research Institute of Sweden (Skogforsk) 2005
Corrugated cardboard production and recycling
European Federation of Corrugated Board Manufacturers (FEFCO) 2006
3.14 Known data gaps
The data gaps that are known are listed below: Important data gaps are checked in Section 9.4
Secondary packaging:
• Assembly of wooden pallets
• Assembly of roll containers
• Transport of secondary packaging to filler
• Return transport of reusable secondary packaging from retail to filler
• Waste management of discarded roll containers
• Secondary packaging for transport of raw materials, liquid packaging board, cap, top and straw
Carton board packaging:
• Straw production from propylene raw material and transport of the straw
• Printing ink production and transport
• Starch and some other chemicals for liquid packaging board production
• Transport of waste from converting sites to local/national waste management system
26
Other data gaps:
• Production, printing and transport of plastic label for glass bottle (approximation: production of PP film)
• Production of paper label for PET 250 ml
• Production of tin cap (approximation: production of tin plated coil)
• Transport to waste management for non-recycled material
• Resource use for production of liquefied petroleum gas (LPG)
Aside from this, there are no known data gaps in the inventory analysis of this study.
3.15 Key assumptions
This section lists some of the key assumptions during modelling of the packaging systems.
3.15.1 Electricity production
There are large differences in the environmental impacts between different electricity production technologies. The choice of electricity production data to use therefore requires careful consideration.
In an attributional LCA, the electricity is typically regarded as being produced in a system with a mix of technologies for electricity production. The emissions from the production of electricity are then calculated as the average emissions from the mix of energy sources.
The geographical or organisational boundaries of the system where the electricity is produced must be defined in order to calculate the average emissions. There is no objective way of defining these boundaries. Some alternative bases for defining system boundaries are the company from which the electricity is bought, the geographical area where an electricity market is effective and the geographical area where the transmission capacity is rarely a constraint. In the Nordics, some of the possible options are a Nordic average mix (Nordpool), national production mix and European mix.
In this study, the electricity production technology chosen is the average of the country in which the process of interest takes place or the contract-specific electricity purchased for a specific site if such data is available (PE International, 2006). The study is performed for the Nordic market, which is why mainly data on national average electricity production in Denmark, Finland, Norway and Sweden is used in the base scenario. In cases where a process is located outside the Nordic market, an average electricity mix from that country has been used. In the case of transport by train in an unknown European country, an average electricity mix for EU-25 has been used. The same applies for cap production at an unknown location in Europe. GWP100 characterisation factors of the different electricity mixes used in this study are listed in Table 5.
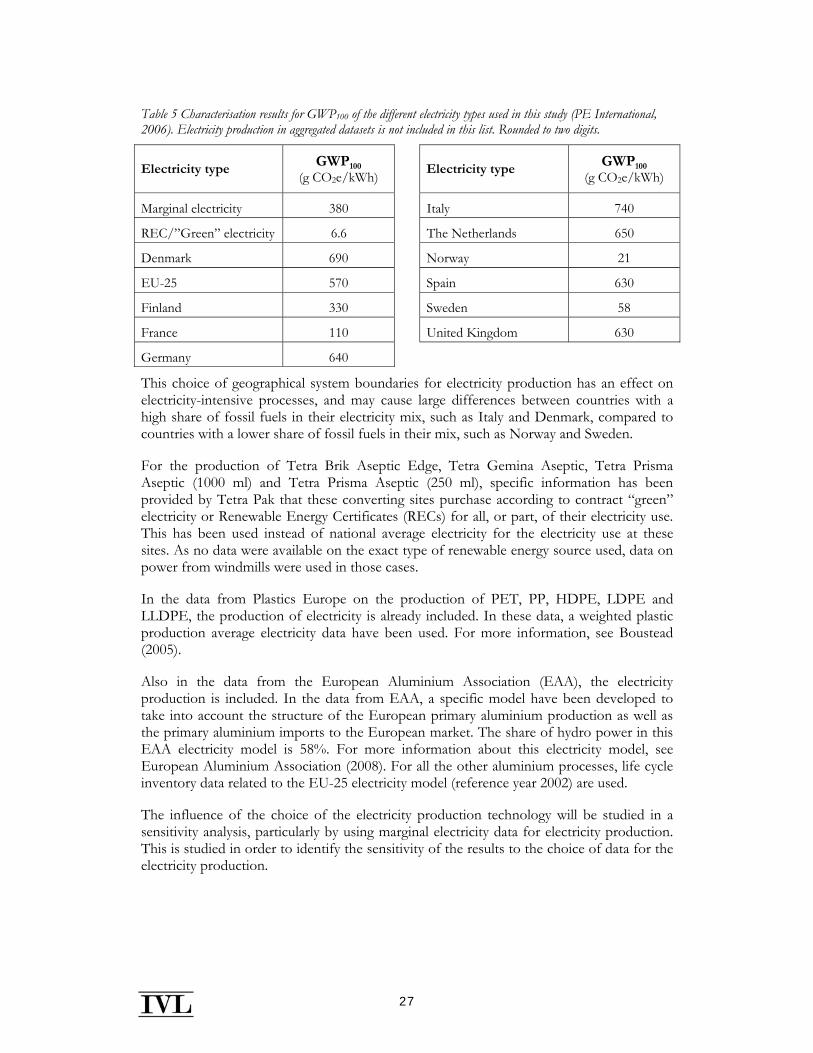
27
Table 5 Characterisation results for GWP100 of the different electricity types used in this study (PE International, 2006). Electricity production in aggregated datasets is not included in this list. Rounded to two digits.
Electricity type GWP100 (g CO2e/kWh)
Electricity type GWP100 (g CO2e/kWh)
Marginal electricity 380 Italy 740
REC/”Green” electricity 6.6 The Netherlands 650
Denmark 690 Norway 21
EU-25 570 Spain 630
Finland 330 Sweden 58
France 110 United Kingdom 630
Germany 640
This choice of geographical system boundaries for electricity production has an effect on electricity-intensive processes, and may cause large differences between countries with a high share of fossil fuels in their electricity mix, such as Italy and Denmark, compared to countries with a lower share of fossil fuels in their mix, such as Norway and Sweden.
For the production of Tetra Brik Aseptic Edge, Tetra Gemina Aseptic, Tetra Prisma Aseptic (1000 ml) and Tetra Prisma Aseptic (250 ml), specific information has been provided by Tetra Pak that these converting sites purchase according to contract “green” electricity or Renewable Energy Certificates (RECs) for all, or part, of their electricity use. This has been used instead of national average electricity for the electricity use at these sites. As no data were available on the exact type of renewable energy source used, data on power from windmills were used in those cases.
In the data from Plastics Europe on the production of PET, PP, HDPE, LDPE and LLDPE, the production of electricity is already included. In these data, a weighted plastic production average electricity data have been used. For more information, see Boustead (2005).
Also in the data from the European Aluminium Association (EAA), the electricity production is included. In the data from EAA, a specific model have been developed to take into account the structure of the European primary aluminium production as well as the primary aluminium imports to the European market. The share of hydro power in this EAA electricity model is 58%. For more information about this electricity model, see European Aluminium Association (2008). For all the other aluminium processes, life cycle inventory data related to the EU-25 electricity model (reference year 2002) are used.
The influence of the choice of the electricity production technology will be studied in a sensitivity analysis, particularly by using marginal electricity data for electricity production. This is studied in order to identify the sensitivity of the results to the choice of data for the electricity production.
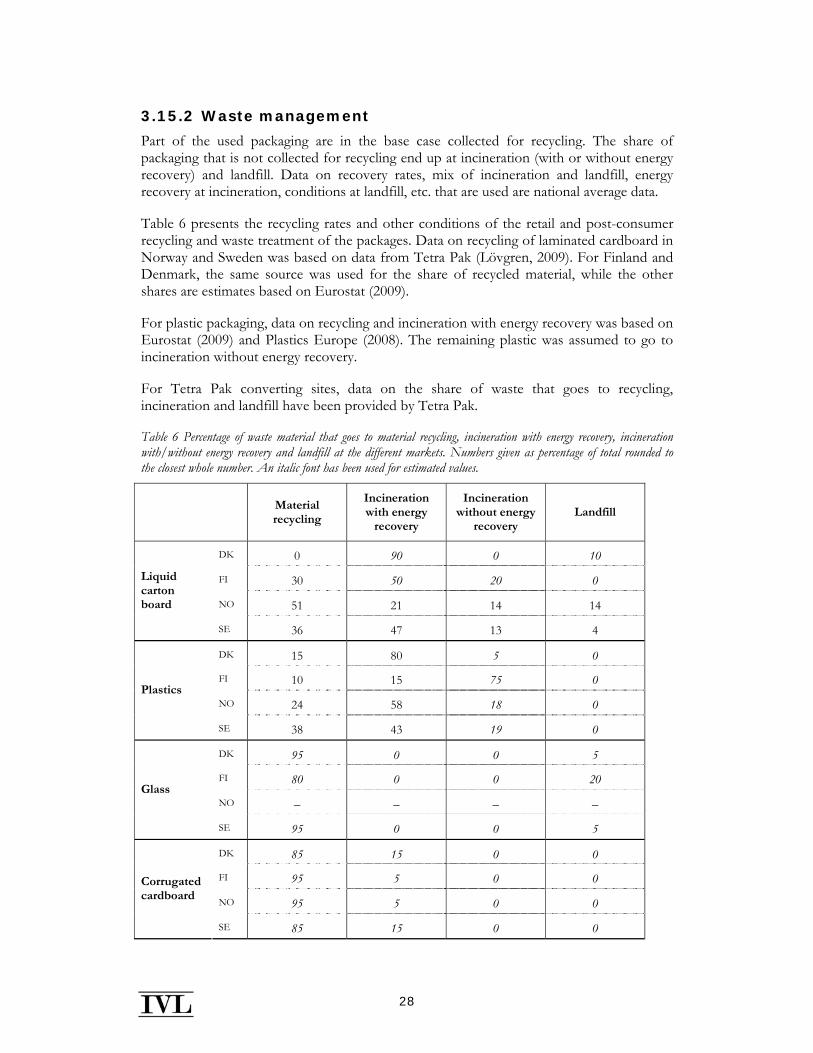
28
3.15.2 Waste management
Part of the used packaging are in the base case collected for recycling. The share of packaging that is not collected for recycling end up at incineration (with or without energy recovery) and landfill. Data on recovery rates, mix of incineration and landfill, energy recovery at incineration, conditions at landfill, etc. that are used are national average data.
Table 6 presents the recycling rates and other conditions of the retail and post-consumer recycling and waste treatment of the packages. Data on recycling of laminated cardboard in Norway and Sweden was based on data from Tetra Pak (Lövgren, 2009). For Finland and Denmark, the same source was used for the share of recycled material, while the other shares are estimates based on Eurostat (2009).
For plastic packaging, data on recycling and incineration with energy recovery was based on Eurostat (2009) and Plastics Europe (2008). The remaining plastic was assumed to go to incineration without energy recovery.
For Tetra Pak converting sites, data on the share of waste that goes to recycling, incineration and landfill have been provided by Tetra Pak.
Table 6 Percentage of waste material that goes to material recycling, incineration with energy recovery, incineration with/without energy recovery and landfill at the different markets. Numbers given as percentage of total rounded to the closest whole number. An italic font has been used for estimated values.
Material recycling
Incineration with energy
recovery
Incineration without energy
recovery Landfill
DK 0 90 0 10
FI 30 50 20 0
NO 51 21 14 14
Liquid carton board
SE 36 47 13 4
DK 15 80 5 0
FI 10 15 75 0
NO 24 58 18 0 Plastics
SE 38 43 19 0
DK 95 0 0 5
FI 80 0 0 20
NO – – – – Glass
SE 95 0 0 5
DK 85 15 0 0
FI 95 5 0 0
NO 95 5 0 0
Corrugated cardboard
SE 85 15 0 0
29
3.15.3 Incineration with energy recovery
Through the production of heat and electricity at waste incineration, other energy sources can be replaced. In this study, the heat and electricity produced at waste incineration are assumed to replace the same amount of heat and electricity from national average electricity and national average district heating. No reliable and/or complete life cycle inventory data has been found regarding Norwegian district heating, why it has been approximated by data on Swedish average district heating. This assumption is checked in the sensitivity analysis.
In Sweden, about 90% of the energy converted at waste incineration is utilised as district heat and the remaining 10% is electricity (AB Svensk Energiförsörjning, 2000). The same ratio has been assumed for Finland and Denmark, while a higher electricity output and lower heat output has been assumed for waste management in Norway to account for a smaller market for district heating.
It has been assumed that waste incineration at converting plants outside the Nordics give rise to only electricity (with a higher yield), and that this power replaces national average electricity.
3.15.4 Avoided material/products
Through recycling of used primary and secondary packaging, other materials and products can be replaced, see Section 3.11.1. In this study, the recycling of liquid carton board has been modelled as producing white line chipboard, which is assumed to replace a Tetra Brik type paperboard. Recycled plastics is assumed to replace plastic granulates and glass is assumed to replace glass for packaging.
3.15.5 Emission of greenhouse gases at landfill
Landfilling of plastics and paper gives raise to emissions of landfill gas, in which methane has an important impact on global warming potential. For landfills, a surveyable time corresponding to approximately 100 years has been chosen. Some of the formed methane is collected and used for energy conversion. The heat from incineration of the collected landfill gas is assumed to replace national average district heat.
According to Sundqvist et al (1999), 26 grams of methane is formed per kilogram of polyethylene landfilled during a surveyable time, here selected to be 100 years. Half of the methane formed is assumed to be collected for energy conversion, while 5% is of the methane is oxidised to carbon dioxide (CO2) before entering the atmosphere. Thus, the amount of methane released to the atmosphere is about 12 grams per kilogram of polyethylene or PET.
For cardboard, the amount of methane formed is 227 grams per kilogram of cardboard landfilled (Sundqvist et al, 1999). Half of the methane formed is assumed to be collected for energy conversion, while 5% is of the methane is oxidised to CO2 before entering the atmosphere. The amount of methane released to the atmosphere is thus 102 grams per kilogram of cardboard.
30
Non-decomposed cardboard at landfill after 100 years is treated like a non-elementary outflow from the product system. This assumption is checked in the sensitivity analysis.
3.15.6 Fillers
Different fillers have been used to model location and filling line data for the different packaging types in order to reflect actual conditions and transport distances on one selected market. When a package has been modelled for a different market than the given one, it has been assumed that the given data with another type of electricity mix is valid for that market as well.
The source for steam used at the filling site is unknown, and has thus assumed to be produced from natural gas for all sites and markets.
3.15.7 Transportation
The transportation data used in this study is based on both case-specific data, case-specific data assumed to be valid on several markets and pure assumptions; see Table 8. In the case of a completely unknown transport distance, as in the case of raw material transports for alternative packaging, a default value of 1,000 km was used. For transports by truck of unknown size and cargo capacity utilisation (CCU) a default truck with a payload of 22 tonnes and 70% (percentage by weight) CCU was used. This corresponds to a quite frequent shipment by a large truck (NTM, 2007). The default value of sulphur content in diesel (50 ppm) was changed to 10 ppm in order to better reflect current European fuel types (EEA, 2009).
For transport via train, an EU-25 default mix of diesel and electric train has been used; equal for all European countries. In the case of transport by electric train in an unknown European country, an average electricity mix for EU-25 has been used.
For transport of raw material to Tetra Pak converting sites, site-specific data on transport distance and type (truck or train) was provided by Tetra Pak. The transport distance from a Tetra Pak converting site to filler was estimated using Google Maps (2009), and assumed to be done by truck.
For transport of caps to filler, data on transport distances was provided by Tetra Pak for one specific customer at one specific market per package. This transport was assumed to be done by truck. When the scope of the study was expanded to all four markets for all packages, it was assumed that these distances remained constant for the same package at different markets.
The transport distance from filler to retail (“distribution”) has been assumed to be the same for all product categories. For a market in which there are few, but large fillers supplying the entire country with one product type, this assumption may not be valid. For Sweden, Finland and Norway, the transport distance from a filling site inside the country to the same market has been assumed to be 200 km, while the same distance has been assumed to be 100 km in Denmark due to shorter distances. Distribution distances to other markets were estimated using Google Maps (2009) ; see Table 7.
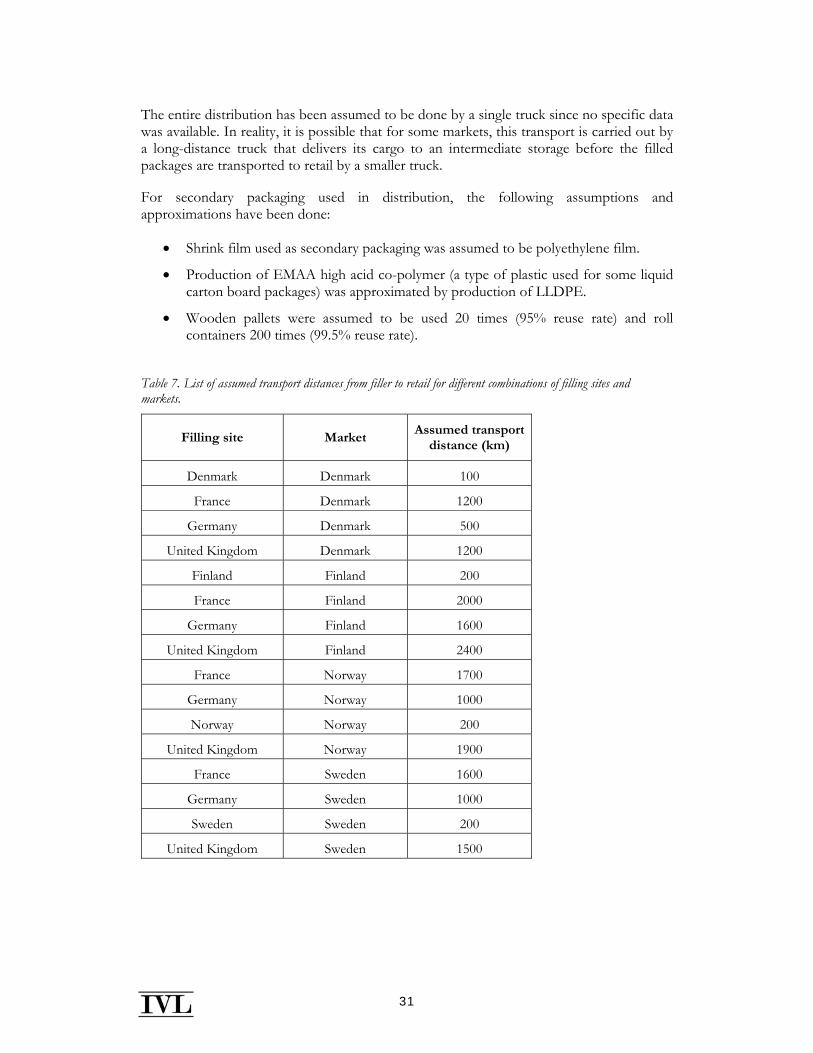
31
The entire distribution has been assumed to be done by a single truck since no specific data was available. In reality, it is possible that for some markets, this transport is carried out by a long-distance truck that delivers its cargo to an intermediate storage before the filled packages are transported to retail by a smaller truck.
For secondary packaging used in distribution, the following assumptions and approximations have been done:
• Shrink film used as secondary packaging was assumed to be polyethylene film.
• Production of EMAA high acid co-polymer (a type of plastic used for some liquid carton board packages) was approximated by production of LLDPE.
• Wooden pallets were assumed to be used 20 times (95% reuse rate) and roll containers 200 times (99.5% reuse rate).
Table 7. List of assumed transport distances from filler to retail for different combinations of filling sites and markets.
Filling site Market Assumed transport
distance (km)
Denmark Denmark 100
France Denmark 1200
Germany Denmark 500
United Kingdom Denmark 1200
Finland Finland 200
France Finland 2000
Germany Finland 1600
United Kingdom Finland 2400
France Norway 1700
Germany Norway 1000
Norway Norway 200
United Kingdom Norway 1900
France Sweden 1600
Germany Sweden 1000
Sweden Sweden 200
United Kingdom Sweden 1500
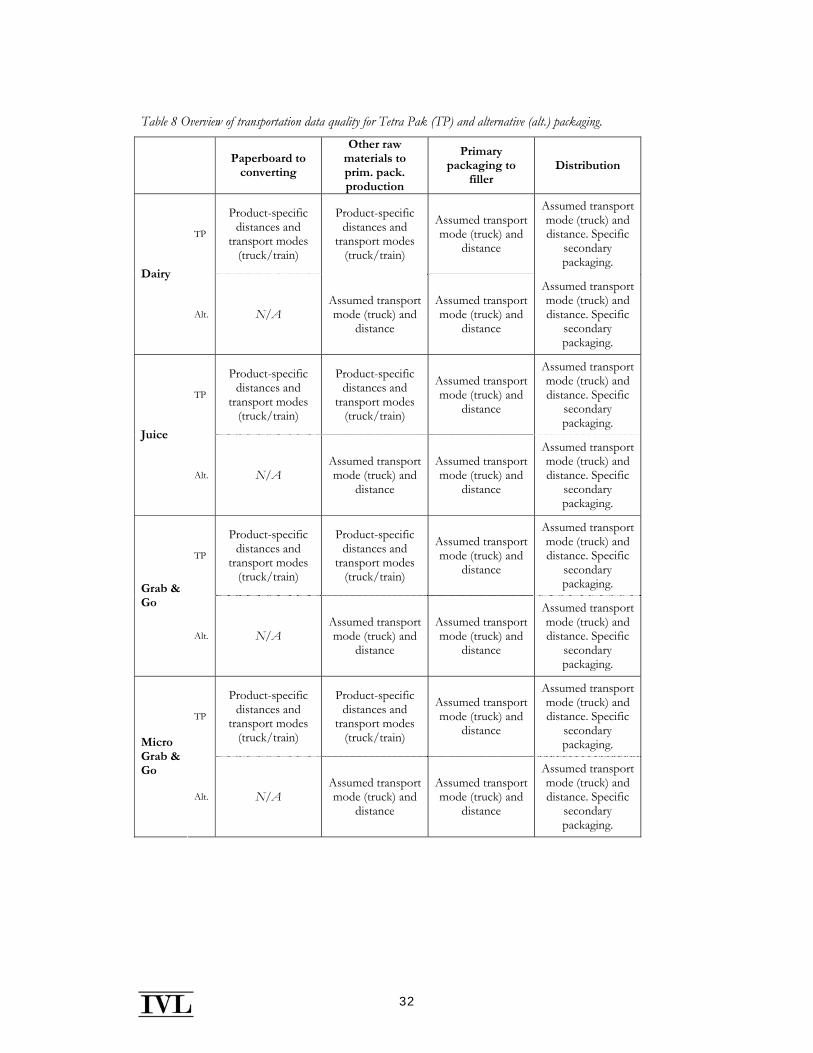
32
Table 8 Overview of transportation data quality for Tetra Pak (TP) and alternative (alt.) packaging.
Paperboard to converting
Other raw materials to prim. pack. production
Primary packaging to
filler Distribution
TP
Product-specific distances and
transport modes (truck/train)
Product-specific distances and
transport modes (truck/train)
Assumed transport mode (truck) and
distance
Assumed transport mode (truck) and distance. Specific
secondary packaging.
Dairy
Alt. N/A Assumed transport mode (truck) and
distance
Assumed transport mode (truck) and
distance
Assumed transport mode (truck) and distance. Specific
secondary packaging.
TP
Product-specific distances and
transport modes (truck/train)
Product-specific distances and
transport modes (truck/train)
Assumed transport mode (truck) and
distance
Assumed transport mode (truck) and distance. Specific
secondary packaging.
Juice
Alt. N/A Assumed transport mode (truck) and
distance
Assumed transport mode (truck) and
distance
Assumed transport mode (truck) and distance. Specific
secondary packaging.
TP
Product-specific distances and
transport modes (truck/train)
Product-specific distances and
transport modes (truck/train)
Assumed transport mode (truck) and
distance
Assumed transport mode (truck) and distance. Specific
secondary packaging. Grab &
Go
Alt. N/A Assumed transport mode (truck) and
distance
Assumed transport mode (truck) and
distance
Assumed transport mode (truck) and distance. Specific
secondary packaging.
TP
Product-specific distances and
transport modes (truck/train)
Product-specific distances and
transport modes (truck/train)
Assumed transport mode (truck) and
distance
Assumed transport mode (truck) and distance. Specific
secondary packaging. Micro
Grab & Go
Alt. N/A Assumed transport mode (truck) and
distance
Assumed transport mode (truck) and
distance
Assumed transport mode (truck) and distance. Specific
secondary packaging.
33
3.16 Selection of impact categories
The LCA method is especially suited for studying global and certain regional environmental impacts. The environmental impact categories included in this study are global warming, acidification, eutrophication, photochemical oxidant formation and stratospheric ozone depletion; see Table 9. These are chosen since there is consensus on the characterisation methods, and they are included in e.g. the international EPD (Environmental Product Declaration) system.
The characterisation factors used were CML2001, updated in August 2007, which were part of the GaBi 4 Professional Database (CML, 2009). The CML impact assessment method for global warming (100 years) was modified in order to exclude positive and negative contributions to global warming caused by biogenic flows of carbon dioxide (CO2.). This corresponds to a model of the biogenic carbon balance where the fixation of CO2 in growing forests and emissions due to incineration or digestion are set to zero (Guinée and Heijungs, 2009).
Table 9 List of environmental impact assessment categories used in this study.
Impact category Characterisation factor Unit2
Global warming GWP, 100 years (GWP100) g CO2 equivalents
Acidification AP mg SO2 equivalents
Eutrophication EP mg PO43- equivalents
Photochemical ozone formation POCP mg C2H4 equivalents
Stratospheric ozone depletion3 ODP, steady-state μg R11 equivalents
There is no consensus today how to describe ecotoxicity and human toxicity impacts in the LCA methodology. Since these impact categories also have not been the focus of the study, they have not been calculated in the impact assessment. Land use and loss of biodiversity has also been excluded due to time constraints and the focus of the study. The impact assessment methodology used in this study is further explained in Appendix A.
In addition to the characterisation results, the amount of primary energy used, divided into renewable and non-renewable, as well as the amount of water used has been calculated and presented as life cycle inventory results. The primary energy use is based on the gross calorific value of primary energy demand from non-renewable and renewable resources calculated from GaBi, and consists of the energy contained within the raw materials and inputs to the system.
The water use is based on life cycle inventory data and does not consider water scarcity/water stress. The data includes feed water, groundwater, river water, sea water, well water, water with river silt and unspecified water. The largest part in this study is 2 CO2: Carbon dioxide, SO2: Sulphur dioxide, PO43-: Phosphate, C2H4: Ethene, R11: Trichlorofluoromethane (sometimes referred to as CCl3F). 3 The categorisation results for stratospheric ozone depletion potential are presented separately in Appendix C.
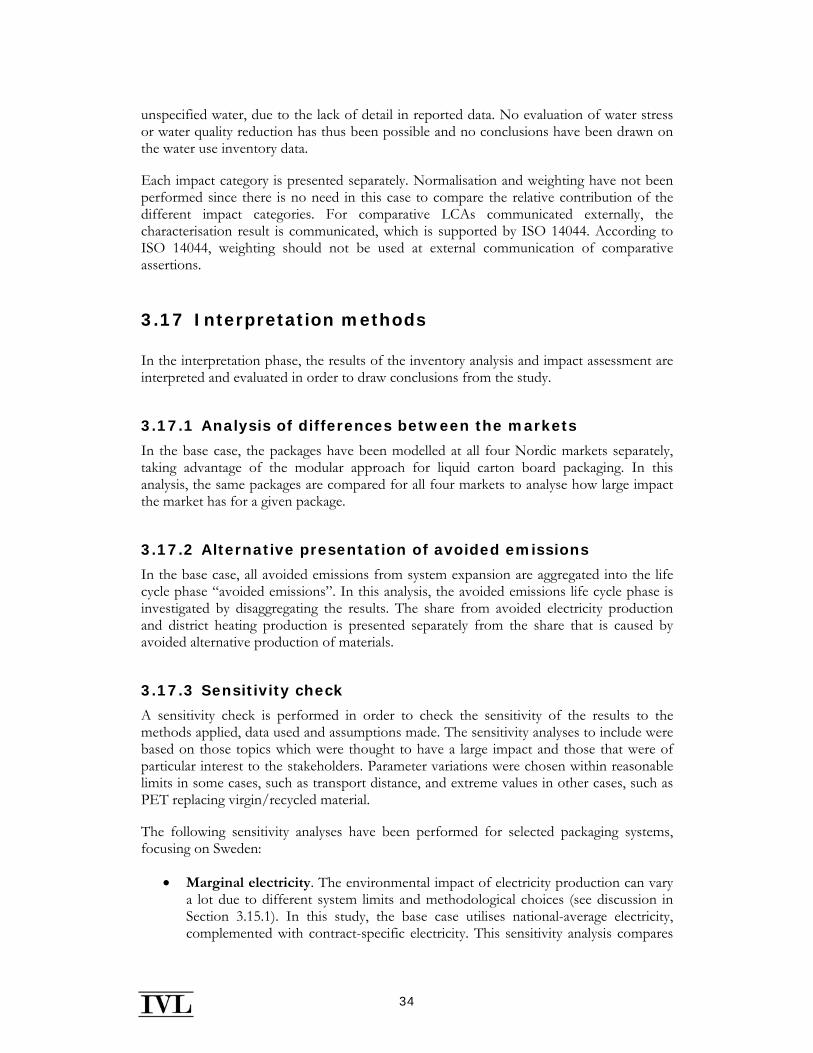
34
unspecified water, due to the lack of detail in reported data. No evaluation of water stress or water quality reduction has thus been possible and no conclusions have been drawn on the water use inventory data.
Each impact category is presented separately. Normalisation and weighting have not been performed since there is no need in this case to compare the relative contribution of the different impact categories. For comparative LCAs communicated externally, the characterisation result is communicated, which is supported by ISO 14044. According to ISO 14044, weighting should not be used at external communication of comparative assertions.
3.17 Interpretation methods
In the interpretation phase, the results of the inventory analysis and impact assessment are interpreted and evaluated in order to draw conclusions from the study.
3.17.1 Analysis of differences between the markets
In the base case, the packages have been modelled at all four Nordic markets separately, taking advantage of the modular approach for liquid carton board packaging. In this analysis, the same packages are compared for all four markets to analyse how large impact the market has for a given package.
3.17.2 Alternative presentation of avoided emissions
In the base case, all avoided emissions from system expansion are aggregated into the life cycle phase “avoided emissions”. In this analysis, the avoided emissions life cycle phase is investigated by disaggregating the results. The share from avoided electricity production and district heating production is presented separately from the share that is caused by avoided alternative production of materials.
3.17.3 Sensitivity check
A sensitivity check is performed in order to check the sensitivity of the results to the methods applied, data used and assumptions made. The sensitivity analyses to include were based on those topics which were thought to have a large impact and those that were of particular interest to the stakeholders. Parameter variations were chosen within reasonable limits in some cases, such as transport distance, and extreme values in other cases, such as PET replacing virgin/recycled material.
The following sensitivity analyses have been performed for selected packaging systems, focusing on Sweden:
• Marginal electricity. The environmental impact of electricity production can vary a lot due to different system limits and methodological choices (see discussion in Section 3.15.1). In this study, the base case utilises national-average electricity, complemented with contract-specific electricity. This sensitivity analysis compares
35
the impact on global warming potential when this electricity is replaced by so-called “marginal electricity”, which in this case was set as power from natural gas for all countries as this comprises a considerable share of the complex marginal electricity in the model calculations available (Mattsson et al., 2003). The replaced district heating remains unchanged, i.e. national average district heat production was used in both scenarios.
• Distribution distance. For most packaging systems, the transport of filled packaging from filler to retail (“distribution”) is a life cycle phase with a high relative impact, but also a life cycle phase that carries many uncertainties. In this sensitivity analysis, the estimated distribution distance is increased by 100 km for selected packaging systems. This corresponds to an increase in distance of 50% for filling locally in Sweden, Finland and Norway.
• PET replacing virgin/recycled material 100/0. In the base case, the PET granulates produced at recycling are assumed to replace 50% virgin material and 50% recycled material (see Section 3.11.1). In this sensitivity analysis, this assumption is checked by assuming that 100% virgin material is replaced for a 1-litre PET bottle in order to analyse what the maximum benefit would be for this system with an alternative methodology.
• Methane formation at landfill. In the base case model, 227 g of methane is formed per kg of paper/cardboard put at landfill, out of which half is captured and used as fuel (see Section 3.15.5). In this sensitivity analysis, it has been assumed that only half of this amount of methane is formed within the time boundary of the study.
• Delayed carbon emissions. In the base case, biogenic carbon dioxide has not been included, and at landfill, non-degraded cardboard after 100 years has been treated like a non-elementary output from the system. An alternative model is to assume that the carbon stored in the cardboard cause a net uptake of carbon, or “delayed emissions” across the time boundary of the system. In this sensitivity analysis, a carbon content of 50% of the board has been assumed to calculate what difference this assumption would have on the total result.
• Transport from retail to consumer. The base case excludes the environmental impact of the consumer. In this sensitivity analysis, an approximation of the environmental impact from the short transport from retail to consumer is included to give an indication of how this change in system boundaries would affect the total results. As in the case with transport to retail, the weight of the beverage is included and used when allocating the environmental impact to the packaging system.
• Norwegian district heating approximation. In the base case, replaced district heating in Norway was assumed to be production of national-average Swedish district heat (about 120 g CO2e/kWh) due to uncertain data in the Norwegian case. This sensitivity analysis compares this base case with a system where production of Norwegian district heat has been approximated (especially the share from waste incineration) with high emissions (250 g CO2e/kWh). The fuel mix used is from SSB (2009).
• Tetra Top with smaller cap. In the base case, a Tetra Top with a cap weighing 3.3 g has been modelled. One possible improvement of this package is to reduce
36
the weight to 3.1 g. As such a comparison is interesting internally and for stakeholders, this sensitivity analysis compares the global warming impact of Tetra Top with two different caps.
• Ambient versus chilled. In the base case, the packages have been modelled without regard to differences between handling of ambient and chilled milk, and the results are thus not directly comparable. As such a comparison would be highly interesting a first attempt has been made to include refrigeration of chilled packaging and extra heating of ambient packaging. This gives an indicative result of the difference between the different packaging types, and is presented as a break-even analysis depending of number of days of chilling at retail.
3.17.4 Completeness check
In the completeness check, the data gaps of the study are analysed in order to verify that the total results, and thus the conclusions of the study, would not change significantly because of them.
The data gaps are investigated one by one by assuming an extreme case of emissions associated with each data gap. The impact on the total result in GWP100 is then analysed, and conclusions drawn on the impact of the missing data.
3.17.5 Consistency check
A consistency check is performed in order to check that data from different parts of the study are consistent with the other parts. This is done as a qualitative analysis where exceptions to the general rule for system boundaries, allocation rules, data quality, impact assessment, etc., are listed and analysed.
3.18 Critical review procedure
A critical review panel consisting of Tiina Pajula and Catharina Hohenthal at KCL/VTT, Finland and Andreas Brekke and Erik Svanes at Ostfold Research, Norway has performed a critical review of this report in order to ensure that the following criteria are met (ISO, 2006):
• The methods used to carry out the LCA are consistent with the ISO 14044:2006 standard.
• The methods used to carry out the LCA are scientifically and technically valid.
• The data used are appropriate and reasonable in relation to the goal of the study.
• The interpretations reflect the limitations identified and the goal of the study.
• The study report is transparent and consistent.
A request to the critical review panel has been to check the assumptions and methodologies applied, so that the comparisons between liquid carton board and alternative packaging are fair and consistent.
37
4 Inventory analysis
This section describes the data collection and calculations that have been done for the study, as well as presents aggregated results of the inventory analysis in the form of primary energy demand and water use.
4.1 Data collection and calculation procedure
In all LCAs, data collection is restricted by the specific limitations of the project. In this study, a large amount of data was collected by Tetra Pak, and subsequently interpreted and imported to GaBi 4 Professional by IVL Swedish Environmental Research Institute. Some data were collected from previous LCA studies performed by CIT Ekologik and IVL Swedish Environmental Research Institute (Ringström et al, 2003; Ringström and Fröling, 2003).
The inventory results as well as the environmental impact assessment were calculated in the LCA software GaBi 4 Professional.
4.2 Packaging specifications
The packaging specifications of Tetra Pak packages were provided by Tetra Pak, based on specific product codes, in the form of area of laminated cardboard and material use (paperboard, aluminium foil, ink, LDPE and other types of plastics) per unit of area and use of plastics for cap and top. The production site of liquid packaging board and converting site used for each package was also provided. (Wallén, 2009)
The material specifications for alternative packaging were provided by Tetra Pak., based on existing or possible future products. The weights of all plastic and glass Grab & Go packaging based on existing products were verified by IVL Swedish Environmental Research Institute by measuring the weight of a product sample purchased at retail. The “Gable Top with extra large cap” is based on a Tetra Rex package, but with a larger cap.
Tetra Pak provided data on secondary packaging for the different packages, which included roll containers, wooden pallets, wrap around of corrugated cardboard and shrink film. No data was available for the glass bottle, and thus the same amount of secondary packaging per functional unit as the HDPE bottle (380 ml) was assumed.
4.3 Production of liquid packaging board
Package-specific process data on ten combinations of production sites and liquid packaging board types were provided by the suppliers of Tetra Pak. The data was for four different sites with 2007 as the baseline year. The data covered the in- and outflows to the pulp and
38
carton production as aggregated cradle-to-gate or gate-to-gate data. In the latter data, the inputs were listed as wood, pulp, chemicals (specified), water and energy carriers. For some mills, the emissions from forestry were already included in the data set as nation-specific forestry. For the other mills, the fuel use and emissions related to forestry operations and transport of wood to the mill were added from Berg and Lindholm (2005).
The amounts of co-products from liquid packaging board production were typically small, why no allocation was made between them and the board. In some cases, there was an output of heat for district heating, which was handled with system expansion (see Section 3.10.5), but aggregated into the “forestry and paperboard” life cycle phase in the presentation of results.
No secondary or tertiary packaging was included in the transport of liquid packaging board to the converting sites.
4.4 Production of plastics and metal
Data on raw materials for alternative packaging, upstream data for primary and secondary packaging and alternative packaging converting processes have been used from literature data (see Section 3).
Most packages has been modelled as being produced from 100% virgin materials. The exception is PET 250 ml, where the bottle consists of 100% recycled content. A system expansion has thus been performed for the production of PET granulates from recycled material. For aluminium, only virgin material production data has been used.
No secondary or tertiary packaging was included in the transport of raw materials to primary packaging production.
4.5 Primary packaging production
Data on Tetra Pak package production processes (“converting”) were collected internally by Tetra Pak, and covers gate-to-gate data on energy, water and fuel use for the entire site as well as product and waste outputs. The data includes infrastructure, extrusion, lamination, printing, cutting, packing, etc. Both data for 2007 and average data for 2005–2007 were provided by Tetra Pak. No clear indication could be seen that the 2007 data had a steady increase of decrease in environmental performance, why the average data was chosen to compensate for possible year-to-year fluctuations.
Data was also provided on the share of waste from the site that goes to recycling, incineration with energy recovery and landfill. (Lövgren, 2009) It was assumed that this waste was made up of the same share of cardboard, plastics and metal as the output packaging, and that the waste management system was the country-specific system. Due to large uncertainties, no transports were included in the waste management of waste generated at the converting sites.
39
Data was provided on which converting sites purchase either green electricity or a share of Renewable Energy Certificates (RECs) for their electricity consumption. In the modelling of these sites, electricity from renewable sources was used instead of national average electricity. As no data was available on the exact type of renewable energy source used, power from windmills was used in those cases.
For plastic packaging, data from Plastics Europe was used for the production of plastics. Electricity use for blow moulding was provided by Tetra Pak. This data was used in favour of aggregated bottle production data from Plastics Europe to have the possibility to change the electricity mix. The electricity use from blow moulding was verified by adding average European electricity and comparing the result to that of plastic bottle production.
For PET bottles, it was assumed that preforms enter the filling line, and thus the electricity use for extrusion blow moulding is included in the filling data. For HDPE bottles, it was assumed that granulates go into filling.
For glass packaging, aggregated data on glass melting and bottle production from the LCA of packaging for beer and soft drinks (Ekvall et al, 1998) are used since no more recent public could be found.
4.6 Filler
Data on electricity, steam, peroxide and water use at the filler was provided by Tetra Pak for all packaging systems, and was based on the filling line specifications and the detailed scenarios on use that are normally used for internal cost estimates. This data set includes the whole filling line, such as conveyor belts and palletisers, and was thus not limited to electricity use for the filling machine.
In the given data for PET bottles, the filling line takes PET preforms as an input, and blow moulding is carried out inside the filling line. For HDPE bottles, plastic granulates enter the filling line, which gives a higher electricity use at the filler site.
4.7 Transport
For transport to the Tetra Pak converting sites, the transport distances and transport mode (truck and/or train) were provided by Tetra Pak. Some upstream transports were included in aggregated database and literature data.
4.8 Waste management
The shares of laminated cardboard that goes to recycling, incineration with energy recovery and other waste management on the different Nordics markets were collected both by Tetra Pak, and by IVL, where IVL decided which source to use in the end; see Section 3.15.2.
40
Data on the recycling process of laminated cardboard were based on a previous LCA study for Tetra Pak, and adjusted to account for the different plastic contents of different packaging (Ringström et al, 2003; Ringström and Fröling, 2003). Rejects were assumed to be incinerated with energy recovery.
Data on fuel use for the recycling process of PET and PE were collected from Arena et al. (2003). The fuel use was allocated based on mass between the produced PET and PE.
4.9 Inventory results
Selected inventory results (primary energy demand and fresh water use) on the Swedish market are presented in Appendix B, divided into the four product categories. Primary energy use is reported for all product categories, while fresh water use has been limited to dairy packaging.
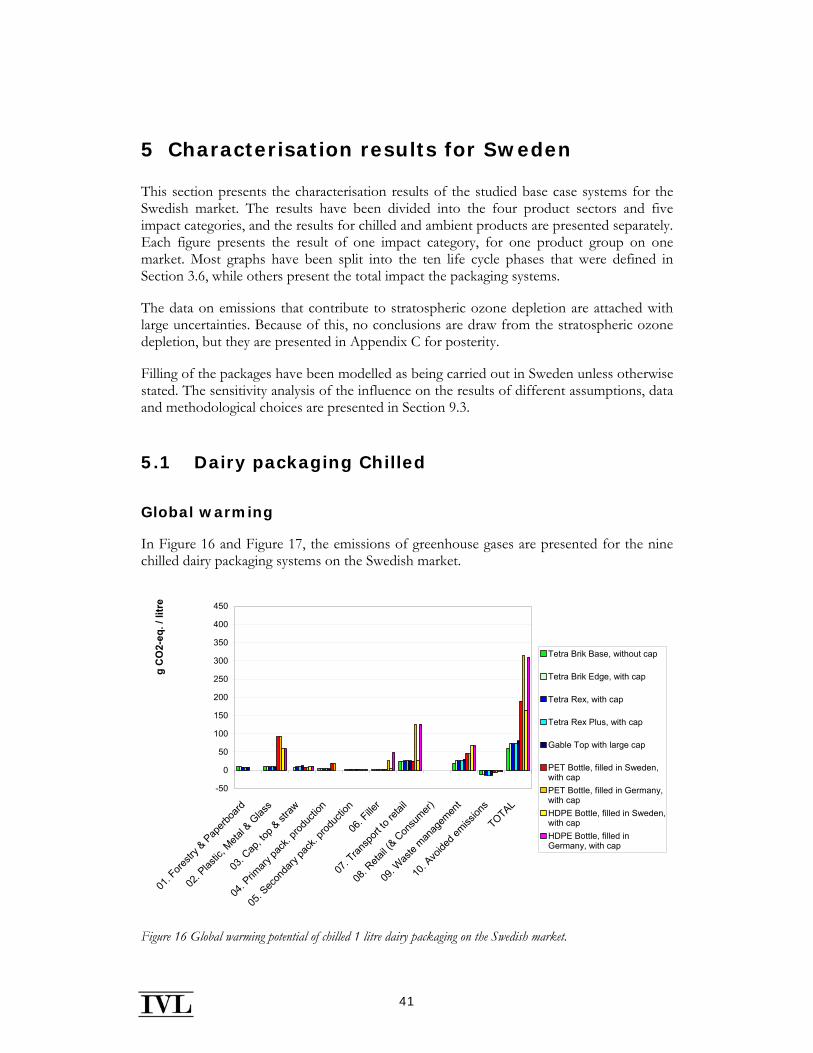
41
5 Characterisation results for Sweden
This section presents the characterisation results of the studied base case systems for the Swedish market. The results have been divided into the four product sectors and five impact categories, and the results for chilled and ambient products are presented separately. Each figure presents the result of one impact category, for one product group on one market. Most graphs have been split into the ten life cycle phases that were defined in Section 3.6, while others present the total impact the packaging systems.
The data on emissions that contribute to stratospheric ozone depletion are attached with large uncertainties. Because of this, no conclusions are draw from the stratospheric ozone depletion, but they are presented in Appendix C for posterity.
Filling of the packages have been modelled as being carried out in Sweden unless otherwise stated. The sensitivity analysis of the influence on the results of different assumptions, data and methodological choices are presented in Section 9.3.
5.1 Dairy packaging Chilled
Global warming
In Figure 16 and Figure 17, the emissions of greenhouse gases are presented for the nine chilled dairy packaging systems on the Swedish market.
-50
0
50
100
150
200
250
300
350
400
450
01. F
orestr
y & Pap
erboa
rd
02. P
lastic
, Meta
l & G
lass
03. C
ap, to
p & st
raw
04. P
rimary
pack
. prod
uctio
n
05. S
econ
dary
pack
. prod
uctio
n
06. F
iller
07. T
ransp
ort to
retai
l
08. R
etail (
& Con
sumer)
09. W
aste
manag
emen
t
10. A
voide
d emiss
ions
TOTAL
g C
O2-
eq. /
litr
e
Tetra Brik Base, without cap
Tetra Brik Edge, with cap
Tetra Rex, with cap
Tetra Rex Plus, with cap
Gable Top with large cap
PET Bottle, filled in Sweden,with capPET Bottle, filled in Germany,with capHDPE Bottle, filled in Sweden,with capHDPE Bottle, filled inGermany, with cap
Figure 16 Global warming potential of chilled 1 litre dairy packaging on the Swedish market.
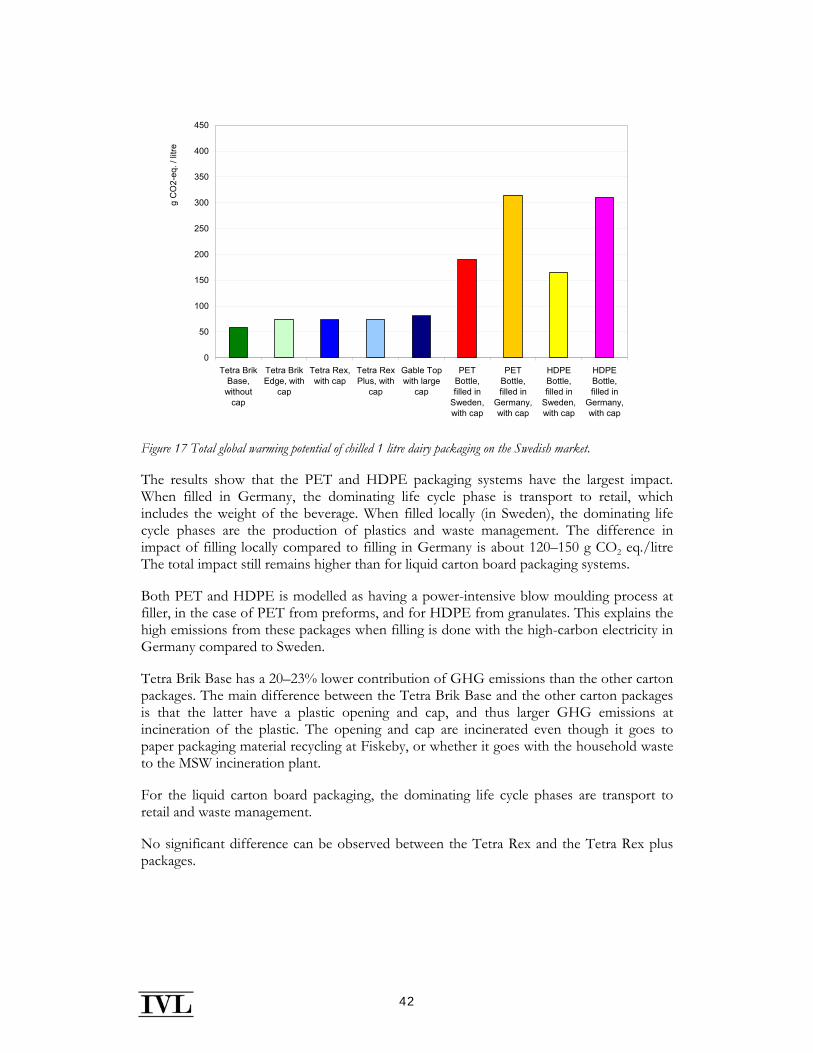
42
0
50
100
150
200
250
300
350
400
450
Tetra BrikBase,
withoutcap
Tetra BrikEdge, with
cap
Tetra Rex,with cap
Tetra RexPlus, with
cap
Gable Topwith large
cap
PETBottle,filled in
Sweden,with cap
PETBottle,filled in
Germany,with cap
HDPEBottle,filled in
Sweden,with cap
HDPEBottle,filled in
Germany,with cap
g C
O2-
eq. /
litre
Figure 17 Total global warming potential of chilled 1 litre dairy packaging on the Swedish market.
The results show that the PET and HDPE packaging systems have the largest impact. When filled in Germany, the dominating life cycle phase is transport to retail, which includes the weight of the beverage. When filled locally (in Sweden), the dominating life cycle phases are the production of plastics and waste management. The difference in impact of filling locally compared to filling in Germany is about 120–150 g CO2 eq./litre The total impact still remains higher than for liquid carton board packaging systems.
Both PET and HDPE is modelled as having a power-intensive blow moulding process at filler, in the case of PET from preforms, and for HDPE from granulates. This explains the high emissions from these packages when filling is done with the high-carbon electricity in Germany compared to Sweden.
Tetra Brik Base has a 20–23% lower contribution of GHG emissions than the other carton packages. The main difference between the Tetra Brik Base and the other carton packages is that the latter have a plastic opening and cap, and thus larger GHG emissions at incineration of the plastic. The opening and cap are incinerated even though it goes to paper packaging material recycling at Fiskeby, or whether it goes with the household waste to the MSW incineration plant.
For the liquid carton board packaging, the dominating life cycle phases are transport to retail and waste management.
No significant difference can be observed between the Tetra Rex and the Tetra Rex plus packages.
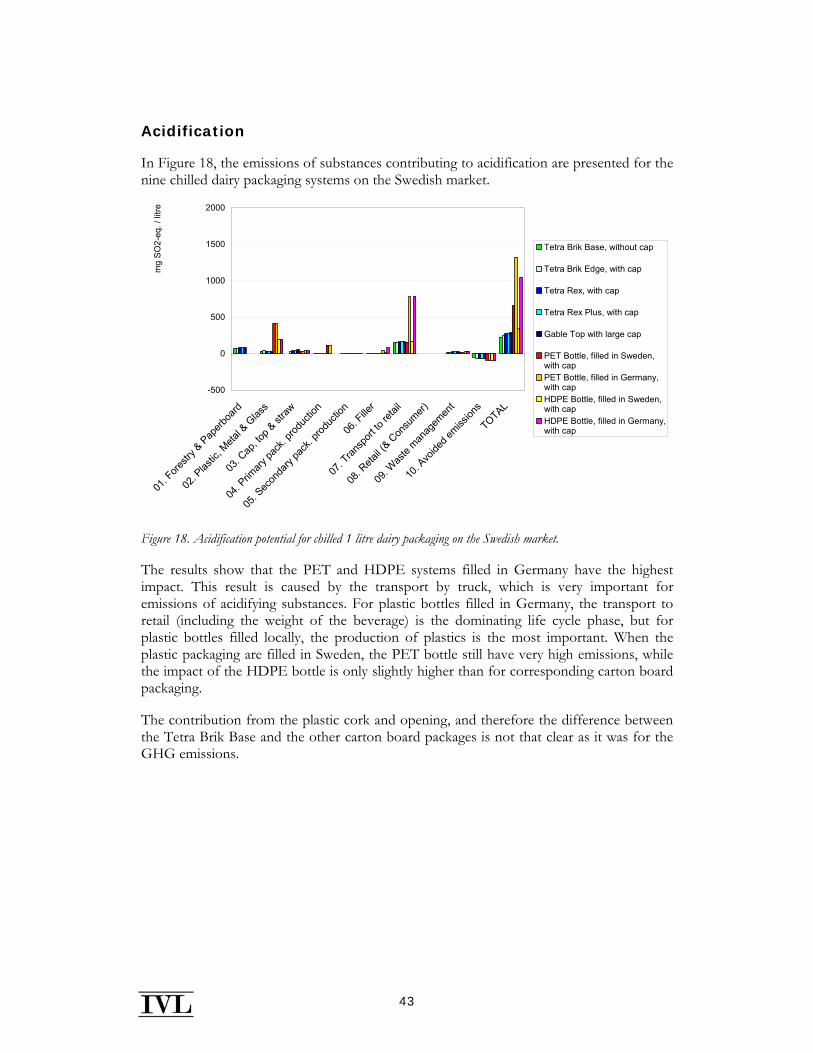
43
Acidification
In Figure 18, the emissions of substances contributing to acidification are presented for the nine chilled dairy packaging systems on the Swedish market.
-500
0
500
1000
1500
2000
01. F
orestr
y & Pap
erboa
rd
02. P
lastic
, Meta
l & G
lass
03. C
ap, to
p & st
raw
04. P
rimary
pack
. prod
uctio
n
05. S
econ
dary
pack
. prod
uctio
n
06. F
iller
07. T
ransp
ort to
retai
l
08. R
etail (
& Con
sumer)
09. W
aste
manag
emen
t
10. A
voide
d emiss
ions
TOTAL
mg
SO
2-eq
. / li
tre
Tetra Brik Base, without cap
Tetra Brik Edge, with cap
Tetra Rex, with cap
Tetra Rex Plus, with cap
Gable Top with large cap
PET Bottle, filled in Sweden,with capPET Bottle, filled in Germany,with capHDPE Bottle, filled in Sweden,with capHDPE Bottle, filled in Germany,with cap
Figure 18. Acidification potential for chilled 1 litre dairy packaging on the Swedish market.
The results show that the PET and HDPE systems filled in Germany have the highest impact. This result is caused by the transport by truck, which is very important for emissions of acidifying substances. For plastic bottles filled in Germany, the transport to retail (including the weight of the beverage) is the dominating life cycle phase, but for plastic bottles filled locally, the production of plastics is the most important. When the plastic packaging are filled in Sweden, the PET bottle still have very high emissions, while the impact of the HDPE bottle is only slightly higher than for corresponding carton board packaging.
The contribution from the plastic cork and opening, and therefore the difference between the Tetra Brik Base and the other carton board packages is not that clear as it was for the GHG emissions.
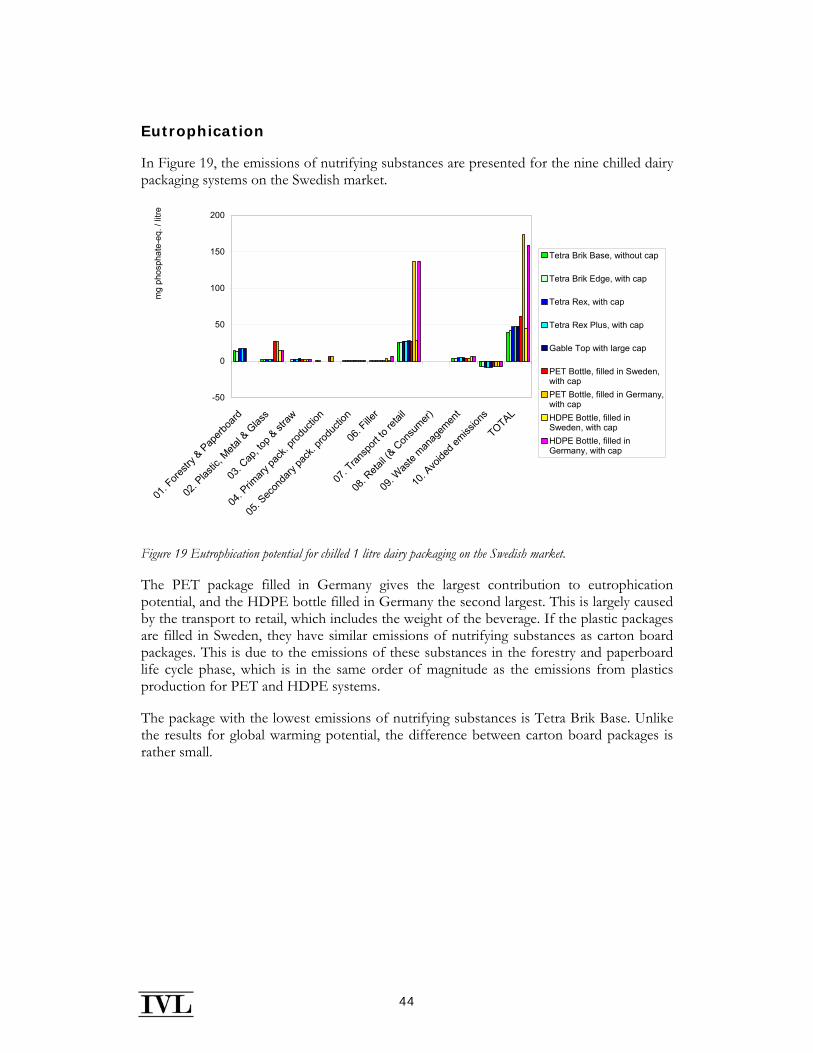
44
Eutrophication
In Figure 19, the emissions of nutrifying substances are presented for the nine chilled dairy packaging systems on the Swedish market.
-50
0
50
100
150
200
01. F
orestr
y & Pap
erboa
rd
02. P
lastic
, Meta
l & G
lass
03. C
ap, to
p & st
raw
04. P
rimary
pack
. prod
uctio
n
05. S
econ
dary
pack
. prod
uctio
n
06. F
iller
07. T
ransp
ort to
retai
l
08. R
etail (
& Con
sumer)
09. W
aste
manag
emen
t
10. A
voide
d emiss
ions
TOTAL
mg
phos
phat
e-eq
. / li
tre
Tetra Brik Base, without cap
Tetra Brik Edge, with cap
Tetra Rex, with cap
Tetra Rex Plus, with cap
Gable Top with large cap
PET Bottle, filled in Sweden,with capPET Bottle, filled in Germany,with capHDPE Bottle, filled inSweden, with capHDPE Bottle, filled inGermany, with cap
Figure 19 Eutrophication potential for chilled 1 litre dairy packaging on the Swedish market.
The PET package filled in Germany gives the largest contribution to eutrophication potential, and the HDPE bottle filled in Germany the second largest. This is largely caused by the transport to retail, which includes the weight of the beverage. If the plastic packages are filled in Sweden, they have similar emissions of nutrifying substances as carton board packages. This is due to the emissions of these substances in the forestry and paperboard life cycle phase, which is in the same order of magnitude as the emissions from plastics production for PET and HDPE systems.
The package with the lowest emissions of nutrifying substances is Tetra Brik Base. Unlike the results for global warming potential, the difference between carton board packages is rather small.
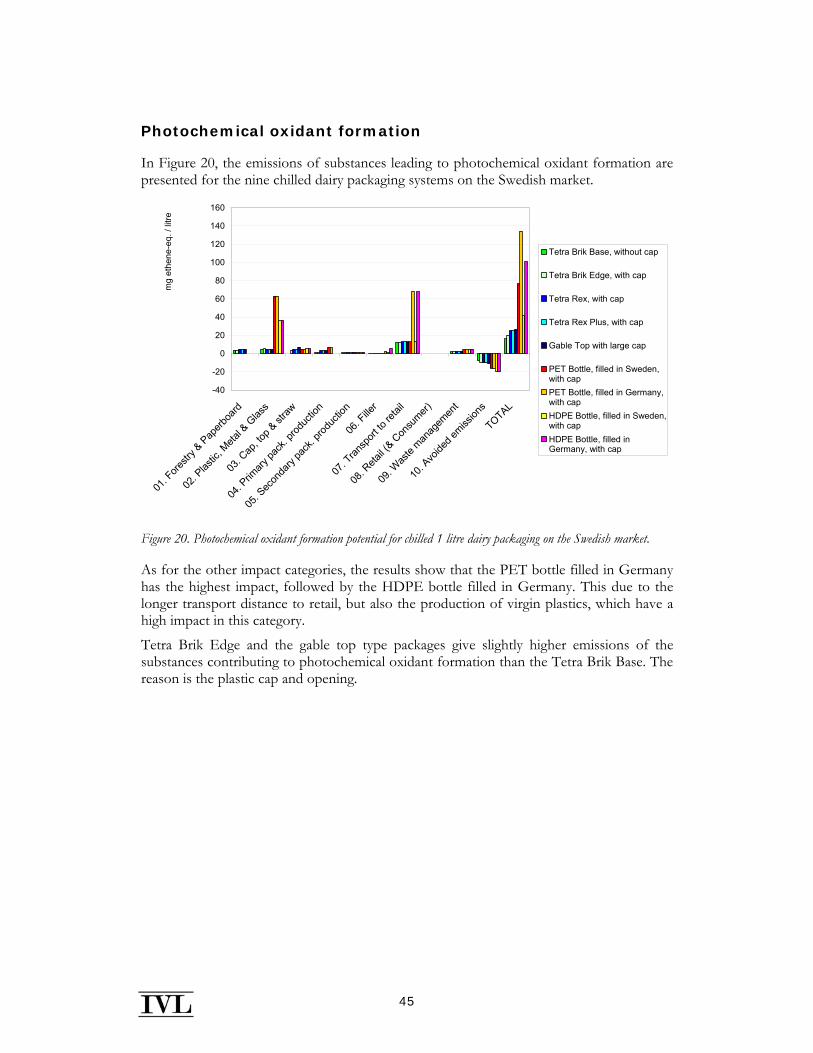
45
Photochemical oxidant formation
In Figure 20, the emissions of substances leading to photochemical oxidant formation are presented for the nine chilled dairy packaging systems on the Swedish market.
-40
-20
0
20
40
60
80
100
120
140
160
01. F
orestr
y & Pap
erboa
rd
02. P
lastic
, Meta
l & G
lass
03. C
ap, to
p & st
raw
04. P
rimary
pack
. prod
uctio
n
05. S
econ
dary
pack
. prod
uctio
n
06. F
iller
07. T
ransp
ort to
retai
l
08. R
etail (
& Con
sumer)
09. W
aste
manag
emen
t
10. A
voide
d emiss
ions
TOTAL
mg
ethe
ne-e
q. /
litre
Tetra Brik Base, without cap
Tetra Brik Edge, with cap
Tetra Rex, with cap
Tetra Rex Plus, with cap
Gable Top with large cap
PET Bottle, filled in Sweden,with capPET Bottle, filled in Germany,with capHDPE Bottle, filled in Sweden,with capHDPE Bottle, filled inGermany, with cap
Figure 20. Photochemical oxidant formation potential for chilled 1 litre dairy packaging on the Swedish market.
As for the other impact categories, the results show that the PET bottle filled in Germany has the highest impact, followed by the HDPE bottle filled in Germany. This due to the longer transport distance to retail, but also the production of virgin plastics, which have a high impact in this category.
Tetra Brik Edge and the gable top type packages give slightly higher emissions of the substances contributing to photochemical oxidant formation than the Tetra Brik Base. The reason is the plastic cap and opening.
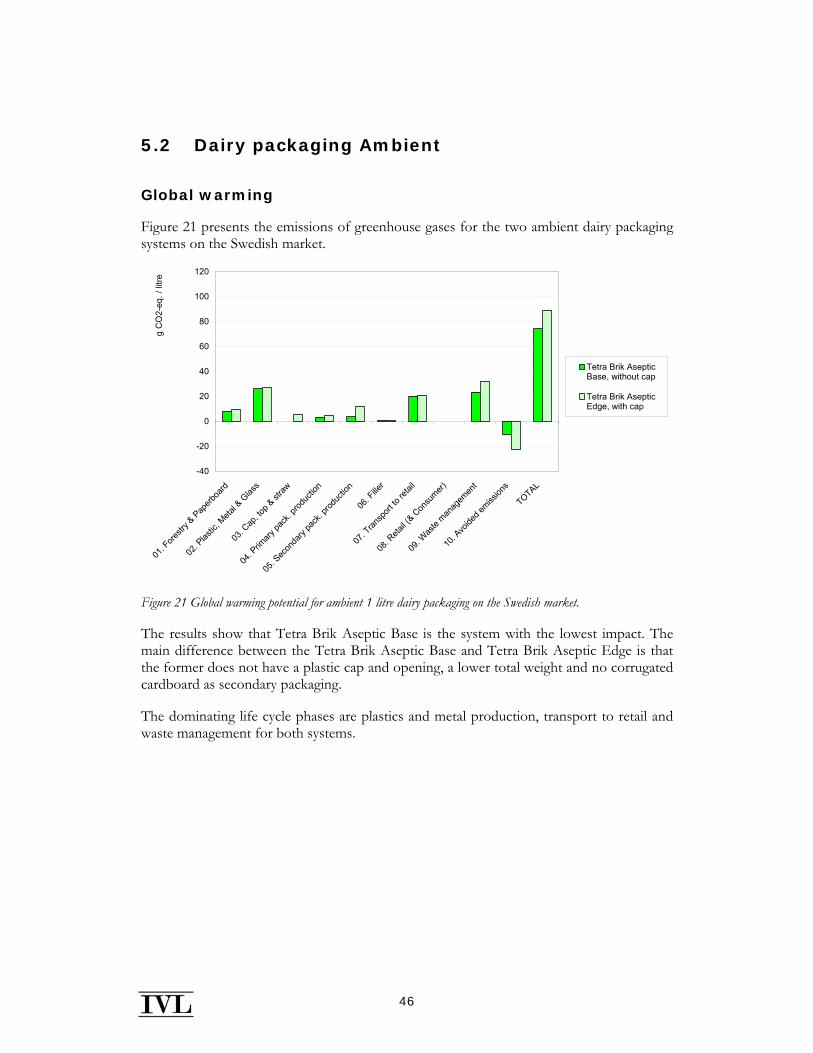
46
5.2 Dairy packaging Ambient
Global warming
Figure 21 presents the emissions of greenhouse gases for the two ambient dairy packaging systems on the Swedish market.
-40
-20
0
20
40
60
80
100
120
01. F
orestr
y & P
aperb
oard
02. P
lastic
, Meta
l & G
lass
03. C
ap, to
p & st
raw
04. P
rimary
pack
. prod
uctio
n
05. S
econ
dary
pack
. prod
uctio
n
06. F
iller
07. T
ransp
ort to
retai
l
08. R
etail (
& Con
sumer)
09. W
aste
manag
emen
t
10. A
voide
d emiss
ions
TOTAL
g C
O2-
eq. /
litre
Tetra Brik AsepticBase, without cap
Tetra Brik AsepticEdge, with cap
Figure 21 Global warming potential for ambient 1 litre dairy packaging on the Swedish market.
The results show that Tetra Brik Aseptic Base is the system with the lowest impact. The main difference between the Tetra Brik Aseptic Base and Tetra Brik Aseptic Edge is that the former does not have a plastic cap and opening, a lower total weight and no corrugated cardboard as secondary packaging.
The dominating life cycle phases are plastics and metal production, transport to retail and waste management for both systems.
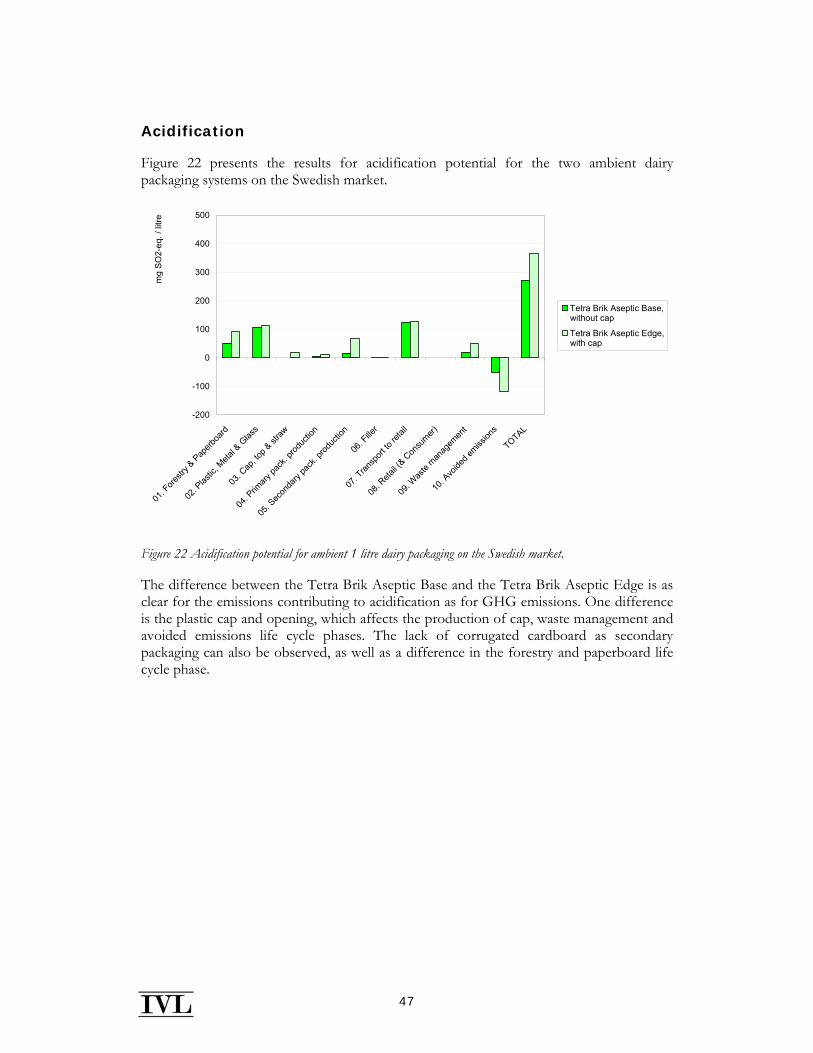
47
Acidification
Figure 22 presents the results for acidification potential for the two ambient dairy packaging systems on the Swedish market.
-200
-100
0
100
200
300
400
500
01. F
orestr
y & P
aperb
oard
02. P
lastic
, Meta
l & G
lass
03. C
ap, to
p & st
raw
04. P
rimary
pack
. prod
uctio
n
05. S
econ
dary
pack
. prod
uctio
n
06. F
iller
07. T
ransp
ort to
retai
l
08. R
etail (
& Con
sumer)
09. W
aste
manag
emen
t
10. A
voide
d emiss
ions
TOTAL
mg
SO
2-eq
. / li
tre
Tetra Brik Aseptic Base,without cap
Tetra Brik Aseptic Edge,with cap
Figure 22 Acidification potential for ambient 1 litre dairy packaging on the Swedish market.
The difference between the Tetra Brik Aseptic Base and the Tetra Brik Aseptic Edge is as clear for the emissions contributing to acidification as for GHG emissions. One difference is the plastic cap and opening, which affects the production of cap, waste management and avoided emissions life cycle phases. The lack of corrugated cardboard as secondary packaging can also be observed, as well as a difference in the forestry and paperboard life cycle phase.
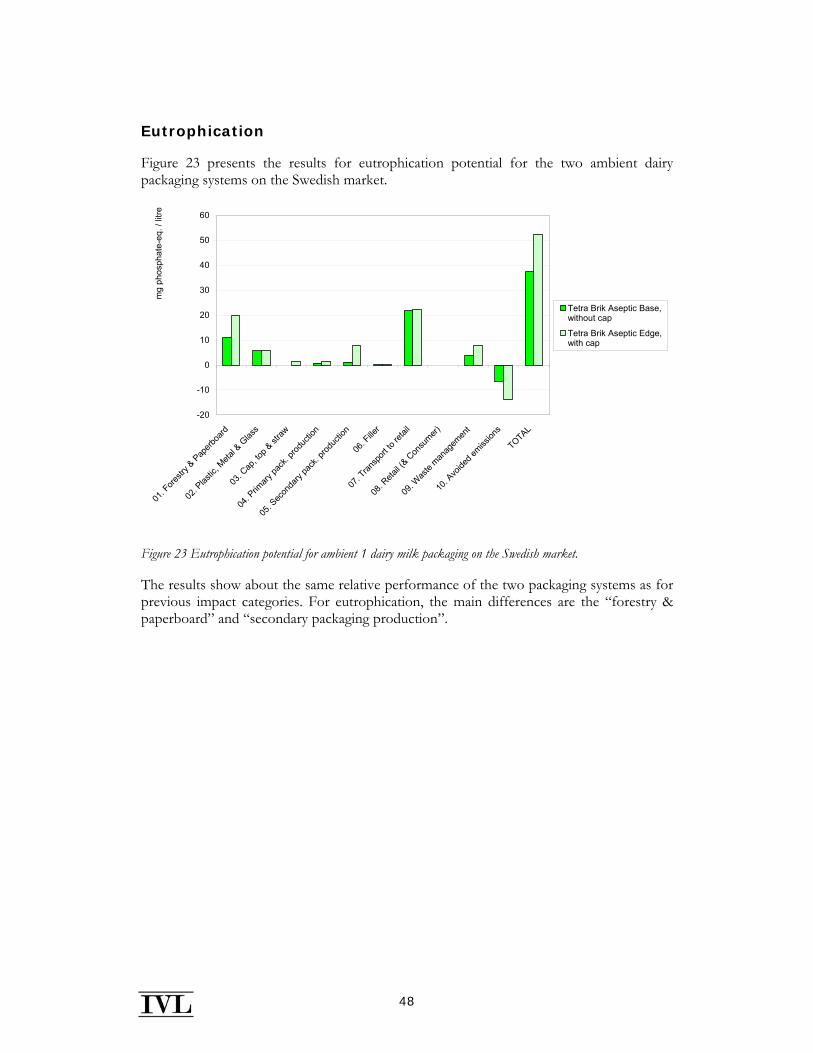
48
Eutrophication
Figure 23 presents the results for eutrophication potential for the two ambient dairy packaging systems on the Swedish market.
-20
-10
0
10
20
30
40
50
60
01. F
orestr
y & P
aperb
oard
02. P
lastic
, Meta
l & G
lass
03. C
ap, to
p & st
raw
04. P
rimary
pack
. prod
uctio
n
05. S
econ
dary
pack
. prod
uctio
n
06. F
iller
07. T
ransp
ort to
retai
l
08. R
etail (
& Con
sumer)
09. W
aste
manag
emen
t
10. A
voide
d emiss
ions
TOTAL
mg
phos
phat
e-eq
. / li
tre
Tetra Brik Aseptic Base,without cap
Tetra Brik Aseptic Edge,with cap
Figure 23 Eutrophication potential for ambient 1 dairy milk packaging on the Swedish market.
The results show about the same relative performance of the two packaging systems as for previous impact categories. For eutrophication, the main differences are the “forestry & paperboard” and “secondary packaging production”.
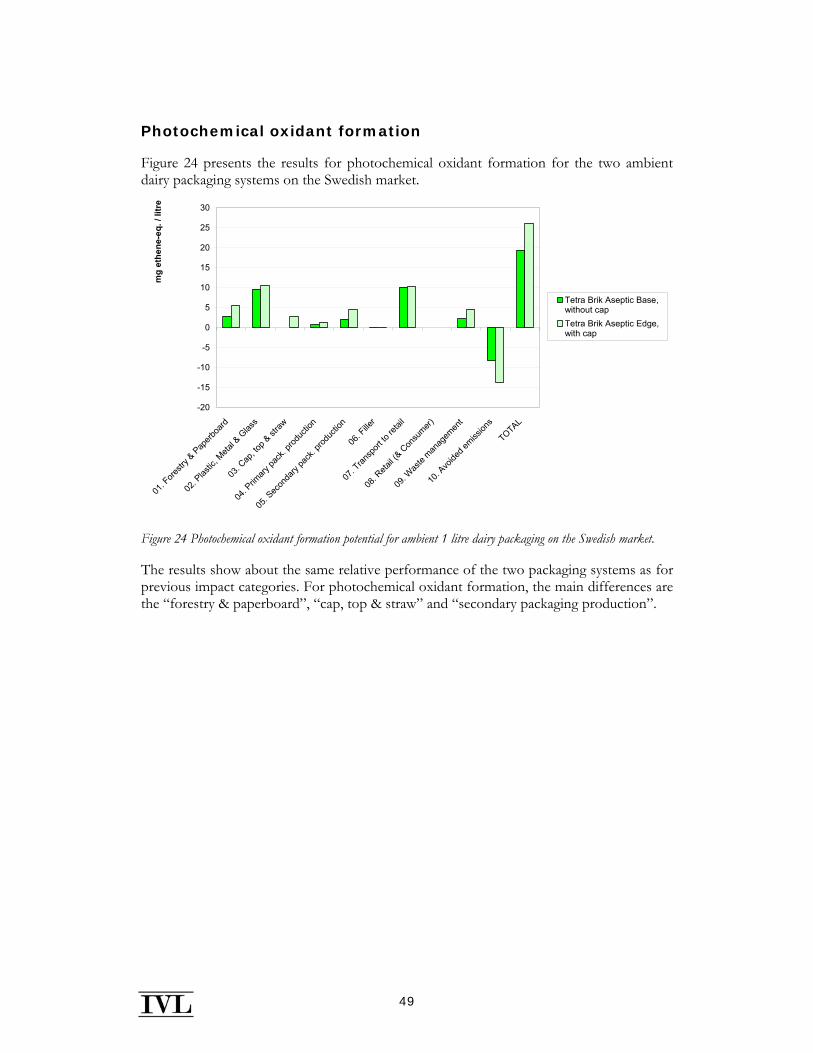
49
Photochemical oxidant formation
Figure 24 presents the results for photochemical oxidant formation for the two ambient dairy packaging systems on the Swedish market.
-20
-15
-10
-5
0
5
10
15
20
25
30
01. F
orestr
y & P
aperb
oard
02. P
lastic
, Meta
l & G
lass
03. C
ap, to
p & st
raw
04. P
rimary
pack
. prod
uctio
n
05. S
econ
dary
pack
. prod
uctio
n
06. F
iller
07. T
ransp
ort to
retai
l
08. R
etail (
& Con
sumer)
09. W
aste
manag
emen
t
10. A
voide
d emiss
ions
TOTAL
mg
ethe
ne-e
q. /
litre
Tetra Brik Aseptic Base,without capTetra Brik Aseptic Edge,with cap
Figure 24 Photochemical oxidant formation potential for ambient 1 litre dairy packaging on the Swedish market.
The results show about the same relative performance of the two packaging systems as for previous impact categories. For photochemical oxidant formation, the main differences are the “forestry & paperboard”, “cap, top & straw” and “secondary packaging production”.
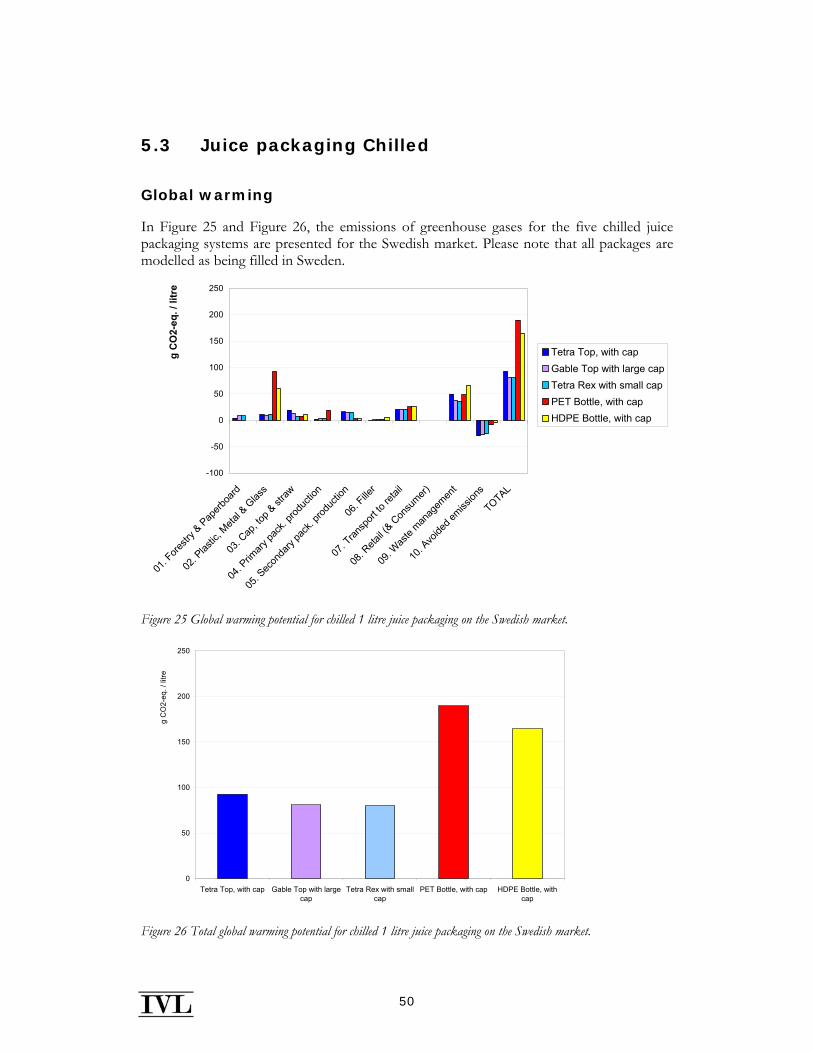
50
5.3 Juice packaging Chilled
Global warming
In Figure 25 and Figure 26, the emissions of greenhouse gases for the five chilled juice packaging systems are presented for the Swedish market. Please note that all packages are modelled as being filled in Sweden.
-100
-50
0
50
100
150
200
250
01. F
orestr
y & P
aperb
oard
02. P
lastic
, Meta
l & G
lass
03. C
ap, to
p & st
raw
04. P
rimary
pack
. prod
uctio
n
05. S
econ
dary
pack
. prod
uctio
n
06. F
iller
07. T
ransp
ort to
retai
l
08. R
etail (
& Con
sumer)
09. W
aste
manag
emen
t
10. A
voide
d emiss
ions
TOTAL
g C
O2-
eq. /
litr
e
Tetra Top, with capGable Top with large capTetra Rex with small capPET Bottle, with capHDPE Bottle, with cap
Figure 25 Global warming potential for chilled 1 litre juice packaging on the Swedish market.
0
50
100
150
200
250
Tetra Top, with cap Gable Top with largecap
Tetra Rex with smallcap
PET Bottle, with cap HDPE Bottle, withcap
g C
O2-
eq. /
litre
Figure 26 Total global warming potential for chilled 1 litre juice packaging on the Swedish market.
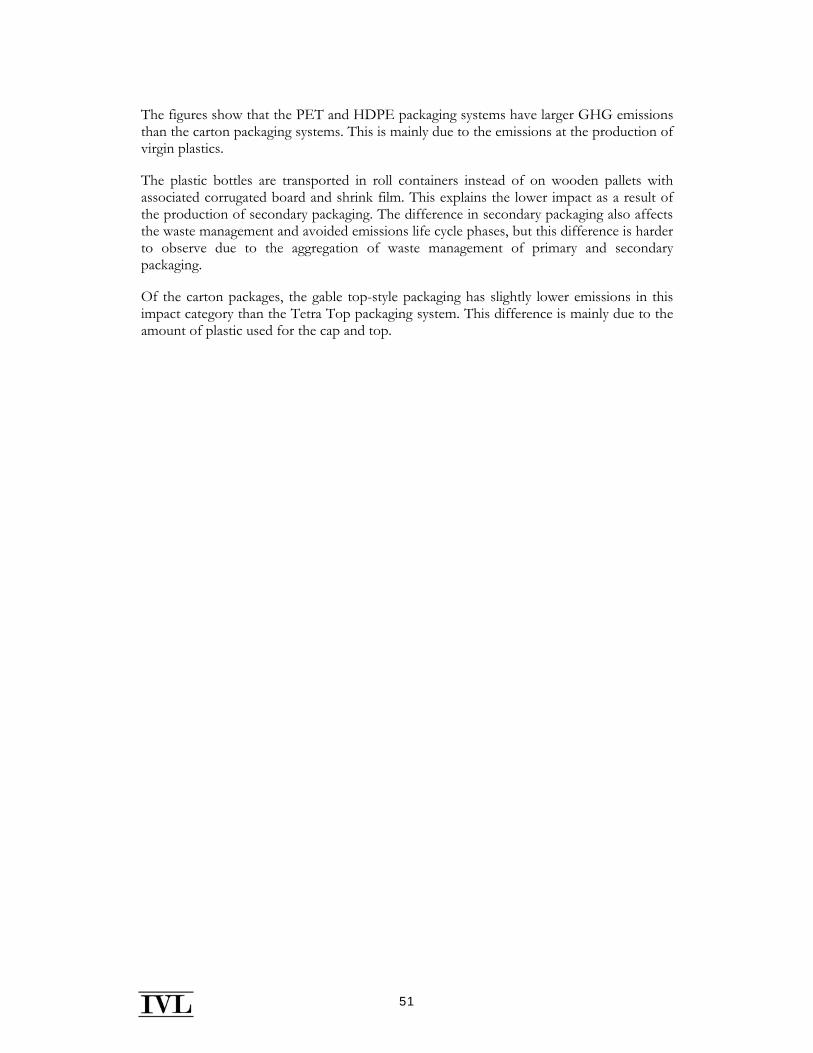
51
The figures show that the PET and HDPE packaging systems have larger GHG emissions than the carton packaging systems. This is mainly due to the emissions at the production of virgin plastics.
The plastic bottles are transported in roll containers instead of on wooden pallets with associated corrugated board and shrink film. This explains the lower impact as a result of the production of secondary packaging. The difference in secondary packaging also affects the waste management and avoided emissions life cycle phases, but this difference is harder to observe due to the aggregation of waste management of primary and secondary packaging.
Of the carton packages, the gable top-style packaging has slightly lower emissions in this impact category than the Tetra Top packaging system. This difference is mainly due to the amount of plastic used for the cap and top.
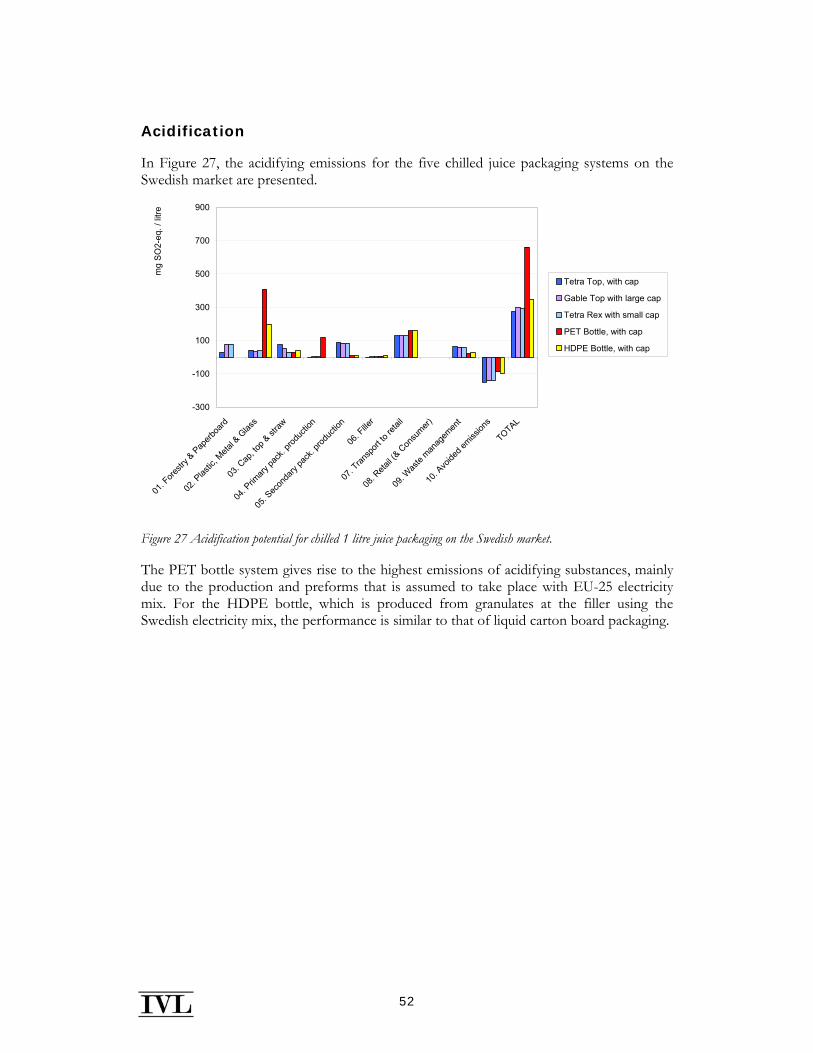
52
Acidification
In Figure 27, the acidifying emissions for the five chilled juice packaging systems on the Swedish market are presented.
-300
-100
100
300
500
700
900
01. F
orestr
y & P
aperb
oard
02. P
lastic
, Meta
l & G
lass
03. C
ap, to
p & st
raw
04. P
rimary
pack
. prod
uctio
n
05. S
econ
dary
pack
. prod
uctio
n
06. F
iller
07. T
ransp
ort to
retai
l
08. R
etail (
& Con
sumer)
09. W
aste
manag
emen
t
10. A
voide
d emiss
ions
TOTAL
mg
SO
2-eq
. / li
tre
Tetra Top, with cap
Gable Top with large cap
Tetra Rex with small cap
PET Bottle, with cap
HDPE Bottle, with cap
Figure 27 Acidification potential for chilled 1 litre juice packaging on the Swedish market.
The PET bottle system gives rise to the highest emissions of acidifying substances, mainly due to the production and preforms that is assumed to take place with EU-25 electricity mix. For the HDPE bottle, which is produced from granulates at the filler using the Swedish electricity mix, the performance is similar to that of liquid carton board packaging.
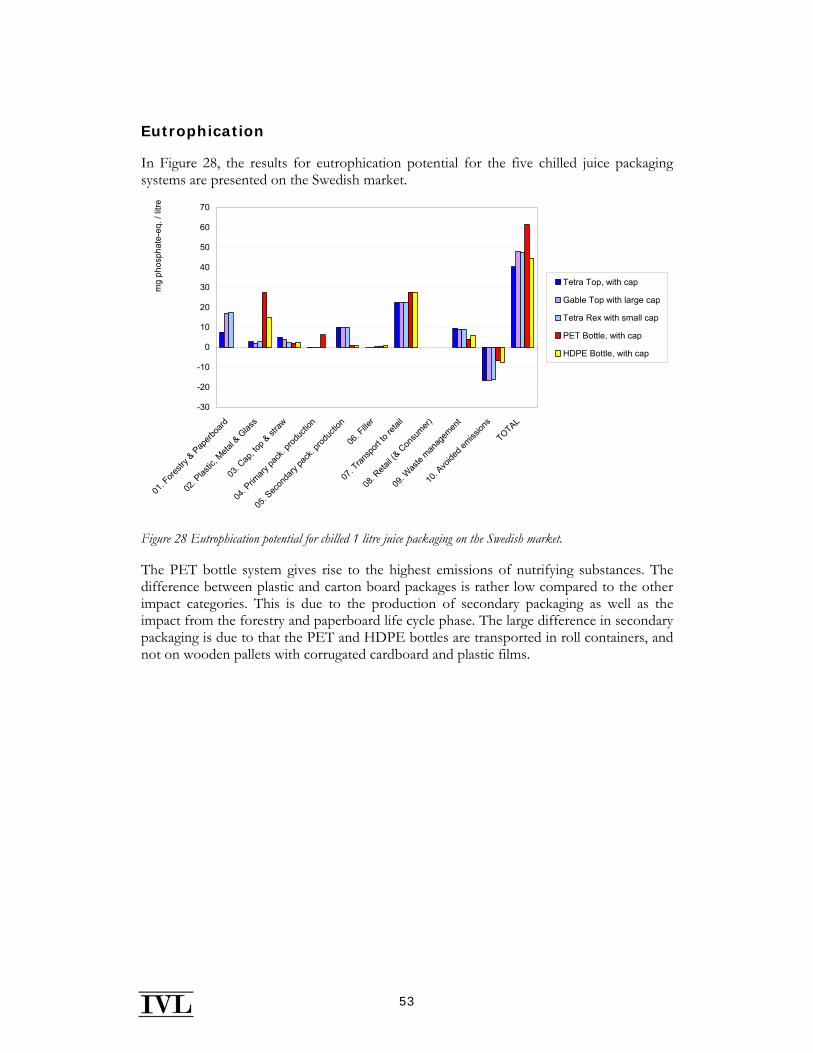
53
Eutrophication
In Figure 28, the results for eutrophication potential for the five chilled juice packaging systems are presented on the Swedish market.
-30
-20
-10
0
10
20
30
40
50
60
70
01. F
orestr
y & P
aperb
oard
02. P
lastic
, Meta
l & G
lass
03. C
ap, to
p & st
raw
04. P
rimary
pack
. prod
uctio
n
05. S
econ
dary
pack
. prod
uctio
n
06. F
iller
07. T
ransp
ort to
retai
l
08. R
etail (
& Con
sumer)
09. W
aste
manag
emen
t
10. A
voide
d emiss
ions
TOTAL
mg
phos
phat
e-eq
. / li
tre
Tetra Top, with cap
Gable Top with large cap
Tetra Rex with small cap
PET Bottle, with cap
HDPE Bottle, with cap
Figure 28 Eutrophication potential for chilled 1 litre juice packaging on the Swedish market.
The PET bottle system gives rise to the highest emissions of nutrifying substances. The difference between plastic and carton board packages is rather low compared to the other impact categories. This is due to the production of secondary packaging as well as the impact from the forestry and paperboard life cycle phase. The large difference in secondary packaging is due to that the PET and HDPE bottles are transported in roll containers, and not on wooden pallets with corrugated cardboard and plastic films.
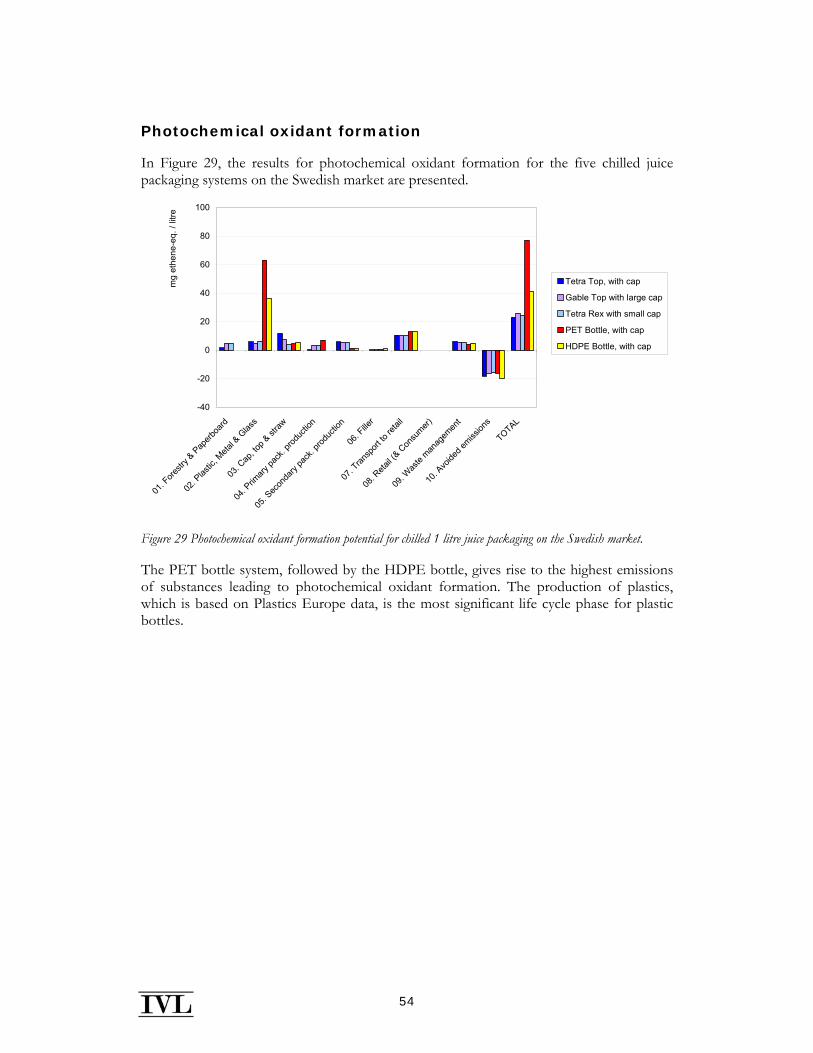
54
Photochemical oxidant formation
In Figure 29, the results for photochemical oxidant formation for the five chilled juice packaging systems on the Swedish market are presented.
-40
-20
0
20
40
60
80
100
01. F
orestr
y & P
aperb
oard
02. P
lastic
, Meta
l & G
lass
03. C
ap, to
p & st
raw
04. P
rimary
pack
. prod
uctio
n
05. S
econ
dary
pack
. prod
uctio
n
06. F
iller
07. T
ransp
ort to
retai
l
08. R
etail (
& Con
sumer)
09. W
aste
manag
emen
t
10. A
voide
d emiss
ions
TOTAL
mg
ethe
ne-e
q. /
litre
Tetra Top, with cap
Gable Top with large cap
Tetra Rex with small cap
PET Bottle, with cap
HDPE Bottle, with cap
Figure 29 Photochemical oxidant formation potential for chilled 1 litre juice packaging on the Swedish market.
The PET bottle system, followed by the HDPE bottle, gives rise to the highest emissions of substances leading to photochemical oxidant formation. The production of plastics, which is based on Plastics Europe data, is the most significant life cycle phase for plastic bottles.

55
5.4 Juice packaging Ambient
Global warming
Figure 30 presents the emissions of greenhouse gases for the three ambient juice packaging systems on the Swedish market.
-40
-20
0
20
40
60
80
100
120
140
01. F
orestr
y & Pap
erboa
rd
02. P
lastic
, Meta
l & G
lass
03. C
ap, to
p & st
raw
04. P
rimary
pack
. prod
uctio
n
05. S
econ
dary
pack
. prod
uctio
n
06. F
iller
07. T
ransp
ort to
retai
l
08. R
etail (
& Con
sumer)
09. W
aste
manag
emen
t
10. A
voide
d emiss
ions
TOTAL
g C
O2-
eq. /
litr
e
Tetra Brik Aseptic Slim,with cap
Tetra Gemina Aseptic,with cap
Tetra Prisma Aseptic,with cap
Figure 30 Global warming potential for ambient 1 litre juice packaging on the Swedish market.
Tetra Brik Aseptic Slim, which has the lowest metal and plastic content, also has the lowest total impact. The aluminium used as a laminate in all three packages comes from virgin aluminium and gives a relatively high contribution to global warming potential.
The environmental impact of filling is low for all three packages due to the use of the Swedish electricity mix.
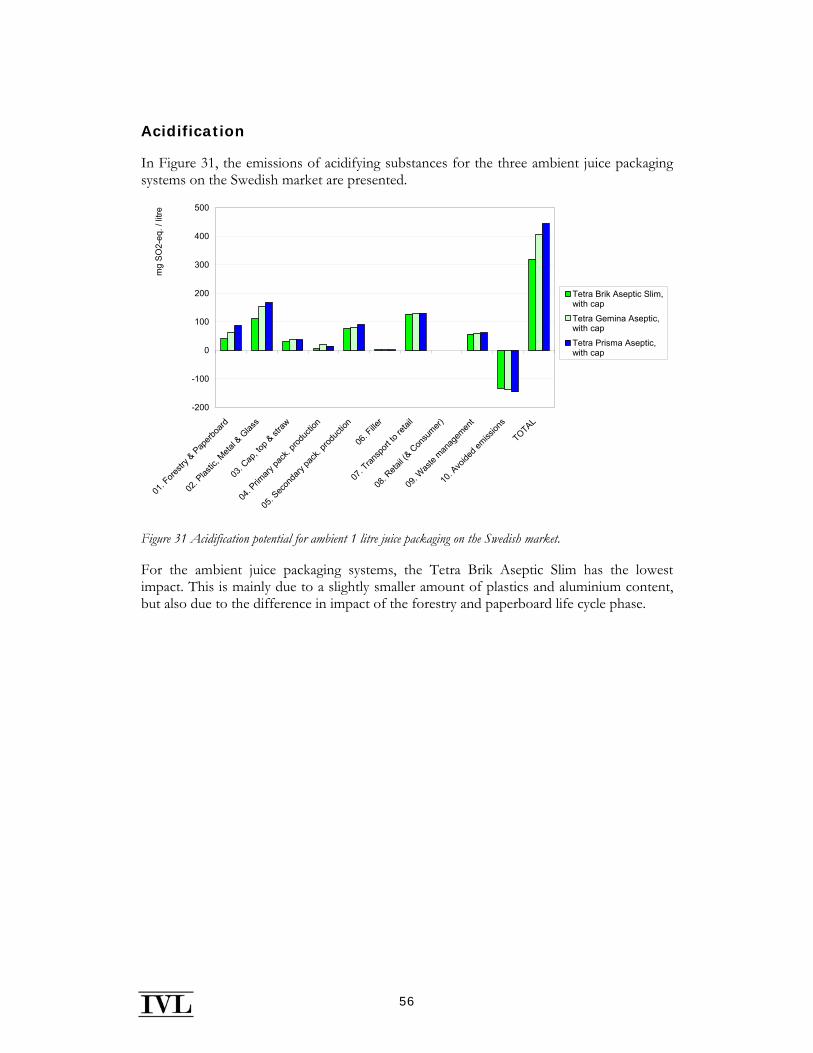
56
Acidification
In Figure 31, the emissions of acidifying substances for the three ambient juice packaging systems on the Swedish market are presented.
-200
-100
0
100
200
300
400
500
01. F
orestr
y & P
aperb
oard
02. P
lastic
, Meta
l & G
lass
03. C
ap, to
p & st
raw
04. P
rimary
pack
. prod
uctio
n
05. S
econ
dary
pack
. prod
uctio
n
06. F
iller
07. T
ransp
ort to
retai
l
08. R
etail (
& Con
sumer)
09. W
aste
manag
emen
t
10. A
voide
d emiss
ions
TOTAL
mg
SO
2-eq
. / li
tre
Tetra Brik Aseptic Slim,with cap
Tetra Gemina Aseptic,with cap
Tetra Prisma Aseptic,with cap
Figure 31 Acidification potential for ambient 1 litre juice packaging on the Swedish market.
For the ambient juice packaging systems, the Tetra Brik Aseptic Slim has the lowest impact. This is mainly due to a slightly smaller amount of plastics and aluminium content, but also due to the difference in impact of the forestry and paperboard life cycle phase.
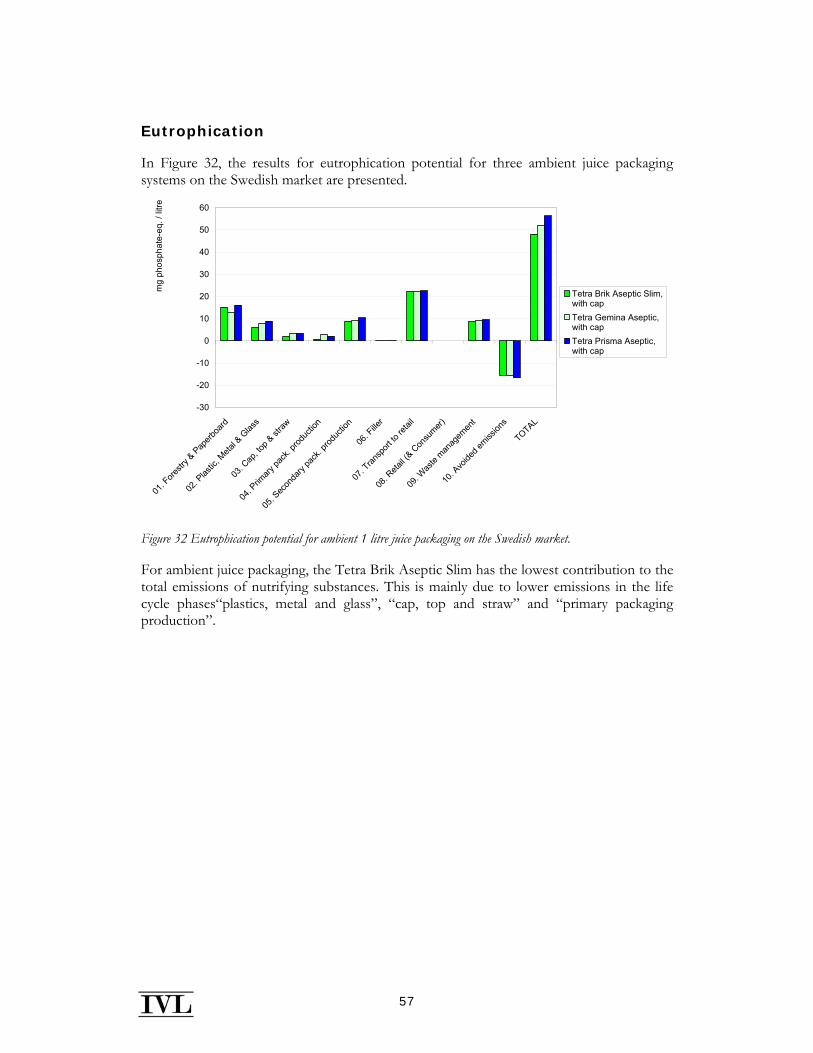
57
Eutrophication
In Figure 32, the results for eutrophication potential for three ambient juice packaging systems on the Swedish market are presented.
-30
-20
-10
0
10
20
30
40
50
60
01. F
orestr
y & P
aperb
oard
02. P
lastic
, Meta
l & G
lass
03. C
ap, to
p & st
raw
04. P
rimary
pack
. prod
uctio
n
05. S
econ
dary
pack
. prod
uctio
n
06. F
iller
07. T
ransp
ort to
retai
l
08. R
etail (
& Con
sumer)
09. W
aste
manag
emen
t
10. A
voide
d emiss
ions
TOTAL
mg
phos
phat
e-eq
. / li
tre
Tetra Brik Aseptic Slim,with capTetra Gemina Aseptic,with capTetra Prisma Aseptic,with cap
Figure 32 Eutrophication potential for ambient 1 litre juice packaging on the Swedish market.
For ambient juice packaging, the Tetra Brik Aseptic Slim has the lowest contribution to the total emissions of nutrifying substances. This is mainly due to lower emissions in the life cycle phases“plastics, metal and glass”, “cap, top and straw” and “primary packaging production”.
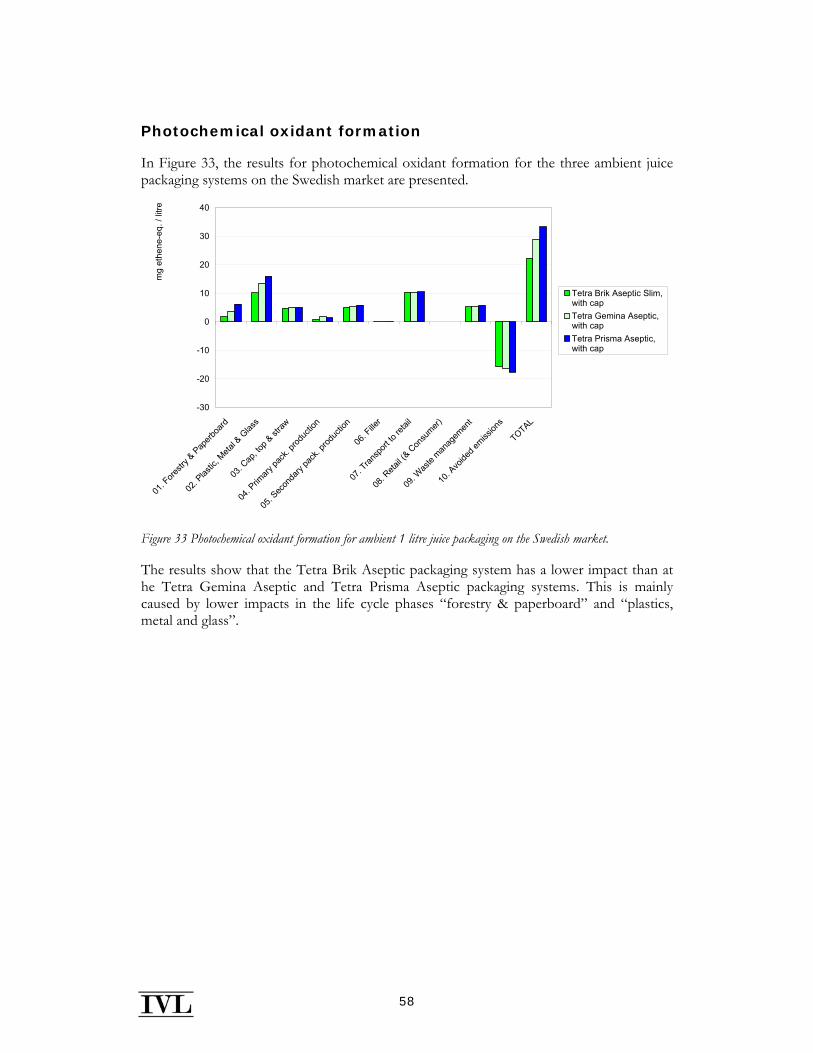
58
Photochemical oxidant formation
In Figure 33, the results for photochemical oxidant formation for the three ambient juice packaging systems on the Swedish market are presented.
-30
-20
-10
0
10
20
30
40
01. F
orestr
y & P
aperb
oard
02. P
lastic
, Meta
l & G
lass
03. C
ap, to
p & st
raw
04. P
rimary
pack
. prod
uctio
n
05. S
econ
dary
pack
. prod
uctio
n
06. F
iller
07. T
ransp
ort to
retai
l
08. R
etail (
& Con
sumer)
09. W
aste
manag
emen
t
10. A
voide
d emiss
ions
TOTAL
mg
ethe
ne-e
q. /
litre
Tetra Brik Aseptic Slim,with capTetra Gemina Aseptic,with capTetra Prisma Aseptic,with cap
Figure 33 Photochemical oxidant formation for ambient 1 litre juice packaging on the Swedish market.
The results show that the Tetra Brik Aseptic packaging system has a lower impact than at he Tetra Gemina Aseptic and Tetra Prisma Aseptic packaging systems. This is mainly caused by lower impacts in the life cycle phases “forestry & paperboard” and “plastics, metal and glass”.
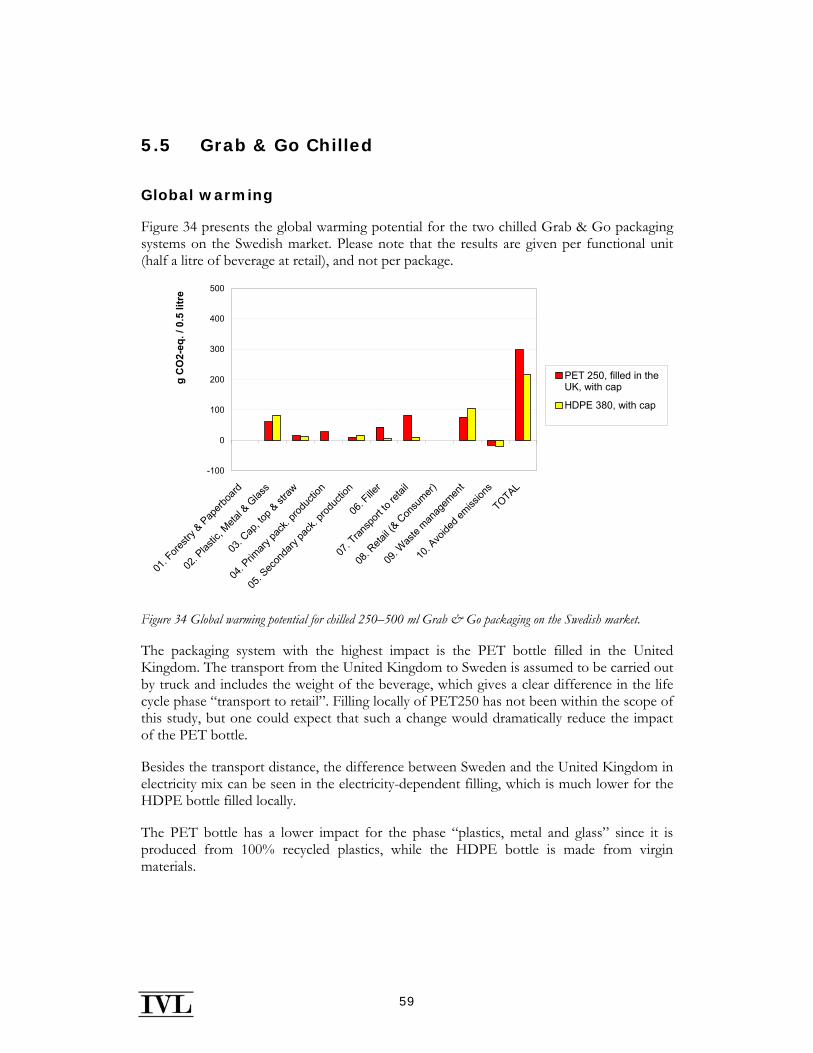
59
5.5 Grab & Go Chilled
Global warming
Figure 34 presents the global warming potential for the two chilled Grab & Go packaging systems on the Swedish market. Please note that the results are given per functional unit (half a litre of beverage at retail), and not per package.
-100
0
100
200
300
400
500
01. F
orestr
y & Pap
erboa
rd
02. P
lastic
, Meta
l & G
lass
03. C
ap, to
p & st
raw
04. P
rimary
pack
. prod
uctio
n
05. S
econ
dary
pack
. prod
uctio
n
06. F
iller
07. T
ransp
ort to
retai
l
08. R
etail (
& Con
sumer)
09. W
aste
manag
emen
t
10. A
voide
d emiss
ions
TOTAL
g C
O2-
eq. /
0.5
litr
e
PET 250, filled in theUK, with cap
HDPE 380, with cap
Figure 34 Global warming potential for chilled 250–500 ml Grab & Go packaging on the Swedish market.
The packaging system with the highest impact is the PET bottle filled in the United Kingdom. The transport from the United Kingdom to Sweden is assumed to be carried out by truck and includes the weight of the beverage, which gives a clear difference in the life cycle phase “transport to retail”. Filling locally of PET250 has not been within the scope of this study, but one could expect that such a change would dramatically reduce the impact of the PET bottle.
Besides the transport distance, the difference between Sweden and the United Kingdom in electricity mix can be seen in the electricity-dependent filling, which is much lower for the HDPE bottle filled locally.
The PET bottle has a lower impact for the phase “plastics, metal and glass” since it is produced from 100% recycled plastics, while the HDPE bottle is made from virgin materials.
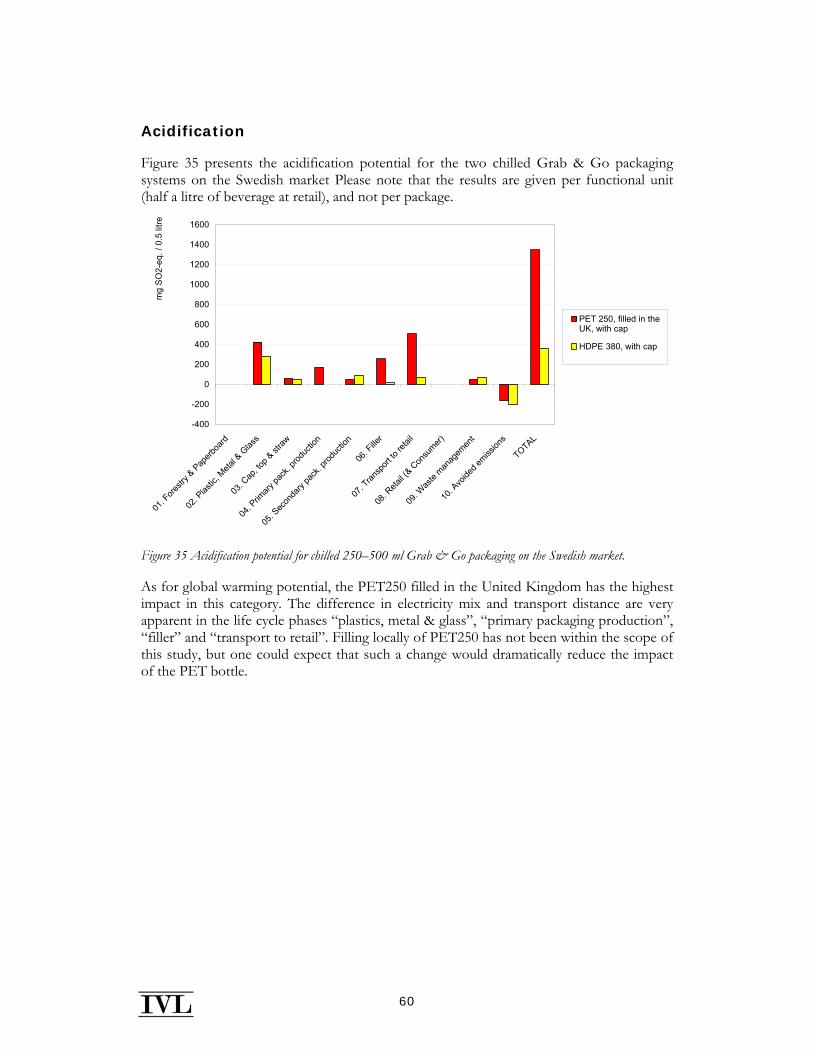
60
Acidification
Figure 35 presents the acidification potential for the two chilled Grab & Go packaging systems on the Swedish market Please note that the results are given per functional unit (half a litre of beverage at retail), and not per package.
-400
-200
0
200
400
600
800
1000
1200
1400
1600
01. F
orestr
y & P
aperb
oard
02. P
lastic
, Meta
l & G
lass
03. C
ap, to
p & st
raw
04. P
rimary
pack
. prod
uctio
n
05. S
econ
dary
pack
. prod
uctio
n
06. F
iller
07. T
ransp
ort to
retai
l
08. R
etail (
& Con
sumer)
09. W
aste
manag
emen
t
10. A
voide
d emiss
ions
TOTAL
mg
SO
2-eq
. / 0
.5 li
tre
PET 250, filled in theUK, with cap
HDPE 380, with cap
Figure 35 Acidification potential for chilled 250–500 ml Grab & Go packaging on the Swedish market.
As for global warming potential, the PET250 filled in the United Kingdom has the highest impact in this category. The difference in electricity mix and transport distance are very apparent in the life cycle phases “plastics, metal & glass”, “primary packaging production”, “filler” and “transport to retail”. Filling locally of PET250 has not been within the scope of this study, but one could expect that such a change would dramatically reduce the impact of the PET bottle.
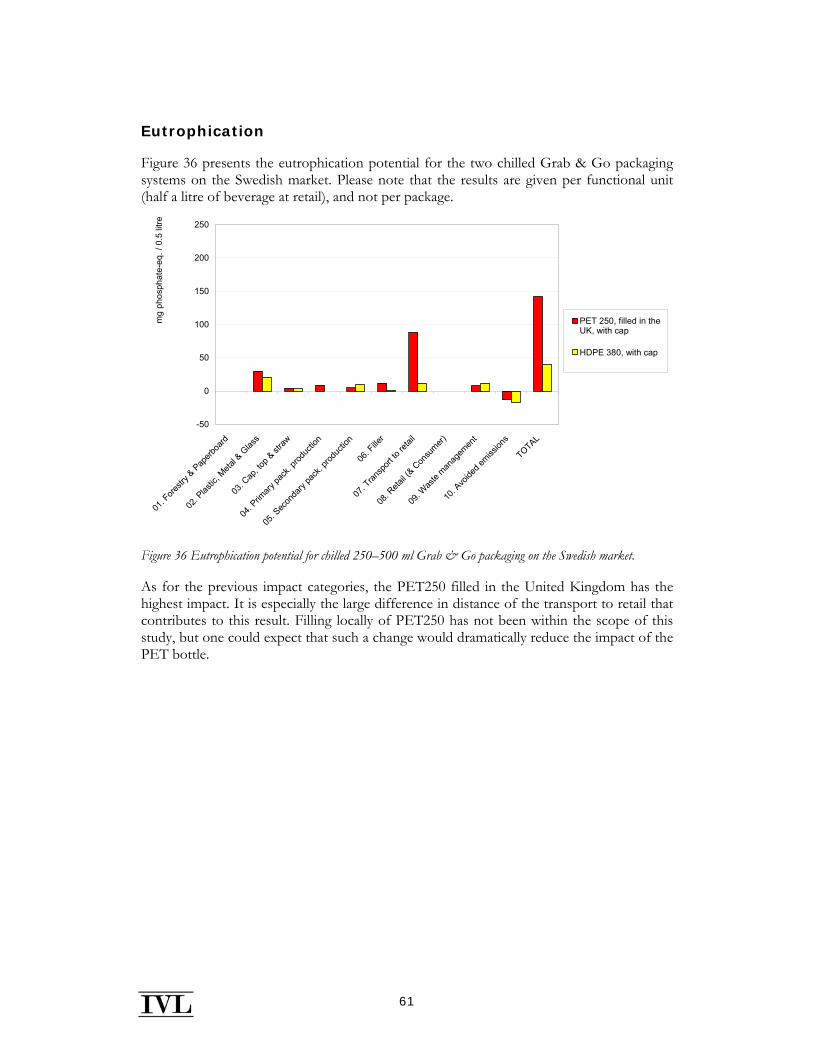
61
Eutrophication
Figure 36 presents the eutrophication potential for the two chilled Grab & Go packaging systems on the Swedish market. Please note that the results are given per functional unit (half a litre of beverage at retail), and not per package.
-50
0
50
100
150
200
250
01. F
orestr
y & P
aperb
oard
02. P
lastic
, Meta
l & G
lass
03. C
ap, to
p & st
raw
04. P
rimary
pack
. prod
uctio
n
05. S
econ
dary
pack
. prod
uctio
n
06. F
iller
07. T
ransp
ort to
retai
l
08. R
etail (
& Con
sumer)
09. W
aste
manag
emen
t
10. A
voide
d emiss
ions
TOTAL
mg
phos
phat
e-eq
. / 0
.5 li
tre
PET 250, filled in theUK, with cap
HDPE 380, with cap
Figure 36 Eutrophication potential for chilled 250–500 ml Grab & Go packaging on the Swedish market.
As for the previous impact categories, the PET250 filled in the United Kingdom has the highest impact. It is especially the large difference in distance of the transport to retail that contributes to this result. Filling locally of PET250 has not been within the scope of this study, but one could expect that such a change would dramatically reduce the impact of the PET bottle.
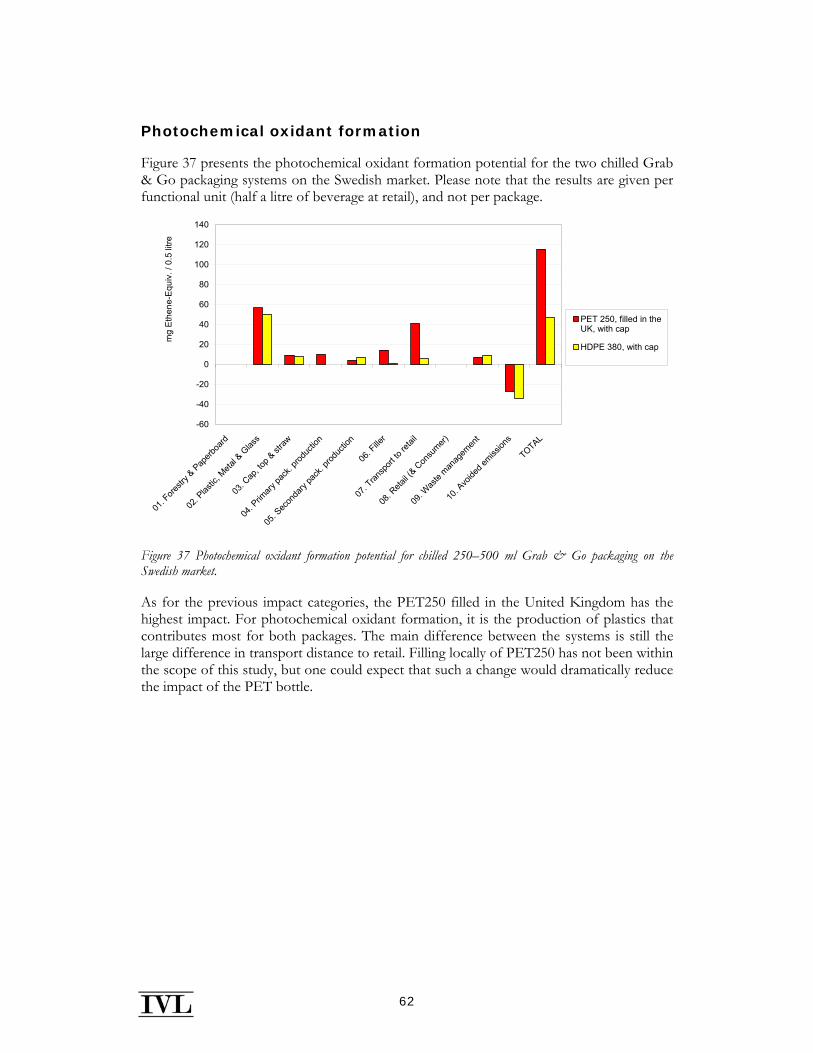
62
Photochemical oxidant formation
Figure 37 presents the photochemical oxidant formation potential for the two chilled Grab & Go packaging systems on the Swedish market. Please note that the results are given per functional unit (half a litre of beverage at retail), and not per package.
-60
-40
-20
0
20
40
60
80
100
120
140
01. F
orestr
y & P
aperb
oard
02. P
lastic
, Meta
l & G
lass
03. C
ap, to
p & st
raw
04. P
rimary
pack
. prod
uctio
n
05. S
econ
dary
pack
. prod
uctio
n
06. F
iller
07. T
ransp
ort to
retai
l
08. R
etail (
& Con
sumer)
09. W
aste
manag
emen
t
10. A
voide
d emiss
ions
TOTAL
mg
Eth
ene-
Equ
iv. /
0.5
litre
PET 250, filled in theUK, with cap
HDPE 380, with cap
Figure 37 Photochemical oxidant formation potential for chilled 250–500 ml Grab & Go packaging on the Swedish market.
As for the previous impact categories, the PET250 filled in the United Kingdom has the highest impact. For photochemical oxidant formation, it is the production of plastics that contributes most for both packages. The main difference between the systems is still the large difference in transport distance to retail. Filling locally of PET250 has not been within the scope of this study, but one could expect that such a change would dramatically reduce the impact of the PET bottle.
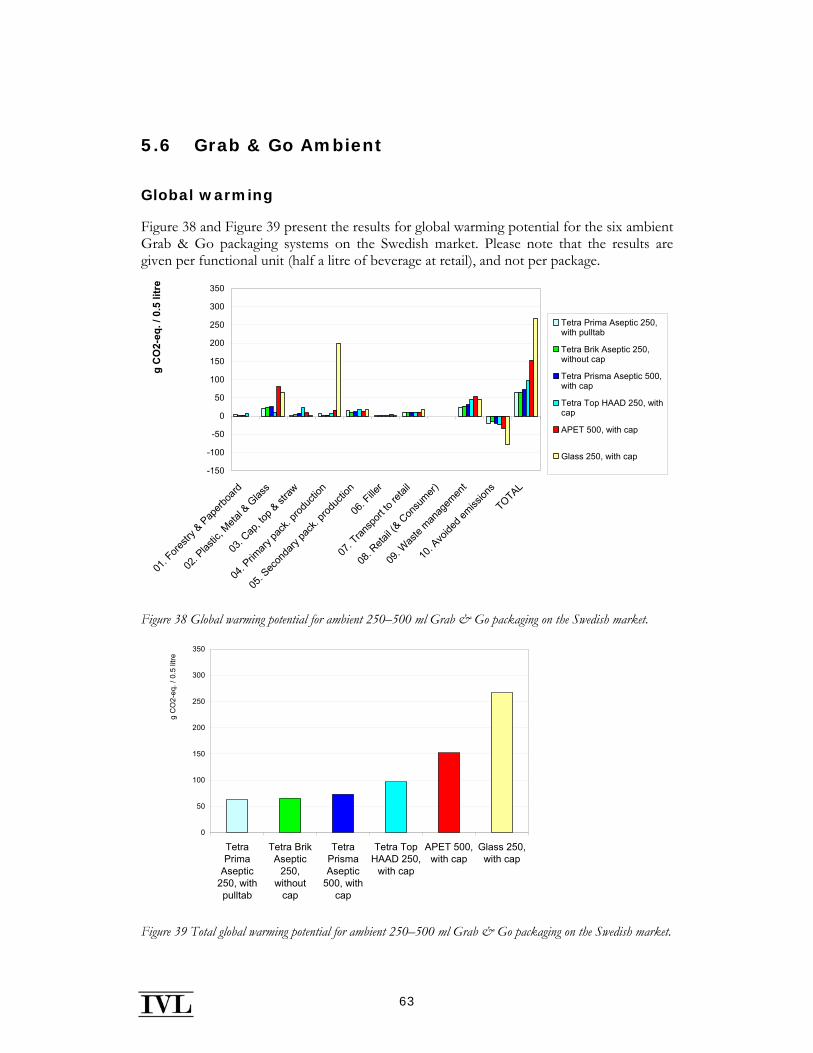
63
5.6 Grab & Go Ambient
Global warming
Figure 38 and Figure 39 present the results for global warming potential for the six ambient Grab & Go packaging systems on the Swedish market. Please note that the results are given per functional unit (half a litre of beverage at retail), and not per package.
-150
-100
-50
0
50
100
150
200
250
300
350
01. F
orestr
y & Pap
erboa
rd
02. P
lastic
, Meta
l & G
lass
03. C
ap, to
p & st
raw
04. P
rimary
pack
. prod
uctio
n
05. S
econ
dary
pack
. prod
uctio
n
06. F
iller
07. T
ransp
ort to
retai
l
08. R
etail (
& Con
sumer)
09. W
aste
manag
emen
t
10. A
voide
d emiss
ions
TOTAL
g C
O2-
eq. /
0.5
litr
e
Tetra Prima Aseptic 250,with pulltab
Tetra Brik Aseptic 250,without cap
Tetra Prisma Aseptic 500,with cap
Tetra Top HAAD 250, withcap
APET 500, with cap
Glass 250, with cap
Figure 38 Global warming potential for ambient 250–500 ml Grab & Go packaging on the Swedish market.
0
50
100
150
200
250
300
350
TetraPrima
Aseptic250, withpulltab
Tetra BrikAseptic
250,without
cap
TetraPrismaAseptic
500, withcap
Tetra TopHAAD 250,
with cap
APET 500,with cap
Glass 250,with cap
g C
O2-
eq. /
0.5
litre
Figure 39 Total global warming potential for ambient 250–500 ml Grab & Go packaging on the Swedish market.

64
The disposable glass packaging system has by far the largest GHG emissions. It is the production of the glass and bottle that gives the highest emissions.
The APET 500 has significantly larger emissions than the studied Tetra Pak packages, also because of the GHG emissions at production of the raw materials. However, the emissions from the production of the PET bottle are much lower than for the glass bottle.
Of the carton board packaging, Tetra Top HAAD is the package with the highest impact. The largest difference between this package and the other are the plastic cap and top, which gives significantly higher emissions than for the other packages. Tetra Top HAAD has a lower GHG emission for the lifecycle “plastic, metal and glass” than the other packages because it is the only packaging without aluminium foil inside. The production of virgin aluminium is very energy-intensive.
The primary production for Tetra Prisma Aseptic 250 are situated in Spain, Tetra Top HAAD in UK and the other two packages in Sweden. The low-carbon electricity mix in Sweden explains the higher emissions in primary packaging production for the aforementioned packaging systems.
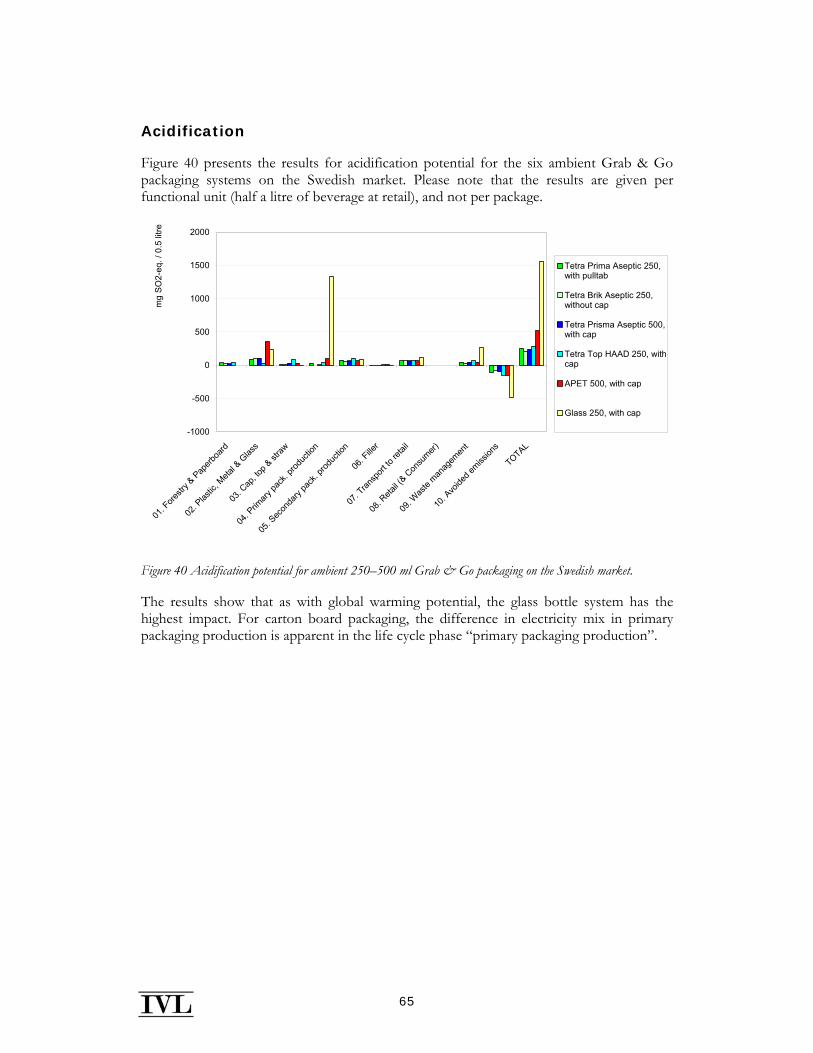
65
Acidification
Figure 40 presents the results for acidification potential for the six ambient Grab & Go packaging systems on the Swedish market. Please note that the results are given per functional unit (half a litre of beverage at retail), and not per package.
-1000
-500
0
500
1000
1500
2000
01. F
orestr
y & P
aperb
oard
02. P
lastic
, Meta
l & G
lass
03. C
ap, to
p & st
raw
04. P
rimary
pack
. prod
uctio
n
05. S
econ
dary
pack
. prod
uctio
n
06. F
iller
07. T
ransp
ort to
retai
l
08. R
etail (
& Con
sumer)
09. W
aste
manag
emen
t
10. A
voide
d emiss
ions
TOTAL
mg
SO
2-eq
. / 0
.5 li
tre
Tetra Prima Aseptic 250,with pulltab
Tetra Brik Aseptic 250,without cap
Tetra Prisma Aseptic 500,with cap
Tetra Top HAAD 250, withcap
APET 500, with cap
Glass 250, with cap
Figure 40 Acidification potential for ambient 250–500 ml Grab & Go packaging on the Swedish market.
The results show that as with global warming potential, the glass bottle system has the highest impact. For carton board packaging, the difference in electricity mix in primary packaging production is apparent in the life cycle phase “primary packaging production”.
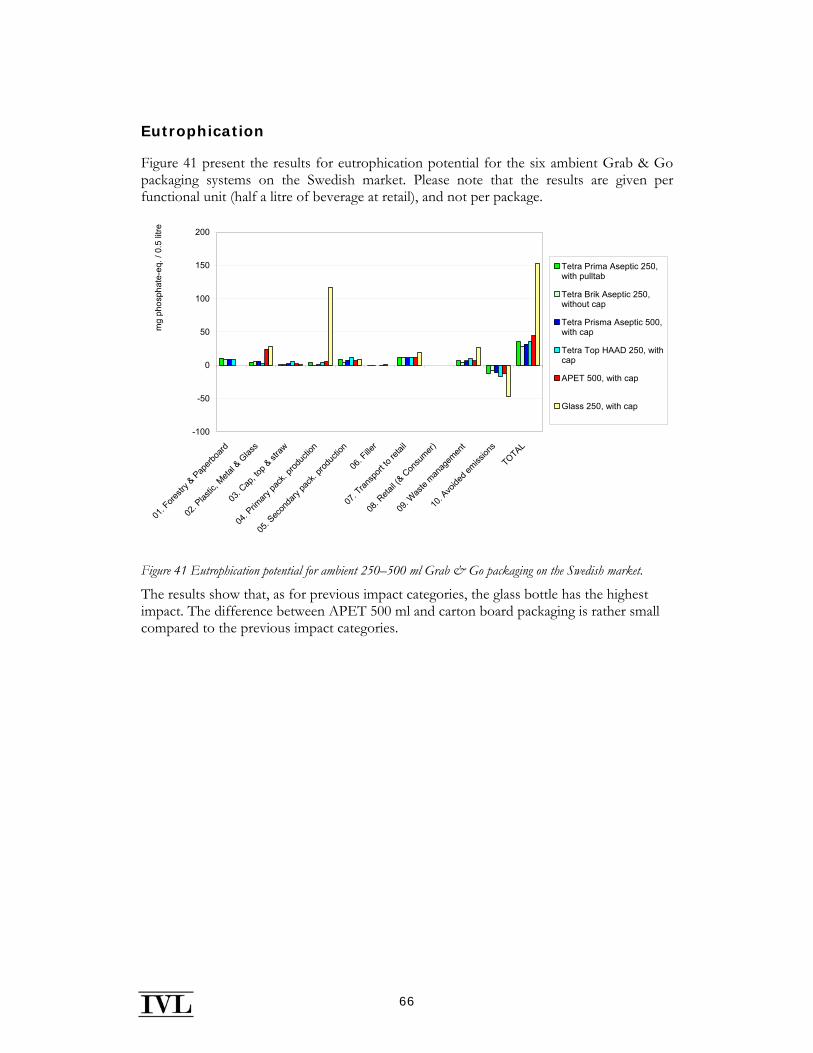
66
Eutrophication
Figure 41 present the results for eutrophication potential for the six ambient Grab & Go packaging systems on the Swedish market. Please note that the results are given per functional unit (half a litre of beverage at retail), and not per package.
-100
-50
0
50
100
150
200
01. F
orestr
y & P
aperb
oard
02. P
lastic
, Meta
l & G
lass
03. C
ap, to
p & st
raw
04. P
rimary
pack
. prod
uctio
n
05. S
econ
dary
pack
. prod
uctio
n
06. F
iller
07. T
ransp
ort to
retai
l
08. R
etail (
& Con
sumer)
09. W
aste
manag
emen
t
10. A
voide
d emiss
ions
TOTAL
mg
phos
phat
e-eq
. / 0
.5 li
tre
Tetra Prima Aseptic 250,with pulltab
Tetra Brik Aseptic 250,without cap
Tetra Prisma Aseptic 500,with cap
Tetra Top HAAD 250, withcap
APET 500, with cap
Glass 250, with cap
Figure 41 Eutrophication potential for ambient 250–500 ml Grab & Go packaging on the Swedish market.
The results show that, as for previous impact categories, the glass bottle has the highest impact. The difference between APET 500 ml and carton board packaging is rather small compared to the previous impact categories.
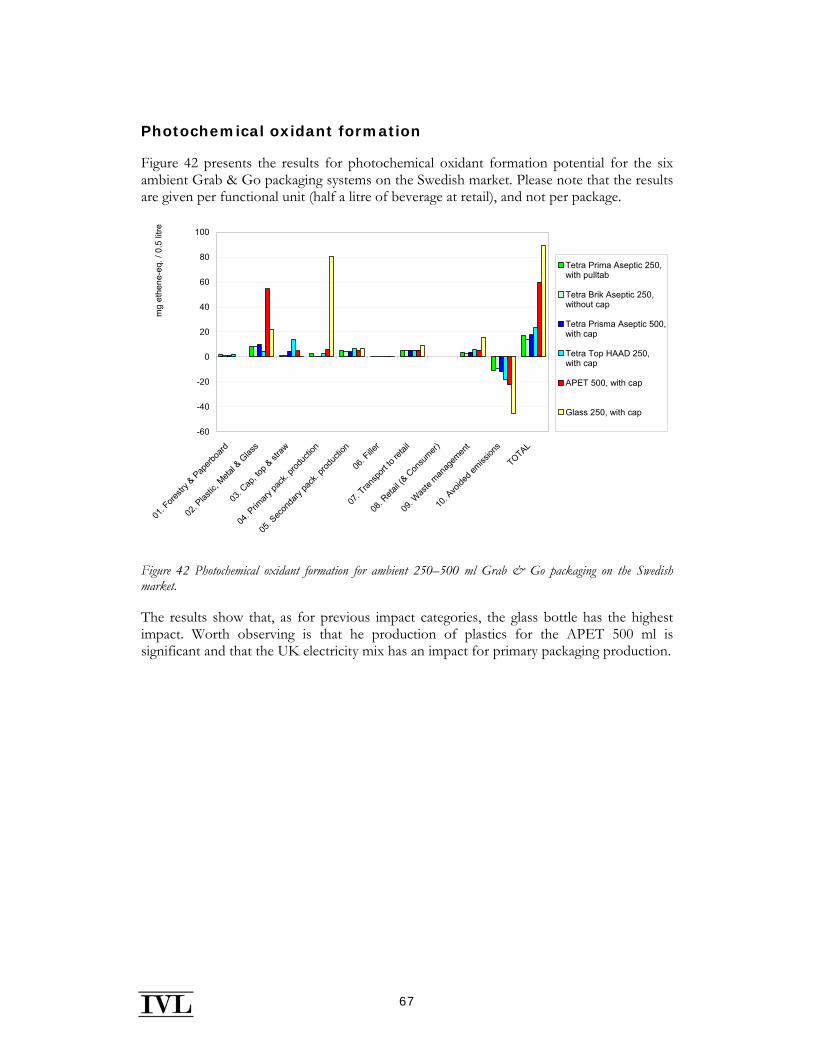
67
Photochemical oxidant formation
Figure 42 presents the results for photochemical oxidant formation potential for the six ambient Grab & Go packaging systems on the Swedish market. Please note that the results are given per functional unit (half a litre of beverage at retail), and not per package.
-60
-40
-20
0
20
40
60
80
100
01. F
orestr
y & P
aperb
oard
02. P
lastic
, Meta
l & G
lass
03. C
ap, to
p & st
raw
04. P
rimary
pack
. prod
uctio
n
05. S
econ
dary
pack
. prod
uctio
n
06. F
iller
07. T
ransp
ort to
retai
l
08. R
etail (
& Con
sumer)
09. W
aste
manag
emen
t
10. A
voide
d emiss
ions
TOTAL
mg
ethe
ne-e
q. /
0.5
litre
Tetra Prima Aseptic 250,with pulltab
Tetra Brik Aseptic 250,without cap
Tetra Prisma Aseptic 500,with cap
Tetra Top HAAD 250,with cap
APET 500, with cap
Glass 250, with cap
Figure 42 Photochemical oxidant formation for ambient 250–500 ml Grab & Go packaging on the Swedish market.
The results show that, as for previous impact categories, the glass bottle has the highest impact. Worth observing is that he production of plastics for the APET 500 ml is significant and that the UK electricity mix has an impact for primary packaging production.
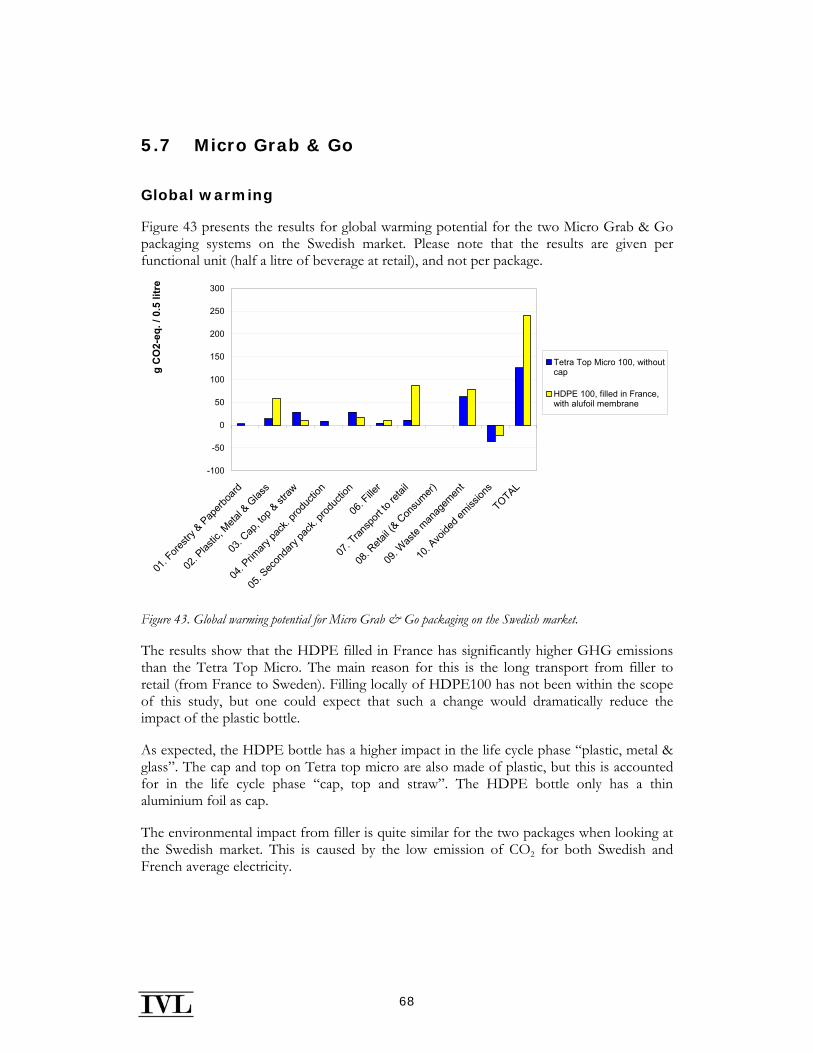
68
5.7 Micro Grab & Go
Global warming
Figure 43 presents the results for global warming potential for the two Micro Grab & Go packaging systems on the Swedish market. Please note that the results are given per functional unit (half a litre of beverage at retail), and not per package.
-100
-50
0
50
100
150
200
250
300
01. F
orestr
y & Pap
erboa
rd
02. P
lastic
, Meta
l & G
lass
03. C
ap, to
p & st
raw
04. P
rimary
pack
. prod
uctio
n
05. S
econ
dary
pack
. prod
uctio
n
06. F
iller
07. T
ransp
ort to
retai
l
08. R
etail (
& Con
sumer)
09. W
aste
manag
emen
t
10. A
voide
d emiss
ions
TOTAL
g C
O2-
eq. /
0.5
litr
e
Tetra Top Micro 100, withoutcap
HDPE 100, filled in France,with alufoil membrane
Figure 43. Global warming potential for Micro Grab & Go packaging on the Swedish market.
The results show that the HDPE filled in France has significantly higher GHG emissions than the Tetra Top Micro. The main reason for this is the long transport from filler to retail (from France to Sweden). Filling locally of HDPE100 has not been within the scope of this study, but one could expect that such a change would dramatically reduce the impact of the plastic bottle.
As expected, the HDPE bottle has a higher impact in the life cycle phase “plastic, metal & glass”. The cap and top on Tetra top micro are also made of plastic, but this is accounted for in the life cycle phase “cap, top and straw”. The HDPE bottle only has a thin aluminium foil as cap.
The environmental impact from filler is quite similar for the two packages when looking at the Swedish market. This is caused by the low emission of CO2 for both Swedish and French average electricity.
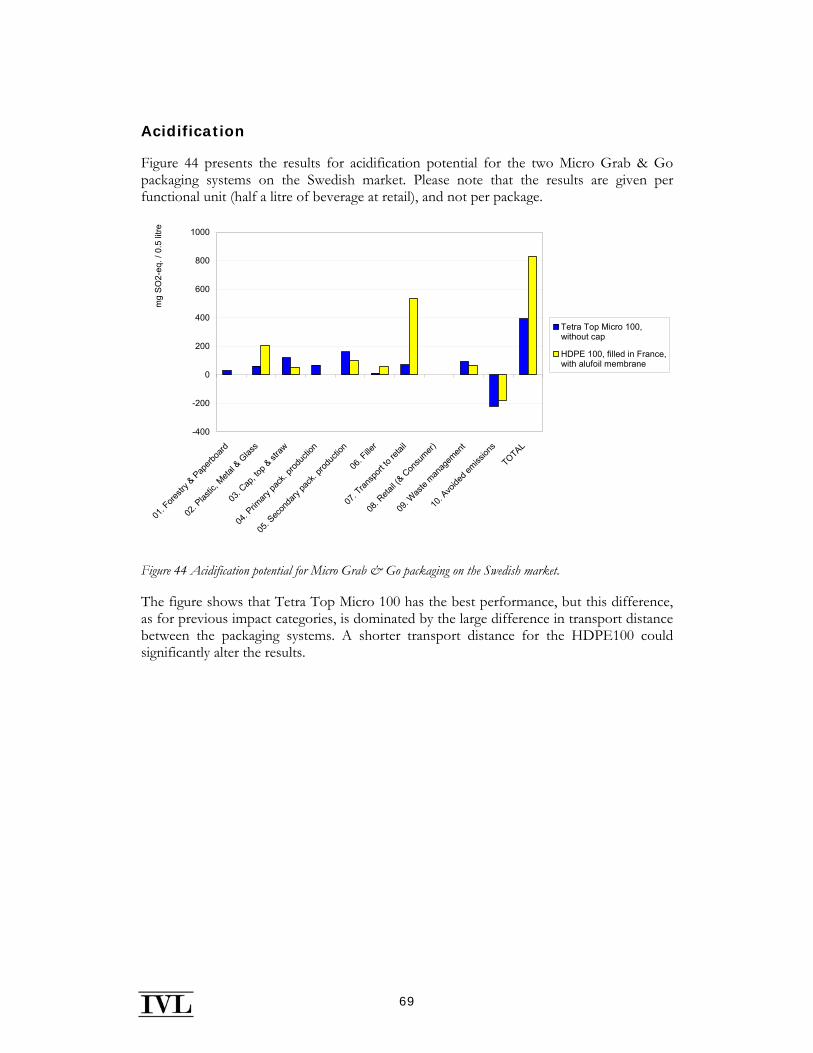
69
Acidification
Figure 44 presents the results for acidification potential for the two Micro Grab & Go packaging systems on the Swedish market. Please note that the results are given per functional unit (half a litre of beverage at retail), and not per package.
-400
-200
0
200
400
600
800
1000
01. F
orestr
y & P
aperb
oard
02. P
lastic
, Meta
l & G
lass
03. C
ap, to
p & st
raw
04. P
rimary
pack
. prod
uctio
n
05. S
econ
dary
pack
. prod
uctio
n
06. F
iller
07. T
ransp
ort to
retai
l
08. R
etail (
& Con
sumer)
09. W
aste
manag
emen
t
10. A
voide
d emiss
ions
TOTAL
mg
SO
2-eq
. / 0
.5 li
tre
Tetra Top Micro 100,without cap
HDPE 100, filled in France,with alufoil membrane
Figure 44 Acidification potential for Micro Grab & Go packaging on the Swedish market.
The figure shows that Tetra Top Micro 100 has the best performance, but this difference, as for previous impact categories, is dominated by the large difference in transport distance between the packaging systems. A shorter transport distance for the HDPE100 could significantly alter the results.
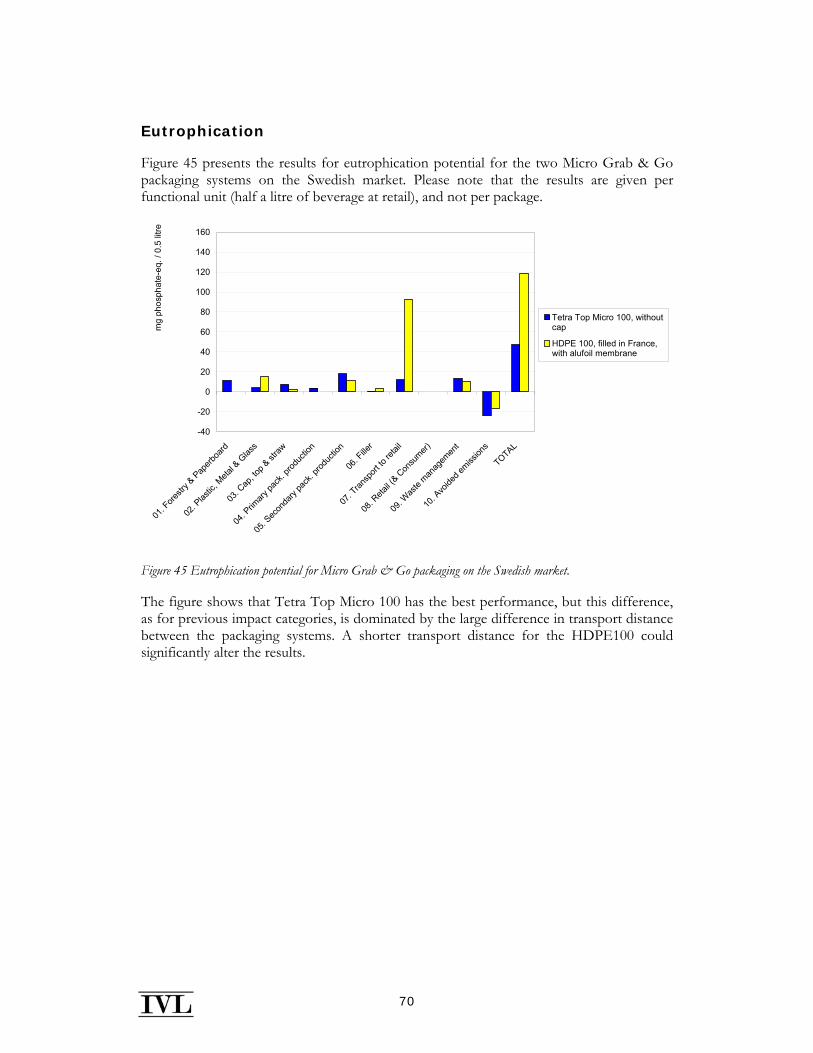
70
Eutrophication
Figure 45 presents the results for eutrophication potential for the two Micro Grab & Go packaging systems on the Swedish market. Please note that the results are given per functional unit (half a litre of beverage at retail), and not per package.
-40
-20
0
20
40
60
80
100
120
140
160
01. F
orestr
y & P
aperb
oard
02. P
lastic
, Meta
l & G
lass
03. C
ap, to
p & st
raw
04. P
rimary
pack
. prod
uctio
n
05. S
econ
dary
pack
. prod
uctio
n
06. F
iller
07. T
ransp
ort to
retai
l
08. R
etail (
& Con
sumer)
09. W
aste
manag
emen
t
10. A
voide
d emiss
ions
TOTAL
mg
phos
phat
e-eq
. / 0
.5 li
tre
Tetra Top Micro 100, withoutcap
HDPE 100, filled in France,with alufoil membrane
Figure 45 Eutrophication potential for Micro Grab & Go packaging on the Swedish market.
The figure shows that Tetra Top Micro 100 has the best performance, but this difference, as for previous impact categories, is dominated by the large difference in transport distance between the packaging systems. A shorter transport distance for the HDPE100 could significantly alter the results.
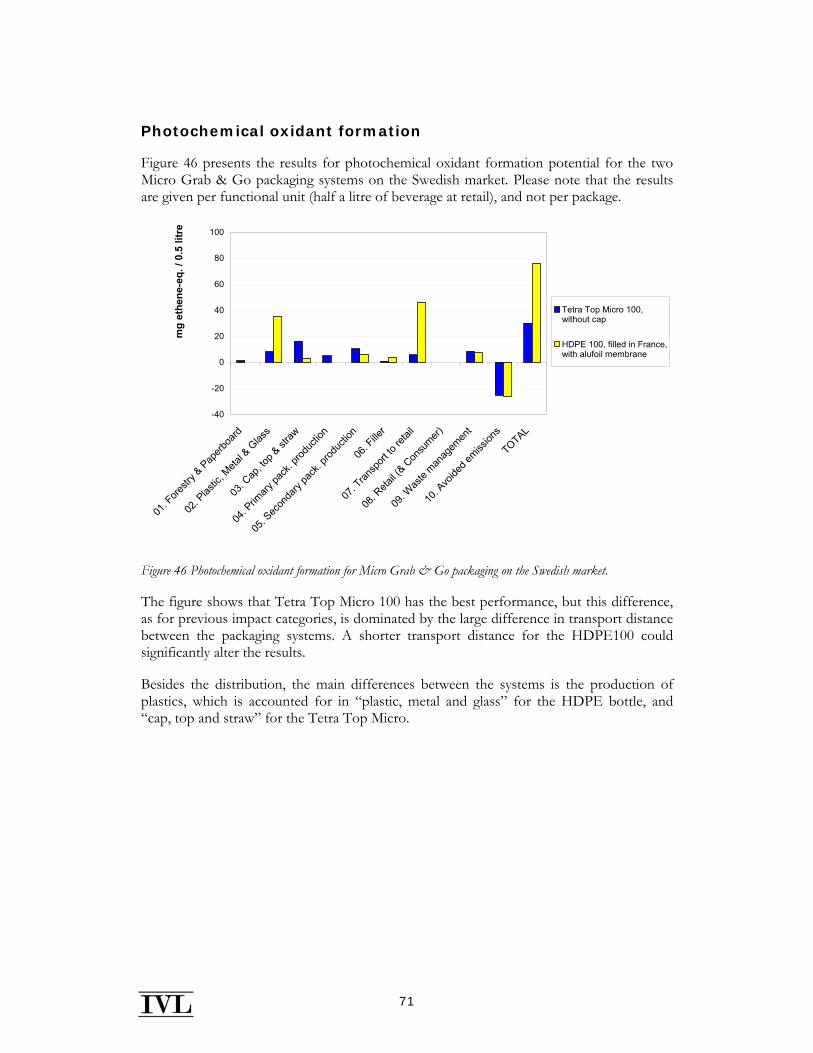
71
Photochemical oxidant formation
Figure 46 presents the results for photochemical oxidant formation potential for the two Micro Grab & Go packaging systems on the Swedish market. Please note that the results are given per functional unit (half a litre of beverage at retail), and not per package.
-40
-20
0
20
40
60
80
100
01. F
orestr
y & Pap
erboa
rd
02. P
lastic
, Meta
l & G
lass
03. C
ap, to
p & st
raw
04. P
rimary
pack
. prod
uctio
n
05. S
econ
dary
pack
. prod
uctio
n
06. F
iller
07. T
ransp
ort to
retai
l
08. R
etail (
& Con
sumer)
09. W
aste
manag
emen
t
10. A
voide
d emiss
ions
TOTAL
mg
ethe
ne-e
q. /
0.5
litre
Tetra Top Micro 100,without cap
HDPE 100, filled in France,with alufoil membrane
Figure 46 Photochemical oxidant formation for Micro Grab & Go packaging on the Swedish market.
The figure shows that Tetra Top Micro 100 has the best performance, but this difference, as for previous impact categories, is dominated by the large difference in transport distance between the packaging systems. A shorter transport distance for the HDPE100 could significantly alter the results.
Besides the distribution, the main differences between the systems is the production of plastics, which is accounted for in “plastic, metal and glass” for the HDPE bottle, and “cap, top and straw” for the Tetra Top Micro.
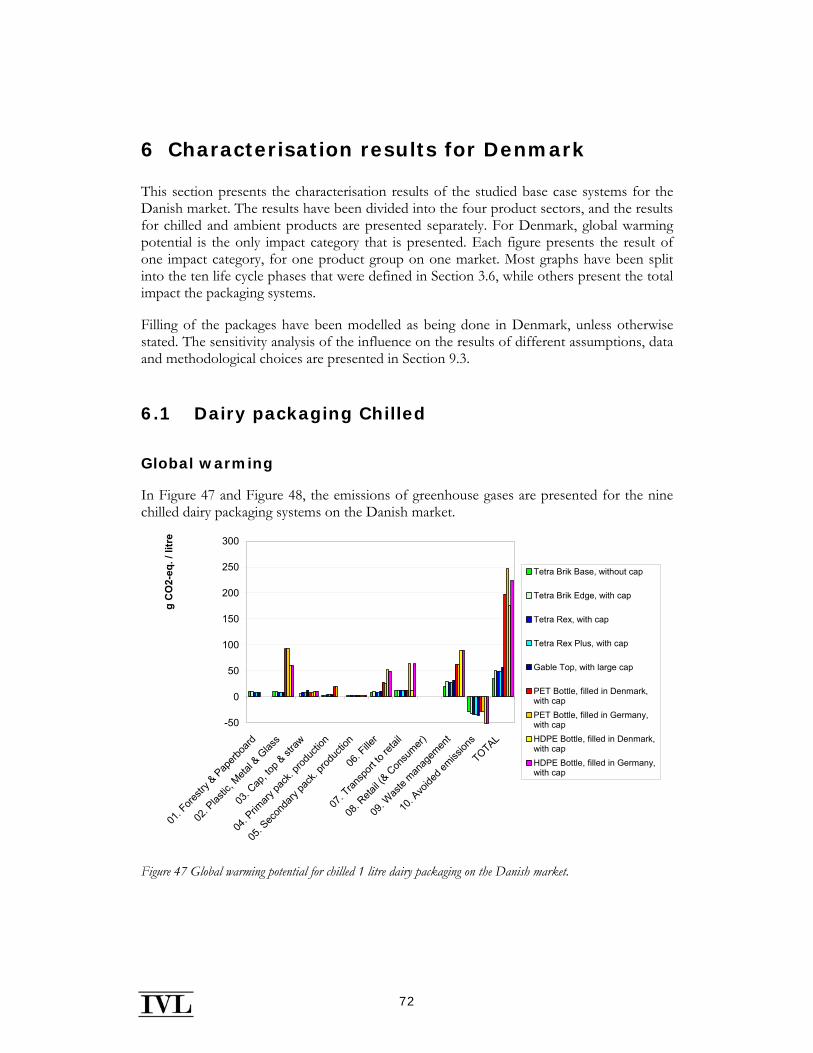
72
6 Characterisation results for Denmark
This section presents the characterisation results of the studied base case systems for the Danish market. The results have been divided into the four product sectors, and the results for chilled and ambient products are presented separately. For Denmark, global warming potential is the only impact category that is presented. Each figure presents the result of one impact category, for one product group on one market. Most graphs have been split into the ten life cycle phases that were defined in Section 3.6, while others present the total impact the packaging systems.
Filling of the packages have been modelled as being done in Denmark, unless otherwise stated. The sensitivity analysis of the influence on the results of different assumptions, data and methodological choices are presented in Section 9.3.
6.1 Dairy packaging Chilled
Global warming
In Figure 47 and Figure 48, the emissions of greenhouse gases are presented for the nine chilled dairy packaging systems on the Danish market.
-50
0
50
100
150
200
250
300
01. F
orestr
y & Pap
erboa
rd
02. P
lastic
, Meta
l & G
lass
03. C
ap, to
p & st
raw
04. P
rimary
pack
. prod
uctio
n
05. S
econ
dary
pack
. prod
uctio
n
06. F
iller
07. T
ransp
ort to
retai
l
08. R
etail (
& Con
sumer)
09. W
aste
manag
emen
t
10. A
voide
d emiss
ions
TOTAL
g C
O2-
eq. /
litr
e
Tetra Brik Base, without cap
Tetra Brik Edge, with cap
Tetra Rex, with cap
Tetra Rex Plus, with cap
Gable Top, with large cap
PET Bottle, filled in Denmark, with capPET Bottle, filled in Germany, with capHDPE Bottle, filled in Denmark, with capHDPE Bottle, filled in Germany,with cap
Figure 47 Global warming potential for chilled 1 litre dairy packaging on the Danish market.
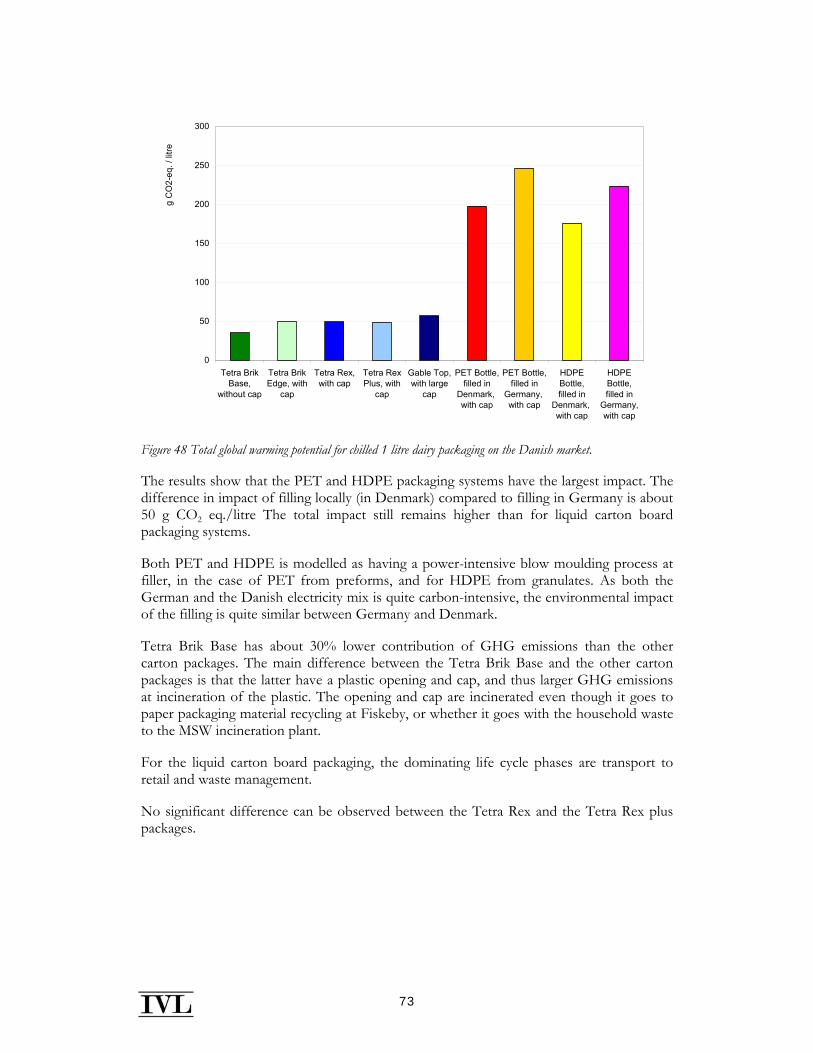
73
0
50
100
150
200
250
300
Tetra BrikBase,
without cap
Tetra BrikEdge, with
cap
Tetra Rex,with cap
Tetra RexPlus, with
cap
Gable Top,with large
cap
PET Bottle,filled in
Denmark, with cap
PET Bottle,filled in
Germany, with cap
HDPEBottle,filled in
Denmark, with cap
HDPEBottle,filled in
Germany,with cap
g C
O2-
eq. /
litre
Figure 48 Total global warming potential for chilled 1 litre dairy packaging on the Danish market.
The results show that the PET and HDPE packaging systems have the largest impact. The difference in impact of filling locally (in Denmark) compared to filling in Germany is about 50 g CO2 eq./litre The total impact still remains higher than for liquid carton board packaging systems.
Both PET and HDPE is modelled as having a power-intensive blow moulding process at filler, in the case of PET from preforms, and for HDPE from granulates. As both the German and the Danish electricity mix is quite carbon-intensive, the environmental impact of the filling is quite similar between Germany and Denmark.
Tetra Brik Base has about 30% lower contribution of GHG emissions than the other carton packages. The main difference between the Tetra Brik Base and the other carton packages is that the latter have a plastic opening and cap, and thus larger GHG emissions at incineration of the plastic. The opening and cap are incinerated even though it goes to paper packaging material recycling at Fiskeby, or whether it goes with the household waste to the MSW incineration plant.
For the liquid carton board packaging, the dominating life cycle phases are transport to retail and waste management.
No significant difference can be observed between the Tetra Rex and the Tetra Rex plus packages.
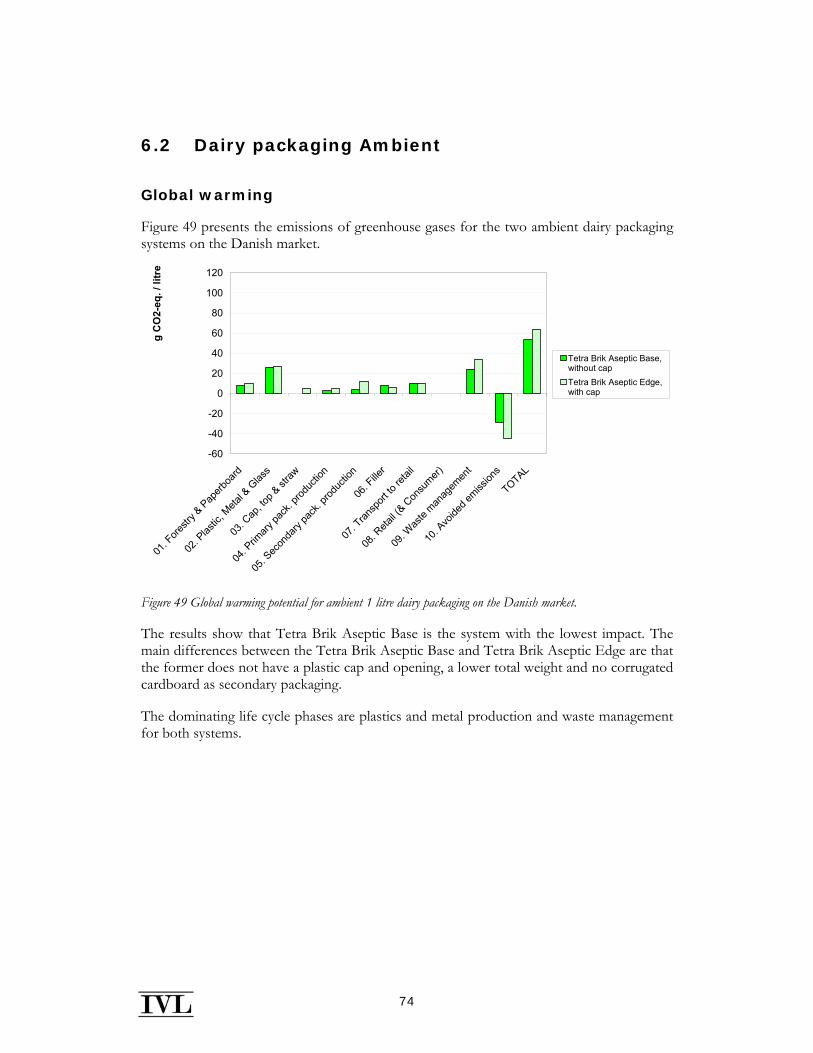
74
6.2 Dairy packaging Ambient
Global warming
Figure 49 presents the emissions of greenhouse gases for the two ambient dairy packaging systems on the Danish market.
-60
-40
-20
0
20
40
60
80
100
120
01. F
orestr
y & Pap
erboa
rd
02. P
lastic
, Meta
l & G
lass
03. C
ap, to
p & st
raw
04. P
rimary
pack
. prod
uctio
n
05. S
econ
dary
pack
. prod
uctio
n
06. F
iller
07. T
ransp
ort to
retai
l
08. R
etail (
& Con
sumer)
09. W
aste
manag
emen
t
10. A
voide
d emiss
ions
TOTAL
g C
O2-
eq. /
litr
e
Tetra Brik Aseptic Base,without capTetra Brik Aseptic Edge,with cap
Figure 49 Global warming potential for ambient 1 litre dairy packaging on the Danish market.
The results show that Tetra Brik Aseptic Base is the system with the lowest impact. The main differences between the Tetra Brik Aseptic Base and Tetra Brik Aseptic Edge are that the former does not have a plastic cap and opening, a lower total weight and no corrugated cardboard as secondary packaging.
The dominating life cycle phases are plastics and metal production and waste management for both systems.
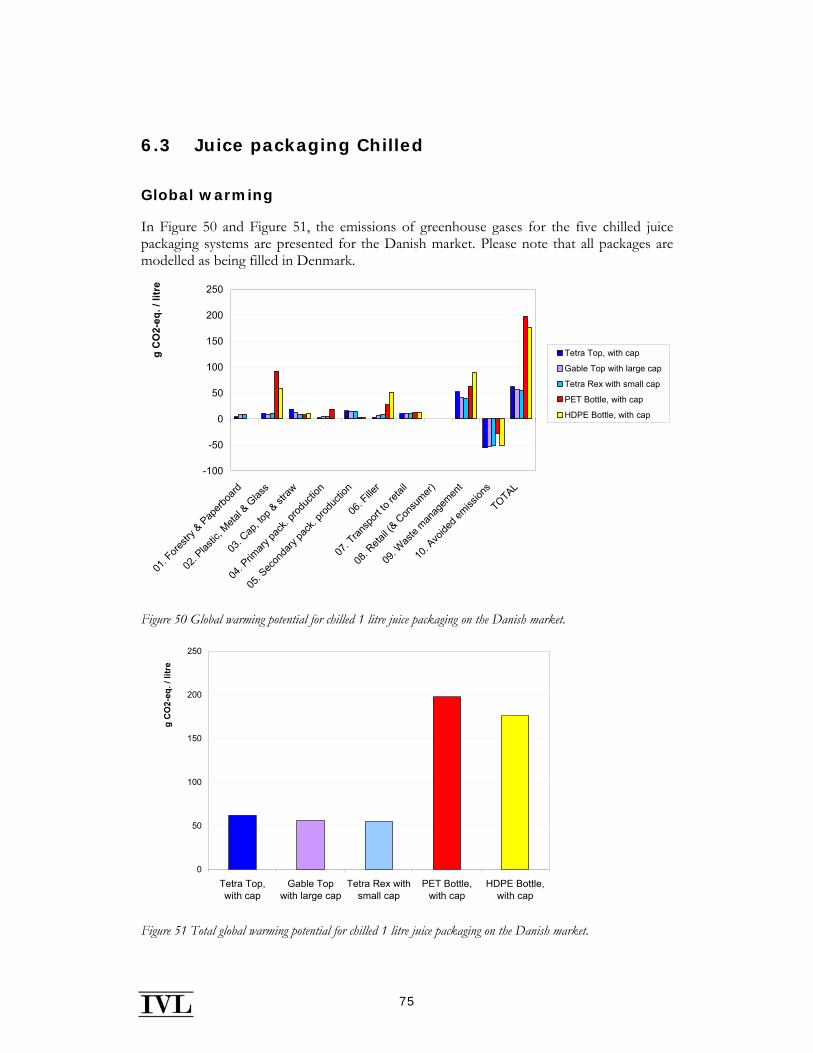
75
6.3 Juice packaging Chilled
Global warming
In Figure 50 and Figure 51, the emissions of greenhouse gases for the five chilled juice packaging systems are presented for the Danish market. Please note that all packages are modelled as being filled in Denmark.
-100
-50
0
50
100
150
200
250
01. F
orestr
y & Pap
erboa
rd
02. P
lastic
, Meta
l & G
lass
03. C
ap, to
p & st
raw
04. P
rimary
pack
. prod
uctio
n
05. S
econ
dary
pack
. prod
uctio
n
06. F
iller
07. T
ransp
ort to
retai
l
08. R
etail (
& Con
sumer)
09. W
aste
manag
emen
t
10. A
voide
d emiss
ions
TOTAL
g C
O2-
eq. /
litr
e
Tetra Top, with cap
Gable Top with large cap
Tetra Rex with small cap
PET Bottle, with cap
HDPE Bottle, with cap
Figure 50 Global warming potential for chilled 1 litre juice packaging on the Danish market.
0
50
100
150
200
250
Tetra Top,with cap
Gable Topwith large cap
Tetra Rex withsmall cap
PET Bottle,with cap
HDPE Bottle,with cap
g C
O2-
eq. /
litr
e
Figure 51 Total global warming potential for chilled 1 litre juice packaging on the Danish market.
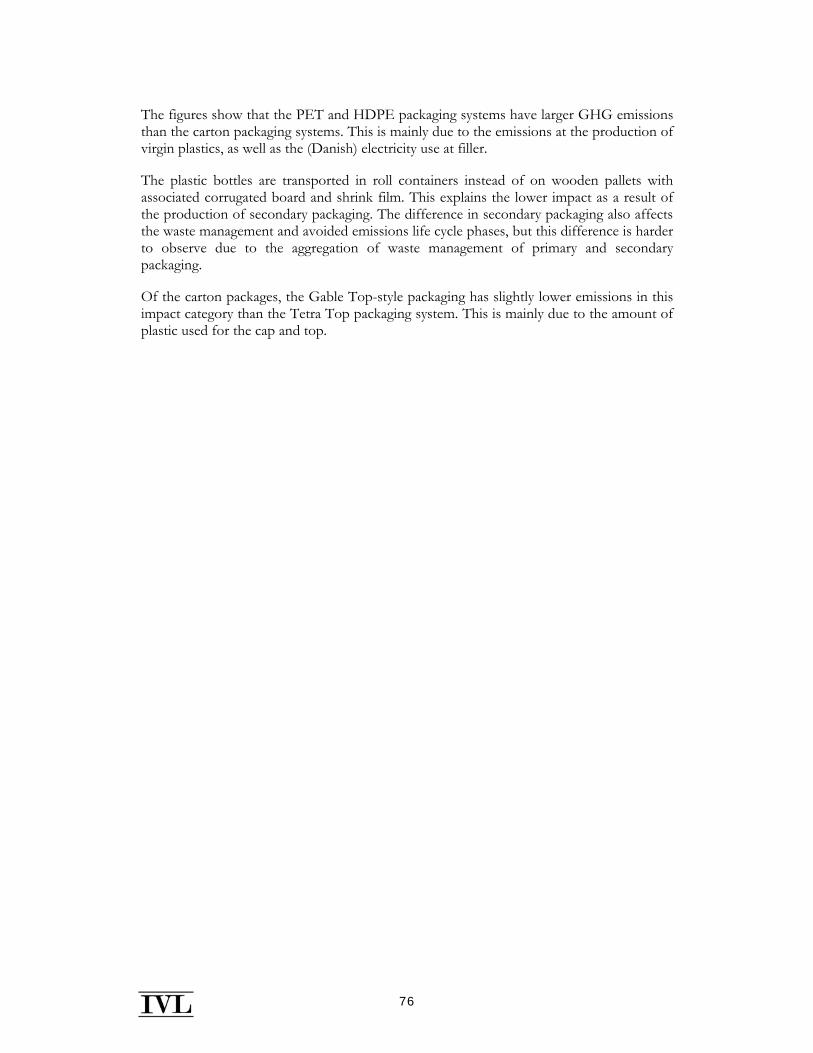
76
The figures show that the PET and HDPE packaging systems have larger GHG emissions than the carton packaging systems. This is mainly due to the emissions at the production of virgin plastics, as well as the (Danish) electricity use at filler.
The plastic bottles are transported in roll containers instead of on wooden pallets with associated corrugated board and shrink film. This explains the lower impact as a result of the production of secondary packaging. The difference in secondary packaging also affects the waste management and avoided emissions life cycle phases, but this difference is harder to observe due to the aggregation of waste management of primary and secondary packaging.
Of the carton packages, the Gable Top-style packaging has slightly lower emissions in this impact category than the Tetra Top packaging system. This is mainly due to the amount of plastic used for the cap and top.
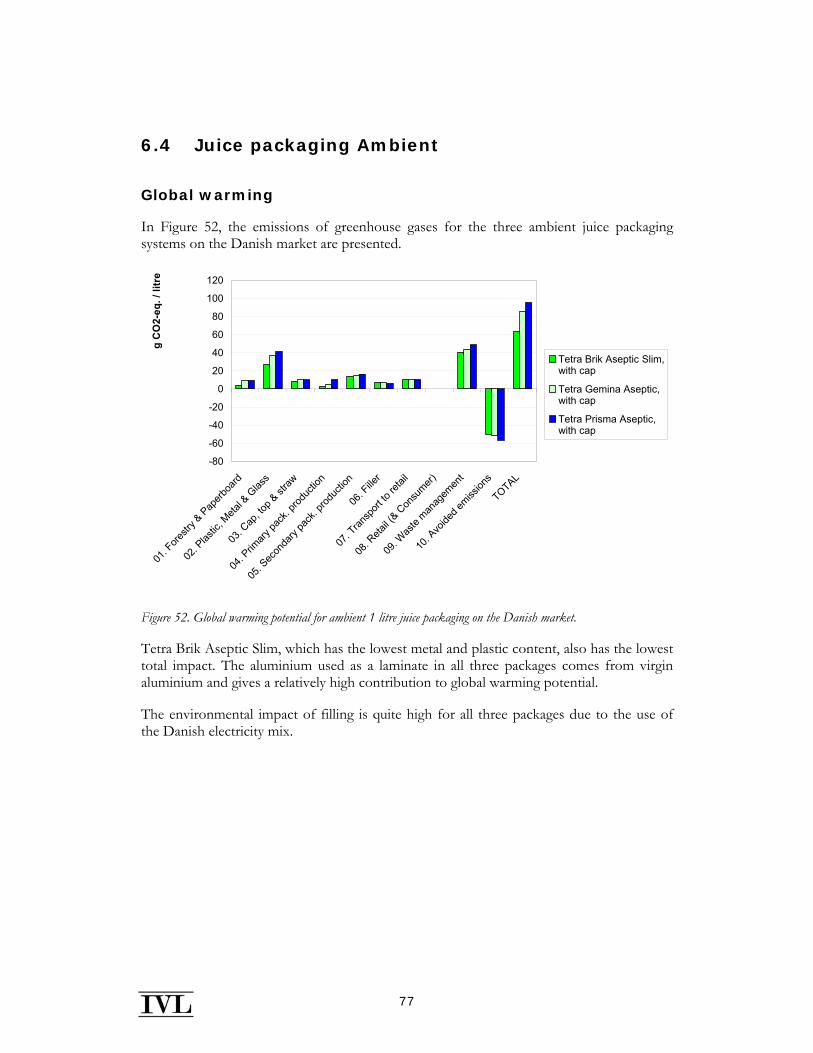
77
6.4 Juice packaging Ambient
Global warming
In Figure 52, the emissions of greenhouse gases for the three ambient juice packaging systems on the Danish market are presented.
-80
-60
-40
-20
0
20
40
60
80
100
120
01. F
orestr
y & Pap
erboa
rd
02. P
lastic
, Meta
l & G
lass
03. C
ap, to
p & st
raw
04. P
rimary
pack
. prod
uctio
n
05. S
econ
dary
pack
. prod
uctio
n
06. F
iller
07. T
ransp
ort to
retai
l
08. R
etail (
& Con
sumer)
09. W
aste
manag
emen
t
10. A
voide
d emiss
ions
TOTAL
g C
O2-
eq. /
litr
e
Tetra Brik Aseptic Slim,with cap
Tetra Gemina Aseptic,with cap
Tetra Prisma Aseptic,with cap
Figure 52. Global warming potential for ambient 1 litre juice packaging on the Danish market.
Tetra Brik Aseptic Slim, which has the lowest metal and plastic content, also has the lowest total impact. The aluminium used as a laminate in all three packages comes from virgin aluminium and gives a relatively high contribution to global warming potential.
The environmental impact of filling is quite high for all three packages due to the use of the Danish electricity mix.
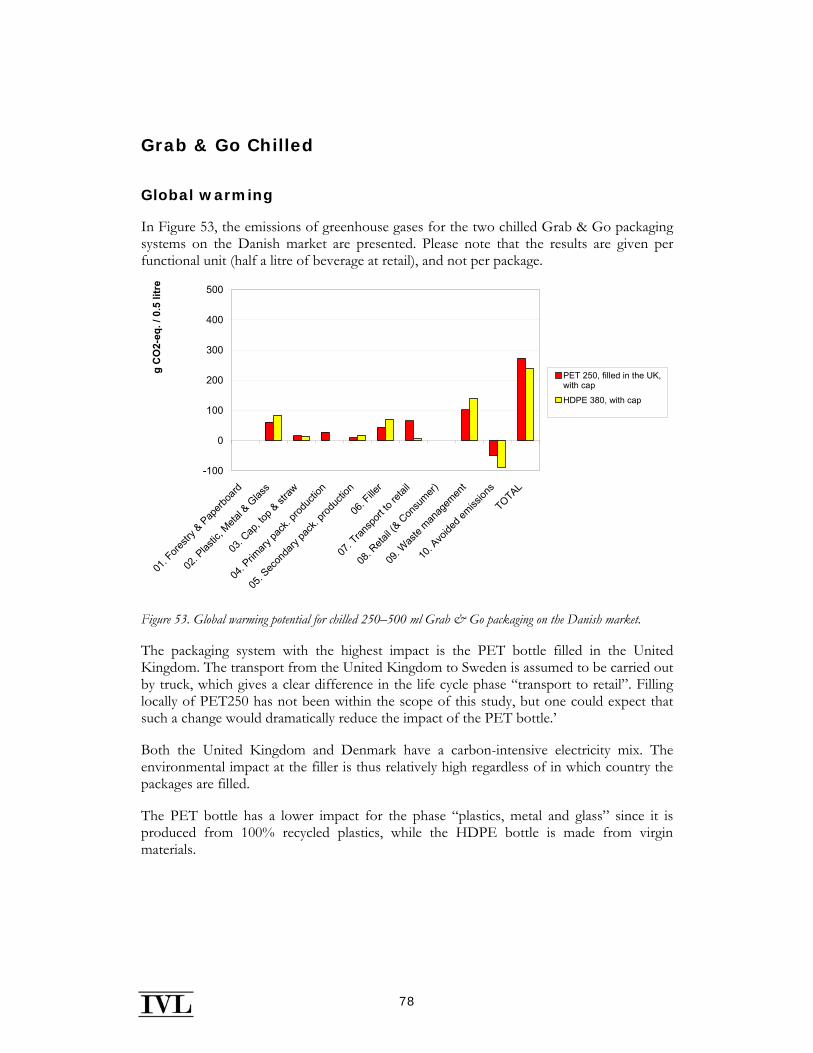
78
Grab & Go Chilled
Global warming
In Figure 53, the emissions of greenhouse gases for the two chilled Grab & Go packaging systems on the Danish market are presented. Please note that the results are given per functional unit (half a litre of beverage at retail), and not per package.
-100
0
100
200
300
400
500
01. F
orestr
y & Pap
erboa
rd
02. P
lastic
, Meta
l & G
lass
03. C
ap, to
p & st
raw
04. P
rimary
pack
. prod
uctio
n
05. S
econ
dary
pack
. prod
uctio
n
06. F
iller
07. T
ransp
ort to
retai
l
08. R
etail (
& Con
sumer)
09. W
aste
manag
emen
t
10. A
voide
d emiss
ions
TOTAL
g C
O2-
eq. /
0.5
litr
e
PET 250, filled in the UK,with cap
HDPE 380, with cap
Figure 53. Global warming potential for chilled 250–500 ml Grab & Go packaging on the Danish market.
The packaging system with the highest impact is the PET bottle filled in the United Kingdom. The transport from the United Kingdom to Sweden is assumed to be carried out by truck, which gives a clear difference in the life cycle phase “transport to retail”. Filling locally of PET250 has not been within the scope of this study, but one could expect that such a change would dramatically reduce the impact of the PET bottle.’
Both the United Kingdom and Denmark have a carbon-intensive electricity mix. The environmental impact at the filler is thus relatively high regardless of in which country the packages are filled.
The PET bottle has a lower impact for the phase “plastics, metal and glass” since it is produced from 100% recycled plastics, while the HDPE bottle is made from virgin materials.
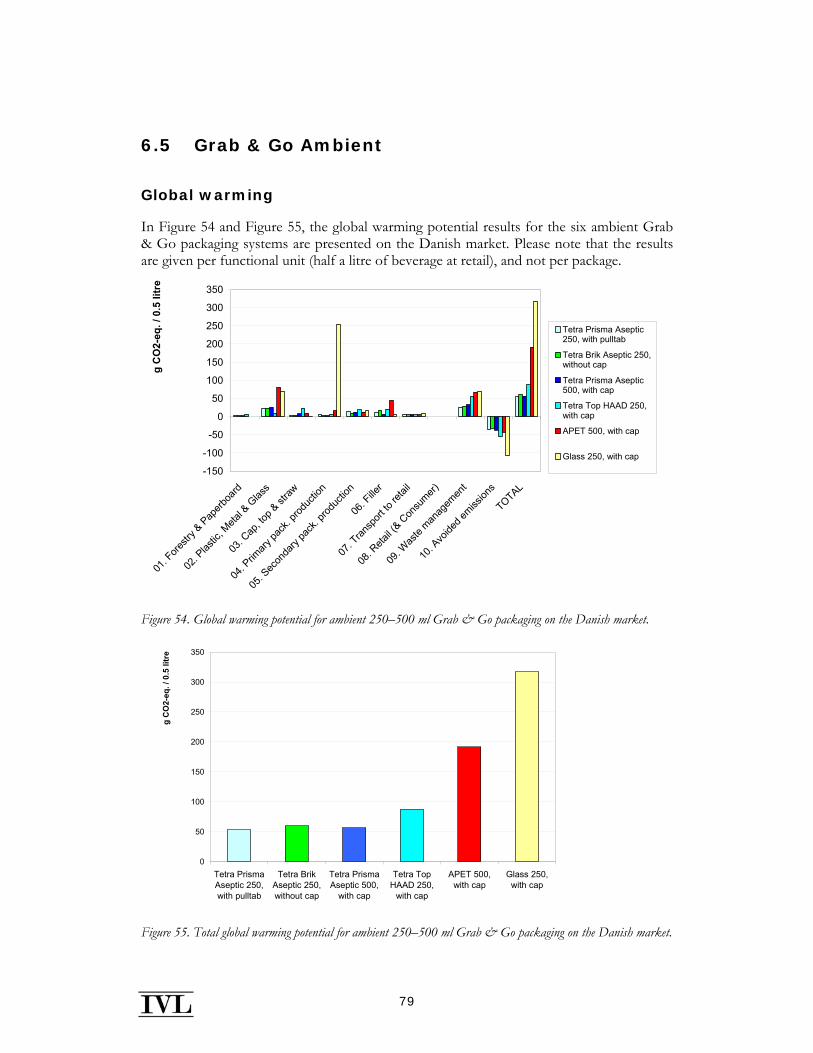
79
6.5 Grab & Go Ambient
Global warming
In Figure 54 and Figure 55, the global warming potential results for the six ambient Grab & Go packaging systems are presented on the Danish market. Please note that the results are given per functional unit (half a litre of beverage at retail), and not per package.
-150
-100
-50
0
50
100
150
200
250
300
350
01. F
orestr
y & Pap
erboa
rd
02. P
lastic
, Meta
l & G
lass
03. C
ap, to
p & st
raw
04. P
rimary
pack
. prod
uctio
n
05. S
econ
dary
pack
. prod
uctio
n
06. F
iller
07. T
ransp
ort to
retai
l
08. R
etail (
& Con
sumer)
09. W
aste
manag
emen
t
10. A
voide
d emiss
ions
TOTAL
g C
O2-
eq. /
0.5
litr
e
Tetra Prisma Aseptic250, with pulltab
Tetra Brik Aseptic 250,without cap
Tetra Prisma Aseptic500, with cap
Tetra Top HAAD 250,with cap
APET 500, with cap
Glass 250, with cap
Figure 54. Global warming potential for ambient 250–500 ml Grab & Go packaging on the Danish market.
0
50
100
150
200
250
300
350
Tetra PrismaAseptic 250,with pulltab
Tetra BrikAseptic 250,without cap
Tetra PrismaAseptic 500,
with cap
Tetra TopHAAD 250,
with cap
APET 500,with cap
Glass 250,with cap
g C
O2-
eq. /
0.5
litr
e
Figure 55. Total global warming potential for ambient 250–500 ml Grab & Go packaging on the Danish market.
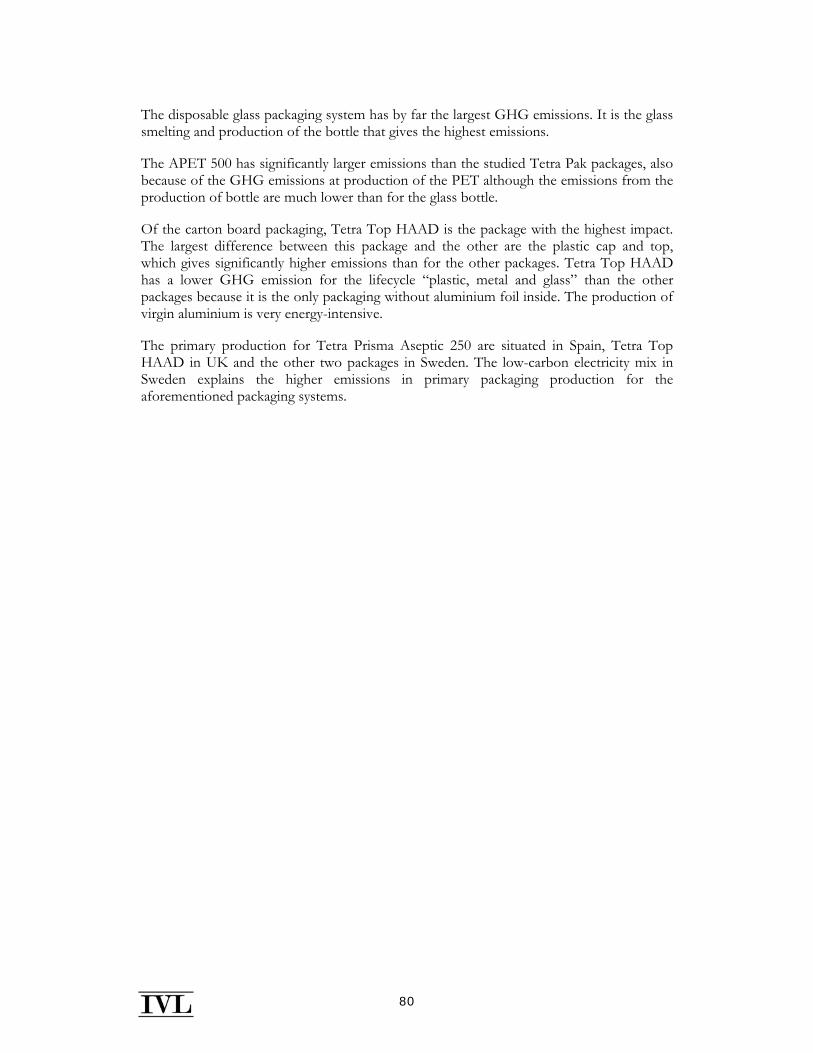
80
The disposable glass packaging system has by far the largest GHG emissions. It is the glass smelting and production of the bottle that gives the highest emissions.
The APET 500 has significantly larger emissions than the studied Tetra Pak packages, also because of the GHG emissions at production of the PET although the emissions from the production of bottle are much lower than for the glass bottle.
Of the carton board packaging, Tetra Top HAAD is the package with the highest impact. The largest difference between this package and the other are the plastic cap and top, which gives significantly higher emissions than for the other packages. Tetra Top HAAD has a lower GHG emission for the lifecycle “plastic, metal and glass” than the other packages because it is the only packaging without aluminium foil inside. The production of virgin aluminium is very energy-intensive.
The primary production for Tetra Prisma Aseptic 250 are situated in Spain, Tetra Top HAAD in UK and the other two packages in Sweden. The low-carbon electricity mix in Sweden explains the higher emissions in primary packaging production for the aforementioned packaging systems.
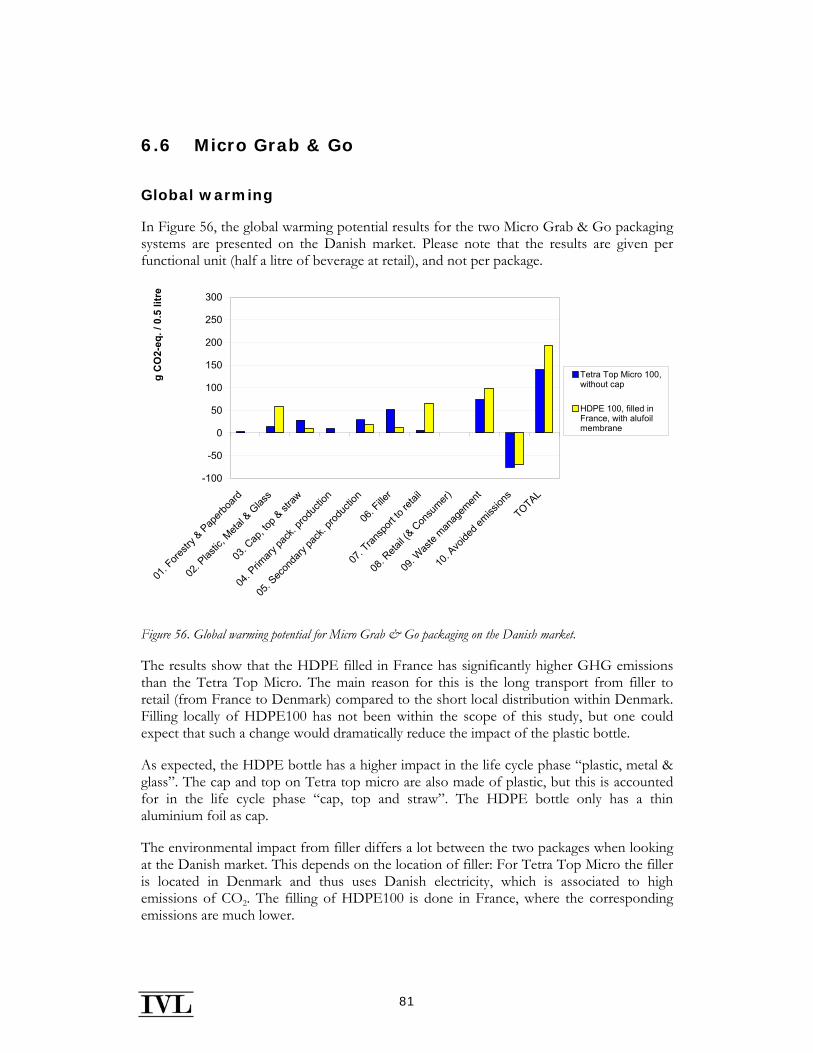
81
6.6 Micro Grab & Go
Global warming
In Figure 56, the global warming potential results for the two Micro Grab & Go packaging systems are presented on the Danish market. Please note that the results are given per functional unit (half a litre of beverage at retail), and not per package.
-100
-50
0
50
100
150
200
250
300
01. F
orestr
y & Pap
erboa
rd
02. P
lastic
, Meta
l & G
lass
03. C
ap, to
p & st
raw
04. P
rimary
pack
. prod
uctio
n
05. S
econ
dary
pack
. prod
uctio
n
06. F
iller
07. T
ransp
ort to
retai
l
08. R
etail (
& Con
sumer)
09. W
aste
manag
emen
t
10. A
voide
d emiss
ions
TOTAL
g C
O2-
eq. /
0.5
litr
e
Tetra Top Micro 100,without cap
HDPE 100, filled inFrance, with alufoilmembrane
Figure 56. Global warming potential for Micro Grab & Go packaging on the Danish market.
The results show that the HDPE filled in France has significantly higher GHG emissions than the Tetra Top Micro. The main reason for this is the long transport from filler to retail (from France to Denmark) compared to the short local distribution within Denmark. Filling locally of HDPE100 has not been within the scope of this study, but one could expect that such a change would dramatically reduce the impact of the plastic bottle.
As expected, the HDPE bottle has a higher impact in the life cycle phase “plastic, metal & glass”. The cap and top on Tetra top micro are also made of plastic, but this is accounted for in the life cycle phase “cap, top and straw”. The HDPE bottle only has a thin aluminium foil as cap.
The environmental impact from filler differs a lot between the two packages when looking at the Danish market. This depends on the location of filler: For Tetra Top Micro the filler is located in Denmark and thus uses Danish electricity, which is associated to high emissions of CO2. The filling of HDPE100 is done in France, where the corresponding emissions are much lower.
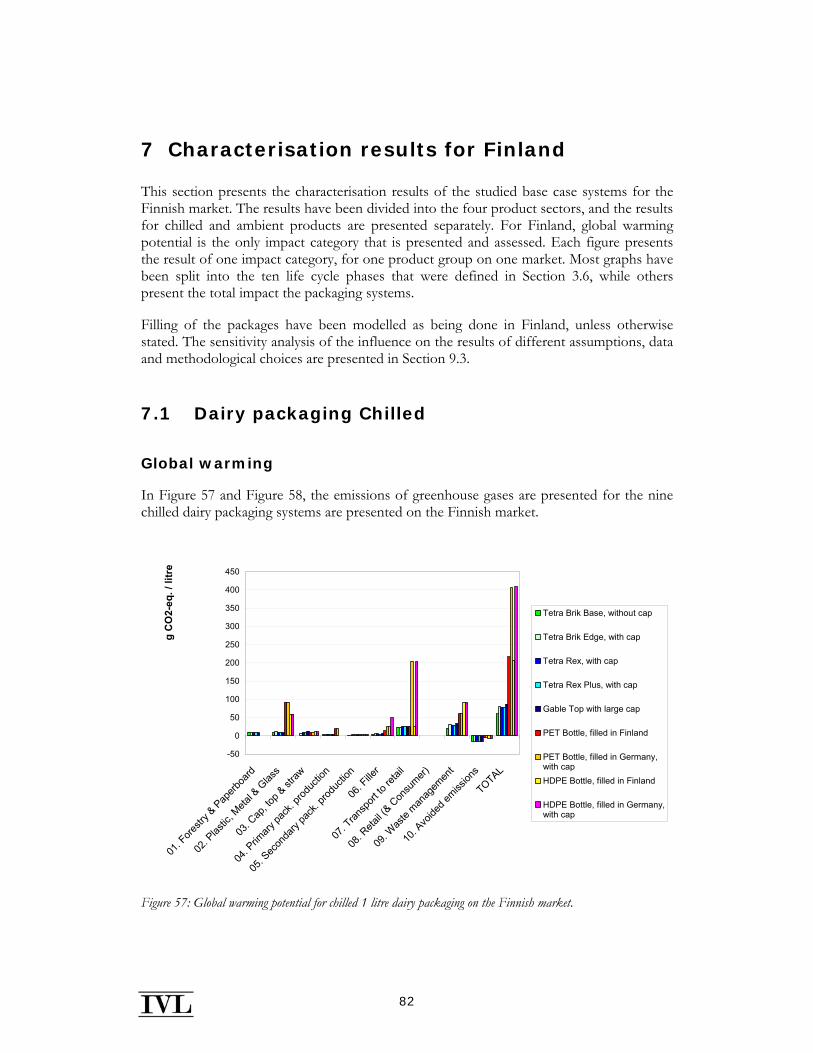
82
7 Characterisation results for Finland
This section presents the characterisation results of the studied base case systems for the Finnish market. The results have been divided into the four product sectors, and the results for chilled and ambient products are presented separately. For Finland, global warming potential is the only impact category that is presented and assessed. Each figure presents the result of one impact category, for one product group on one market. Most graphs have been split into the ten life cycle phases that were defined in Section 3.6, while others present the total impact the packaging systems.
Filling of the packages have been modelled as being done in Finland, unless otherwise stated. The sensitivity analysis of the influence on the results of different assumptions, data and methodological choices are presented in Section 9.3.
7.1 Dairy packaging Chilled
Global warming
In Figure 57 and Figure 58, the emissions of greenhouse gases are presented for the nine chilled dairy packaging systems are presented on the Finnish market.
-50
0
50
100
150
200
250
300
350
400
450
01. F
orestr
y & Pap
erboa
rd
02. P
lastic
, Meta
l & G
lass
03. C
ap, to
p & st
raw
04. P
rimary
pack
. prod
uctio
n
05. S
econ
dary
pack
. prod
uctio
n
06. F
iller
07. T
ransp
ort to
retai
l
08. R
etail (
& Con
sumer)
09. W
aste
manag
emen
t
10. A
voide
d emiss
ions
TOTAL
g C
O2-
eq. /
litr
e
Tetra Brik Base, without cap
Tetra Brik Edge, with cap
Tetra Rex, with cap
Tetra Rex Plus, with cap
Gable Top with large cap
PET Bottle, filled in Finland
PET Bottle, filled in Germany,with capHDPE Bottle, filled in Finland
HDPE Bottle, filled in Germany,with cap
Figure 57: Global warming potential for chilled 1 litre dairy packaging on the Finnish market.
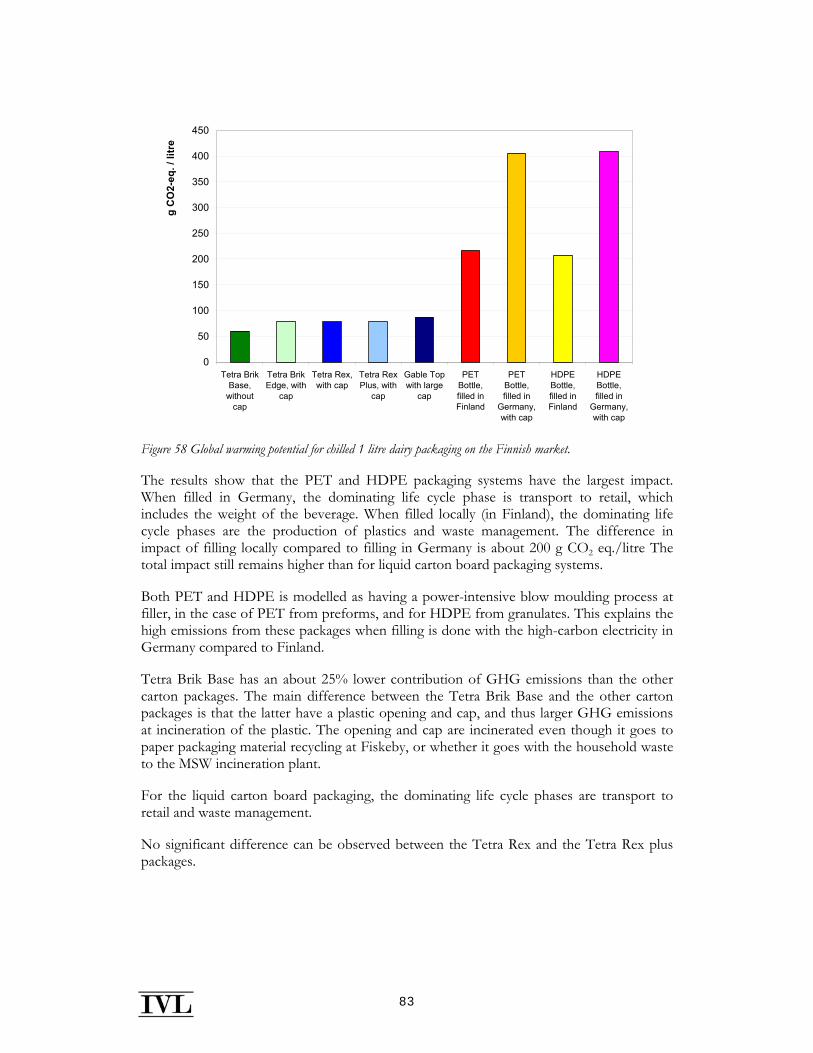
83
0
50
100
150
200
250
300
350
400
450
Tetra BrikBase,
withoutcap
Tetra BrikEdge, with
cap
Tetra Rex,with cap
Tetra RexPlus, with
cap
Gable Topwith large
cap
PETBottle,filled inFinland
PETBottle,filled in
Germany,with cap
HDPEBottle,filled inFinland
HDPEBottle,filled in
Germany,with cap
g C
O2-
eq. /
litr
e
Figure 58 Global warming potential for chilled 1 litre dairy packaging on the Finnish market.
The results show that the PET and HDPE packaging systems have the largest impact. When filled in Germany, the dominating life cycle phase is transport to retail, which includes the weight of the beverage. When filled locally (in Finland), the dominating life cycle phases are the production of plastics and waste management. The difference in impact of filling locally compared to filling in Germany is about 200 g CO2 eq./litre The total impact still remains higher than for liquid carton board packaging systems.
Both PET and HDPE is modelled as having a power-intensive blow moulding process at filler, in the case of PET from preforms, and for HDPE from granulates. This explains the high emissions from these packages when filling is done with the high-carbon electricity in Germany compared to Finland.
Tetra Brik Base has an about 25% lower contribution of GHG emissions than the other carton packages. The main difference between the Tetra Brik Base and the other carton packages is that the latter have a plastic opening and cap, and thus larger GHG emissions at incineration of the plastic. The opening and cap are incinerated even though it goes to paper packaging material recycling at Fiskeby, or whether it goes with the household waste to the MSW incineration plant.
For the liquid carton board packaging, the dominating life cycle phases are transport to retail and waste management.
No significant difference can be observed between the Tetra Rex and the Tetra Rex plus packages.
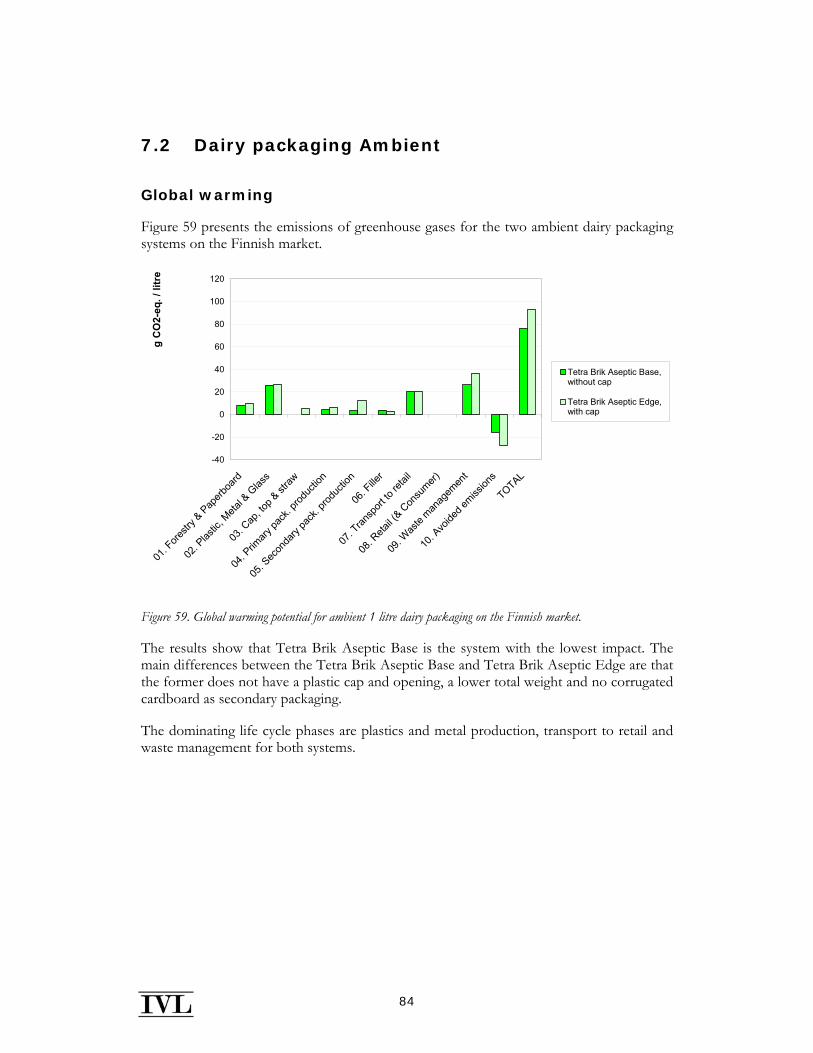
84
7.2 Dairy packaging Ambient
Global warming
Figure 59 presents the emissions of greenhouse gases for the two ambient dairy packaging systems on the Finnish market.
-40
-20
0
20
40
60
80
100
120
01. F
orestr
y & Pap
erboa
rd
02. P
lastic
, Meta
l & G
lass
03. C
ap, to
p & st
raw
04. P
rimary
pack
. prod
uctio
n
05. S
econ
dary
pack
. prod
uctio
n
06. F
iller
07. T
ransp
ort to
retai
l
08. R
etail (
& Con
sumer)
09. W
aste
manag
emen
t
10. A
voide
d emiss
ions
TOTAL
g C
O2-
eq. /
litr
e
Tetra Brik Aseptic Base,without cap
Tetra Brik Aseptic Edge,with cap
Figure 59. Global warming potential for ambient 1 litre dairy packaging on the Finnish market.
The results show that Tetra Brik Aseptic Base is the system with the lowest impact. The main differences between the Tetra Brik Aseptic Base and Tetra Brik Aseptic Edge are that the former does not have a plastic cap and opening, a lower total weight and no corrugated cardboard as secondary packaging.
The dominating life cycle phases are plastics and metal production, transport to retail and waste management for both systems.
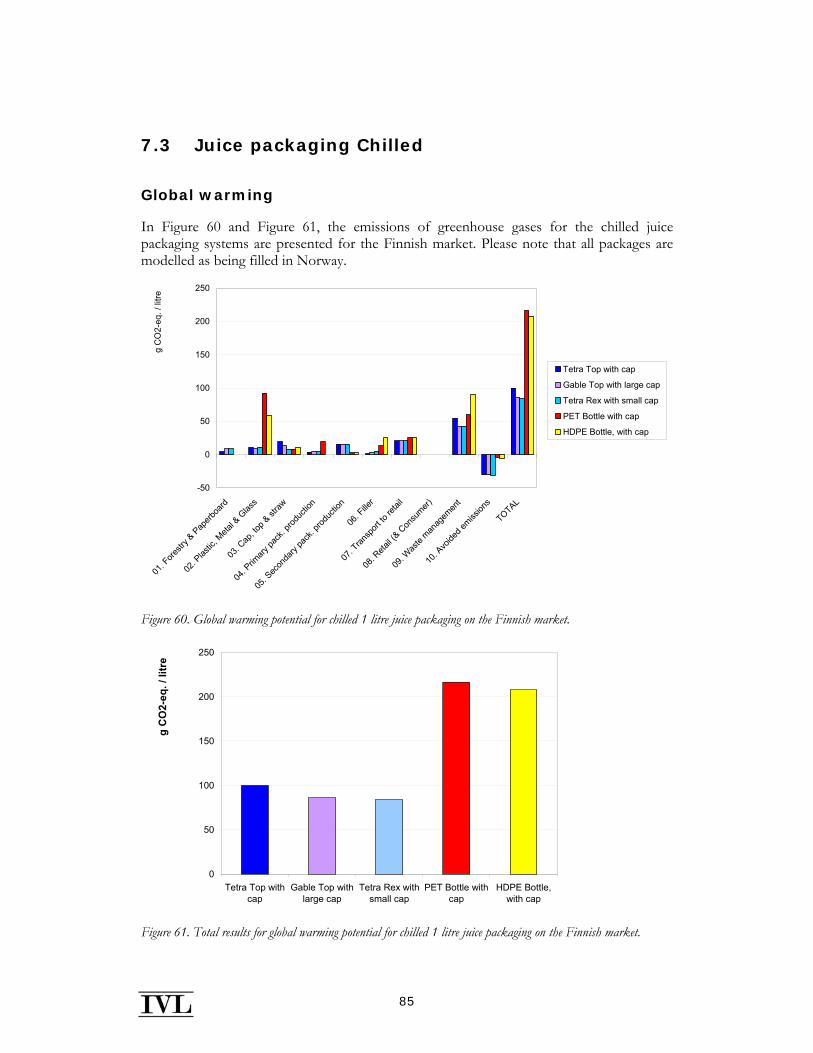
85
7.3 Juice packaging Chilled
Global warming
In Figure 60 and Figure 61, the emissions of greenhouse gases for the chilled juice packaging systems are presented for the Finnish market. Please note that all packages are modelled as being filled in Norway.
-50
0
50
100
150
200
250
01. F
orestr
y & P
aperb
oard
02. P
lastic
, Meta
l & G
lass
03. C
ap, to
p & st
raw
04. P
rimary
pack
. prod
uctio
n
05. S
econ
dary
pack
. prod
uctio
n
06. F
iller
07. T
ransp
ort to
retai
l
08. R
etail (
& Con
sumer)
09. W
aste
manag
emen
t
10. A
voide
d emiss
ions
TOTAL
g C
O2-
eq. /
litre
Tetra Top with cap
Gable Top with large cap
Tetra Rex with small cap
PET Bottle with cap
HDPE Bottle, with cap
Figure 60. Global warming potential for chilled 1 litre juice packaging on the Finnish market.
0
50
100
150
200
250
Tetra Top withcap
Gable Top withlarge cap
Tetra Rex withsmall cap
PET Bottle withcap
HDPE Bottle,with cap
g C
O2-
eq. /
litr
e
Figure 61. Total results for global warming potential for chilled 1 litre juice packaging on the Finnish market.
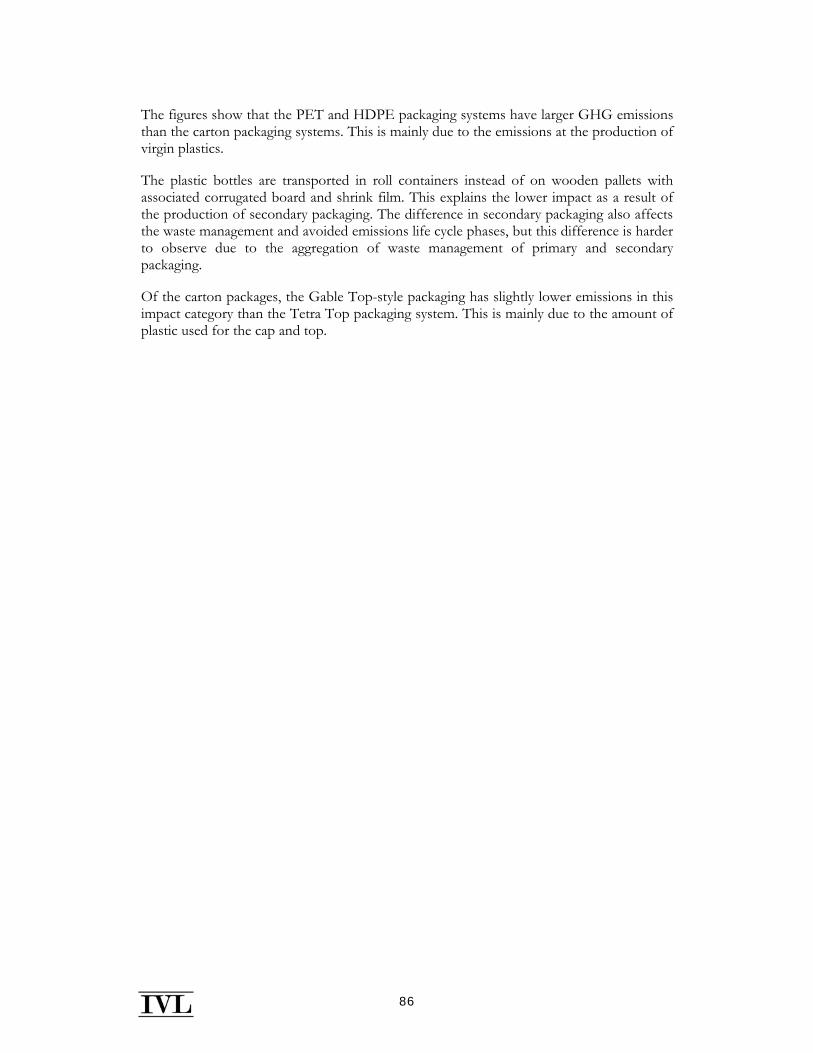
86
The figures show that the PET and HDPE packaging systems have larger GHG emissions than the carton packaging systems. This is mainly due to the emissions at the production of virgin plastics.
The plastic bottles are transported in roll containers instead of on wooden pallets with associated corrugated board and shrink film. This explains the lower impact as a result of the production of secondary packaging. The difference in secondary packaging also affects the waste management and avoided emissions life cycle phases, but this difference is harder to observe due to the aggregation of waste management of primary and secondary packaging.
Of the carton packages, the Gable Top-style packaging has slightly lower emissions in this impact category than the Tetra Top packaging system. This is mainly due to the amount of plastic used for the cap and top.
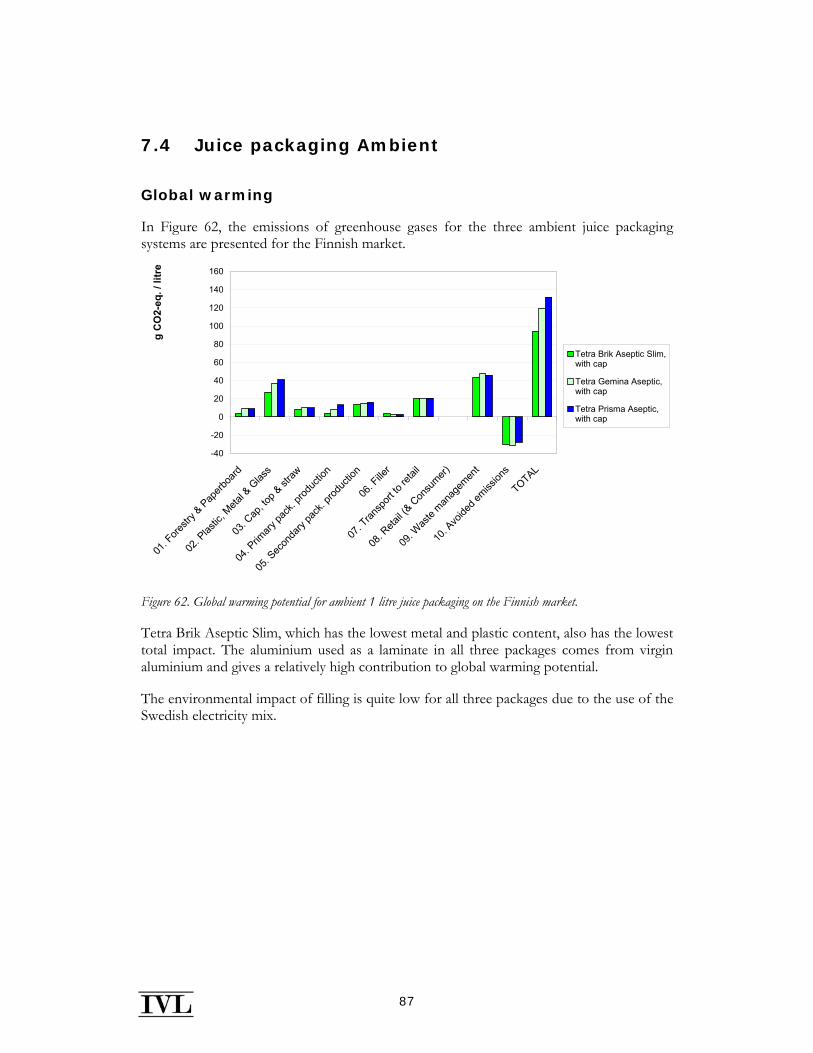
87
7.4 Juice packaging Ambient
Global warming
In Figure 62, the emissions of greenhouse gases for the three ambient juice packaging systems are presented for the Finnish market.
-40
-20
0
20
40
60
80
100
120
140
160
01. F
orestr
y & P
aperb
oard
02. P
lastic
, Meta
l & G
lass
03. C
ap, to
p & st
raw
04. P
rimary
pack
. prod
uctio
n
05. S
econ
dary
pack
. prod
uctio
n
06. F
iller
07. T
ransp
ort to
retai
l
08. R
etail (
& Con
sumer)
09. W
aste
manag
emen
t
10. A
voide
d emiss
ions
TOTAL
g C
O2-
eq. /
litr
e
Tetra Brik Aseptic Slim,with cap
Tetra Gemina Aseptic,with cap
Tetra Prisma Aseptic,with cap
Figure 62. Global warming potential for ambient 1 litre juice packaging on the Finnish market.
Tetra Brik Aseptic Slim, which has the lowest metal and plastic content, also has the lowest total impact. The aluminium used as a laminate in all three packages comes from virgin aluminium and gives a relatively high contribution to global warming potential.
The environmental impact of filling is quite low for all three packages due to the use of the Swedish electricity mix.
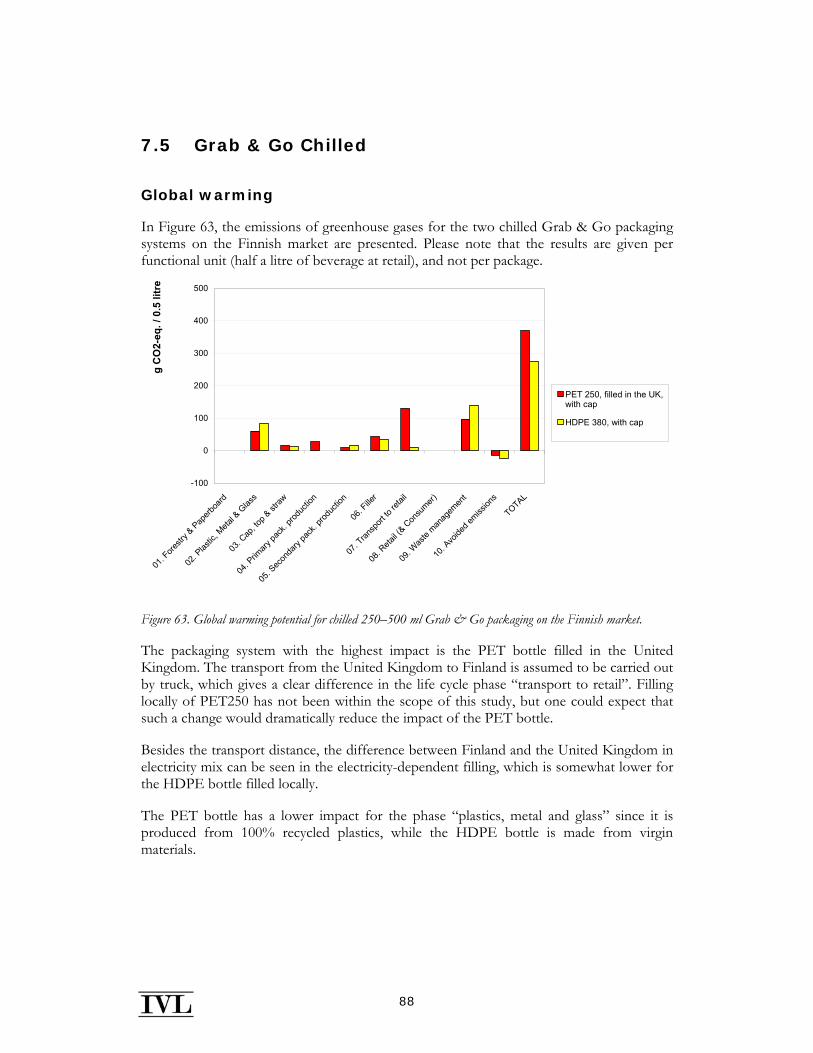
88
7.5 Grab & Go Chilled
Global warming
In Figure 63, the emissions of greenhouse gases for the two chilled Grab & Go packaging systems on the Finnish market are presented. Please note that the results are given per functional unit (half a litre of beverage at retail), and not per package.
-100
0
100
200
300
400
500
01. F
orestr
y & Pap
erboa
rd
02. P
lastic
, Meta
l & G
lass
03. C
ap, to
p & st
raw
04. P
rimary
pack
. prod
uctio
n
05. S
econ
dary
pack
. prod
uctio
n
06. F
iller
07. T
ransp
ort to
retai
l
08. R
etail (
& Con
sumer)
09. W
aste
manag
emen
t
10. A
voide
d emiss
ions
TOTAL
g C
O2-
eq. /
0.5
litr
e
PET 250, filled in the UK,with cap
HDPE 380, with cap
Figure 63. Global warming potential for chilled 250–500 ml Grab & Go packaging on the Finnish market.
The packaging system with the highest impact is the PET bottle filled in the United Kingdom. The transport from the United Kingdom to Finland is assumed to be carried out by truck, which gives a clear difference in the life cycle phase “transport to retail”. Filling locally of PET250 has not been within the scope of this study, but one could expect that such a change would dramatically reduce the impact of the PET bottle.
Besides the transport distance, the difference between Finland and the United Kingdom in electricity mix can be seen in the electricity-dependent filling, which is somewhat lower for the HDPE bottle filled locally.
The PET bottle has a lower impact for the phase “plastics, metal and glass” since it is produced from 100% recycled plastics, while the HDPE bottle is made from virgin materials.
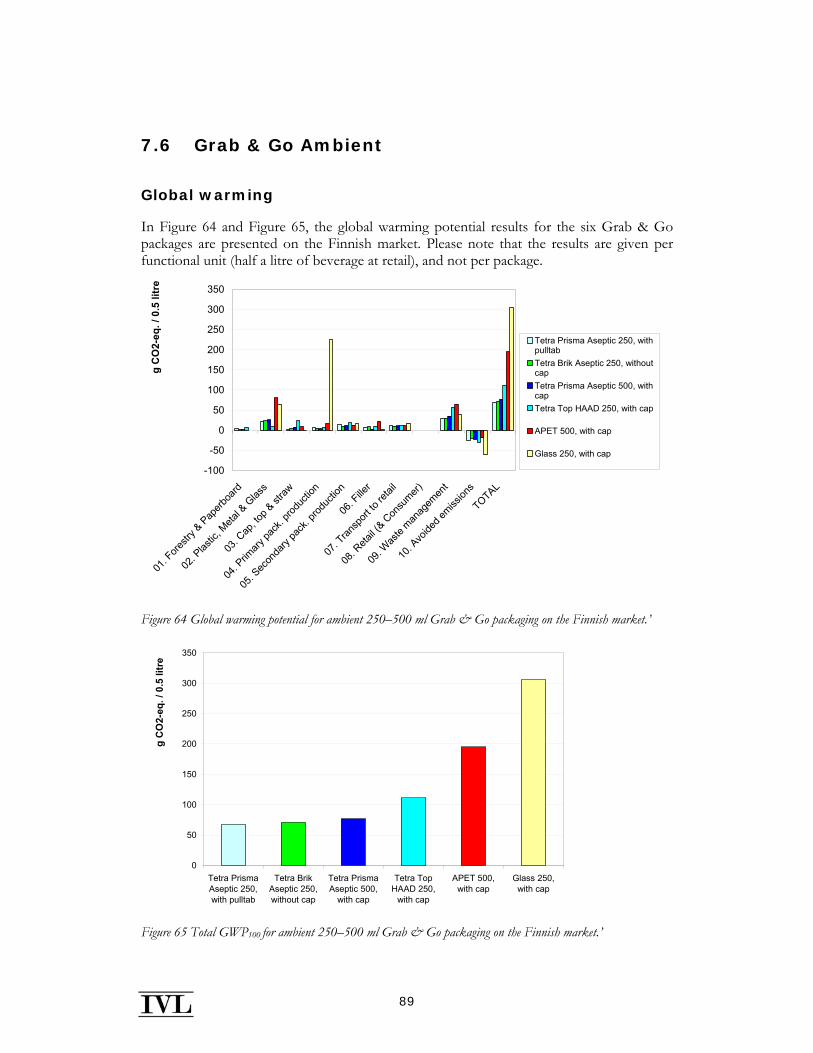
89
7.6 Grab & Go Ambient
Global warming
In Figure 64 and Figure 65, the global warming potential results for the six Grab & Go packages are presented on the Finnish market. Please note that the results are given per functional unit (half a litre of beverage at retail), and not per package.
-100
-50
0
50
100
150
200
250
300
350
01. F
orestr
y & Pap
erboa
rd
02. P
lastic
, Meta
l & G
lass
03. C
ap, to
p & st
raw
04. P
rimary
pack
. prod
uctio
n
05. S
econ
dary
pack
. prod
uctio
n
06. F
iller
07. T
ransp
ort to
retai
l
08. R
etail (
& Con
sumer)
09. W
aste
manag
emen
t
10. A
voide
d emiss
ions
TOTAL
g C
O2-
eq. /
0.5
litr
e
Tetra Prisma Aseptic 250, withpulltabTetra Brik Aseptic 250, withoutcapTetra Prisma Aseptic 500, withcapTetra Top HAAD 250, with cap
APET 500, with cap
Glass 250, with cap
Figure 64 Global warming potential for ambient 250–500 ml Grab & Go packaging on the Finnish market.’
0
50
100
150
200
250
300
350
Tetra PrismaAseptic 250,with pulltab
Tetra BrikAseptic 250,without cap
Tetra PrismaAseptic 500,
with cap
Tetra TopHAAD 250,
with cap
APET 500,with cap
Glass 250,with cap
g C
O2-
eq. /
0.5
litr
e
Figure 65 Total GWP100 for ambient 250–500 ml Grab & Go packaging on the Finnish market.’
90
The disposable glass packaging system has by far the largest GHG emissions. It is the production of the glass and bottle that gives the highest emissions.
The APET 500 has significantly larger emissions than the studied Tetra Pak packages, also because of the GHG emissions at production of the raw materials. However, the emissions from the production of the PET bottle are much lower than for the glass bottle.
Of the carton board packaging, Tetra Top HAAD is the package with the highest impact. The largest difference between this package and the other are the plastic cap and top, which gives significantly higher emissions than for the other packages. Tetra Top HAAD has a lower GHG emission for the lifecycle “plastic, metal and glass” than the other packages because it is the only packaging without aluminium foil inside. The production of virgin aluminium is very energy-intensive.
The primary production for Tetra Prisma Aseptic 250 are situated in Spain, Tetra Top HAAD in UK and the other two packages in Sweden. The low-carbon electricity mix in Sweden explains the higher emissions in primary packaging production for the aforementioned packaging systems.
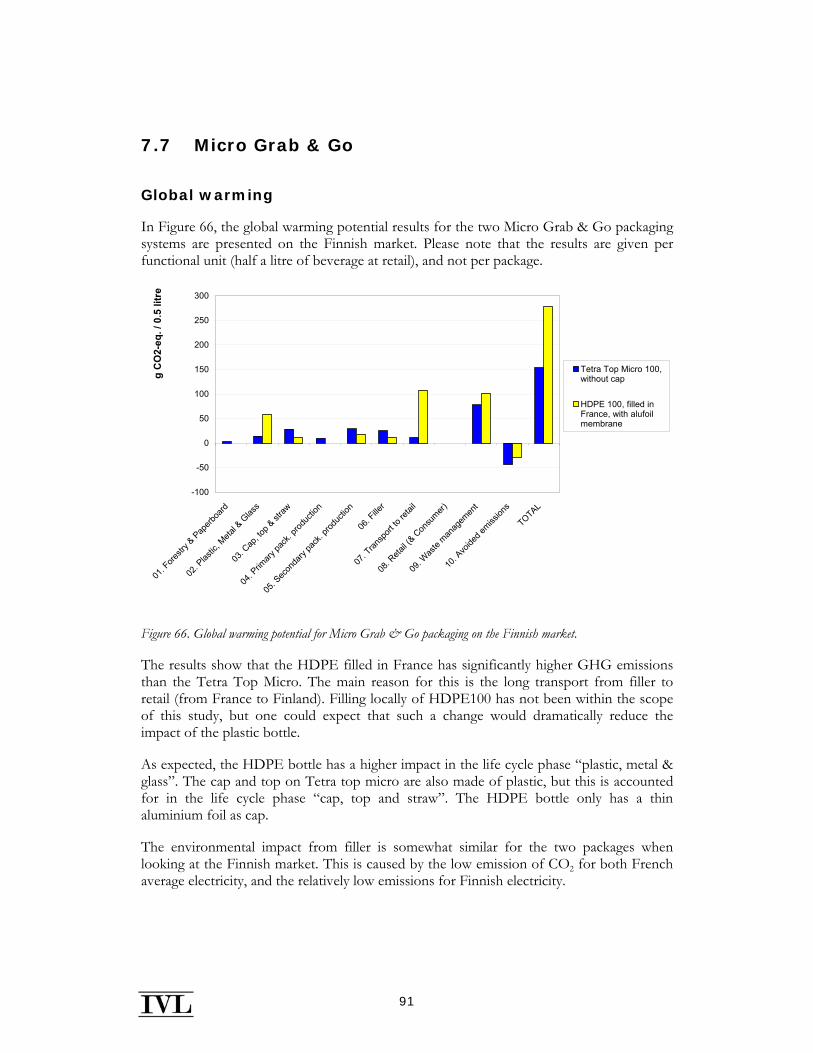
91
7.7 Micro Grab & Go
Global warming
In Figure 66, the global warming potential results for the two Micro Grab & Go packaging systems are presented on the Finnish market. Please note that the results are given per functional unit (half a litre of beverage at retail), and not per package.
-100
-50
0
50
100
150
200
250
300
01. F
orestr
y & P
aperb
oard
02. P
lastic
, Meta
l & G
lass
03. C
ap, to
p & st
raw
04. P
rimary
pack
. prod
uctio
n
05. S
econ
dary
pack
. prod
uctio
n
06. F
iller
07. T
ransp
ort to
retai
l
08. R
etail (
& Con
sumer)
09. W
aste
manag
emen
t
10. A
voide
d emiss
ions
TOTAL
g C
O2-
eq. /
0.5
litr
e
Tetra Top Micro 100,without cap
HDPE 100, filled inFrance, with alufoilmembrane
Figure 66. Global warming potential for Micro Grab & Go packaging on the Finnish market.
The results show that the HDPE filled in France has significantly higher GHG emissions than the Tetra Top Micro. The main reason for this is the long transport from filler to retail (from France to Finland). Filling locally of HDPE100 has not been within the scope of this study, but one could expect that such a change would dramatically reduce the impact of the plastic bottle.
As expected, the HDPE bottle has a higher impact in the life cycle phase “plastic, metal & glass”. The cap and top on Tetra top micro are also made of plastic, but this is accounted for in the life cycle phase “cap, top and straw”. The HDPE bottle only has a thin aluminium foil as cap.
The environmental impact from filler is somewhat similar for the two packages when looking at the Finnish market. This is caused by the low emission of CO2 for both French average electricity, and the relatively low emissions for Finnish electricity.
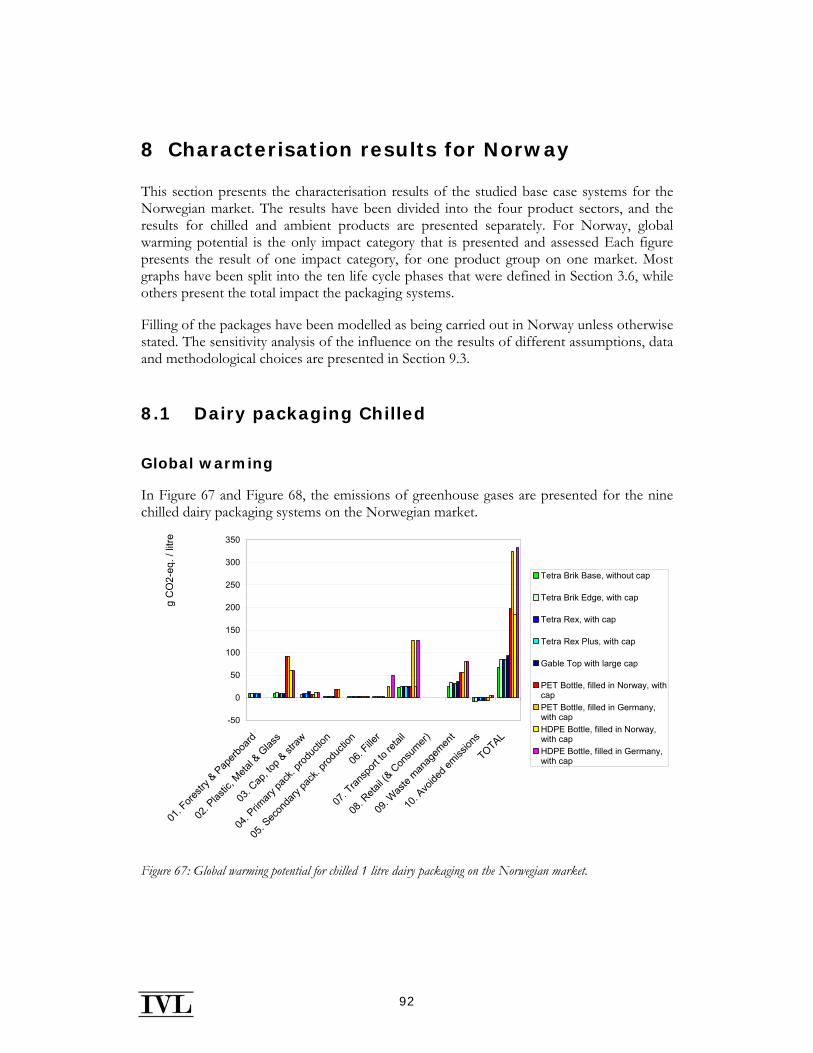
92
8 Characterisation results for Norway
This section presents the characterisation results of the studied base case systems for the Norwegian market. The results have been divided into the four product sectors, and the results for chilled and ambient products are presented separately. For Norway, global warming potential is the only impact category that is presented and assessed Each figure presents the result of one impact category, for one product group on one market. Most graphs have been split into the ten life cycle phases that were defined in Section 3.6, while others present the total impact the packaging systems.
Filling of the packages have been modelled as being carried out in Norway unless otherwise stated. The sensitivity analysis of the influence on the results of different assumptions, data and methodological choices are presented in Section 9.3.
8.1 Dairy packaging Chilled
Global warming
In Figure 67 and Figure 68, the emissions of greenhouse gases are presented for the nine chilled dairy packaging systems on the Norwegian market.
-50
0
50
100
150
200
250
300
350
01. F
orestr
y & Pap
erboa
rd
02. P
lastic
, Meta
l & G
lass
03. C
ap, to
p & st
raw
04. P
rimary
pack
. prod
uctio
n
05. S
econ
dary
pack
. prod
uctio
n
06. F
iller
07. T
ransp
ort to
retai
l
08. R
etail (
& Con
sumer)
09. W
aste
manag
emen
t
10. A
voide
d emiss
ions
TOTAL
g C
O2-
eq. /
litre
Tetra Brik Base, without cap
Tetra Brik Edge, with cap
Tetra Rex, with cap
Tetra Rex Plus, with cap
Gable Top with large cap
PET Bottle, filled in Norway, withcapPET Bottle, filled in Germany,with capHDPE Bottle, filled in Norway,with capHDPE Bottle, filled in Germany,with cap
Figure 67: Global warming potential for chilled 1 litre dairy packaging on the Norwegian market.
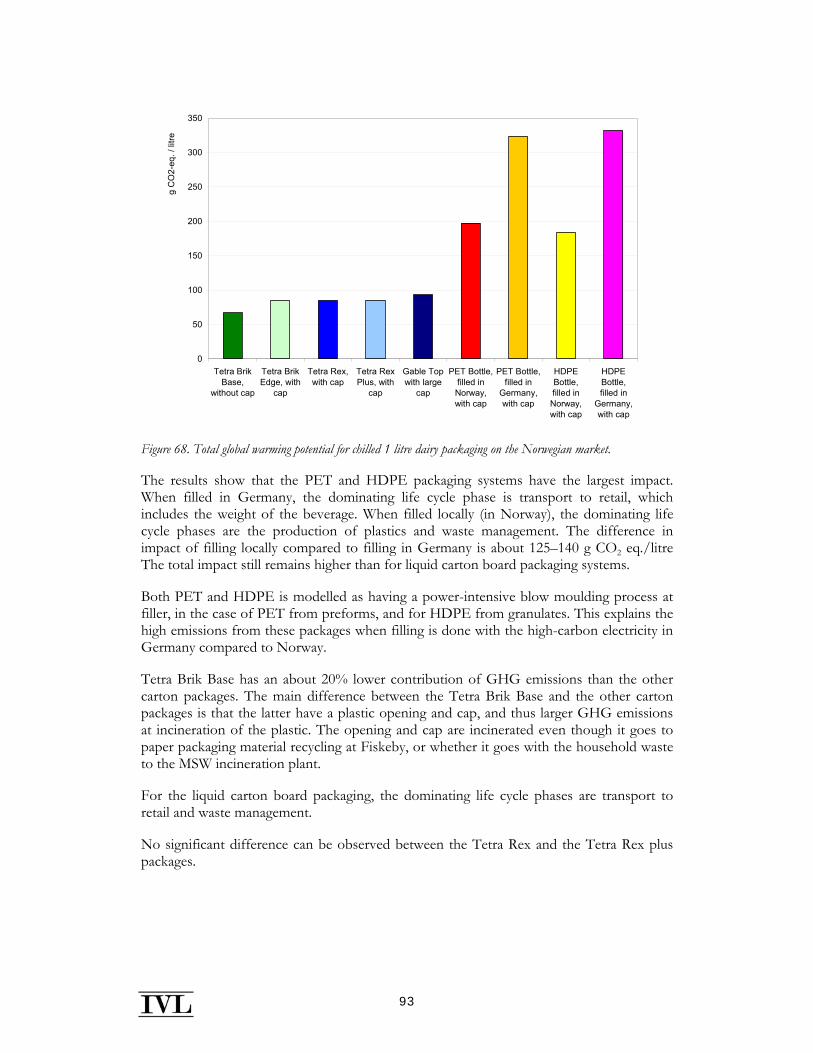
93
0
50
100
150
200
250
300
350
Tetra BrikBase,
without cap
Tetra BrikEdge, with
cap
Tetra Rex,with cap
Tetra RexPlus, with
cap
Gable Topwith large
cap
PET Bottle,filled inNorway,with cap
PET Bottle,filled in
Germany,with cap
HDPEBottle,filled inNorway,with cap
HDPEBottle,filled in
Germany,with cap
g C
O2-
eq. /
litre
Figure 68. Total global warming potential for chilled 1 litre dairy packaging on the Norwegian market.
The results show that the PET and HDPE packaging systems have the largest impact. When filled in Germany, the dominating life cycle phase is transport to retail, which includes the weight of the beverage. When filled locally (in Norway), the dominating life cycle phases are the production of plastics and waste management. The difference in impact of filling locally compared to filling in Germany is about 125–140 g CO2 eq./litre The total impact still remains higher than for liquid carton board packaging systems.
Both PET and HDPE is modelled as having a power-intensive blow moulding process at filler, in the case of PET from preforms, and for HDPE from granulates. This explains the high emissions from these packages when filling is done with the high-carbon electricity in Germany compared to Norway.
Tetra Brik Base has an about 20% lower contribution of GHG emissions than the other carton packages. The main difference between the Tetra Brik Base and the other carton packages is that the latter have a plastic opening and cap, and thus larger GHG emissions at incineration of the plastic. The opening and cap are incinerated even though it goes to paper packaging material recycling at Fiskeby, or whether it goes with the household waste to the MSW incineration plant.
For the liquid carton board packaging, the dominating life cycle phases are transport to retail and waste management.
No significant difference can be observed between the Tetra Rex and the Tetra Rex plus packages.
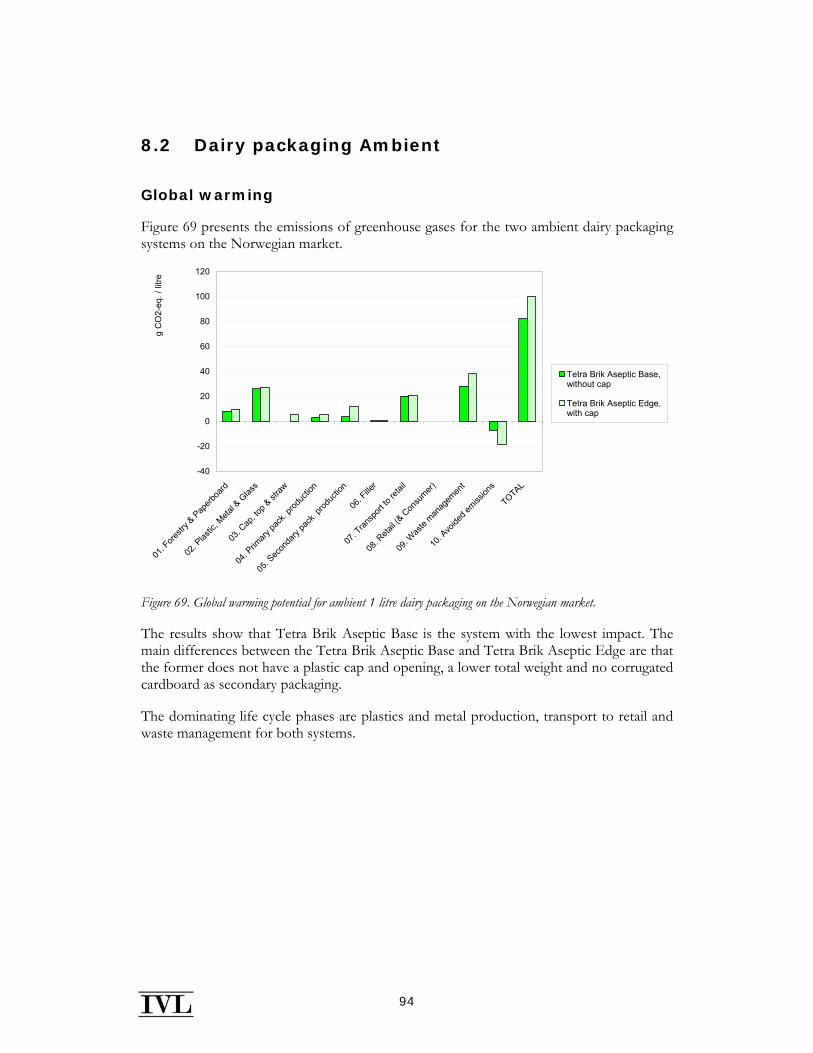
94
8.2 Dairy packaging Ambient
Global warming
Figure 69 presents the emissions of greenhouse gases for the two ambient dairy packaging systems on the Norwegian market.
-40
-20
0
20
40
60
80
100
120
01. F
orestr
y & P
aperb
oard
02. P
lastic
, Meta
l & G
lass
03. C
ap, to
p & st
raw
04. P
rimary
pack
. prod
uctio
n
05. S
econ
dary
pack
. prod
uctio
n
06. F
iller
07. T
ransp
ort to
retai
l
08. R
etail (
& Con
sumer)
09. W
aste
manag
emen
t
10. A
voide
d emiss
ions
TOTAL
g C
O2-
eq. /
litre
Tetra Brik Aseptic Base,without cap
Tetra Brik Aseptic Edge,with cap
Figure 69. Global warming potential for ambient 1 litre dairy packaging on the Norwegian market.
The results show that Tetra Brik Aseptic Base is the system with the lowest impact. The main differences between the Tetra Brik Aseptic Base and Tetra Brik Aseptic Edge are that the former does not have a plastic cap and opening, a lower total weight and no corrugated cardboard as secondary packaging.
The dominating life cycle phases are plastics and metal production, transport to retail and waste management for both systems.
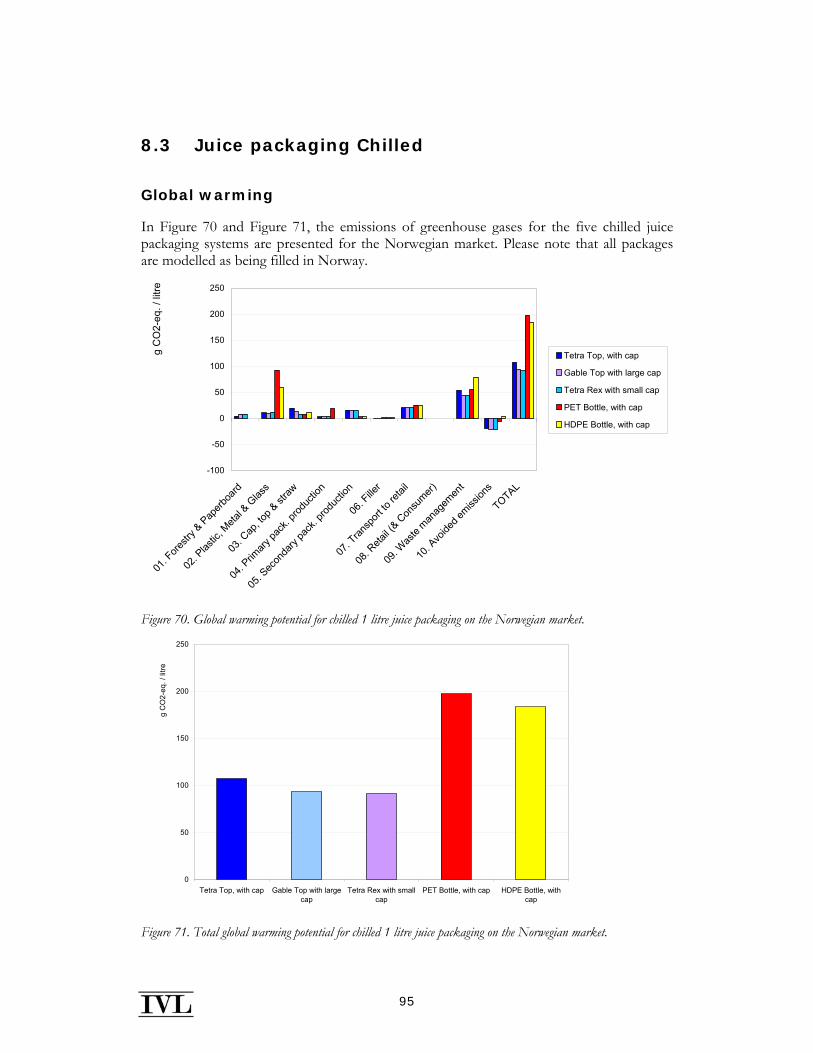
95
8.3 Juice packaging Chilled
Global warming
In Figure 70 and Figure 71, the emissions of greenhouse gases for the five chilled juice packaging systems are presented for the Norwegian market. Please note that all packages are modelled as being filled in Norway.
-100
-50
0
50
100
150
200
250
01. F
orestr
y & Pap
erboa
rd
02. P
lastic
, Meta
l & G
lass
03. C
ap, to
p & st
raw
04. P
rimary
pack
. prod
uctio
n
05. S
econ
dary
pack
. prod
uctio
n
06. F
iller
07. T
ransp
ort to
retai
l
08. R
etail (
& Con
sumer)
09. W
aste
manag
emen
t
10. A
voide
d emiss
ions
TOTAL
g C
O2-
eq. /
litre
Tetra Top, with cap
Gable Top with large cap
Tetra Rex with small cap
PET Bottle, with cap
HDPE Bottle, with cap
Figure 70. Global warming potential for chilled 1 litre juice packaging on the Norwegian market.
0
50
100
150
200
250
Tetra Top, with cap Gable Top with largecap
Tetra Rex with smallcap
PET Bottle, with cap HDPE Bottle, withcap
g C
O2-
eq. /
litre
Figure 71. Total global warming potential for chilled 1 litre juice packaging on the Norwegian market.

96
The figures show that the PET and HDPE packaging systems have larger GHG emissions than the carton packaging systems. This is mainly due to the emissions at the production of virgin plastics.
The plastic bottles are transported in roll containers instead of on wooden pallets with associated corrugated board and shrink film. This explains the lower impact as a result of the production of secondary packaging. The difference in secondary packaging also affects the waste management and avoided emissions life cycle phases, but this difference is harder to observe due to the aggregation of waste management of primary and secondary packaging.
Of the carton packages, the Gable Top-style packaging has slightly lower emissions in this impact category than the Tetra Top packaging system. This is mainly due to the amount of plastic used for the cap and top.

97
8.4 Juice packaging Ambient
Global warming
In Figure 72, the emissions of greenhouse gases for the three ambient juice packaging systems are presented for the Norwegian market.
-40
-20
0
20
40
60
80
100
120
140
160
01. F
orestr
y & Pap
erboa
rd
02. P
lastic
, Meta
l & G
lass
03. C
ap, to
p & st
raw
04. P
rimary
pack
. prod
uctio
n
05. S
econ
dary
pack
. prod
uctio
n
06. F
iller
07. T
ransp
ort to
retai
l
08. R
etail (
& Con
sumer)
09. W
aste
manag
emen
t
10. A
voide
d emiss
ions
TOTAL
g C
O2-
eq. /
litre
Tetra Brik Aseptic Slim,with cap
Tetra Gemina Aseptic,with cap
Tetra Prisma Aseptic,with cap
Figure 72. Global warming potential for ambient 1 litre juice packaging on the Norwegian market.
Tetra Brik Aseptic Slim, which has the lowest metal and plastic content, also has the lowest total impact. The aluminium used as a laminate in all three packages comes from virgin aluminium and gives a relatively high contribution to global warming potential.
The environmental impact of filling is low for all three packages due to the use of the Norwegian electricity mix.
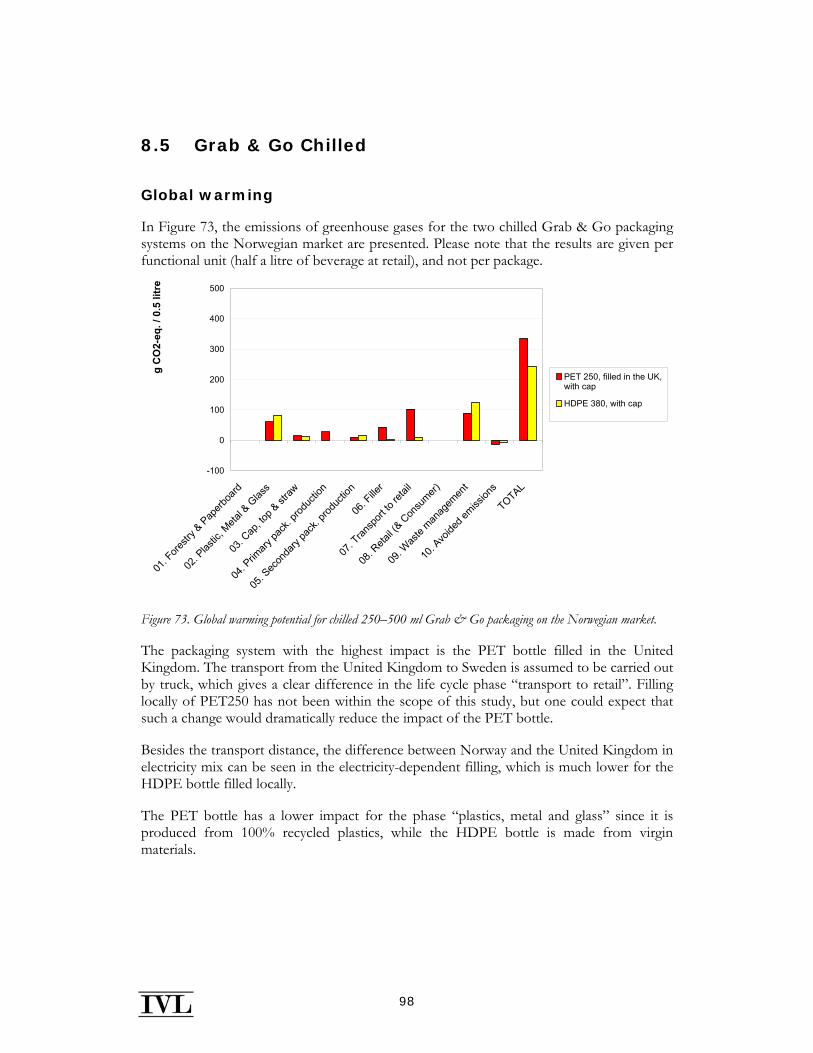
98
8.5 Grab & Go Chilled
Global warming
In Figure 73, the emissions of greenhouse gases for the two chilled Grab & Go packaging systems on the Norwegian market are presented. Please note that the results are given per functional unit (half a litre of beverage at retail), and not per package.
-100
0
100
200
300
400
500
01. F
orestr
y & P
aperb
oard
02. P
lastic
, Meta
l & G
lass
03. C
ap, to
p & st
raw
04. P
rimary
pack
. prod
uctio
n
05. S
econ
dary
pack
. prod
uctio
n
06. F
iller
07. T
ransp
ort to
retai
l
08. R
etail (
& Con
sumer)
09. W
aste
manag
emen
t
10. A
voide
d emiss
ions
TOTAL
g C
O2-
eq. /
0.5
litr
e
PET 250, filled in the UK,with cap
HDPE 380, with cap
Figure 73. Global warming potential for chilled 250–500 ml Grab & Go packaging on the Norwegian market.
The packaging system with the highest impact is the PET bottle filled in the United Kingdom. The transport from the United Kingdom to Sweden is assumed to be carried out by truck, which gives a clear difference in the life cycle phase “transport to retail”. Filling locally of PET250 has not been within the scope of this study, but one could expect that such a change would dramatically reduce the impact of the PET bottle.
Besides the transport distance, the difference between Norway and the United Kingdom in electricity mix can be seen in the electricity-dependent filling, which is much lower for the HDPE bottle filled locally.
The PET bottle has a lower impact for the phase “plastics, metal and glass” since it is produced from 100% recycled plastics, while the HDPE bottle is made from virgin materials.
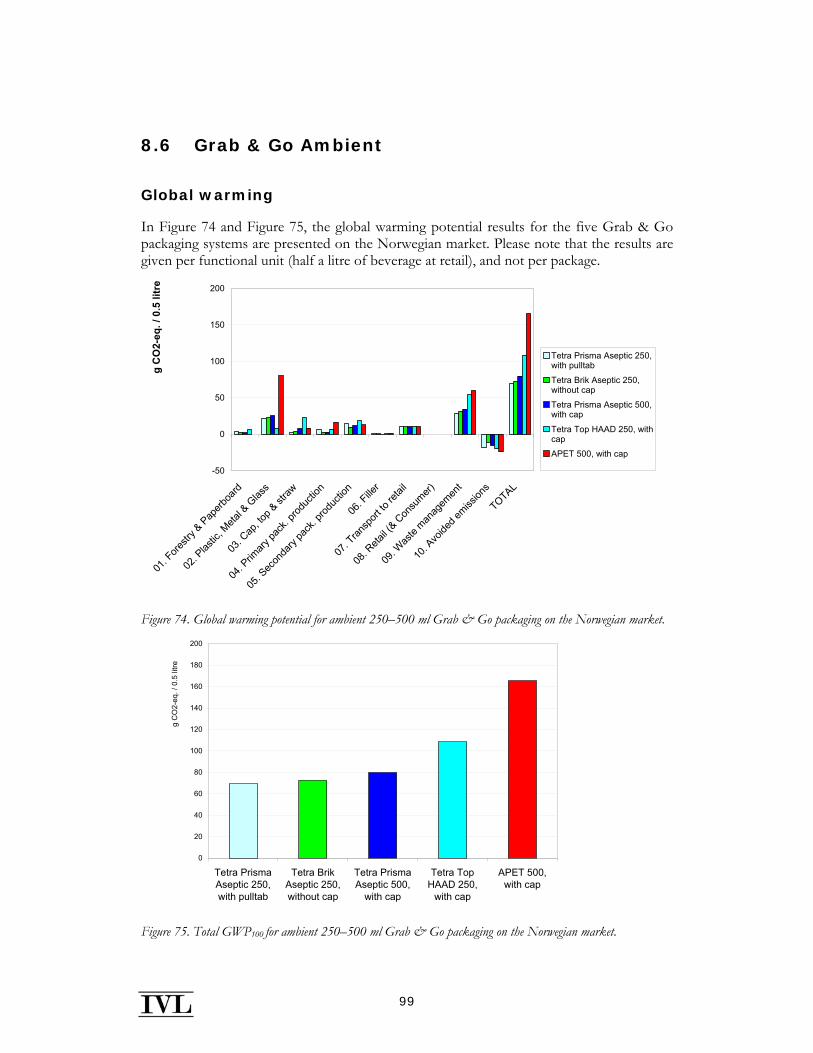
99
8.6 Grab & Go Ambient
Global warming
In Figure 74 and Figure 75, the global warming potential results for the five Grab & Go packaging systems are presented on the Norwegian market. Please note that the results are given per functional unit (half a litre of beverage at retail), and not per package.
-50
0
50
100
150
200
01. F
orestr
y & P
aperb
oard
02. P
lastic
, Meta
l & G
lass
03. C
ap, to
p & st
raw
04. P
rimary
pack
. prod
uctio
n
05. S
econ
dary
pack
. prod
uctio
n
06. F
iller
07. T
ransp
ort to
retai
l
08. R
etail (
& Con
sumer)
09. W
aste
manag
emen
t
10. A
voide
d emiss
ions
TOTAL
g C
O2-
eq. /
0.5
litr
e
Tetra Prisma Aseptic 250,with pulltab
Tetra Brik Aseptic 250,without cap
Tetra Prisma Aseptic 500,with cap
Tetra Top HAAD 250, withcap
APET 500, with cap
Figure 74. Global warming potential for ambient 250–500 ml Grab & Go packaging on the Norwegian market.
0
20
40
60
80
100
120
140
160
180
200
Tetra PrismaAseptic 250,with pulltab
Tetra BrikAseptic 250,without cap
Tetra PrismaAseptic 500,
with cap
Tetra TopHAAD 250,
with cap
APET 500,with cap
g C
O2-
eq. /
0.5
litre
Figure 75. Total GWP100 for ambient 250–500 ml Grab & Go packaging on the Norwegian market.
100
The glass bottle system has not been modelled on the Norwegian market, and thus the APET 500 ml bottle has the largest impact. APET 500 has significantly larger emissions than the studied Tetra Pak packages mainly because of the GHG emissions at production of the PET.
Of the carton board packaging, Tetra Top HAAD is the package with the highest impact. The largest difference between this package and the other are the plastic cap and top, which gives significantly higher emissions than for the other packages. Tetra Top HAAD has a lower GHG emission for the lifecycle “plastic, metal and glass” than the other packages because it is the only packaging without aluminium foil inside. The production of virgin aluminium is very energy-intensive.
The primary production for Tetra Prisma Aseptic 250 are situated in Spain, Tetra Top HAAD in UK and the other two packages in Sweden. The low-carbon electricity mix in Sweden explains the higher emissions in primary packaging production for the aforementioned packaging systems.
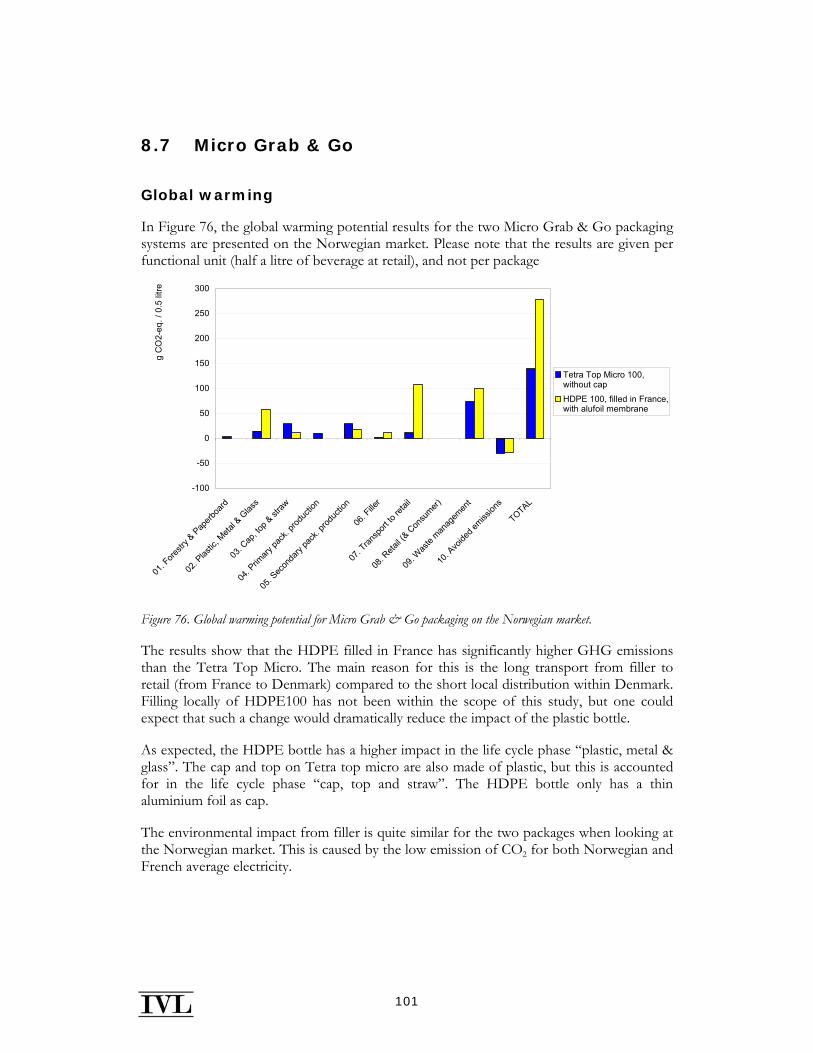
101
8.7 Micro Grab & Go
Global warming
In Figure 76, the global warming potential results for the two Micro Grab & Go packaging systems are presented on the Norwegian market. Please note that the results are given per functional unit (half a litre of beverage at retail), and not per package
-100
-50
0
50
100
150
200
250
300
01. F
orestr
y & P
aperb
oard
02. P
lastic
, Meta
l & G
lass
03. C
ap, to
p & st
raw
04. P
rimary
pack
. prod
uctio
n
05. S
econ
dary
pack
. prod
uctio
n
06. F
iller
07. T
ransp
ort to
retai
l
08. R
etail (
& Con
sumer)
09. W
aste
manag
emen
t
10. A
voide
d emiss
ions
TOTAL
g C
O2-
eq. /
0.5
litre
Tetra Top Micro 100,without cap
HDPE 100, filled in France,with alufoil membrane
Figure 76. Global warming potential for Micro Grab & Go packaging on the Norwegian market.
The results show that the HDPE filled in France has significantly higher GHG emissions than the Tetra Top Micro. The main reason for this is the long transport from filler to retail (from France to Denmark) compared to the short local distribution within Denmark. Filling locally of HDPE100 has not been within the scope of this study, but one could expect that such a change would dramatically reduce the impact of the plastic bottle.
As expected, the HDPE bottle has a higher impact in the life cycle phase “plastic, metal & glass”. The cap and top on Tetra top micro are also made of plastic, but this is accounted for in the life cycle phase “cap, top and straw”. The HDPE bottle only has a thin aluminium foil as cap.
The environmental impact from filler is quite similar for the two packages when looking at the Norwegian market. This is caused by the low emission of CO2 for both Norwegian and French average electricity.
102
9 Interpretation of the results
In this section, the results of the inventory analysis and impact assessment are interpreted and evaluated in order to draw conclusions from the study.
The sensitivity of the results to important assumptions, methodology choices is studied in the sensitivity analysis. A completeness check and consistency check is carried out is also carried out.
9.1 Analysis of differences between the markets
In the base case, the packages have been modelled at all four Nordic markets separately by using the modular approach for liquid carton board packaging. The four markets are different in several ways:
• Electricity mix used for filling and waste management (see Section 3.15.1).
• Shares of waste that goes to recycling, incineration with or without energy recovery or landfill (see Section 3.15.2).
• Avoided electricity and district heating production (see Section 3.15.3).
• Transport distance from converting to filler and from filler to market (see Section 3.15.7).
The results are divided into the different markets since the goal of this study is related to the study of packaging options at each market separately. Despite this, it is important to know about these differences and the effects on the total results, and to avoid to draw the wrong kind of conclusions. In this analysis, the same packages are compared for all four markets to analyse how large impact the market has for a given package.
The contribution to global warming potential for Tetra Brik Base and PET 1 litre milk are presented in Figure 77 and Figure 78.
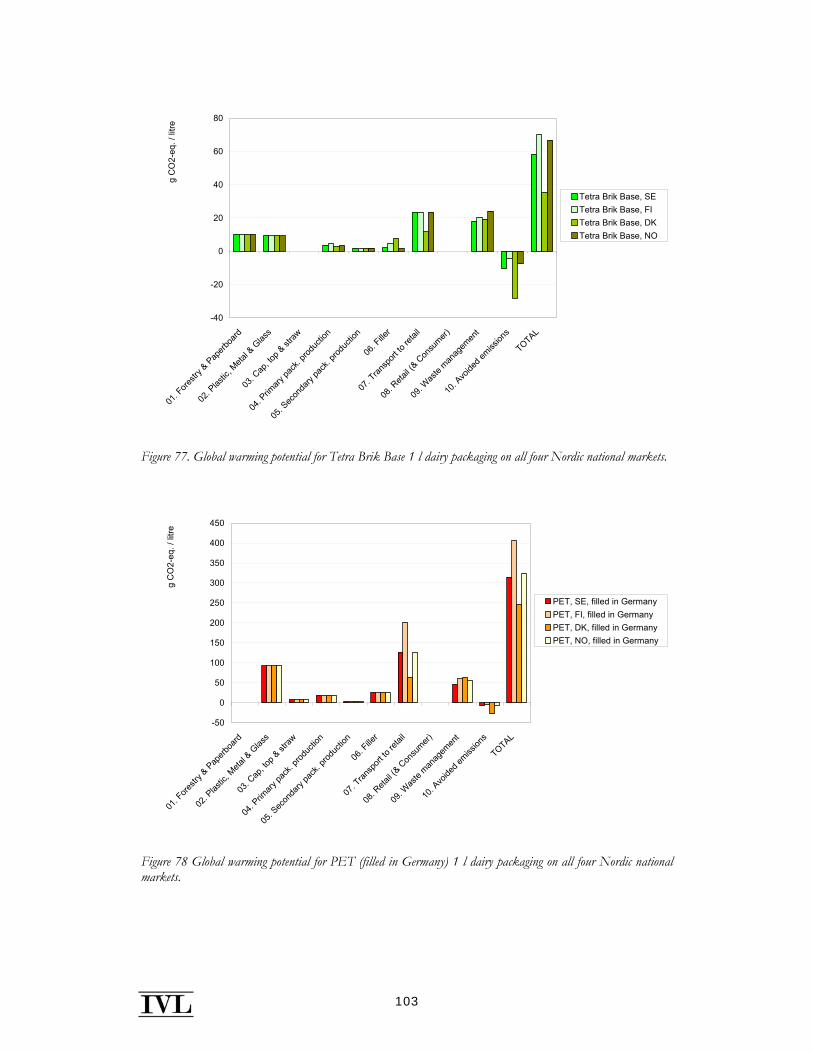
103
-40
-20
0
20
40
60
80
01. F
orestr
y & P
aperb
oard
02. P
lastic
, Meta
l & G
lass
03. C
ap, to
p & st
raw
04. P
rimary
pack
. prod
uctio
n
05. S
econ
dary
pack
. prod
uctio
n
06. F
iller
07. T
ransp
ort to
retai
l
08. R
etail (
& Con
sumer)
09. W
aste
manag
emen
t
10. A
voide
d emiss
ions
TOTAL
g C
O2-
eq. /
litre
Tetra Brik Base, SETetra Brik Base, FITetra Brik Base, DKTetra Brik Base, NO
Figure 77. Global warming potential for Tetra Brik Base 1 l dairy packaging on all four Nordic national markets.
-50
0
50
100
150
200
250
300
350
400
450
01. F
orestr
y & P
aperb
oard
02. P
lastic
, Meta
l & G
lass
03. C
ap, to
p & st
raw
04. P
rimary
pack
. prod
uctio
n
05. S
econ
dary
pack
. prod
uctio
n
06. F
iller
07. T
ransp
ort to
retai
l
08. R
etail (
& Con
sumer)
09. W
aste
manag
emen
t
10. A
voide
d emiss
ions
TOTAL
g C
O2-
eq. /
litre
PET, SE, filled in GermanyPET, FI, filled in GermanyPET, DK, filled in GermanyPET, NO, filled in Germany
Figure 78 Global warming potential for PET (filled in Germany) 1 l dairy packaging on all four Nordic national markets.
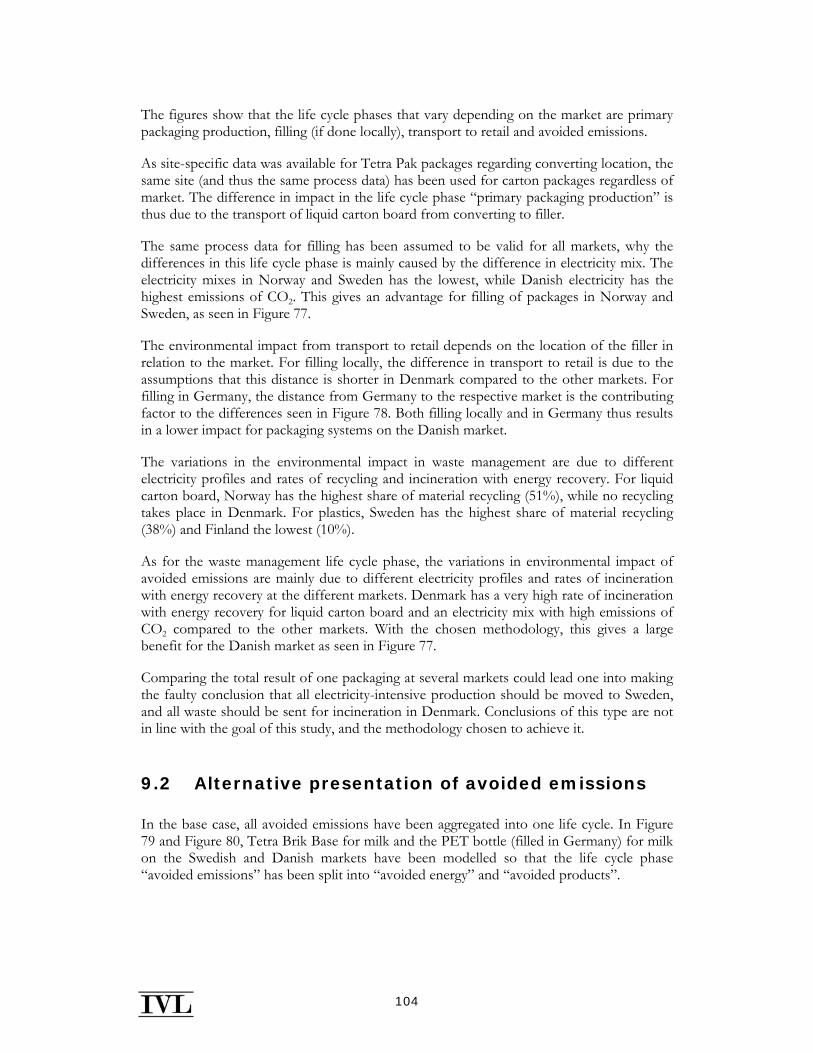
104
The figures show that the life cycle phases that vary depending on the market are primary packaging production, filling (if done locally), transport to retail and avoided emissions.
As site-specific data was available for Tetra Pak packages regarding converting location, the same site (and thus the same process data) has been used for carton packages regardless of market. The difference in impact in the life cycle phase “primary packaging production” is thus due to the transport of liquid carton board from converting to filler.
The same process data for filling has been assumed to be valid for all markets, why the differences in this life cycle phase is mainly caused by the difference in electricity mix. The electricity mixes in Norway and Sweden has the lowest, while Danish electricity has the highest emissions of CO2. This gives an advantage for filling of packages in Norway and Sweden, as seen in Figure 77.
The environmental impact from transport to retail depends on the location of the filler in relation to the market. For filling locally, the difference in transport to retail is due to the assumptions that this distance is shorter in Denmark compared to the other markets. For filling in Germany, the distance from Germany to the respective market is the contributing factor to the differences seen in Figure 78. Both filling locally and in Germany thus results in a lower impact for packaging systems on the Danish market.
The variations in the environmental impact in waste management are due to different electricity profiles and rates of recycling and incineration with energy recovery. For liquid carton board, Norway has the highest share of material recycling (51%), while no recycling takes place in Denmark. For plastics, Sweden has the highest share of material recycling (38%) and Finland the lowest (10%).
As for the waste management life cycle phase, the variations in environmental impact of avoided emissions are mainly due to different electricity profiles and rates of incineration with energy recovery at the different markets. Denmark has a very high rate of incineration with energy recovery for liquid carton board and an electricity mix with high emissions of CO2 compared to the other markets. With the chosen methodology, this gives a large benefit for the Danish market as seen in Figure 77.
Comparing the total result of one packaging at several markets could lead one into making the faulty conclusion that all electricity-intensive production should be moved to Sweden, and all waste should be sent for incineration in Denmark. Conclusions of this type are not in line with the goal of this study, and the methodology chosen to achieve it.
9.2 Alternative presentation of avoided emissions
In the base case, all avoided emissions have been aggregated into one life cycle. In Figure 79 and Figure 80, Tetra Brik Base for milk and the PET bottle (filled in Germany) for milk on the Swedish and Danish markets have been modelled so that the life cycle phase “avoided emissions” has been split into “avoided energy” and “avoided products”.
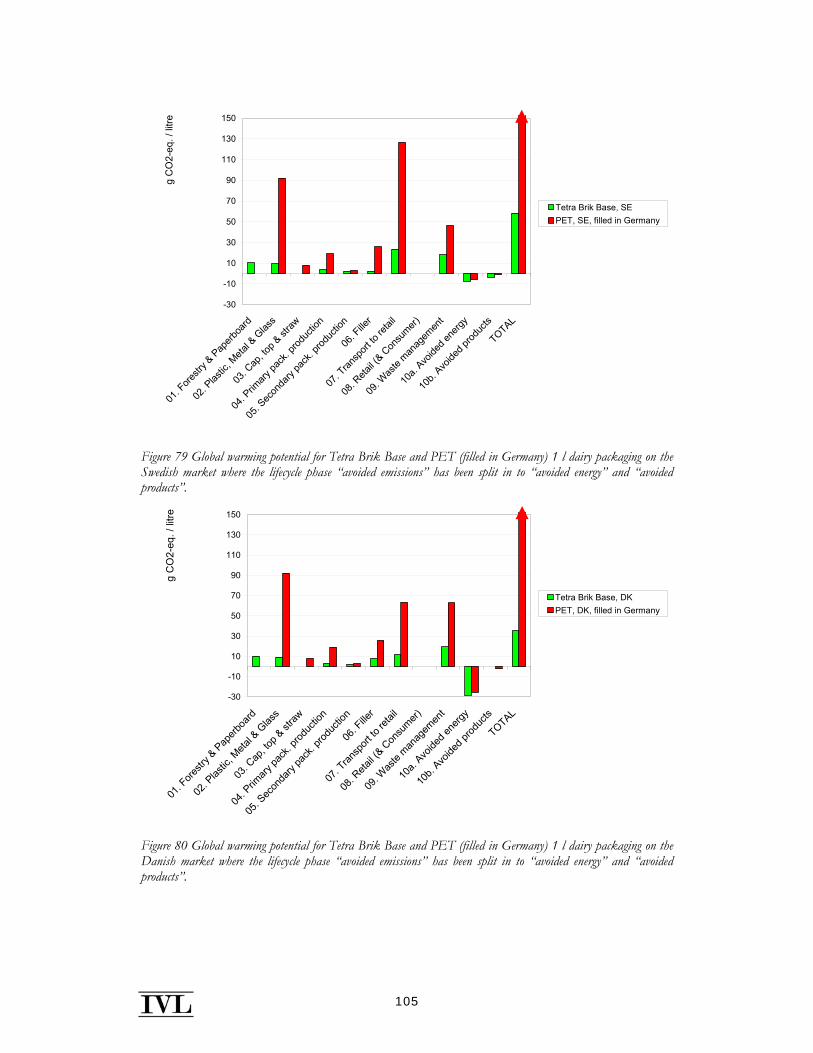
105
-30
-10
10
30
50
70
90
110
130
150
01. F
orestr
y & Pap
erboa
rd
02. P
lastic
, Meta
l & G
lass
03. C
ap, to
p & st
raw
04. P
rimary
pack
. prod
uctio
n
05. S
econ
dary
pack
. prod
uctio
n
06. F
iller
07. T
ransp
ort to
retai
l
08. R
etail (
& Con
sumer)
09. W
aste
manag
emen
t
10a.
Avoide
d ene
rgy
10b.
Avoide
d prod
ucts
TOTAL
g C
O2-
eq. /
litre
Tetra Brik Base, SEPET, SE, filled in Germany
Figure 79 Global warming potential for Tetra Brik Base and PET (filled in Germany) 1 l dairy packaging on the Swedish market where the lifecycle phase “avoided emissions” has been split in to “avoided energy” and “avoided products”.
-30
-10
10
30
50
70
90
110
130
150
01. F
orestr
y & P
aperb
oard
02. P
lastic
, Meta
l & G
lass
03. C
ap, to
p & st
raw
04. P
rimary
pack
. prod
uctio
n
05. S
econ
dary
pack
. prod
uctio
n
06. F
iller
07. T
ransp
ort to
retai
l
08. R
etail (
& Con
sumer)
09. W
aste
manag
emen
t
10a.
Avoide
d ene
rgy
10b.
Avoide
d prod
ucts
TOTAL
g C
O2-
eq. /
litre
Tetra Brik Base, DKPET, DK, filled in Germany
Figure 80 Global warming potential for Tetra Brik Base and PET (filled in Germany) 1 l dairy packaging on the Danish market where the lifecycle phase “avoided emissions” has been split in to “avoided energy” and “avoided products”.

106
From the figures, it is clear that avoided energy is the main component of avoided emissions for both markets. In Denmark, where the recycling rate is low and the electricity mix has a high carbon content, this effect is especially noticeable.
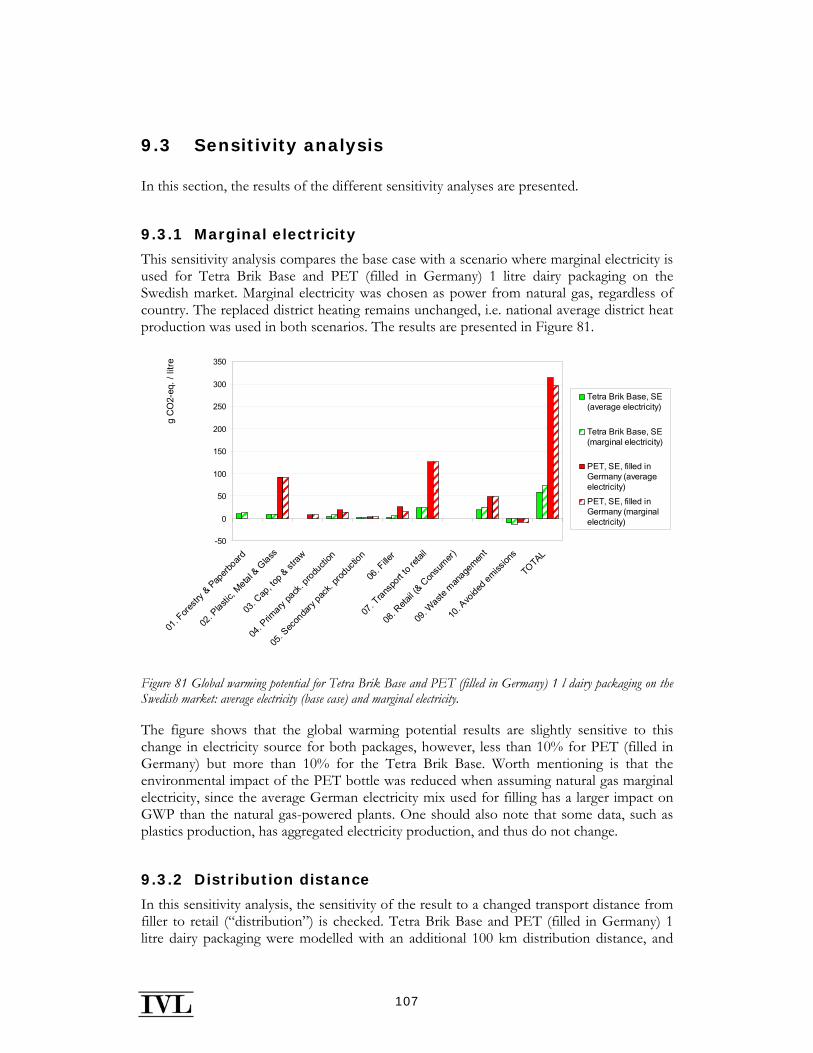
107
9.3 Sensitivity analysis
In this section, the results of the different sensitivity analyses are presented.
9.3.1 Marginal electricity
This sensitivity analysis compares the base case with a scenario where marginal electricity is used for Tetra Brik Base and PET (filled in Germany) 1 litre dairy packaging on the Swedish market. Marginal electricity was chosen as power from natural gas, regardless of country. The replaced district heating remains unchanged, i.e. national average district heat production was used in both scenarios. The results are presented in Figure 81.
-50
0
50
100
150
200
250
300
350
01. F
orestr
y & Pap
erboa
rd
02. P
lastic
, Meta
l & G
lass
03. C
ap, to
p & st
raw
04. P
rimary
pack
. prod
uctio
n
05. S
econ
dary
pack
. prod
uctio
n
06. F
iller
07. T
ransp
ort to
retai
l
08. R
etail (
& Con
sumer)
09. W
aste
manag
emen
t
10. A
voide
d emiss
ions
TOTA
L
g C
O2-
eq. /
litre
Tetra Brik Base, SE(average electricity)
Tetra Brik Base, SE(marginal electricity)
PET, SE, filled inGermany (averageelectricity)
PET, SE, filled inGermany (marginalelectricity)
Figure 81 Global warming potential for Tetra Brik Base and PET (filled in Germany) 1 l dairy packaging on the Swedish market: average electricity (base case) and marginal electricity.
The figure shows that the global warming potential results are slightly sensitive to this change in electricity source for both packages, however, less than 10% for PET (filled in Germany) but more than 10% for the Tetra Brik Base. Worth mentioning is that the environmental impact of the PET bottle was reduced when assuming natural gas marginal electricity, since the average German electricity mix used for filling has a larger impact on GWP than the natural gas-powered plants. One should also note that some data, such as plastics production, has aggregated electricity production, and thus do not change.
9.3.2 Distribution distance
In this sensitivity analysis, the sensitivity of the result to a changed transport distance from filler to retail (“distribution”) is checked. Tetra Brik Base and PET (filled in Germany) 1 litre dairy packaging were modelled with an additional 100 km distribution distance, and
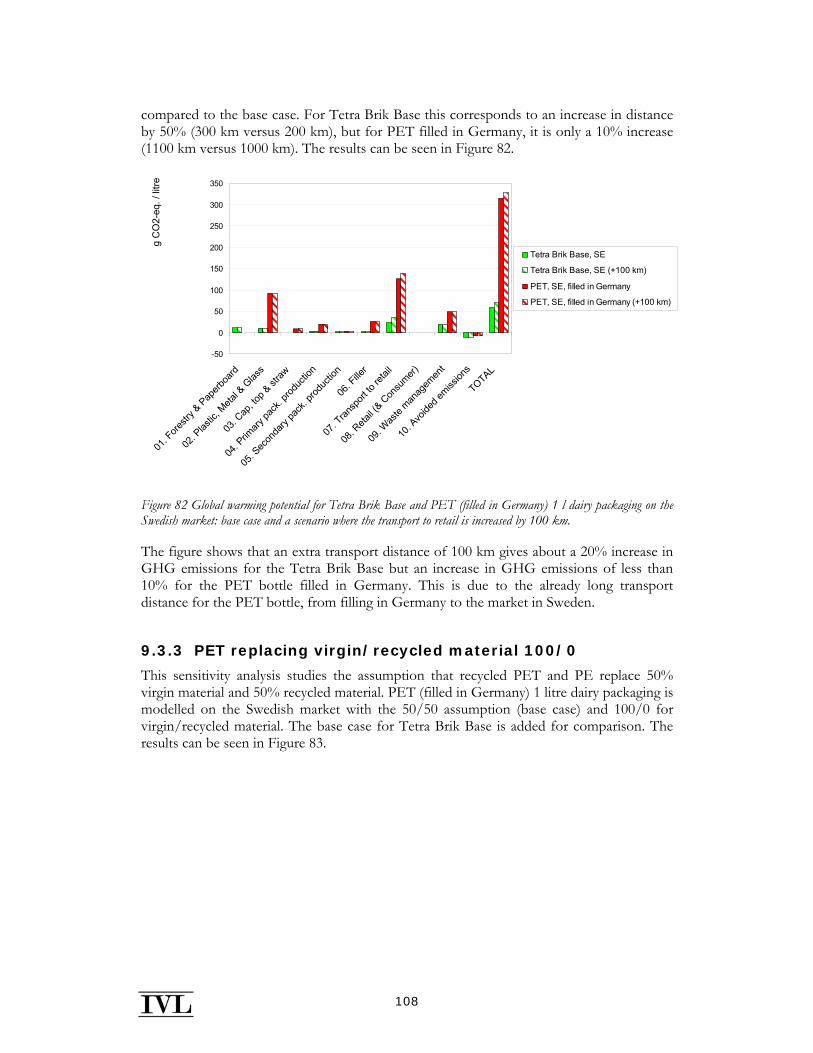
108
compared to the base case. For Tetra Brik Base this corresponds to an increase in distance by 50% (300 km versus 200 km), but for PET filled in Germany, it is only a 10% increase (1100 km versus 1000 km). The results can be seen in Figure 82.
-50
0
50
100
150
200
250
300
350
01. F
orestr
y & P
aperb
oard
02. P
lastic
, Meta
l & G
lass
03. C
ap, to
p & st
raw
04. P
rimary
pack
. prod
uctio
n
05. S
econ
dary
pack
. prod
uctio
n
06. F
iller
07. T
ransp
ort to
retai
l
08. R
etail (
& Con
sumer)
09. W
aste
manag
emen
t
10. A
voide
d emiss
ions
TOTAL
g C
O2-
eq. /
litre
Tetra Brik Base, SE
Tetra Brik Base, SE (+100 km)
PET, SE, filled in Germany
PET, SE, filled in Germany (+100 km)
Figure 82 Global warming potential for Tetra Brik Base and PET (filled in Germany) 1 l dairy packaging on the Swedish market: base case and a scenario where the transport to retail is increased by 100 km.
The figure shows that an extra transport distance of 100 km gives about a 20% increase in GHG emissions for the Tetra Brik Base but an increase in GHG emissions of less than 10% for the PET bottle filled in Germany. This is due to the already long transport distance for the PET bottle, from filling in Germany to the market in Sweden.
9.3.3 PET replacing virgin/recycled material 100/0
This sensitivity analysis studies the assumption that recycled PET and PE replace 50% virgin material and 50% recycled material. PET (filled in Germany) 1 litre dairy packaging is modelled on the Swedish market with the 50/50 assumption (base case) and 100/0 for virgin/recycled material. The base case for Tetra Brik Base is added for comparison. The results can be seen in Figure 83.
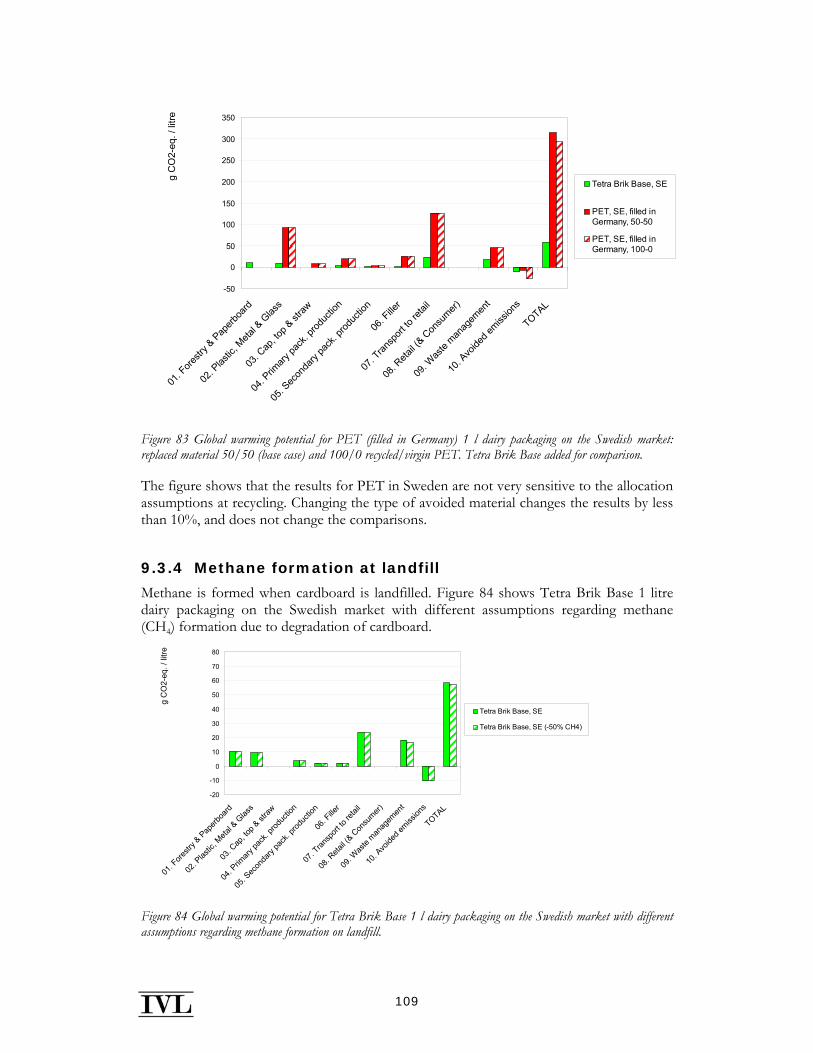
109
-50
0
50
100
150
200
250
300
350
01. F
orestr
y & Pap
erboa
rd
02. P
lastic
, Meta
l & G
lass
03. C
ap, to
p & st
raw
04. P
rimary
pack
. prod
uctio
n
05. S
econ
dary
pack
. prod
uctio
n
06. F
iller
07. T
ransp
ort to
retai
l
08. R
etail (
& Con
sumer)
09. W
aste
manag
emen
t
10. A
voide
d emiss
ions
TOTAL
g C
O2-
eq. /
litre
Tetra Brik Base, SE
PET, SE, filled inGermany, 50-50
PET, SE, filled inGermany, 100-0
Figure 83 Global warming potential for PET (filled in Germany) 1 l dairy packaging on the Swedish market: replaced material 50/50 (base case) and 100/0 recycled/virgin PET. Tetra Brik Base added for comparison.
The figure shows that the results for PET in Sweden are not very sensitive to the allocation assumptions at recycling. Changing the type of avoided material changes the results by less than 10%, and does not change the comparisons.
9.3.4 Methane formation at landfill
Methane is formed when cardboard is landfilled. Figure 84 shows Tetra Brik Base 1 litre dairy packaging on the Swedish market with different assumptions regarding methane (CH4) formation due to degradation of cardboard.
-20
-10
0
10
20
30
40
50
60
70
80
01. F
orestr
y & P
aperb
oard
02. P
lastic
, Meta
l & G
lass
03. C
ap, to
p & st
raw
04. P
rimary
pack
. prod
uctio
n
05. S
econ
dary
pack
. prod
uctio
n
06. F
iller
07. T
ransp
ort to
retai
l
08. R
etail (
& Con
sumer)
09. W
aste
manag
emen
t
10. A
voide
d emiss
ions
TOTAL
g C
O2-
eq. /
litre
Tetra Brik Base, SE
Tetra Brik Base, SE (-50% CH4)
Figure 84 Global warming potential for Tetra Brik Base 1 l dairy packaging on the Swedish market with different assumptions regarding methane formation on landfill.
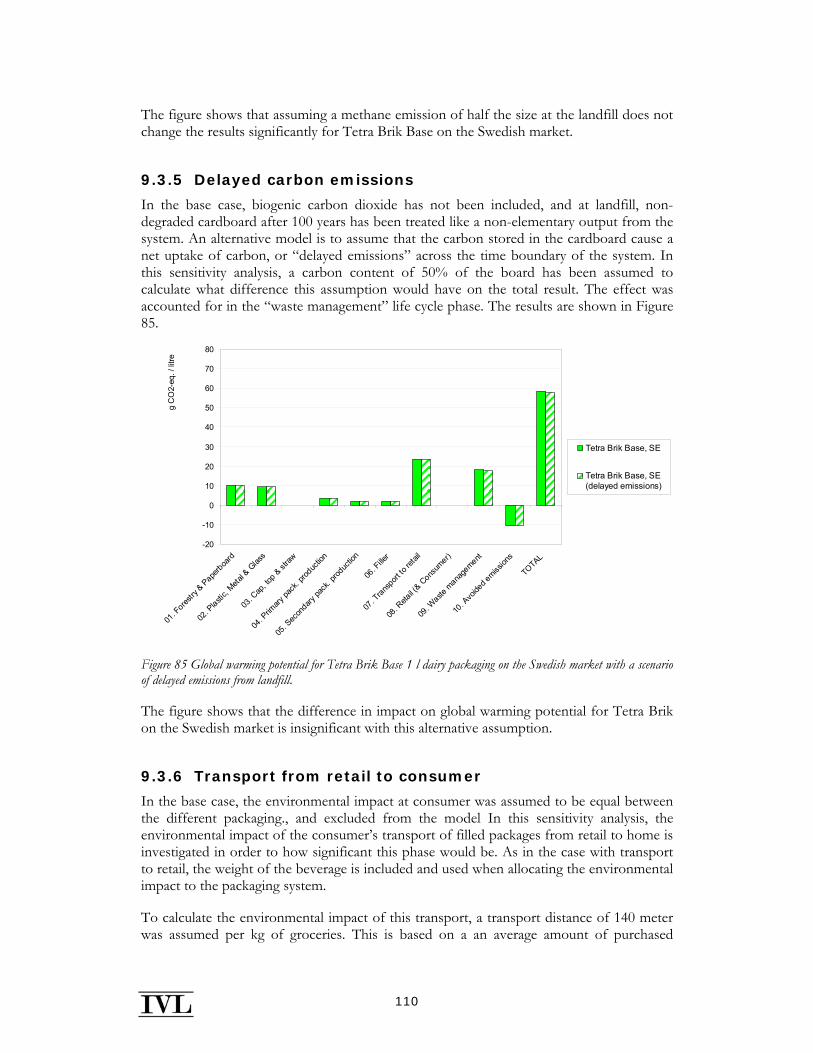
110
The figure shows that assuming a methane emission of half the size at the landfill does not change the results significantly for Tetra Brik Base on the Swedish market.
9.3.5 Delayed carbon emissions
In the base case, biogenic carbon dioxide has not been included, and at landfill, non-degraded cardboard after 100 years has been treated like a non-elementary output from the system. An alternative model is to assume that the carbon stored in the cardboard cause a net uptake of carbon, or “delayed emissions” across the time boundary of the system. In this sensitivity analysis, a carbon content of 50% of the board has been assumed to calculate what difference this assumption would have on the total result. The effect was accounted for in the “waste management” life cycle phase. The results are shown in Figure 85.
-20
-10
0
10
20
30
40
50
60
70
80
01. F
orestry
& Paperboa
rd
02. P
lastic,
Metal &
Glas
s
03. C
ap, to
p & straw
04. P
rimary
pack
. prod
uctio
n
05. S
econ
dary pa
ck. p
roduc
tion
06. F
iller
07. T
ransport
to re
tail
08. R
etail (
& Cons
umer)
09. W
aste m
anage
ment
10. A
voide
d emiss
ions
TOTAL
g C
O2-
eq. /
litre
Tetra Brik Base, SE
Tetra Brik Base, SE(delayed emissions)
Figure 85 Global warming potential for Tetra Brik Base 1 l dairy packaging on the Swedish market with a scenario of delayed emissions from landfill.
The figure shows that the difference in impact on global warming potential for Tetra Brik on the Swedish market is insignificant with this alternative assumption.
9.3.6 Transport from retail to consumer
In the base case, the environmental impact at consumer was assumed to be equal between the different packaging., and excluded from the model In this sensitivity analysis, the environmental impact of the consumer’s transport of filled packages from retail to home is investigated in order to how significant this phase would be. As in the case with transport to retail, the weight of the beverage is included and used when allocating the environmental impact to the packaging system.
To calculate the environmental impact of this transport, a transport distance of 140 meter was assumed per kg of groceries. This is based on a an average amount of purchased
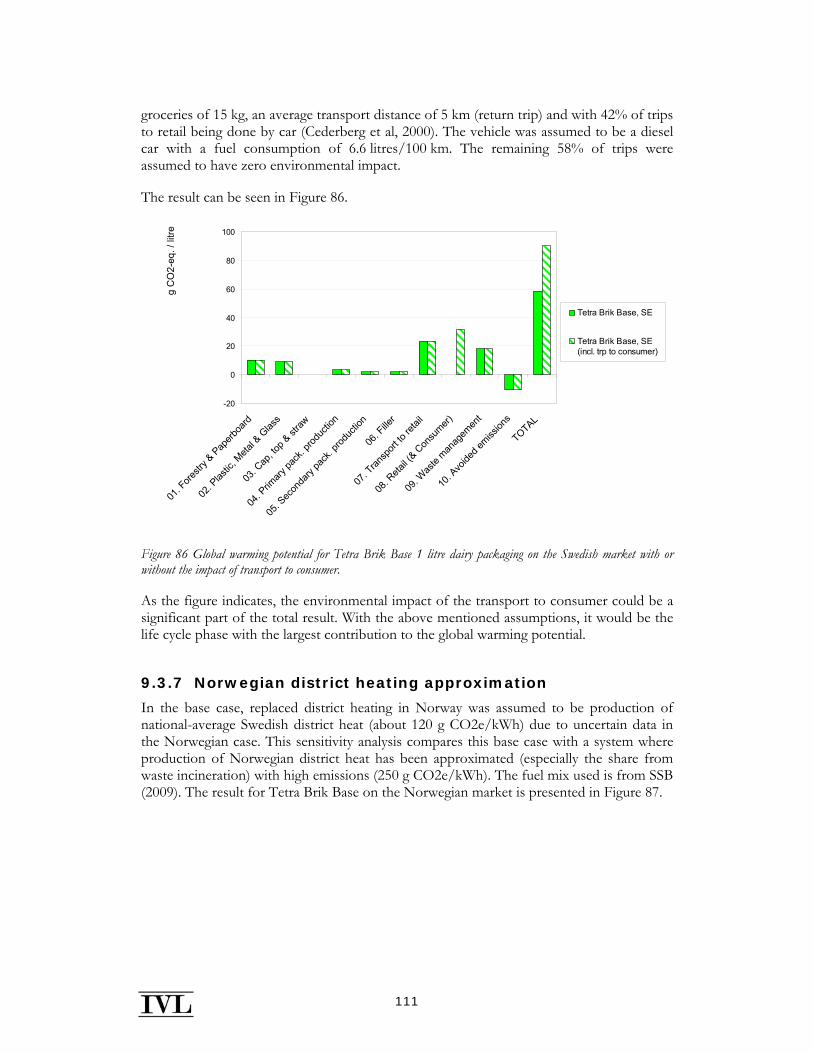
111
groceries of 15 kg, an average transport distance of 5 km (return trip) and with 42% of trips to retail being done by car (Cederberg et al, 2000). The vehicle was assumed to be a diesel car with a fuel consumption of 6.6 litres/100 km. The remaining 58% of trips were assumed to have zero environmental impact.
The result can be seen in Figure 86.
-20
0
20
40
60
80
100
01. F
orestr
y & Pap
erboa
rd
02. P
lastic
, Meta
l & G
lass
03. C
ap, to
p & st
raw
04. P
rimary
pack
. prod
uctio
n
05. S
econ
dary
pack
. prod
uctio
n
06. F
iller
07. T
ransp
ort to
retai
l
08. R
etail (
& Con
sumer)
09. W
aste
manag
emen
t
10. A
voide
d emiss
ions
TOTAL
g C
O2-
eq. /
litre
Tetra Brik Base, SE
Tetra Brik Base, SE(incl. trp to consumer)
Figure 86 Global warming potential for Tetra Brik Base 1 litre dairy packaging on the Swedish market with or without the impact of transport to consumer.
As the figure indicates, the environmental impact of the transport to consumer could be a significant part of the total result. With the above mentioned assumptions, it would be the life cycle phase with the largest contribution to the global warming potential.
9.3.7 Norwegian district heating approximation
In the base case, replaced district heating in Norway was assumed to be production of national-average Swedish district heat (about 120 g CO2e/kWh) due to uncertain data in the Norwegian case. This sensitivity analysis compares this base case with a system where production of Norwegian district heat has been approximated (especially the share from waste incineration) with high emissions (250 g CO2e/kWh). The fuel mix used is from SSB (2009). The result for Tetra Brik Base on the Norwegian market is presented in Figure 87.
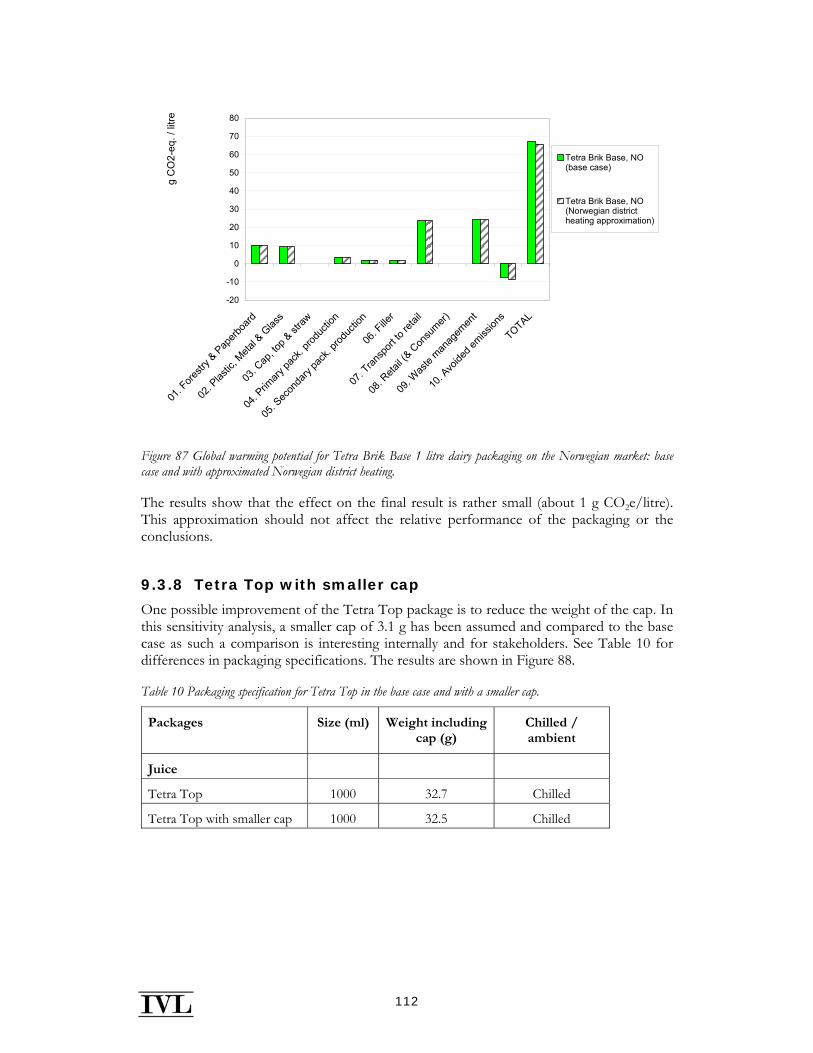
112
-20
-10
0
10
20
30
40
50
60
70
80
01. F
orestr
y & P
aperb
oard
02. P
lastic
, Meta
l & G
lass
03. C
ap, to
p & st
raw
04. P
rimary
pack
. prod
uctio
n
05. S
econ
dary
pack
. prod
uctio
n
06. F
iller
07. T
ransp
ort to
retai
l
08. R
etail (
& Con
sumer)
09. W
aste
manag
emen
t
10. A
voide
d emiss
ions
TOTAL
g C
O2-
eq. /
litre
Tetra Brik Base, NO(base case)
Tetra Brik Base, NO(Norwegian districtheating approximation)
Figure 87 Global warming potential for Tetra Brik Base 1 litre dairy packaging on the Norwegian market: base case and with approximated Norwegian district heating.
The results show that the effect on the final result is rather small (about 1 g CO2e/litre). This approximation should not affect the relative performance of the packaging or the conclusions.
9.3.8 Tetra Top with smaller cap
One possible improvement of the Tetra Top package is to reduce the weight of the cap. In this sensitivity analysis, a smaller cap of 3.1 g has been assumed and compared to the base case as such a comparison is interesting internally and for stakeholders. See Table 10 for differences in packaging specifications. The results are shown in Figure 88.
Table 10 Packaging specification for Tetra Top in the base case and with a smaller cap.
Packages Size (ml) Weight including cap (g)
Chilled / ambient
Juice
Tetra Top 1000 32.7 Chilled
Tetra Top with smaller cap 1000 32.5 Chilled
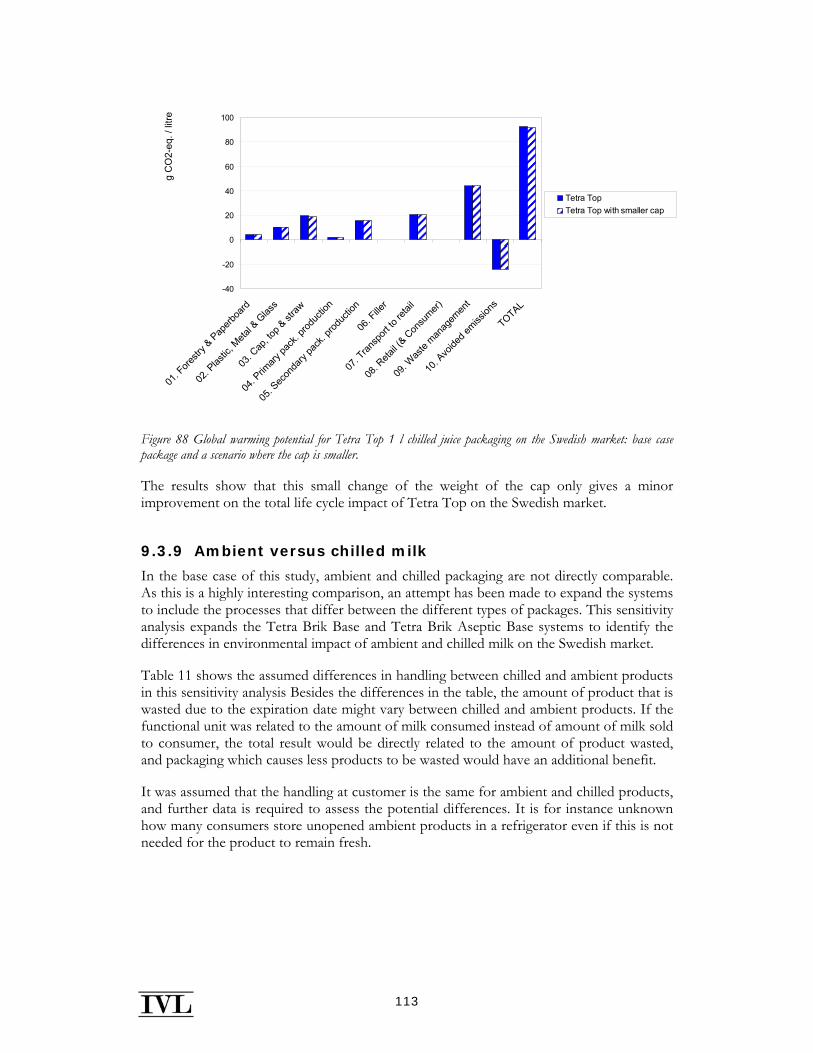
113
-40
-20
0
20
40
60
80
100
01. F
orestr
y & Pap
erboa
rd
02. P
lastic
, Meta
l & G
lass
03. C
ap, to
p & st
raw
04. P
rimary
pack
. prod
uctio
n
05. S
econ
dary
pack
. prod
uctio
n
06. F
iller
07. T
ransp
ort to
retai
l
08. R
etail (
& Con
sumer)
09. W
aste
manag
emen
t
10. A
voide
d emiss
ions
TOTAL
g C
O2-
eq. /
litre
Tetra TopTetra Top with smaller cap
Figure 88 Global warming potential for Tetra Top 1 l chilled juice packaging on the Swedish market: base case package and a scenario where the cap is smaller.
The results show that this small change of the weight of the cap only gives a minor improvement on the total life cycle impact of Tetra Top on the Swedish market.
9.3.9 Ambient versus chilled milk
In the base case of this study, ambient and chilled packaging are not directly comparable. As this is a highly interesting comparison, an attempt has been made to expand the systems to include the processes that differ between the different types of packages. This sensitivity analysis expands the Tetra Brik Base and Tetra Brik Aseptic Base systems to identify the differences in environmental impact of ambient and chilled milk on the Swedish market.
Table 11 shows the assumed differences in handling between chilled and ambient products in this sensitivity analysis Besides the differences in the table, the amount of product that is wasted due to the expiration date might vary between chilled and ambient products. If the functional unit was related to the amount of milk consumed instead of amount of milk sold to consumer, the total result would be directly related to the amount of product wasted, and packaging which causes less products to be wasted would have an additional benefit.
It was assumed that the handling at customer is the same for ambient and chilled products, and further data is required to assess the potential differences. It is for instance unknown how many consumers store unopened ambient products in a refrigerator even if this is not needed for the product to remain fresh.
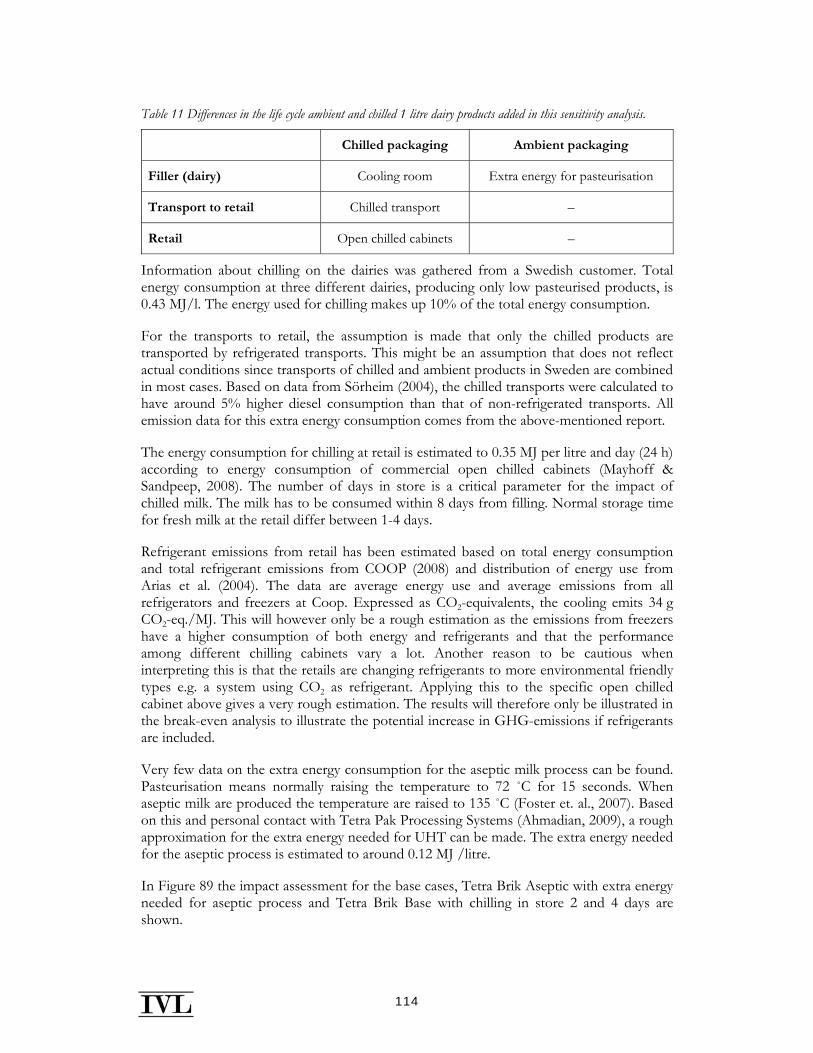
114
Table 11 Differences in the life cycle ambient and chilled 1 litre dairy products added in this sensitivity analysis.
Chilled packaging Ambient packaging
Filler (dairy) Cooling room Extra energy for pasteurisation
Transport to retail Chilled transport –
Retail Open chilled cabinets –
Information about chilling on the dairies was gathered from a Swedish customer. Total energy consumption at three different dairies, producing only low pasteurised products, is 0.43 MJ/l. The energy used for chilling makes up 10% of the total energy consumption.
For the transports to retail, the assumption is made that only the chilled products are transported by refrigerated transports. This might be an assumption that does not reflect actual conditions since transports of chilled and ambient products in Sweden are combined in most cases. Based on data from Sörheim (2004), the chilled transports were calculated to have around 5% higher diesel consumption than that of non-refrigerated transports. All emission data for this extra energy consumption comes from the above-mentioned report.
The energy consumption for chilling at retail is estimated to 0.35 MJ per litre and day (24 h) according to energy consumption of commercial open chilled cabinets (Mayhoff & Sandpeep, 2008). The number of days in store is a critical parameter for the impact of chilled milk. The milk has to be consumed within 8 days from filling. Normal storage time for fresh milk at the retail differ between 1-4 days.
Refrigerant emissions from retail has been estimated based on total energy consumption and total refrigerant emissions from COOP (2008) and distribution of energy use from Arias et al. (2004). The data are average energy use and average emissions from all refrigerators and freezers at Coop. Expressed as CO2-equivalents, the cooling emits 34 g CO2-eq./MJ. This will however only be a rough estimation as the emissions from freezers have a higher consumption of both energy and refrigerants and that the performance among different chilling cabinets vary a lot. Another reason to be cautious when interpreting this is that the retails are changing refrigerants to more environmental friendly types e.g. a system using CO2 as refrigerant. Applying this to the specific open chilled cabinet above gives a very rough estimation. The results will therefore only be illustrated in the break-even analysis to illustrate the potential increase in GHG-emissions if refrigerants are included.
Very few data on the extra energy consumption for the aseptic milk process can be found. Pasteurisation means normally raising the temperature to 72 ˚C for 15 seconds. When aseptic milk are produced the temperature are raised to 135 ˚C (Foster et. al., 2007). Based on this and personal contact with Tetra Pak Processing Systems (Ahmadian, 2009), a rough approximation for the extra energy needed for UHT can be made. The extra energy needed for the aseptic process is estimated to around 0.12 MJ /litre.
In Figure 89 the impact assessment for the base cases, Tetra Brik Aseptic with extra energy needed for aseptic process and Tetra Brik Base with chilling in store 2 and 4 days are shown.
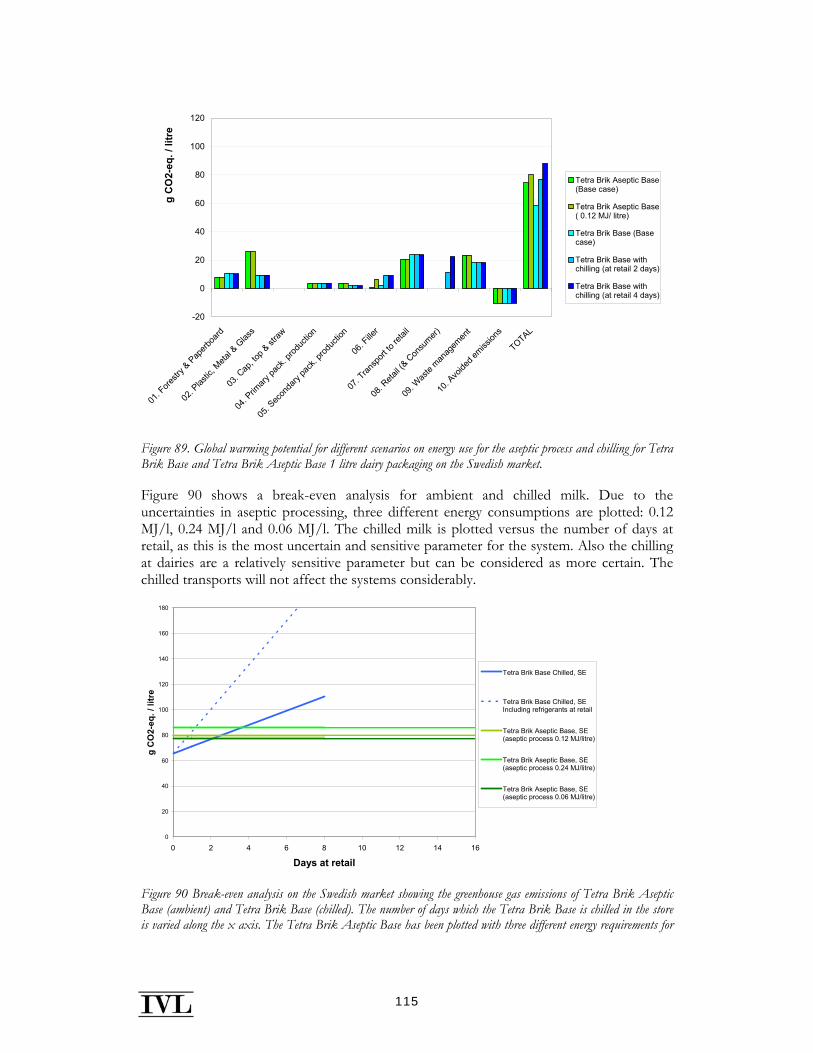
115
-20
0
20
40
60
80
100
120
01. F
orestr
y & P
aperb
oard
02. P
lastic
, Meta
l & G
lass
03. C
ap, to
p & st
raw
04. P
rimary
pack
. prod
uctio
n
05. S
econ
dary
pack
. prod
uctio
n
06. F
iller
07. T
ransp
ort to
retai
l
08. R
etail (
& Con
sumer)
09. W
aste
manag
emen
t
10. A
voide
d emiss
ions
TOTAL
g C
O2-
eq. /
litr
eTetra Brik Aseptic Base(Base case)
Tetra Brik Aseptic Base( 0.12 MJ/ litre)
Tetra Brik Base (Basecase)
Tetra Brik Base withchilling (at retail 2 days)
Tetra Brik Base withchilling (at retail 4 days)
Figure 89. Global warming potential for different scenarios on energy use for the aseptic process and chilling for Tetra Brik Base and Tetra Brik Aseptic Base 1 litre dairy packaging on the Swedish market.
Figure 90 shows a break-even analysis for ambient and chilled milk. Due to the uncertainties in aseptic processing, three different energy consumptions are plotted: 0.12 MJ/l, 0.24 MJ/l and 0.06 MJ/l. The chilled milk is plotted versus the number of days at retail, as this is the most uncertain and sensitive parameter for the system. Also the chilling at dairies are a relatively sensitive parameter but can be considered as more certain. The chilled transports will not affect the systems considerably.
0
20
40
60
80
100
120
140
160
180
0 2 4 6 8 10 12 14 16
Days at retail
g C
O2-
eq. /
litr
e
Tetra Brik Base Chilled, SE
Tetra Brik Base Chilled, SEIncluding refrigerants at retail
Tetra Brik Aseptic Base, SE(aseptic process 0.12 MJ/litre)
Tetra Brik Aseptic Base, SE(aseptic process 0.24 MJ/litre)
Tetra Brik Aseptic Base, SE(aseptic process 0.06 MJ/litre)
Figure 90 Break-even analysis on the Swedish market showing the greenhouse gas emissions of Tetra Brik Aseptic Base (ambient) and Tetra Brik Base (chilled). The number of days which the Tetra Brik Base is chilled in the store is varied along the x axis. The Tetra Brik Aseptic Base has been plotted with three different energy requirements for
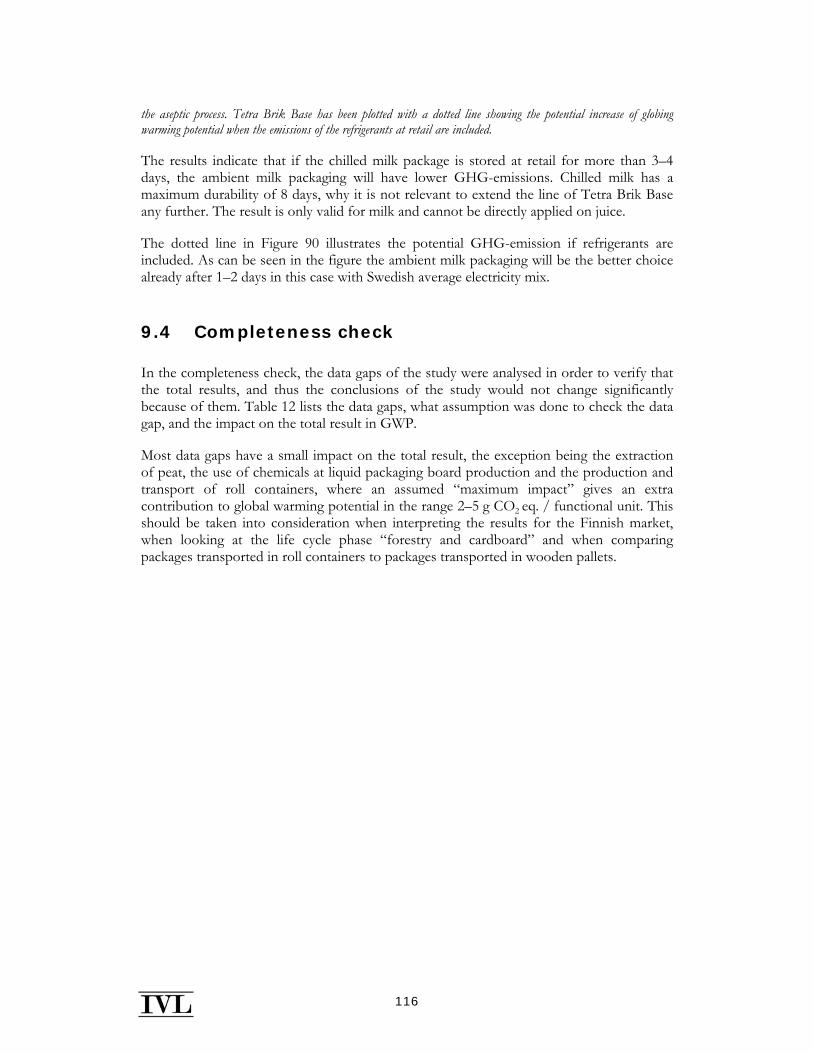
116
the aseptic process. Tetra Brik Base has been plotted with a dotted line showing the potential increase of globing warming potential when the emissions of the refrigerants at retail are included.
The results indicate that if the chilled milk package is stored at retail for more than 3–4 days, the ambient milk packaging will have lower GHG-emissions. Chilled milk has a maximum durability of 8 days, why it is not relevant to extend the line of Tetra Brik Base any further. The result is only valid for milk and cannot be directly applied on juice.
The dotted line in Figure 90 illustrates the potential GHG-emission if refrigerants are included. As can be seen in the figure the ambient milk packaging will be the better choice already after 1–2 days in this case with Swedish average electricity mix.
9.4 Completeness check
In the completeness check, the data gaps of the study were analysed in order to verify that the total results, and thus the conclusions of the study would not change significantly because of them. Table 12 lists the data gaps, what assumption was done to check the data gap, and the impact on the total result in GWP.
Most data gaps have a small impact on the total result, the exception being the extraction of peat, the use of chemicals at liquid packaging board production and the production and transport of roll containers, where an assumed “maximum impact” gives an extra contribution to global warming potential in the range 2–5 g CO2 eq. / functional unit. This should be taken into consideration when interpreting the results for the Finnish market, when looking at the life cycle phase “forestry and cardboard” and when comparing packages transported in roll containers to packages transported in wooden pallets.
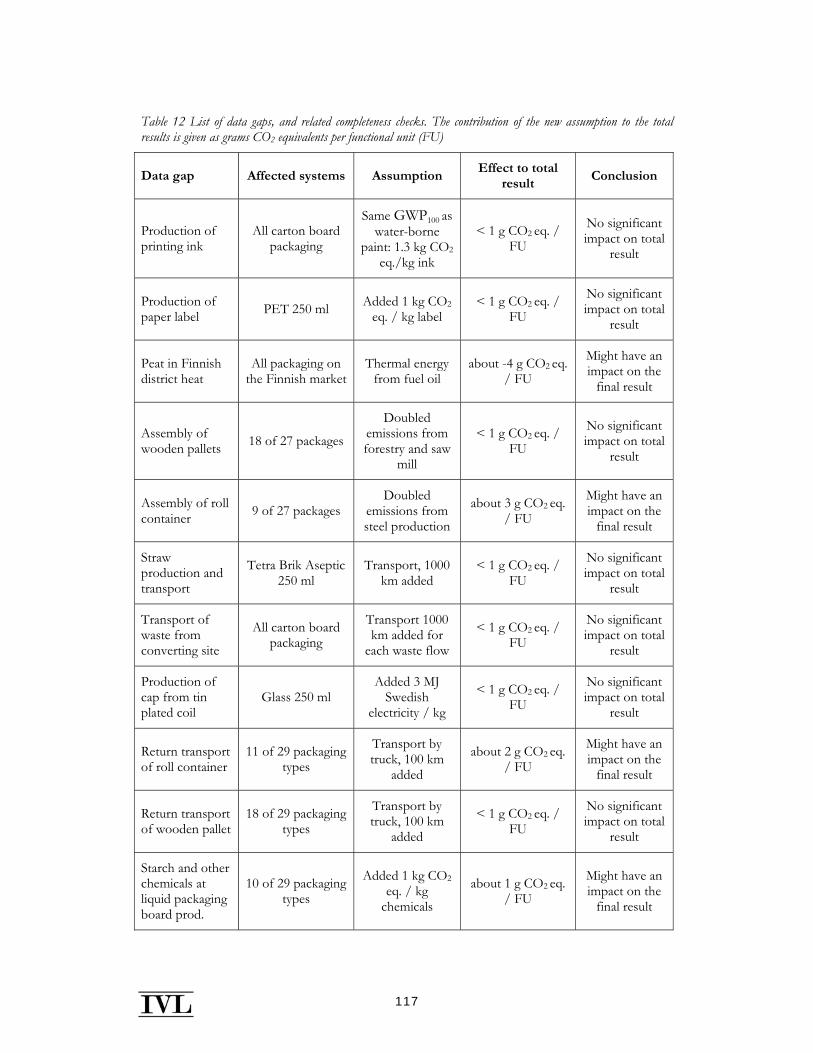
117
Table 12 List of data gaps, and related completeness checks. The contribution of the new assumption to the total results is given as grams CO2 equivalents per functional unit (FU)
Data gap Affected systems Assumption Effect to total
result Conclusion
Production of printing ink
All carton board packaging
Same GWP100 as water-borne
paint: 1.3 kg CO2
eq./kg ink
< 1 g CO2 eq. / FU
No significant impact on total
result
Production of paper label PET 250 ml Added 1 kg CO2
eq. / kg label < 1 g CO2 eq. /
FU
No significant impact on total
result
Peat in Finnish district heat
All packaging on the Finnish market
Thermal energy from fuel oil
about -4 g CO2 eq. / FU
Might have an impact on the
final result
Assembly of wooden pallets 18 of 27 packages
Doubled emissions from forestry and saw
mill
< 1 g CO2 eq. / FU
No significant impact on total
result
Assembly of roll container 9 of 27 packages
Doubled emissions from steel production
about 3 g CO2 eq. / FU
Might have an impact on the
final result
Straw production and transport
Tetra Brik Aseptic 250 ml
Transport, 1000 km added
< 1 g CO2 eq. / FU
No significant impact on total
result
Transport of waste from converting site
All carton board packaging
Transport 1000 km added for
each waste flow
< 1 g CO2 eq. / FU
No significant impact on total
result
Production of cap from tin plated coil
Glass 250 ml Added 3 MJ
Swedish electricity / kg
< 1 g CO2 eq. / FU
No significant impact on total
result
Return transport of roll container
11 of 29 packaging types
Transport by truck, 100 km
added
about 2 g CO2 eq. / FU
Might have an impact on the
final result
Return transport of wooden pallet
18 of 29 packaging types
Transport by truck, 100 km
added
< 1 g CO2 eq. / FU
No significant impact on total
result
Starch and other chemicals at liquid packaging board prod.
10 of 29 packaging types
Added 1 kg CO2
eq. / kg chemicals
about 1 g CO2 eq. / FU
Might have an impact on the
final result
118
9.5 Consistency check
The modelling of the systems within the same product group is based on equivalent methodological considerations concerning system boundaries, allocation, data quality, impact assessment etc. Known exceptions to this general rule are:
• Modelling of Tetra Pak packaging is mainly based on site-specific and recent data, while alternative packages are based on data from databases, literature and previous studies. Data for the glass bottle production is older than corresponding data for other packaging.
• Packaging specifications, including secondary packaging, filling data, transport distances for cap, etc. were provided for one market per package, see Table 2. It was assumed that the same packaging specification was valid on the other three markets, which may not be the case.
• Plastics Production (from Plastics Europe data) is based on average plastic raw materials sold on the market, using national electricity.
• Processes and transports in unknown countries (secondary packaging production), HDPE cap production, and some train transports) have been modelled as being done with EU-25 electricity.
• Forestry and paperboard production data from different suppliers have been modelled by the suppliers themselves. No significant differences have been found in their modelling or system boundaries, but there are some differences in their relative environmental performance, which could be due to such inconsistencies.
• Heat as a co-product from incineration or other processes in the Nordic countries has been given a credit due to replaced district heating. Due to uncertainties in the fact that heat is generated at all and 2) what type of heating should be replaced, this has not been the case in non-Nordic countries.
• No waste management of roll containers has been included, unlike waste management for other types of secondary packaging (wooden pallets, corrugated board, etc.).
• Due to the aggregation of given data, the blow moulding of HDPE and PET bottles have been accounted for in different life cycle phases. As the PET bottles enter the filling machine as PET preforms, while HDPE bottles enter the machine as ready bottles.
• For glass bottle, waste scrap of 0.2 kg per functional unit has been modelled using closed loop due to the format of given data.
• The district heating used for Finland has been approximated, and does likely not cover all of the emissions related to such production.
119
10 Conclusions, limitations and recommendations
The study has given a clear picture of the environmental performance of dairy, juice, Grab & Go and Micro Grab & Go packaging in the Nordics for a large number of Tetra Pak and alternative packaging. This section presents the main conclusions drawn and recommendations based on the presented results.
10.1 Conclusions
Direct comparisons should not be made between products of different product groups, or between ambient and chilled packaging, why the conclusions are presented separately for each group.
Dairy packaging systems
• On all four markets, the chilled liquid carton board packaging systems have significantly lower contribution to global warming potential than the PET and HDPE systems. The difference between packaging types is significantly reduced by filling the plastic packaging locally since the transport from filler to retail includes the weight of the beverage.
• On the Swedish market, the contribution to acidification is significantly lower for the chilled liquid carton board packaging than for the PET and HDPE bottles filled in Germany. When filled locally, the HDPE system only has slightly higher emissions of acidifying substances than the liquid carton board systems. The contribution to eutrophication potential is highest for PET and HDPE filled in Germany, while local filling gives about the same result as liquid carton board packaging.
• For chilled plastic bottles on the Swedish market, the dominating life cycle phases for the global warming, acidification and photochemical oxidant formation potential impact categories are:
o Transport to retail for bottles filled in Germany.
o Plastic production and waste management for bottles filled in Sweden.
• For liquid carton board packaging on all four markets, the dominating life cycle phases for global warming potential are:
o Transport to retail and waste management for the chilled liquid carton board systems.
o Plastics and metal production, transport to retail and waste management for the ambient liquid carton board systems.
120
• On all four markets, Tetra Brik Base has the lowest impact on global warming potential of all chilled Tetra Pak packages. Tear opening (Tetra Brik Base) has 20-30% lower GWP100 than packages with a plastic opening, depending on market.
Juice packaging systems
• On all four markets, the chilled liquid carton board packaging systems have significantly lower contribution to global warming potential than the PET and HDPE systems.
• On the Swedish market, the contribution to photochemical oxidant formation is significantly lower for the chilled liquid carton board packaging than for the PET and HDPE bottles. The contribution to acidification and eutrophication potential is highest for PET, while HDPE has about the same performance as liquid carton board packaging.
• On all markets, Tetra Brik Aseptic Slim has the lowest impact on global warming potential of the ambient juice packaging systems. The production of virgin aluminium gives a relatively high contribution for all three packages.
• On the Swedish market, Tetra Brik Aseptic Slim has the lowest impact on acidification potential, eutrophication potential and photochemical oxidant formation.
Grab & Go packaging systems (250–500 ml):
• On all four markets, the chilled PET 250 ml filled in the United Kingdom has a higher contribution to global warming potential than the HDPE 380 ml system. This is mainly due to the very long transport from filler to retail, which is assumed to be carried out by truck and includes the weight of the beverage. Filling of PET 250 locally has not been within the scope of the study, but one could expect that such a change would dramatically reduce the impact of the PET bottle.
• On the Swedish market, the chilled PET 250 ml filled in the United Kingdom has a dramatically higher impact on acidification, eutrophication and photochemical oxidant formation than the HDPE bottle. This is mainly due to the very long transport from filler to retail.
• On the Swedish, Danish and Finnish markets, the disposable glass packaging system has by far the largest GHG emissions of the ambient Grab & Go packaging. It is the production of the glass and bottle that causes the highest emissions. On all four markets, the APET 500 has significantly larger emissions than the studied Tetra Pak packages, also because of the GHG emissions at production of the raw materials.
• On all four markets, Tetra Top HAAD 250 ml is Tetra Pak package with the highest impact on global warming potential. The largest difference between this package and the other are the plastic cap and top, which gives significantly higher emissions than for the other packages.
121
Micro Grab & Go packaging systems:
• On all four markets, the HDPE 100 ml filled in France has a higher contribution to global warming potential than the Tetra Top Micro system. This is mainly due to the very long transport from filler to retail, which is assumed to be carried out by truck and includes the weight of the beverage. Filling of the HDPE bottle locally has not been within the scope of the study, but one could expect that such a change would dramatically reduce its impact, and change the relative performance of the packages.
• On the Swedish market, the HDPE 100 ml filled in France has a significantly higher contribution to acidification, eutrophication and photochemical oxidant formation than the Tetra Top Micro system. This is mainly due to the very long transport from filler to retail.
The results are divided into the different markets since the goal of this study is related to the study of packaging options at each market separately, and not as a comparison of the markets. Despite this, it is important to know about these differences and the effects on the total results, and to avoid drawing the wrong kind of conclusions.
One difference between the markets is the electricity mix, which affects the environmental impact especially at filling. Another large difference between the markets is the avoided emissions due to recycling and waste management. On the Swedish market, a high recycling rate gives a better environmental performance, while on the Danish market a high rate of incineration with energy recovery gives a better environmental performance.
10.2 Limitations
As for all studies, this LCA have various limitations that are important to remember when interpreting the results. These limitations include the potential difference in product loss between the packaging, the included impact assessment categories and data quality.
The results show the importance of reducing the weight of primary of secondary packaging to reduce the life cycle impact of a selected packaging. However, if this is done with an increase in product loss the attempt to reduce the environmental impact could lead to sub-optimisation or even an increase in environmental impact.
The impact assessment categories were chosen as the categories where there is most scientific consensus, focus and quality of data. Some impact categories that were left out were land use and toxicity. It is uncertain, but possible, that these categories would give a contradictory result to the main conclusions of the report.
Regarding inventory data, a limitation of the study has been that modelling of Tetra Pak packaging is mainly based on site-specific and recent data, while alternative packages are based on data from databases, literature and previous studies. A broad study in the future where all packaging types were based on specific data would be desirable.
122
10.3 Recommendations
In addition to the comparison of different packaging types at each market, the study has highlighted the following points for the Tetra Pak packages:
• The amount of plastic used for the top and opening
• The total weight of the liquid carton board package
• The amount of secondary packaging such as corrugated board and shrink film
• The waste treatment scenario, with a high recycling rate being favourable in most countries, but also incineration with energy recovery being favourable in Denmark.
For all packaging systems, the transport from filler to retail is crucial; filling at the local market gives significantly lower contribution to all studied environmental impacts as compared to filling abroad. This is due to the weight of the beverage being included in the modelling of this transport.
As described in Section 10.2, the scope of this study does not take product loss into account. Any improvements in these points must not cause additional product loss in the life cycle to avoid sub-optimisation and a shift of the environmental burden.
The alternative packages that are filled on the local national market, the plastic and glass production processes are the most contributing part of the product systems.
The recommendations to Tetra Pak based on the results of the study are the following:
• Continue to minimise the amount of plastics used. In this context organic plastics could be an alternative, but they have not been included in this study
• Continue to minimise the materials used for each individual packaging system, including secondary packaging
• Continue to buy renewable energy; so called green electricity, and also to buy it on more sites.
• Continue to set targets for material recycling rate, and try to enhance availability of cardboard and paperboard recycling plants as well as collection systems (even though incineration with energy recovery may be favourable at some markets)
123
11 References
AB Svensk Energiförsörjning (2000), Energifakta, page 2, September 2000, AB Svensk Energiförsörjning, Stockholm, Sweden.
Ahmadian A. (2009), Tetra Pak Processing Systems, Personal contact 2009.
Andersson-Sköld Y, Grennfelt P, Plejel K. (1992) Photochemical Ozone Creation Potentials: A Study of Different Concepts. IVL Swedish Environmental Institute, Gothenburg, Sweden, J of Air Waste Management Association, pp 1152-1158.
Arena U., Mastellone M.L. and Perugini F. (2003), Life Cycle Assessment of a Plastic Packaging Recycling System, Int. J. LCA 8 (2), pp. 92-98.
Arla (1999), Miljövarudeklaration av temperaturreglerad transport av mejerivaror, [Environmental Product Declaration (EPD) of Transportation of Dairy Products], Andersson, K, CIT Ekologik, Chalmers Industriteknik, Gothenburg 1999.
Arias J., Claesson J., Sawalha S. and Rogstam J., (2004), Effektivare Kyla – En inventering, Royal Institute of Technology, Stockholm, Sweden.
Baumann H. and Tillman A-M. (2004), The Hitch Hiker’s Guide to LCA: An orientation in life cycle assessment methodology and application, Studentlitteratur, Lund, Sweden.
Berg and Lindholm (2005a), Energy use and environmental impacts of forest operations in Sweden. Forestry Research Institute of Sweden (Skogforsk). Journal of Cleaner Production 13, pp. 33-42.
Berg and Lindholm (2005b), Corrigendum: Energy use and environmental impacts of forest operations in Sweden [Journal of Cleaner Production 13 (2005) pp. 33-42], Journal of Cleaner Production 13 (2005), p. 327.
Boustead I (2005), Plastics Europe, Eco-profiles of the European Plastics Industry, March 2005, Available at http://www.plasticseurope.com.
Bäckman P., Eriksson E., Ringström E., Andersson K. and Svensson R. (2001) Översiktlig samhällsekonomisk analys av producentansvaret, CIT Ekologik AB, Gothenburg, Sweden.
Cederberg et al (2000), LCA Livsmedel, Metodrapport, SIK, Institutet för Livsmedel och Bioteknik AB, Gothenburg, Sweden.
COOP, (2008), Hållbarhetsredovisning 2008, Available at http://www.coop.se/ upload/modul/coopse/redovisning/Hållbarhetsredovisning2008.pdf
CML (2009), CML Impact Assessment Database, Last update August 2007. Available at http://cml.leiden.edu/software/data-cmlia.html.
124
Curran MA, Mann M, Norris G. (2005), The international workshop on electricity data for life cycle inventories. Journal of Cleaner Production 13(8): 853-862.
EEA (2009), CSI 037 - Use of cleaner and alternative fuels - Assessment published Apr 2009, European Environmental Agency (EEA), Brussels, Belgium. Available at http://themes.eea.europa.eu/IMS/IMS/ISpecs/ISpecification20041007132328/IAssessment1226918420756/view_content, Last visited 2009-08-11.
Ekvall T et al (1998), Life Cycle Assessment of Packaging Systems for Beer and Soft Drinks, Main Report, Miljøprojekt nr.399, Chalmers Industriteknik, Institute for Product Development, Ministry of Environment and Energy, Denmark, and Danish Environmental Protection Agency.
Ekvall T (1999) System Expansion and Allocation in Life Cycle Assessment. PhD thesis. Department of Technical Environmental Planning, Chalmers University of Technology, Gothenburg, Sweden.
Ekvall T., Rydberg T. and Ringström E. (2001), Brytpunkter vid miljömässig jämförelse mellan materialåtervinning och energiutvinning av använda pappersförpackningar, CIT Ekologik, Chalmers Industriteknik, Gothenburg
Ekvall T, Tillman A-M, Molander S. (2005), Normative ethics and methodology for life cycle assessment. J. Cleaner Prod. 13(13-14):1225-1234.
Eriksson E., Svensson G., Blinge M., Svingby M. and Ölund G. (1995), Transporters miljöpåverkan i ett livscykelperspektiv [The Environmental Impact of Transportation in a Life Cycle Perspective], FoU nr 126, REFORSK, Malmö, 1995.
Eriksson E., Börjesson V., Ringström E. and Ljunggren Söderman M. (2001) Samhällsekonomisk jämförelse av bringsystem och fastighetsnära system för insamling av glas, CIT Ekologik AB, Gothenburg.
European Aluminium Association (2008), Environmental Profile Report for the European Aluminium Industry, April 2008
Foster C., Audsley E., Williams A., Webster S., Dewick P. & Green K., (2007), The Environmental, Social and Economic Impacts Associated with Liquid Milk Consumption in the UK and its Production, Department for Environment, Food and Rural Affairs (Defra), London.
Google Maps (2009), Google Maps: Get directions by car, Available at http://maps.google.com, Last visited 2009-08-12.
Grangård (2003), Fiskeby Board, Norrköping, Sweden, personal contact 2003 and Anneli Niva, 2009.
Guinée J.B. and Heijungs R. (2009), A greenhouse gas indicator for bioenergy: some theoretical issues with practical implications, Int. J. of Life Cycle Assessment 14 pp. 328–339.
Heijungs R., Guinée J.B., Huppes G., Lankreijer R.M., Uno de Haes H.A., Wegener Sleeswijk A., Ansems A.M.M, Eggels P.G., van Duin R. and de Goede H.P. (1992).
125
Environmental Life Cycle Assessment of Products - Guide. Centre of Environmental Science, Leiden, The Netherlands.
ISO 14040:1997 (1997), Environmental management – Life cycle assessment – Principals and framework, European Committee for Standardization, Brussels, Belgium.
ISO 14042:1998 (2000), Environmental management – Life cycle assessment – Life cycle impact assessment, European Committee for Standardization, Brussels, Belgium.
ISO 14044:2006 (2006), Environmental management – Life cycle assessment – Requirements and guidelines. European Committee for Standardization, Brussels, Belgium.
Lövgren A. (2009), Tetra Pak Sverige AB, Stockholm, Sweden. Personal contact 2008-2009.
Mattsson N., Unger T. and Ekvall T. (2003), Effects of perturbations in a dynamic system - The case of Nordic power production. in Unger T. (2003) Common energy and climate strategies for the Nordic countries – A model analysis. Ph.D. thesis, Chalmers University of Technology, Gothenburg, Sweden.
Mayhoff J. & Sandpeep R., (2008), Streamlined LCA comparing Chilled and Ambient Milk packaging, Tetra Pak UK, Prepared by ERM
NTM (2007), Environmental data for international cargo transport: Calculation method – mode-specific issues, Network for Transport and the Environment (NTM), Document dated 2007-04-13.
PE International (2006), GaBi Professional Databases 2006.
Ringström E., Berg H. and Eriksson E. (2003), A comparative LCA of four one litre milk packages and two micro packages. A report by CIT Ekologik AB on commission of Tetra Pak Carton Chilled.
Ringström E. and Fröling M. (2003), A comparative LCA of four grab-and-go milk packages. A report by CIT Ekologik AB on commission of Tetra Pak Sverige AB.
SSB (2009), SSB Fjernvarmestatistikk, 2007 [in Norwegian], Statistics Norway. Available at http://www.ssb.no/fjernvarme/. Last visited: 2009-08-25.
Sundqvist et al (1999), Life cycle assessment and solid waste – Guidelines for solid waste treatment and disposal in LCA, Final Report, AFR-report 279, December 1999.
Sörheim E, (2004), Nya fordon med tillhörande data, TFK – Institutet för Transportforskning on demand of NTM.
Wallén E. (2009), Tetra Pak, Lund, Sweden. Personal contact 2008-2009.
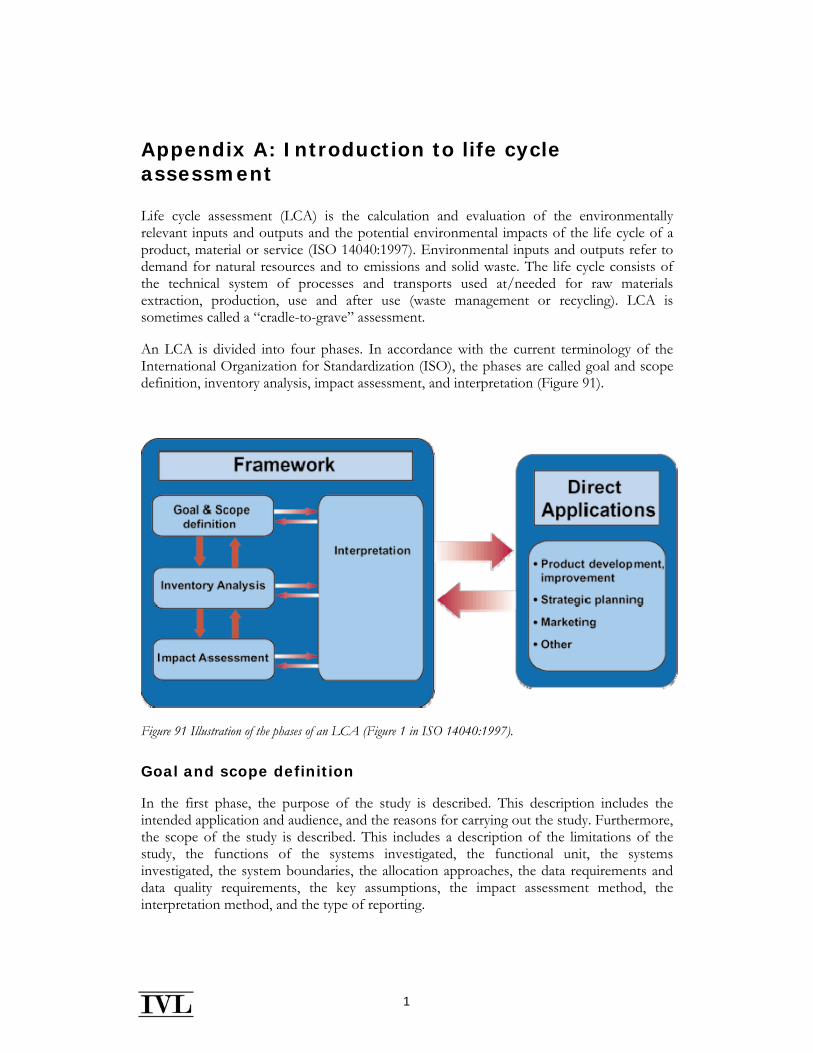
1
Appendix A: Introduction to life cycle assessment
Life cycle assessment (LCA) is the calculation and evaluation of the environmentally relevant inputs and outputs and the potential environmental impacts of the life cycle of a product, material or service (ISO 14040:1997). Environmental inputs and outputs refer to demand for natural resources and to emissions and solid waste. The life cycle consists of the technical system of processes and transports used at/needed for raw materials extraction, production, use and after use (waste management or recycling). LCA is sometimes called a “cradle-to-grave” assessment.
An LCA is divided into four phases. In accordance with the current terminology of the International Organization for Standardization (ISO), the phases are called goal and scope definition, inventory analysis, impact assessment, and interpretation (Figure 91).
Figure 91 Illustration of the phases of an LCA (Figure 1 in ISO 14040:1997).
Goal and scope definition
In the first phase, the purpose of the study is described. This description includes the intended application and audience, and the reasons for carrying out the study. Furthermore, the scope of the study is described. This includes a description of the limitations of the study, the functions of the systems investigated, the functional unit, the systems investigated, the system boundaries, the allocation approaches, the data requirements and data quality requirements, the key assumptions, the impact assessment method, the interpretation method, and the type of reporting.
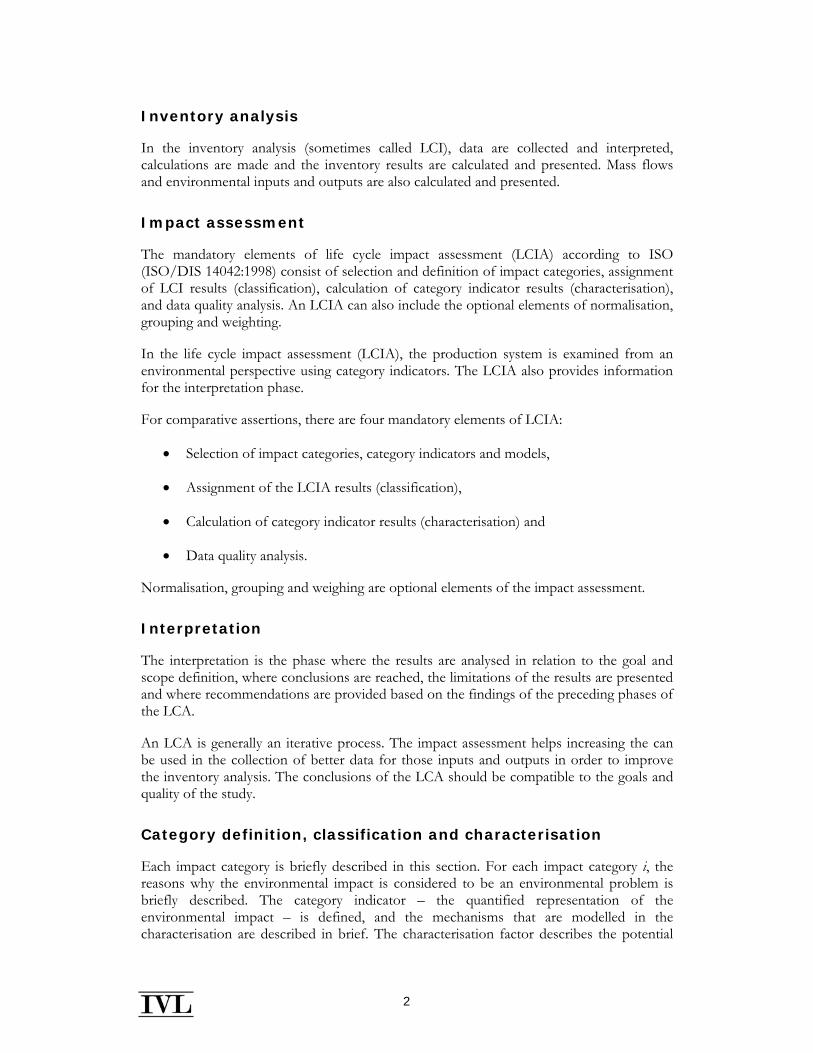
2
Inventory analysis
In the inventory analysis (sometimes called LCI), data are collected and interpreted, calculations are made and the inventory results are calculated and presented. Mass flows and environmental inputs and outputs are also calculated and presented.
Impact assessment
The mandatory elements of life cycle impact assessment (LCIA) according to ISO (ISO/DIS 14042:1998) consist of selection and definition of impact categories, assignment of LCI results (classification), calculation of category indicator results (characterisation), and data quality analysis. An LCIA can also include the optional elements of normalisation, grouping and weighting.
In the life cycle impact assessment (LCIA), the production system is examined from an environmental perspective using category indicators. The LCIA also provides information for the interpretation phase.
For comparative assertions, there are four mandatory elements of LCIA:
• Selection of impact categories, category indicators and models,
• Assignment of the LCIA results (classification),
• Calculation of category indicator results (characterisation) and
• Data quality analysis.
Normalisation, grouping and weighing are optional elements of the impact assessment.
Interpretation
The interpretation is the phase where the results are analysed in relation to the goal and scope definition, where conclusions are reached, the limitations of the results are presented and where recommendations are provided based on the findings of the preceding phases of the LCA.
An LCA is generally an iterative process. The impact assessment helps increasing the can be used in the collection of better data for those inputs and outputs in order to improve the inventory analysis. The conclusions of the LCA should be compatible to the goals and quality of the study.
Category definition, classification and characterisation
Each impact category is briefly described in this section. For each impact category i, the reasons why the environmental impact is considered to be an environmental problem is briefly described. The category indicator – the quantified representation of the environmental impact – is defined, and the mechanisms that are modelled in the characterisation are described in brief. The characterisation factor describes the potential
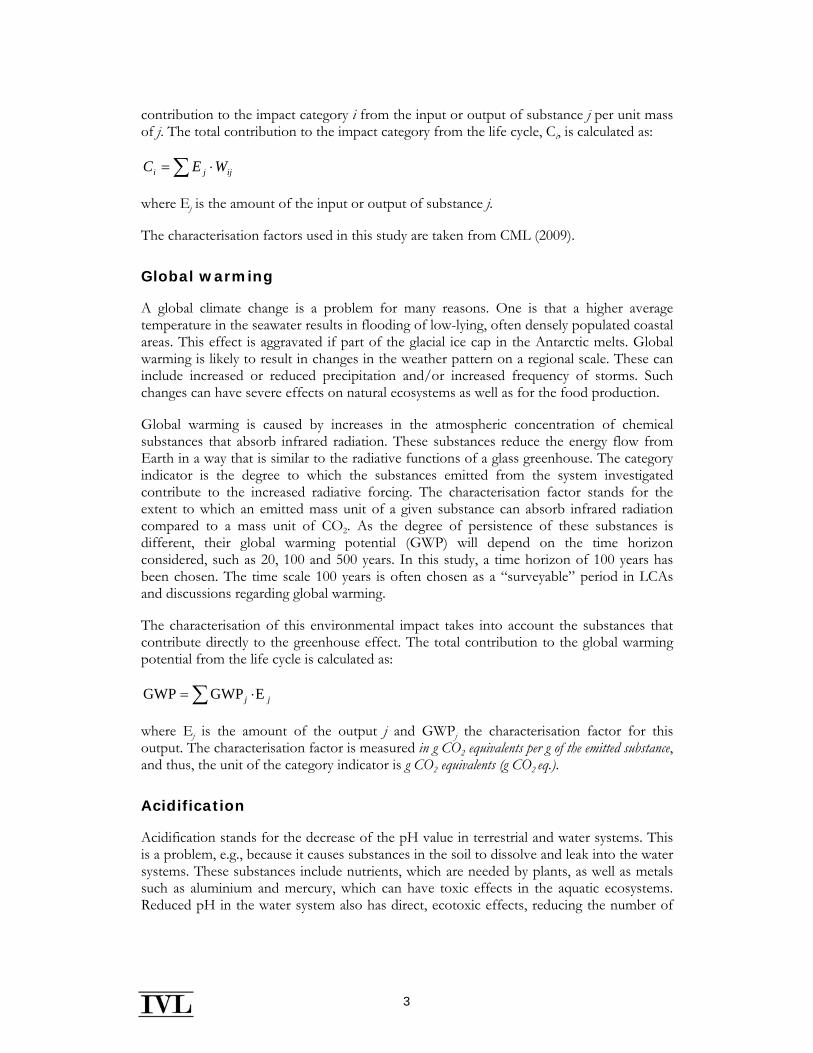
3
contribution to the impact category i from the input or output of substance j per unit mass of j. The total contribution to the impact category from the life cycle, Ci, is calculated as:
∑ ⋅= ijji WEC
where Ej is the amount of the input or output of substance j.
The characterisation factors used in this study are taken from CML (2009).
Global warming
A global climate change is a problem for many reasons. One is that a higher average temperature in the seawater results in flooding of low-lying, often densely populated coastal areas. This effect is aggravated if part of the glacial ice cap in the Antarctic melts. Global warming is likely to result in changes in the weather pattern on a regional scale. These can include increased or reduced precipitation and/or increased frequency of storms. Such changes can have severe effects on natural ecosystems as well as for the food production.
Global warming is caused by increases in the atmospheric concentration of chemical substances that absorb infrared radiation. These substances reduce the energy flow from Earth in a way that is similar to the radiative functions of a glass greenhouse. The category indicator is the degree to which the substances emitted from the system investigated contribute to the increased radiative forcing. The characterisation factor stands for the extent to which an emitted mass unit of a given substance can absorb infrared radiation compared to a mass unit of CO2. As the degree of persistence of these substances is different, their global warming potential (GWP) will depend on the time horizon considered, such as 20, 100 and 500 years. In this study, a time horizon of 100 years has been chosen. The time scale 100 years is often chosen as a “surveyable” period in LCAs and discussions regarding global warming.
The characterisation of this environmental impact takes into account the substances that contribute directly to the greenhouse effect. The total contribution to the global warming potential from the life cycle is calculated as:
∑ ⋅= jj EGWPGWP
where Ej is the amount of the output j and GWPj the characterisation factor for this output. The characterisation factor is measured in g CO2 equivalents per g of the emitted substance, and thus, the unit of the category indicator is g CO2 equivalents (g CO2 eq.).
Acidification
Acidification stands for the decrease of the pH value in terrestrial and water systems. This is a problem, e.g., because it causes substances in the soil to dissolve and leak into the water systems. These substances include nutrients, which are needed by plants, as well as metals such as aluminium and mercury, which can have toxic effects in the aquatic ecosystems. Reduced pH in the water system also has direct, ecotoxic effects, reducing the number of
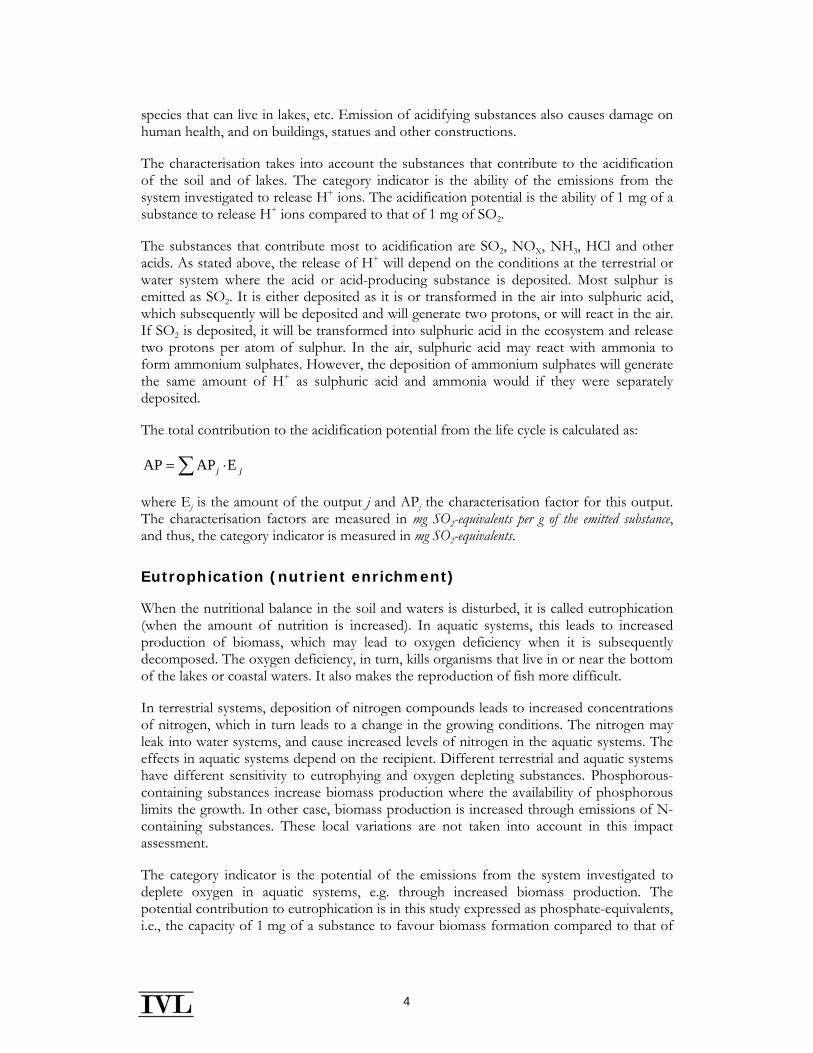
4
species that can live in lakes, etc. Emission of acidifying substances also causes damage on human health, and on buildings, statues and other constructions.
The characterisation takes into account the substances that contribute to the acidification of the soil and of lakes. The category indicator is the ability of the emissions from the system investigated to release H+ ions. The acidification potential is the ability of 1 mg of a substance to release H+ ions compared to that of 1 mg of SO2.
The substances that contribute most to acidification are SO2, NOX, NH3, HCl and other acids. As stated above, the release of H+ will depend on the conditions at the terrestrial or water system where the acid or acid-producing substance is deposited. Most sulphur is emitted as SO2. It is either deposited as it is or transformed in the air into sulphuric acid, which subsequently will be deposited and will generate two protons, or will react in the air. If SO2 is deposited, it will be transformed into sulphuric acid in the ecosystem and release two protons per atom of sulphur. In the air, sulphuric acid may react with ammonia to form ammonium sulphates. However, the deposition of ammonium sulphates will generate the same amount of H+ as sulphuric acid and ammonia would if they were separately deposited.
The total contribution to the acidification potential from the life cycle is calculated as:
∑ ⋅= jj EAPAP
where Ej is the amount of the output j and APj the characterisation factor for this output. The characterisation factors are measured in mg SO2-equivalents per g of the emitted substance, and thus, the category indicator is measured in mg SO2-equivalents.
Eutrophication (nutrient enrichment)
When the nutritional balance in the soil and waters is disturbed, it is called eutrophication (when the amount of nutrition is increased). In aquatic systems, this leads to increased production of biomass, which may lead to oxygen deficiency when it is subsequently decomposed. The oxygen deficiency, in turn, kills organisms that live in or near the bottom of the lakes or coastal waters. It also makes the reproduction of fish more difficult.
In terrestrial systems, deposition of nitrogen compounds leads to increased concentrations of nitrogen, which in turn leads to a change in the growing conditions. The nitrogen may leak into water systems, and cause increased levels of nitrogen in the aquatic systems. The effects in aquatic systems depend on the recipient. Different terrestrial and aquatic systems have different sensitivity to eutrophying and oxygen depleting substances. Phosphorous-containing substances increase biomass production where the availability of phosphorous limits the growth. In other case, biomass production is increased through emissions of N-containing substances. These local variations are not taken into account in this impact assessment.
The category indicator is the potential of the emissions from the system investigated to deplete oxygen in aquatic systems, e.g. through increased biomass production. The potential contribution to eutrophication is in this study expressed as phosphate-equivalents, i.e., the capacity of 1 mg of a substance to favour biomass formation compared to that of
5
1 mg of phosphate (PO43-). Another unit that is used to measure eutrophication NOx-
equivalents. One unit of NOx-equivalents corresponds to 0.13 g PO43--equivalents.
Oxygen depletion in aquatic systems is caused not only by emissions of nutrients that stimulate the biomass production, but also by direct emissions of organic material that is decomposed in the water. These emissions can be measured in terms of BOD (biological oxygen demand), COD (chemical oxygen demand) or TOC (total organic carbon). They are taken into account in the characterisation of this environmental impact.
The total contribution to the Eutrophication potential from the life cycle is calculated as:
∑ ⋅= jj EEPEP
where Ej is the amount of the output j and EPj the characterisation factor for this output. The characterisation factors used for eutrophication are measured in mg PO4
3--equivalents per mg of the emitted substance. Thus, the unit of the category indicator is mg PO4
3--equivalents.
Photochemical ozone formation
This impact category reflects the problem of creation of oxidising compounds (oxidants) through photochemical reactions in the air (close to the ground). An oxidant is by definition substances that are able to oxidise I- (iodide) to I2 (iodine). The most important oxidant in this context is ozone. The tropospheric concentration of ozone and other oxidants has increased during the last century. The surface ozone (ozone close to the earth’s surface) concentration has been doubled in the Northern Hemisphere from the time of pre-industrialisation to today. Surface ozone has toxic effects on humans and vegetation. Smog in large cities is an effect of these kinds of reactions.
The ozone is formed by volatile organic compounds (VOC) and radiation from the sun, under the presence of NOX. When ozone is created under the influence of solar radiation, NO is gained. This substance must be oxidised back to NO2 by another molecule than the ozone, in order to get a net increase of ozone. Peroxy radicals mainly from decomposed VOCs act as oxidising agents. If the background level of NOX is low, NOX may be the limiting factor for ozone formation. Where the atmospheric NOX concentration is high, the concentration of VOCs and, hence peroxy radicals is the limiting factor. The most efficient ozone producers are propene and ethene, but also higher alkenes, aromatics, alkanes and ethers produce ozone.
The impact indicator for photochemical oxidant formation (POCP) is the potential of the emissions from the system investigated to contribute to the creation of oxidising compounds. The equivalent used for this impact category is mg ethene (C2H4); the photochemical oxidant creation potential of a substance is a measure of the extent to which a mass unit of the substance forms oxidants compared to the oxidant formation from a mass unit of ethene.
The total POCP of the emissions from the life cycle is calculated as:
∑ ⋅= jj EPOCPPOCP
6
where Ej is the amount of the output j and POCPj the characterisation factor for this output. The characterisation factors for photochemical ozone formation are measured in mg C2H4-equivalents per mg of the emitted substance. Thus, the category indicator is measured in mg C2H4-equivalents.
Stratospheric ozone depletion potential
This impact category concerns substances depleting the stratospheric ozone (O3) layer in the stratosphere. This layer is located 11-50 km above the earth surface but with a concentration between 20 and 40 km. The ozone layer absorbs ultraviolet (UV) radiation of short wavelengths (280-310 nm) and radiates heat. Ozone is the only substance that effectively absorbs the UV-B radiation. The absorption of the UV radiation of these wavelengths (called UV-B radiation) is important, since this radiation is the cause of most human skin cancer, and it has perhaps even greater effects on other biological species. Approximately 90% of the earth’s atmospheric ozone is located in the stratosphere.
The category indicator of stratospheric ozone depletion potential (ODP) is the potential of the emissions from the system investigated to contribute to the depletion of the stratospheric ozone. It is quantified relative to the ozone depletion potential of the chlorofluorocarbon CFC-11, using a “CFC11-equivalent” unit. The World Meteorological Organization (WMO) has assessed the potential of different substances. The CFC (chlorofluorocarbons) and halon (bromofluoro-carbons) molecules emitted at earth surface are only decomposed by high energy UV. Therefore, they survive in the lower atmosphere, but as soon as they reach the middle stratosphere, they will absorb high-energy UV radiation and decompose. The released chlorine or bromine atoms will react with ozone, which will be decomposed. Beside CFCs and halons, some other halogenated substances such as chlorinated solvents contribute to this impact.
The total contribution to the ozone depletion potential from the life cycle is calculated as:
ODP = Σ ODPj * Ej
where Ej is the amount of the output j and ODPj the characterisation factor for this output.
The unit of the characterisation factors used for ozone depletion is g CFC11-equivalents per g of the emitted substance and thus, the unit of the category indicator is g CFC11-equivalents
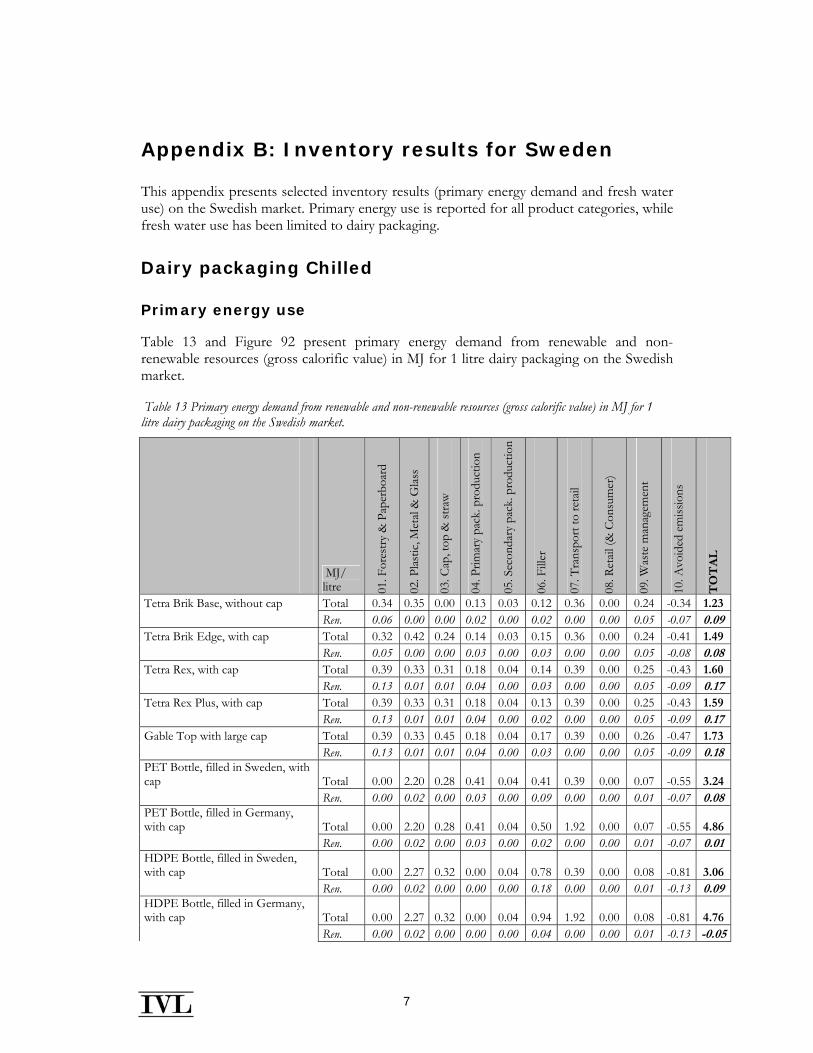
7
Appendix B: Inventory results for Sweden
This appendix presents selected inventory results (primary energy demand and fresh water use) on the Swedish market. Primary energy use is reported for all product categories, while fresh water use has been limited to dairy packaging.
Dairy packaging Chilled
Primary energy use
Table 13 and Figure 92 present primary energy demand from renewable and non-renewable resources (gross calorific value) in MJ for 1 litre dairy packaging on the Swedish market.
Table 13 Primary energy demand from renewable and non-renewable resources (gross calorific value) in MJ for 1 litre dairy packaging on the Swedish market.
MJ/ litre 01
. For
estry
& P
aper
boar
d
02. P
lastic
, Met
al &
Glas
s
03. C
ap, t
op &
stra
w
04. P
rimar
y pa
ck. p
rodu
ctio
n
05. S
econ
dary
pac
k. p
rodu
ctio
n
06. F
iller
07. T
rans
port
to re
tail
08. R
etail
(& C
onsu
mer
)
09. W
aste
man
agem
ent
10. A
void
ed e
miss
ions
TO
TA
L
Tetra Brik Base, without cap Total 0.34 0.35 0.00 0.13 0.03 0.12 0.36 0.00 0.24 -0.34 1.23 Ren. 0.06 0.00 0.00 0.02 0.00 0.02 0.00 0.00 0.05 -0.07 0.09Tetra Brik Edge, with cap Total 0.32 0.42 0.24 0.14 0.03 0.15 0.36 0.00 0.24 -0.41 1.49 Ren. 0.05 0.00 0.00 0.03 0.00 0.03 0.00 0.00 0.05 -0.08 0.08Tetra Rex, with cap Total 0.39 0.33 0.31 0.18 0.04 0.14 0.39 0.00 0.25 -0.43 1.60 Ren. 0.13 0.01 0.01 0.04 0.00 0.03 0.00 0.00 0.05 -0.09 0.17Tetra Rex Plus, with cap Total 0.39 0.33 0.31 0.18 0.04 0.13 0.39 0.00 0.25 -0.43 1.59 Ren. 0.13 0.01 0.01 0.04 0.00 0.02 0.00 0.00 0.05 -0.09 0.17Gable Top with large cap Total 0.39 0.33 0.45 0.18 0.04 0.17 0.39 0.00 0.26 -0.47 1.73 Ren. 0.13 0.01 0.01 0.04 0.00 0.03 0.00 0.00 0.05 -0.09 0.18PET Bottle, filled in Sweden, with cap Total 0.00 2.20 0.28 0.41 0.04 0.41 0.39 0.00 0.07 -0.55 3.24 Ren. 0.00 0.02 0.00 0.03 0.00 0.09 0.00 0.00 0.01 -0.07 0.08PET Bottle, filled in Germany, with cap Total 0.00 2.20 0.28 0.41 0.04 0.50 1.92 0.00 0.07 -0.55 4.86 Ren. 0.00 0.02 0.00 0.03 0.00 0.02 0.00 0.00 0.01 -0.07 0.01HDPE Bottle, filled in Sweden, with cap Total 0.00 2.27 0.32 0.00 0.04 0.78 0.39 0.00 0.08 -0.81 3.06 Ren. 0.00 0.02 0.00 0.00 0.00 0.18 0.00 0.00 0.01 -0.13 0.09HDPE Bottle, filled in Germany, with cap Total 0.00 2.27 0.32 0.00 0.04 0.94 1.92 0.00 0.08 -0.81 4.76 Ren. 0.00 0.02 0.00 0.00 0.00 0.04 0.00 0.00 0.01 -0.13 -0.05
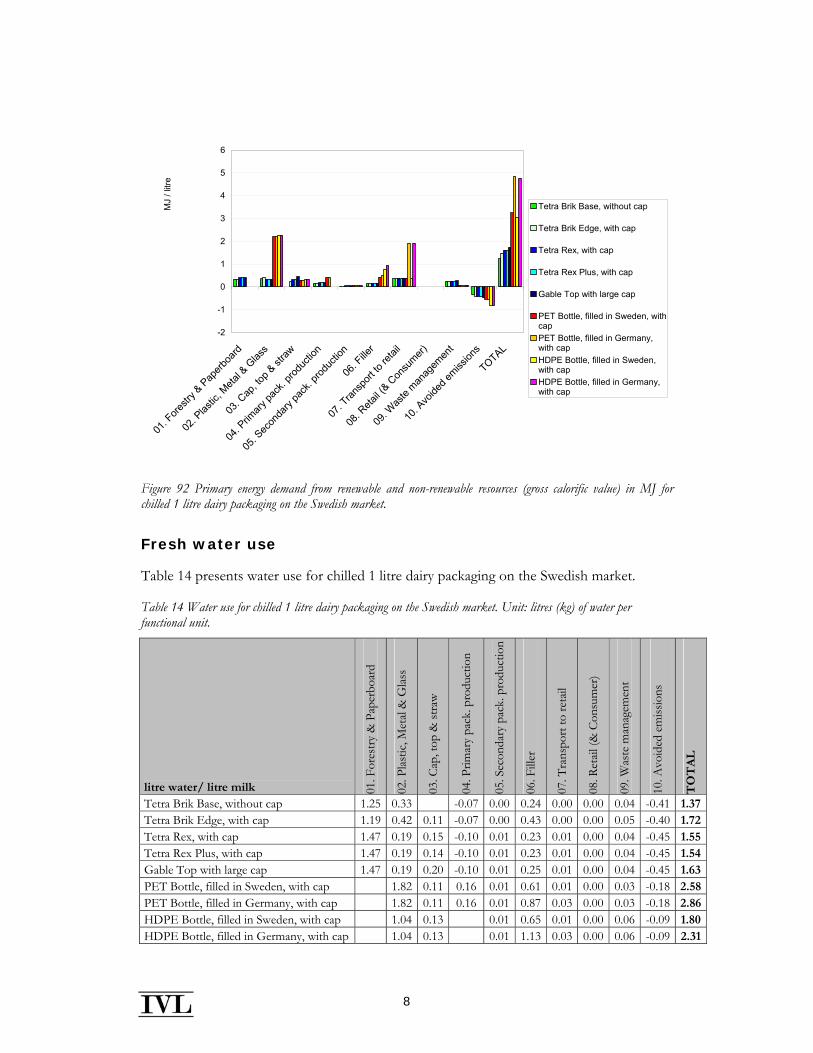
8
-2
-1
0
1
2
3
4
5
6
01. F
orestr
y & Pap
erboa
rd
02. P
lastic
, Meta
l & G
lass
03. C
ap, to
p & st
raw
04. P
rimary
pack
. prod
uctio
n
05. S
econ
dary
pack
. prod
uctio
n
06. F
iller
07. T
ransp
ort to
retai
l
08. R
etail (
& Con
sumer)
09. W
aste
manag
emen
t
10. A
voide
d emiss
ions
TOTAL
MJ
/ litr
e
Tetra Brik Base, without cap
Tetra Brik Edge, with cap
Tetra Rex, with cap
Tetra Rex Plus, with cap
Gable Top with large cap
PET Bottle, filled in Sweden, withcapPET Bottle, filled in Germany,with capHDPE Bottle, filled in Sweden,with capHDPE Bottle, filled in Germany,with cap
Figure 92 Primary energy demand from renewable and non-renewable resources (gross calorific value) in MJ for chilled 1 litre dairy packaging on the Swedish market.
Fresh water use
Table 14 presents water use for chilled 1 litre dairy packaging on the Swedish market.
Table 14 Water use for chilled 1 litre dairy packaging on the Swedish market. Unit: litres (kg) of water per functional unit.
litre water/ litre milk 01. F
ores
try &
Pap
erbo
ard
02. P
lastic
, Met
al &
Glas
s
03. C
ap, t
op &
stra
w
04. P
rimar
y pa
ck. p
rodu
ctio
n
05. S
econ
dary
pac
k. p
rodu
ctio
n
06. F
iller
07. T
rans
port
to re
tail
08. R
etail
(& C
onsu
mer
)
09. W
aste
man
agem
ent
10. A
void
ed e
miss
ions
TO
TA
L
Tetra Brik Base, without cap 1.25 0.33 -0.07 0.00 0.24 0.00 0.00 0.04 -0.41 1.37Tetra Brik Edge, with cap 1.19 0.42 0.11 -0.07 0.00 0.43 0.00 0.00 0.05 -0.40 1.72Tetra Rex, with cap 1.47 0.19 0.15 -0.10 0.01 0.23 0.01 0.00 0.04 -0.45 1.55Tetra Rex Plus, with cap 1.47 0.19 0.14 -0.10 0.01 0.23 0.01 0.00 0.04 -0.45 1.54Gable Top with large cap 1.47 0.19 0.20 -0.10 0.01 0.25 0.01 0.00 0.04 -0.45 1.63PET Bottle, filled in Sweden, with cap 1.82 0.11 0.16 0.01 0.61 0.01 0.00 0.03 -0.18 2.58PET Bottle, filled in Germany, with cap 1.82 0.11 0.16 0.01 0.87 0.03 0.00 0.03 -0.18 2.86HDPE Bottle, filled in Sweden, with cap 1.04 0.13 0.01 0.65 0.01 0.00 0.06 -0.09 1.80HDPE Bottle, filled in Germany, with cap 1.04 0.13 0.01 1.13 0.03 0.00 0.06 -0.09 2.31
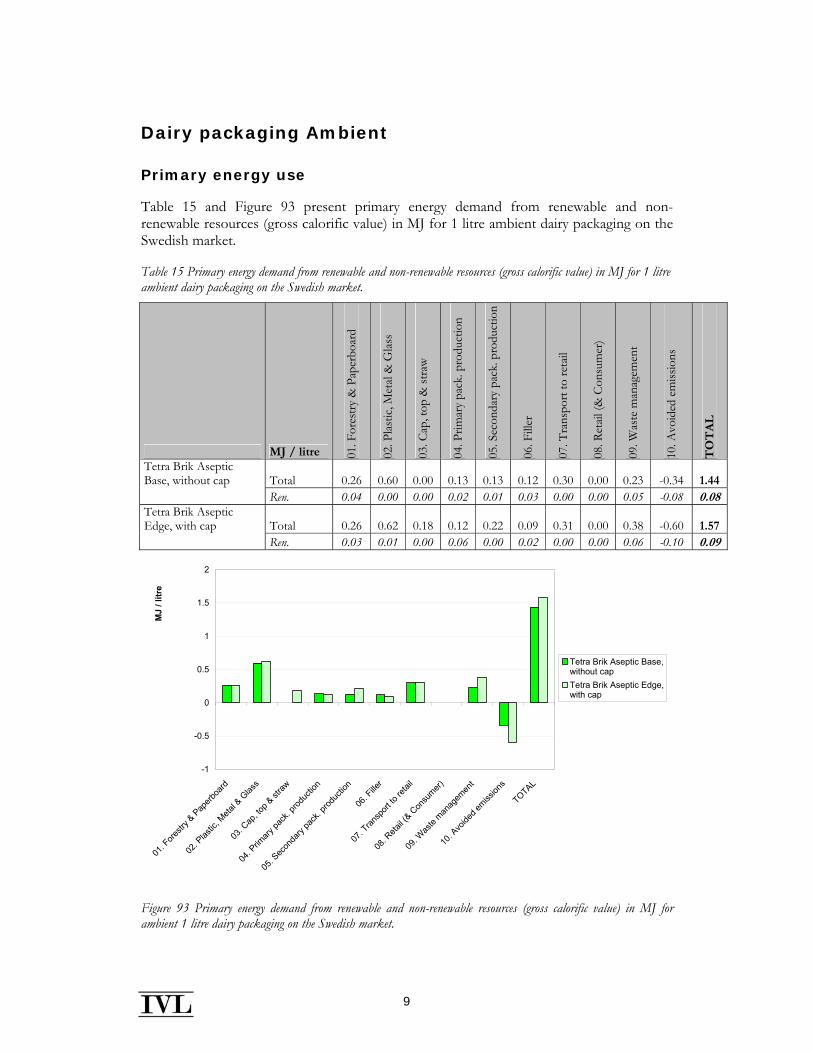
9
Dairy packaging Ambient
Primary energy use
Table 15 and Figure 93 present primary energy demand from renewable and non-renewable resources (gross calorific value) in MJ for 1 litre ambient dairy packaging on the Swedish market.
Table 15 Primary energy demand from renewable and non-renewable resources (gross calorific value) in MJ for 1 litre ambient dairy packaging on the Swedish market.
MJ / litre 01. F
ores
try &
Pap
erbo
ard
02. P
lastic
, Met
al &
Glas
s
03. C
ap, t
op &
stra
w
04. P
rimar
y pa
ck. p
rodu
ctio
n
05. S
econ
dary
pac
k. p
rodu
ctio
n
06. F
iller
07. T
rans
port
to re
tail
08. R
etail
(& C
onsu
mer
)
09. W
aste
man
agem
ent
10. A
void
ed e
miss
ions
TO
TA
L
Tetra Brik Aseptic Base, without cap Total 0.26 0.60 0.00 0.13 0.13 0.12 0.30 0.00 0.23 -0.34 1.44 Ren. 0.04 0.00 0.00 0.02 0.01 0.03 0.00 0.00 0.05 -0.08 0.08Tetra Brik Aseptic Edge, with cap Total 0.26 0.62 0.18 0.12 0.22 0.09 0.31 0.00 0.38 -0.60 1.57 Ren. 0.03 0.01 0.00 0.06 0.00 0.02 0.00 0.00 0.06 -0.10 0.09
-1
-0.5
0
0.5
1
1.5
2
01. F
orestr
y & P
aperb
oard
02. P
lastic
, Meta
l & G
lass
03. C
ap, to
p & st
raw
04. P
rimary
pack
. prod
uctio
n
05. S
econ
dary
pack
. prod
uctio
n
06. F
iller
07. T
ransp
ort to
retai
l
08. R
etail (
& Con
sumer)
09. W
aste
manag
emen
t
10. A
voide
d emiss
ions
TOTAL
MJ
/ litr
e
Tetra Brik Aseptic Base,without capTetra Brik Aseptic Edge,with cap
Figure 93 Primary energy demand from renewable and non-renewable resources (gross calorific value) in MJ for ambient 1 litre dairy packaging on the Swedish market.
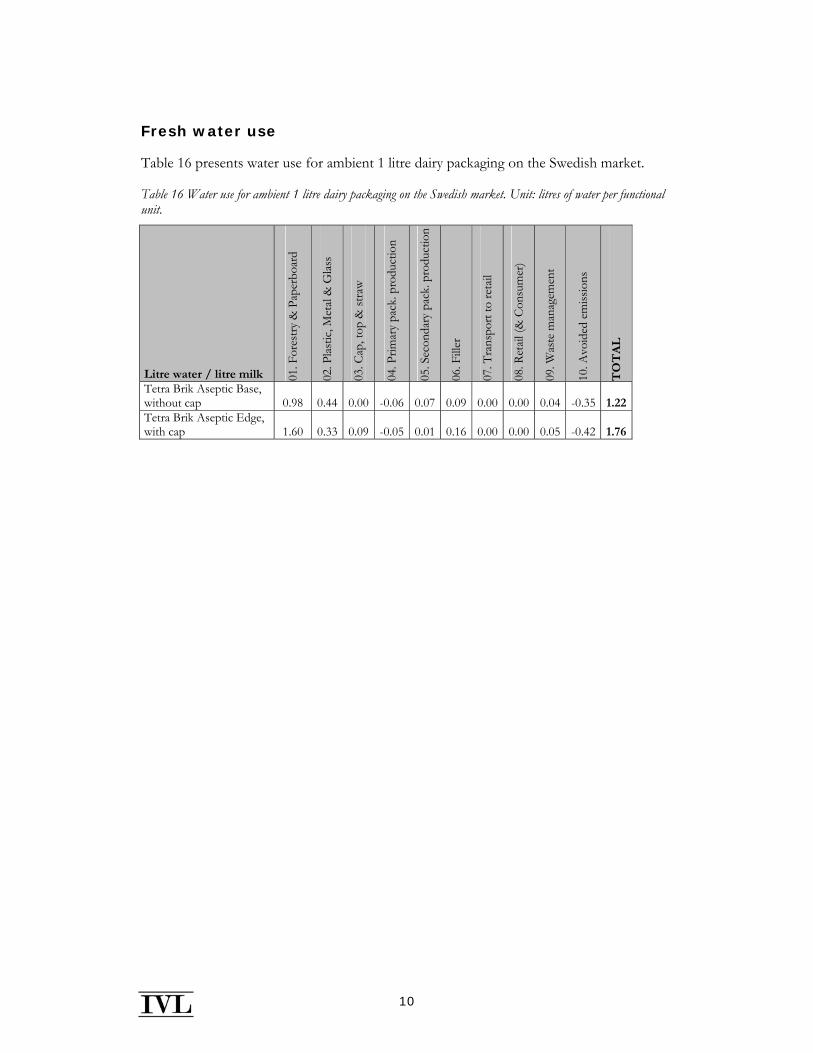
10
Fresh water use
Table 16 presents water use for ambient 1 litre dairy packaging on the Swedish market.
Table 16 Water use for ambient 1 litre dairy packaging on the Swedish market. Unit: litres of water per functional unit.
Litre water / litre milk 01. F
ores
try &
Pap
erbo
ard
02. P
lastic
, Met
al &
Glas
s
03. C
ap, t
op &
stra
w
04. P
rimar
y pa
ck. p
rodu
ctio
n
05. S
econ
dary
pac
k. p
rodu
ctio
n
06. F
iller
07. T
rans
port
to re
tail
08. R
etail
(& C
onsu
mer
)
09. W
aste
man
agem
ent
10. A
void
ed e
miss
ions
TO
TA
L
Tetra Brik Aseptic Base, without cap 0.98 0.44 0.00 -0.06 0.07 0.09 0.00 0.00 0.04 -0.35 1.22 Tetra Brik Aseptic Edge, with cap 1.60 0.33 0.09 -0.05 0.01 0.16 0.00 0.00 0.05 -0.42 1.76
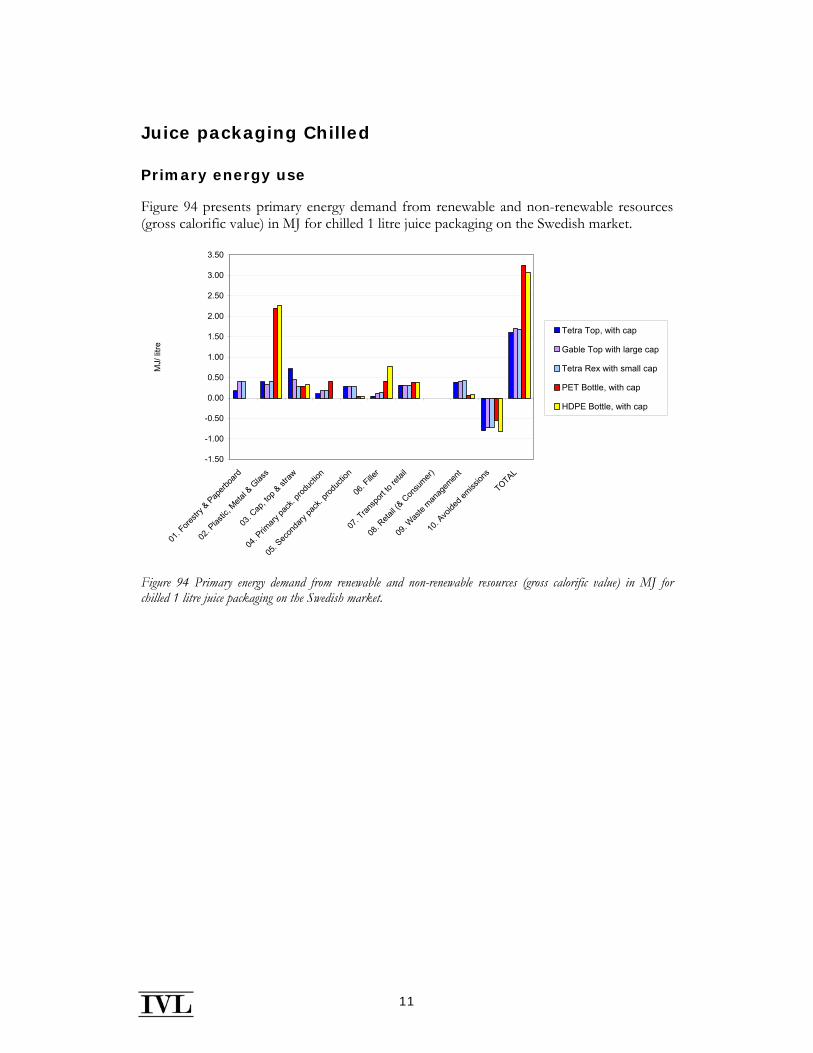
11
Juice packaging Chilled
Primary energy use
Figure 94 presents primary energy demand from renewable and non-renewable resources (gross calorific value) in MJ for chilled 1 litre juice packaging on the Swedish market.
-1.50
-1.00
-0.50
0.00
0.50
1.00
1.50
2.00
2.50
3.00
3.50
01. F
orestr
y & Pap
erboa
rd
02. P
lastic
, Meta
l & G
lass
03. C
ap, to
p & st
raw
04. P
rimary
pack
. prod
uctio
n
05. S
econ
dary
pack
. prod
uctio
n
06. F
iller
07. T
ransp
ort to
retai
l
08. R
etail (
& Con
sumer)
09. W
aste
manag
emen
t
10. A
voide
d emiss
ions
TOTAL
MJ/
litre
Tetra Top, with cap
Gable Top with large cap
Tetra Rex with small cap
PET Bottle, with cap
HDPE Bottle, with cap
Figure 94 Primary energy demand from renewable and non-renewable resources (gross calorific value) in MJ for chilled 1 litre juice packaging on the Swedish market.
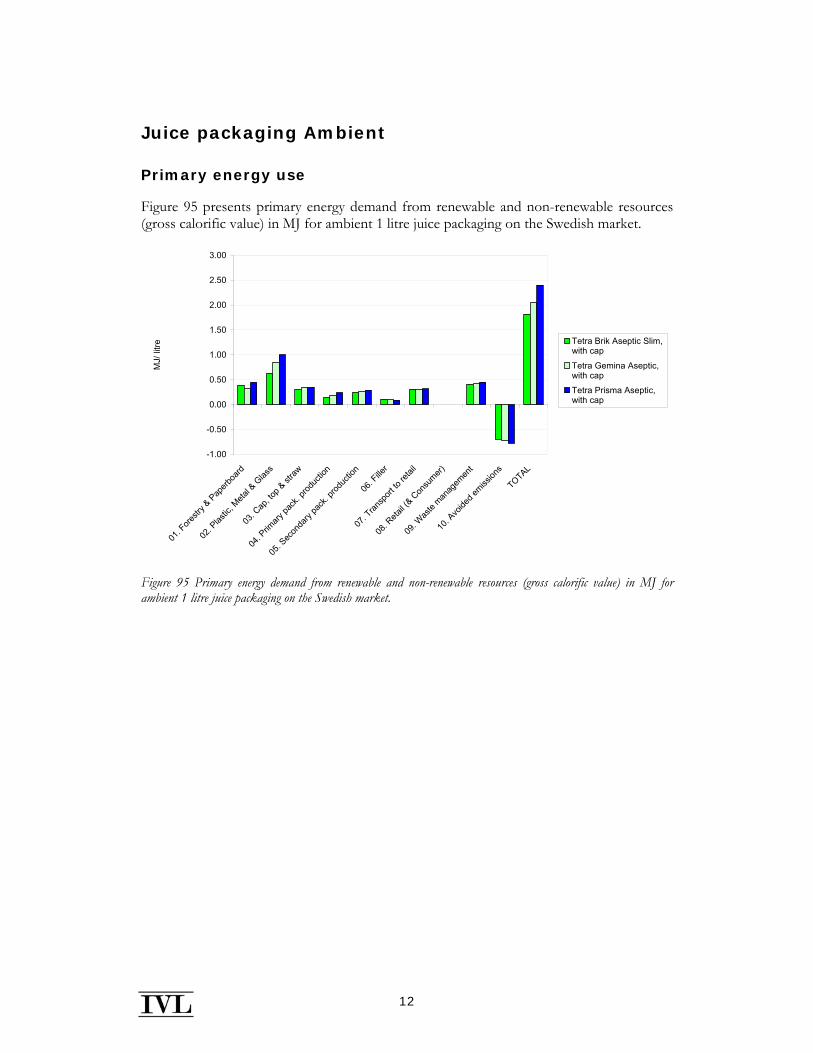
12
Juice packaging Ambient
Primary energy use
Figure 95 presents primary energy demand from renewable and non-renewable resources (gross calorific value) in MJ for ambient 1 litre juice packaging on the Swedish market.
-1.00
-0.50
0.00
0.50
1.00
1.50
2.00
2.50
3.00
01. F
orestr
y & P
aperb
oard
02. P
lastic
, Meta
l & G
lass
03. C
ap, to
p & st
raw
04. P
rimary
pack
. prod
uctio
n
05. S
econ
dary
pack
. prod
uctio
n
06. F
iller
07. T
ransp
ort to
retai
l
08. R
etail (
& Con
sumer)
09. W
aste
manag
emen
t
10. A
voide
d emiss
ions
TOTAL
MJ/
litre
Tetra Brik Aseptic Slim,with cap
Tetra Gemina Aseptic,with cap
Tetra Prisma Aseptic,with cap
Figure 95 Primary energy demand from renewable and non-renewable resources (gross calorific value) in MJ for ambient 1 litre juice packaging on the Swedish market.
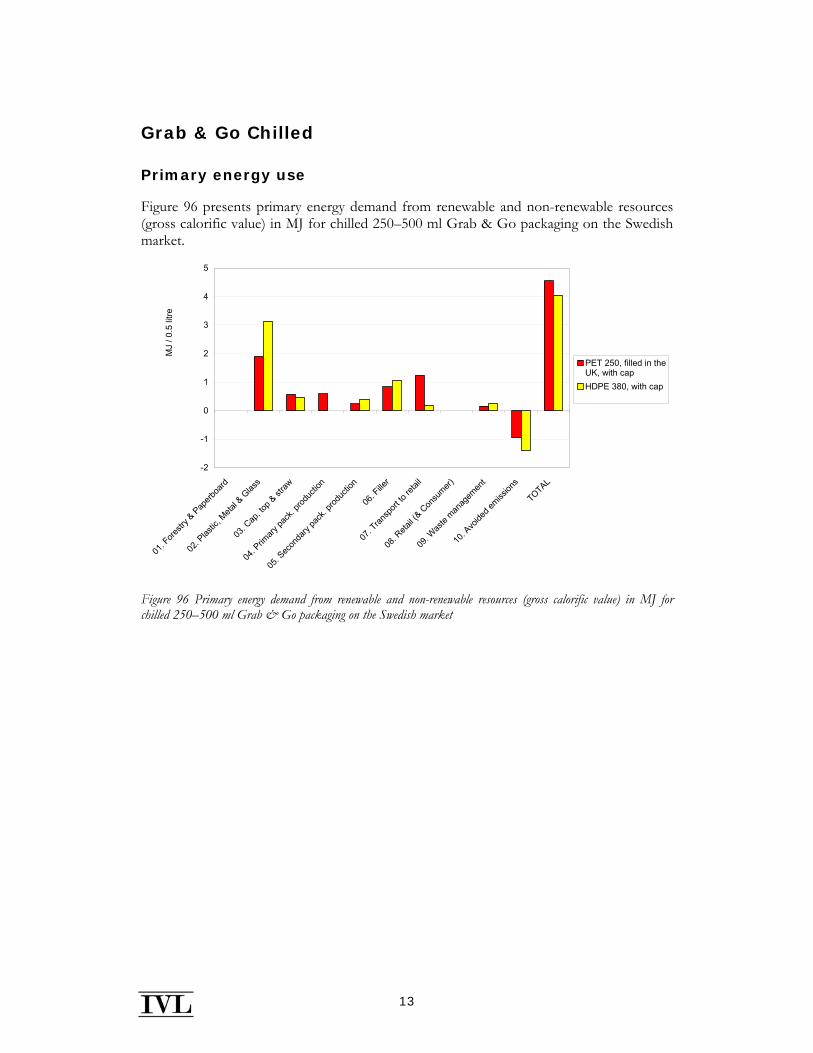
13
Grab & Go Chilled
Primary energy use
Figure 96 presents primary energy demand from renewable and non-renewable resources (gross calorific value) in MJ for chilled 250–500 ml Grab & Go packaging on the Swedish market.
-2
-1
0
1
2
3
4
5
01. F
orestr
y & P
aperb
oard
02. P
lastic
, Meta
l & G
lass
03. C
ap, to
p & st
raw
04. P
rimary
pack
. prod
uctio
n
05. S
econ
dary
pack
. prod
uctio
n
06. F
iller
07. T
ransp
ort to
retai
l
08. R
etail (
& Con
sumer)
09. W
aste
manag
emen
t
10. A
voide
d emiss
ions
TOTAL
MJ
/ 0.5
litre
PET 250, filled in theUK, with capHDPE 380, with cap
Figure 96 Primary energy demand from renewable and non-renewable resources (gross calorific value) in MJ for chilled 250–500 ml Grab & Go packaging on the Swedish market
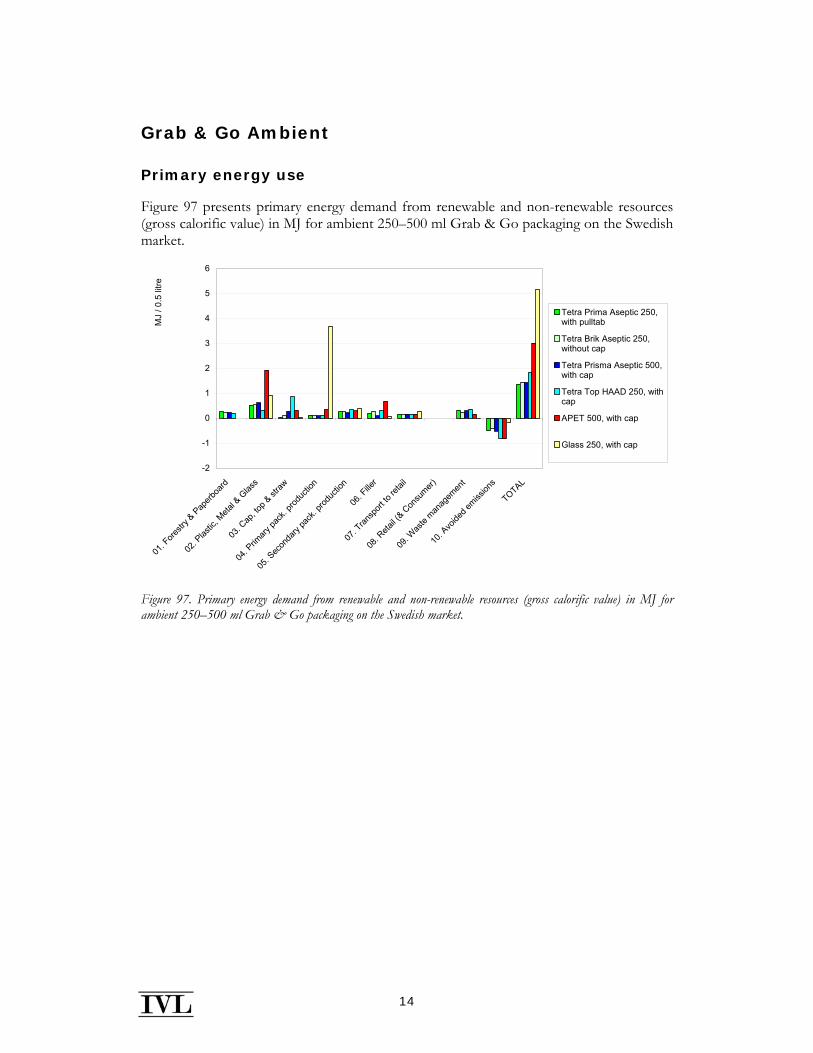
14
Grab & Go Ambient
Primary energy use
Figure 97 presents primary energy demand from renewable and non-renewable resources (gross calorific value) in MJ for ambient 250–500 ml Grab & Go packaging on the Swedish market.
-2
-1
0
1
2
3
4
5
6
01. F
orestr
y & P
aperb
oard
02. P
lastic
, Meta
l & G
lass
03. C
ap, to
p & st
raw
04. P
rimary
pack
. prod
uctio
n
05. S
econ
dary
pack
. prod
uctio
n
06. F
iller
07. T
ransp
ort to
retai
l
08. R
etail (
& Con
sumer)
09. W
aste
manag
emen
t
10. A
voide
d emiss
ions
TOTAL
MJ
/ 0.5
litre
Tetra Prima Aseptic 250,with pulltab
Tetra Brik Aseptic 250,without cap
Tetra Prisma Aseptic 500,with cap
Tetra Top HAAD 250, withcap
APET 500, with cap
Glass 250, with cap
Figure 97. Primary energy demand from renewable and non-renewable resources (gross calorific value) in MJ for ambient 250–500 ml Grab & Go packaging on the Swedish market.
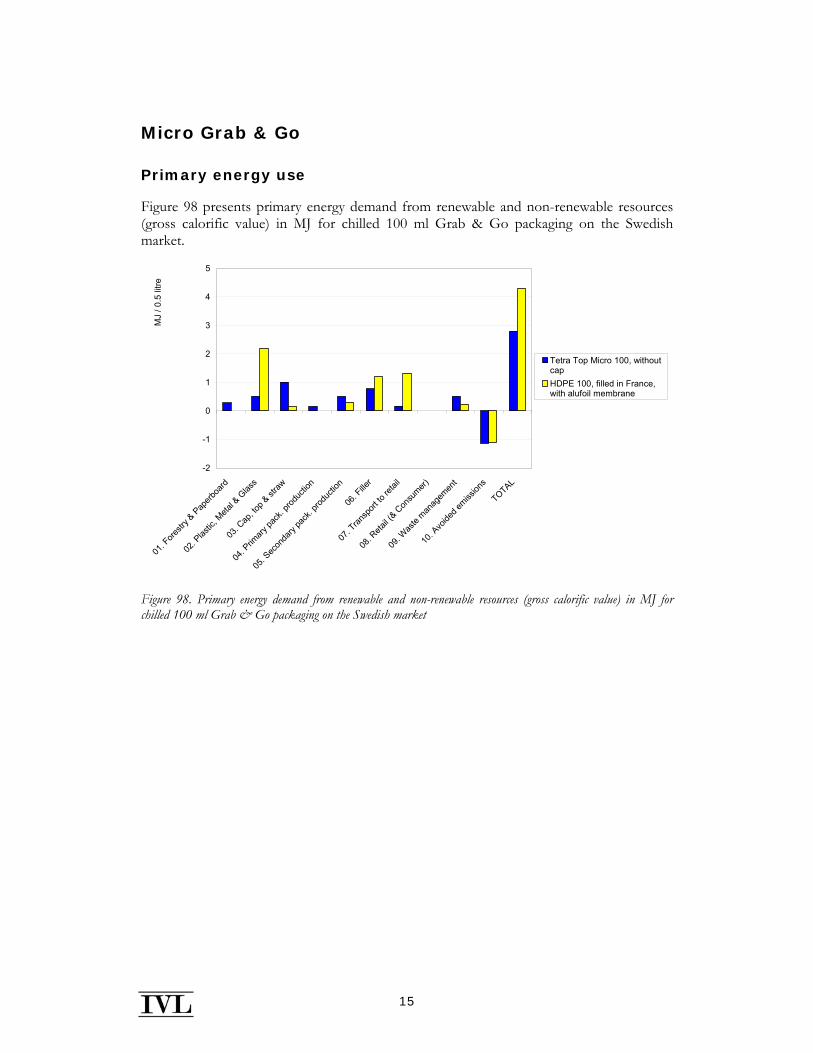
15
Micro Grab & Go
Primary energy use
Figure 98 presents primary energy demand from renewable and non-renewable resources (gross calorific value) in MJ for chilled 100 ml Grab & Go packaging on the Swedish market.
-2
-1
0
1
2
3
4
5
01. F
orestr
y & P
aperb
oard
02. P
lastic
, Meta
l & G
lass
03. C
ap, to
p & st
raw
04. P
rimary
pack
. prod
uctio
n
05. S
econ
dary
pack
. prod
uctio
n
06. F
iller
07. T
ransp
ort to
retai
l
08. R
etail (
& Con
sumer)
09. W
aste
manag
emen
t
10. A
voide
d emiss
ions
TOTAL
MJ
/ 0.5
litre
Tetra Top Micro 100, withoutcapHDPE 100, filled in France,with alufoil membrane
Figure 98. Primary energy demand from renewable and non-renewable resources (gross calorific value) in MJ for chilled 100 ml Grab & Go packaging on the Swedish market
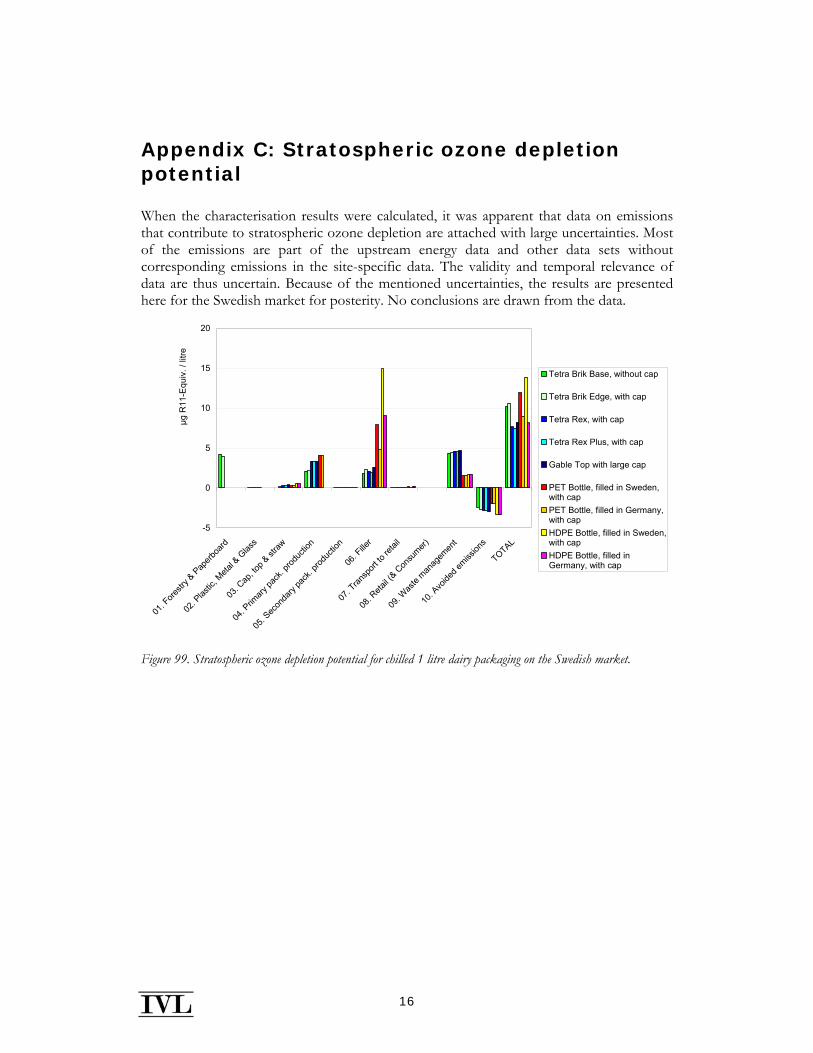
16
Appendix C: Stratospheric ozone depletion potential
When the characterisation results were calculated, it was apparent that data on emissions that contribute to stratospheric ozone depletion are attached with large uncertainties. Most of the emissions are part of the upstream energy data and other data sets without corresponding emissions in the site-specific data. The validity and temporal relevance of data are thus uncertain. Because of the mentioned uncertainties, the results are presented here for the Swedish market for posterity. No conclusions are drawn from the data.
-5
0
5
10
15
20
01. F
orestr
y & P
aperb
oard
02. P
lastic
, Meta
l & G
lass
03. C
ap, to
p & st
raw
04. P
rimary
pack
. prod
uctio
n
05. S
econ
dary
pack
. prod
uctio
n
06. F
iller
07. T
ransp
ort to
retai
l
08. R
etail (
& Con
sumer)
09. W
aste
manag
emen
t
10. A
voide
d emiss
ions
TOTAL
μg R
11-E
quiv
. / li
tre
Tetra Brik Base, without cap
Tetra Brik Edge, with cap
Tetra Rex, with cap
Tetra Rex Plus, with cap
Gable Top with large cap
PET Bottle, filled in Sweden,with capPET Bottle, filled in Germany,with capHDPE Bottle, filled in Sweden,with capHDPE Bottle, filled inGermany, with cap
Figure 99. Stratospheric ozone depletion potential for chilled 1 litre dairy packaging on the Swedish market.
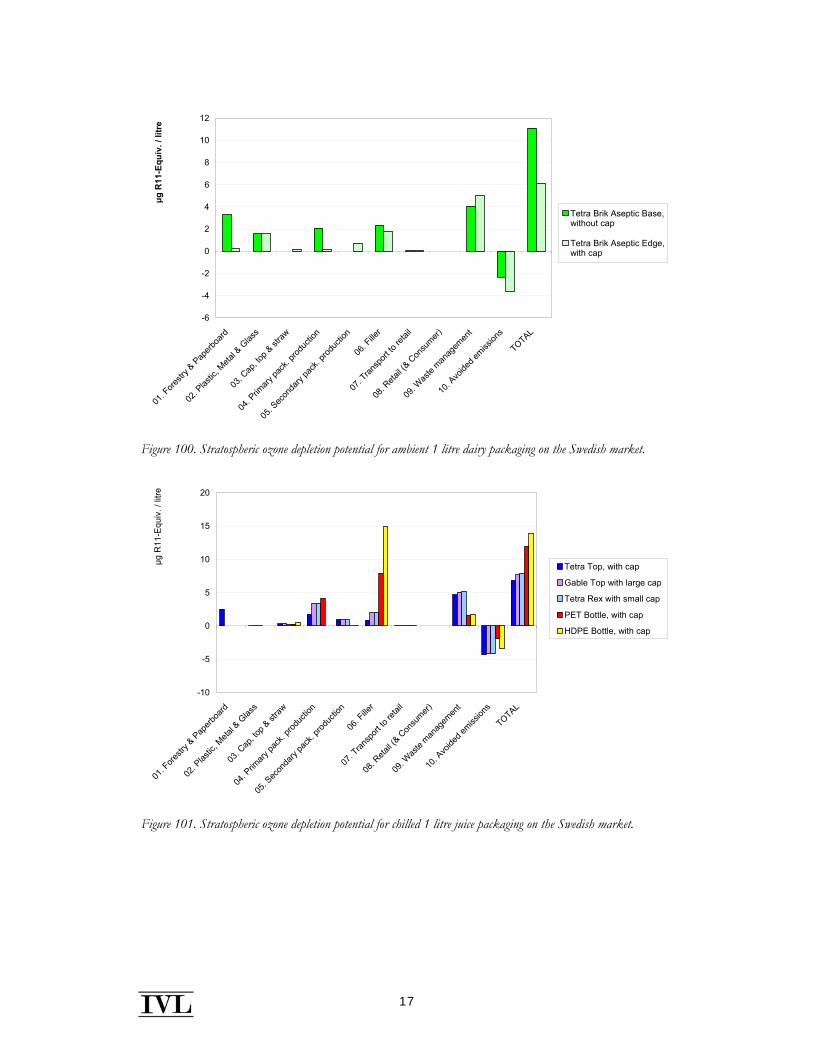
17
-6
-4
-2
0
2
4
6
8
10
12
01. F
orestr
y & P
aperb
oard
02. P
lastic
, Meta
l & G
lass
03. C
ap, to
p & st
raw
04. P
rimary
pack
. prod
uctio
n
05. S
econ
dary
pack
. prod
uctio
n
06. F
iller
07. T
ransp
ort to
retai
l
08. R
etail (
& Con
sumer)
09. W
aste
manag
emen
t
10. A
voide
d emiss
ions
TOTAL
μg R
11-E
quiv
. / li
tre
Tetra Brik Aseptic Base,without cap
Tetra Brik Aseptic Edge,with cap
Figure 100. Stratospheric ozone depletion potential for ambient 1 litre dairy packaging on the Swedish market.
-10
-5
0
5
10
15
20
01. F
orestr
y & P
aperb
oard
02. P
lastic
, Meta
l & G
lass
03. C
ap, to
p & st
raw
04. P
rimary
pack
. prod
uctio
n
05. S
econ
dary
pack
. prod
uctio
n
06. F
iller
07. T
ransp
ort to
retai
l
08. R
etail (
& Con
sumer)
09. W
aste
manag
emen
t
10. A
voide
d emiss
ions
TOTAL
μg R
11-E
quiv
. / li
tre
Tetra Top, with cap
Gable Top with large cap
Tetra Rex with small cap
PET Bottle, with cap
HDPE Bottle, with cap
Figure 101. Stratospheric ozone depletion potential for chilled 1 litre juice packaging on the Swedish market.
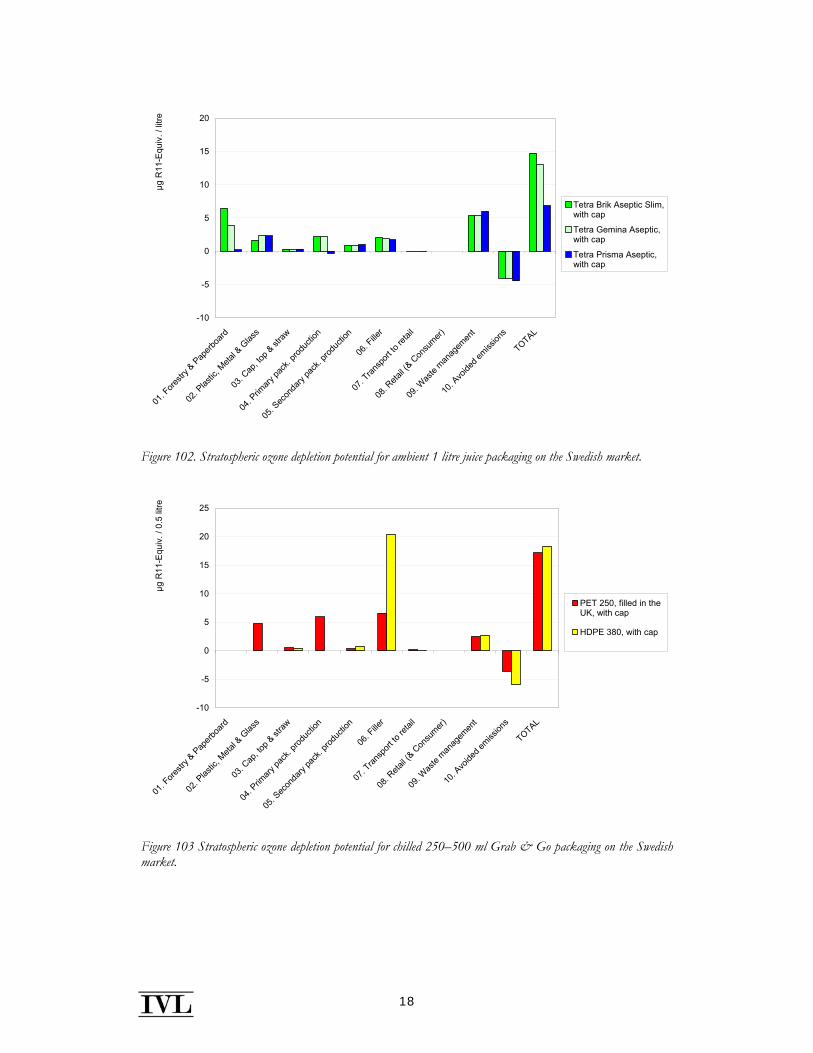
18
-10
-5
0
5
10
15
20
01. F
orestr
y & P
aperb
oard
02. P
lastic
, Meta
l & G
lass
03. C
ap, to
p & st
raw
04. P
rimary
pack
. prod
uctio
n
05. S
econ
dary
pack
. prod
uctio
n
06. F
iller
07. T
ransp
ort to
retai
l
08. R
etail (
& Con
sumer)
09. W
aste
manag
emen
t
10. A
voide
d emiss
ions
TOTAL
μg R
11-E
quiv
. / li
tre
Tetra Brik Aseptic Slim,with cap
Tetra Gemina Aseptic,with cap
Tetra Prisma Aseptic,with cap
Figure 102. Stratospheric ozone depletion potential for ambient 1 litre juice packaging on the Swedish market.
-10
-5
0
5
10
15
20
25
01. F
orestr
y & P
aperb
oard
02. P
lastic
, Meta
l & G
lass
03. C
ap, to
p & st
raw
04. P
rimary
pack
. prod
uctio
n
05. S
econ
dary
pack
. prod
uctio
n
06. F
iller
07. T
ransp
ort to
retai
l
08. R
etail (
& Con
sumer)
09. W
aste
manag
emen
t
10. A
voide
d emiss
ions
TOTAL
μg R
11-E
quiv
. / 0
.5 li
tre
PET 250, filled in theUK, with cap
HDPE 380, with cap
Figure 103 Stratospheric ozone depletion potential for chilled 250–500 ml Grab & Go packaging on the Swedish market.
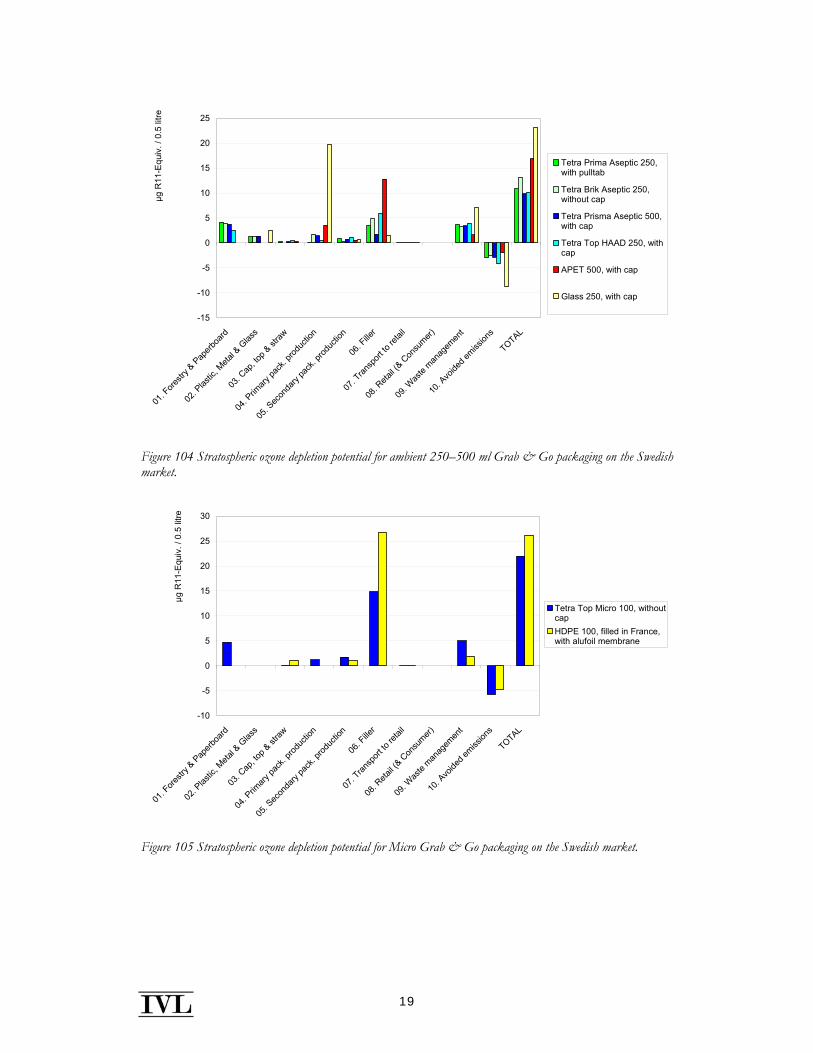
19
-15
-10
-5
0
5
10
15
20
25
01. F
orestr
y & P
aperb
oard
02. P
lastic
, Meta
l & G
lass
03. C
ap, to
p & st
raw
04. P
rimary
pack
. prod
uctio
n
05. S
econ
dary
pack
. prod
uctio
n
06. F
iller
07. T
ransp
ort to
retai
l
08. R
etail (
& Con
sumer)
09. W
aste
manag
emen
t
10. A
voide
d emiss
ions
TOTAL
μg R
11-E
quiv
. / 0
.5 li
treTetra Prima Aseptic 250,with pulltab
Tetra Brik Aseptic 250,without cap
Tetra Prisma Aseptic 500,with cap
Tetra Top HAAD 250, withcap
APET 500, with cap
Glass 250, with cap
Figure 104 Stratospheric ozone depletion potential for ambient 250–500 ml Grab & Go packaging on the Swedish market.
-10
-5
0
5
10
15
20
25
30
01. F
orestr
y & P
aperb
oard
02. P
lastic
, Meta
l & G
lass
03. C
ap, to
p & st
raw
04. P
rimary
pack
. prod
uctio
n
05. S
econ
dary
pack
. prod
uctio
n
06. F
iller
07. T
ransp
ort to
retai
l
08. R
etail (
& Con
sumer)
09. W
aste
manag
emen
t
10. A
voide
d emiss
ions
TOTAL
μg R
11-E
quiv
. / 0
.5 li
tre
Tetra Top Micro 100, withoutcapHDPE 100, filled in France,with alufoil membrane
Figure 105 Stratospheric ozone depletion potential for Micro Grab & Go packaging on the Swedish market.