Embed Size (px)
Citation preview

Local low carbon development initiatives in Fukushima
Gomi Kei National Institute for Environmental Studies, Japan (NIES)2015/Jan/23AIM International Workshop @NIES

Toward Local Society Design
Planning of relatively small municipality
Population decrease and aged society
Employment
Energy
2

Shinchi town (新地町)
A small town in Tohoku
North most of Fukushima’s coastal region.
50km north of Fukushima-daiichi power plant
50km south from Sendai city
3
Tokyo
SendaiShinchi
2011. 3. 11
4
116 were killed

2011.3.11
5
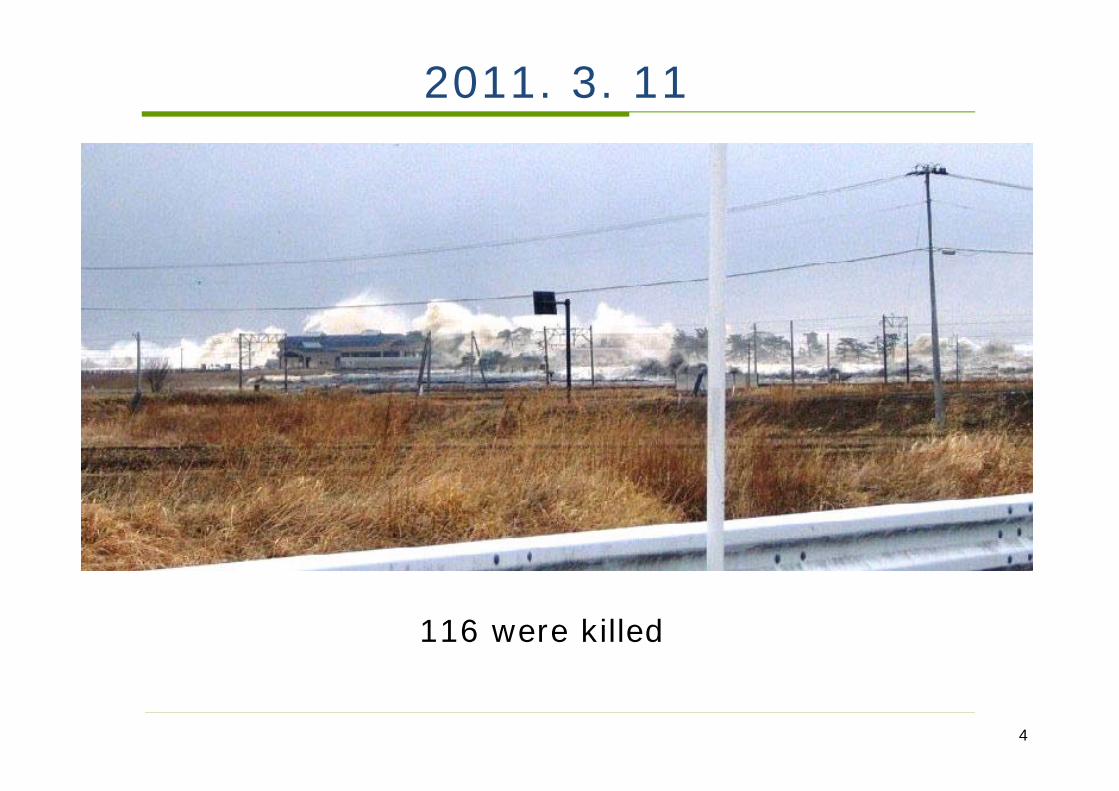
Recovery? 2014. Feb
6

Even without Tsunami,
7
Population decrease Aged society
Employment Agriculture

LNG facility
8
JAPEX (Japan Petroleum Exploration Co. Ltd.)Operation: From 2018Investment: 60Bill. Yen Employment for construction: 1000

Modeling
How much alternative scenarios can enhance its activity level
Describe effects and interaction of : Industry policies Residence policies Transport policies Energy policies Family and welfare policies
Least data requirement9

Family and Welfare PolicyIndustry Policy
Residential and Transport
Policy
Employment Policy
North Hamado-ri Snapshot Model
10
pIndustrial
output
CommutingEmployment
Population
Share of residence
Age composition
Labor participation
Consumption
Labor productivity
Employment(outside)

North Hamado-ri Snapshot Model
11
Age composition
Household size
Household
( )
Vehicle ownership
(household)
Vehicle ownership
of industriesVehicle number
Transport demand Energy service
demand
p gTrip generationpTrip distance g
Energy service demand
generation
( )Value added
(BI) ( )Value added
(NBI)
p yLabor
productivityShare of residence
Commuting matrix
Value added rate of NBI
Employment
Population
p pLabor
participation
( )Employment (commercial)
gEnergy service demand
generation
gEndogenous
gExogenous( )Employment
(outside)
BI: Basic industry NBI: Non-basic industry
Basic Data
Population & Household Commuting pattern Value added Energy demand
12

Commuting from Shinchi (2010)
13
Sendai
Soma
Minami Soma
Sen-nan+
Other Fukushima
Other Miyagi
1860
259
1086
39
436
173
10
Other18
52%commutes to
outside
Shinchi

Commuting to Shinchi (2010)
14
1860
224
782
38
19
23
4 436
41%commutes
from outside
Sendai
Shinchi
Soma
Minami Soma
Sen-nan+
Other Fukushima
Other Miyagi
Other
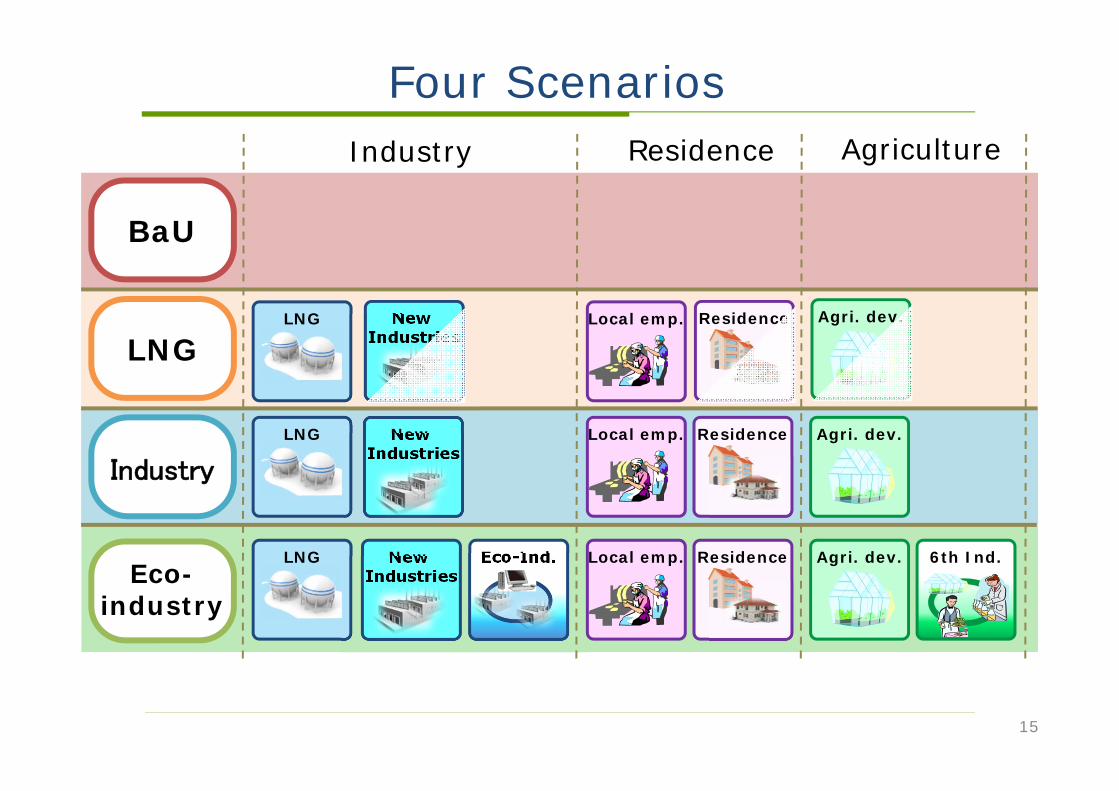
Four Scenarios
15
BaU
LNG
Industry
Eco-industry
LNG
LNG New Industries
LNG New Industries
Eco-Ind.
Agri. dev.
Agri. dev. 6th Ind.
Local emp.
Local emp.
Local emp. Residence
Residence
Industry Residence Agriculture
New Industries
Agri. dev.Residence

Projection of 4 scenarios
16
0
10
20
30
40
50
60
70
2005 2010 2015 2020 2025 2030 2035 2040 2045 2050
Bill. Yen
0
1,000
2,000
3,000
4,000
5,000
6,000
7,000
8,000
9,000
10,000
2005 2010 2015 2020 2025 2030 2035 2040 2045 2050
Popu
latio
nEco-IndustryIndustry
LNGBaU
Popu
latio
nG
RP
Eco-IndustryIndustryLNG
BaU
Caused by recovery from disaster.
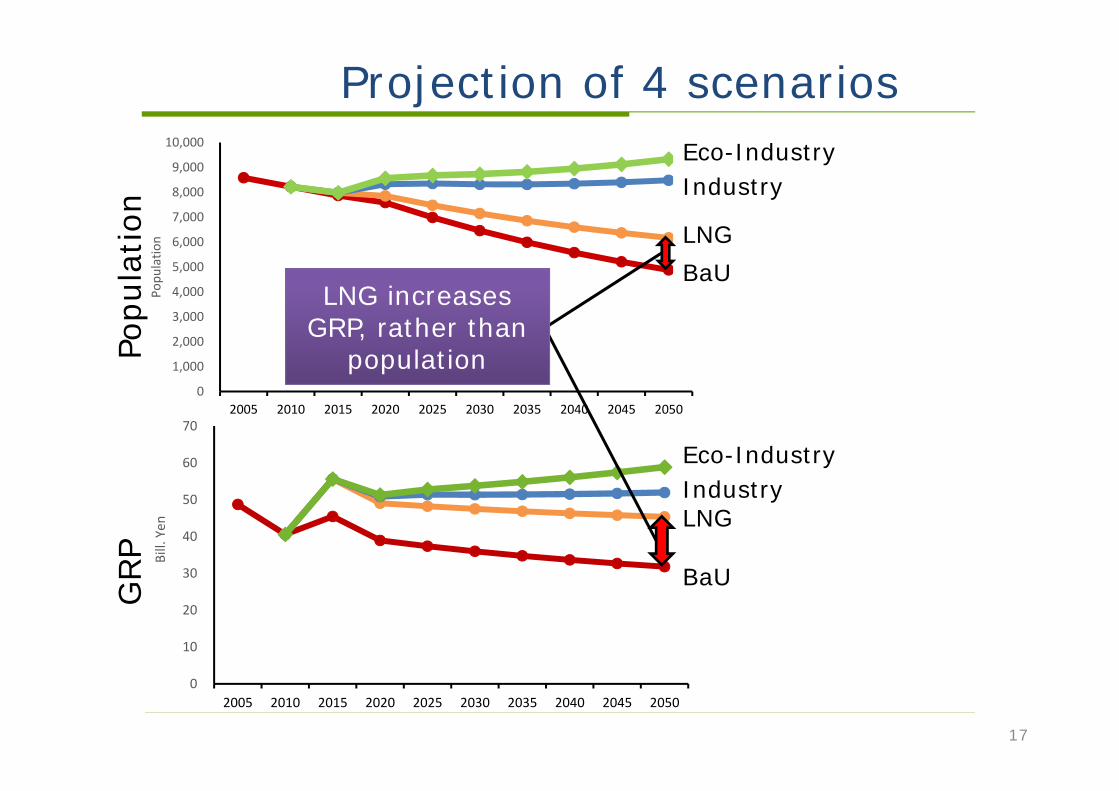
Projection of 4 scenarios
17
0
10
20
30
40
50
60
70
2005 2010 2015 2020 2025 2030 2035 2040 2045 2050
Bill. Yen
0
1,000
2,000
3,000
4,000
5,000
6,000
7,000
8,000
9,000
10,000
2005 2010 2015 2020 2025 2030 2035 2040 2045 2050
Popu
latio
nEco-IndustryIndustry
LNGBaU
Popu
latio
nG
RP
Eco-IndustryIndustryLNG
BaU
LNG increases GRP, rather than
population

Energy & CO2
18
By Dr. Shiraki (NIES)
0
5
10
15
20
25
30
35
40
45
50
0
50
100
150
200
250
300
350
400
450
500
[kt-CO
2]
[TJ]
農林漁業 建設鉱業 家庭
業務 製造業 CO2排出量
0
5
10
15
20
25
30
35
40
45
50
0
50
100
150
200
250
300
350
400
450
500
[kt-CO
2]
[TJ]
農林漁業 建設鉱業 家庭
業務 製造業 CO2排出量
BaU Eco-industry
AGRCOM
CSTMNF
RESCO2 emissions
AGRCOM
CSTMNF
RESCO2 emissions

Energy & CO2
19
By Dr. Shiraki (NIES)
0
5
10
15
20
25
30
35
40
45
50
0
50
100
150
200
250
300
350
400
450
500
[kt-CO
2]
[TJ]
農林漁業 建設鉱業 家庭
業務 製造業 CO2排出量
0
5
10
15
20
25
30
35
40
45
50
0
50
100
150
200
250
300
350
400
450
500
[kt-CO
2]
[TJ]
農林漁業 建設鉱業 家庭
業務 製造業 CO2排出量
BaU Eco-industry
AGRCOM
CSTMNF
RESCO2 emissions
AGRCOM
CSTMNF
RESCO2 emissions

From the scenarios to the programs
20
0
1,000
2,000
3,000
4,000
5,000
6,000
7,000
8,000
9,000
10,000
2005
2010
2015
2020
2025
2030
2035
2040
2045
2050
Gap
Short term
Long term
Mid term

Appendix
21

North-Hamadori Snapshot Model
22
世帯数車両
保有台数車両
走行距離 内生変数 外生変数エネルギーサービス需要(家庭・業務)
産業生産額
就業者数
,, , / i ri r i rL VA LP
,,
,
,
( )
( )
nb rr aa
i r
b r
P VAP for i nbVA
VA for i b
, ,, , ,i s ri r i s rL RS CM
, ,, , ,,
/ s s r s ai s r s ai r r
CM LPR Lout PC P
人口
通勤者数
純移動
出生率
生残率
移動調整前人口
農業・製造業等
商業・サービス業等
商業・サービス業等
農業・製造業等
町内→町外町内→町内
町外→町内
前期人口
居住人口
350 300 250 200 150 100 50 0 50 100 150 200 250 300
00_0405_0910_1415_1920_2425_2930_3435_3940_4445_4950_5455_5960_6465_6970_7475_7980_84
85_Over
女性 男性
産業の労働需要から雇用を求める
人口に見合う生産額を求める
産業誘致・農業振興施策等から想定する
町外への通勤、町外からの通勤を含む通勤パターンを推計する
雇用と前期の人口、出生・死亡要因から居住人口を求める

NHSMの定式化
23
,, , / i ri r i rL VA LP
,,
,
,
( )
( )
nb rr aa
i r
b r
P VAP for i nbVA
VA for i b
, ,, , ,i s ri r i s rL RS CM
, ,, , ,,
/ s s r s ai s r s ai r r
CM LPR Lout PC P
11
, ,
( 0)
( 0)t-1,s,at-1,s,a
t s a t-1,s,at-1,s,aa
P SVR for aP P BR for a
, , ,s a s a s aP P NM
, / ss a sa
P HS HHD
, ,s ps s pHHD VOW VH
,, ,r fi r r fi
VA VOW VH
,,, ,s cs cs c s cVH TG TD VKT
,
,,
, ,
,
,
( )
( )
( )( )
s res,esvs
s com,esvt sts eds esv
pas s
c s
HHD ESVG for eds res
L ESVG for eds comESVD
VA for eds pasVKT for eds c
内生変数 VAnb,r: 地域 r の非基盤産業 nb の付加価値 [億円] Li,r: 地域 r で産業 i に就業する就業者数 [人] CMi,s,r: 地域 s に住み地域 r で産業 i に就業する就業者数(通勤マトリクス)[人] Ps,a: 地域 s に住む年齢 a の人口[人] Pt-1,s,a-1: 前期に地域 s に住んでいた年齢 a-1 の人口[人] P’s,a: 前期人口から求めた移動考慮前の地域 s に住む年齢 a の人口[人] NMs,a: 当期において地域 s に住む年齢 a の者の前期からの純移動[人] HHDs: 地域 s の世帯数 [世帯] VHs,c: 地域 s の車両 c の保有台数[台] VKTs,c: 地域 s の車両 c の走行距離 [台 km] ESVDs,eds,esv: 地域 s のエネルギー需要部門 edsにおけるエネルギーサービス esvのエネルギーサービス需要 (単位はエネルギーサービスによって異なる) 外生変数
VA______
b,r: 地域 r の基盤産業 b の付加価値 [億円] LP______
i,r: 地域 r の産業 i の付加価値労働生産性 [億円/人] RS______
i,s,r:地域 r で産業 i に就業する就業者のうち地域 s の居住地域構成比[-] Lout_________
s,r: 地域 r に住み域外の地域 s で就業する就業者数[人] VAP_________
nb,r: 地域 r の常住人口一人当たりの非基盤産業 nb の付加価値 [億円/人] LPR________
s: 地域 s に住む者の就業率[-] PC______
s,a: 地域 s に住む者のうち年齢 a の年齢構成比[-] SVR________
t-1,s,a-1: 前期に地域 s に住んでいた年齢 a-1 の者の生残率[-] BR______
t-1,s,a-1: 前期に地域 s に住んでいた年齢 a-1 の者の出生率[-] HS______
s: 地域 s の平均世帯人員[人/世帯] VOW__________
s,p: 地域 s の車両(乗用)p の世帯当たり保有台数[台/世帯] VOW__________
r,f: 地域 r の車両(貨物用)f の全産業付加価値当たり保有台数[台/世帯] TG______
s,c: 地域 s の車両 c の年間トリップ数 [-] TD______
s,c: 地域 s の車両 c の平均トリップ長 [km] ESVG____________
s,eds,esv: 地域 s のエネルギー需要部門 eds におけるエネルギーサービス esv のエネルギーサービス需要原
単位 (単位はエネルギー需要部門およびエネルギーサービスによって異なる) 添え字 t: 年(式(5)を除いて全ての式の全ての変数に添えられる。表記を簡略化するため省略) r, s: 地域 I: 産業の集合 i : 産業 (i∈I) b: 基盤産業(b∈I) nb: 非基盤産業(nb∈I, b∧nb=φ ) com: 業務部門に属する産業(com∈I) pas: 第一次・第二次産業(pas∈I, com∧pas=φ) a: 年齢