Embed Size (px)
Citation preview
October 2011
Magnitogorsk Steel (MMK)
38%
33%
24%
6% 7%
10% 11%
5% 5% 4%
10%
7% 4% 5%
6%
0%
5%
10%
15%
20%
25%
30%
35%
40%
Russia NAFTA EU-27 China Middle East
2010 2011E 2012E
1 215 1 207
1 119
1 284
1 359
1 441
1 000
1 100
1 200
1 300
1 400
1 500
2007 2008 2009 2010 2011E 2012E
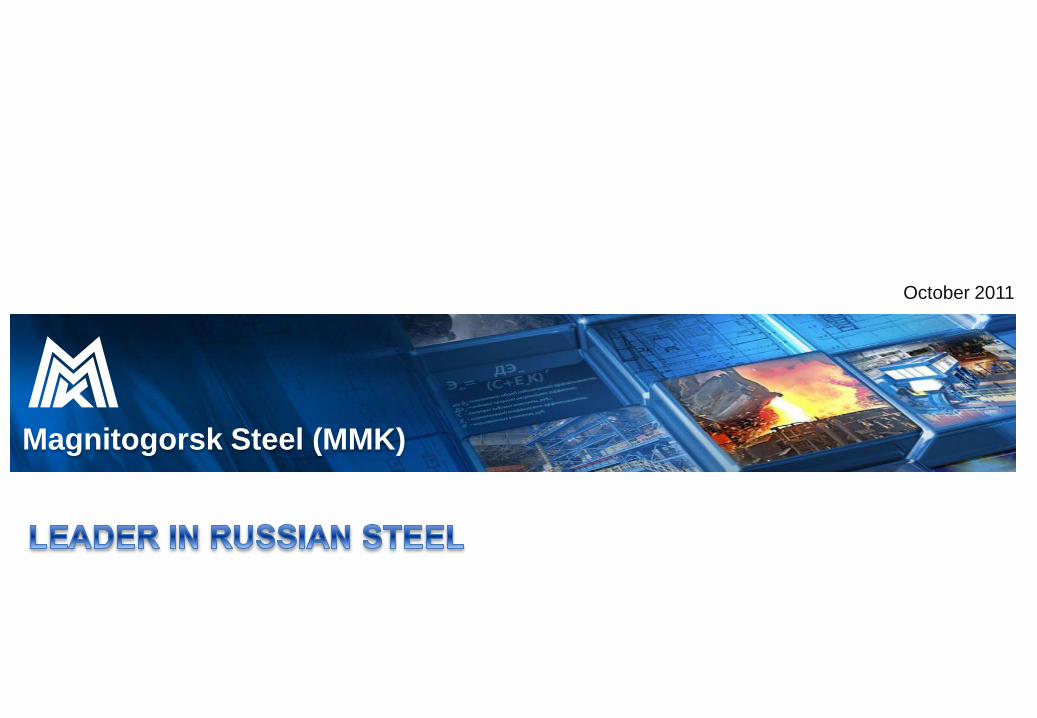
Global Steel Industry Highlights
World Steel Consumption, mln tonnes Apparent Steel Consumption Growth, % y-on-y
World Steel Production, mln tonnes Finished Steel Production/Consumption in China, mln tonnes
2
Source: WSA, Nomura
Source: WSA Source: WSA, Nomura
15%
6%
6% World steel consumption
continues to grow
Russian market demonstrates the
highest growth rates
576 632
657 677 680 685 690
535 573
602 620 630 639 649
-24 -24 -25 -26 -27 -28 -29 -100
0
100
200
300
400
500
600
700
800
2009 2010 2011E 2012E 2013E 2014E 2015E
Production Consumption Export
656 574
787
627
810
685
0
250
500
750
1 000
ROW China
2009 2010 2011Е
5,1 8,0 8,5 9,3
4,9
6,7 7,7
8,6
1,4
2,6 2,9
3,2
2,2
2,3 2,5
2,7
0,1
0,2 0,2
0,2
0
5
10
15
20
25
2009 2010 2011E 2012E
Construction Pipe plants Machinery Coating and metalwork Other
0,9 1,2 1,2 0,8 1,4 1,5 1,6
0,3 0,4 0,3
0,2
0,4 0,4 0,5 1,0 1,3
0,9 0,9
1,0 1,2
1,3 0,7
0,6 0,5
0,4
0,7 0,8
0,8 1,7
2,7
1,9
1,0
1,7 1,8
2,0
0
1
2
3
4
5
6
7
2006 2007 2008 2009 2010 2011E 2012E
Coated products C/r products Thick plate H/r products Long products
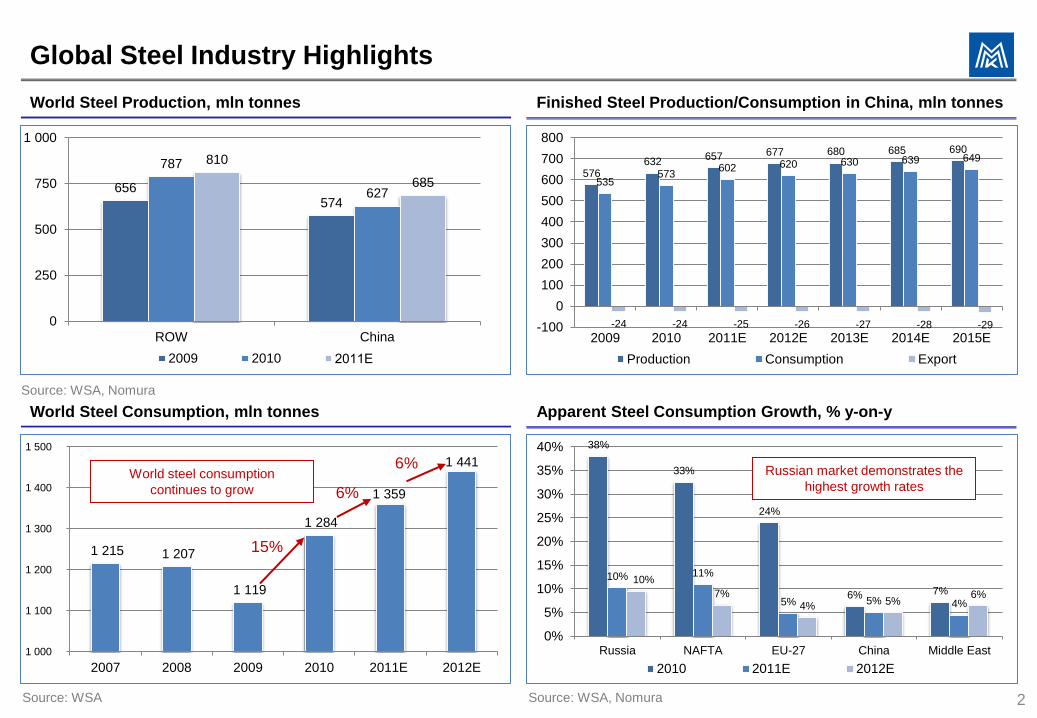
Russian Steel Dynamics
BOF Shop Domestic Flat Steel Consumption, mln tonnes
Steel Consumption in Russia and Export, mln tonnes Russian Import Structure, mln tonnes
3
Source: Metal Expert
HVA products
Source: Metal Courrier
Source: Metal Expert
13,7
19,8 21,9
24,0
Russia sees solid import
volumes, mostly of HVA
products
13,7 19,8 21,9 24,0
10,4
13,7 15,1
16,5 3,2
4,0 4,4
4,8 30,0
27,3 30,1
32,9
0
20
40
60
80
2009 2010 2011E 2012E
Flat steel Long steel Other steel products Export
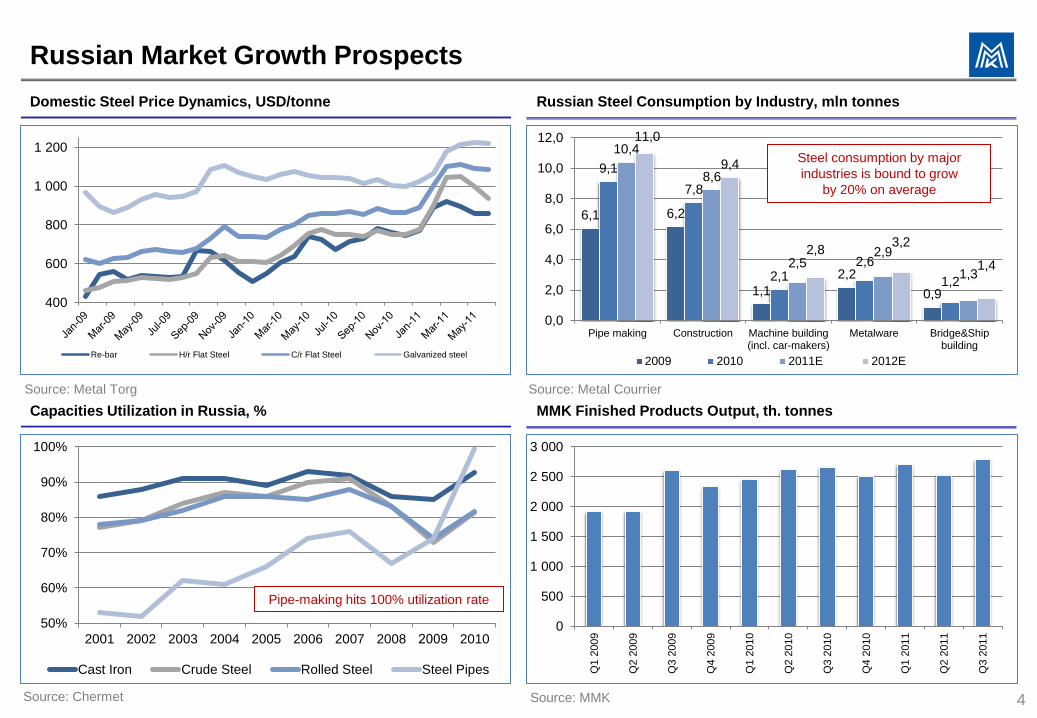
6,1 6,2
1,1
2,2
0,9
9,1
7,8
2,1 2,6
1,2
10,4
8,6
2,5 2,9
1,3
11,0
9,4
2,8 3,2
1,4
0,0
2,0
4,0
6,0
8,0
10,0
12,0
Pipe making Construction Machine building(incl. car-makers)
Metalware Bridge&Shipbuilding
2009 2010 2011E 2012E
Russian Market Growth Prospects
Capacities Utilization in Russia, % MMK Finished Products Output, th. tonnes
Domestic Steel Price Dynamics, USD/tonne Russian Steel Consumption by Industry, mln tonnes
4
50%
60%
70%
80%
90%
100%
2001 2002 2003 2004 2005 2006 2007 2008 2009 2010
Cast Iron Crude Steel Rolled Steel Steel Pipes
Steel consumption by major
industries is bound to grow
by 20% on average
Pipe-making hits 100% utilization rate
Source: Chermet Source: MMK
Source: Metal Courrier Source: Metal Torg
0
500
1 000
1 500
2 000
2 500
3 000
Q1 2
009
Q2 2
009
Q3 2
009
Q4 2
009
Q1 2
010
Q2 2
010
Q3 2
010
Q4 2
010
Q1 2
011
Q2 2
011
Q3 2
011
400
600
800
1 000
1 200
Re-bar H/r Flat Steel C/r Flat Steel Galvanized steel
5
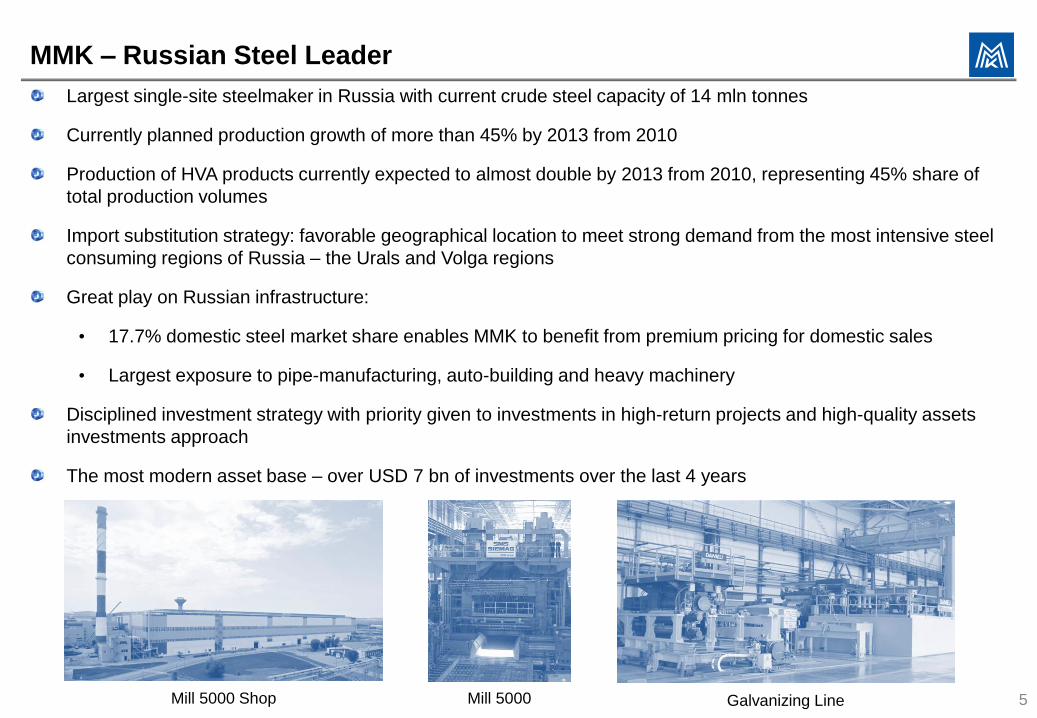
MMK – Russian Steel Leader
Largest single-site steelmaker in Russia with current crude steel capacity of 14 mln tonnes
Currently planned production growth of more than 45% by 2013 from 2010
Production of HVA products currently expected to almost double by 2013 from 2010, representing 45% share of
total production volumes
Import substitution strategy: favorable geographical location to meet strong demand from the most intensive steel
consuming regions of Russia – the Urals and Volga regions
Great play on Russian infrastructure:
• 17.7% domestic steel market share enables MMK to benefit from premium pricing for domestic sales
• Largest exposure to pipe-manufacturing, auto-building and heavy machinery
Disciplined investment strategy with priority given to investments in high-return projects and high-quality assets
investments approach
The most modern asset base – over USD 7 bn of investments over the last 4 years
Mill 5000 Shop Mill 5000 Galvanizing Line
6
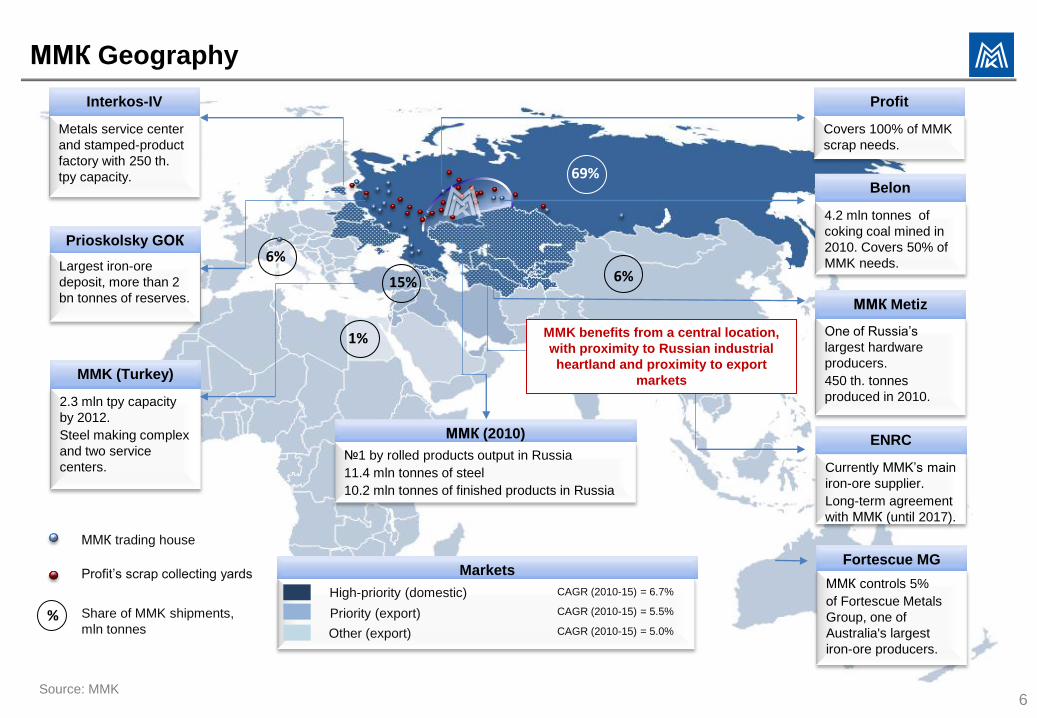
ММК Geography
2.3 mln tpy capacity
by 2012.
Steel making complex
and two service
centers.
Metals service center
and stamped-product
factory with 250 th.
tpy capacity.
4.2 mln tonnes of
coking coal mined in
2010. Covers 50% of
MMK needs. Largest iron-ore
deposit, more than 2
bn tonnes of reserves.
Interkos-IV
Prioskolsky GОК
MMK (Turkey)
ENRC
Belon
One of Russia’s
largest hardware
producers.
450 th. tonnes
produced in 2010.
ММК Metiz
Profit
Source: MMK
Covers 100% of MMK
scrap needs.
ММК trading house
69%
6% 15%
6%
1%
High-priority (domestic)
Priority (export)
Markets
Other (export)
ММК (2010)
№1 by rolled products output in Russia
11.4 mln tonnes of steel
10.2 mln tonnes of finished products in Russia
% Share of MMK shipments,
mln tonnes
Profit’s scrap collecting yards
CAGR (2010-15) = 5.5%
CAGR (2010-15) = 5.0%
CAGR (2010-15) = 6.7%
Currently MMK’s main
iron-ore supplier.
Long-term agreement
with ММК (until 2017).
ММК controls 5%
оf Fortescue Metals
Group, one of
Australia's largest
iron-ore producers.
Fortescue MG
MMK benefits from a central location,
with proximity to Russian industrial
heartland and proximity to export
markets
0
5 000
10 000
15 000
20 000
2010 2011E 2012E 2013E 2014Е
ММК, currently run capacities MMK, upside on current capacities MMK-Turkey
0
2 000
4 000
6 000
8 000
10 000
12 000
14 000
16 000
18 000
2009 2010 2011E 2012E 2013E 2014Е MMK MMK (Turkey) HVA products
75 79
146
240 279
392
212
0%
5%
10%
15%
20%
25%
30%
35%
40%
0
50
100
150
200
250
300
350
400
450
Long steel HR flatsteel
CR flatsteel
Mill 5000plate
Galvanizedsteel
Formedsections
Colour -coated steel
EBITDA/t (LHS) EBITDA margin (RHS)
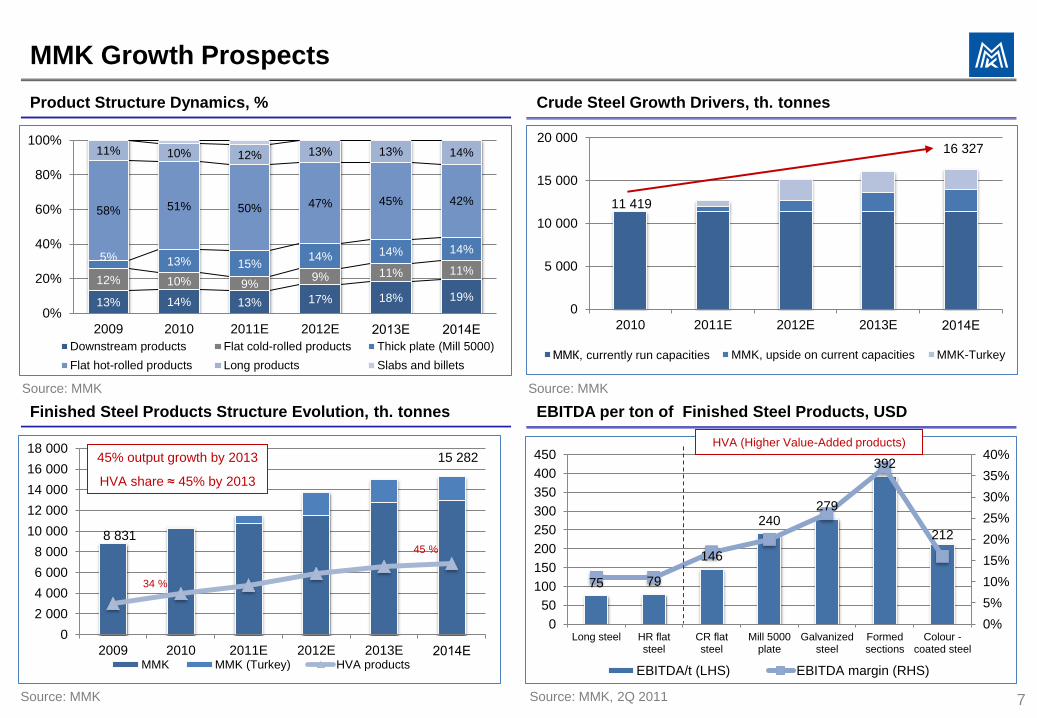
13% 14% 13% 17% 18% 19%
12% 10% 9% 9% 11% 11%
5% 13% 15% 14% 14% 14%
58% 51% 50% 47% 45% 42%
11% 10% 12% 13% 13% 14%
0%
20%
40%
60%
80%
100%
2009 2010 2011E 2012E 2013Е 2014Е
Downstream products Flat cold-rolled products Thick plate (Mill 5000)
Flat hot-rolled products Long products Slabs and billets
MMK Growth Prospects
Finished Steel Products Structure Evolution, th. tonnes EBITDA per ton of Finished Steel Products, USD
Product Structure Dynamics, % Crude Steel Growth Drivers, th. tonnes
7
45% output growth by 2013
HVA share ≈ 45% by 2013
HVA (Higher Value-Added products)
8 831
15 282
34 %
Sourсe: MMK Sourсe: MMK
Sourсe: MMK, 2Q 2011 Sourсe: MMK
11 419
16 327
45 %
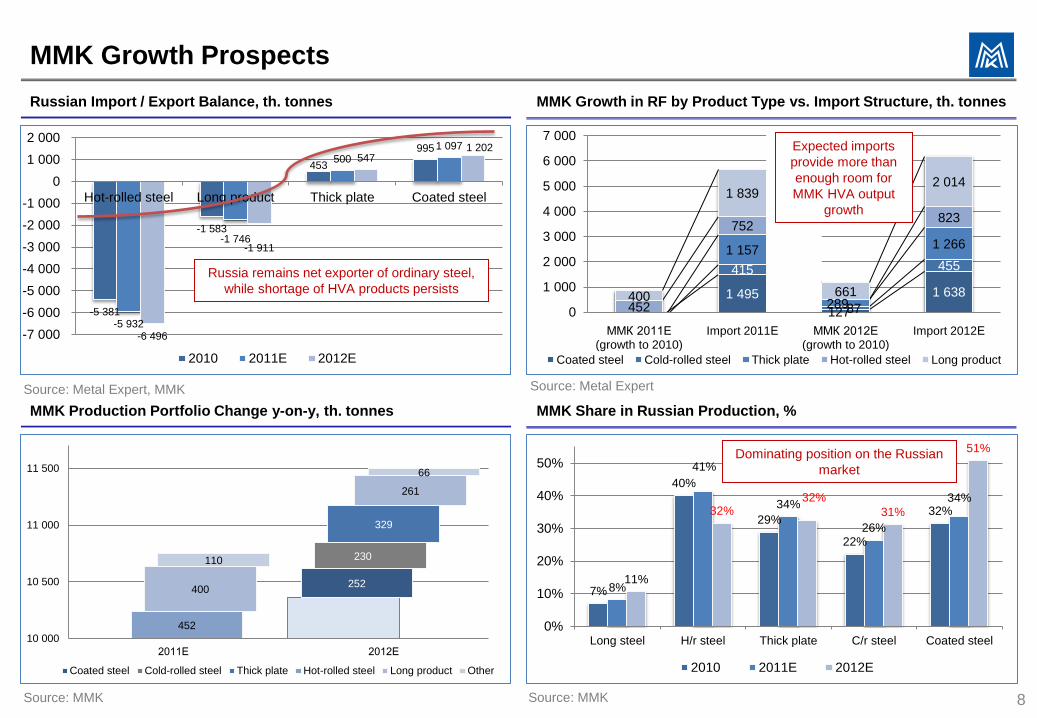
252
230
329
452
400
261
110
66
10 000
10 500
11 000
11 500
2011Е 2012Е
Coated steel Cold-rolled steel Thick plate Hot-rolled steel Long product Other
1 495
127
1 638
415
87
455
1 157
289
1 266
452
752 823
400
1 839
661
2 014
0
1 000
2 000
3 000
4 000
5 000
6 000
7 000
ММК 2011Е (growth to 2010)
Import 2011Е ММК 2012Е (growth to 2010)
Import 2012Е
Coated steel Cold-rolled steel Thick plate Hot-rolled steel Long product
7%
40%
29%
22%
32%
8%
41%
34%
26%
34%
11%
32% 32%
31%
51%
0%
10%
20%
30%
40%
50%
Long steel H/r steel Thick plate C/r steel Coated steel
2010 2011E 2012E
-5 381
-1 583
453
995
-5 932
-1 746
500
1 097
-6 496
-1 911
547 1 202
-7 000
-6 000
-5 000
-4 000
-3 000
-2 000
-1 000
0
1 000
2 000
Hot-rolled steel Long product Thick plate Coated steel
2010 2011E 2012E
MMK Growth Prospects
MMK Production Portfolio Change y-on-y, th. tonnes MMK Share in Russian Production, %
Russian Import / Export Balance, th. tonnes MMK Growth in RF by Product Type vs. Import Structure, th. tonnes
8 Source: MMK Source: MMK
Source: Metal Expert, MMK Source: Metal Expert
Russia remains net exporter of ordinary steel,
while shortage of HVA products persists
Dominating position on the Russian
market
Expected imports
provide more than
enough room for
MMK HVA output
growth
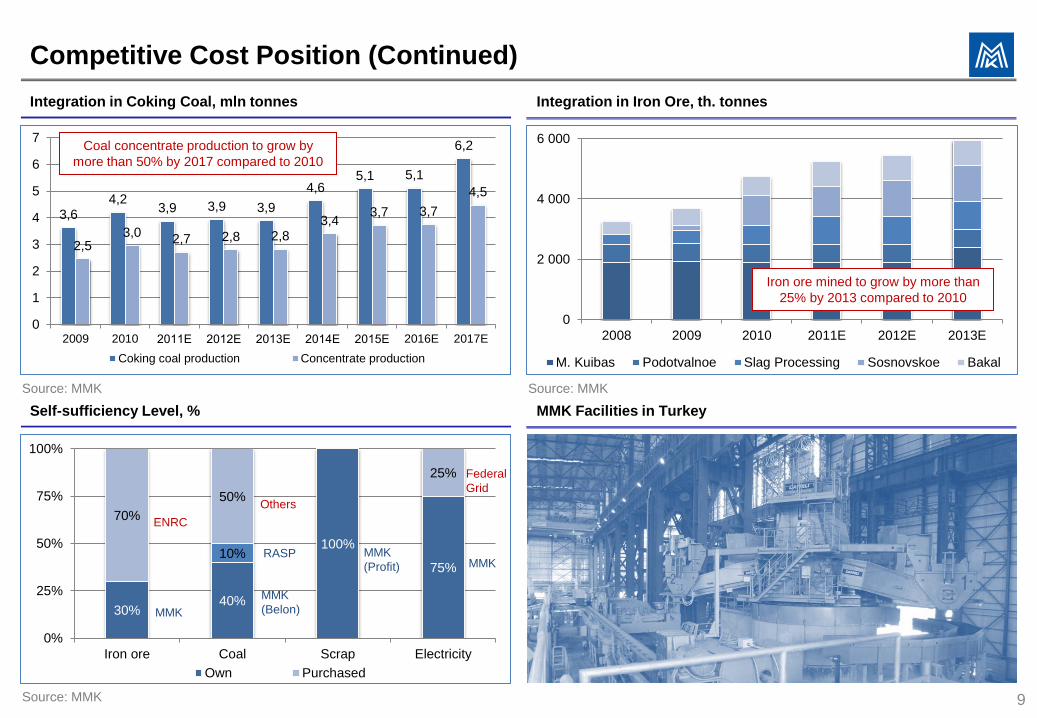
Competitive Cost Position (Continued)
30% 40%
100%
75% 10%
70%
50%
25%
0%
25%
50%
75%
100%
Iron ore Coal Scrap Electricity
Own Purchased
Self-sufficiency Level, % MMK Facilities in Turkey
3,6 4,2
3,9 3,9 3,9
4,6 5,1 5,1
6,2
2,5 3,0
2,7 2,8 2,8 3,4
3,7 3,7
4,5
0
1
2
3
4
5
6
7
2009 2010 2011Е 2012Е 2013Е 2014Е 2015Е 2016E 2017E
Coking coal production Concentrate production
Integration in Coking Coal, mln tonnes
0
2 000
4 000
6 000
2008 2009 2010 2011E 2012E 2013E
M. Kuibas Podotvalnoe Slag Processing Sosnovskoe Bakal
Integration in Iron Ore, th. tonnes
9
-19
Sourсe: MMK
ENRC
Others
Federal
Grid
MMK
MMK
(Belon)
MMK
(Profit) MMK RASP
Sourсe: MMK
Sourсe: MMK
Coal concentrate production to grow by
more than 50% by 2017 compared to 2010
Iron ore mined to grow by more than
25% by 2013 compared to 2010
7 000
8 000
9 000
10 000
11 000
12 000
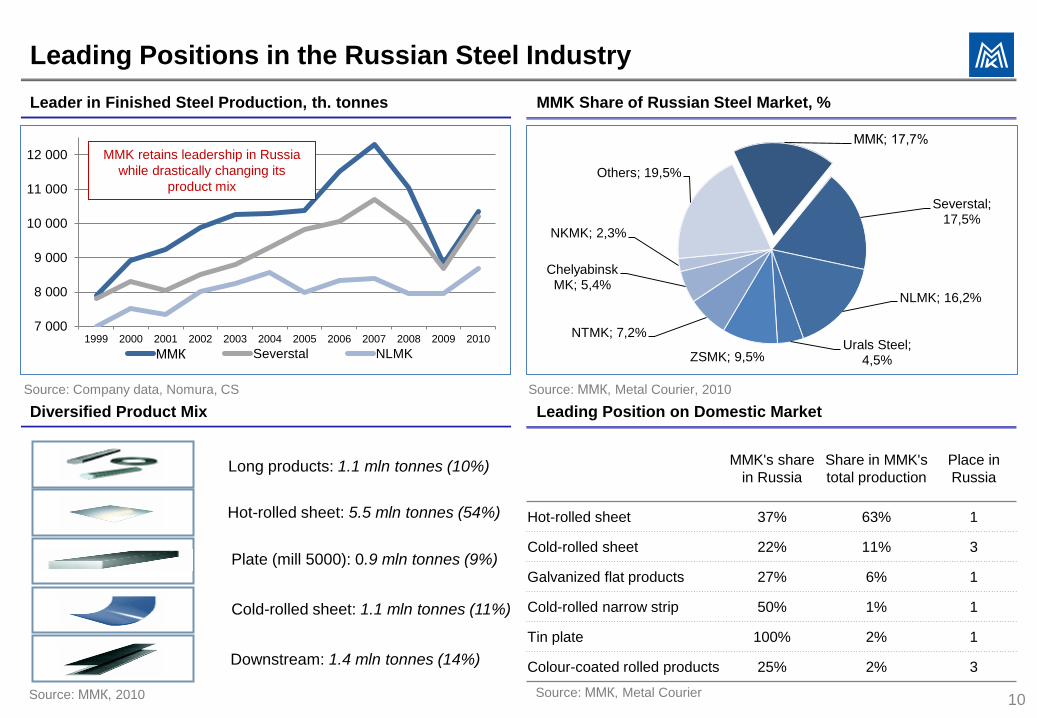
1999 2000 2001 2002 2003 2004 2005 2006 2007 2008 2009 2010
ММК Severstal NLMK
Leading Positions in the Russian Steel Industry
Diversified Product Mix Leading Position on Domestic Market
Leader in Finished Steel Production, th. tonnes MMK Share of Russian Steel Market, %
10
Hot-rolled sheet: 5.5 mln tonnes (54%)
Cold-rolled sheet: 1.1 mln tonnes (11%)
Long products: 1.1 mln tonnes (10%)
Downstream: 1.4 mln tonnes (14%)
Plate (mill 5000): 0.9 mln tonnes (9%)
Picture
Picture
Picture
Picture
Source: Company data, Nomura, CS Source: ММК, Metal Courier, 2010
Source: ММК, Metal Courier
MMK retains leadership in Russia
while drastically changing its
product mix
ММК; 17,7%
Severstal; 17,5%
NLMK; 16,2%
Urals Steel; 4,5% ZSMK; 9,5%
NTMK; 7,2%
Chelyabinsk MK; 5,4%
NKMK; 2,3%
Others; 19,5%
Source: ММК, 2010
MMK's share
in Russia
Share in MMK's
total production
Place in
Russia
Hot-rolled sheet 37% 63% 1
Cold-rolled sheet 22% 11% 3
Galvanized flat products 27% 6% 1
Cold-rolled narrow strip 50% 1% 1
Tin plate 100% 2% 1
Colour-coated rolled products 25% 2% 3
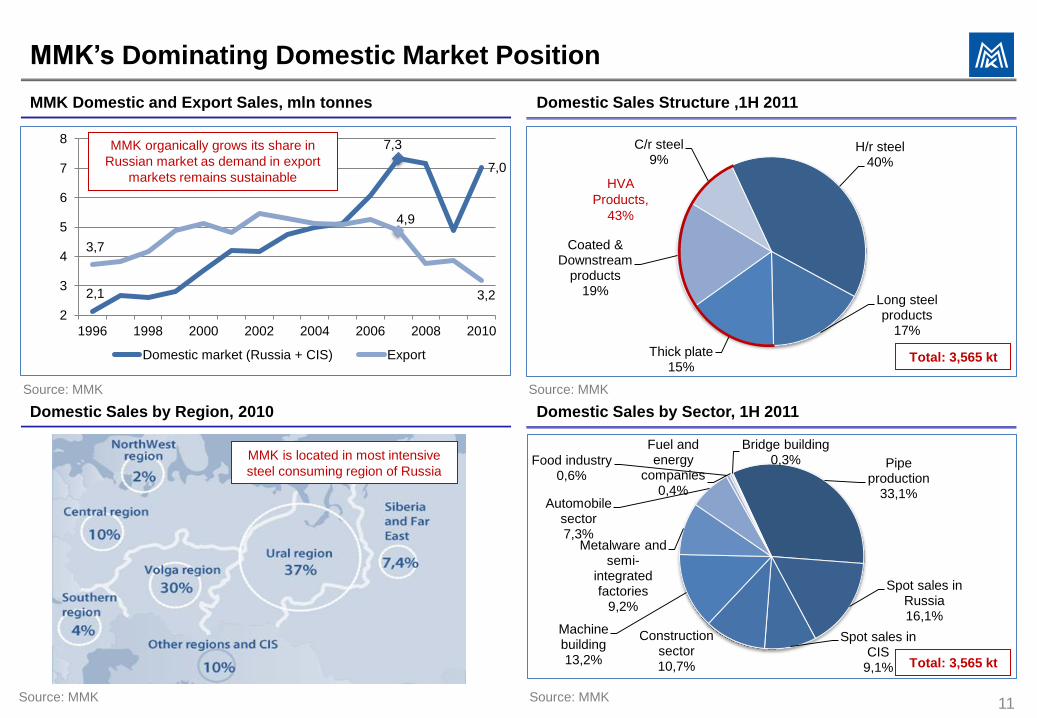
2,1
7,3
7,0
3,7
4,9
3,2
2
3
4
5
6
7
8
1996 1998 2000 2002 2004 2006 2008 2010
Domestic market (Russia + CIS) Export
Pipe production
33,1%
Spot sales in Russia 16,1%
Spot sales in CIS
9,1%
Construction sector 10,7%
Machine building 13,2%
Metalware and semi-
integrated factories
9,2%
Automobile sector 7,3%
Food industry 0,6%
Fuel and energy
companies 0,4%
Bridge building 0,3%
H/r steel 40%
Long steel products
17%
Thick plate 15%
Coated & Downstream
products 19%
C/r steel 9%
MMK’s Dominating Domestic Market Position
Domestic Sales by Region, 2010 Domestic Sales by Sector, 1H 2011
MMK Domestic and Export Sales, mln tonnes Domestic Sales Structure ,1H 2011
11
HVA
Products,
43%
Total: 3,565 kt
Source: MMK
Source: MMK Source: MMK
Source: MMK
MMK organically grows its share in
Russian market as demand in export
markets remains sustainable
Total: 3,565 kt
MMK is located in most intensive
steel consuming region of Russia
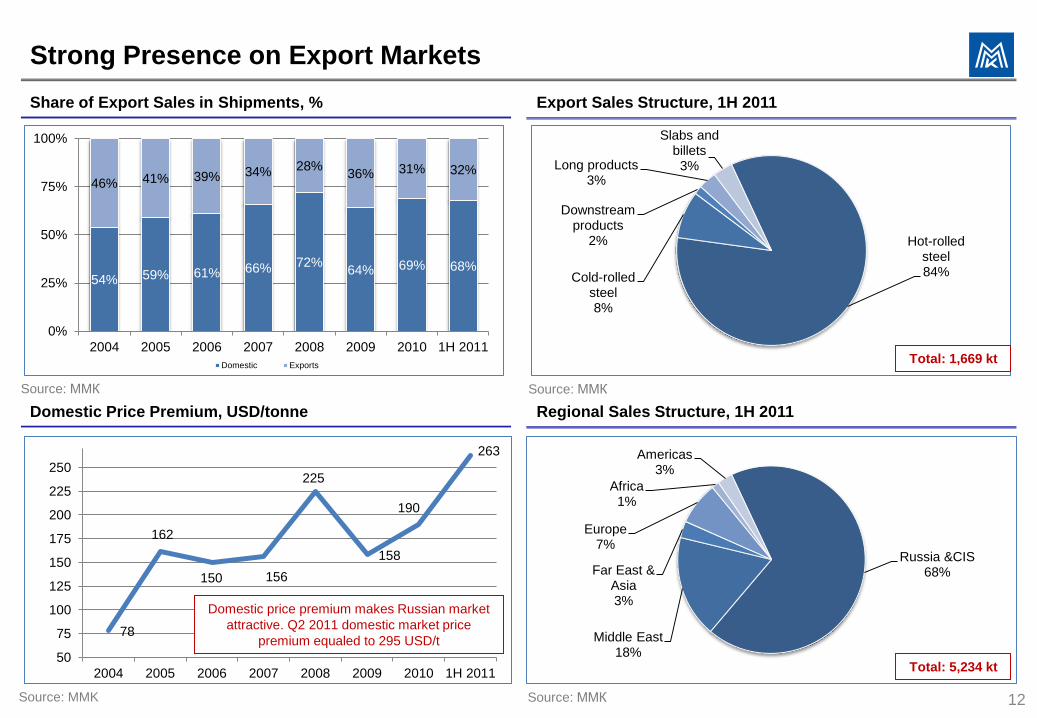
78
162
150 156
225
158
190
263
50
75
100
125
150
175
200
225
250
2004 2005 2006 2007 2008 2009 2010 1H 2011
Russia &CIS 68%
Middle East 18%
Far East & Asia 3%
Europe 7%
Africa 1%
Americas 3%
Hot-rolled steel 84% Cold-rolled
steel 8%
Downstream products
2%
Long products 3%
Slabs and billets 3%
Strong Presence on Export Markets
Domestic Price Premium, USD/tonne Regional Sales Structure, 1H 2011
Share of Export Sales in Shipments, % Export Sales Structure, 1H 2011
12
Total: 1,669 kt
Total: 5,234 kt
Source: ММК Source: ММК
Source: ММК Source: MMK
Domestic price premium makes Russian market
attractive. Q2 2011 domestic market price
premium equaled to 295 USD/t
54% 59% 61% 66% 72% 64% 69% 68%
46% 41% 39% 34% 28% 36% 31% 32%
0%
25%
50%
75%
100%
2004 2005 2006 2007 2008 2009 2010 1H 2011
Domestic Exports
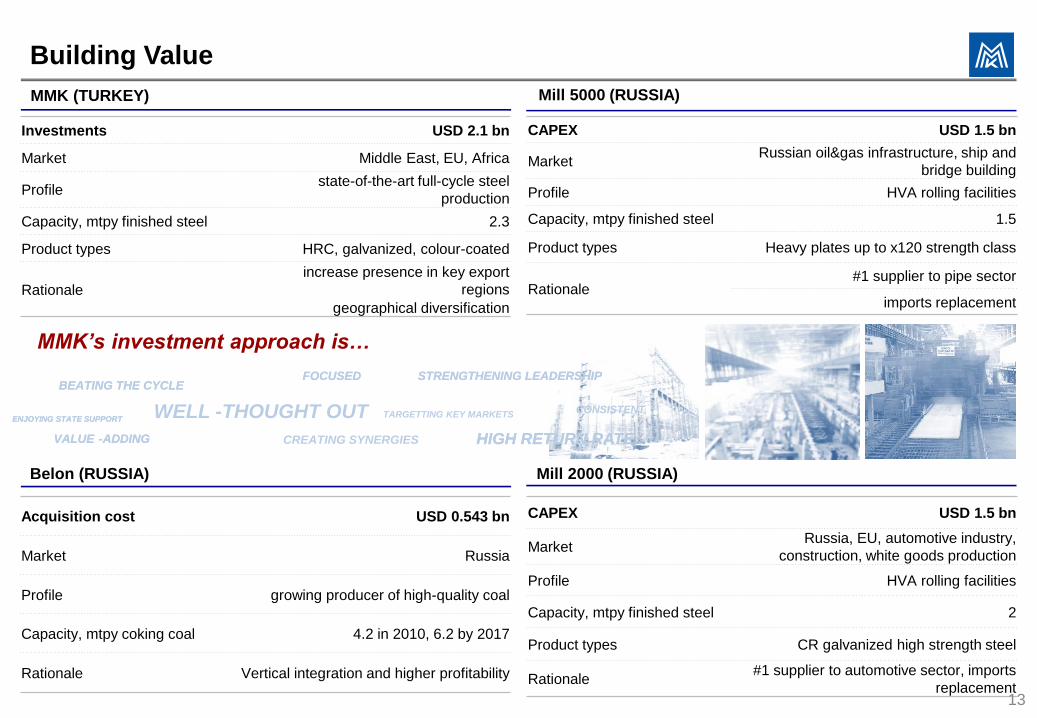
CAPEX USD 1.5 bn
Market Russia, EU, automotive industry,
construction, white goods production
Profile HVA rolling facilities
Capacity, mtpy finished steel 2
Product types CR galvanized high strength steel
Rationale #1 supplier to automotive sector, imports
replacement
Acquisition cost USD 0.543 bn
Market Russia
Profile growing producer of high-quality coal
Capacity, mtpy coking coal 4.2 in 2010, 6.2 by 2017
Rationale Vertical integration and higher profitability
CAPEX USD 1.5 bn
Market Russian oil&gas infrastructure, ship and
bridge building
Profile HVA rolling facilities
Capacity, mtpy finished steel 1.5
Product types Heavy plates up to x120 strength class
Rationale #1 supplier to pipe sector
imports replacement
Investments USD 2.1 bn
Market Middle East, EU, Africa
Profile state-of-the-art full-cycle steel
production
Capacity, mtpy finished steel 2.3
Product types HRC, galvanized, colour-coated
Rationale
increase presence in key export
regions
geographical diversification
Building Value
Belon (RUSSIA) Mill 2000 (RUSSIA)
MMK (TURKEY) Mill 5000 (RUSSIA)
13
MMK’s investment approach is…
HIGH RETURN RATE VALUE - ADDING
ENJOYING STATE SUPPORT
STRENGTHENING LEADERSHIP FOCUSED BEATING THE CYCLE
HIGH RETURN RATE CREATING SYNERGIES VALUE - ADDING
CONSISTENT TARGETTING KEY MARKETS WELL - THOUGHT OUT ENJOYING STATE SUPPORT
STRENGTHENING LEADERSHIP FOCUSED BEATING THE CYCLE
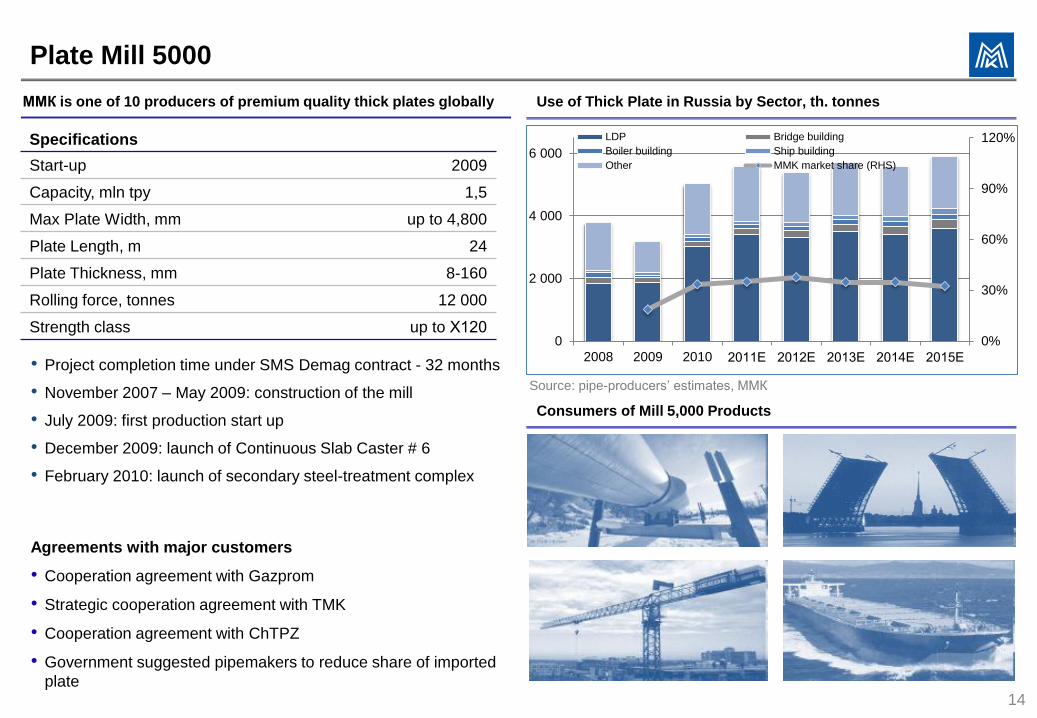
Plate Mill 5000
Consumers of Mill 5,000 Products
ММК is one of 10 producers of premium quality thick plates globally Use of Thick Plate in Russia by Sector, th. tonnes
• Project completion time under SMS Demag contract - 32 months
• November 2007 – May 2009: construction of the mill
• July 2009: first production start up
• December 2009: launch of Continuous Slab Caster # 6
• February 2010: launch of secondary steel-treatment complex
Agreements with major customers
• Cooperation agreement with Gazprom
• Strategic cooperation agreement with TMK
• Cooperation agreement with ChTPZ
• Government suggested pipemakers to reduce share of imported
plate
14
Specifications
Start-up 2009
Capacity, mln tpy 1,5
Max Plate Width, mm up to 4,800
Plate Length, m 24
Plate Thickness, mm 8-160
Rolling force, tonnes 12 000
Strength class up to Х120
Source: pipe-producers’ estimates, ММК
0%
30%
60%
90%
120%
0
2 000
4 000
6 000
2008 2009 2010 2011Е 2012Е 2013Е 2014Е 2015Е
LDP Bridge building
Boiler building Ship building
Other MMK market share (RHS)
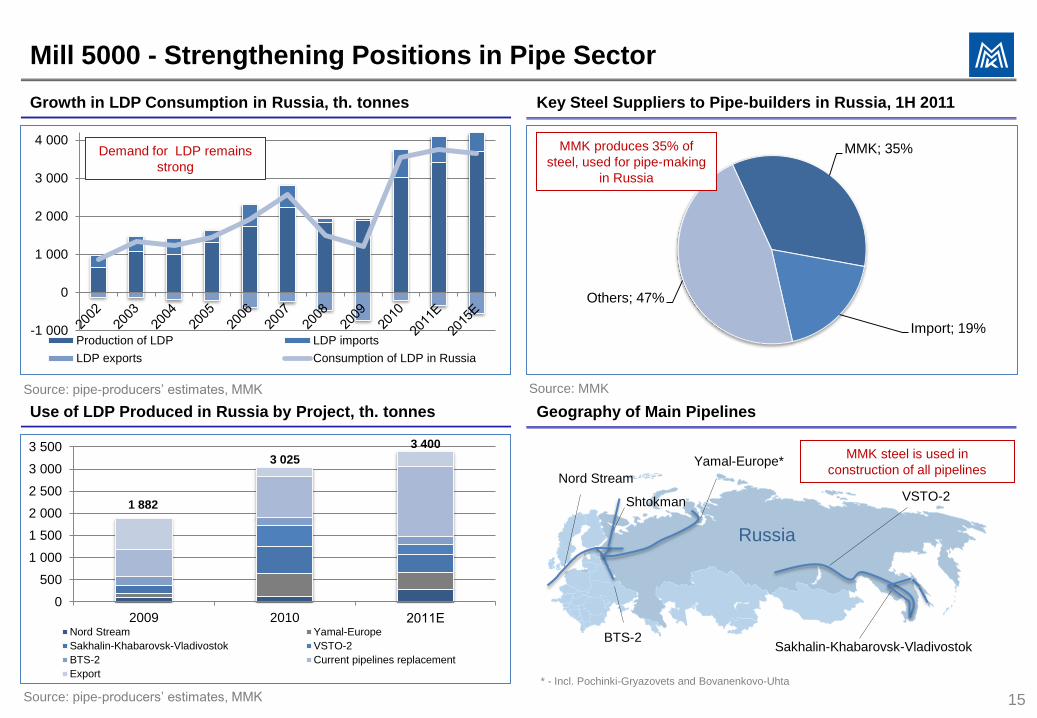
MMK; 35%
Import; 19%
Others; 47%
0
500
1 000
1 500
2 000
2 500
3 000
3 500
2009 2010 2011Е Nord Stream Yamal-Europe
Sakhalin-Khabarovsk-Vladivostok VSTO-2
BTS-2 Current pipelines replacement
Export
-1 000
0
1 000
2 000
3 000
4 000
Production of LDP LDP imports
LDP exports Consumption of LDP in Russia
Mill 5000 - Strengthening Positions in Pipe Sector
Use of LDP Produced in Russia by Project, th. tonnes Geography of Main Pipelines
Growth in LDP Consumption in Russia, th. tonnes Key Steel Suppliers to Pipe-builders in Russia, 1H 2011
15
BTS-2
VSTO-2
Sakhalin-Khabarovsk-Vladivostok
Yamal-Europe*
Nord Stream
Russia
1 882
3 025
Source: pipe-producers’ estimates, MMK
Source: pipe-producers’ estimates, MMK Source: MMK
MMK produces 35% of
steel, used for pipe-making
in Russia
MMK steel is used in
construction of all pipelines
Demand for LDP remains
strong
3 400
* - Incl. Pochinki-Gryazovets and Bovanenkovo-Uhta
Shtokman
765
565 519
426 399
261
156
67 12 10
0
100
200
300
400
500
600
700
800
Strengthening Position in Auto Industry
Russian Vehicle Fleet by Age, %
Mill 2,000 Complex Private Car Ownership, vehicles per 1,000 people
16
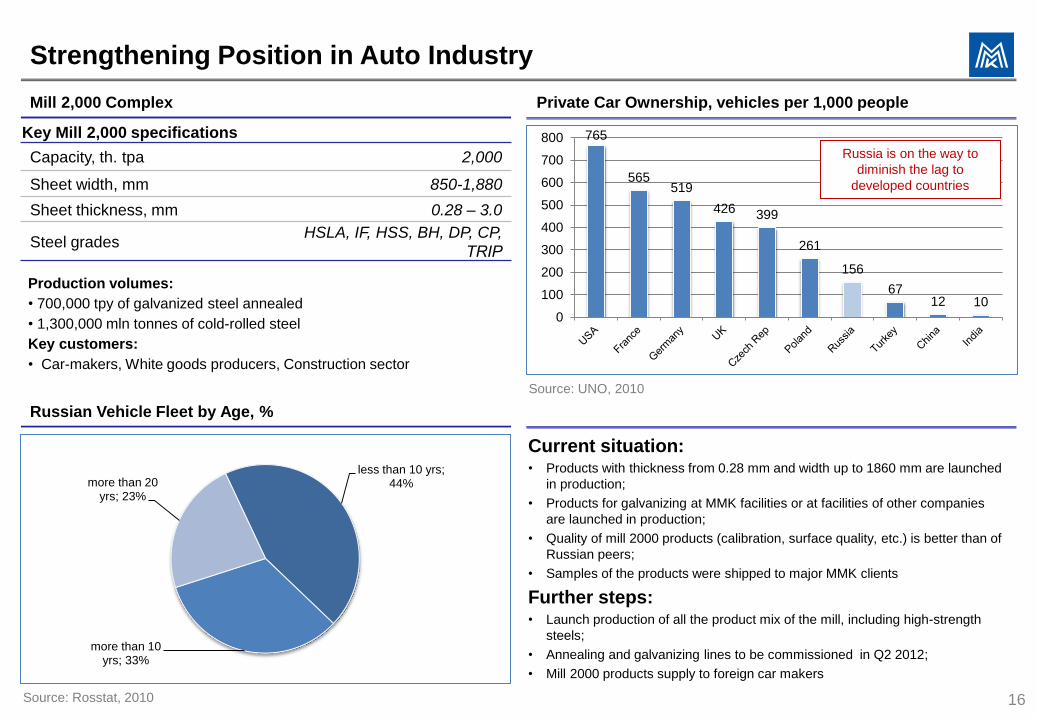
Key Mill 2,000 specifications
Capacity, th. tpa 2,000
Sheet width, mm 850-1,880
Sheet thickness, mm 0.28 – 3.0
Steel grades HSLA, IF, HSS, BH, DP, CP,
ТRIP
Production volumes:
• 700,000 tpy of galvanized steel annealed
• 1,300,000 mln tonnes of cold-rolled steel
Key customers:
• Car-makers, White goods producers, Construction sector
Source: Rosstat, 2010
Source: UNO, 2010
Russia is on the way to
diminish the lag to
developed countries
less than 10 yrs; 44%
more than 10 yrs; 33%
more than 20 yrs; 23%
Current situation: • Products with thickness from 0.28 mm and width up to 1860 mm are launched
in production;
• Products for galvanizing at MMK facilities or at facilities of other companies
are launched in production;
• Quality of mill 2000 products (calibration, surface quality, etc.) is better than of
Russian peers;
• Samples of the products were shipped to major MMK clients
Further steps: • Launch production of all the product mix of the mill, including high-strength
steels;
• Annealing and galvanizing lines to be commissioned in Q2 2012;
• Mill 2000 products supply to foreign car makers
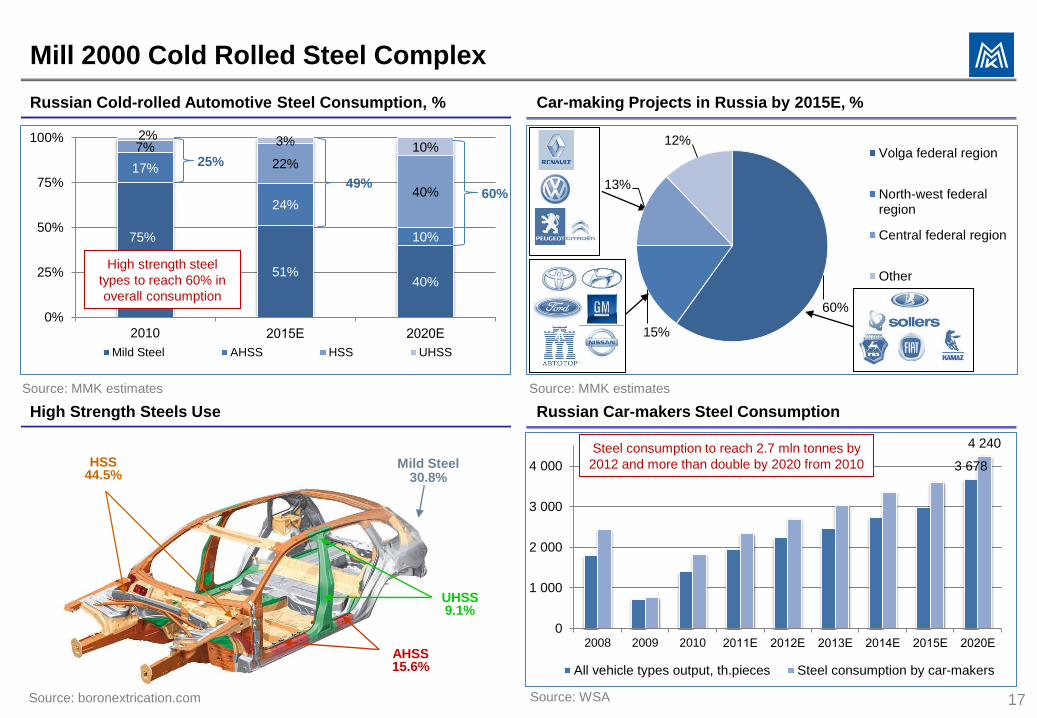
3 678
4 240
0
1 000
2 000
3 000
4 000
2008 2009 2010 2011Е 2012Е 2013Е 2014Е 2015Е 2020Е
All vehicle types output, th.pieces Steel consumption by car-makers
75%
51% 40%
17%
24%
10%
7%
22%
40%
2% 3% 10%
0%
25%
50%
75%
100%
2010 2015Е 2020Е
Mild Steel AHSS HSS UHSS
Mill 2000 Cold Rolled Steel Complex
High Strength Steels Use Russian Car-makers Steel Consumption
Russian Cold-rolled Automotive Steel Consumption, % Car-making Projects in Russia by 2015E, %
17
Source: boronextrication.com
Mild Steel 30.8%
UHSS 9.1%
HSS 44.5%
AHSS 15.6%
High strength steel
types to reach 60% in
overall consumption
Source: WSA
Source: MMK estimates Source: MMK estimates
60%
15%
13%
12% Volga federal region
North-west federalregion
Central federal region
Other
Steel consumption to reach 2.7 mln tonnes by
2012 and more than double by 2020 from 2010
60%
25%
49%
MMK Cooperation with Automakers
Mill 2000 Production Scheme
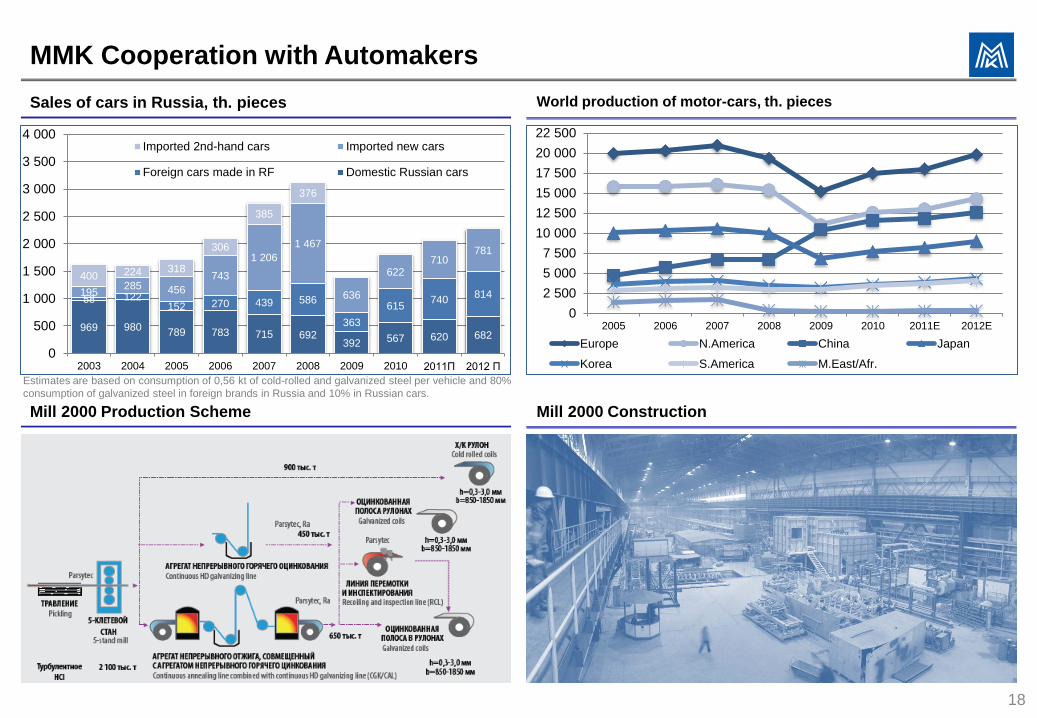
Sales of cars in Russia, th. pieces World production of motor-cars, th. pieces
18
Estimates are based on consumption of 0,56 kt of cold-rolled and galvanized steel per vehicle and 80%
consumption of galvanized steel in foreign brands in Russia and 10% in Russian cars.
0
2 500
5 000
7 500
10 000
12 500
15 000
17 500
20 000
22 500
2005 2006 2007 2008 2009 2010 2011E 2012E
Europe N.America China Japan
Korea S.America M.East/Afr.
969 980 789 783 715 692
392 567 620 682
58 122 152 270 439 586
363
615 740
814 195 285 456
743
1 206
1 467
636
622 710
781
400 224 318
306
385
376
0
500
1 000
1 500
2 000
2 500
3 000
3 500
4 000
2003 2004 2005 2006 2007 2008 2009 2010 2011П 2012 П
Imported 2nd-hand cars Imported new cars
Foreign cars made in RF Domestic Russian cars
Mill 2000 Construction
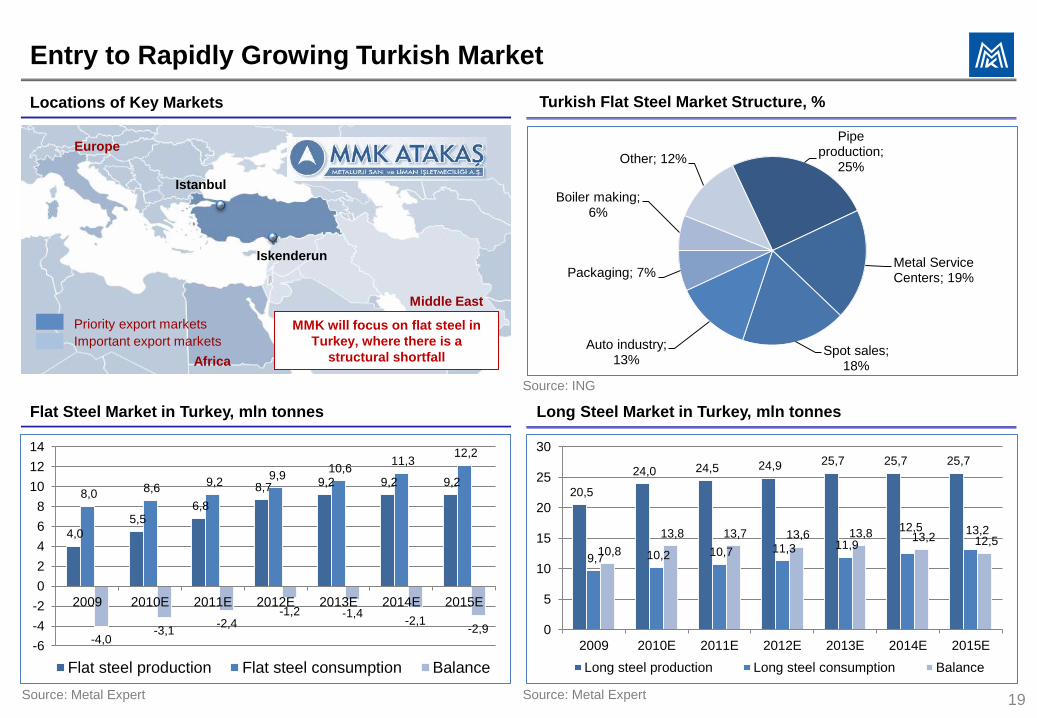
Entry to Rapidly Growing Turkish Market
Flat Steel Market in Turkey, mln tonnes Long Steel Market in Turkey, mln tonnes
Locations of Key Markets
19 Source: Metal Expert
Source: ING
Istanbul
Iskenderun
Europe
Middle East
Africa
Priority export markets
Important export markets
Turkish Flat Steel Market Structure, %
4,0
5,5 6,8
8,7 9,2 9,2 9,2 8,0
8,6 9,2
9,9 10,6
11,3 12,2
-4,0 -3,1
-2,4 -1,2 -1,4
-2,1 -2,9
-6
-4
-2
0
2
4
6
8
10
12
14
2009 2010E 2011E 2012E 2013E 2014E 2015E
Flat steel production Flat steel consumption Balance
MMK will focus on flat steel in
Turkey, where there is a
structural shortfall
Pipe production;
25%
Metal Service Centers; 19%
Spot sales; 18%
Auto industry; 13%
Packaging; 7%
Boiler making; 6%
Other; 12%
20,5
24,0 24,5 24,9 25,7 25,7 25,7
9,7 10,2 10,7 11,3 11,9
12,5 13,2
10,8
13,8 13,7 13,6 13,8 13,2 12,5
0
5
10
15
20
25
30
2009 2010E 2011E 2012E 2013E 2014E 2015E
Long steel production Long steel consumption Balance
Source: Metal Expert
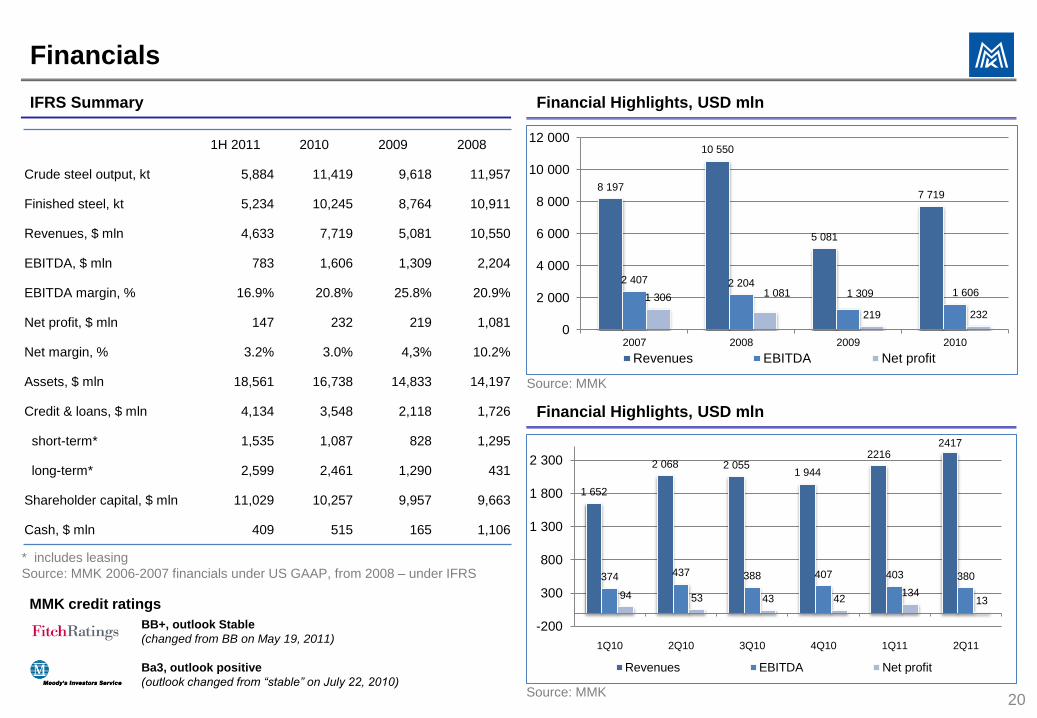
Financials
Financial Highlights, USD mln
IFRS Summary Financial Highlights, USD mln
20
Source: MMK
Source: MMK
* includes leasing
Source: MMK 2006-2007 financials under US GAAP, from 2008 – under IFRS
BB+, outlook Stable
(changed from BB on May 19, 2011)
Ba3, outlook positive
(outlook changed from “stable” on July 22, 2010)
MMK credit ratings
1H 2011 2010 2009 2008
Crude steel output, kt 5,884 11,419 9,618 11,957
Finished steel, kt 5,234 10,245 8,764 10,911
Revenues, $ mln 4,633 7,719 5,081 10,550
EBITDA, $ mln 783 1,606 1,309 2,204
EBITDA margin, % 16.9% 20.8% 25.8% 20.9%
Net profit, $ mln 147 232 219 1,081
Net margin, % 3.2% 3.0% 4,3% 10.2%
Assets, $ mln 18,561 16,738 14,833 14,197
Credit & loans, $ mln 4,134 3,548 2,118 1,726
short-term* 1,535 1,087 828 1,295
long-term* 2,599 2,461 1,290 431
Shareholder capital, $ mln 11,029 10,257 9,957 9,663
Cash, $ mln 409 515 165 1,106
8 197
10 550
5 081
7 719
2 407 2 204 1 309 1 606 1 306 1 081
219 232
0
2 000
4 000
6 000
8 000
10 000
12 000
2007 2008 2009 2010
Revenues EBITDA Net profit
1 652
2 068 2 055 1 944
2216 2417
374 437 388 407 403 380
94 53 43 42 134
13
-200
300
800
1 300
1 800
2 300
1Q10 2Q10 3Q10 4Q10 1Q11 2Q11
Revenues EBITDA Net profit
21
Investment Highlights
• Key beneficiary of steel market recovery – fully financed production growth currently planned at >45%
by 2013
• Growing volumes and share of HVA products (45% by 2013) to secure sustainably high efficiency
• Focus on specialty steel products to replace imports in Russia and to capture domestic market price
premium
• Access to lucrative Turkish flat steel market with high-quality steel products
• Emphasized direct exposure to growing industry sectors in the domestic market – pipe-building,
automotive and heavy machinery industries
• Technological flexibility to address raw-material market fluctuations – crude steel production using
iron ore/coking coal vs. scrap
• Plans for further strengthening in commodities
Magnitogorsk Steel (MMK)
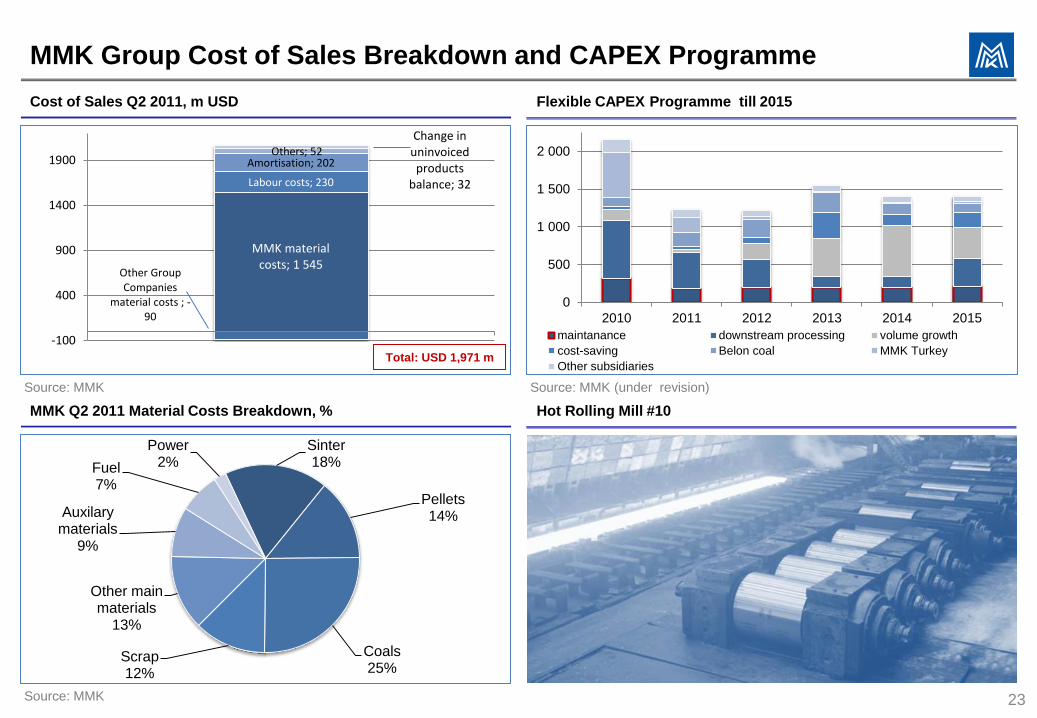
MMK material costs; 1 545
Other Group Companies
material costs ; -90
Labour costs; 230
Amortisation; 202 Others; 52
Change in uninvoiced products
balance; 32
-100
400
900
1400
1900
1
MMK Group Cost of Sales Breakdown and CAPEX Programme
MMK Q2 2011 Material Costs Breakdown, %
Cost of Sales Q2 2011, m USD Flexible CAPEX Programme till 2015
23
Sourсe: MMK (under revision)
Sourсe: MMK
Sourсe: MMK
Total: USD 1,971 m
0
500
1 000
1 500
2 000
2010 2011 2012 2013 2014 2015
maintanance downstream processing volume growth
cost-saving Belon coal MMK Turkey
Other subsidiaries
Hot Rolling Mill #10
Sinter 18%
Pellets 14%
Coals 25%
Scrap 12%
Other main materials
13%
Auxilary materials
9%
Fuel 7%
Power 2%
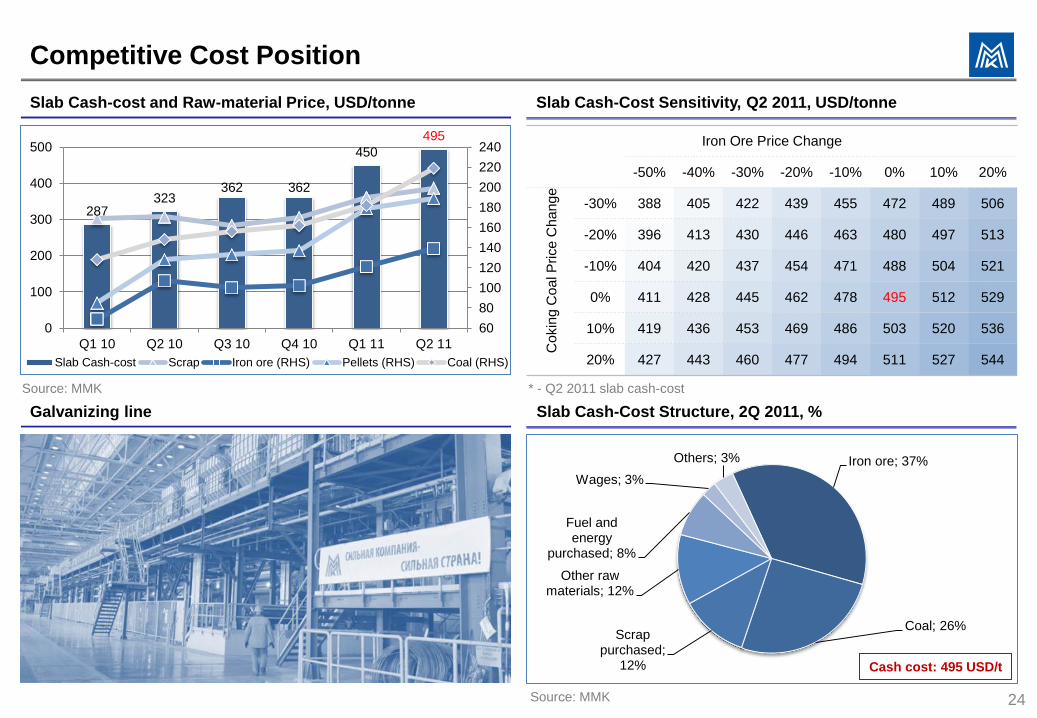
Iron ore; 37%
Coal; 26% Scrap
purchased; 12%
Other raw materials; 12%
Fuel and energy
purchased; 8%
Wages; 3%
Others; 3%
Competitive Cost Position
Galvanizing line Slab Cash-Cost Structure, 2Q 2011, %
Slab Cash-cost and Raw-material Price, USD/tonne
24
Cash cost: 495 USD/t
Slab Cash-Cost Sensitivity, Q2 2011, USD/tonne
Sourсe: MMK
Sourсe: MMK
* - Q2 2011 slab cash-cost
Iron Ore Price Change
-50% -40% -30% -20% -10% 0% 10% 20%
Co
kin
g C
oa
l P
rice
Ch
an
ge
-30% 388 405 422 439 455 472 489 506
-20% 396 413 430 446 463 480 497 513
-10% 404 420 437 454 471 488 504 521
0% 411 428 445 462 478 495 512 529
10% 419 436 453 469 486 503 520 536
20% 427 443 460 477 494 511 527 544
287 323
362 362
450
495
60
80
100
120
140
160
180
200
220
240
0
100
200
300
400
500
Q1 10 Q2 10 Q3 10 Q4 10 Q1 11 Q2 11
Slab Cash-cost Scrap Iron ore (RHS) Pellets (RHS) Coal (RHS)
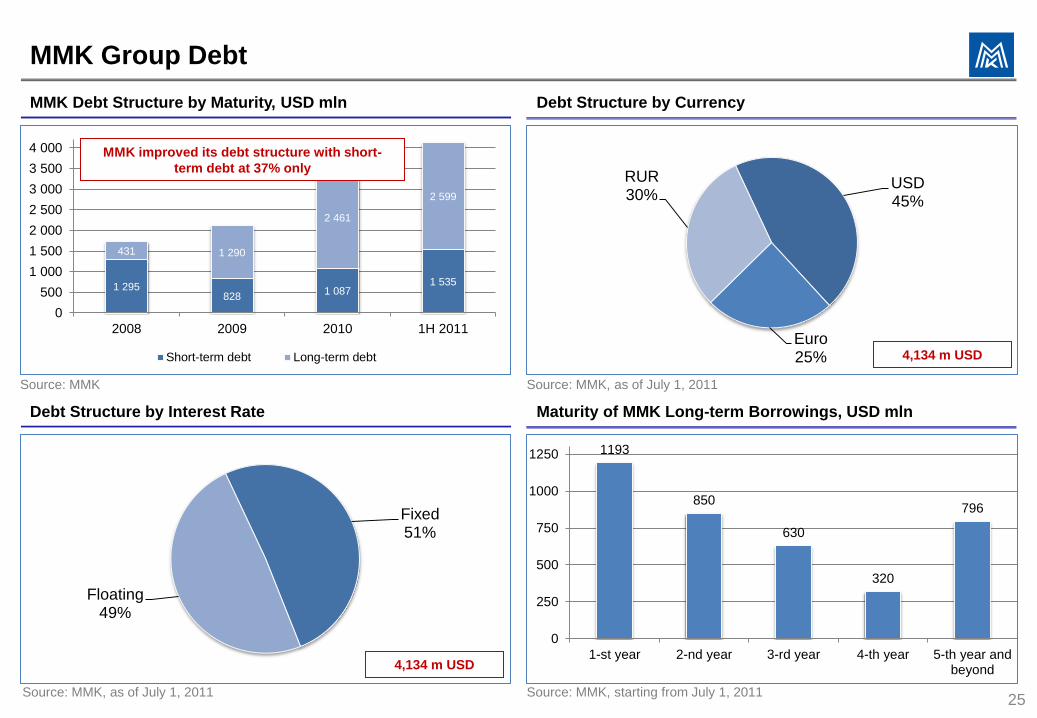
1 295 828
1 087 1 535
431 1 290
2 461
2 599
0
500
1 000
1 500
2 000
2 500
3 000
3 500
4 000
2008 2009 2010 1H 2011
Short-term debt Long-term debt
MMK Group Debt
Debt Structure by Interest Rate Maturity of MMK Long-term Borrowings, USD mln
MMK Debt Structure by Maturity, USD mln Debt Structure by Currency
25
MMK improved its debt structure with short-
term debt at 37% only
Source: MMK, as of July 1, 2011
Source: MMK Source: MMK, as of July 1, 2011
Source: MMK, starting from July 1, 2011
4,134 m USD
4,134 m USD
1193
850
630
320
796
0
250
500
750
1000
1250
1-st year 2-nd year 3-rd year 4-th year 5-th year andbeyond
USD 45%
Euro 25%
RUR 30%
Fixed 51%
Floating 49%
0
500
1 000
1 500
2 000
2 500
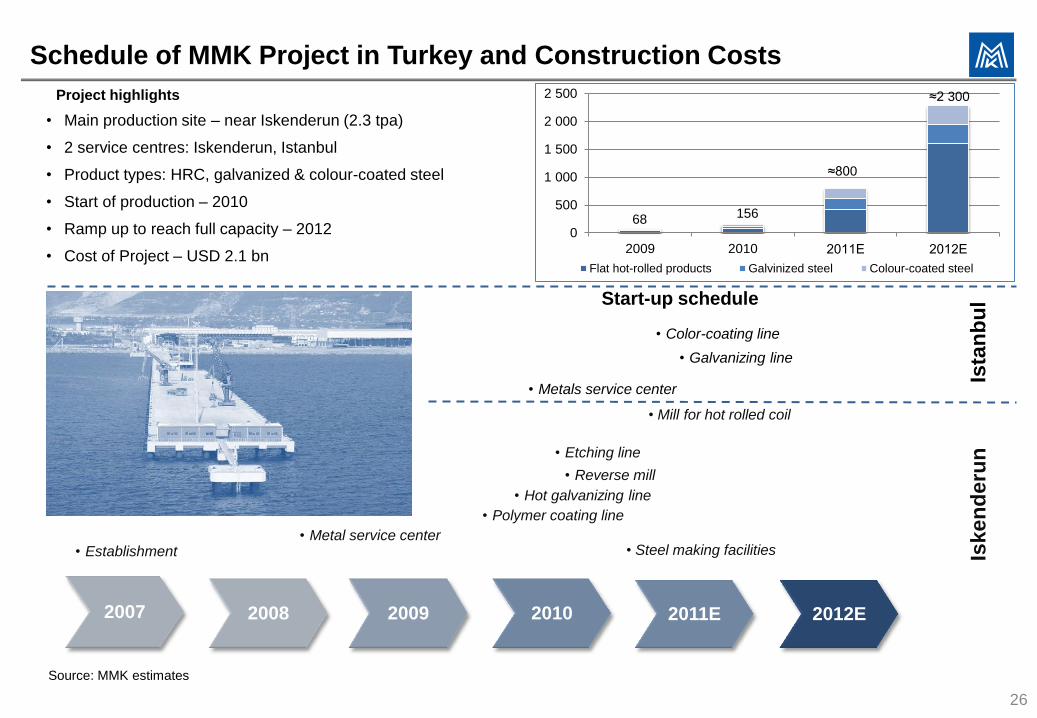
2009 2010 2011Е 2012Е
Flat hot-rolled products Galvinized steel Colour-coated steel
• Reverse mill
26
Schedule of MMK Project in Turkey and Construction Costs
• Establishment
2007 2008 2009 2010 2011E 2012E
• Metal service center
• Hot galvanizing line
• Etching line
• Polymer coating line
• Metals service center
• Galvanizing line
• Color-coating line
Iske
nd
eru
n
Ista
nb
ul
Source: MMK estimates
• Mill for hot rolled coil
Project highlights
• Main production site – near Iskenderun (2.3 tpa)
• 2 service centres: Iskenderun, Istanbul
• Product types: HRC, galvanized & colour-coated steel
• Start of production – 2010
• Ramp up to reach full capacity – 2012
• Cost of Project – USD 2.1 bn
Start-up schedule
68 156
≈800
≈2 300
• Steel making facilities
Contacts
THIS PRESENTATION IS FOR INFORMATION ONLY.
•THIS PRESENTATION IS FOR DISTRIBUTION IN UK ONLY AMONG THE PEOPLE HAVING PROFESSIONAL SKILL IN THE ISSUES RELATED TO INVESTMENTS WITHIN THE MEANING OF ARTICLE 19(5) OF DIRECTIVE ON FINANCIAL ADVERTISEMENT APPROVED IN 2005 ON THE BASIS OF LAW ON FINANCIAL SERVICES AND MARKETS 2000, OR THOSE PEOPLE, AMONG WHICH IT MAY BE LAWFULLY DISTRIBUTED. THIS INFORMATION IS CONFIDENTIAL AND PROVIDED TO YOU EXCLUSIVELY FOR YOUR REFERENCE. BY ACCEPTANCE OF THIS INFORMATION THE RECIPIENT HEREOF CONFIRMS THAT HE OR SHE IS A SPECIALIST IN THE SPHERE OF INVESTMENTS WITHIN THE MEANING OF ARTICLE 19(5) OF DIRECTIVE ON FINANCIAL ADVERTISEMENT APPROVED IN 2005 ON THE BASIS OF LAW ON FINANCIAL SERVICES AND MARKETS 2000, ACTING IN HIS OR HER NATURE.
•THIS PRESENTATION DOES NOT CONSTITUTE AN OFFER OR A PART THEREOF, OR INVITATION TO SELL OR TO ISSUE, OR TO SUBSCRIBE FOR OR OTHERWISE PURCHASE ANY SHARES IN THE COMPANY OR ANY OTHER SECURITIES AND NOTHING CONTAINED HEREIN SHALL FORM THE BASIS OF ANY CONTRACT OR COMMITMENT WHATSOEVER.
•THE INFORMATION CONTAINED HEREIN IS SUBJECT TO VERIFICATION, COMPLETION AND MAY BE SIGNIFICANTLY CHANGED. NONE OF THE PERSONS IS LIABLE TO UPDATE OR MAINTAIN TOPICALITY OF THE INFORMATION CONTAINED HEREIN, AND THIS INFORMATION AND OPINIONS REFLECTED THEREIN COULD BE CHANGED WITHOUT ANY NOTIFICATION THEREABOUT.
•THIS PRESENTATION SHOULD REMAIN CONFIDENTIAL UNTIL THE REPORT IS PUBLISHED. SOME INFORMATION CONTAINED HEREIN IS STILL A DRAFT INFORMATION AND WAS NOT LEGALLY CONFIRMED AND WILL BE FINALY DETERMINED ONLY AT THE MOMENT OF FILING THE APPLICATION FOR FINAL ACCEPTANCE FOR TRADING AT THE STOCK EXCHANGE.
•THIS INFORMATION DOES NOT CONSTITUTE AN OFFER OF THE SECURITIES TO BE SOLD IN RUSSIA, THE UNITED STATES OR ANY OTHER JURISDICTION. THE SECURITIES HAVE NOT BEEN AND WILL NOT BE REGISTERED UNDER THE US SECURITIES ACT OF 1933,AS AMENDED, AND MAY NOT BE OFFERED OR SOLD INTO THE UNITED STATES EXCEPT IN A TRANSACTION REGISTERED UNDER SUCH ACT, OR NOT REQUIRED TO BE REGISTERED THERE UNDER, OR PURSUANT TO AND EXEMPTION FROM REGISTRATION REQUIREMENTS THEREOF. NO OFFERING OF SECURITIES IS BEING MADE INTO THE UNITED STATES. NO SECURITIES WILL BE REGISTERED UNDER THE APPLICABLE SECURITIES ACT OF ANY STATE OR TERRITORIAL ENTITY OF CANADA AND JAPAN. THIS PRESENTATION IS NOT SUBJECT TO MAILING, TRANSFERRING OR OTHER TYPE OF DISTRIBUTION IN THE UNITED STATES OF AMERICA, CANADA, AUSTRALIA AND JAPAN, OR TO THE TERRITORY OR FROM THE TERRITORY OF THE SPECIFIED COUNTRIES TO THE NAME OF ANY ANALYST IN THE SPHERE OF SECURITIES OR OTHER PERSON IN ANY OF THE SPECIFIED JURISDICTIONS. YOU AGREE TO AVOID FROM DISTRIBUTION OF ANY REPORT RESULTING FROM THE SURVEY OR SIMILAR DOCUMENTS ON THE TERRITORY OF THE UNITED STATES OF AMERICA, CANADA, AUSTRALIA AND JAPAN, SAVE AS IN ACCORDANCE WITH THE FEDERAL LAWS OF THE UNITED STATES ON SECURITIES INCLUDING SECURITIES ACT, AS WELL AS THE APPLICABLE LAWS OF CANADA, AUSTRALIA AND JAPAN, ACCORDINGLY.
•THIS PRESENTATION INCLUDES THE STATEMENTS RELATED TO THE FUTURE, WHICH REPRODUCE THE INTENTIONS, OPINIONS AND CURRENT EXPECTATIONS OF THE COMPANY. THE STATEMENTS FOR THE FUTURE INCLUDE ANYTHING, WHICH IS NOT A FACT OCCURED. THE COMPANY TRIED TO HIGHLIGHT SUCH STATEMENTS RELATED TO THE FUTURE BY MEANS OF THE WORDS, SUCH AS “MAY”, “WILL”, “SHOULD”, “EXPECT”, “INTEND”, “EVALUATE”, “ASSUME”, “PLAN”, “TO HAVE AN OPINION”, “TRY”, “FORECAST”, “CONTINUE” AND SIMILAR WORDS OR THEIR NEGATIVE FORMS. SUCH STATEMENTS HAD BEEN DONE BASING ON THE ASSUMPTIONS AND ASSESSMENTS, WHICH MAY OCCUR FAULTY, THOUGH THE COMPANY CONSIDERS THEM REASONABLE AT THE CURRENT MOMENT.
•SUCH STATEMENTS RELATED TO THE FUTURE ARE LINKED TO THE RISKS, UNCERTAINTIES AND ASSUMPTIONS, AS WELL AS TO OTHER FACTORS, WHICH MAY LEAD TO THE EVENT THAT ACTUAL RESULTS OF THE COMPANY’S ACTIVITY AND ACTIVITY OF THE MARKETS, ON WHICH IT OPERATES OR INTENDS TO OPERATE IN, THEIR FINANCIAL STATUS, LIQUIDITY, CHARACTERISTICS, PROSPECTS AND ABILITIES COUILD MATERIALLY DIFFER FROM THOSE, WHICH ARE EXPRESSED WITH THE HELP OF SUCH STATEMENTS RELATED TO THE FUTURE. THE IMPORTANT FACTORS, WHICH MAY RESULT IN SUCH DIFFERENCES, INCLUDE, INTER ALIA, CHANGING BUSINESS CONDITIONS AND OTHER MARKET CONDITIONS, COMMON ECONOMIC CONDITIONS IN RUSSIA, EU COUNTRIES, THE UNITED STATES OF AMERICA OR ANYWHERE ELSE, AS WELL AS THE ABILITY OF THE COMPANY TO MEET THE TRENDS IN THE INDUSTRY. THE MATERIAL DIFFERENCE OF THE ACTUAL RESULTS, FEATURES AND ACHIEVEMENTS MAY BE THE RESULT OF ADDITIONAL FACTORS. THE COMPANY AND ALL ITS DIRECTORS, OFFICERS, EMPLOYEES AND ADVISORS HEREWITH STATE THAT THEY ARE NOT OBLIGED TO ISSUE ANY UPDATE OF OR REVISE ANY STATEMENTS RELATED TO THE FUTURE CONTAINED HEREIN, OR DISCLOSE ANY CHANGES IN THE FORECASTS OF THE COMPANY OR EVENTS, CONDITIONS AND CIRCUMSTANCES, WHICH SUCH STATEMENTS RELATED TO THE FUTURE ARE BASED ON, SAVE AS IN THE CASES PROVIDED FOR BY THE APPLICABLE LAWS.
•RECEIPT OF ANY COPY OF THIS INFORMATION TESTIFIES THE ACCEPTANCE OF THE ABOVE LIMITATIONS.
Disclaimer
GDR Depositary - BNY Mellon
Contact person at the depositary
Ludmila Leliavskaia Vice President
Tel +1.212.815.4493 [email protected]
MMK (Magnitogorsk Iron & Steel works)
Ordinary shares listed at MICEX and RTS in June 2006.
GDRs listed at LSE in April 2007
ISIN / СUSIP US5591892048/559189105
Andrey Serov Head of IR
Tel +7 (3519) 24 52 97 [email protected]
www.mmk.ru
Contacts at MMK
Tickers
MICEX, RTS: MAGN
LSE: MMK
Bloomberg: MMK:LI
27