Embed Size (px)
Citation preview
Volume 11 No. 1 Quezon City, Philippines
ISSN 2094-6201
Major Fruit Crops Quarterly Bulletin
January-March 2017
Solid ∙ Responsive ∙ World Class PHILIPPINE STATISTICS AUTHORITY
Republic of the Philippines

Major
Fruit Crops Quarterly Bulletin
January-March 2017
Solid ∙ Responsive ∙ World Class PHILIPPINE STATISTICS AUTHORITY
Republic of the Philippines

Major Fruit Crops Quarterly Bulletin is a publication of the Philippine Statistics A uthority. T he PSA r eserves ex clusive r ight t o r eproduce t his publication in whatever f orm. S hould any portion of this publ ication b e included in a report/article, the title of the publication and the PSA should be cited as the source of data. The PSA will not be responsible for an y information derived from the processing of data contained in this bulletin.
REPUBLIC OF THE PHILIPPINES
HIS EXCELLENCY PRESIDENT RODRIGO R. DUTERTE
PHILIPPINE STATISTICS AUTHORITY
LISA GRACE S. BERSALES, Ph.D. National Statistician
JOSIE B. PEREZ
Deputy National Statistician Census and Technical Coordination Office
Office
ROMEO S. RECIDE Deputy National Statistician
Sectoral Statistics Office
ii

FOREWORD
The Major Fruit Crops Quarterly Bulletin provides up dates on production of banana , calamansi, m ango, a nd pineapple. T hese c rops are hi ghlighted i n t he r eport on t he Performance of A griculture that the Philippine Statistics Authority (PSA) releases quarterly. This 1st quarter 2017 issue of the Bulletin presents the final estimates of production for October-December 2016 and t he preliminary estimates f or J anuary-March 201 7. The main source of data is the quarterly Crops Production Survey (CrPS) of the PSA.
LISA GRACE S. BERSALES, Ph. D. National Statistician Quezon City, Philippines May 2017
iii

TABLE OF CONTENTS Administrative Page …………………………………………………………………… ….. ii Foreword ……………………………………………………………………...................... iii Table of Contents ………………………………………………………………………….. iv Technical Notes ……………………………………………………………………………. v
Banana ……………………………………………………………………………. 2
Calamansi ……………………………………………………………………….... 4 Mango …………………………………………………………………………….. 6 Pineapple ……………………………………………………………………….... 8
List of Tables
TABLE 1 Volume of Production for Selected Fruit Crops, Philippines, October-December: 2015-2016 and January-March: 2016-2017p 10 TABLE 2 Volume of Production for Banana by Region, October-December: 2015-2016 and January-March: 2016-2017p 11 TABLE 3 Volume of Production for Calamansi by Region, October-December: 2015-2016 and January-March: 2016-2017p 12 TABLE 4 Volume of Production for Mango by Region, October-December: 2015-2016 and January-March: 2016-2017p 13 TABLE 5 Volume of Production for Pineapple by Region, October-December: 2015-2016 and January-March: 2016-2017p 14
List of Figures
FIGURE 1 Banana Production by Region, January-March: 2017p 1 FIGURE 2 Distribution of Banana Production by Region, January-March: 2017p 2 FIGURE 3 Percent Distribution of Banana Production by Variety, January-March: 2017p 2 FIGURE 4 Calamansi Production by Region, January-March: 2017p 3 FIGURE 5 Distribution of Calamansi Production by Region, January-March: 2017p 4 FIGURE 6 Mango Production by Region, January-March: 2017p 5 FIGURE 7 Distribution of Mango Production by Region, January-March: 2017p 6 FIGURE 8 Percent Distribution of Mango Production by Variety, January-March: 2017p 6 FIGURE 9 Pineapple Production by Region, January-March: 2017p 7 FIGURE 10 Distribution of Pineapple Production by Region, January-March: 2017p 8
iv

TECHNICAL NOTES Production refers to the quantity produced and actually harvested for a particular crop during the reference period. For other crops, area planted refers to the actual physical area pl anted w hile ar ea harvested refers t o the ac tual area f rom which h arvests ar e realized. Bearing t rees/hills i s the num ber of t rees/hills where harvesting has been made i n t he p ast but m ay or m ay n ot h ave b orne f ruits or pr oductive d uring t he reference period due to cyclical production pattern of the crop. Estimates of production, area planted/harvested, and number of bearing trees/hills are generated from the Quarterly Crops Production Survey (CrPS) of which there are four survey rounds in a year, that is, February, May, August, and November.
v

1
FIGURE 1 Banana Production by Region, January-March: 2017p

2
Banana
• For the period January-March 2017, production of banana went up by 2.6 percent from 2.05 million metric tons in 2016 to 2.10 million metric tons this year. This was brought about by the following: o increase in area and number of bearing hills harvested for Cavendish variety on
corporate farms in Bukidnon, Sultan Kudarat, Davao City, Davao del Norte, and Davao Oriental; and
o bigger bunches harvested in Misamis Oriental, Saranggani, South Cotabato, Compostela Valley, and Davao del Sur due to sufficient rainfall.
• The bulk of production came from Davao Region with a share of 36.9 percent. Northern Mindanao followed with 24.5 percent and SOCCSKSARGEN with 12.9 percent (Figure 2).
• Cavendish variety recorded the highest output at 1.17 million metric tons representing 55.8 percent of the total banana production this quarter. Lakatan ranked second with 25.5 percent share and Saba with 9.0 percent (Figure 3).
FIGURE 3 Percent Distribution of Banana Production by Variety, January-March: 2017p
Cavendish55.8%Lakatan
25.5%
Saba9.0%
Others9.8%
FIGURE 2 Distribution of Banana Production by Region, January-March: 2017p
Davao Region36.9%
Northern Mindanao
24.5%
SOCCSKSARGEN12.9%
Other Regions25.7%

3
FIGURE 4 Calamansi Production by Region, January-March: 2017p

4
Calamansi • The January-March 2017 production of calamansi was estimated at 14.99 thousand
metric t ons w hich was 4.4 per cent l ower t han l ast year’s 15. 69 t housand m etric tons. This decline in output was caused by the following factors: o decrease in number of bear ing trees i n Q uezon due t o T yphoon “ Nina”
in December 2016; and o drop in yield in Batangas due to effect of fruit flies during flowering and in Davao
del Norte due t o d amages br ought b y h eavy r ains during the flowering a nd fruiting stages.
• The top calamansi producers and their shares during the period were MIMAROPA with 16.9 percent; CALABARZON, 15.7 percent; and Central Luzon, with 14.3 percent (Figure 5).
FIGURE 5 Distribution of Calamansi Production by Region, January-March: 2017p
MIMAROPA16.9%
CALABARZON15.7%
Central Luzon14.3%
Other Regions53.1%

5
FIGURE 6 Mango Production by Region, January-March: 2017p

6
Mango • During the January-March 2017 period, production of mango dropped
by 7.8 percent, from 117.00 thousand metric tons in 2016 to 107.83 thousand metric tons this year. The decrease could be attributed to:
o the incidence of capsid bug and cecid fly in Zambales that resulted to poor quality of fruits and premature fruit drops; and
o the decrease in yield in Nueva Ecija and Pangasinan due to rainshowers during flowering.
• Ilocos Region topped all the mango producing regions with 59.99 thousand metric tons contributing 55.6 percent to the national total. Central Luzon ranked second with 18.4 percent share and Western Visayas with 5.8 percent (Figure 7).
• Carabao mango comprised 81.8 percent of the total mango output this quarter (Figure 8).
FIGURE 7 Distribution of Mango Production by Region, January-March: 2017p
Ilocos Region55.6%
Central Luzon18.4%
Western Visayas5.8%
Other Regions20.2%
FIGURE 8 Percent Distribution of Mango Production by Variety, January-March: 2017p
Carabao81.8%
Piko4.0%
Others14.2%
7
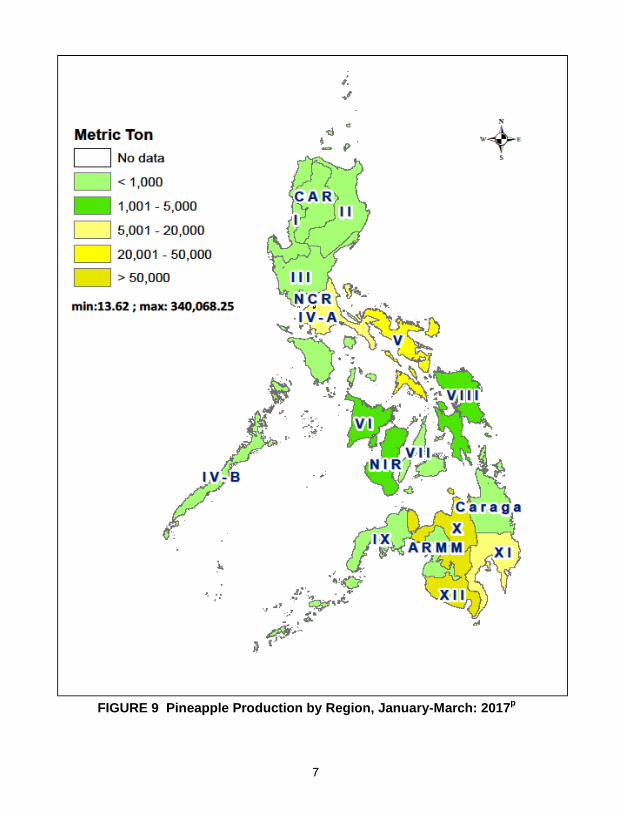
FIGURE 9 Pineapple Production by Region, January-March: 2017p

8
Pineapple • In the first quarter of 2017, pineapple production was estimated at 613.53 thousand
metric tons, 3.8 percent higher than the 2016 level of 591.25 thousand metric tons. The increment could be traced to the: o increase in area harvested on corporate farms in Bukidnon and North Cotabato; o increase in yield in South Cotabato due to sufficient soil moisture; and o bigger and g ood quality o f fruits har vested i n C amarines N orte d ue t o more
application of fertilizer.
• Northern M indanao r emained the hi ghest pr oducer with 340.07 t housand m etric tons contributing 55.4 p ercent t o t he na tional p ineapple output during t he q uarter. The other t op producing r egions were SOCCSKSARGEN with 34. 9 percent s hare and Bicol Region with 5.9 percent (Figure 10).
FIGURE 10 Distribution of Pineapple Production by Region, January-March: 2017p
Northern Mindanao
55.4%
SOCCSKSARGEN34.9%
Bicol Region5.9%
Other Regions3.8%

STATISTICAL TABLES

TABLE 1 Volume of Production for Selected Fruit Crops, Philippines: October-December: 2015-2016 and January-March: 2016-2017p (In metric tons)
ppPreliminary
2015 2016 2016 2017p Oct-Dec Jan-Mar
Banana 2,299,320 2,335,941 2,048,133 2,100,538 1.6 2.6 Cavendish 1,181,114 1,209,320 1,112,603 1,171,406 2.4 5.3 Lakatan 239,243 239,206 189,074 188,325 (0.0) (0.4) Saba 636,435 643,787 538,108 535,107 1.2 (0.6) Calamansi 27,634 28,052 15,685 14,988 1.5 (4.4) Mango 33,127 30,579 117,001 107,827 (7.7) (7.8) Carabao 26,776 24,751 96,183 88,199 (7.6) (8.3) Pineapple 670,021 679,168 591,249 613,526 1.4 3.8
January-March ChangePercentProduction
October-DecemberCROP
10
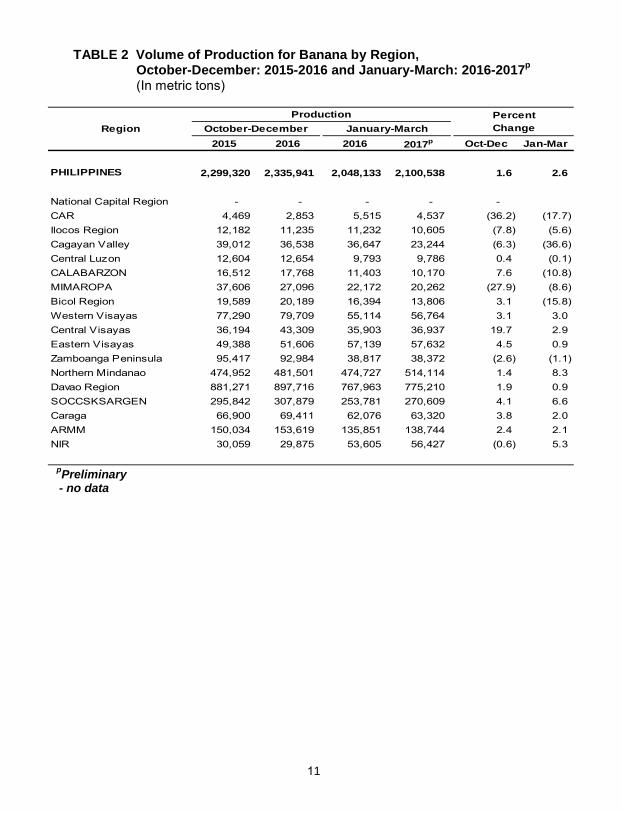
TABLE 2 Volume of Production for Banana by Region, October-December: 2015-2016 and January-March: 2016-2017p (In metric tons)
pPreliminary - no data
2015 2016 2016 2017p Oct-Dec Jan-Mar
PHILIPPINES 2,299,320 2,335,941 2,048,133 2,100,538 1.6 2.6
National Capital Region - - - - - CAR 4,469 2,853 5,515 4,537 (36.2) (17.7) Ilocos Region 12,182 11,235 11,232 10,605 (7.8) (5.6) Cagayan Valley 39,012 36,538 36,647 23,244 (6.3) (36.6) Central Luzon 12,604 12,654 9,793 9,786 0.4 (0.1) CALABARZON 16,512 17,768 11,403 10,170 7.6 (10.8) MIMAROPA 37,606 27,096 22,172 20,262 (27.9) (8.6) Bicol Region 19,589 20,189 16,394 13,806 3.1 (15.8) Western Visayas 77,290 79,709 55,114 56,764 3.1 3.0 Central Visayas 36,194 43,309 35,903 36,937 19.7 2.9 Eastern Visayas 49,388 51,606 57,139 57,632 4.5 0.9 Zamboanga Peninsula 95,417 92,984 38,817 38,372 (2.6) (1.1) Northern Mindanao 474,952 481,501 474,727 514,114 1.4 8.3 Davao Region 881,271 897,716 767,963 775,210 1.9 0.9 SOCCSKSARGEN 295,842 307,879 253,781 270,609 4.1 6.6 Caraga 66,900 69,411 62,076 63,320 3.8 2.0 ARMM 150,034 153,619 135,851 138,744 2.4 2.1 NIR 30,059 29,875 53,605 56,427 (0.6) 5.3
RegionPercentChange
ProductionOctober-December January-March
11

TABLE 3 Volume of Production for Calamansi by Region, October-December: 2015-2016 and January-March: 2016-2017p
(In metric tons)
12
pPreliminary - no data
2015 2016 2016 2017p Oct-Dec Jan-Mar
PHILIPPINES 27,634 28,052 15,685 14,988 1.5 (4.4)
National Capital Region - - - - - CAR 124 111 134 130 (10.8) (3.6) Ilocos Region 927 890 625 633 (4.0) 1.3 Cagayan Valley 2,686 2,274 650 581 (15.3) (10.6) Central Luzon 3,018 2,934 2,251 2,136 (2.8) (5.1) CALABARZON 3,695 4,079 2,761 2,353 10.4 (14.8) MIMAROPA 1,288 1,186 2,594 2,535 (7.9) (2.3) Bicol Region 592 661 244 225 11.7 (8.0) Western Visayas 1,985 1,775 1,140 1,203 (10.6) 5.5 Central Visayas 103 111 83 80 8.3 (3.5) Eastern Visayas 406 428 440 449 5.3 2.0 Zamboanga Peninsula 3,854 4,012 619 600 4.1 (3.1) Northern Mindanao 507 534 343 368 5.3 7.2 Davao Region 2,316 2,414 1,817 1,654 4.2 (9.0) SOCCSKSARGEN 2,314 2,318 1,168 1,321 0.2 13.1 Caraga 3,278 3,786 474 363 15.5 (23.6) ARMM 442 447 237 246 1.3 3.8 NIR 99 92 105 113 (7.6) 7.7
ChangeRegionProduction Percent
October-December January-March

TABLE 4 Volume of Production for Mango by Region, October-December: 2015-2016 and January-March: 2016-2017p (In metric tons)
13
pPreliminary - no data
2015 2016 2016 2017p Oct-Dec Jan-Mar
PHILIPPINES 33,127 30,579 117,001 107,827 (7.7) (7.8)
National Capital Region - - - - - CAR - - 484 527 - 8.8 Ilocos Region 1,483 1,379 62,205 59,990 (7.0) (3.6) Cagayan Valley - - 8 6 - (25.0) Central Luzon 266 243 24,136 19,886 - (17.6) CALABARZON - - 803 295 - (63.3) MIMAROPA 154 156 624 597 1.4 (4.4) Bicol Region 219 219 21 17 (0.2) (19.0) Western Visayas 382 349 6,908 6,214 (8.6) (10.0) Central Visayas 3,106 2,286 1,838 1,826 (26.4) (0.6) Eastern Visayas 134 115 21 19 (14.1) (9.6) Zamboanga Peninsula 11,040 9,844 5,773 5,305 (10.8) (8.1) Northern Mindanao 4,356 4,304 1,314 1,260 (1.2) (4.1) Davao Region 2,615 2,579 2,688 2,612 (1.4) (2.8) SOCCSKSARGEN 1,653 1,394 6,866 6,117 (15.7) (10.9) Caraga 5,797 5,934 999 947 2.4 (5.3) ARMM 982 935 71 65 (4.8) (8.1) NIR 938 842 2,242 2,145 (10.2) (4.3)
RegionProduction Percent
October-December January-March Change

TABLE 5 Volume of Production for Pineapple by Region, October-December: 2015-2016 and January-March: 2016-2017p (In metric tons)
14
pPreliminary - no data
2015 2016 2016 2017p Oct-Dec Jan-Mar
PHILIPPINES 670,021 679,168 591,249 613,526 1.4 3.8
National Capital Region - - - - - CAR 9 8 70 72 (2.5) 3.2 Ilocos Region 56 55 14 14 (2.2) (0.7) Cagayan Valley 152 133 563 466 (12.8) (17.3) Central Luzon 82 92 25 21 12.6 (15.8) CALABARZON 13,319 14,697 10,739 11,081 10.3 3.2 MIMAROPA 41 52 113 127 27.8 12.1 Bicol Region 16,089 15,580 33,216 36,246 (3.2) 9.1 Western Visayas 4,333 4,216 1,521 1,616 (2.7) 6.3 Central Visayas 61 59 48 25 (4.3) (47.7) Eastern Visayas 271 567 1,455 1,361 109.3 (6.5) Zamboanga Peninsula 727 659 144 142 (9.3) (1.5) Northern Mindanao 425,832 431,874 328,538 340,068 1.4 3.5 Davao Region 3,981 4,063 6,484 6,575 2.1 1.4 SOCCSKSARGEN 203,445 205,586 206,573 213,932 1.1 3.6 Caraga 202 210 103 94 4.0 (9.0) ARMM 277 269 130 130 (2.9) (0.1) NIR 1,147 1,049 1,514 1,557 (8.5) 2.9
RegionProduction Percent
October-December January-March Change

/Philippine Statistics Authority /PSAgovph

Republic of the Philippines PHILIPPINE STATISTICS AUTHORITY
16th Floor, ETON Cyberpod Centris 3 EDSA, Quezon City
www.psa.gov.ph