Embed Size (px)
Citation preview
Market Research Market
アジアのリサーチ市場(いちば)
Discussion Summary & Overview Presentations, 2010/11/25

Overall methodologies- If interviewing generic population representatively, CATI will be
recommended. CATI questionnaire is usually better no longer than
20 minutes.
- For those low incident product/brand research, pre- recruited and
CLT is applied. CAPI is very commonly used in CLT.
About Online- Now online data collection is popular for kinds of special
segments research, such as baby’s mom, IT managers, business
elite who access internet very often.
- The client is starting to try more types of research. We can predict
much more online application in the next few years.
About physician and patient interview- A very good sampling database exists to do physician sampling
design, due to the organized hospital management.
Discussion Summary from China (CMRA) : 1
Doing research in Beijing, Shanghai and Guangzhou - As the first tier cities, Beijing, Shanghai and Guangzhou are always
selected to collect consumer’s insight. At the analysis stage, if the
sample is enough, we will do city comparison due to the significant
difference consumer’s living habit and personality. If sampling more
than those three cities, we always group those three cities as the tier
one city result.
Statistics is reliable for sampling design reference- Some people say the statistical data from the government is not so
accurate. But, when doing sampling design, that data is the only solid
for reference, better than none. Further more, country level, province
level and city level data is existed.
Discussion Summary from China (CMRA) : 2

Japanese Teens: Internal Market
- Less powerful, more selective as consumers.
- Investment for “myself” is important.
- “Kawaii”(Cute) ,“Friendly” and “Relax” are important concepts to
approach them.
Japanese products in Asian Countries: External Market- Which sweets and drinks are popular in each country?
- How do Asian consumers feel about Japanese products?
Like? Dislike? Don’t Know?
Discussion Summary from Japan

Difference in mind set.• Due to country size, Korean firms have always sought
opportunities overseas cf. Japanese companies only looked at Japan.
Clients have Different Views on each countries• To see marketing opportunities in each market.
Speed• Korean clients are very time-oriented, quick to make decisions
based on research result.
Growth of Online Method in Korea• Korean clients relay on online research result.• Comparison with Japanese MR industry,
especially research fee and speed to respond clients.
Discussion Summary from Korea
• Diversity- Difference of culture among ethnic groups, even language.
- Divided markets for each ethnic groups.
- Diversified consumer behavior.
- Literacy rate is very high even in rural areas.
• Country Census Singapore versus Malaysia
• More segments in Malaysia more FGI groups
- Attitude of FGI respondents are very different country to country.
Discussion Summary of
Singapore, Malaysia, and Chinese Taipei
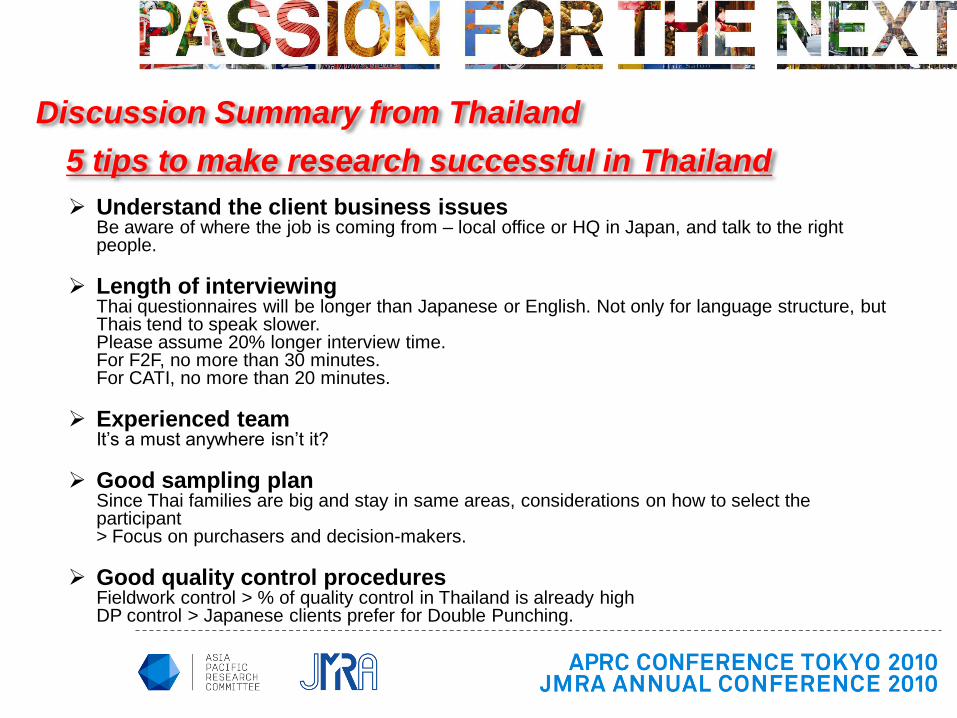
Understand the client business issuesBe aware of where the job is coming from – local office or HQ in Japan, and talk to the right people.
Length of interviewingThai questionnaires will be longer than Japanese or English. Not only for language structure, but Thais tend to speak slower.Please assume 20% longer interview time.For F2F, no more than 30 minutes.For CATI, no more than 20 minutes.
Experienced teamIt’s a must anywhere isn’t it?
Good sampling planSince Thai families are big and stay in same areas, considerations on how to select the participant> Focus on purchasers and decision-makers.
Good quality control proceduresFieldwork control > % of quality control in Thailand is already highDP control > Japanese clients prefer for Double Punching.
Discussion Summary from Thailand
5 tips to make research successful in Thailand

AUSTRALIA
AUSTRALIA
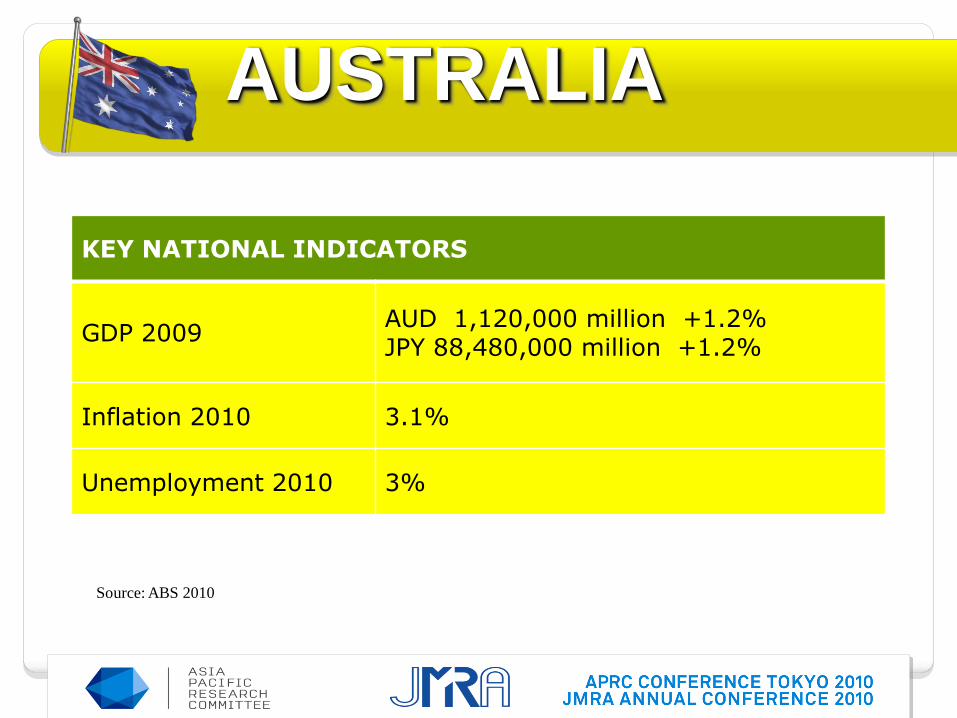
KEY NATIONAL INDICATORS
GDP 2009AUD 1,120,000 million +1.2%JPY 88,480,000 million +1.2%
Inflation 2010 3.1%
Unemployment 2010 3%
Source: ABS 2010

AUSTRALIA
In 2009, the GFC flowed through to reduce market research spending
In 2009, industry revenue fell by 9% to AUD 729 million (JPY 57,591 million)
Source: ESOMAR 2009
KEY INDUSTRY FIGURES 2009
Industry revenue 729 $million (AUD)
Revenue growth -9 %
Number of enterprises 294
Employment 12,300 People

AUSTRALIA
Online 32%
Phone 18%
Face to face 7%
Postal 1%
Other 5%
Groups 22%
In-depth interviews 10%
Other 1%Source: ESOMAR 2009

AUSTRALIA
Source: ESOMAR 2009

Taking comfort in reliable and trusted brands
Adopting more convenient shopping methods
and channels
Purchasing locally grown and manufactured products
Adopting sustainable living and conscious
purchasing practices.
AUSTRALIA
Recent trends in Australian
consumer behaviour
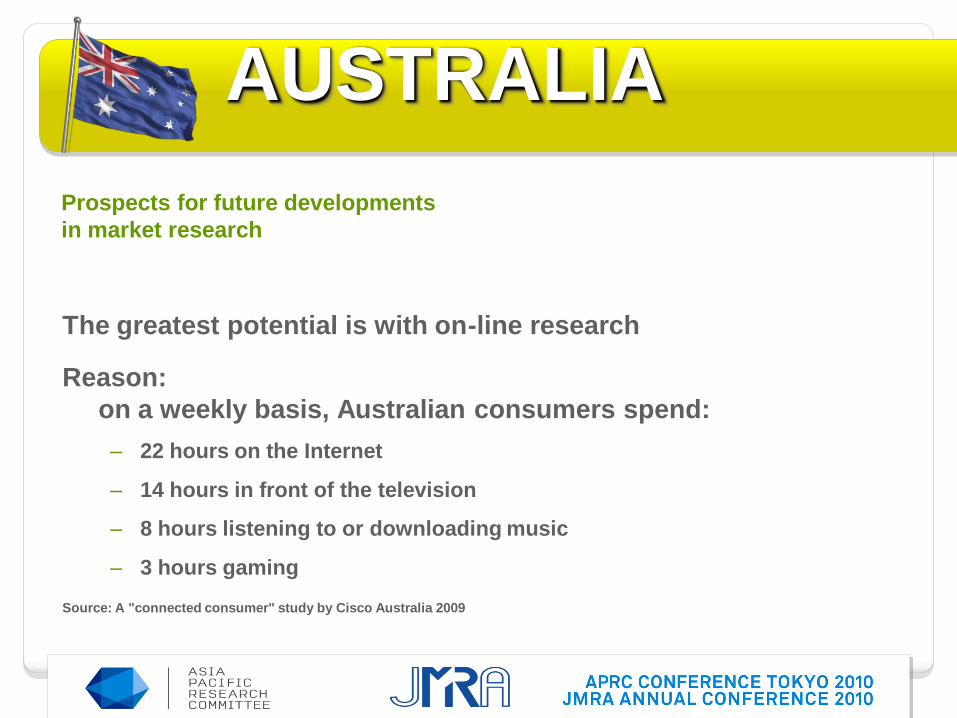
The greatest potential is with on-line research
Reason:
on a weekly basis, Australian consumers spend:
– 22 hours on the Internet
– 14 hours in front of the television
– 8 hours listening to or downloading music
– 3 hours gaming
Source: A "connected consumer" study by Cisco Australia 2009
AUSTRALIA
Prospects for future developments
in market research

80% of Australians have internet access (Nielsen) and 80% of
Australians shop online
Up to 50% of Australians search online prior to purchasing in-
store
Ranked as the most important pre-purchase information source
due to “ease of comparison‟
Growth linked to technological advancement and smart-phone
devices
Source: Australian Institute of Retail Studies 2010
AUSTRALIA
Online consumer behaviour

AUSTRALIA
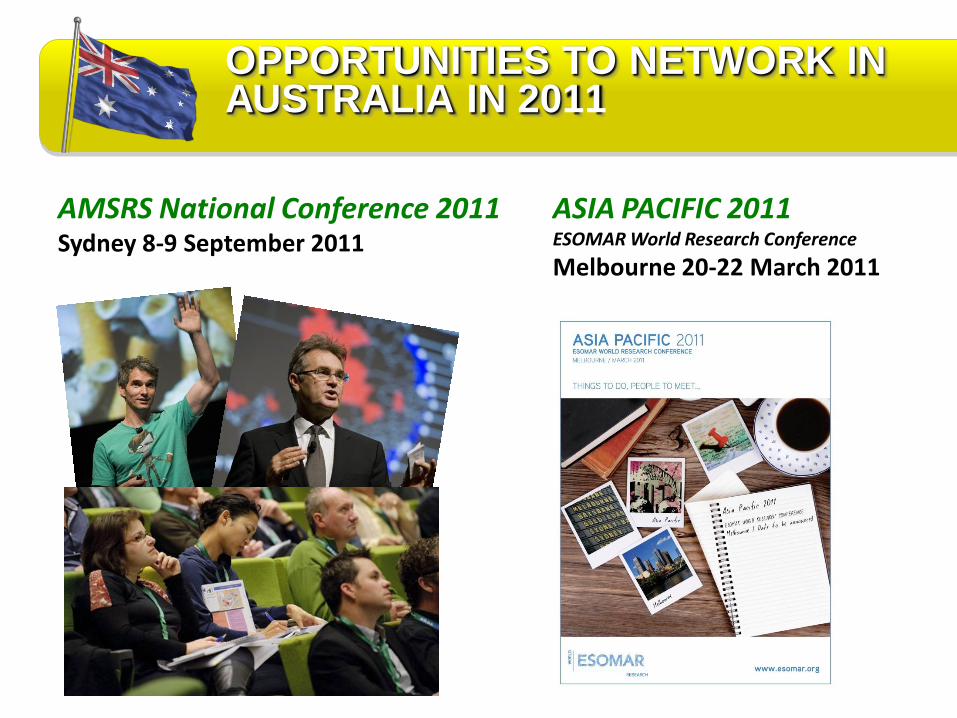
OPPORTUNITIES TO NETWORK IN AUSTRALIA IN 2011
ASIA PACIFIC 2011ESOMAR World Research Conference
Melbourne 20-22 March 2011
AMSRS National Conference 2011Sydney 8-9 September 2011
China Market Research
Industry Review
CMRA

China’s Market Research
2008 2009Oct
2010
Inflation rate 5.9% -0.7% 4.1%
Gross Domestic Product Growth
Size (BCNY) 31,405 34,051 38,921
Growth rate 9.6% 9.1% 9.8%
Domestic Market Research Growth
Size (BCNY) 6,141 6,270 6,897
Growth rate 17.5% 8.9% 13.3%
Labor cost evolution 11% 12% 10%
Internet penetration rate 22.6% 28.9% 31.8%
Population (BCNY) 1.32 1.33 1.34

Market Share by Methodology
2008 2009 2010
Telephone 16% 16% 16%
Face to Face 64% 61% 62%
Mail 2% 2% 2%
Qualitative 14% 16% 15%
Prof.Service/Consulting 2% 2% 2%
Online 2% 3% 3%
Total 100% 100% 100%

Market Share by Client Industry
23
5
24
0.8
10
28.8
4.68
12
4.4
0.6
4.63.7 3
4.93.4 3.9 3.4
5.2
0.93.6 3.9
0
5
10
15
20
25
30
35
FMCG Durables Industrial Wholesale/retail Finance IT Auto
2008 2009 2010 Est
Percentage %
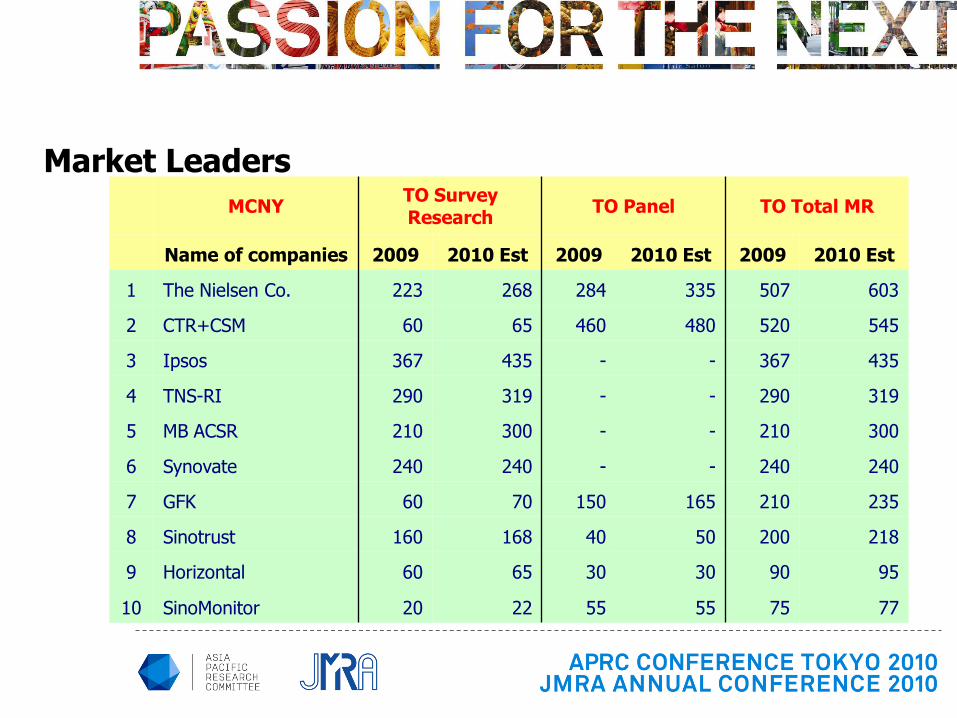
Market Leaders
MCNYTO Survey Research
TO Panel TO Total MR
Name of companies 2009 2010 Est 2009 2010 Est 2009 2010 Est
1 The Nielsen Co. 223 268 284 335 507 603
2 CTR+CSM 60 65 460 480 520 545
3 Ipsos 367 435 - - 367 435
4 TNS-RI 290 319 - - 290 319
5 MB ACSR 210 300 - - 210 300
6 Synovate 240 240 - - 240 240
7 GFK 60 70 150 165 210 235
8 Sinotrust 160 168 40 50 200 218
9 Horizontal 60 65 30 30 90 95
10 SinoMonitor 20 22 55 55 75 77

% Very Good / Somewhat Good
Now thinking about our economic situation, how would you describe the current economic situation in [insert country]? Is it very good, somewhat good, somewhat bad or very bad? 23
China Leads the World along with
India in terms of its citizens and
their favorable assessment of
their current economic situation.
Source: Ipsos global research

17
15
1211
109
17
1415
10
8
11
16
13
10 10
13
10
1819
1213
11
6
Fresh fruits Cakes/bread Chewing gum Biscuits Chocolate Drinking yoghurt
Total Beijing Shanghai Guangzhou
%
Source: Ipsos global research
What Chinese are snacking on

Thank you for your attention!

Population
2010 estimate 127,360,000 (10th)
2004 census 127,333,002
Density 337.1/km² (36th)
(AU 3/km²)
GDP 2010 estimate
Total US$4,276trriion (3rd)
Per capita US$33,478 (23rd)
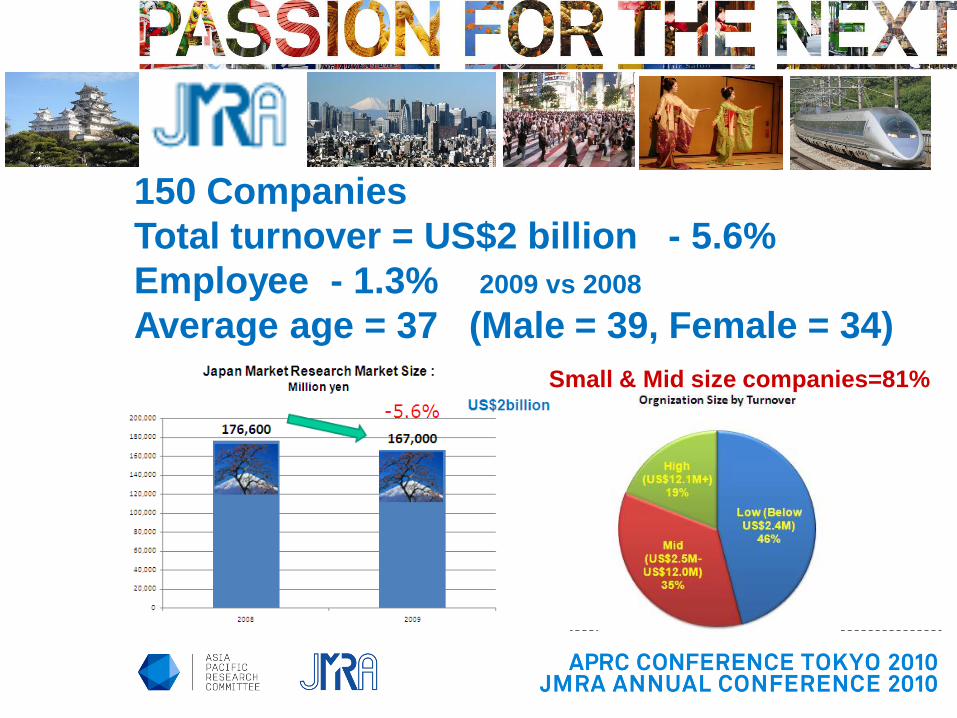
150 Companies
Total turnover = US$2 billion - 5.6%
Employee - 1.3% 2009 vs 2008
Average age = 37 (Male = 39, Female = 34)
Small & Mid size companies=81%

24676 25932
2974832361
28945
0
5000
10000
15000
20000
25000
30000
35000
2005 2006 2007 2008 2009
Global Market Research Market Size : Million US$
+3.5+4.3
+4.0+0.4
-4.6
Source: ESOMAR
Decline the market – Challenge the new Direction!
-4.6%

4267
295
363
365
370
576
587
631
657
757
918
1769
2688
2897
3248
8557
0 1000 2000 3000 4000 5000 6000 7000 8000 9000
Others
Korea
Sweden
Netherland
Mexico
Australia
Brazil
Canada
Spain
Italy
China
Japan
France
Germany
UK
USA
Marketing Research Market Size – Global 2009 : Million US$
Japan is No. 5 Market in the World!

30
36
58
67
70
74
78
86
88
114
192
295
576
918
1769
0 200 400 600 800 1000 1200 1400 1600 1800 2000
Vietnam
CIS*
Singapore
Malaysia
Philippines
New Zealand
Indonesia
Taiwan
Hong Kong
Thailand
India
Korea
Australia
China
Japan
Marketing Research Market Size - Asia 2009 : Million US$
CIS= Commonwealth of Independent States= Armenia, Azerbaijan, Georgia, Kazakhstan & Uzbekistan.
Source: ESOMAR
Japan is No. 5 Market in the World!
But No. 1 in Asia Pacific
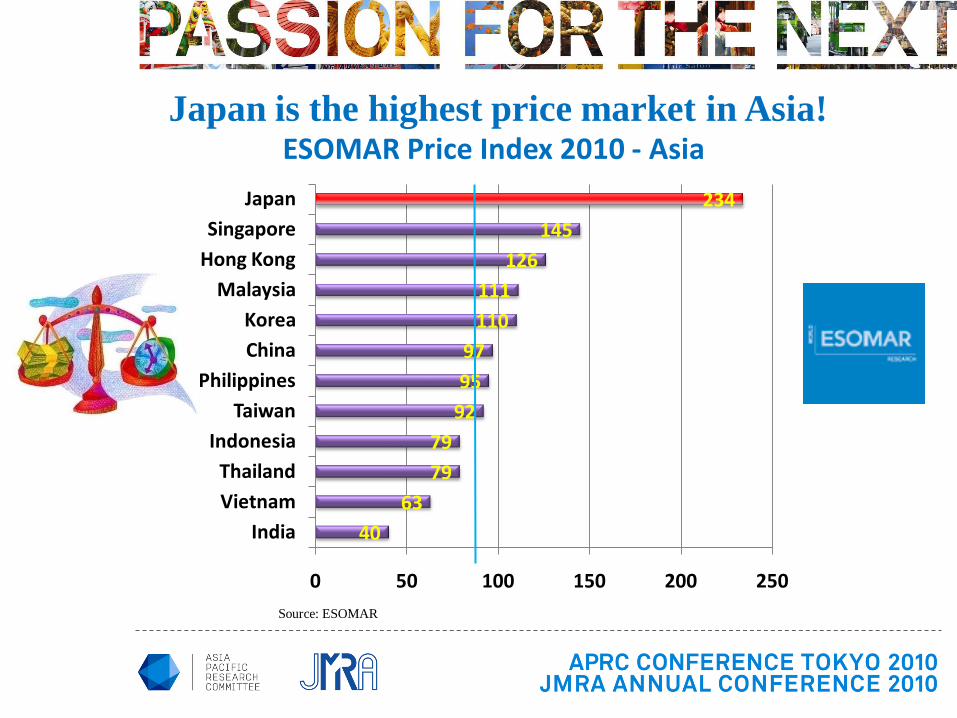
40
63
79
79
92
95
97
110
111
126
145
234
0 50 100 150 200 250
India
Vietnam
Thailand
Indonesia
Taiwan
Philippines
China
Korea
Malaysia
Hong Kong
Singapore
Japan
ESOMAR Price Index 2010 - Asia
Source: ESOMAR
Japan is the highest price market in Asia!

Ad / Research Agency & Media represent 40% Business in Japan
Manufacture 37%
Advertising Agency
17%
Research Agency
13%
Media10%
Others8%
Government5%
Traffic/Telecom4%
Retail/Hole sale3%
B to B2%
Financial1%
Source: JMRA Annual turnover ratio.

Online portion is growing and the biggest business in Japan
Online37%
CLT & others22%
Home visit12%
Mail11%
Focus Group
Interview8%
Depth Interview5%
Telephone3%
Quali Others2%
Source: JMRA Annual turnover ratio.

Internet Internet
Information Distribution Volume Information Consumption Volume
Trend of Information Volume – Base 2004=100
Telephone, Internet, Broadcast, Mail, Publishing/Printing, Package soft
Source: Institute for Information Communication Policy
3,500
100
100
200
2004 20042010 2010

Internet Access
Source: com SCORE

Low Price 70%
Unfavorable Sales 52%
Excessive Competition 42%
Lack of middle class staff 35%
Lack of Research skill 21%
Lack of Consulting capability 17%
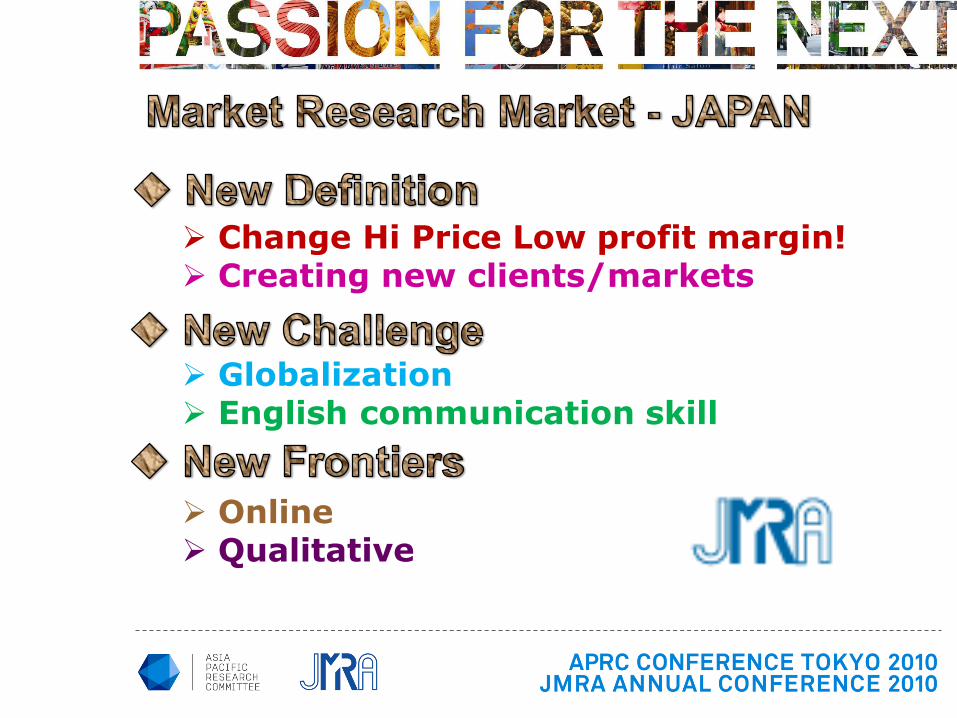
Change Hi Price Low profit margin! Creating new clients/markets
Globalization English communication skill
Online Qualitative

Current issues & insights:
“MORE ONLINE RESEARCH?”
Kee Hyoung Lee
Dongseo Research Inc.(DSR Group)
Korea Research Association (KORA)

Contents :
1. Overview of Korean Research Market
2. Asia Pacific Economic Confidence Study
3. Current issues & insights :
“More Online Research?”
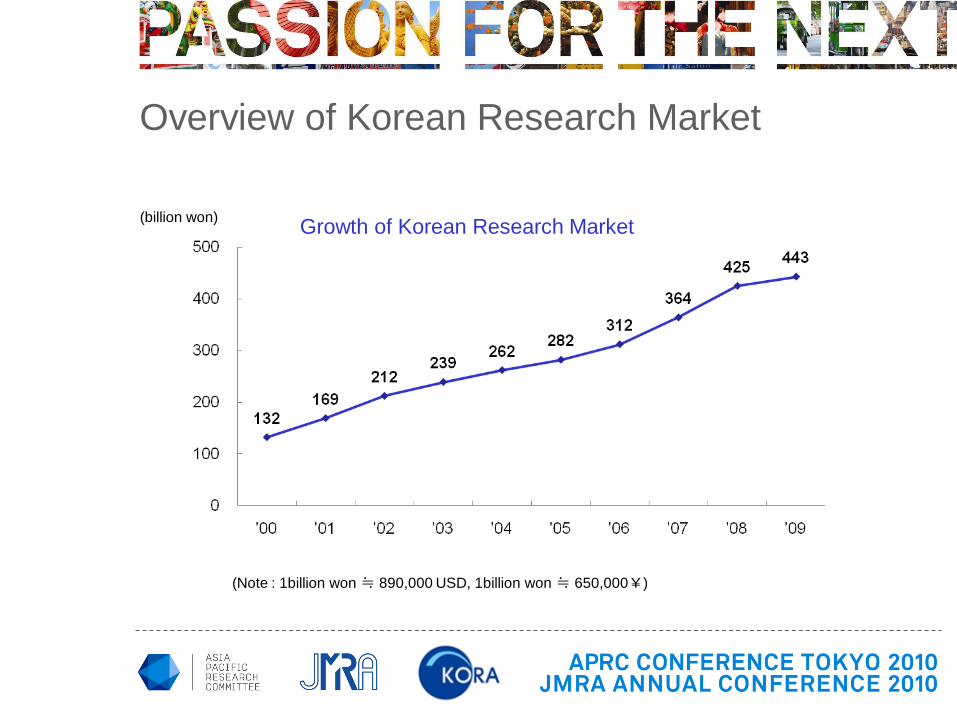
Overview of Korean Research Market
(Note : 1billion won ≒ 890,000 USD, 1billion won ≒ 650,000¥)
(billion won)Growth of Korean Research Market

Overview of Korean Research Market
Korean Research Market Share
M/S Global Rank
Japan 5.1 5
China 2.4 8
Australia 2.2 10
Korea 1.3 15
Overview of Korean Research Market
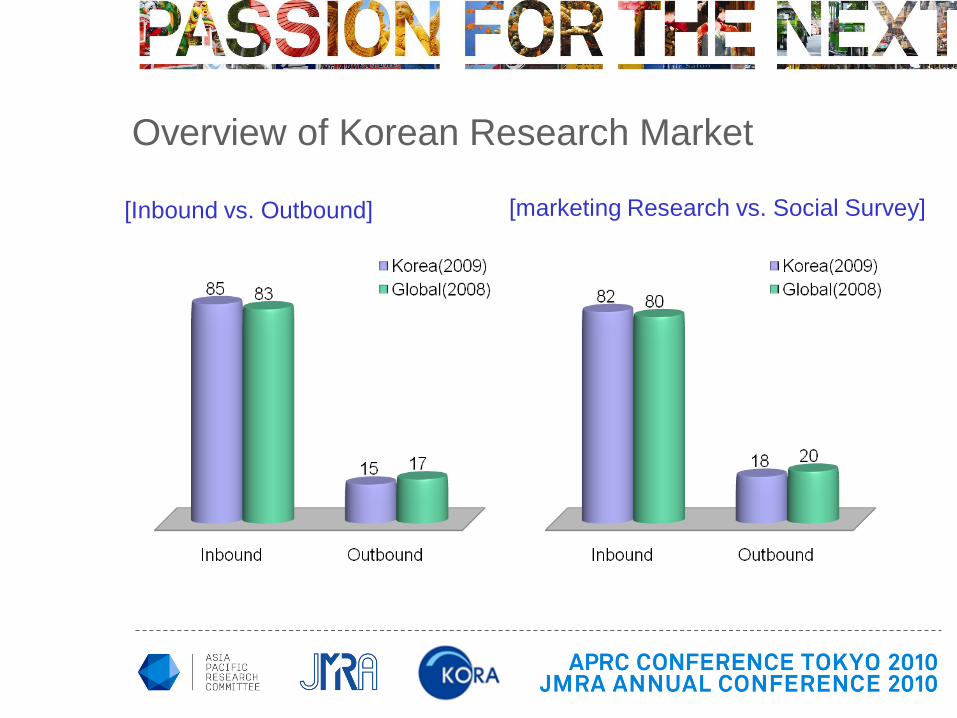
[Inbound vs. Outbound] [marketing Research vs. Social Survey]
Overview of Korean Research Market
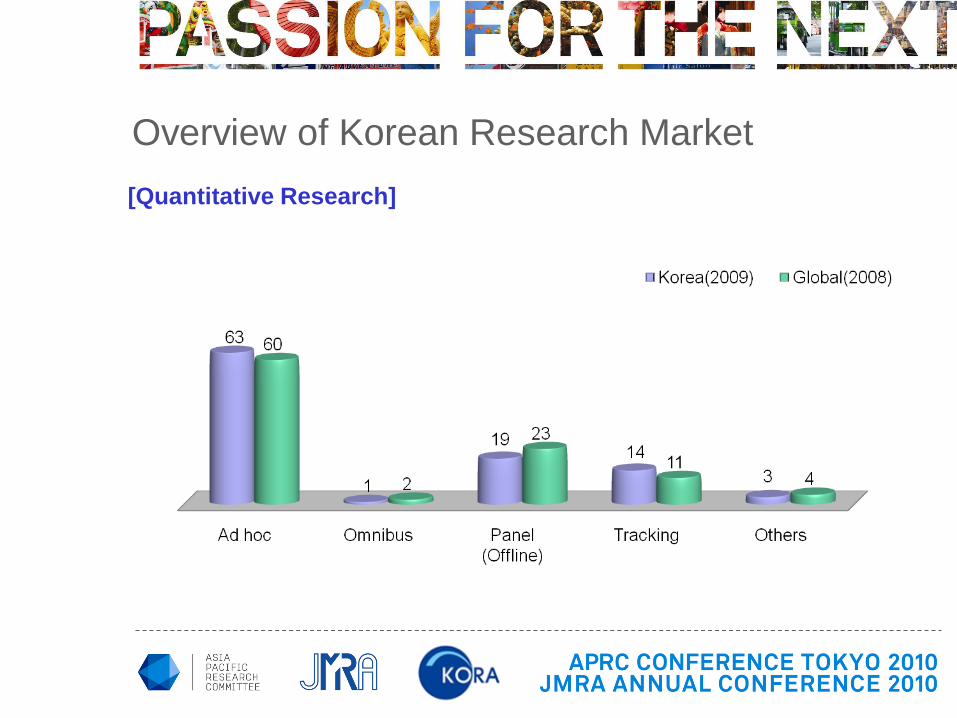
[Quantitative Research]

Overview of Korean Research Market
Korea (2009) Global (2008)
Product 45 47
FMCG 19 25
Drink 1 4
Food 4 7
Cosmetics 5 9
Cigarette 1 1
Confectionaries 1 2
Others 7 2
Durable Goods 11 2
Pharmaceuticals 6 11
Motor vehicles 5 4
Others 4 5
Commercial 4 4
Trade 5 4
Financial 7 5
Utilities 8 7
Gas/Water 3
Communication 4
Construction/Traffic 1
Public 18 9
Media/Entertainment 2 14
Advertisement 3 3
Research 4 3
Others 4 4
(%)[Area of Research]

Overview of Korean Research Market
Global
'00 '05 '08
Quantitative
F2F 40 24 12
Telephone 29 21 18
Mail 8 6 4
On-Line 2 13 21
Off-Line Trafic 1
ED/RFID/DB 17
Other 5 19 7
Qualitative 13 14 14
Other 3 3 6
Korea
'00 '05 '09
Quantitative
F2F 44 37 32
Telephone 27 19 14
Mail 1 1 1
On-Line 1 6 14
Off-Line Trafic 2
ED/RFID/DB 9
Other 7 18 11
Qualitative 17 17 15
Other 3 2 2
(%) (%)
[Methodology]
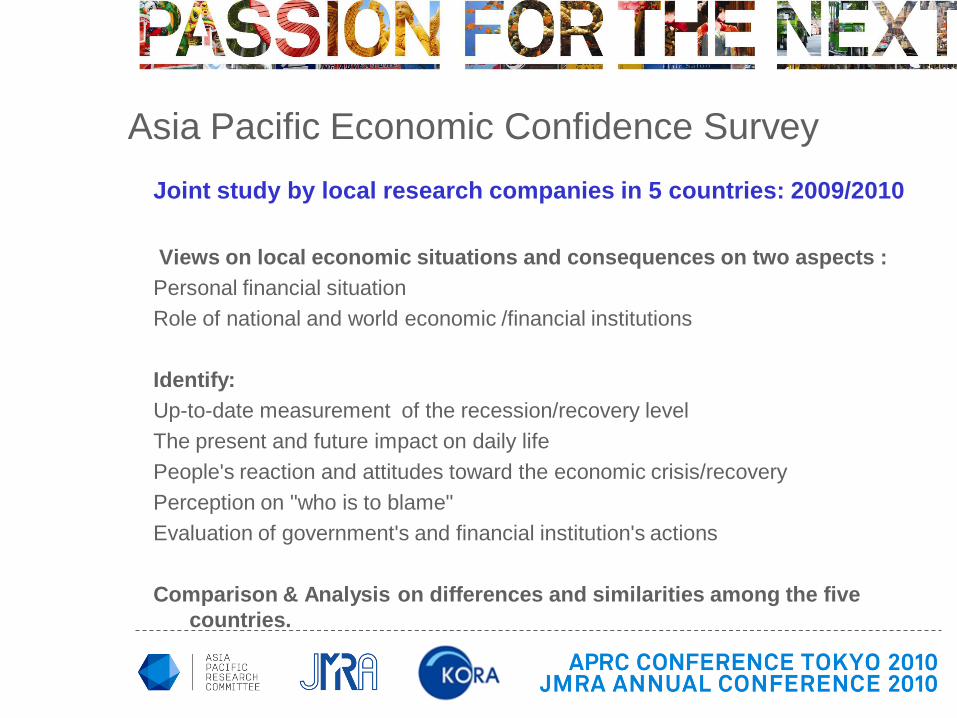
Joint study by local research companies in 5 countries: 2009/2010
Views on local economic situations and consequences on two aspects :
Personal financial situation
Role of national and world economic /financial institutions
Identify:
Up-to-date measurement of the recession/recovery level
The present and future impact on daily life
People's reaction and attitudes toward the economic crisis/recovery
Perception on "who is to blame"
Evaluation of government's and financial institution's actions
Comparison & Analysis on differences and similarities among the five
countries.
Asia Pacific Economic Confidence Survey

Australia China JapanSouth
KoreaThailand
Fieldwork:Telephone Telephone On-line Telephone Telephone
Respondents:Men & Women aged 20-69
2009 554 1,000 1,000 1,000 760
2010 502 1,000 1,000 1,000 1,025
Asia Pacific Economic Confidence Survey
[Survey Outline]
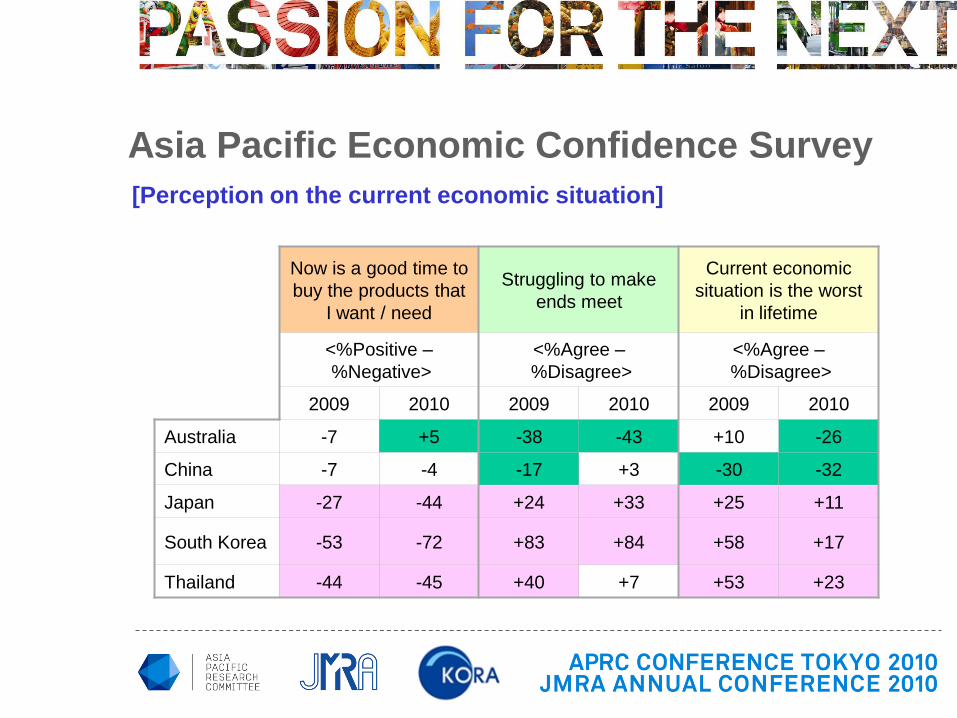
Now is a good time to
buy the products that
I want / need
Struggling to make
ends meet
Current economic
situation is the worst
in lifetime
<%Positive –
%Negative>
<%Agree –
%Disagree>
<%Agree –
%Disagree>
2009 2010 2009 2010 2009 2010
Australia -7 +5 -38 -43 +10 -26
China -7 -4 -17 +3 -30 -32
Japan -27 -44 +24 +33 +25 +11
South Korea -53 -72 +83 +84 +58 +17
Thailand -44 -45 +40 +7 +53 +23
Asia Pacific Economic Confidence Survey
[Perception on the current economic situation]
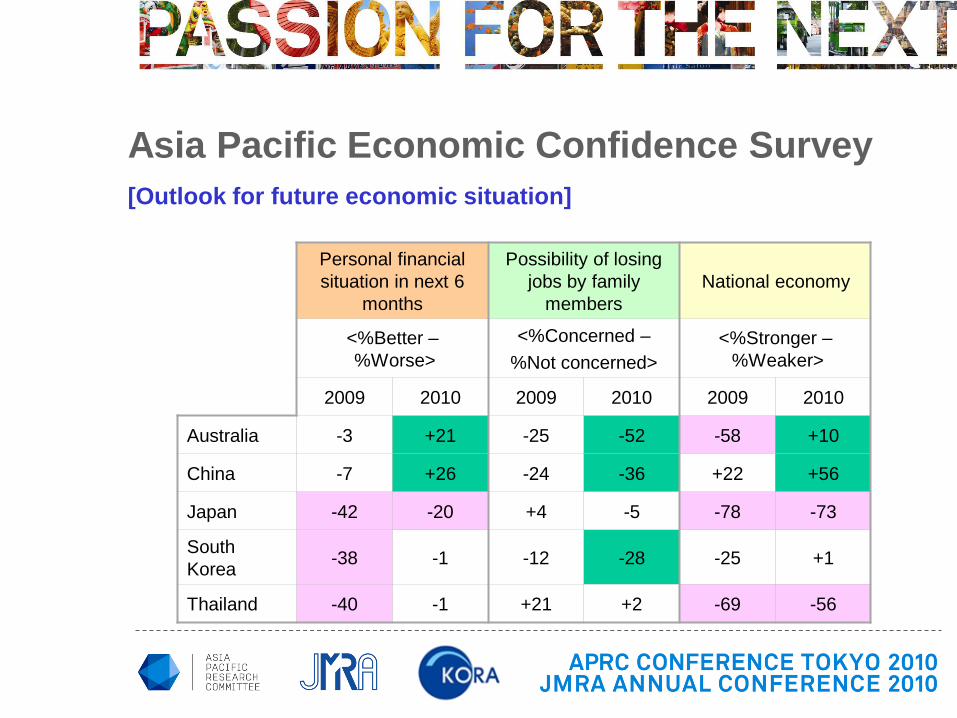
Personal financial
situation in next 6
months
Possibility of losing
jobs by family
members
National economy
<%Better –
%Worse>
<%Concerned –
%Not concerned>
<%Stronger –
%Weaker>
2009 2010 2009 2010 2009 2010
Australia -3 +21 -25 -52 -58 +10
China -7 +26 -24 -36 +22 +56
Japan -42 -20 +4 -5 -78 -73
South
Korea-38 -1 -12 -28 -25 +1
Thailand -40 -1 +21 +2 -69 -56
Asia Pacific Economic Confidence Survey
[Outlook for future economic situation]

Free Market System
works well vs. Need
gov’t intervention
Government taking
sufficient measures
IMF and World Bank
taking sufficient
measures
<%Free Market
System –
%Gov’t intervention>
<%Sufficient –
%Not Sufficient>
<%Sufficient –
%Not Sufficient>
2009 2010 2009 2010 2009 2010
Australia -14 -26 +33 +14 -12 -10
China -28 -20 +13 -16 +4 -20
Japan -17 -15 -93 -94 -85 -81
South Korea -30 -26 -8 +5 +15 +14
Thailand -37 -42 -79 -81 -77 -60
Asia Pacific Economic Confidence Survey
[Who is responsible for the global economic problem?]
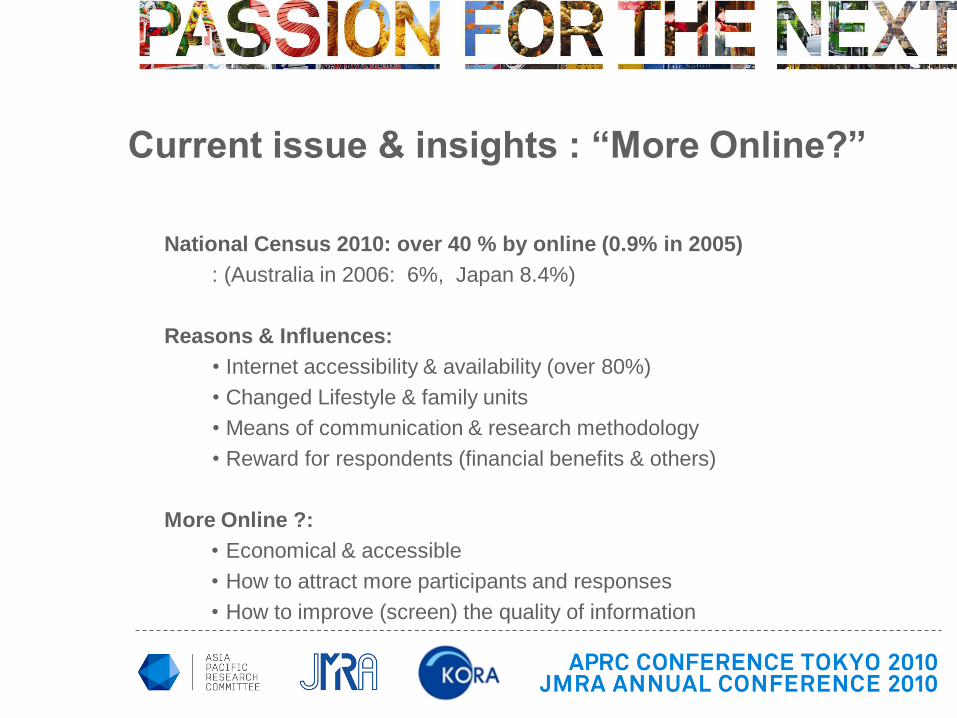
National Census 2010: over 40 % by online (0.9% in 2005)
: (Australia in 2006: 6%, Japan 8.4%)
Reasons & Influences:
• Internet accessibility & availability (over 80%)
• Changed Lifestyle & family units
• Means of communication & research methodology
• Reward for respondents (financial benefits & others)
More Online ?:
• Economical & accessible
• How to attract more participants and responses
• How to improve (screen) the quality of information
Current issue & insights : “More Online?”

The Research Business in Singapore
Dr Neil Gains
Tapestry Works, Singapore
25 November 2010

History & Development - Singapore
Growth of research business with rise of
Asian Tiger Economies.
Singapore gains status as regional
research hub for Asia.
1990-951996-2000
2001-2005
2006-2010
2011-2015

History & Development - Singapore
Asia Crisis has marginal impact on
research business.
Further growth and consolidation of
„big research houses‟, e.g. Nielsen,
TNS, RI, AMI, etc.
1990-951996-2000
2001-2005
2006-2010
2011-2015
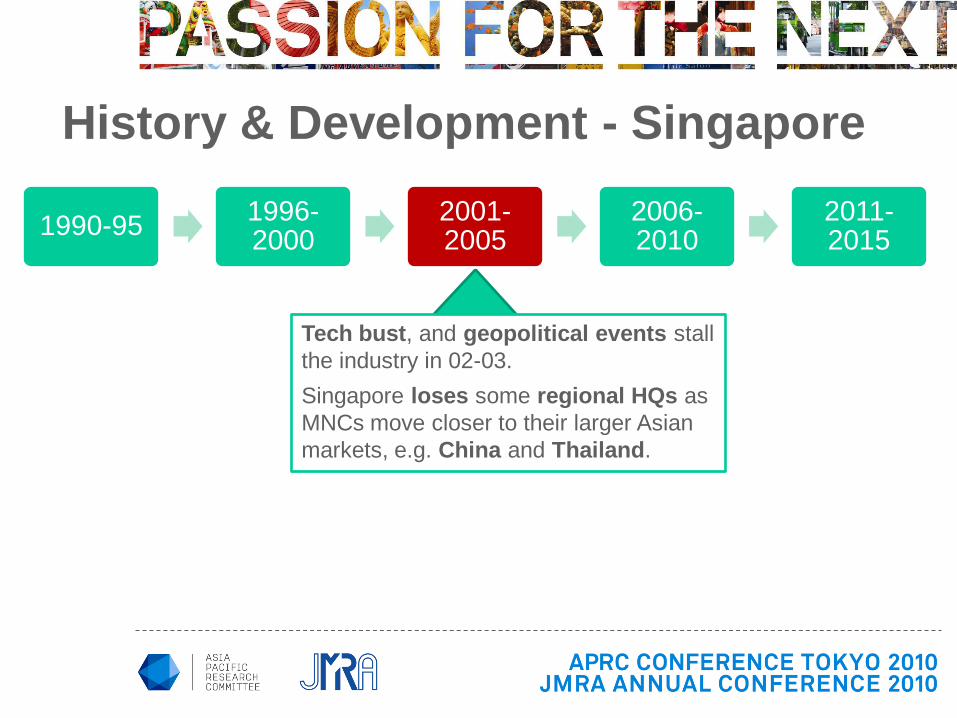
History & Development - Singapore
Tech bust, and geopolitical events stall
the industry in 02-03.
Singapore loses some regional HQs as
MNCs move closer to their larger Asian
markets, e.g. China and Thailand.
1990-951996-2000
2001-2005
2006-2010
2011-2015
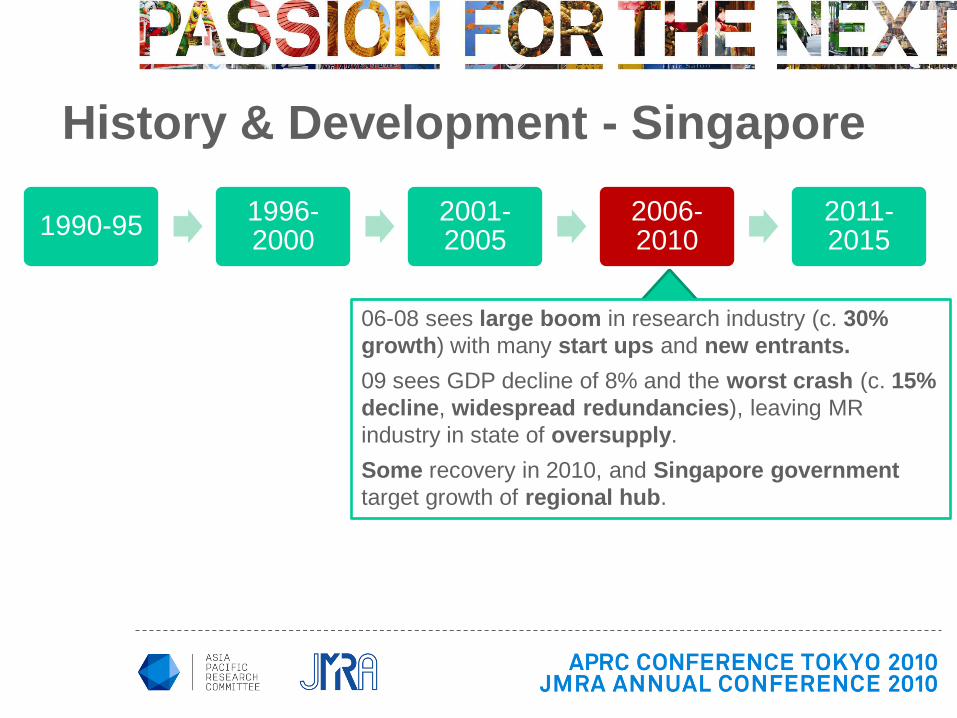
History & Development - Singapore
06-08 sees large boom in research industry (c. 30%
growth) with many start ups and new entrants.
09 sees GDP decline of 8% and the worst crash (c. 15%
decline, widespread redundancies), leaving MR
industry in state of oversupply.
Some recovery in 2010, and Singapore government
target growth of regional hub.
1990-951996-2000
2001-2005
2006-2010
2011-2015
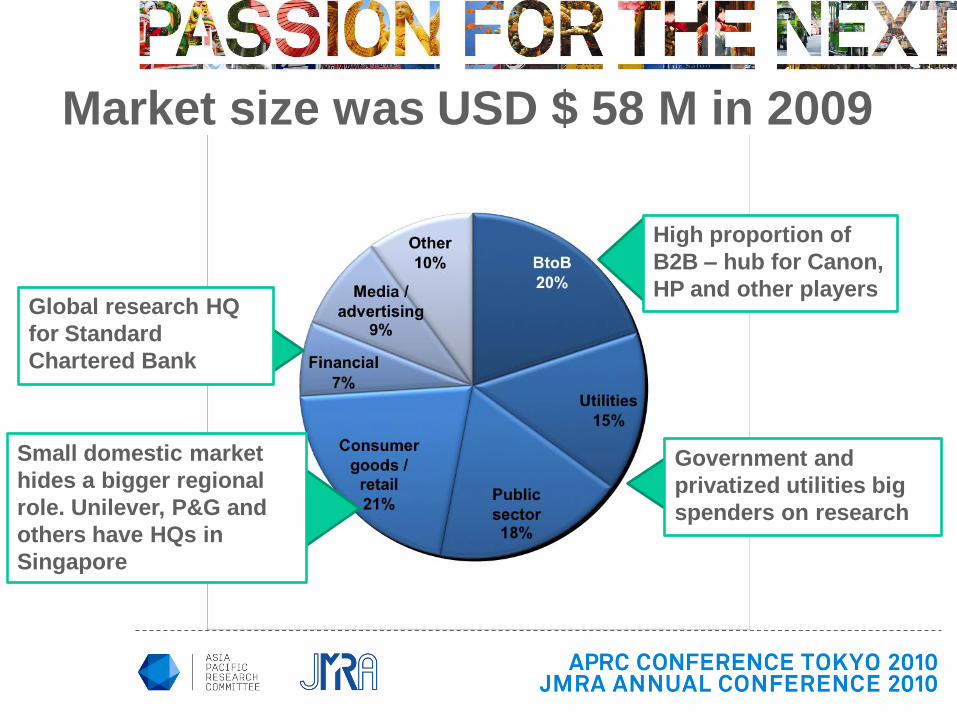
Market size was USD $ 58 M in 2009
High proportion of
B2B – hub for Canon,
HP and other players
Small domestic market
hides a bigger regional
role. Unilever, P&G and
others have HQs in
Singapore
Global research HQ
for Standard
Chartered Bank
Government and
privatized utilities big
spenders on research
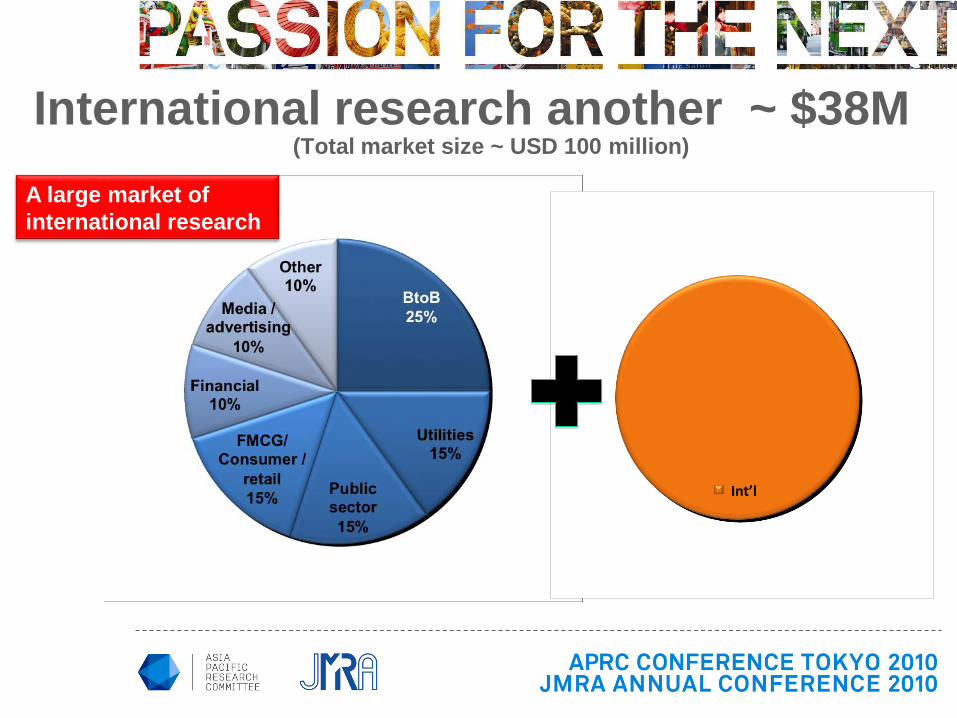
International research another ~ $38M(Total market size ~ USD 100 million)
A large market of
international research
Int’l
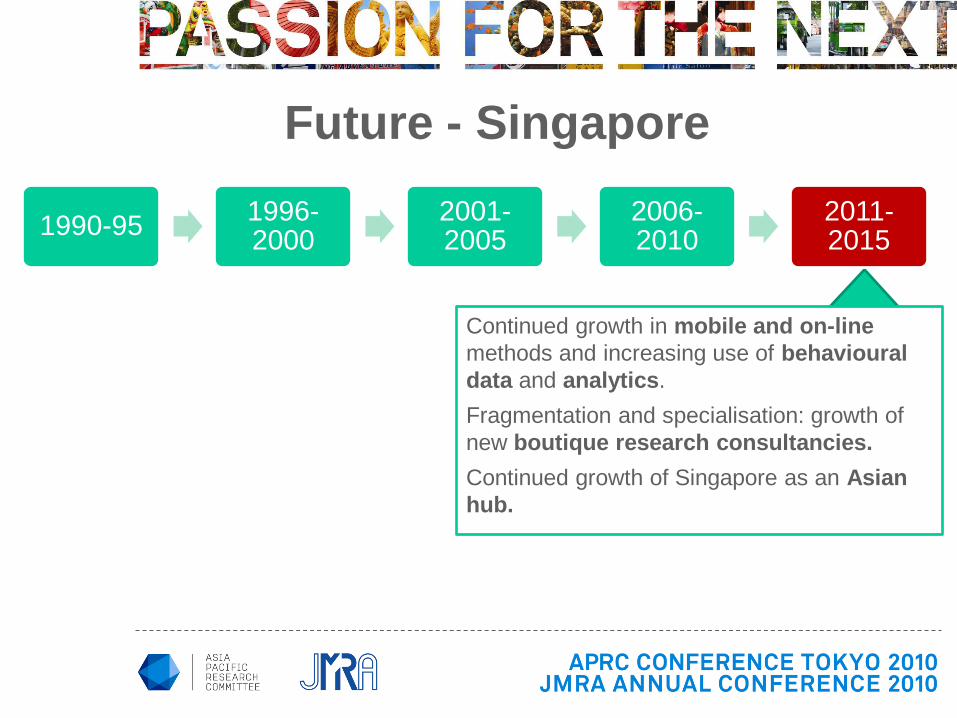
Future - Singapore
Continued growth in mobile and on-line
methods and increasing use of behavioural
data and analytics.
Fragmentation and specialisation: growth of
new boutique research consultancies.
Continued growth of Singapore as an Asian
hub.
1990-951996-2000
2001-2005
2006-2010
2011-2015

Thank you!
Dr Neil Gains
Tapestry Works, Singapore
25 November 2010


THAILAND
67,089,500
Population :
67,089,500 (July 2010 est.)
Gender Census (%)
Male 49.46
Female 50.54
1 of 6
Sources: National Statistics Office Thailand (October,2010)
CIA The World Factbook (November 3,2010)

THAILAND
67,089,500Age:
0-14 years 20.8%
15-64 years 70.5%
65 years and over
8.7%
Population :
67,089,500 (July 2010 est.)
Gender Census (%)
Male 49.46
Female 50.54
1 of 6
Sources: National Statistics Office Thailand (October,2010)
CIA The World Factbook (November 3,2010)

THAILAND
67,089,500
Ethnicity:
Thai 75.00
Chinese 14.00
Other 11.00
Age:
0-14 years 20.8%
15-64 years 70.5%
65 years and over 8.7%
Population :
67,089,500 (July 2010 est.)
Gender Census (%)
Male 49.46
Female 50.54
1 of 6
Sources: National Statistics Office Thailand (October,2010)
CIA The World Factbook (November 3,2010)

THAILAND
67,089,500
Literacy (15 yrs+)
92.6
Ethnicity:
Thai 75.00
Chinese 14.00
Other 11.00
Age:
0-14 years 20.8%
15-64 years 70.5%
65 years and over 8.7%
Population :
67,089,500 (July 2010 est.)
Gender Census (%)
Male 49.46
Female 50.54
1 of 6
Sources: National Statistics Office Thailand (October,2010)
CIA The World Factbook (November 3,2010)

THAILAND
67,089,500
Literacy (15 yrs+) 92.6
Ethnicity:
Thai 75.00
Chinese 14.00
Other 11.00
Age:
0-14 years 20.8%
15-64 years 70.5%
65 years and over 8.7%
Population :
67,089,500 (July 2010 est.)
Gender Census (%)
Male 49.46
Female 50.54
Economic Forecast Year 2010:
(% ) Projection
GDP 7.0-7.5
Export of Goods 25.7
Inflation 3.5
Communications 2010*:
Telephones -main lines in use:
7.024 million
Telephones -mobile cellular:
69 million
Internet hosts: 1.335 million
Internet users: 18 million
High Speed Internet users:
2 million
Social Network Facebookusers:
6 million
Grow up-15% per
month
1 of 6
Sources: National Statistics Office Thailand (October,2010)
CIA The World Factbook (November 3,2010)
*Bangkok Post (November 11, 2010)

THAILAND
67,089,500
Literacy (15 yrs+) 92.6
Ethnicity:
Thai 75.00
Chinese 14.00
Other 11.00
Age:
0-14 years 20.8%
15-64 years 70.5%
65 years and over 8.7%
Population :
67,089,500 (July 2010 est.)
Gender Census (%)
Male 49.46
Female 50.54
Economic Forecast Year 2010:
(% ) Projection
GDP 7.0-7.5
Export of Goods 25.7
Inflation 3.5
Communications 2010*:
Telephones -main lines in use:
7.024 million
Telephones -mobile cellular:
69 million
Internet hosts: 1.335 million
Internet users: 18 million
High Speed Internet users: 2 million
Social Network Facebook users:
6 million
Grow up- 15% per month
1 of 6
Sources: National Statistics Office Thailand (October,2010)
CIA The World Factbook (November 3,2010)

GLOBAL AND REGIONAL GROWTH
RATES
• A decline of 4.6% is the
1st decline in worldwide
research turnover since
ESOMAR began
measuring the industry in
1988
Growth rate adjusted for inflation
Exchange rate fluctuations eliminated. IMF
inflation rates used to determine net growth.
World
Europe
North America
Asia Pacific
Latin America
ME & Africa
• APAC experienced the
softest declines globally
Sources: ESOMAR Global Market Research 2010
2 of 6

BREAKDOWN OF APAC
TURNOVER 2009
• Japan is by far the largest market in the APAC region, however its prominence is
falling as emerging economies grow at a fast rate
Sources: ESOMAR Global Market Research 2010
3 of 6

BREAKDOWN OF APAC
TURNOVER 2009
• With turnover estimated at $114m or 3.9bn Baht Thailand is the 6th largest market
in APAC
Sources: ESOMAR Global Market Research 2010
3 of 6

ASIA PACIFIC 2009 AND GROWTH RATES
ON 2008 Turnover (US$m) Net growth (%)
Asia Pacific 2009 2008/09
Australia 576 -10.6
Bangladesh 8 -4.5
Cambodia 3 3.7
China 918 2.8
Commonwealth of Independent States 36 3.1
Hong Kong 88 -10.4
India 192 -6.0
Indonesia 78 15.5
Japan 1,769 -4.0
Laos 1 -4.8
Malaysia 67 -0.6
Myanmar 2 -7.2
New Zealand 74 -19.9
Pakistan 12 -10.5
Philippines 70 4.3
Singapore 58 -14.2
South Korea 295 16.6
Sri Lanka 5 3.8
Taiwan 86 7.2
Thailand 114 6.9
Vietnam 30 0.1
Total 4,480 -2.2
Growth over 5%
15.5
16.6
7.2
6.9
4 of 6
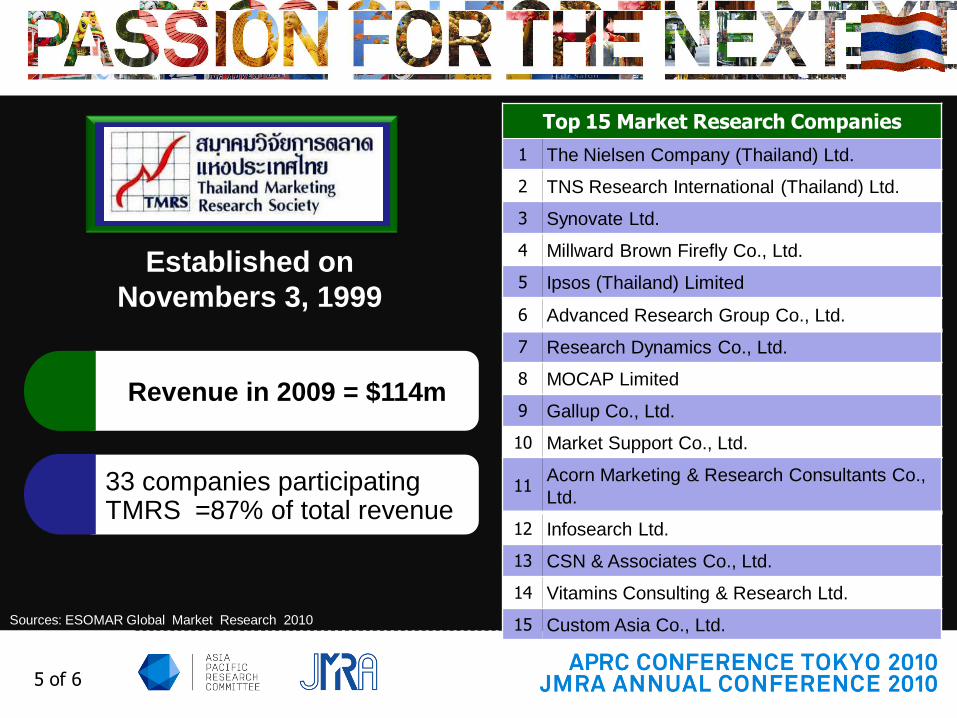
Top 15 Market Research Companies
1 The Nielsen Company (Thailand) Ltd.
2 TNS Research International (Thailand) Ltd.
3 Synovate Ltd.
4 Millward Brown Firefly Co., Ltd.
5 Ipsos (Thailand) Limited
Revenue in 2009 = $114m
33 companies participating TMRS =87% of total revenue
Established on
Novembers 3, 1999
Sources: ESOMAR Global Market Research 2010
5 of 6
6 Advanced Research Group Co., Ltd.
7 Research Dynamics Co., Ltd.
8 MOCAP Limited
9 Gallup Co., Ltd.
10 Market Support Co., Ltd.
11Acorn Marketing & Research Consultants Co.,
Ltd.
12 Infosearch Ltd.
13 CSN & Associates Co., Ltd.
14 Vitamins Consulting & Research Ltd.
15 Custom Asia Co., Ltd.

MARKET RESEARCH
REPORT
Face-to-face and telephone are popular
Online research has just born and ready to grow
up in 2012 when the G3 system is completely
used in nationwide within the year of 2011.
Sources: ESOMAR Global Market Research 2010
6 of 6


![[Research];[Digital market]_3](https://img.pdfslide.tips/doc/110x75/54539d9bb1af9f95228b46bd/researchdigital-market3.jpg)


![[Research];[Digital market]_2_VN](https://img.pdfslide.tips/doc/110x75/546c47bcaf7959ba0e8b4fb1/researchdigital-market2vn.jpg)