Embed Size (px)
Citation preview

1
Mathematics Teachers’ Self Study Guide
on the National Curriculum Statement
Book 1 of 2

2
CONTENTS
Financial Mathematics
Transformation Geometry
Data Handling
Linear Programming

3
FINANCIAL
MATHEMATICS

4
CONTENT LAYOUT Pre-knowledge (Overview of Grade 10 and 11):
• Simple and compound appreciation and depreciation. • Nominal and effective interest rates • Hire purchase
Grade 12 and beyond:
• Time lines • Future and present value annuities • Sinking funds • Outstanding value of a loan • Deferred annuities • Fixed payment annuities
EXERCISE 1: DIAGNOSTIC TEST ON GRADE 10 AND 11 CURRICULUM 1. From Focus on Mathematics Grade 11
In 2003, it was estimated that 4,7 million South Africans were infected with HIV. It was estimated that the number of HIV positive South Africans was increasing at a rate of approximately 6% per year. Assuming this growth rate remains constant, how may South African be infected by: 1.1 2006 1.2 2020?
2. From Shuters Mathematics Grade 11 Calculate the rate of depreciation of a bus purchased for R850 000 if its scrap value, eight years later is R110 000 and depreciation is calculated on the: 2.1 straight-line basis; 2.2 reducing balance method?
3. From Classroom Mathematics Grade 11

5
3.1 Convert 11% p.a. compounded quarterly to the effective annual rate. 3.2 Convert an effective annual interest rate of 14,2% p.a. to a nominal
interest rate compounded monthly.
4. A customer wishing to buy a car with a cash price of R250 000 is offered a hire purchase agreement (simple interest) involving monthly repayments over 5 years at 12% p.a. What will be the amount of the monthly repayments?
5. From Classroom Mathematics Grade 11
R2 300 is deposited into a savings account and, 12 months later, R1 400 is added to the amount. Calculate the total amount saved by the end of two years if the interest rate is 8%p.a. compounded quarterly for the first year and 9,5%p.a. compounded monthly for the second year.
6. Sketched below (from Study and Master Grade 11) is a graph showing the depreciated value of a CD player using the flat-rate and the reducing balance methods of depreciation:
6.1 What is the depreciated value of the CD player when the flat-rate
depreciated value equals the reducing balance depreciated value? 6.2 Use the graph to estimate the annual flat rate depreciation that has been used. Draw up a marking memorandum for the test above. Suggest modifications to make the test a more effective instrument for identifying areas of the Grade 10 and 11 curriculum (LO 1 Assessment Standards 10.5.1 and 11.5.1) that need support.

6
CALCULATING n IN THE FORMULAE A=P(1+i)n AND A=P(1i)
n
xx
+=
12105,012
n
Example How long will it take money invested at 10,5% p.a., compounded monthly, to double in value? Solution: Let the original investment be Rx.
Then where n is the number of months the money must be invested.
n
xx
+=∴
12105,012 Do not use an approximate value for
+
12105,01
562891,7912105,01log
2log12105,01log.2log
12105,01log2log
12105,012
=
+
=∴
+=∴
+=∴
+=∴
n
n
n
n
So it would take 80 months for money invested to double at the given rate. Exercise 2 1. R100 000 invested at 12% p.a., compounded monthly, grows to R181 669,67. For how long was the money invested? 2. From Step Ahead Mathematics Grade 12
A long lost relative paid R120 000 for a house a number of years ago. You inherit the property and sell it for R2 800 000. Inflation is calculated at 17%p.a., calculated annually. How many years ago was the house purchased?

7
3. From Classroom Mathematics Grade 12.
How long would it take an investment to triple if the investment rate is 14%p.a., compounded daily? Give your answer in years and days.
4. How long (correct to the nearest month) will it take a motor car bought for R200 000 to depreciate to R50 000 if depreciation is calculated at 16% p.a. 4.1 on the straight line method; 4.2 on the reducing balance?

8
ANNUITIES Mainly from Classroom Mathematics Grade 12 Time lines It could be argued that question 5 in the diagnostic test is, strictly speaking, beyond the scope of the Grade 11 curriculum. Confident, innovative learners would find a way to solve the problem. They might well do this by breaking the question down into four stages: 1. Calculate the value of the deposit of R2 300 at the end of the first year. 2. Calculate the value of this amount at the end of the second year. 3. Calculate the value of the deposit of R1 400 at the end of the second year. 4. Add the answers obtained in steps 2 and 3 together. Time lines enable us to streamline our calculations so that our working is simpler:
9,5% compounded monthly
8% compounded quarterly
R1 400
R2 300
T
2
T
0
T
1
Amount at
++
+
+=
12124
2 12095,014001
12095,01
408,013002RT
Future value annuities A future value annuity is capital accumulated by regular equal payments into a savings or investment account. Example 1: R200 is paid into a sinking fund every month for five years, starting immediately. Sixty payments are made altogether. Interest is 18% p.a. compounded monthly. Calculate the value of the fund at the end of 5 years. Solution: In the five years, the 60 payments are made from now, 0T up to to 59T

9
Hence the value of the investment is:
6032
1218,01200...
1218,01200
1218,01200
1218,01200
+++
++
++
+
This forms a geometric series, so we can use the formula for the sum of a geometric series to find the sum of the 60 terms:
( )1
1−
−=
rraS
n
n where 1218,01,
1218,01200 +=
+= ra and n = 60.
57,531191
1218,01
11218,01
1218,01200
60
60 RS =−
+
−
+
+
= (correct to the nearest cent)
The formula for the future value of an annuity as listed in the Curriculum Statement is derived as follows: For a series of payments of Rx, the future value of an annuity immediately after the nth regular payment is:
( ) ( )[ ] ( )[ ]iix
iixixixixxF
nnn
v11
11111...)1()1( 12 −+
=−+
−+=++++++++= −
As can be seen, it is not applicable to the above example where the last payment has earned interest for a compounding period and for this reason, many teachers believe it safer to encourage learners to stick to the general formula for a geometric series. Exercise 3 1. From Study and Master Grade 12
Naledi opens a savings account, in which she plans to deposit R500 per month for a year. If interest is paid at 12% per annum, compounded monthly, how much will she have at the end of this time?
2. From Step Ahead Mathematics Grade 12.
Calculate the future value if R800 is invested into an account every six months for 7 years with interest being calculated at 8%p.a. compounded semi-annually.
3. From Classroom Mathematics Grade 12.

10
To replace a truck in eight years time, a business sets up a sinking fund, paying R1 800 into the fund each month. Payments start in one month’s time. How much money will have accumulated in the fund immediately after the last payment has been made at the end of the eight years? Interest of 9,4% p.a. is compounded monthly.
4. A young man decides to invest money each month into a pension fund, starting on his 30th birthday and ending on his 60th birthday. He wants to have R1,5 million on retirement. If the interest rate is 14% p.a., compounded monthly, what will be his monthly payments?
Present value annuities Money is repaid by regular, equal payments in order to pay back a loan, together with the interest accrued. Interest is charged on the reducing balance. Example A house is bought for R260 000. The buyer pays R50 000 cash and secures a loan for the balance to be repaid monthly over a period of 20 years. 1. If interest is calculated at 19,5% p.a., compounded monthly, what will be the
equal monthly payments? 2. What would be the payments if the loan were repaid over 10 years? 3 What would be the balance of the loan after 10 years, immediately after the 120th payment of the monthly amount calculated in (1)? Solution 1.1 A time line is useful:
Let the value, at 0T , of the first repayment of Rx be 1yR .
Then
+=
12195,011yx .

11
So 1
1 12195,01
12195,01
−
+=
+
= xxy
Similarly, the value at 0T , of the repayment of Rx , made at 2T the end of the second month, is
2
2 12195,01
−
+= xy
and the value at 0T of the third payment is 3
3 12195,01
−
+= xy
Now R210 000 = 240321 ... yyyy ++++ And so:
240321
12195,01...
12195,01
12195,01
12195,01000210
−−−−
+++
++
++
+= xxxx
1
2401
12195,011
12195,011
12195,01
000210 −
−−
+−
+−
+
=∴
x
30,4853Rx =∴ (correct to the nearest cent)
A different method: If we equate the values of the amount owed and the sum of the Rx monthly payments at 240T instead of at
0T , then we would proceed like this:
xxxx ++
++
++
+=
+ ...
12195,01
12195,01
12195,01
12195,01000210
237238239240
1
12195,01
112195,01
240
−
+
−
+
=
x
Again x = R3 485 30 (correct to the nearest cent).
Why does the formula ( )[ ]i
ixPn
v
−+−=
11 also work?

12
Because using the geometric series formula ( )rraS
n
n −−
=11 for the series:
( ) ( ) ( ) ( ) nixixixix −−−− ++++++++ 1...111 321 , where ( ) 11 −+= ixa and ( ) 11 −+= ir , we get:
( ) ( ) ( ) ( ) ( ) ( )[ ]( )[ ]1
1321
111111...111 −
−−−−−−
+−+−+
=++++++++i
iixixixixixn
n
( ) ( )[ ]
i
ii
x n
+−
+−+
=
−
111
111
( ) ( )[ ]
ii
ii
x n
+−+
+−+
=
−
111
111
= ( ) ( )[ ]i
iii
x n +×+−
+− 111
1
= ( )[ ]i
ix n−+− 11
In this question, the formula works because repayments commence one period
(usually a month) after the granting of the loan. Whilst this is likely to be the type of question asked at this stage, other options might be applicable in real life and perhaps such questions will be asked in a few years’ time?
2 The answer to this question is just under R500 per month more (monthly
payments ofR3 989,00 to the nearest cent). This is perhaps surprising to most learners and serves to show how good it is to pay off loans by the largest regular payments one can afford.
3. Method 1 After 10 years, the amount owed, if no payments had been made is
120
12195,01000210
+

13
The value of the money paid at 120T is
12195,0
112195,0130,3485
120
−
+
So the balance is the difference between these two amounts. Balance owing = R183 481,19 (correct to the nearest cent)
Method 2. We could also calculate the value at 120T of the 120 outstanding payments:
120321
12195,0130,3485...
12195,0130,3485
12195,0130,3485
12195,0130,3485
−−−−
+++
++
++
+
Using the present value formula for this, we get R183 482,99 (correct to the nearest cent) . The slight difference in the answers is because R3 485,30 is a rounded (and not an exact) amount.
Exercise 4 1. Peter takes out a loan of R510 000 to be able to buy a house. He pays
back the loan over a period of 20 years, starting one month after he bought the house. Interest is charged at 14%p.a., compounded monthly.
1.1 Determine his monthly payments (correct to the nearest cent).
1.2 How long would it take to repay the loan if he were to pay R10 000 each
month? (This is not actually prescribed in the NCS)
2. I need R200 000 to buy the car of my dreams. I have been offered a hire purchase agreement at 12,5% p.a. to be repaid in 48 equal monthly instalments. 2.1 What will be the amount of the monthly repayments?
2.2 Show that a bank loan at 21% p.a. compounded monthly on the reducing balance is a better option.
2.3 What hire purchase rate would be better than the 21% bank
loan?

14
3. A loan of R180 000 is to be repaid over 20 years by means of equal monthly
payments, starting one month after the loan is granted. The interest rate is 16% p.a. compounded monthly. 3.1 Calculate the monthly repayments. 3.2 Calculate the outstanding balance after 10 years.
Deferred annuities In many situations, the repayment of a loan begins one month or one period after the granting of the loan. However, circumstances arise where the repayment of the loan is deferred or delayed for an agreed period of time. Example Nthabi borrows R420 000 to start a small business. She agrees to repay the loan over a period of five years, from the time the loan is granted. The first payment, however, will be nine months after the granting of the loan. The interest rate is 18% p.a. compounded quarterly. Calculate the quarterly instalments. Solution:
At :0T
20543
418,01...
418,01
418,01
418,01000420
−−−−
+++
++
++
+= xxxx
Hence 99,71737Rx =

15
Solution: Method 2 At 20T :
17220
418,01...
418,01
418,01
418,01000420
+++
++
++=
+ xxxx
99,71737
1418,01
418,0
418,01000420
18
20
Rx =
−
+
×
+
=∴ (to the nearest cent)
Solution: Method 3: At 2T :
420 000
418,0
418,011
418,01
18
2
+−
=
+
−
x
(Using the present value formula)
Again 99,37717Rx = Fixed payment annuities A loan is sometimes repaid by deciding on what the borrower can afford, which is often a percentage of his/her income. In such circumstances, the number of payments as well as the amount of the final payment need to be calculated. Example A teacher borrows R12 800 to buy furniture. He can afford to repay R700 a month. The interest rate is 18% p.a. compounded monthly. 1. Calculate the number of months that he will be required to pay R700. 2. Determine the amount of the final payment (less than R700) which is made one month after the last payment of R700.

16
Solution: 1.
n−−−−
+++
++
++
+=
1218,01700...
1218,01700
1218,01700
1218,0170080012
321
1
1
1218,011
1218,011
1218,01700
80012 −
−−
+−
+−
+
=∴
n
...7257,01218,01 =
+∴
−n
...533,21
...7257,0log1218,01log
=∴
=
+−∴
n
n
There will be 21 payments of R700 and a 22nd
22
1
211
1218,01
1218,011
1218,011
1218,01700
80012−
−
−−
++
+−
+−
+
= y
payment of less than R700 2. The final payment:
51,374
10,53012800121218,01
22
Ry
y
=∴
−=
+∴
−

17
Exercise 5 1. After moving to a new house, you buy a number of household items for a total of
R34 300. You are able to finance the purchase of these goods under the following conditions:
• the money is repaid in 24 equal monthly payments; • the first payment is made after 6 months; • the interest rate is 12%p.a. compounded monthly.
1.1 Calculate the amount of the monthly repayments. 1.2 How much money will you owe after 8 payments have been made?
2. From IEB Additional Mathematics November 2006
Ashika takes out a loan of R450 000 at an effective interest rate of 14% p.a. in order to purchase a town house. She repays the loan with equal monthly instalments of R7 500, starting one month from the granting of the loan. The interest is compounded monthly. 2.1 Show that the nominal interest rate is approximately 13,17% p.a. 2.2 Calculate
2.2.1 the time span of the loan in months. 2.2.2 the value of the last payment (less than R7 500).
2.3 Calculate how much interest is paid:
2.3.1 in the first month 2.3.2 in the first year of repayment.
3. A retirement policy pays out R250 000 when a worker retires. The worker invests
this amount at an effective 14,5% p.a. If the worker wishes to draw R7 500 a month, how long will the money last?
18
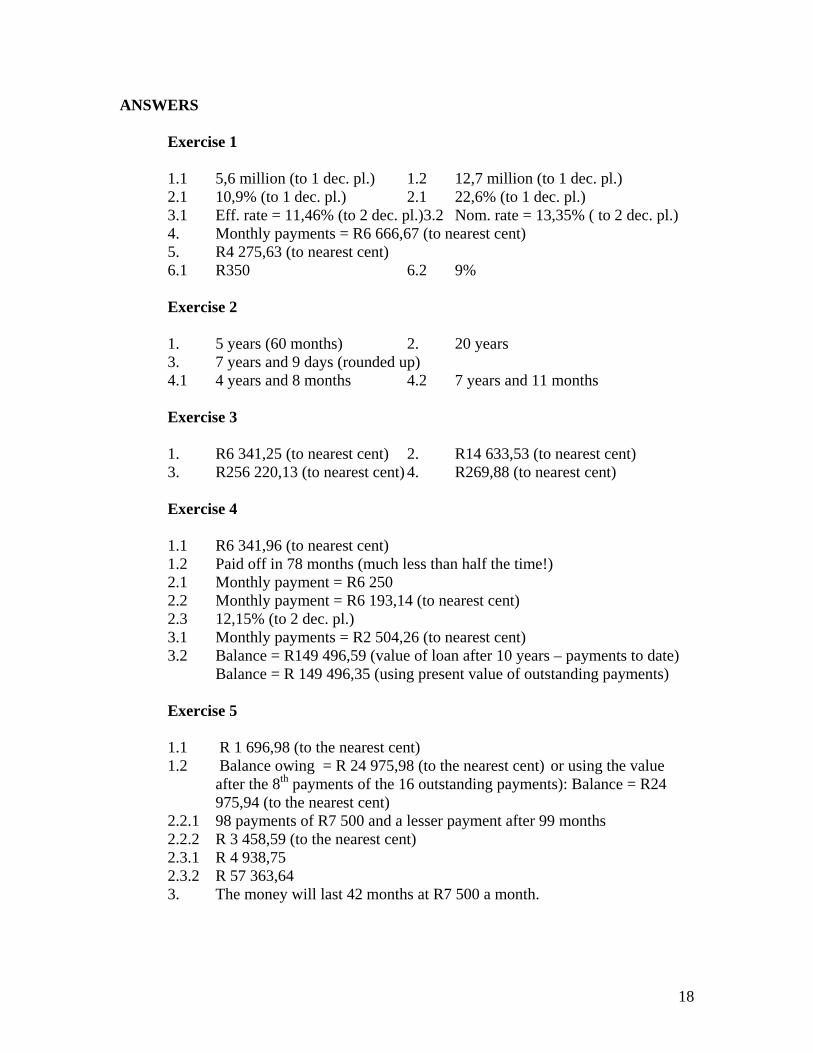
ANSWERS Exercise 1 1.1 5,6 million (to 1 dec. pl.) 1.2 12,7 million (to 1 dec. pl.) 2.1 10,9% (to 1 dec. pl.) 2.1 22,6% (to 1 dec. pl.) 3.1 Eff. rate = 11,46% (to 2 dec. pl.)3.2 Nom. rate = 13,35% ( to 2 dec. pl.) 4. Monthly payments = R6 666,67 (to nearest cent) 5. R4 275,63 (to nearest cent) 6.1 R350 6.2 9% Exercise 2 1. 5 years (60 months) 2. 20 years 3. 7 years and 9 days (rounded up) 4.1 4 years and 8 months 4.2 7 years and 11 months Exercise 3 1. R6 341,25 (to nearest cent) 2. R14 633,53 (to nearest cent) 3. R256 220,13 (to nearest cent) 4. R269,88 (to nearest cent) Exercise 4 1.1 R6 341,96 (to nearest cent) 1.2 Paid off in 78 months (much less than half the time!) 2.1 Monthly payment = R6 250 2.2 Monthly payment = R6 193,14 (to nearest cent) 2.3 12,15% (to 2 dec. pl.) 3.1 Monthly payments = R2 504,26 (to nearest cent) 3.2 Balance = R149 496,59 (value of loan after 10 years – payments to date) Balance = R 149 496,35 (using present value of outstanding payments) Exercise 5
1.1 R 1 696,98 (to the nearest cent) 1.2 Balance owing = R 24 975,98 (to the nearest cent) or using the value
after the 8th payments of the 16 outstanding payments): Balance = R24 975,94 (to the nearest cent)
2.2.1 98 payments of R7 500 and a lesser payment after 99 months 2.2.2 R 3 458,59 (to the nearest cent) 2.3.1 R 4 938,75 2.3.2 R 57 363,64 3. The money will last 42 months at R7 500 a month.

19
TRANSFORMATION
GEOMETRY

20
THE BASICS Experimental work is done in the GET phase and learners should come to Grade 10 knowing about the rigid transformations: translation, reflection, rotation and glide reflection. The formulae for the effect on a general point (x;y) of translation, reflection about the axes or the lines y = x and y = x and glide reflection are taught in Grade 10. In Grade 11, rotation around the origin, through angles of 900, 900 and 1800 are taught. As in trigonometry, where the angle of rotation is positive, the rotation is anti-clockwise and where the angle is negative, the rotation is clockwise. This work links with the reduction formulae for the sin and cos of ( + 900), ( + 1800) and ( 900) or (900
ABC∆
). Also in Grade 11, the enlargement of polygons, through the origin, by a factor of k is taught where k can be any number, positive or negative. The formula for the effect of such enlargements on the vertices of the polygon are then derived and the effect on the area of the polygon is investigated. Unlike the transformations studied in earlier grades, this is not a rigid transformation, but it does preserve the shape of polygons. Transformations which preserve neither size nor shape include vertical and horizontal stretches, but these transformations are beyond the scope of the NCS. In Grade 12, rotation, about the origin through any angle is taught once the work on compound angles in trigonometry has been completed. Task 1 Draw in which A is the point (2;4), B is (6;8) and C is (4;10). Then complete the table. Transformation A B C Random
point Rule
Original triangle
)4;2( (6;8) (4;10) (a;b) ( ) →yx;
Reflection in the x-axis
Reflection in the y-axis
Reflection in the line y = x
Reflection in the line y = x
Rotation about the origin through 90
0

21
Rotation about the origin through 180
0
Rotation about the origin through 90
0
Translation 2 units to the right and I unit down
Translation 3 units to the left and 2 units down
Translation a units horizontally and b units vertically
Glide reflection of 2 units to the right about the x-axis
Glide reflection of 1 unit down about the y-axis
Enlargement through the origin by a factor of 1/2
Enlargement through the origin by a
factor of 23
Enlargement through the origin by a factor of k

22
Grade 12 Exercise 1. From Step Ahead Mathematics Grade 12
The point P(2;5) is given.
θ
O
P(2;5)
Write down the new co-ordinates of the point P if the line OP is rotated anti-clockwise about the origin through 1.1 1800 1.2 900 1.3 2700
θ2180 −
1.4 1.5 θ2−
2. From Classroom Mathematics Grade 12
Describe in words, each of the given transformations: 2.1 ( ) ( )xyyx ;; → 2.2 ( ) ( )yxyx −−→ ;; 2.3 ( ) ( )1;; +−→ yxyx 2.4 ( ) ( )xyyx ;; −→ 2.5 ( ) ( )xyyx −→ ;; 2.6 ( ) ( )xyyx −−→ ;;
3. Consider the effect of each of the given transformations on:
(a) the length of sides (b) the shape (c) the area of the trapezium OABC below.
O
C(5;0)
Β (3; 2)
Α(1; 2)

23
3.1 ( ) );(; xyyx −→ 3.2 ( ) ( )xyyx ;; → 3.3 ( ) ( )1;3; +−→ yxyx 3.4 ( ) ( )yxyx −+→ ;2; 3.5 ( ) ( )yxyx 2;2; → 3.6 ( ) ( )yxyx ;2; →
4. Determine, in terms of a, b and trigonometric ratios of θ the
coordinates of the image of the point P ( )ba; after the rotation of P, about the origin, through an angle of θ where θ can be any angle.
θ
O
5. Use the formula derived in question 4 to check that your coordinates are correct when θ is 900, 1800 and - 900
( ) ( ) ( )2;5,0;4,0;1 −−−− CBA
.
6. According to the NCS, would you consider the following questions to be definitely included, definitely excluded, included for extension purposes for the most able learners only or perhaps suitable in a few years time when teachers have mastered the new topics more comprehensively: 6.1 Maths for all Grade 12 Show that parallelogram ABCD is similar to parallelogram
WXYZ by finding a sequence of translations, reflections, rotations and an enlargement through the origin that will move ABCD on top of WXYZ.
and ( )2;2 −−D ; ( ) ( ) ( )10;4;8;0,2;0 −−− YXW and ( )4;4 −Z
6.2 Classroom Mathematics Grade 12
The given regular pentagon has been placed on a set of axes with its central point on the origin. If the vertex on the x axis is the point (4;0): 6.2.1 Determine the coordinates of the other vertices,
correct to 1 decimal place. 6.2.2 Write down the equations of the five axes of symmetry of
the figure as illustrated below.

24
6.3 Study and Master Mathematics Grade 12 If the curve ( )xfy = is rotated 1800
xyx
yxy 2,2,2 ===
about the origin, find the rule for its image in terms of f.
Transformations and Functions Task
Consider the functions and 2xy = .
1 Identify three points A, B and C on each graph and calculate the
image of each point after the following transformations: a) ( ) ( )2;1; −+→ yxyx and b) ( ) ( )xyyx ;; −→
2 Sketch each curve as well as the curve through the image points in each case (8 sketches). 3 Determine the equation of each of the 8 graphs through the
image points. Extension Task (from Classroom Mathematics Grade 12) 1. There are exactly seven types of frieze patterns consisting of a motif
repeated indefinitely. Every frieze pattern has translation symmetry. Six of the 7 types also have at least one other form of symmetry. The examples below are the San Ildefonso patterns in New Mexico. (http://members.tripod.com/vismath6/crowe1/) Type 1: no symmetry.
Type 2: glide reflection symmetry.

25
Type 3: glide reflection and vertical symmetry.
Type 4: half turn symmetry or rotational symmetry of order 2.
Type 5: vertical symmetry
Type 6: horizontal symmetry
Type 7: vertical and horizontal symmetry
Find and make copies of actual friezes from at least 2 different counties, including South Africa, illustrating each of the seven frieze types and classify them according to the types illustrated above.

26
Escher became fascinated by the regular Division of the Plane in 1922. This is where an entire space is taken up with recurring images that tessellate with each other.
Grade 12 Project: Escher and Transformation Geometry (From Western Cape Assessment Booklet 2008) Maurits Cornelis Escher, who was born in Leeuwarden, Holland in 1898, created unique and fascinating works of art that explore and exhibit a wide range of mathematical ideas.
(All M.C. Escher works (c) 2007 The M.C. Escher Company - the Netherlands. All rights reserved. Used by permission.
During his lifetime, he made 448 lithographs, woodcuts and wood engravings and over 2000 drawings and sketches.
www.mcescher.com ) Task 1 Using the outline of the fish shown below you need to attempt to ‘divide the plane’ with this shape.
Start with a blank sheet of A4 paper and choose a starting position to trace your fish and mark it clearly as the start.
Using this shape alone, you must develop a
pattern using the rules of transformation geometry. Each time you trace the fish in a new position, you need to describe the transformation you have carried out.
You may use translation, reflection and
rotation. In your description, remember to specify the degrees and direction that you have rotated the shape, or the manner in which you have reflected or translated it.
The use of different colours often helps to
keep track of where you are.
Once you have finished your design with accompanying directions, a second person should be able to follow your instructions and come up with the same design.

27
Task 2 In the sketch below, Escher has used several different shapes to divide the plane. Identify how many shapes are used and what they are. Describe how they are combined and transformed to create the design shown.
Make mention of any symmetry that exists, any reflection, rotation or translation
that has taken place. Task 3 The above sketch shows a frieze where 2 shapes are tessellating to create a recurring pattern that can be used as a page border.

28
Escher was mesmerized by geckos and did several sketches using this creature. Below is one of his more famous ones. This sketch uses a complex combination of transformations including enlargement, rotation and translation.
Describe the transformation used in detail. Task 4 .
Identify your own starting point and discuss as many different transformations as
you can see. Be specific about ratios of enlargement and degrees and direction of rotation.

29
DATA
HANDLING

30
EXERCISES 1. A group of people were surveyed with respect to how long it took them to travel
to work each day. The results of the survey is summarized in the chart below. a) What is the range? b) What is the modal class? c) Which class contains the median?
d) Calculate the estimated mean. Show your calculations and work correct to the nearest minute.
2. Geoff, a driver of a courier motorcycle, recorded the distances he travelled (in
kilometres) on 15 trips. The data is given below: 24 19 21 27 20 17 32 22 26 18 13 23 30 10 13 a) i) What is the median for the above-mentioned data? ii) Write down the upper and lower quartiles iii) Draw a box and whisker diagram for the data of Geoff's travels
b) Another driver, Thabo, in the same company had also travelled and recorded (in kilometres) the distance he travelled on 15 trips. The five number summary of his data is (12 ; 21 ; 25 ; 32 ; 34). The box and whisker diagram is shown below.
10 12 14 16 18 20 22 24 26 28 30 32 34
Time taken to travel to work
0
50
100
150
200
250
300
350
400
450
0 - 1
4 m
inut
es
15 -
29 m
inut
es
30 -
44 m
inut
es
45 -
59 m
inut
es
60 -
74 m
inut
es
75 -
89 m
inut
es
90 -
104m
inut
es
105
- 119
min
utes
120
- 134
min
utes
Time (minutes)
Num
ber o
f peo
ple

31
Carefully analyse the box and whisker diagrams, on the diagram sheet, of Geoff and Thabo's travels and comment on the differences or similarities, if any, between the distances covered by each on the 15 trips.
3. Below are box and whisker plots that depict the results of a pollution survey in a
Western Cape River conducted from 2005 to 2007. The survey measured the pollution (total dissolved solids) in milligrams per litre of water.
a) Determine the five number summary for 2006. b) Which year had the greatest range of results? Explain your answer. c) Using the data, comment on the pollution levels in the river over the three
years of monitoring. 4. The housing department recently conducted a survey on the number of bedrooms
in 200 houses in Saldanha. The following data was obtained:
No. of bedrooms 1 2 3 4 5 6 7 8 9 10 No. of houses 25 40 42 28 22 18 12 7 4 2
a) Set up a cumulative frequency table for the given data. b) Hence draw an ogive (cumulative frequency graph) for this data. c) Use the ogive to determine the median, lower quartile (Q1) and upper quartile (Q3
e) What is the value of the interquartile and semi-interquartile range?
). d) Draw a box and whisker diagram for this data.
2007
2006
2005
500 1000 1500 2000 2500 0 TOTAL DISSOLVED SOLIDS (mg/l)
5 On the Game of SURVIVAL, a piece of music was played to a group of 80 contestants and afterwards they were asked to estimate how long the piece of music had lasted. The estimates in seconds are given in the cumulative frequency graph below.
Using the graph, determine: a) the median b) the interquartile range
c) the number of contestants that overestimated the playing time

32
6 The table below gives the values of the height, h cm, of a plant w weeks after germinating.
w 1 2 3 4 5 6 7 h 0,41 0,57 0,78 1,07 1,46 2,01 2,76
a) Suggest intuitively whether a linear, quadratic or exponential function
would best fit the data. Motivate your response.
b) Draw a scatter plot to represent the data in the table above.
c) Estimate the height of the plant after 10 weeks. (Explain whether your answer is acceptable)
7 A company that rents out cars calculated the average cost per kilometre of
maintaining a new car for different distances covered during the first year. The data gathered is given in the table below.
Annual mileage (in km) 5 10 15 20 25 30 Cost per km (in rand) 2,50 2,46 2,42 2,37 2,31 2,25
a) Draw a scatter diagram to represent the above data.
b) Decide which of the following graphs fit the above-mentioned data best: straight line, parabola or exponential.
c) Estimate, by using a suitable graph, the average cost per kilometre of
operating a new car if it is driven 8 000 kilometres during the first year.
8 The manager of a women's clothing store was curious about the amount of money
women of various ages spent monthly on clothing items. He obtained the following information from a representative sample of women who regularly buy from his store:
Women's ages (in years) 18 21 23 25 30 32 36 38 39 45
Amount spent (in rand) 330 300 300 240 250 190 180 310 150 120
a) Identify and estimate any outliers in this data. b) Draw a scatter-plot to represent the above data on the diagram sheet.

33
c) Draw the line of best fit for the given data on your graph. d) Describe the general trend between the age of the women and the amount of
money spent. e) Use the scatter plot to predict the amount that a 40-year-old woman will spend.
9 The traffic department investigated where it would be most appropriate to in
install speed cameras. As part of their investigation a survey was done of the different speeds of vehicles on a stretch of a national road. The following table shows the results of the survey:
SPEED (in km/h)
FREQUENCY (Of vehicles)
CUMULATIVE FREQUENCY
40 < d ≤ 60 49
60 < d ≤ 80 92 80 < d ≤ 100 134 100 < d ≤ 120 158
120 < d ≤ 140 49 140 < d ≤ 160 17 160 < d ≤ 180 1
a) How many vehicles were observed in the survey?
b) Complete the cumulative frequency column using the table on the diagram sheet.
c) Represent the information in the table by drawing an ogive (cumulative frequency
curve) on the grid provided on the diagram sheet.
d) Use your graph to determine the median speed. Indicate on your graph using the letter T where you would read off your answer.
10 The marks of 15 learners in a test for which the maximum mark is 100, were:
70 ; 43 ; 92 ; 47 ; 98 ; 56 ; 45 ; 61 ; 34 ; 51 ; 39 ; 92 ; 43 ; 72 ; 80

34
Calculate the following for this data: a) the mean b) the standard deviation.

35
LINEAR
PROGRAMMING

36
EXERCISES Question 1 Use the variables x and y and write down the equation or inequality that represents each of the following situations. State clearly, in each case, what x and y represent. 1.1 When mixing green paint, the amount of yellow pigment must be at least double the amount of blue pigment. 1.2 The number of hours spent on Maths and English homework each day should not exceed two. 1.3 The sum of two numbers must be greater than 12. 1.4 The profit made on selling an ice cream must be one-and-a-half times the profit made on selling a chocolate. 1.5 In a hotel, the rooms can accommodate either two people or three people. The total number of guests in the hotel must be less than 250. 1.6 M is the sum of two numbers. 1.7 M is the sum of one number and double another number. Question 2 Represent each of the following systems of inequalities graphically:
201215 1.2
≤+≤≤
yxyx
425122 2.2
≤+≤≤−≤≤−
yx yx
500020101300060503000060150 3.2
≤+≤+≤+
yxyxyx
234800 25
016223 200 4.2
≥
≤+≤+≥
xyyxyxx

37
Question 3 Represent each of the following systems of graphs symbolically in terms of x and y: 3.1 3.2 Question 4 On the grid provided, draw the graph of 122 =+ xy , where 00 ≥≥ yandx 4.1 Give three ordered pairs that are a solution to the equation 122 =+ xy . 4.2 What is the gradient of the graph? 4.3 State the x and y intercepts of the graph. 4.4 Using a blue pen, shade the region which represents
122 <+ xy 4.5 Give three ordered pairs that are a solution to the equation 122 <+ xy
50 100 150 200 250 300
50
100
150
200
250
300y
50 100 150 200 250 300
50
100
150
200
250
y
x x

38
Question 5 In a certain week a radio manufacturer makes two types of portable radios, M(mains) and B(battery). Let x be the number of type M and y be the number of type B. In the sketch the shaded area represents the feasible region.
5.2 If the profit on a type M is R40 and on type B is R80, write down the equation in terms of x and y which will represent the profit (P).
5.3 Draw the search line that represents the profit function on the diagram sheet provided.
5.4 Use the graph to determine the pair );( yx in the feasible region where the profit is maximum.
5.5 What is the maximum weekly profit?
5.6 The manager is informed that the workers' union plans a strike for the following week, which will result in only 50 hours being worked. How many radios of each type
should now be manufactured for maximum profit, and what will the maximum profit now be for the week?
1
40
1
0 4
8
1
1
- -
-
| | | | x
8
y 5.1 Write down the constraints to the linear programming problem, given: 5.1.1 At most 60 of type M and 100 of type B can be manufactured in a week. 5.1.2 At least 80 radios in total must be produced in a week to cover costs. 5.1.3 It takes 3
2 hour to assemble a type M and
21 hour

39
Question 6 A toy factory makes two different types of wooden toys –coloured blocks (x) and mobiles (y). According to its worker contracts, the factory guarantees each department a minimum amount of work per day. The cutting department must have at least 480 minutes of work per day. A set of coloured blocks takes 20 minutes to cut and a mobile takes 10 minutes to cut. The decorating department must have at least 600 minutes of work per day. A mobile takes 20 minutes to decorate and a set of wooden blocks take 10 minutes to decorate. The assembly department must have at least 1080 minutes of work per day. A set of coloured blocks takes 10 minutes to assembly and a mobile takes 60 minutes to assemple. 6.1 If x represents the number of set of blocks and y represents the number of mobiles, present the information given above as a set of inequalities. 6.2 On graph paper, graph the set of inequalities and indicate the feasible region. 6.3 If materials for a set of blocks cost R15 and the materials for a mobile cost R45,
set up an equation which represents the cost (C) of producing paint. 6.4 Plot the cost equation on your graph and use it to determine which vertex will result in the most effective production schedule that minimises costs. 6.5 Find the co-ordinates of this vertex by solving the appropriate two boundary lines. Question 7 An organic farmer grows lavender and vegetables. He has a plot of land with an area of 9 hectares. In order to fulfil his market contracts the farmer has to plant at least 2 hectares of lavender and 1 hectare of vegetables. In order to minimise the damage done by insects, the area under lavender should be at least equal to the area under vegetables. In order to maintain the nitrogen balance of the soil, the area under lavender should not be more than double the area under vegetables. 7.1 Below is a system of equations that models the scenario described. If x is the
hectares under lavender and y is the hectares under vegetables, extract from the text the words that have resulted in the constraint being modelled (i.e. write down the words from the text that belong to each constraint).
7.1.1 yx ≥ 7.1.2 2≥x 7.1.3 yx 2≤ 7.1.4 9≤+ yx 7.1.5 1≥y 7.2 Using graph paper, draw the system of equations and shade the feasible region.

40
7.3 Set up a Profit equation if the profit on a hectare of lavender is R10 000 and the profit on a hectare of vegetables is R8 000. 7.4 Graph the profit equation and use it to assist you in determining accurately the planting schedule that will result in the farmer maximizing profit. 7.5 If the profit margins changed so that the profit on vegetables and lavender were equal, would it be necessary for the farmer to change his planting schedule? Explain your answer. Question 8 A certain motorcycle manufacturer produces two basic models, the ‘Super X’ and the ‘Super Y’. These motorcycles are sold to dealers at a profit of R20 000 per ‘Super X’ and R10 000 per ‘Super Y’. A ‘Super X’ requires 150 hours for assembly, 50 hours for painting and finishing and 10 hours for checking and testing. The ‘Super Y’ requires 60 hours for assembly, 40 hours for painting and finishing and 20 hours for checking and testing. The total number of hours available per month is: 30 000 in the assembly department, 13 000 in the painting and finishing department and 5 000 in the checking and testing department. The above information can be summarised by the following table: Let x be the number of ‘Super X’ and y be the number of ‘Super Y’ models manufactured per month. 8.1 Write down the set of constraint inequalities.
8.2 Use the graph paper provided to represent the constraint inequalities.
8.3 Shade the feasible region on the graph paper.
8.4 Write down the profit generated in terms of x and y.
8.5 How many motorcycles of each model must be produced in order to maximize the monthly profit?
8.6 What is the maximum monthly profit?
Department Hours for ‘Super X’ Hours for ‘Super Y’
Maximum hours available per month
Assembly 150 60 30 000 Painting and finishing 50 40 13 000 Checking and testing 10 20 5 000

41
Question 9 A group of students plan to sell x hamburgers and y chicken burgers at a rugby match. They have meat for at most 300 hamburgers and at most 400 chicken burgers. Each burger of both types is sold in a packet. There are 500 packets available. The demand is likely to be such that the number of chicken burgers sold is at least half the number of hamburgers sold. 9.1 Write the constraint inequalities. 9.2 Represent the inequalities graphically, on the axes below, and indicate the feasible region. 9.3 A profit of R3 is made on each hamburger sold and R2 on each chicken burger sold. Write the equation which represents the total profit, P, in terms of x and y. 9.4 The objective is to maximise profit. Draw a search line on the graph paper by indicating it as a dotted line in its optimum position. 9.5 How many, of each type of burger, should be sold to maximise profit? Question 10 A BizBus motor assembly factory employs you as a production planner at the factory. Your job will be to advise the management on how many of each model should be produced per week in order to maximise the profit on the local production. The factory is producing two types of minibuses: Quadrant and Shosholoza Two of the production processes that the minibuses must go through are: bodywork and engine work. * The factory cannot operate for less than 360 hours on engine work for the minibuses. * The factory has a maximum capacity of 480 hours for bodywork for the minibuses.
* 21 hour of engine work and
21 hour of bodywork is required to produce one
Quadrant.

42
* 31 hour of engine work and
51 hour of bodywork is required to produce one
Shosholoza.
* The ratio of Shosholoza minibuses to Quadrant minibuses produced per week must be at least 3:2.
* A minimum of 200 Quadrant minibuses must be produced per week.
Let the number of Quadrant mini buses manufactured in a week be x. Let the number of Shosholoza minibuses manufactured in a week be y. 10.1 Write down the constraints in terms of x and y to represent the above-mentioned
information. 10.2 Use graph paper to represent the constraints graphically.
10.3 Clearly indicate the feasible region by shading it.
10.4 If the profit on one Quadrant minibus is R12 000 and the profit on one Shosholoza minibus i R4 000, write down an equation that will represent the profit on the minibuses.