Embed Size (px)
Citation preview
ANALYTICAL CHEMISTRY & TESTING SERVICES
Right solutions….
….Right partner
Environmental Division
Measurement of Hydrocarbons following Spill Events. Gathering Information Required for Human Health and Environmental Risk Assessments
D.A. Birkholz, Research & Development
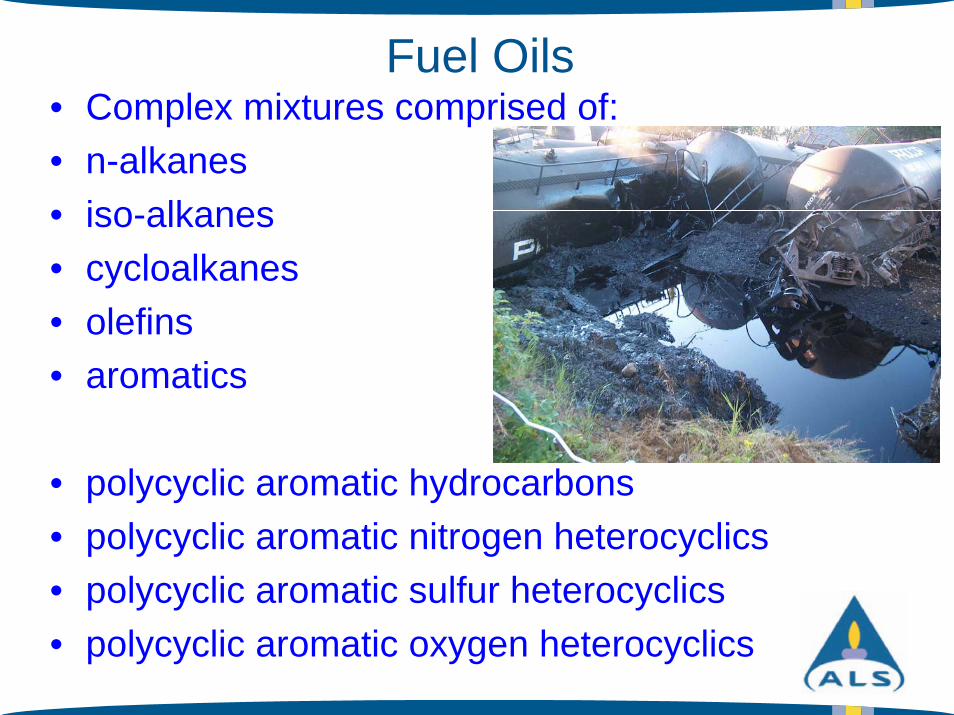
Fuel Oils• Complex mixtures comprised of:• n-alkanes• iso-alkanes• cycloalkanes• olefins• aromatics
• polycyclic aromatic hydrocarbons• polycyclic aromatic nitrogen heterocyclics• polycyclic aromatic sulfur heterocyclics• polycyclic aromatic oxygen heterocyclics
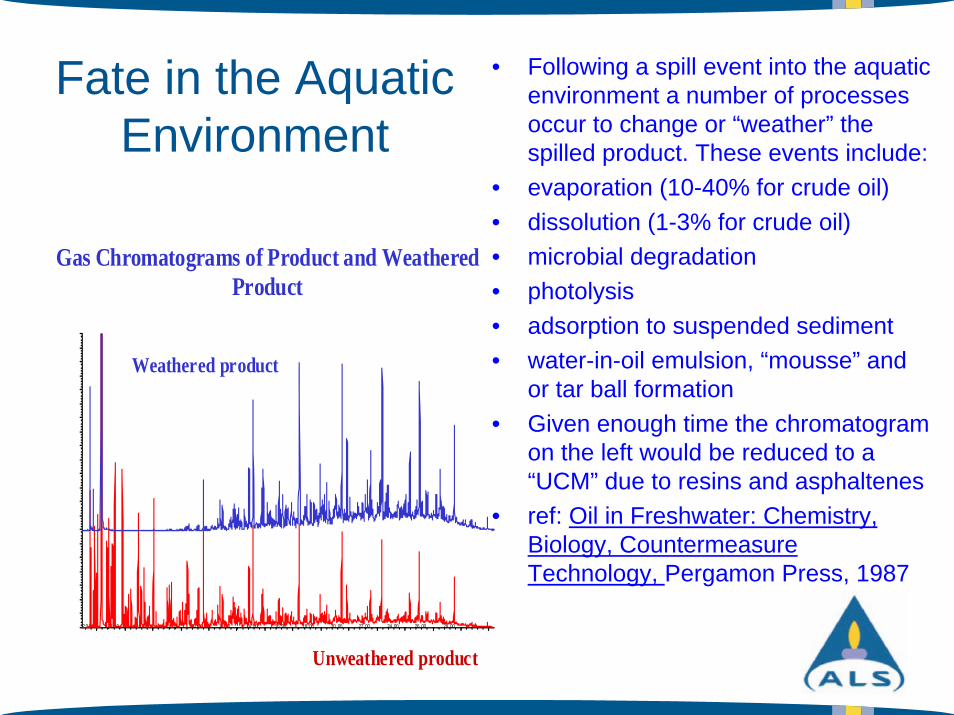
Fate in the Aquatic Environment
2.0 0 4.0 0 6.0 0 8.0 0 10 .00 12 .00 14 .00 16 .00 18 .00 20 .00 22 .00 24 .00 26 .00 28 .00
Gas Chromatograms of Product and WeatheredProduct
Weathered product
Unweathered product
• Following a spill event into the aquatic environment a number of processes occur to change or “weather” the spilled product. These events include:
• evaporation (10-40% for crude oil)• dissolution (1-3% for crude oil)• microbial degradation• photolysis• adsorption to suspended sediment• water-in-oil emulsion, “mousse” and
or tar ball formation• Given enough time the chromatogram
on the left would be reduced to a “UCM” due to resins and asphaltenes
• ref: Oil in Freshwater: Chemistry, Biology, Countermeasure Technology, Pergamon Press, 1987
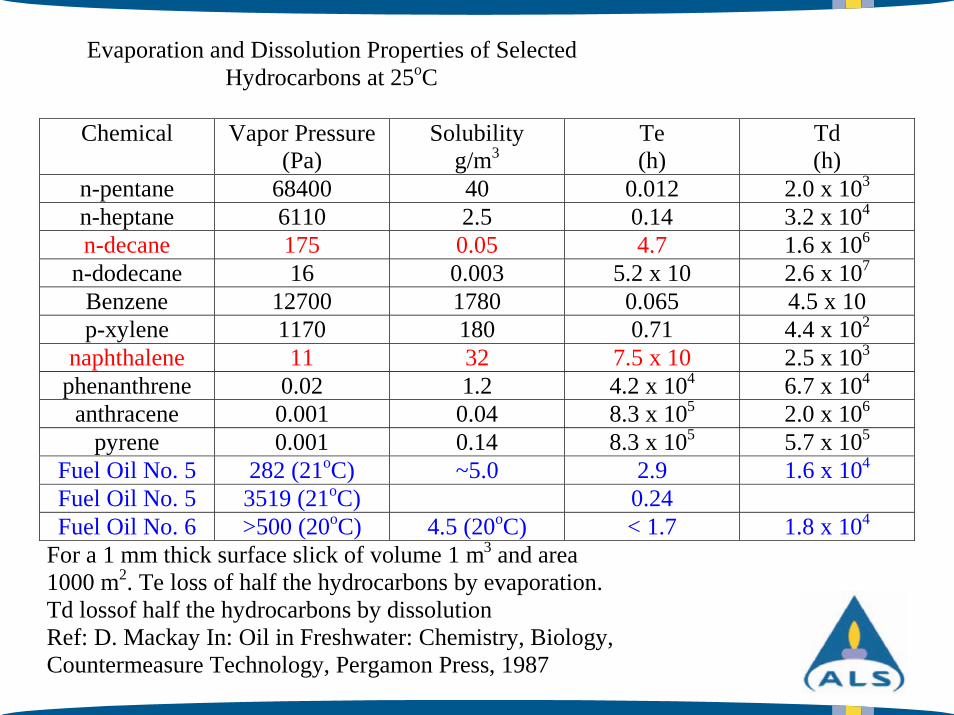
Evaporation and Dissolution Properties of SelectedHydrocarbons at 25oC
Chemical Vapor Pressure(Pa)
Solubilityg/m3
Te(h)
Td(h)
n-pentane 68400 40 0.012 2.0 x 10³
n-heptane 6110 2.5 0.14 3.2 x 10⁴
n-decane 175 0.05 4.7 1.6 x 10⁶
n-dodecane 16 0.003 5.2 x 10 2.6 x 10⁷
Benzene 12700 1780 0.065 4.5 x 10p-xylene 1170 180 0.71 4.4 x 10²
naphthalene 11 32 7.5 x 10 2.5 x 10³
phenanthrene 0.02 1.2 4.2 x 10⁴ 6.7 x 10⁴
anthracene 0.001 0.04 8.3 x 10⁵ 2.0 x 10⁶
pyrene 0.001 0.14 8.3 x 10⁵ 5.7 x 10⁵
Fuel Oil No. 5 282 (21oC) ~5.0 2.9 1.6 x 10⁴
Fuel Oil No. 5 3519 (21oC) 0.24Fuel Oil No. 6 >500 (20oC) 4.5 (20oC) < 1.7 1.8 x 10⁴
For a 1 mm thick surface slick of volume 1 m3 and area1000 m2. Te loss of half the hydrocarbons by evaporation.Td lossof half the hydrocarbons by dissolutionRef: D. Mackay In: Oil in Freshwater: Chemistry, Biology,Countermeasure Technology, Pergamon Press, 1987
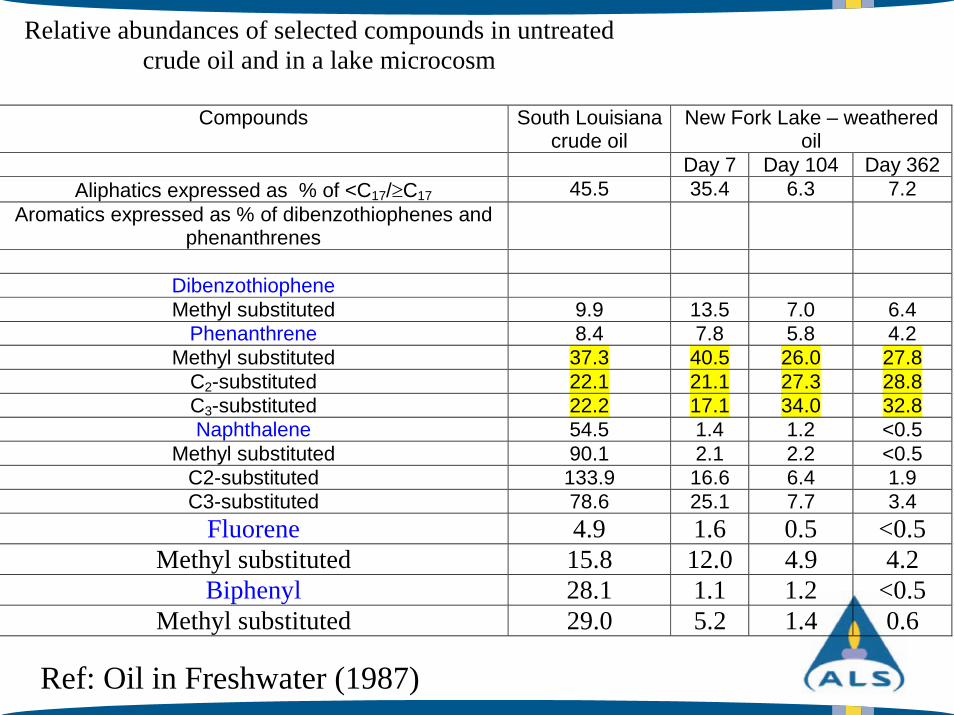
Relative abundances of selected compounds in untreatedcrude oil and in a lake microcosm
Compounds South Louisianacrude oil
New Fork Lake – weatheredoil
Day 7 Day 104 Day 362Aliphatics expressed as % of <C17/ C17 45.5 35.4 6.3 7.2
Aromatics expressed as % of dibenzothiophenes andphenanthrenes
DibenzothiopheneMethyl substituted 9.9 13.5 7.0 6.4
Phenanthrene 8.4 7.8 5.8 4.2Methyl substituted 37.3 40.5 26.0 27.8
C2-substituted 22.1 21.1 27.3 28.8C3-substituted 22.2 17.1 34.0 32.8Naphthalene 54.5 1.4 1.2 <0.5
Methyl substituted 90.1 2.1 2.2 <0.5C2-substituted 133.9 16.6 6.4 1.9C3-substituted 78.6 25.1 7.7 3.4
Fluorene 4.9 1.6 0.5 <0.5Methyl substituted 15.8 12.0 4.9 4.2
Biphenyl 28.1 1.1 1.2 <0.5Methyl substituted 29.0 5.2 1.4 0.6
Ref: Oil in Freshwater (1987)
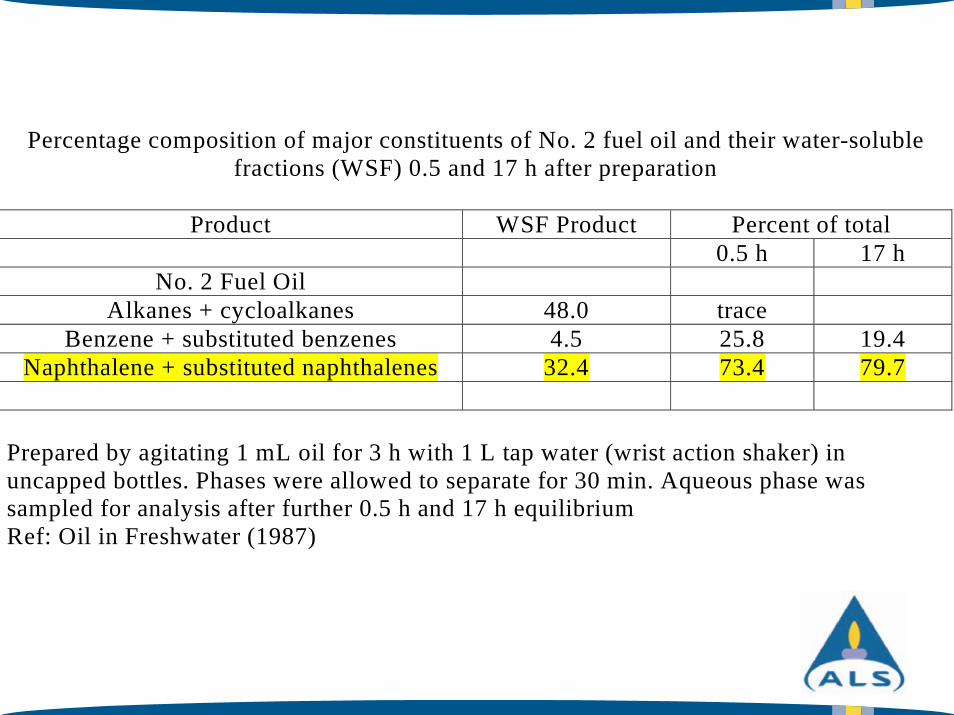
Percentage composition of major constituents of No. 2 fuel oil and their water-solublefractions (WSF) 0.5 and 17 h after preparation
Product WSF Product Percent of total0.5 h 17 h
No. 2 Fuel OilAlkanes + cycloalkanes 48.0 trace
Benzene + substituted benzenes 4.5 25.8 19.4Naphthalene + substituted naphthalenes 32.4 73.4 79.7
Prepared by agitating 1 mL oil for 3 h with 1 L tap water (wrist action shaker) inuncapped bottles. Phases were allowed to separate for 30 min. Aqueous phase wassampled for analysis after further 0.5 h and 17 h equilibriumRef: Oil in Freshwater (1987)
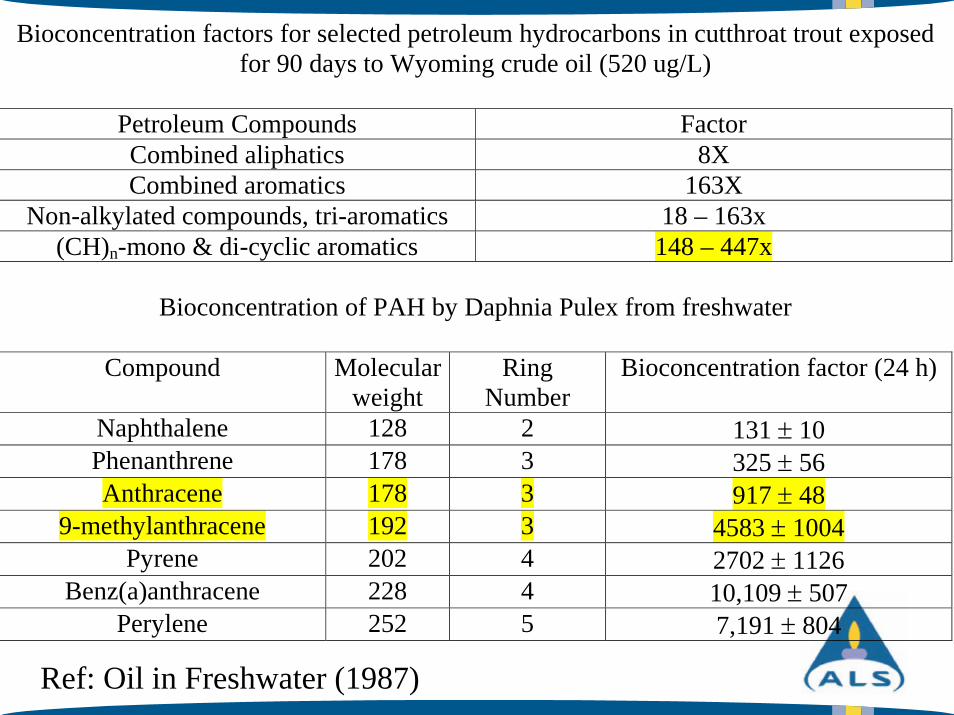
Bioconcentration factors for selected petroleum hydrocarbons in cutthroat trout exposedfor 90 days to Wyoming crude oil (520 ug/L)
Petroleum Compounds FactorCombined aliphatics 8XCombined aromatics 163X
Non-alkylated compounds, tri-aromatics 18 – 163x(CH)n-mono & di-cyclic aromatics 148 – 447x
Bioconcentration of PAH by Daphnia Pulex from freshwater
Compound Molecularweight
RingNumber
Bioconcentration factor (24 h)
Naphthalene 128 2 131 10Phenanthrene 178 3 325 56Anthracene 178 3 917 48
9-methylanthracene 192 3 4583 1004Pyrene 202 4 2702 1126
Benz(a)anthracene 228 4 10,109 507Perylene 252 5 7,191 804
Ref: Oil in Freshwater (1987)
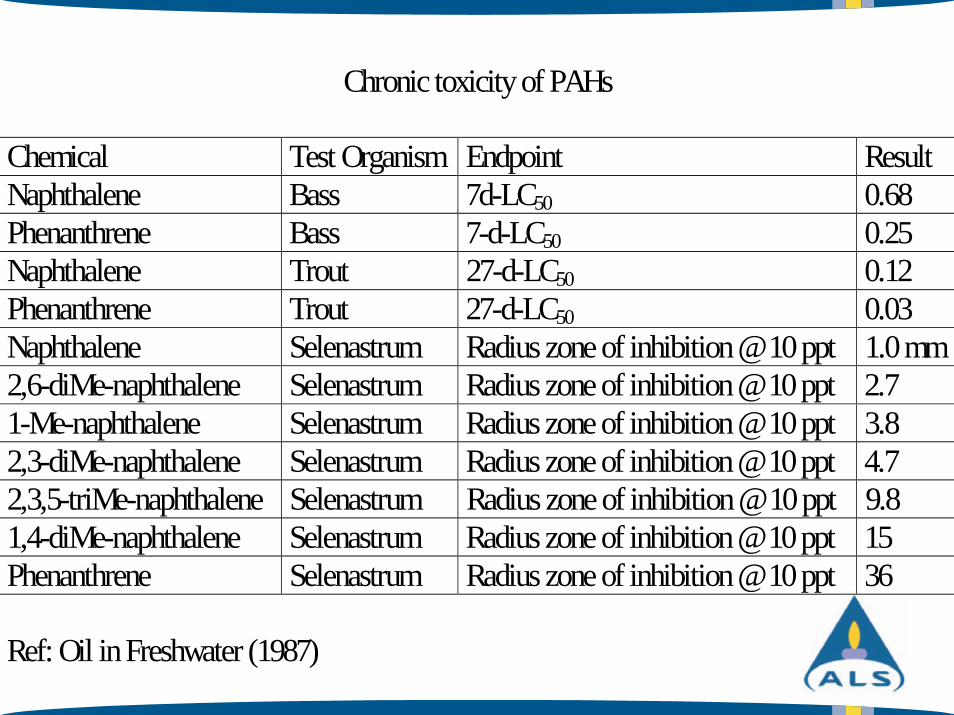
Chronic toxicity of PAHs
Chemical Test Organism Endpoint ResultNaphthalene Bass 7d-LC50 0.68Phenanthrene Bass 7-d-LC50 0.25Naphthalene Trout 27-d-LC50 0.12Phenanthrene Trout 27-d-LC50 0.03Naphthalene Selenastrum Radius zone of inhibition @ 10 ppt 1.0 mm2,6-diMe-naphthalene Selenastrum Radius zone of inhibition @ 10 ppt 2.71-Me-naphthalene Selenastrum Radius zone of inhibition @ 10 ppt 3.82,3-diMe-naphthalene Selenastrum Radius zone of inhibition @ 10 ppt 4.72,3,5-triMe-naphthalene Selenastrum Radius zone of inhibition @ 10 ppt 9.81,4-diMe-naphthalene Selenastrum Radius zone of inhibition @ 10 ppt 15Phenanthrene Selenastrum Radius zone of inhibition @ 10 ppt 36
Ref: Oil in Freshwater (1987)
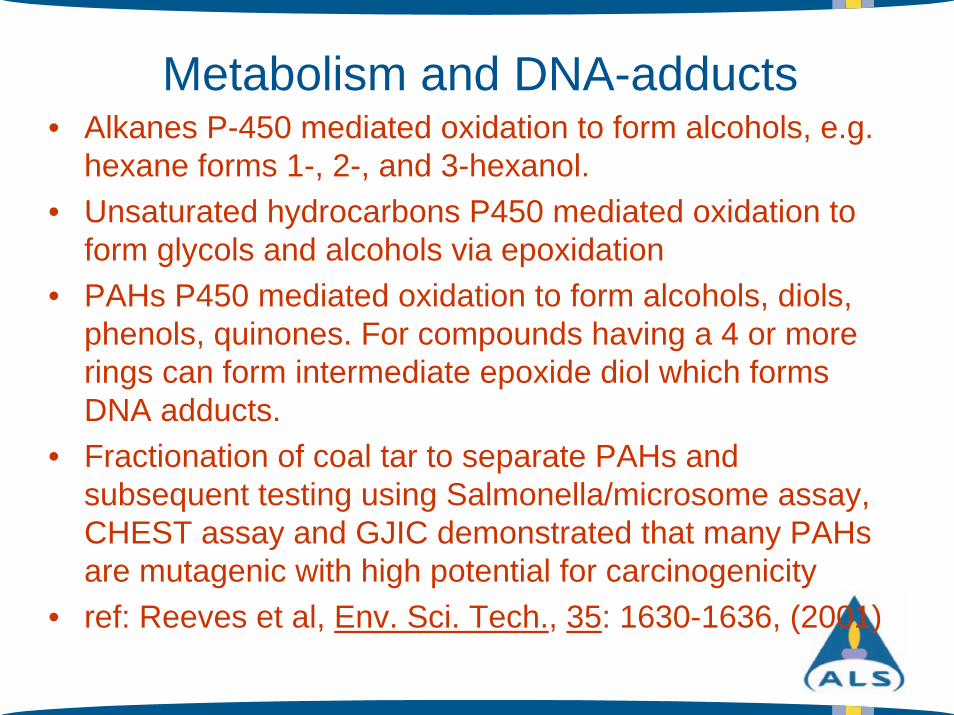
Metabolism and DNA-adducts• Alkanes P-450 mediated oxidation to form alcohols, e.g.
hexane forms 1-, 2-, and 3-hexanol. • Unsaturated hydrocarbons P450 mediated oxidation to
form glycols and alcohols via epoxidation• PAHs P450 mediated oxidation to form alcohols, diols,
phenols, quinones. For compounds having a 4 or more rings can form intermediate epoxide diol which forms DNA adducts.
• Fractionation of coal tar to separate PAHs and subsequent testing using Salmonella/microsome assay, CHEST assay and GJIC demonstrated that many PAHsare mutagenic with high potential for carcinogenicity
• ref: Reeves et al, Env. Sci. Tech., 35: 1630-1636, (2001)
Summation• Following an oil spill the WSF is dominated by PAHs• These are:• relatively persistent• demonstrate acute and chronic toxicity• bioconcentrate• some are mutagenic/carcinogenic and have been
correlated to cause tumors and neoplasms in fish• differences in toxicological responses from petrogenic
sources can be related to the aromatic and PAH concentrations and distributions
• Many agencies recommend monitoring for PAHsfollowing spill events because of these considerations
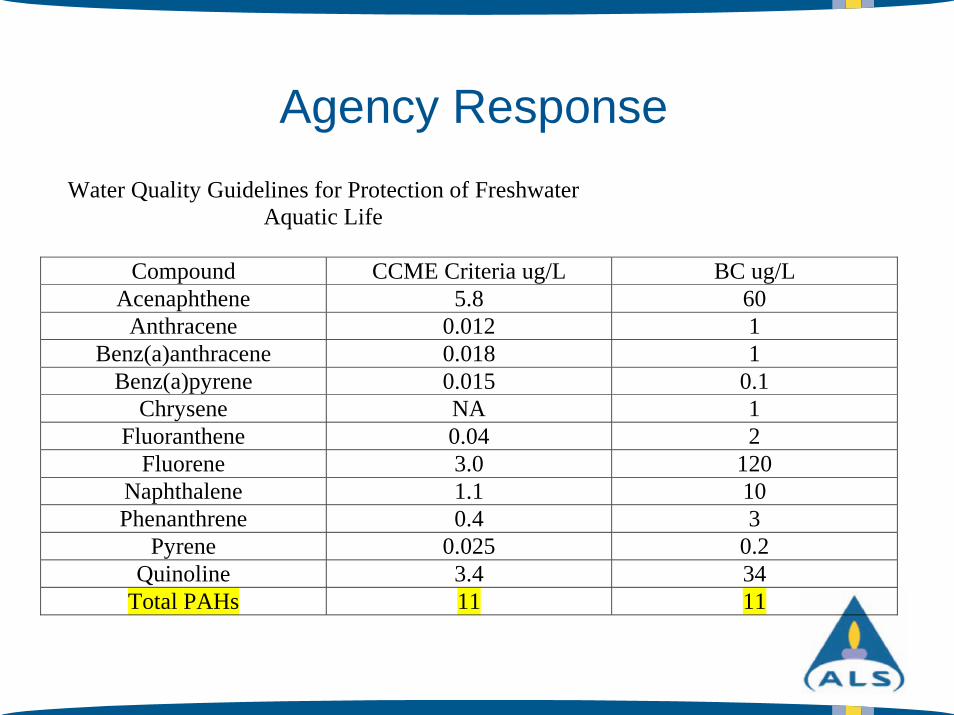
Agency Response
Water Quality Guidelines for Protection of FreshwaterAquatic Life
Compound CCME Criteria ug/L BC ug/LAcenaphthene 5.8 60
Anthracene 0.012 1Benz(a)anthracene 0.018 1
Benz(a)pyrene 0.015 0.1Chrysene NA 1
Fluoranthene 0.04 2Fluorene 3.0 120
Naphthalene 1.1 10Phenanthrene 0.4 3
Pyrene 0.025 0.2Quinoline 3.4 34
Total PAHs 11 11
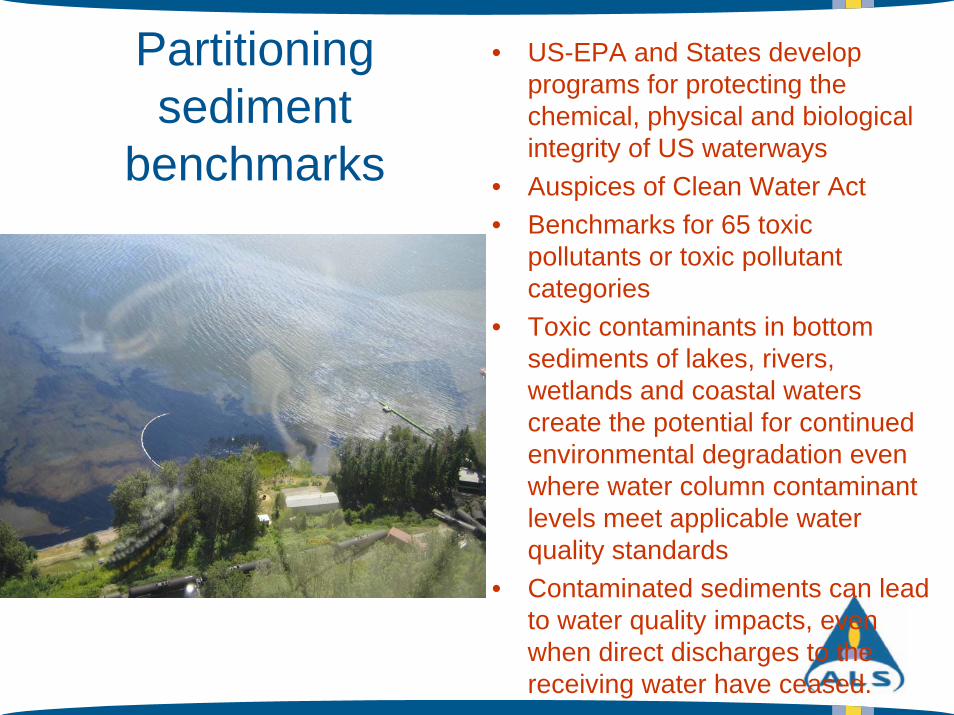
Partitioningsediment
benchmarks
• US-EPA and States develop programs for protecting the chemical, physical and biological integrity of US waterways
• Auspices of Clean Water Act• Benchmarks for 65 toxic
pollutants or toxic pollutant categories
• Toxic contaminants in bottom sediments of lakes, rivers, wetlands and coastal waters create the potential for continued environmental degradation even where water column contaminant levels meet applicable water quality standards
• Contaminated sediments can lead to water quality impacts, even when direct discharges to the receiving water have ceased.
US EPA Benchmark values• Risk from sediment PAHs to benthic organisms• based on the number of PAH toxic units (TU)
freely dissolved in the sediment pore water• all PAHs assumed to have the same toxicity (on
a molar basis) - narcosis model• differ only in their tendency to partition from
sediment to pore water• For sediment PAHs, KOC, Klipid, and KOW are
used to calculate the concentration of each PAH that represents one toxic unit
Ref: Procedures for the Derivation of Equilibrium Partitioning Sediment Benchmarks (ESBs) for the Protection of Benthic Organisms: PAH mixtures (2003). EPA-600-R-02-013
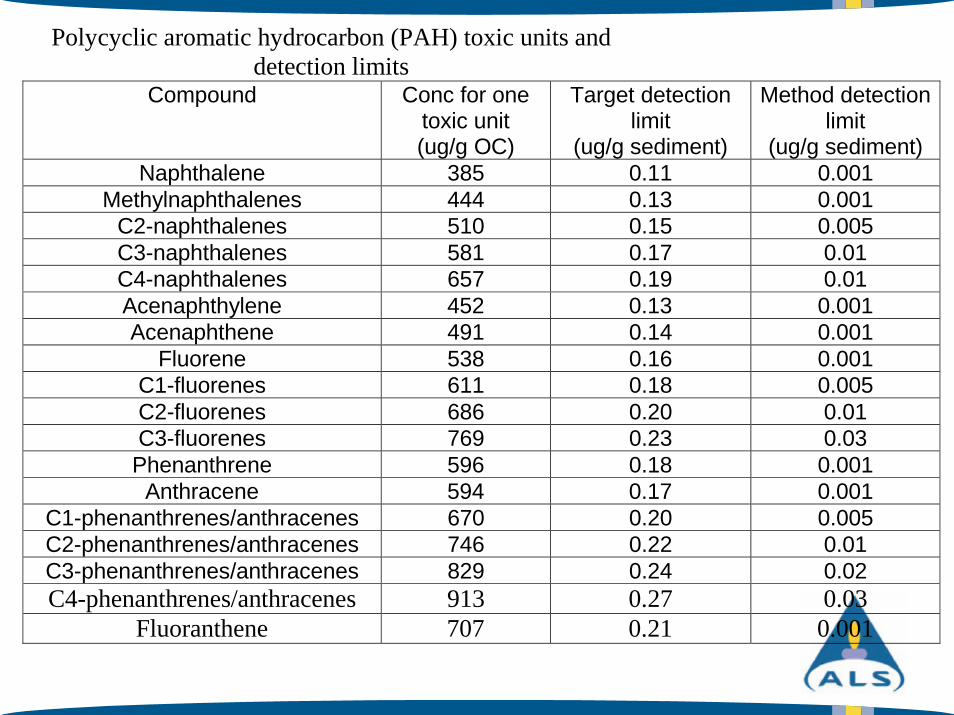
Polycyclic aromatic hydrocarbon (PAH) toxic units anddetection limits
Compound Conc for onetoxic unit(ug/g OC)
Target detectionlimit
(ug/g sediment)
Method detectionlimit
(ug/g sediment)Naphthalene 385 0.11 0.001
Methylnaphthalenes 444 0.13 0.001C2-naphthalenes 510 0.15 0.005C3-naphthalenes 581 0.17 0.01C4-naphthalenes 657 0.19 0.01Acenaphthylene 452 0.13 0.001Acenaphthene 491 0.14 0.001
Fluorene 538 0.16 0.001C1-fluorenes 611 0.18 0.005C2-fluorenes 686 0.20 0.01C3-fluorenes 769 0.23 0.03Phenanthrene 596 0.18 0.001
Anthracene 594 0.17 0.001C1-phenanthrenes/anthracenes 670 0.20 0.005C2-phenanthrenes/anthracenes 746 0.22 0.01C3-phenanthrenes/anthracenes 829 0.24 0.02C4-phenanthrenes/anthracenes 913 0.27 0.03
Fluoranthene 707 0.21 0.001
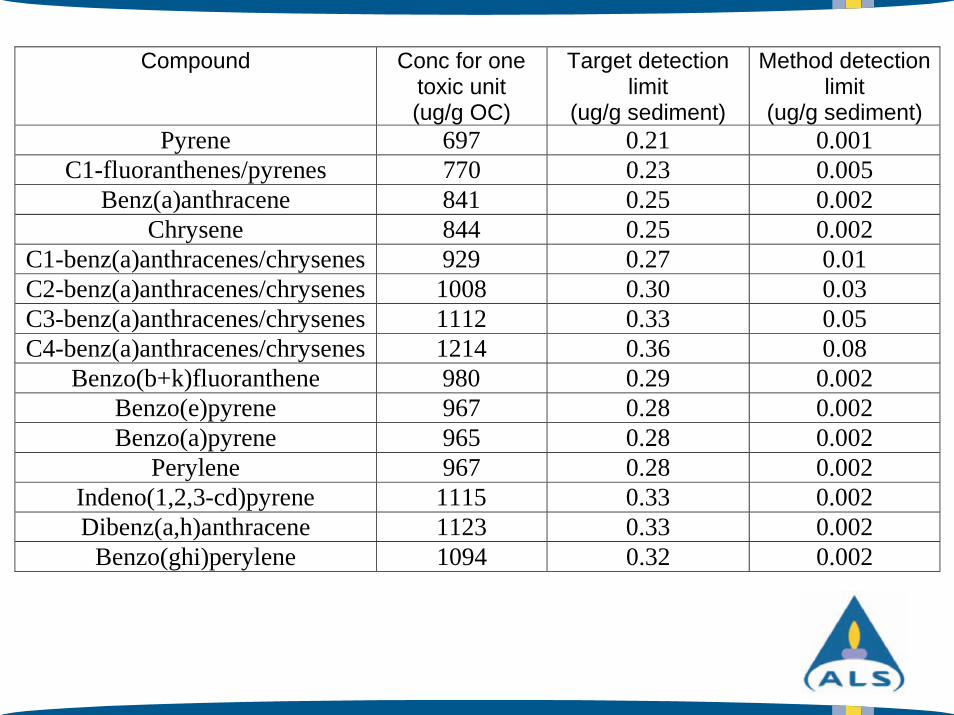
Compound Conc for onetoxic unit(ug/g OC)
Target detectionlimit
(ug/g sediment)
Method detectionlimit
(ug/g sediment)Pyrene 697 0.21 0.001
C1-fluoranthenes/pyrenes 770 0.23 0.005Benz(a)anthracene 841 0.25 0.002
Chrysene 844 0.25 0.002C1-benz(a)anthracenes/chrysenes 929 0.27 0.01C2-benz(a)anthracenes/chrysenes 1008 0.30 0.03C3-benz(a)anthracenes/chrysenes 1112 0.33 0.05C4-benz(a)anthracenes/chrysenes 1214 0.36 0.08
Benzo(b+k)fluoranthene 980 0.29 0.002Benzo(e)pyrene 967 0.28 0.002Benzo(a)pyrene 965 0.28 0.002
Perylene 967 0.28 0.002Indeno(1,2,3-cd)pyrene 1115 0.33 0.002Dibenz(a,h)anthracene 1123 0.33 0.002
Benzo(ghi)perylene 1094 0.32 0.002
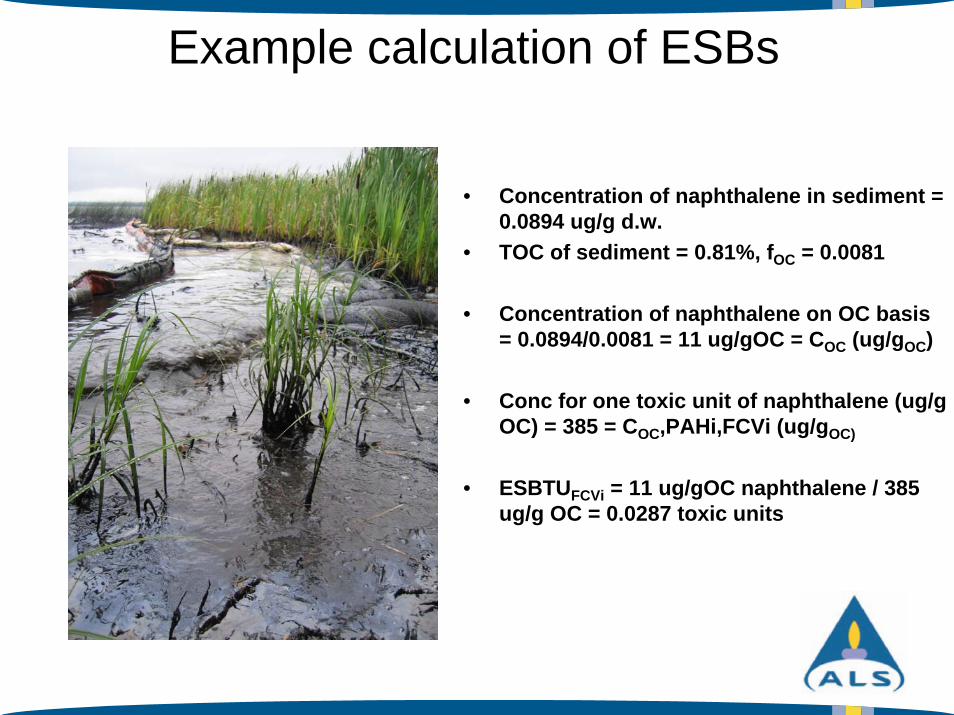
Example calculation of ESBs
• Concentration of naphthalene in sediment = 0.0894 ug/g d.w.
• TOC of sediment = 0.81%, fOC = 0.0081
• Concentration of naphthalene on OC basis = 0.0894/0.0081 = 11 ug/gOC = COC (ug/gOC)
• Conc for one toxic unit of naphthalene (ug/gOC) = 385 = COC,PAHi,FCVi (ug/gOC)
• ESBTUFCVi = 11 ug/gOC naphthalene / 385 ug/g OC = 0.0287 toxic units
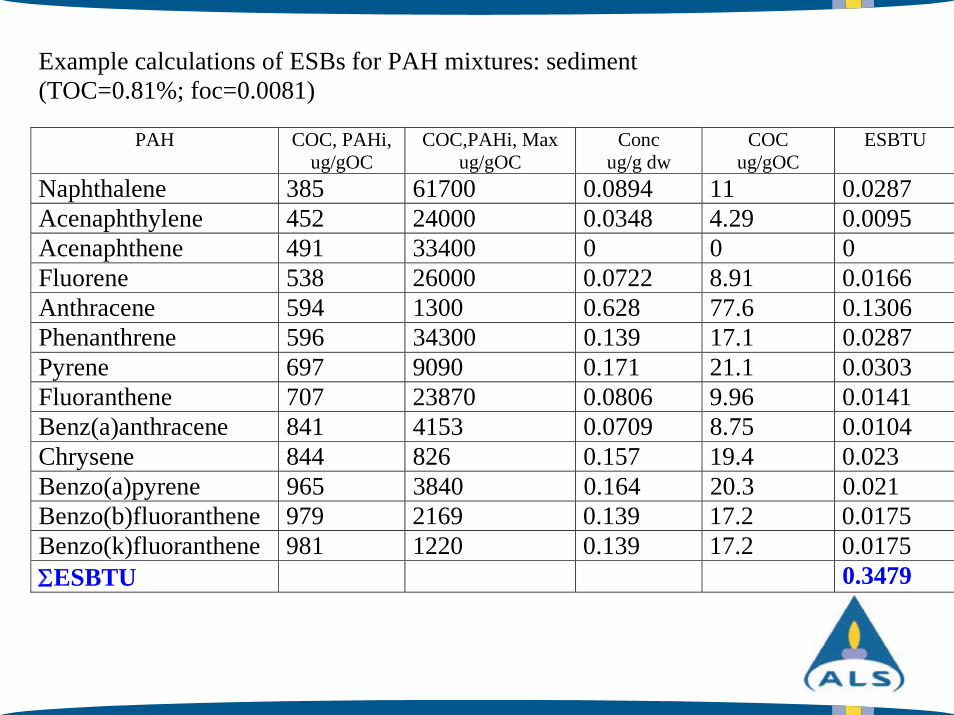
Example calculations of ESBs for PAH mixtures: sediment(TOC=0.81%; foc=0.0081)
PAH COC, PAHi,ug/gOC
COC,PAHi, Maxug/gOC
Concug/g dw
COCug/gOC
ESBTU
Naphthalene 385 61700 0.0894 11 0.0287Acenaphthylene 452 24000 0.0348 4.29 0.0095Acenaphthene 491 33400 0 0 0Fluorene 538 26000 0.0722 8.91 0.0166Anthracene 594 1300 0.628 77.6 0.1306Phenanthrene 596 34300 0.139 17.1 0.0287Pyrene 697 9090 0.171 21.1 0.0303Fluoranthene 707 23870 0.0806 9.96 0.0141Benz(a)anthracene 841 4153 0.0709 8.75 0.0104Chrysene 844 826 0.157 19.4 0.023Benzo(a)pyrene 965 3840 0.164 20.3 0.021Benzo(b)fluoranthene 979 2169 0.139 17.2 0.0175Benzo(k)fluoranthene 981 1220 0.139 17.2 0.0175
ESBTU 0.3479
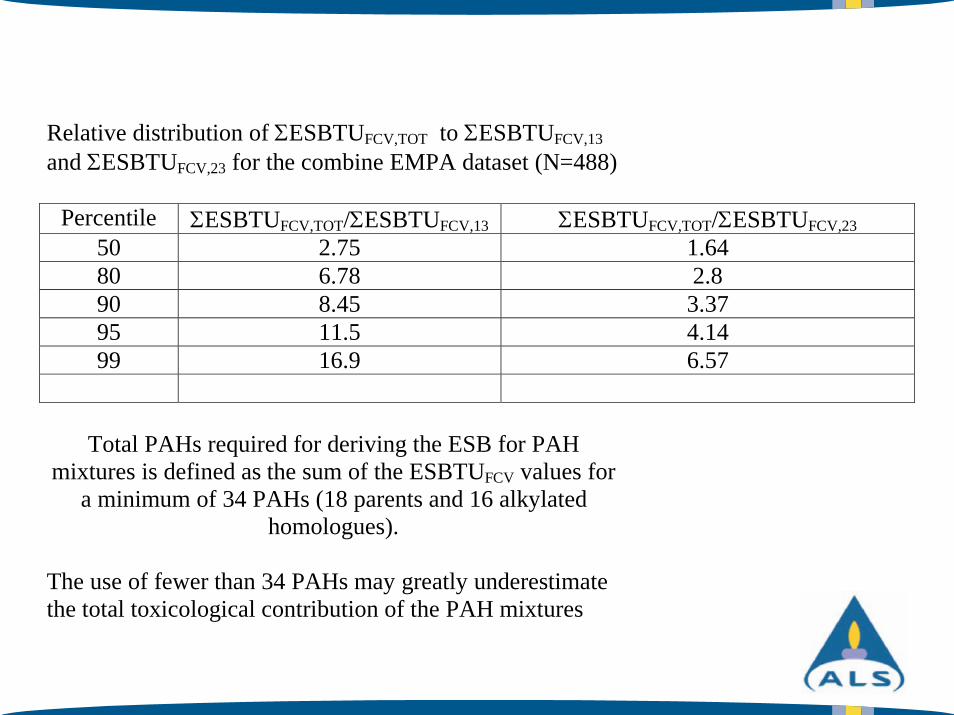
Relative distribution of ESBTUFCV,TOT to ESBTUFCV,13
and ESBTUFCV,23 for the combine EMPA dataset (N=488)
Percentile ESBTUFCV,TOT/ ESBTUFCV,13 ESBTUFCV,TOT/ ESBTUFCV,23
50 2.75 1.6480 6.78 2.890 8.45 3.3795 11.5 4.1499 16.9 6.57
Total PAHs required for deriving the ESB for PAHmixtures is defined as the sum of the ESBTUFCV values for
a minimum of 34 PAHs (18 parents and 16 alkylatedhomologues).
The use of fewer than 34 PAHs may greatly underestimatethe total toxicological contribution of the PAH mixtures
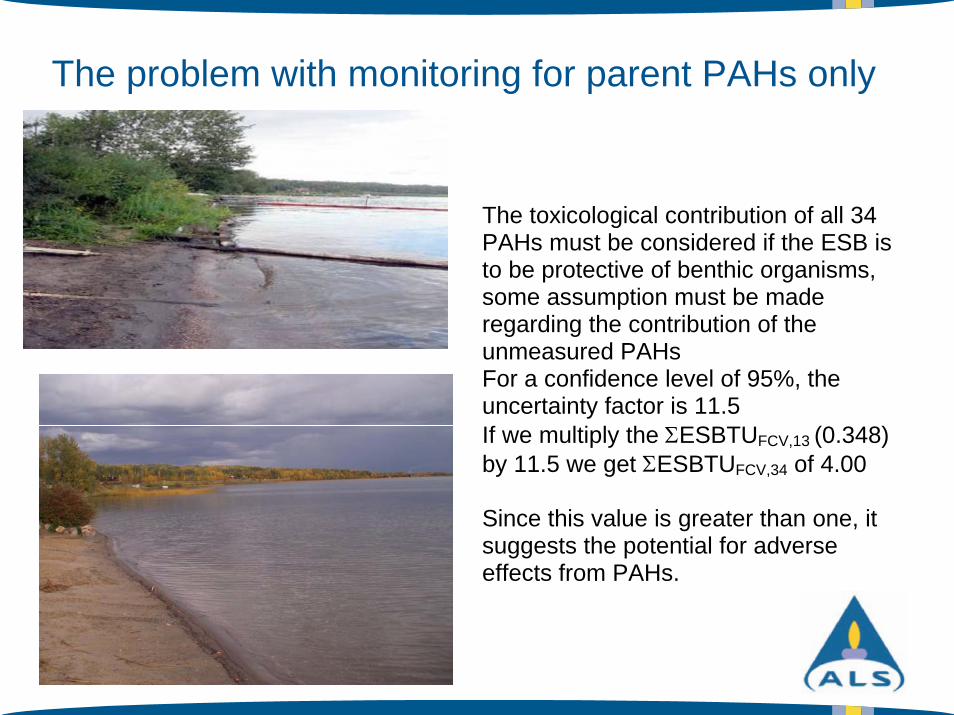
The problem with monitoring for parent PAHs only
The toxicological contribution of all 34PAHs must be considered if the ESB isto be protective of benthic organisms,some assumption must be maderegarding the contribution of theunmeasured PAHsFor a confidence level of 95%, theuncertainty factor is 11.5If we multiply the ESBTUFCV,13 (0.348)by 11.5 we get ESBTUFCV,34 of 4.00
Since this value is greater than one, itsuggests the potential for adverseeffects from PAHs.
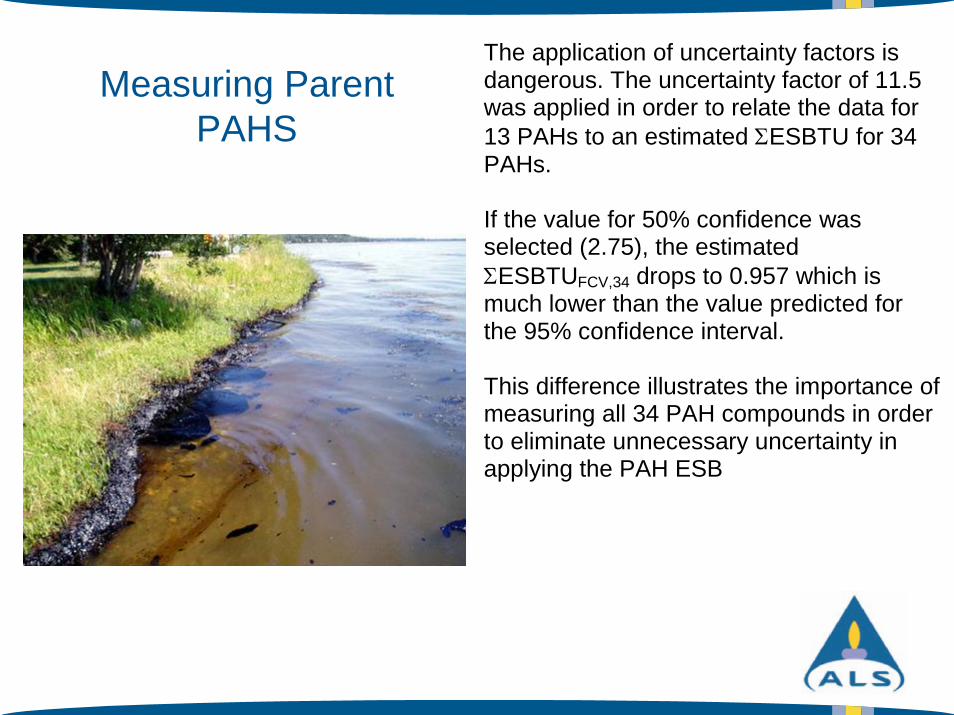
Measuring Parent PAHS
The application of uncertainty factors isdangerous. The uncertainty factor of 11.5was applied in order to relate the data for13 PAHs to an estimated ESBTU for 34PAHs.
If the value for 50% confidence wasselected (2.75), the estimated
ESBTUFCV,34 drops to 0.957 which ismuch lower than the value predicted forthe 95% confidence interval.
This difference illustrates the importance ofmeasuring all 34 PAH compounds in orderto eliminate unnecessary uncertainty inapplying the PAH ESB
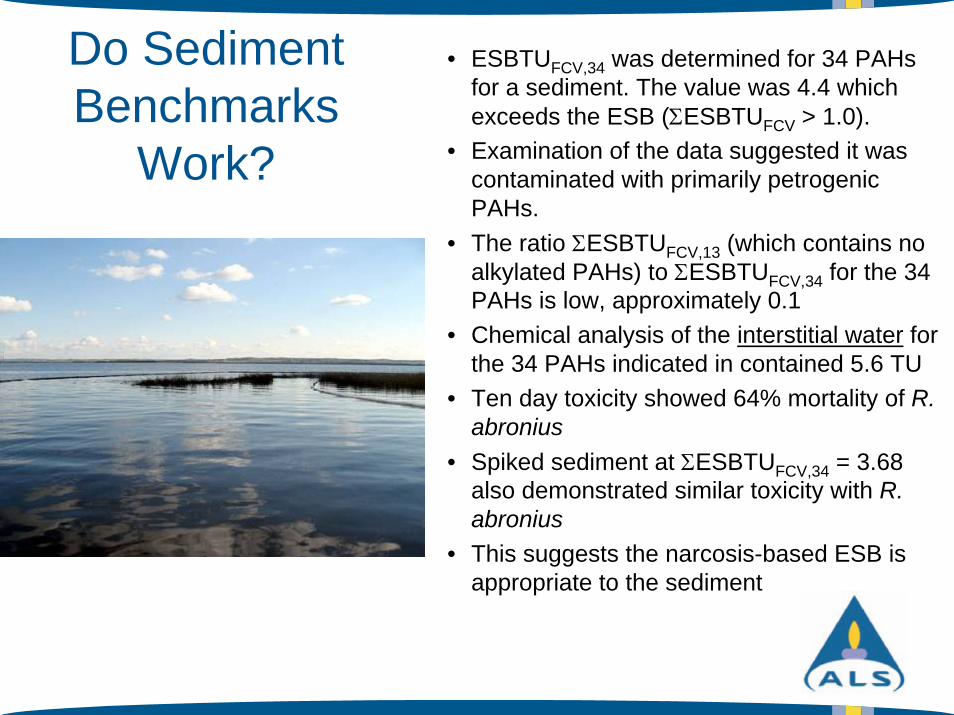
Do Sediment Benchmarks
Work?
• ESBTUFCV,34 was determined for 34 PAHsfor a sediment. The value was 4.4 which exceeds the ESB ( ESBTUFCV > 1.0).
• Examination of the data suggested it was contaminated with primarily petrogenicPAHs.
• The ratio ESBTUFCV,13 (which contains no alkylated PAHs) to ESBTUFCV,34 for the 34 PAHs is low, approximately 0.1
• Chemical analysis of the interstitial water forthe 34 PAHs indicated in contained 5.6 TU
• Ten day toxicity showed 64% mortality of R.abronius
• Spiked sediment at ESBTUFCV,34 = 3.68 also demonstrated similar toxicity with R.abronius
• This suggests the narcosis-based ESB is appropriate to the sediment
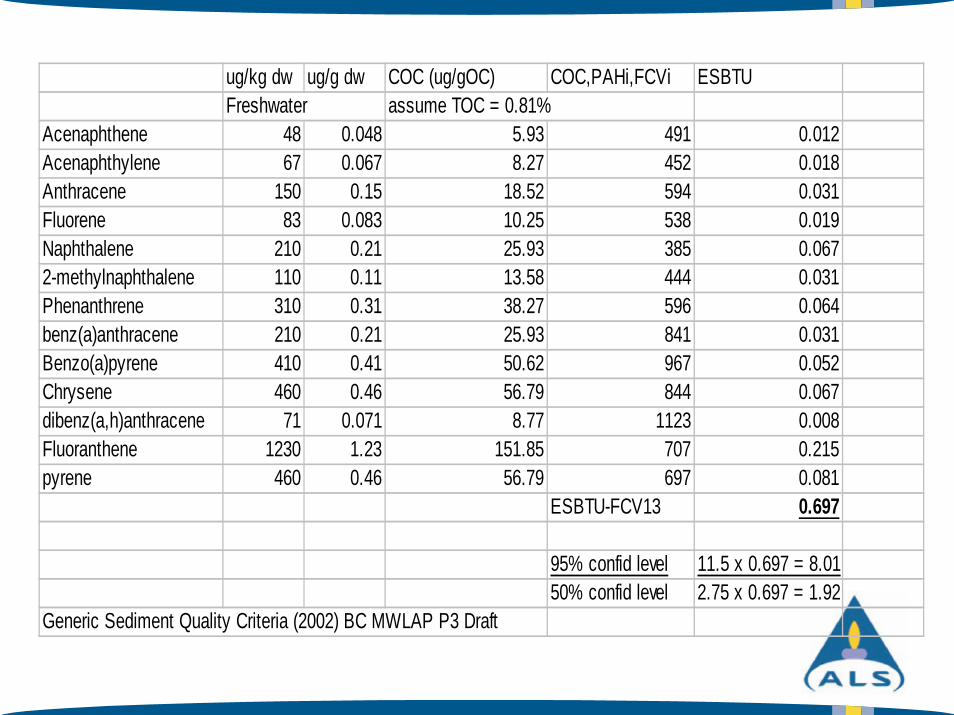
ug/kg dw ug/g dw COC (ug/gOC) COC,PAHi,FCVi ESBTUFreshwater assume TOC = 0.81%
Acenaphthene 48 0.048 5.93 491 0.012Acenaphthylene 67 0.067 8.27 452 0.018Anthracene 150 0.15 18.52 594 0.031Fluorene 83 0.083 10.25 538 0.019Naphthalene 210 0.21 25.93 385 0.0672-methylnaphthalene 110 0.11 13.58 444 0.031Phenanthrene 310 0.31 38.27 596 0.064benz(a)anthracene 210 0.21 25.93 841 0.031Benzo(a)pyrene 410 0.41 50.62 967 0.052Chrysene 460 0.46 56.79 844 0.067dibenz(a,h)anthracene 71 0.071 8.77 1123 0.008Fluoranthene 1230 1.23 151.85 707 0.215pyrene 460 0.46 56.79 697 0.081
ESBTU-FCV13 0.697
95% confid level 11.5 x 0.697 = 8.0150% confid level 2.75 x 0.697 = 1.92
Generic Sediment Quality Criteria (2002) BC MWLAP P3 Draft
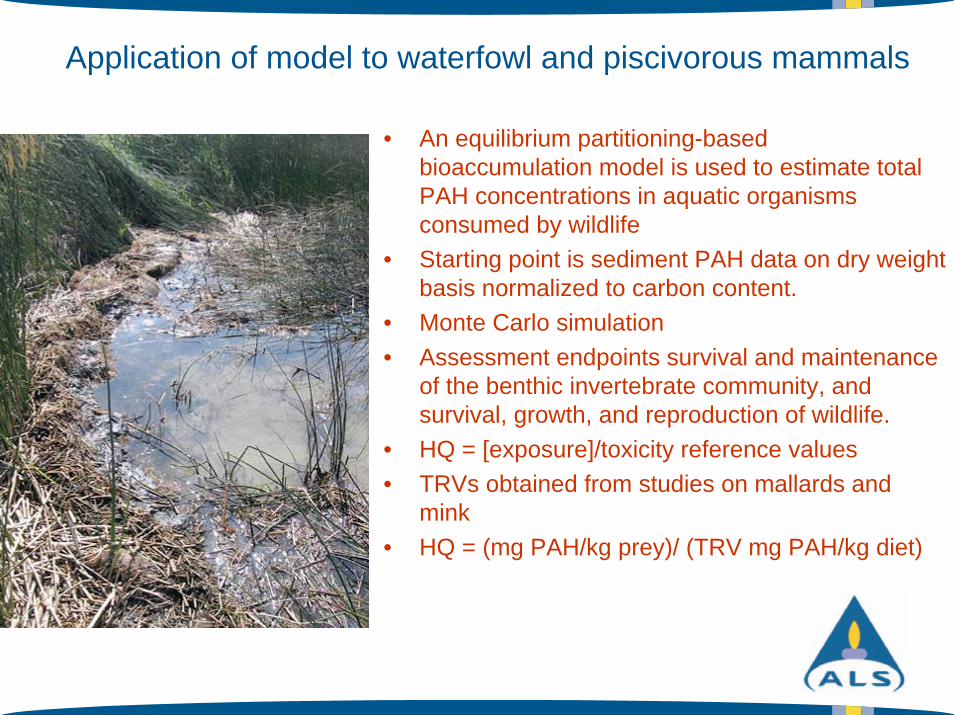
Application of model to waterfowl and piscivorous mammals
• An equilibrium partitioning-based bioaccumulation model is used to estimate total PAH concentrations in aquatic organisms consumed by wildlife
• Starting point is sediment PAH data on dry weight basis normalized to carbon content.
• Monte Carlo simulation• Assessment endpoints survival and maintenance
of the benthic invertebrate community, and survival, growth, and reproduction of wildlife.
• HQ = [exposure]/toxicity reference values• TRVs obtained from studies on mallards and
mink• HQ = (mg PAH/kg prey)/ (TRV mg PAH/kg diet)
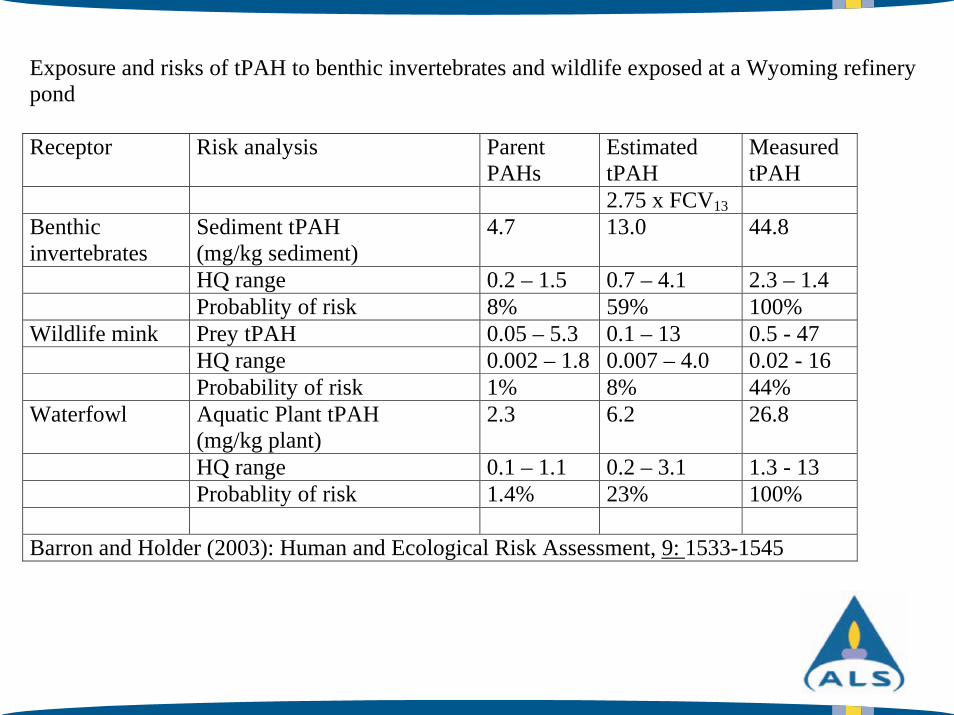
Exposure and risks of tPAH to benthic invertebrates and wildlife exposed at a Wyoming refinery pond
Receptor Risk analysis Parent PAHs
Estimated tPAH
Measured tPAH
2.75 x FCV13
Benthic invertebrates
Sediment tPAH (mg/kg sediment)
4.7 13.0 44.8
HQ range 0.2 – 1.5 0.7 – 4.1 2.3 – 1.4 Probablity of risk 8% 59% 100%
Wildlife mink Prey tPAH 0.05 – 5.3 0.1 – 13 0.5 - 47 HQ range 0.002 – 1.8 0.007 – 4.0 0.02 - 16
Probability of risk 1% 8% 44% Waterfowl Aquatic Plant tPAH
(mg/kg plant) 2.3 6.2 26.8
HQ range 0.1 – 1.1 0.2 – 3.1 1.3 - 13 Probablity of risk 1.4% 23% 100%
Barron and Holder (2003): Human and Ecological Risk Assessment, 9: 1533-1545
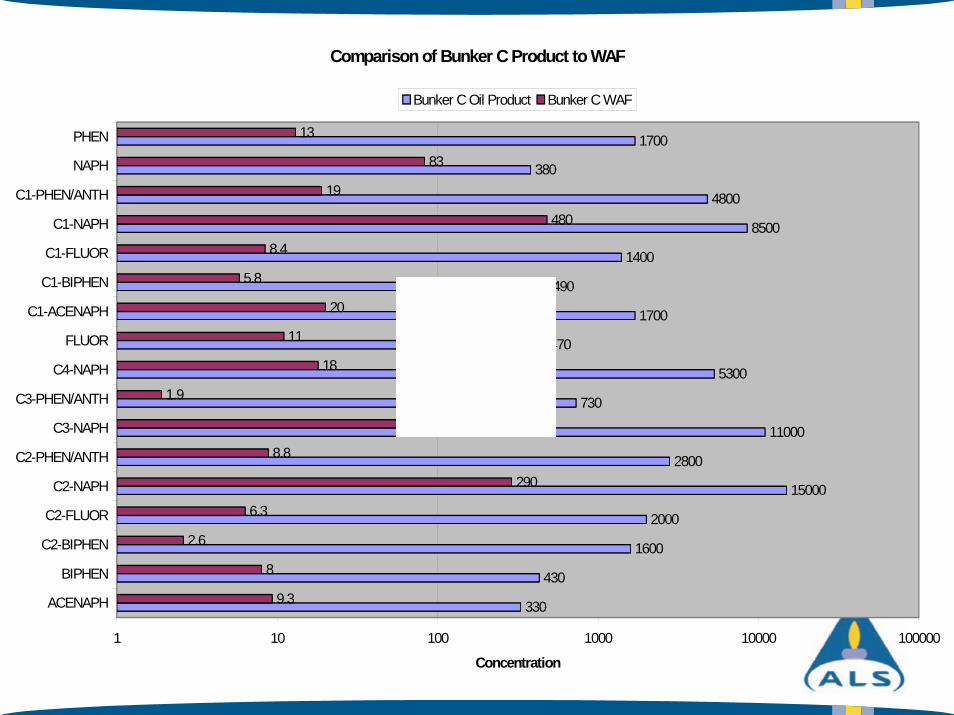
Comparison of Bunker C Product to WAF
330
430
1600
2000
15000
2800
11000
730
5300
470
1700
490
1400
8500
4800
380
1700
9.3
8
2.6
6.3
290
8.8
80
1.9
18
11
20
5.8
8.4
480
19
83
13
1 10 100 1000 10000 100000
ACENAPH
BIPHEN
C2-BIPHEN
C2-FLUOR
C2-NAPH
C2-PHEN/ANTH
C3-NAPH
C3-PHEN/ANTH
C4-NAPH
FLUOR
C1-ACENAPH
C1-BIPHEN
C1-FLUOR
C1-NAPH
C1-PHEN/ANTH
NAPH
PHEN
Concentration
Bunker C Oil Product Bunker C WAF
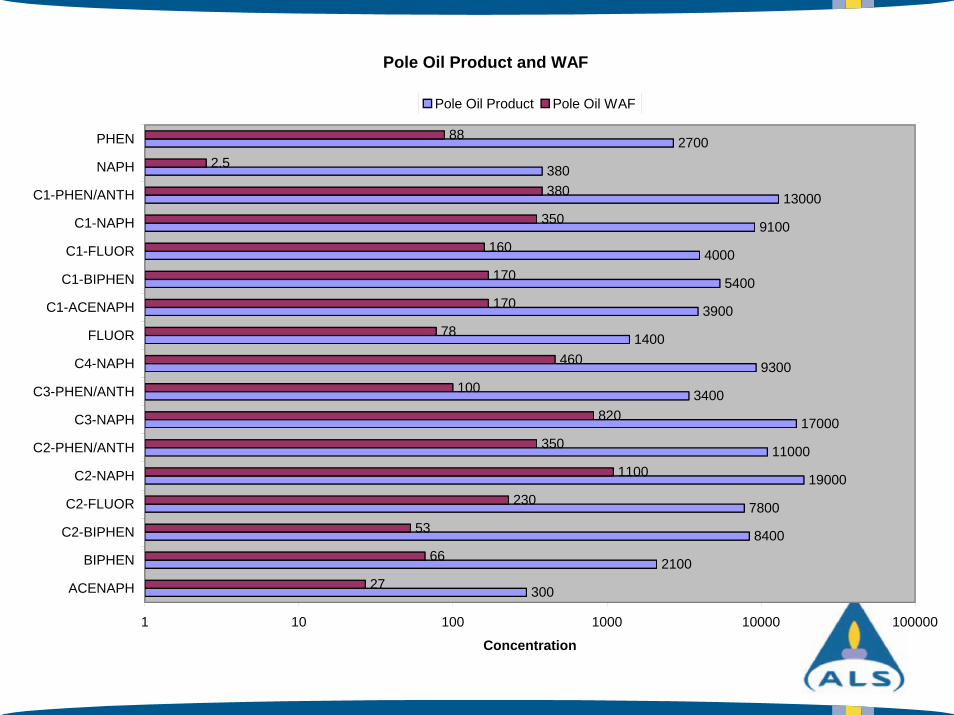
Pole Oil Product and WAF
300
2100
8400
7800
19000
11000
17000
3400
9300
1400
3900
5400
4000
9100
13000
380
2700
27
66
53
230
1100
350
820
100
460
78
170
170
160
350
380
2.5
88
1 10 100 1000 10000 100000
ACENAPH
BIPHEN
C2-BIPHEN
C2-FLUOR
C2-NAPH
C2-PHEN/ANTH
C3-NAPH
C3-PHEN/ANTH
C4-NAPH
FLUOR
C1-ACENAPH
C1-BIPHEN
C1-FLUOR
C1-NAPH
C1-PHEN/ANTH
NAPH
PHEN
Concentration
Pole Oil Product Pole Oil WAF
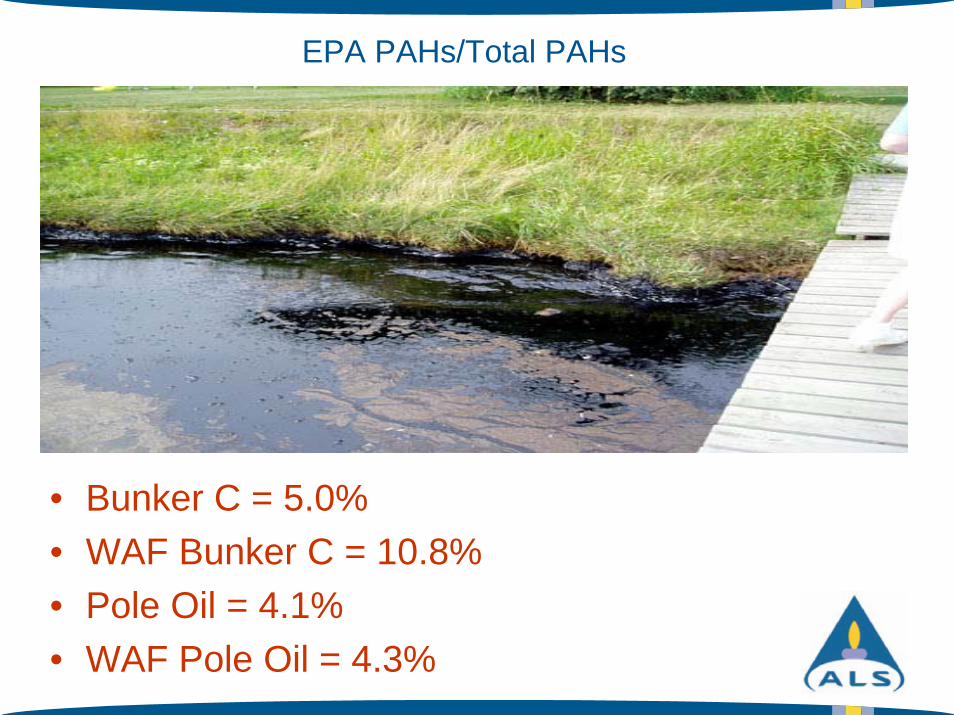
EPA PAHs/Total PAHs
• Bunker C = 5.0%• WAF Bunker C = 10.8%• Pole Oil = 4.1%• WAF Pole Oil = 4.3%
GC/MS Analysis of PAH Alkyl-homologues
• Not straight forward• Response factors for parent
and alkyl homologues are different
• Obtaining all the standards necessary is a challenge and expensive
• Window setting for the homologues is a challenge
• Overlap of PASH and Alk-PAH• Overlap of deuterated internal
standards with Alk-PAH
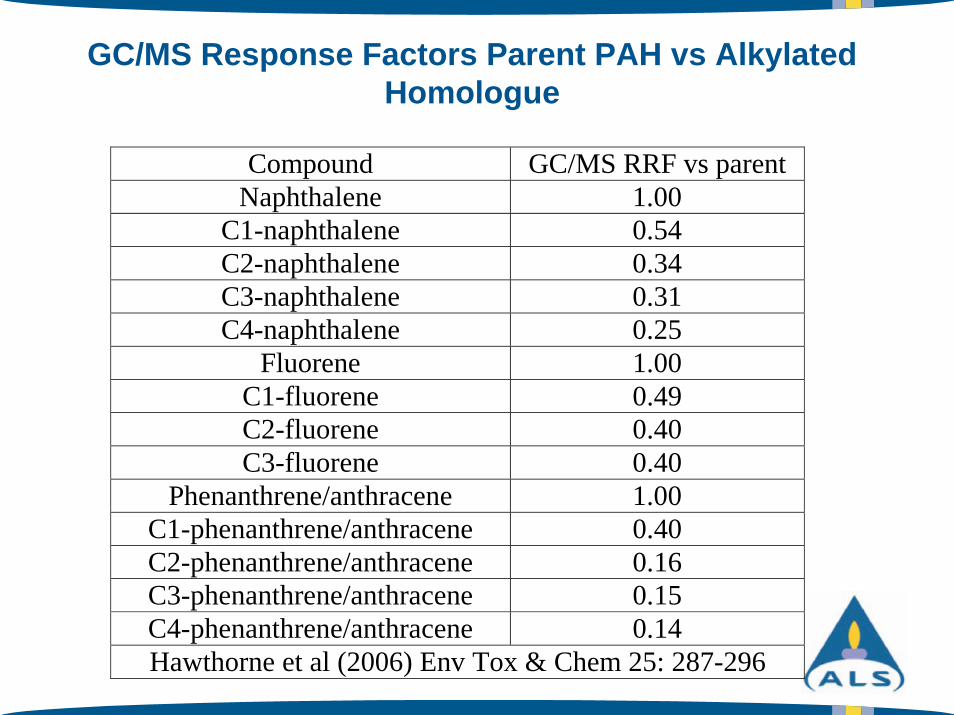
GC/MS Response Factors Parent PAH vs AlkylatedHomologue
Compound GC/MS RRF vs parent Naphthalene 1.00
C1-naphthalene 0.54 C2-naphthalene 0.34 C3-naphthalene 0.31 C4-naphthalene 0.25
Fluorene 1.00 C1-fluorene 0.49 C2-fluorene 0.40 C3-fluorene 0.40
Phenanthrene/anthracene 1.00 C1-phenanthrene/anthracene 0.40 C2-phenanthrene/anthracene 0.16 C3-phenanthrene/anthracene 0.15 C4-phenanthrene/anthracene 0.14 Hawthorne et al (2006) Env Tox & Chem 25: 287-296
Conclusions• Following an oil spill the WSF is
dominated by PAHs• These are:• relatively persistent• demonstrate acute and chronic
toxicity• bioconcentrate• some are mutagenic/carcinogenic
and have been correlated to cause tumors and neoplasms in fish
• differences in toxicological responses from petrogenic sources can be related to the aromatic and PAH concentrations and distributions
• Many agencies recommend monitoring for PAHs following spill events because of these considerations
Conclusions• Toxicology and various models
(e.g. narcosis model) suggest that both alkylated and parent PAHs should be measured
• Supported by Monte Carlo simulations for wildlife
• Application of correction factors to EPA priority pollutant or CCME PAHs does not work –depending on HC distribution can underestimate or overestimate risk.
• Analysis for both parent and alkyl-homologues are analytically challenging and not straight forward (i.e. no SW-846 method).
Conclusions• Recognizing the
importance of adequate data in risk analyses Golder and ALS generated parent and alk-PAH data for all samples analyzed
• Because of the timely need for data in site decision making many analyses were performed within 12 h of receipt of samples