Embed Size (px)
Citation preview
RESEARCH ARTICLE Open Access
Metabolomics analysis elucidates uniqueinfluences on purine / pyrimidinemetabolism by xanthine oxidoreductaseinhibitors in a rat model of renal ischemia-reperfusion injuryTakashi Tani1,2* , Ken Okamoto2, Megumi Fujiwara2, Akira Katayama2 and Shuichi Tsuruoka1
Abstract
Background: Clinically applied as anti-gout drugs, xanthine oxidoreductase (XOR) inhibitors, especially the potent,selective, non-purine-analog XOR inhibitors febuxostat and topiroxostat, exert organ-protective effects. We testedthe hypothesis that preservation of tissue concentrations of high-energy phosphates, such as ATP and ADP,contributes to organ-protective effects through CE-TOFMS metabolomics.
Methods: Rats were subjected to 30 min of renal ischemia-reperfusion (I/R) injury 60 min after oral administration of10 mg/kg febuxostat, 10 mg/kg topiroxostat, 50 mg/kg allopurinol, or vehicle.
Results: In non-purine-analog XOR inhibitor-treated groups, renal concentrations of high-energy phosphates weregreater before and after I/R injury, and renal adenine compounds were less depleted by I/R injury than in thevehicle and allopurinol groups. These findings were well in accordance with the proposed hypothesis that therecomposition of high-energy phosphates is promoted by non-purine-analog XOR inhibitors via the salvagepathway through blockade of hypoxanthine catabolism, whereas non-specific inhibitory effects of allopurinol onpurine/pyrimidine enzymes impede this re-synthesis process.
Conclusions: This metabolic approach shed light on the physiology of the organ-protective effects of XORinhibitors.
Keywords: Metabolome, Xanthine oxidoreductase inhibitor, Ischemia-reperfusion injury
BackgroundXanthine oxidoreductase (XOR) catalyzes the oxida-tion of hypoxanthine to xanthine and that of xanthineto uric acid, as well as the reduction of nicotinamideadenine dinucleotide (NAD+) or molecular oxygen.Because they inhibit the conversion of xanthine touric acid, XOR inhibitors are used as anti-gout drugs.Clinically used XOR inhibitors are classified into twogroups based on different chemical structures and
inhibition mechanisms: the purine-analog inhibitorallopurinol, and non-purine-analog inhibitors, such asfebuxostat and topiroxostat. The largest difference be-tween the purine analog and non-purine-analog inhib-itors is the specificity of the target enzyme; the non-purine-analog inhibitors impede the activity of XORsolely by obstructing substrate binding, and do notinhibit additional enzymes in purine and pyrimidinemetabolism pathways as reported for allopurinol(Okamoto et al. 2003; Takano et al. 2005).XOR inhibitors have shown potential organ-protective
effects in clinical trials (Sezai et al. 2015; Tanaka et al.2015; Tsuruta et al. 2014; Whelton et al. 2011) as well asanimal experiments (Sanchez-Lozada et al. 2008; Tsuda
© The Author(s). 2019 Open Access This article is distributed under the terms of the Creative Commons Attribution 4.0International License (http://creativecommons.org/licenses/by/4.0/), which permits unrestricted use, distribution, andreproduction in any medium, provided you give appropriate credit to the original author(s) and the source, provide a link tothe Creative Commons license, and indicate if changes were made. The Creative Commons Public Domain Dedication waiver(http://creativecommons.org/publicdomain/zero/1.0/) applies to the data made available in this article, unless otherwise stated.
* Correspondence: [email protected] of Nephrology, Graduate School of Medicine, Nippon MedicalSchool, 1-1-5 Sendagi, Bunkyo-ku, Tokyo 113-8602, Japan2Department of Metabolism and Nutrition, Graduate School of Medicine,Nippon Medical School, 1-1-5 Sendagi, Bunkyo-ku, Tokyo 113-8602, Japan
Molecular MedicineTani et al. Molecular Medicine (2019) 25:40 https://doi.org/10.1186/s10020-019-0109-y
et al. 2012; Omori et al. 2012). The mechanism of pro-tection is usually explained by the oxidative-stress hy-pothesis: potent inhibition of XOR activity results insuppression of the activity of xanthine oxidase (XO),where XO functions in disease states by transferringelectrons to O2 to form O2
−, leading to oxidative stressand resulting in organ disorders (Tsuda et al. 2012;Omori et al. 2012; McCord 1985).There are several clinical reports indicating that
the non-purine-analog inhibitor, febuxostat showssuperior organ-protective effects compared to allo-purinol (Sezai et al. 2015; Kim et al. 2017; Chou etal. 2017; Foody et al. 2017; Shafik 2013; Wang et al.2015; Khan et al. 2017; Kato et al. 2016). Some invivo experiments revealed a superior organ-protect-ive effect of febuxostat compared to allopurinol inan intestinal ischemia-reperfusion (I/R) injury ratmodel, a myocardial I/R injury mouse/rat model anda mouse model of amyotrophic lateral sclerosis(ALS) (Shafik 2013; Wang et al. 2015; Khan et al.2017; Kato et al. 2016). Most of these reports claimthat superiority of non-purine-analog inhibitor toallopurinol was due to significant potency of non-purine-analog inhibitor to inhibit XOR activity, andthus lowering oxidative-stress. However, there are nostudies in which augmentation of XO activity itselfwas confirmed enzymatically, and the specific mech-anism of action remains further to be elucidated.One possible alternate answer to the question is that
XOR inhibitors might exhibit organ-protective effects byaffecting purine metabolism. Indeed, administration ofallopurinol maintained tissue concentrations of ATP, ad-enosine diphosphate (ADP), and adenosine 5′-monopho-sphate (AMP), and preserved functional organ activity(Cunningham et al. 1974; Lasley et al. 1988; Khatib et al.2001). As XOR is a key player in purine metabolism, ex-haustive metabolic analysis would contribute to elucidatethe beneficial organ-protective effect of XOR inhibitors.To survey such global alterations of metabolic pathways,metabolomics is considered an appropriate approach. Themetabolome is the global collection of small molecules(typically < 1500 Da; e.g., sugars, amino acids, organicacids, nucleotides, acylcarnitines, and lipids) in a cell or abiologic specimen (Kalim and Rhee 2017).Animal models of I/R injury have long been used to
evaluate metabolic fluctuations in organ disorders (Cun-ningham et al. 1974; Lasley et al. 1988; Khatib et al.2001; Stromski et al. 1986; Stromski et al. 1988; Okabe1996). By investigating the influence of renal I/R on themetabolome, I/R-induced metabolic changes can be elu-cidated. For instance, ischemia produces a rapid loss ofhigh-energy phosphates and accumulation of hydrolysisproducts, including lactate, β-hydroxybutyrate, and cit-rate (Weiner 1987).
The influence of XOR inhibitors on metabolic path-ways may be related to their organ-protective effects(Cunningham et al. 1974; Lasley et al. 1988; Khatib et al.2001); thus, clarifying the alterations in the metabolomemay help elucidate their mechanism of action. There-fore, in this study, we aimed to elucidate the mechanismof XOR inhibitors using capillary electrophoresis–time-of-flight mass spectrometry (CE-TOFMS) in a rat modelof renal I/R, in which the effectiveness of XOR inhibitorshas been established (Tsuda et al. 2012).
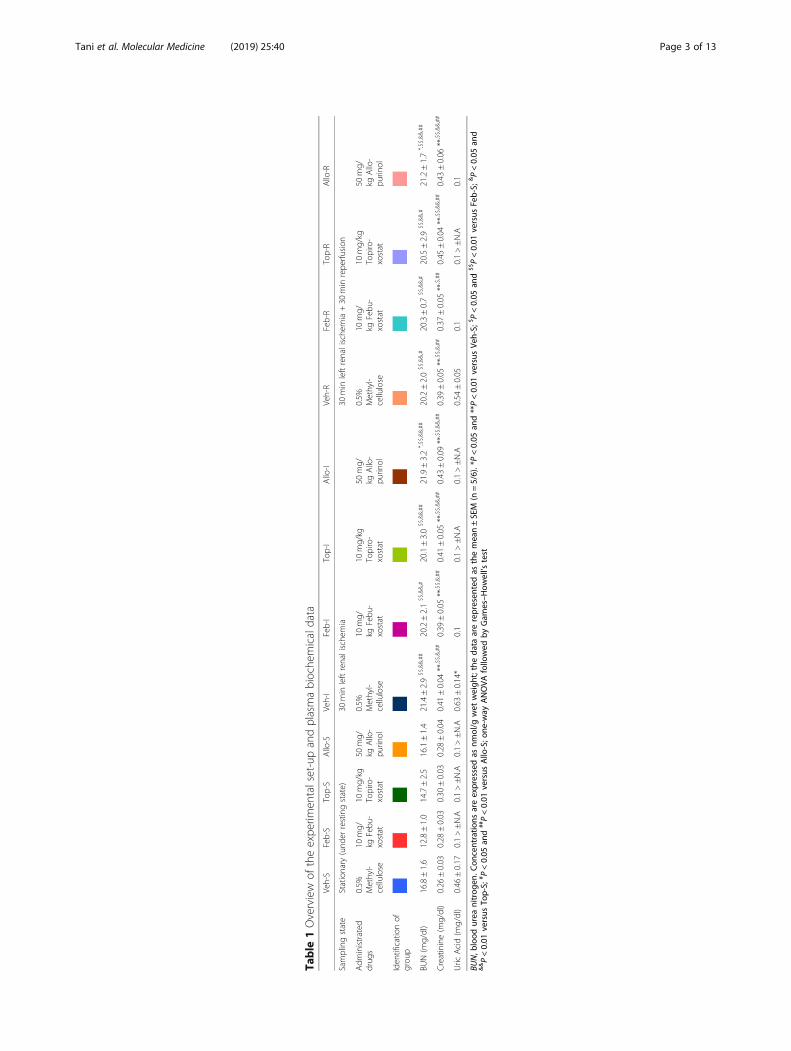
MethodsRat model of renal I/R injurySixty-two 6-week-old male Sprague–Dawley rats wererandomly allocated to four groups (Table 1): (1) vehicle-treatment group (Veh; n = 17); (2) febuxostat-treatmentgroup (Feb; n = 15); (3) topiroxostat-treatment group(Top; n = 15) (4) allopurinol-treatment group (Allo; n =15). Vehicle-treated rats orally received 0.5 ml of 0.5%methylcellulose 60min before surgery. Experimental ratswere orally administered 10mg/kg febuxostat, 10 mg/kgtopiroxostat, or 50 mg/kg allopurinol in 0.5% methylcel-lulose, 60 min before operation.Before surgery, rats were anesthetized by intraperitoneal
injection of 360mg/kg chloral hydrate (Wako Pure Chem-ical Industries, CAS: 302–17-0) and were placed on awarmed table to maintain a rectal temperature of 37 °C.The animals were then allowed to stabilize for 20min. I/Rinjury was initiated by left renal pedicle occlusion with anon-traumatic vascular clamp for 30min, during whichtime the kidney was kept warm and moist. Occlusion wasconfirmed visually by a color change to a paler shade. Then,the clamp was removed, and the kidney was observed forreturn of blood flow.Kidney samples were obtained at different phases
of the operation (Table 1): (a) stationary phase (n =21), sacrifice at 60 min after drug administrationwith no ischemic damage (S groups); (b) ischemicphase (n = 20), sacrifice at after 30 min left renal is-chemia (I groups); (c) reperfusion phase (n = 21),sacrifice after 30 min of left renal ischemia followedby 30 min of reperfusion (R groups). Each samplegroup (n = 5 or 6) was named after the administereddrug and sampling phase, e.g., Feb-I represents thegroup treated with febuxostat that underwent 30 minof I/R injury. At the time of sacrifice, the left kidneywas quickly weighed, snap-frozen in liquid nitrogen,and stored at − 80 °C, and blood was obtained viapuncture of the inferior vena cava. Plasma creatinineand urea were measured enzymatically and by theurease-GLDH method, respectively, on a Hitachi7180 auto-analyzer (Hitachi High-Technologies,Tokyo, Japan). Rats were euthanized through cervicaldislocation under anesthesia.
Tani et al. Molecular Medicine (2019) 25:40 Page 2 of 13
Table
1Overview
oftheexpe
rimen
talset-upandplasmabioche
micaldata
Veh-S
Feb-S
Top-S
Allo-S
Veh-I
Feb-I
Top-I
Allo-I
Veh-R
Feb-R
Top-R
Allo-R
Samplingstate
Stationary
(und
errestingstate)
30min
leftrenalische
mia
30min
leftrenalische
mia+30
min
repe
rfusion
Adm
inistrated
drug
s0.5%
Methyl-
cellulose
10mg/
kgFebu
-xostat
10mg/kg
Topiro-
xostat
50mg/
kgAllo-
purin
ol
0.5%
Methyl-
cellulose
10mg/
kgFebu
-xostat
10mg/kg
Topiro-
xostat
50mg/
kgAllo-
purin
ol
0.5%
Methyl-
cellulose
10mg/
kgFebu
-xostat
10mg/kg
Topiro-
xostat
50mg/
kgAllo-
purin
ol
Iden
tificationof
grou
p
BUN(m
g/dl)
16.8±1.6
12.8±1.0
14.7±2.5
16.1±1.4
21.4±2.9
$$,&&,##
20.2±2.1
$$,&&,#
20.1±3.0
$$,&&,##
21.9±3.2
*,$$,&&,##
20.2±2.0
$$,&&,#
20.3±0.7
$$,&&,#
20.5±2.9
$$,&&,#
21.2±1.7
*,$$,&&,##
Creatinine(m
g/dl)
0.26
±0.03
0.28
±0.03
0.30
±0.03
0.28
±0.04
0.41
±0.04
**,$$,&,##
0.39
±0.05
**,$$,&,##
0.41
±0.05
**,$$,&&,##
0.43
±0.09
**,$$,&&,##
0.39
±0.05
**,$$,&,##
0.37
±0.05
**,$,##
0.45
±0.04
**,$$,&&,##
0.43
±0.06
**,$$,&&,##
Uric
Acid(m
g/dl)
0.46
±0.17
0.1>±N.A
0.1>±N.A
0.1>±N.A
0.63
±0.14*
0.1
0.1>±N.A
0.1>±N.A
0.54
±0.05
0.1
0.1>±N.A
0.1
BUN,b
lood
urea
nitrog
en.C
oncentratio
nsareexpressedas
nmol/g
wet
weigh
t;theda
taarerepresen
tedas
themean±SEM
(n=5/6).*P<0.05
and**P<0.01
versus
Veh-S;
$P<0.05
and
$$P<0.01
versus
Feb-S;
&P<0.05
and
&&P<0.01
versus
Top-S;
# P<0.05
and
##P<0.01
versus
Allo-S;o
ne-w
ayANOVA
followed
byGam
es–H
owell’s
test
Tani et al. Molecular Medicine (2019) 25:40 Page 3 of 13

Preparation of kidney extracts for HPLC and metabolomeanalysesSpecial care was taken throughout the procedure not todenature adenine nucleotides. Frozen samples werecrushed into powder using a Cryopress (CP-100w;Microtec, Chiba, Japan). The samples were transferredinto ice-cold 70% acetonitrile (1:5, v/v), vortexed imme-diately for 30 s, and centrifuged (10 min, 4 °C, 20,670×g).The supernatant was stored at − 80 °C.
Measurement of purine nucleotide concentration byHPLCPurine nucleotide concentration of kidney extract (10 μl)was measured using a high-performance liquid chroma-tography (HPLC) system (ÄKTApurifier UPC 10; GEHealthcare UK/Amersham, Little Chalfont, Buckingham-shire, UK) with a reverse-phase column (Supelcosil LC-18-T, 250 × 4.6 mm, 5 μm; Sigma-Aldrich, Bellefonte,PA, USA) and a guard column (Supelguard LC-18-T,20 × 4.0 mm; Sigma-Aldrich). All concentrations areexpressed as nmol/g wet weight. For details of the meas-urement, see supporting information.
Measurement of metabolitesCE-TOFMS was performed on an Agilent CE CapillaryElectrophoresis System equipped with an Agilent 6210TOF mass spectrometer, Agilent 1100 isocratic HPLCpump, Agilent G1603A CE-MS adapter kit, and AgilentG1607A CE-ESI-MS sprayer kit (Agilent Technologies,Waldbronn, Germany). Metabolome measurements wereperformed at Human Metabolome Technologies as pre-viously described (Soga and Heiger 2000; Soga et al.2002; Soga et al. 2003). For details of the measurement,see supporting information.
Absolute quantification of metabolites and statisticalanalysesAbsolute quantification was performed for 110 metab-olites, including glycolytic and TCA cycle intermedi-ates, amino acids, and nucleic acids, as previouslydescribed (Subramanian et al. 2017). All metaboliteconcentrations were calculated by normalizing thepeak area of each metabolite to the area of the in-ternal standard and by using standard curves obtainedby single-point (100 μM) calibrations. Hierarchicalcluster analysis, principal component analysis (PCA),and PLS-ROG analysis were performed using propri-etary software, PeakStat and SampleStat, respectively.Partial least squares with rank order of groups (PLS-ROG) is an extended version of PLS that adds a dif-ferential penalty between means of groups in the PLSsubspace, which can distinguish between groups andcan reflect group rank order (Yamamoto n.d.). De-tected metabolites were plotted on metabolic pathway
maps using Visualization and Analysis of Networkscontaining Experimental Data software (Junker et al.2006). Based on the concentration of each metabolitemeasured by CE-TOFMS, energy charge, total adeninenucleotide (TAN) and TAN' were calculated by thefollowing formulas:
Energy charge¼ATPþ 0:5ADP
ATPþ ADPþ AMP
TAN =ATP + ADP + AMP, TAN' = dATP + phosphor-ibosyl diphosphate (PRPP) + adenosine + adenine + in-osine + IMP + hypoxanthine + xanthine + uric acid.ΔhTAN + TAN' was calculated as the TAN + TAN' ofthe reperfused state minus that of the ischemic state.
Western blotting and XOR activity assay of kidneyFor western blotting of kidney lysates, we followed themethod used in our previous reports, with minor modifi-cations (Okabe 1996; Ikegami and Nishino 1986). Fordetails of the method, see supporting information. TheXOR activity of tissue lysates was measured spectro-photometrically by following the increase in the absorb-ance of uric acid at 295 nm (Okabe 1996; Ikegami andNishino 1986). The assay buffer consisted of 50 mM po-tassium phosphate buffer (pH 7.8), 0.4 mM EDTA, 0.15mM xanthine, 0.5 mM NAD+, and 1mM oxonic acid.All measurements were performed at 25 °C under air-saturated conditions.
Quantitative reverse-transcription (qRT-)PCRRNA was extracted from frozen tissue samples, andcomplementary DNA was generated with oligo-dTprimers using an RNeasy Mini Kit (Qiagen GmbH, Hil-den, Germany) and a ReverTra qPCR RT Kit (ToyoboCo., Osaka, Japan) according to the manufacturer’sprotocol, respectively. qPCR amplification was per-formed using the TaqMan Fast Advanced Master Mix(Life Technologies, Carlsbad, CA, USA) in 96-well op-tical plates on an ABI 7500 Fast Real-Time PCR System(Life Technologies). Gene expression was normalized tolevels of 18S rRNA as an internal control and expressedas fold increases using the ΔΔCt method. For details ofthe method, see supporting information.
StatisticsStatistical analyses were performed using SPSS version16.0 (IBM, Chicago, IL, USA), with values expressed asthe mean ± standard error of the mean (SEM), unlessotherwise stated. For analysis of biochemical data, HPLCand qRT-PCR results, one-way analysis of variance(ANOVA) followed by Games-Howell’s test was used tofind statistical differences among groups, and p < 0.05was considered significant. For an untargeted approach
Tani et al. Molecular Medicine (2019) 25:40 Page 4 of 13
in the metabolome analysis, one-way ANOVA was ap-plied to identify metabolites showing statistical differ-ences across groups. The q-value, determined by usingthe Benjamini–Hochberg correction, was applied to ad-just for false positive discovery arising from multipletesting of p-values (adjusted for predicted p < 0.05) (Ben-jamini and Hochberg 1995; Storey 2003).
Study approvalAll experiments using rats were conducted in compli-ance with the guidelines for animal experiments of Nip-pon Medical School, and the study protocol wasapproved by the Institutional Animal Care and UseCommittee at Nippon Medical School (approval number27–004).
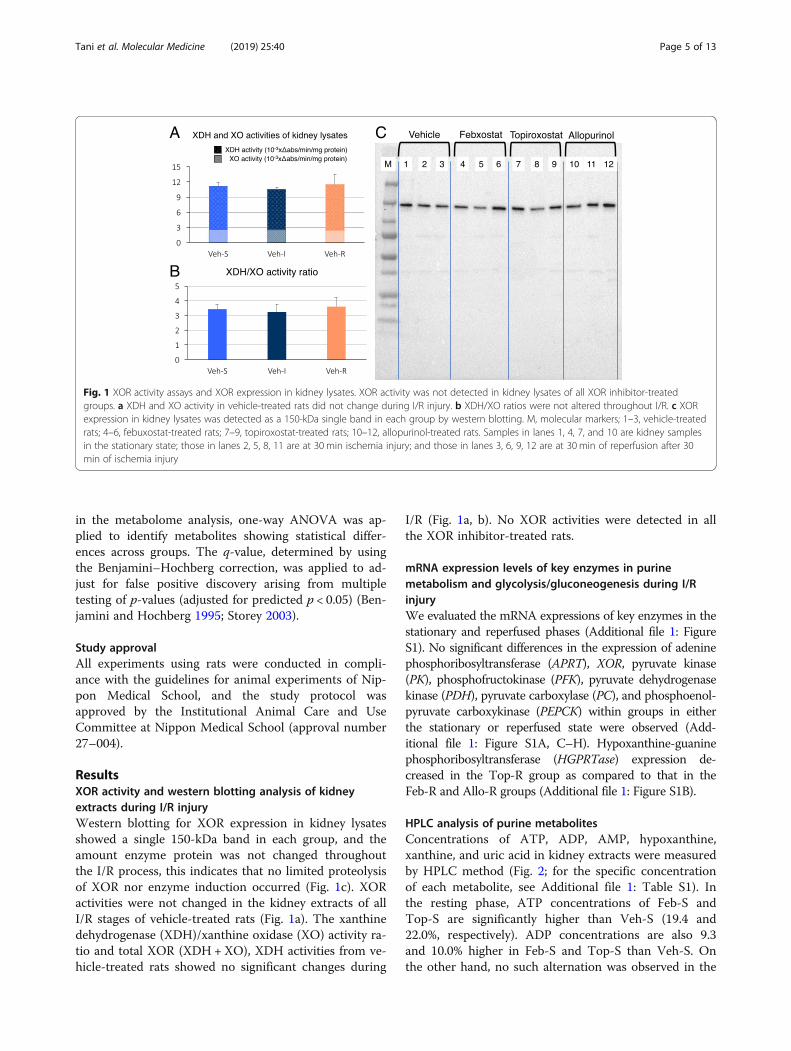
ResultsXOR activity and western blotting analysis of kidneyextracts during I/R injuryWestern blotting for XOR expression in kidney lysatesshowed a single 150-kDa band in each group, and theamount enzyme protein was not changed throughoutthe I/R process, this indicates that no limited proteolysisof XOR nor enzyme induction occurred (Fig. 1c). XORactivities were not changed in the kidney extracts of allI/R stages of vehicle-treated rats (Fig. 1a). The xanthinedehydrogenase (XDH)/xanthine oxidase (XO) activity ra-tio and total XOR (XDH +XO), XDH activities from ve-hicle-treated rats showed no significant changes during
I/R (Fig. 1a, b). No XOR activities were detected in allthe XOR inhibitor-treated rats.
mRNA expression levels of key enzymes in purinemetabolism and glycolysis/gluconeogenesis during I/RinjuryWe evaluated the mRNA expressions of key enzymes in thestationary and reperfused phases (Additional file 1: FigureS1). No significant differences in the expression of adeninephosphoribosyltransferase (APRT), XOR, pyruvate kinase(PK), phosphofructokinase (PFK), pyruvate dehydrogenasekinase (PDH), pyruvate carboxylase (PC), and phosphoenol-pyruvate carboxykinase (PEPCK) within groups in eitherthe stationary or reperfused state were observed (Add-itional file 1: Figure S1A, C–H). Hypoxanthine-guaninephosphoribosyltransferase (HGPRTase) expression de-creased in the Top-R group as compared to that in theFeb-R and Allo-R groups (Additional file 1: Figure S1B).
HPLC analysis of purine metabolitesConcentrations of ATP, ADP, AMP, hypoxanthine,xanthine, and uric acid in kidney extracts were measuredby HPLC method (Fig. 2; for the specific concentrationof each metabolite, see Additional file 1: Table S1). Inthe resting phase, ATP concentrations of Feb-S andTop-S are significantly higher than Veh-S (19.4 and22.0%, respectively). ADP concentrations are also 9.3and 10.0% higher in Feb-S and Top-S than Veh-S. Onthe other hand, no such alternation was observed in the
A C
B
Fig. 1 XOR activity assays and XOR expression in kidney lysates. XOR activity was not detected in kidney lysates of all XOR inhibitor-treatedgroups. a XDH and XO activity in vehicle-treated rats did not change during I/R injury. b XDH/XO ratios were not altered throughout I/R. c XORexpression in kidney lysates was detected as a 150-kDa single band in each group by western blotting. M, molecular markers; 1–3, vehicle-treatedrats; 4–6, febuxostat-treated rats; 7–9, topiroxostat-treated rats; 10–12, allopurinol-treated rats. Samples in lanes 1, 4, 7, and 10 are kidney samplesin the stationary state; those in lanes 2, 5, 8, 11 are at 30 min ischemia injury; and those in lanes 3, 6, 9, 12 are at 30 min of reperfusion after 30min of ischemia injury
Tani et al. Molecular Medicine (2019) 25:40 Page 5 of 13
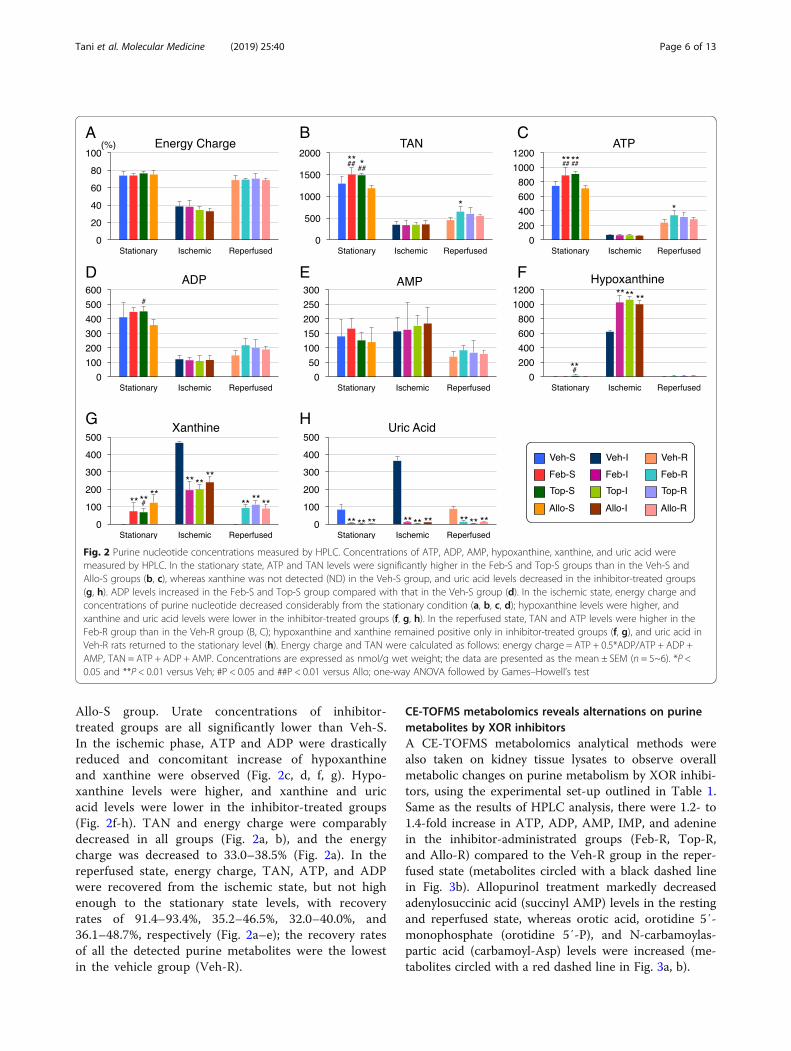
Allo-S group. Urate concentrations of inhibitor-treated groups are all significantly lower than Veh-S.In the ischemic phase, ATP and ADP were drasticallyreduced and concomitant increase of hypoxanthineand xanthine were observed (Fig. 2c, d, f, g). Hypo-xanthine levels were higher, and xanthine and uricacid levels were lower in the inhibitor-treated groups(Fig. 2f-h). TAN and energy charge were comparablydecreased in all groups (Fig. 2a, b), and the energycharge was decreased to 33.0–38.5% (Fig. 2a). In thereperfused state, energy charge, TAN, ATP, and ADPwere recovered from the ischemic state, but not highenough to the stationary state levels, with recoveryrates of 91.4–93.4%, 35.2–46.5%, 32.0–40.0%, and36.1–48.7%, respectively (Fig. 2a–e); the recovery ratesof all the detected purine metabolites were the lowestin the vehicle group (Veh-R).
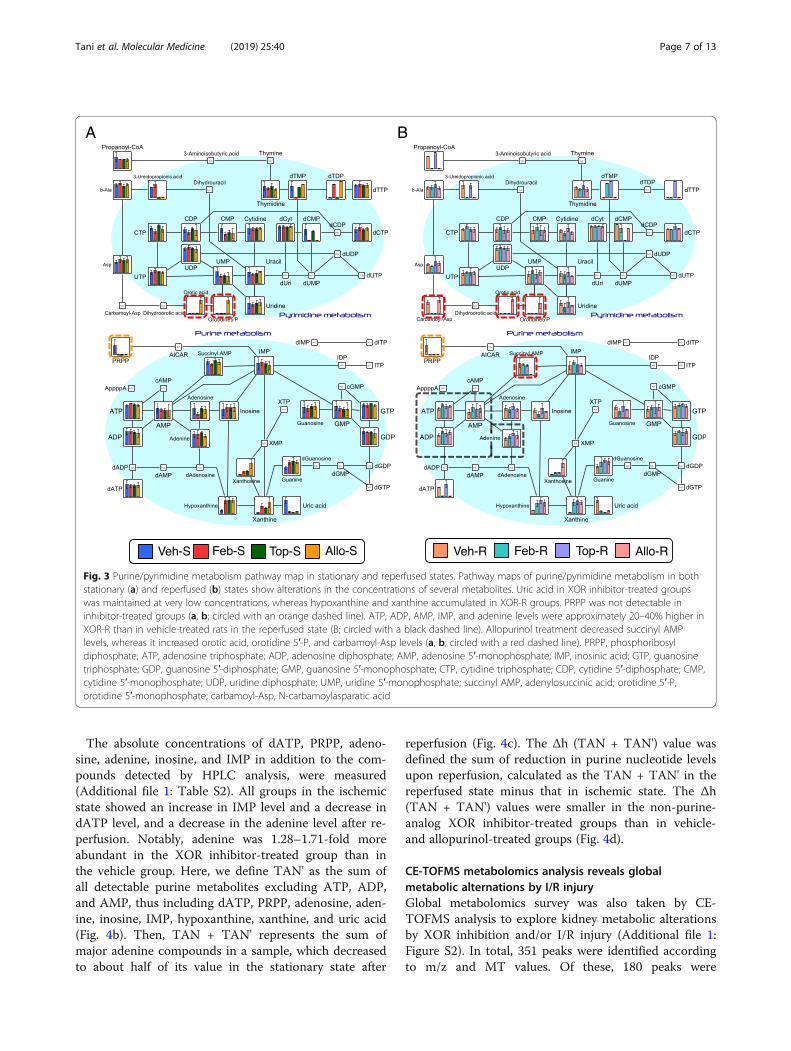
CE-TOFMS metabolomics reveals alternations on purinemetabolites by XOR inhibitorsA CE-TOFMS metabolomics analytical methods werealso taken on kidney tissue lysates to observe overallmetabolic changes on purine metabolism by XOR inhibi-tors, using the experimental set-up outlined in Table 1.Same as the results of HPLC analysis, there were 1.2- to1.4-fold increase in ATP, ADP, AMP, IMP, and adeninein the inhibitor-administrated groups (Feb-R, Top-R,and Allo-R) compared to the Veh-R group in the reper-fused state (metabolites circled with a black dashed linein Fig. 3b). Allopurinol treatment markedly decreasedadenylosuccinic acid (succinyl AMP) levels in the restingand reperfused state, whereas orotic acid, orotidine 5′-monophosphate (orotidine 5′-P), and N-carbamoylas-partic acid (carbamoyl-Asp) levels were increased (me-tabolites circled with a red dashed line in Fig. 3a, b).
A B C
D E
G H
F
Fig. 2 Purine nucleotide concentrations measured by HPLC. Concentrations of ATP, ADP, AMP, hypoxanthine, xanthine, and uric acid weremeasured by HPLC. In the stationary state, ATP and TAN levels were significantly higher in the Feb-S and Top-S groups than in the Veh-S andAllo-S groups (b, c), whereas xanthine was not detected (ND) in the Veh-S group, and uric acid levels decreased in the inhibitor-treated groups(g, h). ADP levels increased in the Feb-S and Top-S group compared with that in the Veh-S group (d). In the ischemic state, energy charge andconcentrations of purine nucleotide decreased considerably from the stationary condition (a, b, c, d); hypoxanthine levels were higher, andxanthine and uric acid levels were lower in the inhibitor-treated groups (f, g, h). In the reperfused state, TAN and ATP levels were higher in theFeb-R group than in the Veh-R group (B, C); hypoxanthine and xanthine remained positive only in inhibitor-treated groups (f, g), and uric acid inVeh-R rats returned to the stationary level (h). Energy charge and TAN were calculated as follows: energy charge = ATP + 0.5*ADP/ATP + ADP +AMP, TAN = ATP + ADP + AMP. Concentrations are expressed as nmol/g wet weight; the data are presented as the mean ± SEM (n = 5~6). *P <0.05 and **P < 0.01 versus Veh; #P < 0.05 and ##P < 0.01 versus Allo; one-way ANOVA followed by Games–Howell’s test
Tani et al. Molecular Medicine (2019) 25:40 Page 6 of 13
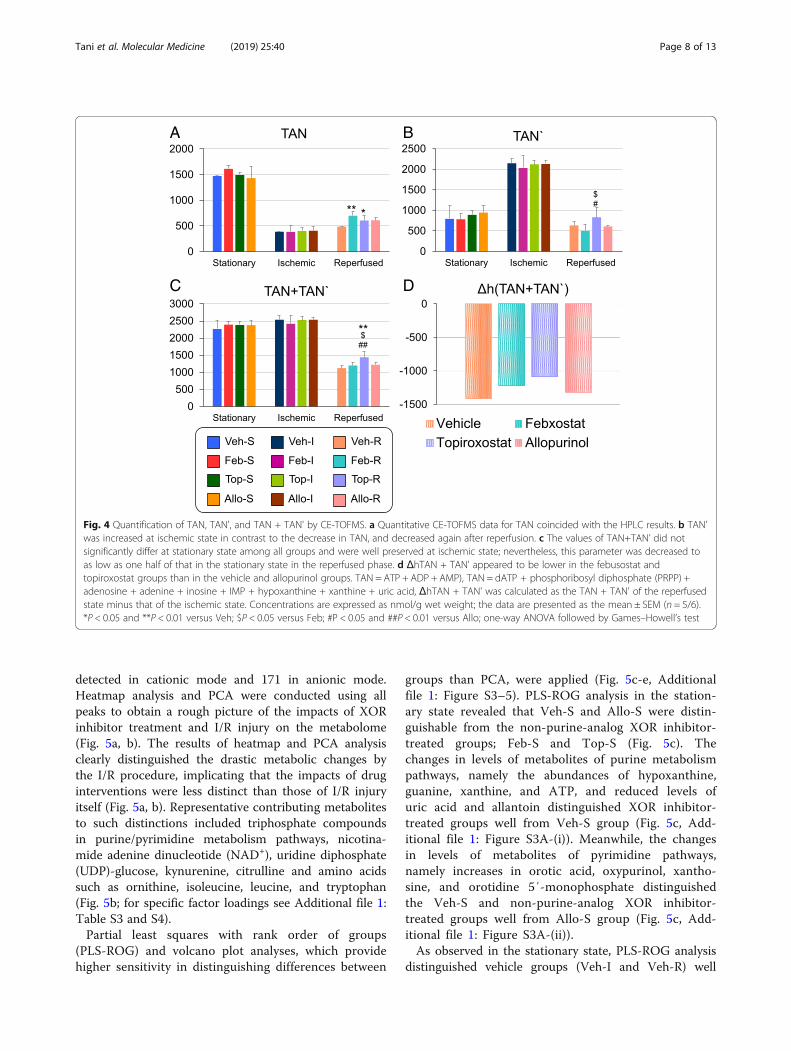
The absolute concentrations of dATP, PRPP, adeno-sine, adenine, inosine, and IMP in addition to the com-pounds detected by HPLC analysis, were measured(Additional file 1: Table S2). All groups in the ischemicstate showed an increase in IMP level and a decrease indATP level, and a decrease in the adenine level after re-perfusion. Notably, adenine was 1.28–1.71-fold moreabundant in the XOR inhibitor-treated group than inthe vehicle group. Here, we define TAN' as the sum ofall detectable purine metabolites excluding ATP, ADP,and AMP, thus including dATP, PRPP, adenosine, aden-ine, inosine, IMP, hypoxanthine, xanthine, and uric acid(Fig. 4b). Then, TAN + TAN' represents the sum ofmajor adenine compounds in a sample, which decreasedto about half of its value in the stationary state after
reperfusion (Fig. 4c). The Δh (TAN + TAN') value wasdefined the sum of reduction in purine nucleotide levelsupon reperfusion, calculated as the TAN + TAN' in thereperfused state minus that in ischemic state. The Δh(TAN + TAN') values were smaller in the non-purine-analog XOR inhibitor-treated groups than in vehicle-and allopurinol-treated groups (Fig. 4d).
CE-TOFMS metabolomics analysis reveals globalmetabolic alternations by I/R injuryGlobal metabolomics survey was also taken by CE-TOFMS analysis to explore kidney metabolic alterationsby XOR inhibition and/or I/R injury (Additional file 1:Figure S2). In total, 351 peaks were identified accordingto m/z and MT values. Of these, 180 peaks were
A B
Fig. 3 Purine/pyrimidine metabolism pathway map in stationary and reperfused states. Pathway maps of purine/pyrimidine metabolism in bothstationary (a) and reperfused (b) states show alterations in the concentrations of several metabolites. Uric acid in XOR inhibitor-treated groupswas maintained at very low concentrations, whereas hypoxanthine and xanthine accumulated in XOR-R groups. PRPP was not detectable ininhibitor-treated groups (a, b; circled with an orange dashed line). ATP, ADP, AMP, IMP, and adenine levels were approximately 20–40% higher inXOR-R than in vehicle-treated rats in the reperfused state (B; circled with a black dashed line). Allopurinol treatment decreased succinyl AMPlevels, whereas it increased orotic acid, orotidine 5′-P, and carbamoyl-Asp levels (a, b; circled with a red dashed line). PRPP, phosphoribosyldiphosphate; ATP, adenosine triphosphate; ADP, adenosine diphosphate; AMP, adenosine 5′-monophosphate; IMP, inosinic acid; GTP, guanosinetriphosphate; GDP, guanosine 5′-diphosphate; GMP, guanosine 5′-monophosphate; CTP, cytidine triphosphate; CDP, cytidine 5′-diphosphate; CMP,cytidine 5′-monophosphate; UDP, uridine diphosphate; UMP, uridine 5′-monophosphate; succinyl AMP, adenylosuccinic acid; orotidine 5′-P,orotidine 5′-monophosphate; carbamoyl-Asp, N-carbamoylasparatic acid
Tani et al. Molecular Medicine (2019) 25:40 Page 7 of 13
detected in cationic mode and 171 in anionic mode.Heatmap analysis and PCA were conducted using allpeaks to obtain a rough picture of the impacts of XORinhibitor treatment and I/R injury on the metabolome(Fig. 5a, b). The results of heatmap and PCA analysisclearly distinguished the drastic metabolic changes bythe I/R procedure, implicating that the impacts of druginterventions were less distinct than those of I/R injuryitself (Fig. 5a, b). Representative contributing metabolitesto such distinctions included triphosphate compoundsin purine/pyrimidine metabolism pathways, nicotina-mide adenine dinucleotide (NAD+), uridine diphosphate(UDP)-glucose, kynurenine, citrulline and amino acidssuch as ornithine, isoleucine, leucine, and tryptophan(Fig. 5b; for specific factor loadings see Additional file 1:Table S3 and S4).Partial least squares with rank order of groups
(PLS-ROG) and volcano plot analyses, which providehigher sensitivity in distinguishing differences between
groups than PCA, were applied (Fig. 5c-e, Additionalfile 1: Figure S3–5). PLS-ROG analysis in the station-ary state revealed that Veh-S and Allo-S were distin-guishable from the non-purine-analog XOR inhibitor-treated groups; Feb-S and Top-S (Fig. 5c). Thechanges in levels of metabolites of purine metabolismpathways, namely the abundances of hypoxanthine,guanine, xanthine, and ATP, and reduced levels ofuric acid and allantoin distinguished XOR inhibitor-treated groups well from Veh-S group (Fig. 5c, Add-itional file 1: Figure S3A-(i)). Meanwhile, the changesin levels of metabolites of pyrimidine pathways,namely increases in orotic acid, oxypurinol, xantho-sine, and orotidine 5′-monophosphate distinguishedthe Veh-S and non-purine-analog XOR inhibitor-treated groups well from Allo-S group (Fig. 5c, Add-itional file 1: Figure S3A-(ii)).As observed in the stationary state, PLS-ROG analysis
distinguished vehicle groups (Veh-I and Veh-R) well
A B
C D
Fig. 4 Quantification of TAN, TAN', and TAN + TAN' by CE-TOFMS. a Quantitative CE-TOFMS data for TAN coincided with the HPLC results. b TAN'was increased at ischemic state in contrast to the decrease in TAN, and decreased again after reperfusion. c The values of TAN+TAN’ did notsignificantly differ at stationary state among all groups and were well preserved at ischemic state; nevertheless, this parameter was decreased toas low as one half of that in the stationary state in the reperfused phase. d ΔhTAN + TAN' appeared to be lower in the febusostat andtopiroxostat groups than in the vehicle and allopurinol groups. TAN = ATP + ADP + AMP), TAN = dATP + phosphoribosyl diphosphate (PRPP) +adenosine + adenine + inosine + IMP + hypoxanthine + xanthine + uric acid, ΔhTAN + TAN' was calculated as the TAN + TAN' of the reperfusedstate minus that of the ischemic state. Concentrations are expressed as nmol/g wet weight; the data are presented as the mean ± SEM (n = 5/6).*P < 0.05 and **P < 0.01 versus Veh; $P < 0.05 versus Feb; #P < 0.05 and ##P < 0.01 versus Allo; one-way ANOVA followed by Games–Howell’s test
Tani et al. Molecular Medicine (2019) 25:40 Page 8 of 13
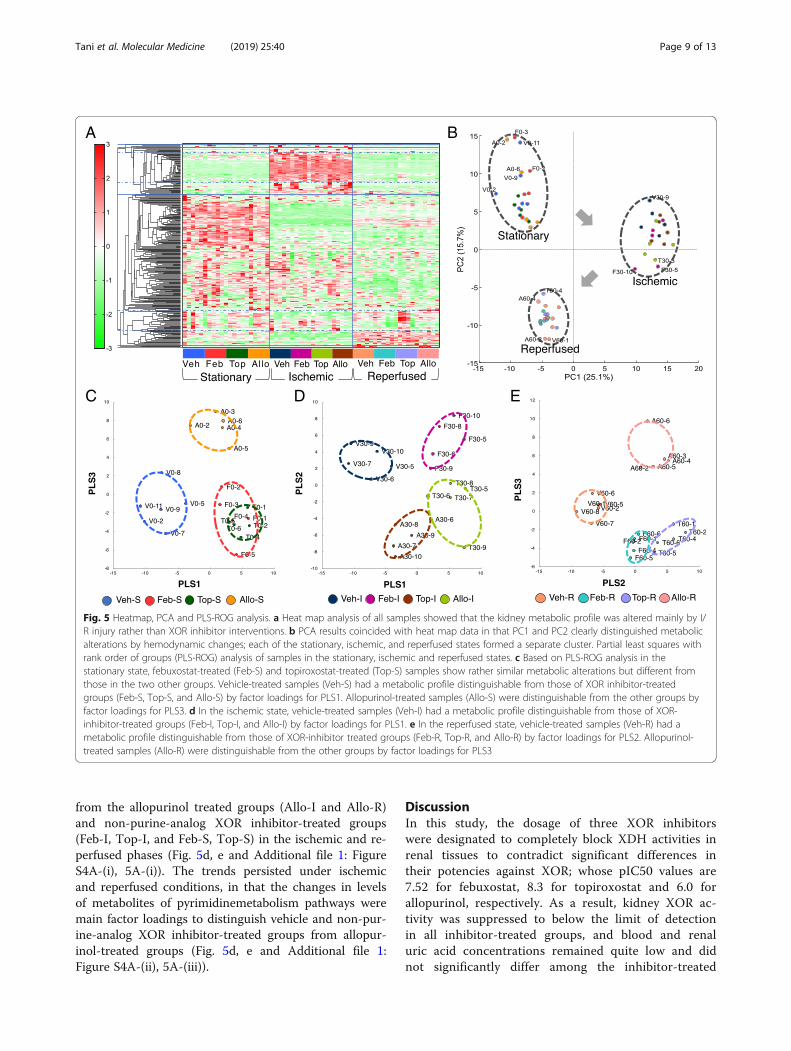
from the allopurinol treated groups (Allo-I and Allo-R)and non-purine-analog XOR inhibitor-treated groups(Feb-I, Top-I, and Feb-S, Top-S) in the ischemic and re-perfused phases (Fig. 5d, e and Additional file 1: FigureS4A-(i), 5A-(i)). The trends persisted under ischemicand reperfused conditions, in that the changes in levelsof metabolites of pyrimidinemetabolism pathways weremain factor loadings to distinguish vehicle and non-pur-ine-analog XOR inhibitor-treated groups from allopur-inol-treated groups (Fig. 5d, e and Additional file 1:Figure S4A-(ii), 5A-(iii)).
DiscussionIn this study, the dosage of three XOR inhibitorswere designated to completely block XDH activities inrenal tissues to contradict significant differences intheir potencies against XOR; whose pIC50 values are7.52 for febuxostat, 8.3 for topiroxostat and 6.0 forallopurinol, respectively. As a result, kidney XOR ac-tivity was suppressed to below the limit of detectionin all inhibitor-treated groups, and blood and renaluric acid concentrations remained quite low and didnot significantly differ among the inhibitor-treated
A
C D E
B
Fig. 5 Heatmap, PCA and PLS-ROG analysis. a Heat map analysis of all samples showed that the kidney metabolic profile was altered mainly by I/R injury rather than XOR inhibitor interventions. b PCA results coincided with heat map data in that PC1 and PC2 clearly distinguished metabolicalterations by hemodynamic changes; each of the stationary, ischemic, and reperfused states formed a separate cluster. Partial least squares withrank order of groups (PLS-ROG) analysis of samples in the stationary, ischemic and reperfused states. c Based on PLS-ROG analysis in thestationary state, febuxostat-treated (Feb-S) and topiroxostat-treated (Top-S) samples show rather similar metabolic alterations but different fromthose in the two other groups. Vehicle-treated samples (Veh-S) had a metabolic profile distinguishable from those of XOR inhibitor-treatedgroups (Feb-S, Top-S, and Allo-S) by factor loadings for PLS1. Allopurinol-treated samples (Allo-S) were distinguishable from the other groups byfactor loadings for PLS3. d In the ischemic state, vehicle-treated samples (Veh-I) had a metabolic profile distinguishable from those of XOR-inhibitor-treated groups (Feb-I, Top-I, and Allo-I) by factor loadings for PLS1. e In the reperfused state, vehicle-treated samples (Veh-R) had ametabolic profile distinguishable from those of XOR-inhibitor treated groups (Feb-R, Top-R, and Allo-R) by factor loadings for PLS2. Allopurinol-treated samples (Allo-R) were distinguishable from the other groups by factor loadings for PLS3
Tani et al. Molecular Medicine (2019) 25:40 Page 9 of 13
groups. Therefore, it was demonstrated that eachXOR inhibitor showed comparably potent inhibitionof XDH in both kidneys and plasma, and alternationson metabolic profiles by administrating XOR inhibi-tors resulted probably not from the differences inXOR inhibition potencies.Multiple reports support a relationship between
organ disorder caused by I/R injury and reactive oxy-gen species (ROS) production (Tsuda et al. 2012;McCord 1985), and the major hypothesis for organprotection by XOR inhibitors is that the suppressionof the conversion of XDH to XO under stressful con-ditions results in oxidative-stress suppression (Tsudaet al. 2012; Omori et al. 2012; McCord 1985). How-ever, this does not fully explain the higher effective-ness of non-purine-analog XOR inhibitors thanallopurinol (Sezai et al. 2015; Kim et al. 2017; Chouet al. 2017; Foody et al. 2017; Shafik 2013; Wang etal. 2015; Khan et al. 2017; Kato et al. 2016). Further-more, no significant change in total XOR activity orelevation of XO-type activity was observed in vehicle-treated group, and western blotting yielded no evi-dence of production of XO-type proteins by limitedproteolysis of XOR in I/R injury in accordance withprevious reports (Okabe 1996), which is contradictoryto oxidative-stress hypothesis (Tsuda et al. 2012;Omori et al. 2012; McCord 1985). Therefore, it is un-likely that the main locus of pathophysiology in I/Rinjury model was the conversion of XDH to XO trig-gered by physical stress nor the differences in theirpotencies of XOR inhibitors.CE-TOFMS identified 351 metabolites, a number
comparable to that in a previous renal tissue metabo-lome study (Wei et al. 2014), suggesting appropriate tis-sue handling and measurement. As ATP catabolismproceeds during tissue sampling and extraction, weassessed energy charge value to evaluate whether or notthe sample processing was adequate as the values reflectthe relative concentration of high-energy phosphates(Atkinson 1968). The levels were approximately 80% inthe control stationary state, which is high when com-pared to previously reported levels (Khatib et al. 2001;Okabe 1996). Thus, sampling was considered to havebeen performed appropriately.To summarize, the drastic metabolic changes by the I/R
injury were much more significant than the impacts by ad-ministrating any XOR-inhibitors. The representative con-tributing factors for alternations of metabolites through I/Rinjury were continual decreases of high-energy purine com-pounds in purine/pyrimidine metabolism pathways, NAD+
and UDP-glucose, and consistent/transient increases ofkynurenine, citrulline, amino acids and marked accumula-tion of hydrolysis products; such as lactate and β-hydroxy-butyrate (Additional file 1: Figure S6A–C and Table S3 and
S4), as reported previously (Weiner 1987). Those changesin the levels of such metabolites are considered result of an-aerobic condition in renal tissues by I/R injury, as they playimportant roles in energy metabolism under static state.The purine and pyrimidine metabolic pathways were
most strongly affected by drug administration asproven by PLS-ROG and volcano analysis. Markeddecreases in ATP and ADP and accumulation ofhypoxanthine, xanthine, and uric acid during ischemiareflected a rapid loss of high-energy phosphates byanaerobic metabolism (purine degradation), in agree-ment with previous reports (Lasley et al. 1988;Stromski et al. 1986; Okabe 1996). Hypoxanthine andxanthine levels were higher, whereas uric acid and
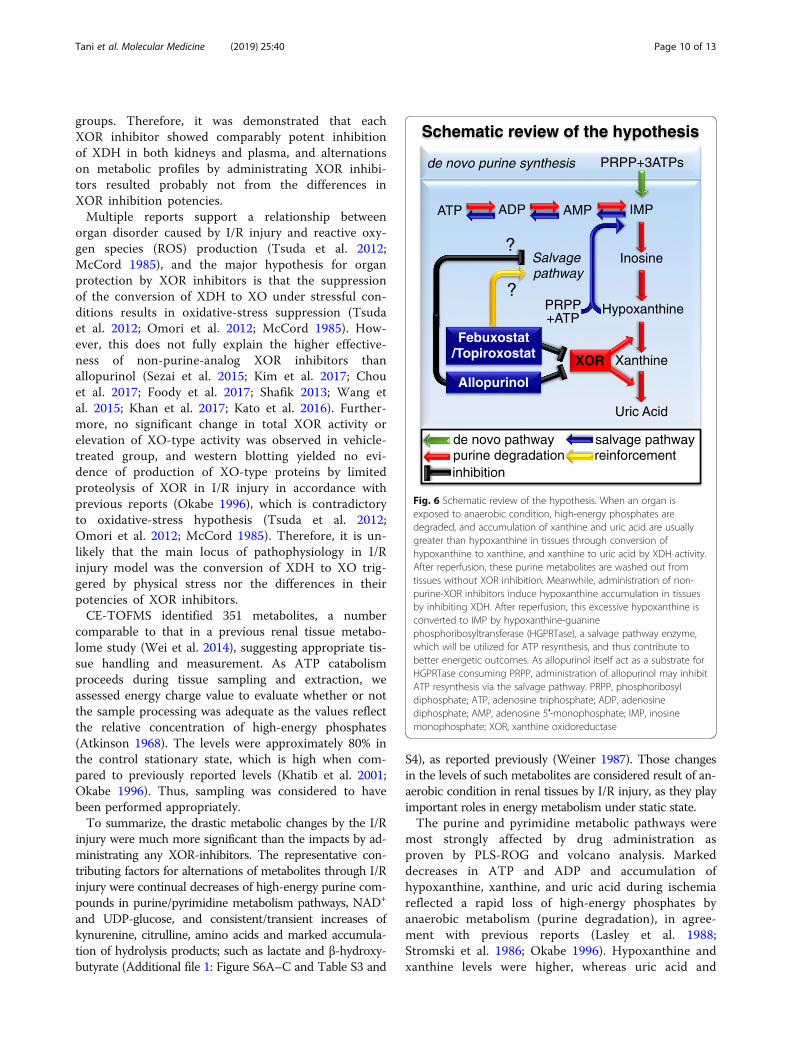
Fig. 6 Schematic review of the hypothesis. When an organ isexposed to anaerobic condition, high-energy phosphates aredegraded, and accumulation of xanthine and uric acid are usuallygreater than hypoxanthine in tissues through conversion ofhypoxanthine to xanthine, and xanthine to uric acid by XDH activity.After reperfusion, these purine metabolites are washed out fromtissues without XOR inhibition. Meanwhile, administration of non-purine-XOR inhibitors induce hypoxanthine accumulation in tissuesby inhibiting XDH. After reperfusion, this excessive hypoxanthine isconverted to IMP by hypoxanthine-guaninephosphoribosyltransferase (HGPRTase), a salvage pathway enzyme,which will be utilized for ATP resynthesis, and thus contribute tobetter energetic outcomes. As allopurinol itself act as a substrate forHGPRTase consuming PRPP, administration of allopurinol may inhibitATP resynthesis via the salvage pathway. PRPP, phosphoribosyldiphosphate; ATP, adenosine triphosphate; ADP, adenosinediphosphate; AMP, adenosine 5′-monophosphate; IMP, inosinemonophosphate; XOR, xanthine oxidoreductase
Tani et al. Molecular Medicine (2019) 25:40 Page 10 of 13
allantoin levels were lower in all XOR inhibitor-treated groups (with no difference among them) thanin the vehicle group, and these are considered the re-sults from inhibition of XDH activities by XOR inhib-itors. The greater values of ATP, ADP and TAN innon-purine-analog XOR inhibitors were observed inthe stationary state. High-energy phosphates markedlydecreased during ischemia, with no significant differ-ences between groups, while abundancy of such me-tabolites reappeared in the reperfused state. The lesssignificant increases induced by non-purine-analogXOR inhibitors in the reperfused state than in thestationary state may have the following reasons:Firstly, reperfused samples are more likely to showgreater variability than stationary samples as they passthrough the I/R injury procedure, which can lead toindividual differences and greater standard deviation(SD) value. Secondly, as the reperfused organs areabout to resynthesize high-energy phosphates, theywere probably in the earlier stage, judging from thelow ATP recovery rates. Therefore, longer observationperiods, i.e., 4 to 6 h. and/or 24 to 48 h. after I/R in-jury, and greater sample volumes per group may en-hance pharmacological effects of XOR inhibitors andfacilitate between-group differences. The barely com-parable mRNA expressions of key enzymes for purineand pyrimidine metabolism between groups impliedthat these metabolic changes were not inducedenzymatically.As the increases in levels of high-energy phosphates,
such as ATP and TAN, have been previously reportedto have organ-protective effects (Stromski et al. 1986;Stromski et al. 1988), our results may explain patho-physiology of organ-protective effects by XOR inhibi-tors, especially non-purine-analog XOR inhibitors. Wepropose the following hypothesis to explain thephenomenon described above (Fig. 6): When an organis exposed to anaerobic condition, high-energy phos-phates are degraded, and accumulation of xanthineand uric acid are usually greater than hypoxanthinein tissues through conversion of hypoxanthine toxanthine, and xanthine to uric acid by XDH activity.After reperfusion, these purine metabolites are washedout from tissues without XDH inhibition. Meanwhile,administration of XOR inhibitors induce hypoxanthineaccumulation in tissues by inhibiting XDH. After reper-fusion, this excessive hypoxanthine is converted to IMPby hypoxanthine-guanine phosphoribosyltransferase(HGPRTase), a salvage pathway enzyme, which will beutilized for ATP resynthesis, and thus contribute tobetter energetic outcomes. The smaller amount of Δh(TAN + TAN') value in the non-purine-analog XOR in-hibitor-treated groups than in vehicle- and allopurinol-treated groups may represent these favorable effects by
non-purine-analog XOR inhibitors, reflecting smalleramount of purine metabolites’ depletion through I/Rinjury (Fig. 4d). Also, as the presence of excess hypo-xanthine in tissues is reported to preserve tissue injuryduring the brain I/R injury (Mink and Johnston 2007),an increase in the hypoxanthine concentration in renaltissue by XOR inhibitors is expected to have similar ef-fects. The result of human HPRT enzyme kinetic data(Xu et al. 1997) implicates increase in IMP productionin direct proportion to the 20 times increased hypoxan-thine concentration, nevertheless confirming incorpor-ation of excessive hypoxanthine for the resynthesis ofhigh-energy phosphate compounds through the salvagepathway, for example, by using stable isotope tracing,would be necessary to strengthen the likelihood of theproposed hypothesis.The reason why concentrations of ATP and TAN in
the allopurinol-treated group were lower than those inthe non-purine-analog XOR inhibitor groups throughoutthe I/R procedure may be because allopurinol affectsother purine and pyrimidine metabolic enzymes (Oka-moto et al. 2003; Takano et al. 2005; Becker et al. 2005).As allopurinol is structurally similar to hypoxanthine, itis metabolized extensively by XOR to oxypurinol, actingas a suicide substrate for XDH to generate oxypurinol; anisomer of xanthine (Additional file 1: Figure S7A-D) (Oka-moto et al. 2003; Takano et al. 2005). Also, allopurinol canact as a substrate for HGPRTase (Nelson et al. 1973),yielding allopurinol-1-ribotide, which is decomposed toallopurinol-1-riboside and allopurinol, with partial con-sumption of PRPP, by cycling of the reactions. Moreover,allopurinol acts as a substrate for orotate phosphoribosyl-transferase, which is converted to orotidine-5′-monopho-sphate with partial consumption of PRPP (Takano et al.2005). Furthermore, allopurinol is converted to oxypurinolriboside, structurally similar to xanthosine (Additionalfile 1: Figure S7E, F), by reverse reaction of purine nucleo-side phosphorylase (Krenitsky et al. 1967) with ribose-1-phosphate, a precursor of PRPP (Tozzi et al. 2006), thusreducing PRPP levels (Kato et al. 2016; Fox et al. 1970).Therefore, the increases in orotic acid, oxypurinol,xanthosine, and orotidine 5′-monophosphate as indicatedby PLS-ROG analysis in allopurinol-treated group stronglyindicates XOR-non-specific metabolic alternations andadditional inhibitory effects on purine/pyrimidine en-zymes by allopurinol. As PRPP and HGPRTase are re-quired for the biosynthesis of IMP from hypoxanthine,administration of allopurinol itself may have suppressedthe purine salvage pathway (Fig. 6). Although these unwel-coming affect by allopurinol on the purine salvage path-way needs further validation, this hypothesis is in goodagreement with previous reports describing superiority ofnon-purine-analog XOR inhibitors over allopurinol inorgan-protective effects (Sezai et al. 2015; Kim et al. 2017;
Tani et al. Molecular Medicine (2019) 25:40 Page 11 of 13

Chou et al. 2017; Foody et al. 2017; Shafik 2013; Wang etal. 2015; Khan et al. 2017; Kato et al. 2016).There are several limitations in our report. Firstly, as the
clinical doses are 2–10% of doses administrated in ourstudy, differences in the potency of XOR inhibition mightinfluence the ability to suppress XOR activity morestrongly at clinical practice. Secondly, purine metabolismdiffers between humans and rodents, in that XOR activityis much lower in humans than in rodents (Murase et al.2016), while HGPRTase activity is higher in humans thanin rodents (Tax and Veerkamp 1978). Finally, uric acid isfurther metabolized to allantoin by uricase, and excretedin the urine in rodents (Wu et al. 1992). In fact, allantoinproduction was suppressed by XOR inhibitor administra-tion (Additional file 1: Figure S6F). Therefore, in-vitro ex-periments using human primary or iPS cells, and in-vivostudies using an animal model having physiological condi-tions and purine metabolism closer to those in humans,with lower XOR activity and uricase and higherHGPRTase activity, are desired.
ConclusionsIn conclusion, we evaluated XOR-inhibitor-inducedmetabolic alterations by CE-TOFMS. Importantly, thedifferences in purine/pyrimidine-pathway alterations be-tween non-purine-analog XOR inhibitors and alopurinolwere in accordance with our hypothesis that inhibitionof XDH results in increases in the adenine nucleotidepool in renal tissues via the salvage pathway, whereasnon-specific effects on enzymes by allopurinol may in-hibit the alternative pathway. Thus, metabolically favor-able changes induced by non-purine-analog XORinhibitors may support organ-protective effects againstmetabolic, degenerative, and kidney diseases. Althoughfurther in-vivo and in-vitro experiments would be neces-sary to elucidate underlying mechanisms, we expect ourhypothesis to be substantiated by further experiments,and non-purine-analog XOR inhibitors to be applied inthe clinic as organ-protective agents in future.
Additional file
Additional file 1 Figure S1. Gene expression of key enzymes for purinemetabolism. Figure S2. Metabolic pathways of all detected metabolites.Figure S3. Top/Bottom Factor Loadings for PLS1/3 and volcano plotanalysis under the stationary state. Figure S4. Top/Bottom FactorLoadings for PLS1/2 and volcano plot analysis under the ischemic state.Figure S5. Top/Bottom Factor Loadings for PLS2/3 and volcano plotanalysis under the reperfused state. Figure S6. Relative peak areas ofmetabolites in kidney lysates as analyzed by CE-TOFMS. Figure S7.Structural similarities between allopurinol-associated metabolites andpurine metabolites. Table S1. Concentrations of purine nucleotide asmeasured by HPLC system. Table S2. Quantitative evaluation ofmetabolites associated with purine nucleotide as measured by CETOFMS. Table S3. Top/Bottom Factor Loadings for PC1 in the stationarystate. Table S4. Top/Bottom Factor Loadings for PC2 in the stationarystate. (PDF 2410 kb)
AbbreviationsADP: Adenosine diphosphate; ALS: Amyotrophic lateral sclerosis;AMP: Adenosine 5′-monophosphate; ATP: Adenosine triphosphate;CDP: Cytidine 5′-diphosphate; CE-TOFMS: Capillary electrophoresis–time-of-flight mass spectrometry; CKD: Chronic kidney disease; CMP: Cytidine 5′-monophosphate; CTP: Cytidine triphosphate; eGFR: Glomerular filtration rate;GTP: Guanosine triphosphate; HGPRTase: Hypoxanthine-guaninephosphoribosyltransferase; HPLC: High-performance liquid chromatography;I/R: Ischemia-reperfusion; IMP: Inosine monophosphate; IMP: Intracellularinosine 5′-monophosphate; MT: Migration time; NAD+: Nicotinamide adeninedinucleotide; NADH: Nicotinamide adenine dinucleotide; PCA: Principalcomponent analysis; PEP: Phosphoenolpyruvic acid; PRPP: Phosphoribosyldiphosphate; S7P: Sedoheptulose 7-phosphate; TAN: Total adeninenucleotide; UMP: Uridine 5′-monophosphate; UTP: Uridine triphosphate;XMP: Xanthosine 5′-phosphate; XO: Xanthine oxidase; XOR: Xanthineoxidoreductase
AcknowledgementsThe authors would like to thank H. Tomatsu (Human MetabolomeTechnologies Inc.) for technical help with metabolome measurements. Weappreciate technical assistance in animal experiments from T. Asakura and S.Kurihara.
Authors’ contributionsTT and KO conceived the experiment. KO, MF and AK conducted theexperiment. TT wrote the manuscript under the guidance of KO and ST. Allauthors reviewed the manuscript. All authors read and approved the finalmanuscript.
FundingMetabolome analyses in this study were supported by the HMT Grant forLeading Research in Metabolomics 2015 from Human MetabolomeTechnologies Inc. The funder had no role in the study design, decision topublish, or preparation of the manuscript.
Availability of data and materialsPlease contact author for data requests.
Ethics approvalAll experiments using rats were conducted in compliance with theguidelines for animal experiments of Nippon Medical School, and the studyprotocol was approved by the Institutional Animal Care and Use Committeeat Nippon Medical School (approval number 27–004).
Consent for publicationNot applicable.
Competing interestsThe authors declare that they have no competing interests.
Received: 4 February 2019 Accepted: 6 August 2019
ReferencesAtkinson DE. The energy charge of the adenylate pool as a regulatory parameter.
Interaction with feedback modifiers. Biochemistry. 1968;7(11):4030–4.Becker MA, Schumacher HRJ, Wortmann RL, MacDonald PA, Eustace D, Palo WA,
et al. Febuxostat compared with allopurinol in patients with hyperuricemiaand gout. N Engl J Med. 2005;353(23):2450–61.
Benjamini Y, Hochberg Y. Controlling the false discovery rate: a practical andpowerful approach to multiple testing. J R Statist Soc serB. 1995;57(1):289–300.
Chou HW, Chiu HT, Tsai CW, Ting IW, Yeh HC, Huang HC, et al. Comparativeeffectiveness of allopurinol, febuxostat and benzbromarone on renal functionin chronic kidney disease patients with hyperuricemia: a 13-year inceptioncohort study. Nephrol Dial Transplant. 2018;33(9):1620–27.
Cunningham SK, Keaveny TV, Fitzgerald P. Effect of allopurinol on tissue ATP,ADP and AMP concentrations in renal ischaemia. Br J Surg. 1974;61(7):562–5.
Foody J, Turpin RS, Tidwell BA, Lawrence D, Schulman KL. Major cardiovascularevents in patients with gout and associated cardiovascular disease or heartfailure and chronic kidney disease initiating a xanthine oxidase inhibitor. AmHealth Drug Benefits. 2017;10(8):393–401.
Tani et al. Molecular Medicine (2019) 25:40 Page 12 of 13
Fox IH, Wyngaarden JB, Kelley WN. Depletion of erythrocytephosphoribosylpyrophosphate in man. N Engl J Med. 1970;283(22):1177–82.
Ikegami T, Nishino T. The presence of desulfo xanthine dehydrogenase inpurified and crude enzyme preparations from rat liver. Arch BiochemBiophys. 1986;247(2):254–60.
Junker BH, Klukas C, Schreiber F. VANTED: a system for advanced data analysisand visualization in the context of biological networks. BMC Bioinformatics.2006;7:109.
Kalim S, Rhee EP. An overview of renal metabolomics. Kidney Int. 2017;91(1):61–9.Kato S, Kato M, Kusano T, Nishino T. New strategy that delays progression of
amyotrophic lateral sclerosis in G1H-G93A transgenic mice: Oral Administrationof Xanthine Oxidoreductase Inhibitors that are not Substrates for the purinesalvage pathway. J Neuropathol Exp Neurol. 2016;75(12):1124–44.
Khan SI, Malhotra RK, Rani N, Sahu AK, Tomar A, Garg S, et al. Febuxostatmodulates MAPK/NF-kappaBp65/TNF-alpha signaling in cardiac ischemia-reperfusion injury. Oxidative Med Cell Longev. 2017;2017:8095825.
Khatib SY, Farah H, El-Migdadi F. Allopurinol enhances adenine nucleotide levelsand improves myocardial function in isolated hypoxic rat heart. BiochemBiokhimiia. 2001;66(3):328–33.
Kim S, Kim HJ, Ahn HS, Oh SW, Han KH, Um TH, et al. Renoprotectiveeffects of febuxostat compared with allopurinol in patients withhyperuricemia: a systematic review and meta-analysis. Kidney Res ClinPract. 2017;36(3):274–81.
Krenitsky TA, Elion GB, Strelitz RA, Hitchings GH. Ribonucleosides of allopurinoland oxoallopurinol. Isolation from human urine, enzymatic synthesis, andcharacterization. J Biol Chem. 1967;242(11):2675–82.
Lasley RD, Ely SW, Berne RM, Mentzer RM Jr. Allopurinol enhanced adeninenucleotide repletion after myocardial ischemia in the isolated rat heart. J ClinInvest. 1988;81(1):16–20.
McCord JM. Oxygen-derived free radicals in postischemic tissue injury. N Engl JMed. 1985;312(3):159–63.
Mink R, Johnston J. The effect of infusing hypoxanthine or xanthine on hypoxic-ischemic brain injury in rabbits. Brain Res. 2007;1147:256–64.
Murase T, Oka M, Nampei M, Miyachi A, Nakamura T. A highly sensitive assay forxanthine oxidoreductase activity using a combination of [(13) C2 ,(15) N2]xanthine and liquid chromatography/triple quadrupole mass spectrometry. JLabel Compds Radiopharm. 2016;59(5):214–20.
Nelson DJ, Bugge CJ, Krasny HC, Elion GB. Formation of nucleotides of (6-14C)allopurinol and (6-14C) oxipurinol in rat tissues and effects on uridinenucleotide pools. Biochem Pharmacol. 1973;22(16):2003–22.
Okabe H. The role of xanthine dehydrogenase (xanthine oxidase) in ischemia-reperfusion injury in rat kidney. Jpn J Nephrol. 1996;38:577–84.
Okamoto K, Eger BT, Nishino T, Kondo S, Pai EF, Nishino T. An extremely potentinhibitor of xanthine oxidoreductase. Crystal structure of the enzyme-inhibitorcomplex and mechanism of inhibition. J Biol Chem. 2003;278(3):1848–55.
Omori H, Kawada N, Inoue K, Ueda Y, Yamamoto R, Matsui I, et al. Use ofxanthine oxidase inhibitor febuxostat inhibits renal interstitial inflammationand fibrosis in unilateral ureteral obstructive nephropathy. Clin Exp Nephrol.2012;16(4):549–56.
Sanchez-Lozada LG, Tapia E, Soto V, Avila-Casado C, Franco M, Wessale JL, et al.Effect of febuxostat on the progression of renal disease in 5/6 nephrectomyrats with and without hyperuricemia. Nephron Physiol. 2008;108(4):p69–78.
Sezai A, Soma M, Nakata K, Osaka S, Ishii Y, Yaoita H, et al. Comparison of febuxostatand allopurinol for hyperuricemia in cardiac surgery patients with chronickidney disease (NU-FLASH trial for CKD). J Cardiol. 2015;66(4):298–303.
Shafik AN. Febuxostat improves the local and remote organ changes induced byintestinal ischemia/reperfusion in rats. Dig Dis Sci. 2013;58(3):650–9.
Soga T, Heiger DN. Amino acid analysis by capillary electrophoresis electrosprayionization mass spectrometry. Anal Chem. 2000;72(6):1236–41.
Soga T, Ohashi Y, Ueno Y, Naraoka H, Tomita M, Nishioka T. Quantitativemetabolome analysis using capillary electrophoresis mass spectrometry. JProteome Res. 2003;2(5):488–94.
Soga T, Ueno Y, Naraoka H, Ohashi Y, Tomita M, Nishioka T. Simultaneousdetermination of anionic intermediates for Bacillus subtilis metabolicpathways by capillary electrophoresis electrospray ionization massspectrometry. Anal Chem. 2002;74(10):2233–9.
Storey JD. The positive false discovery rate: a Bayesian interpretation and the Q-value. Ann Stat. 2003;31(6):2013–35.
Stromski ME, Cooper K, Thulin G, Gaudio KM, Siegel NJ, Shulman RG. Chemicaland functional correlates of postischemic renal ATP levels. Proc Natl Acad SciU S A. 1986;83(16):6142–5.
Stromski ME, van Waarde A, Avison MJ, Thulin G, Gaudio KM, Kashgarian M, et al.Metabolic and functional consequences of inhibiting adenosine deaminaseduring renal ischemia in rats. J Clin Invest. 1988;82(5):1694–9.
Subramanian P, Oh BJ, Mani V, Lee JK, Lee CM, Sim JS, et al. DifferentialMetabolic Profiles during the Developmental Stages of Plant-ParasiticNematode Meloidogyne incognita. Int J Mol Sci. 2017;18(7):1351. https://doi.org/10.3390/ijms18071351.
Takano Y, Hase-Aoki K, Horiuchi H, Zhao L, Kasahara Y, Kondo S, et al. Selectivityof febuxostat, a novel non-purine inhibitor of xanthine oxidase/xanthinedehydrogenase. Life Sci. 2005;76(16):1835–47.
Tanaka K, Nakayama M, Kanno M, Kimura H, Watanabe K, Tani Y, et al.Renoprotective effects of febuxostat in hyperuricemic patients with chronickidney disease: a parallel-group, randomized, controlled trial. Clin ExpNephrol. 2015;19(6):1044–53.
Tax WJ, Veerkamp JH. Phosphoribosylpyrophosphate in erythrocytes of tenmammalian species: concentration, synthesis and degradation. CompBiochem Physiol B. 1978;59(3):219–22.
Tozzi MG, Camici M, Mascia L, Sgarrella F, Ipata PL. Pentose phosphates innucleoside interconversion and catabolism. FEBS J. 2006;273(6):1089–101.
Tsuda H, Kawada N, Kaimori JY, Kitamura H, Moriyama T, Rakugi H, et al.Febuxostat suppressed renal ischemia-reperfusion injury via reducedoxidative stress. Biochem Biophys Res Commun. 2012;427(2):266–72.
Tsuruta Y, Mochizuki T, Moriyama T, Itabashi M, Takei T, Tsuchiya K, et al.Switching from allopurinol to febuxostat for the treatment of hyperuricemiaand renal function in patients with chronic kidney disease. Clin Rheumatol.2014;33(11):1643–8.
Wang S, Li Y, Song X, Wang X, Zhao C, Chen A, et al. Febuxostat pretreatmentattenuates myocardial ischemia/reperfusion injury via mitochondrialapoptosis. J Transl Med. 2015;13:209.
Wei Q, Xiao X, Fogle P, Dong Z. Changes in metabolic profiles during acutekidney injury and recovery following ischemia/reperfusion. PLoS One. 2014;9(9):e106647.
Weiner MW. NMR spectroscopy for clinical medicine. Animal models and clinicalexamples. Ann N Y Acad Sci. 1987;508:287–99.
Whelton A, Macdonald PA, Zhao L, Hunt B, Gunawardhana L. Renal function in gout:long-term treatment effects of febuxostat. J Clin Rheumatol. 2011;17(1):7–13.
Wu XW, Muzny DM, Lee CC, Caskey CT. Two independent mutational events in theloss of urate oxidase during hominoid evolution. J Mol Evol. 1992;34(1):78–84.
Xu Y, Eads J, Sacchettini JC, Grubmeyer C. Kinetic mechanism of humanhypoxanthine-guanine phosphoribosyltransferase: rapid phosphoribosyltransfer chemistry. Biochemistry. 1997;36(12):3700–12.
Yamamoto H. PLS-ROG: partial least squares with rank order of groups [publishedonline ahead of print February 24, 2017]. J Chemometrics. https://doi.org/10.1002/cem.2883.
Publisher’s NoteSpringer Nature remains neutral with regard to jurisdictional claims inpublished maps and institutional affiliations.
Tani et al. Molecular Medicine (2019) 25:40 Page 13 of 13