Embed Size (px)
Citation preview
Microstructure and function of the thyroid gland may relate to feed
efficiency in the bovine
J. Ormon1, S. Bourgon1, J. Munro1, A. Macdonald2, S. Lam2,
S. Miller2,3, Y. Montanholi1
1 2 3
1
2
3
4
5
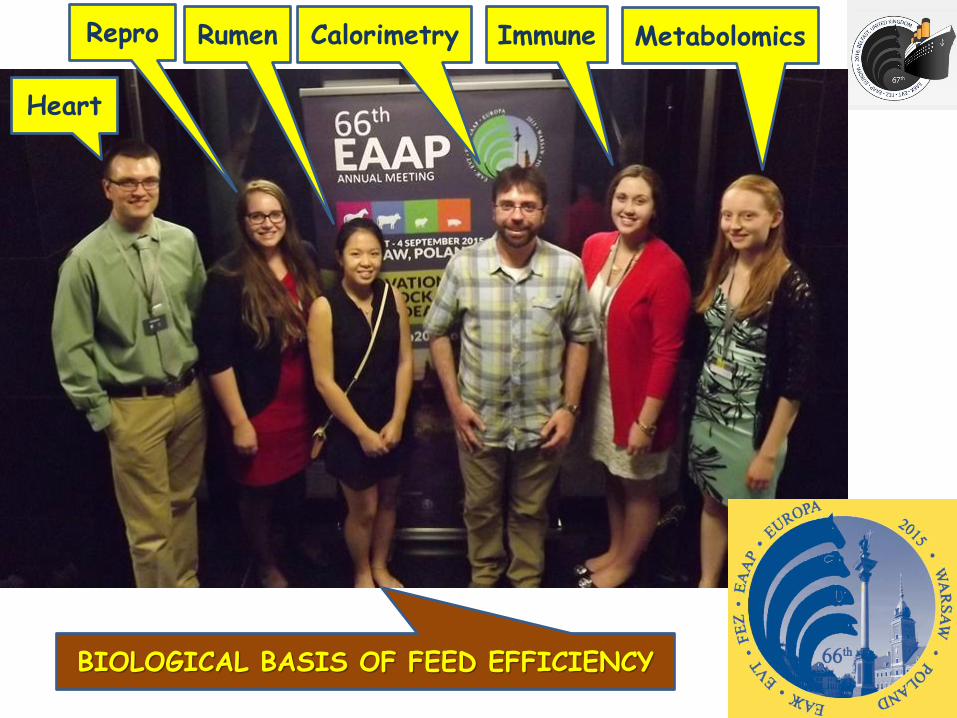
Metabolomics Immune Calorimetry Rumen Repro
Heart
BIOLOGICAL BASIS OF FEED EFFICIENCY
Outline
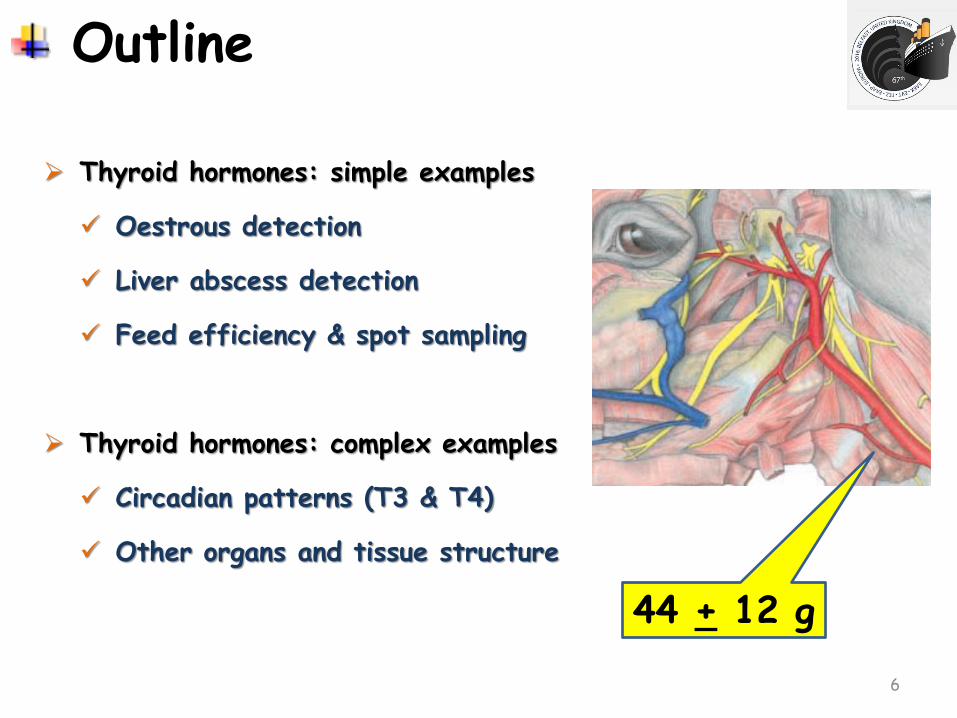
Thyroid hormones: simple examples
Oestrous detection
Liver abscess detection
Feed efficiency & spot sampling
Thyroid hormones: complex examples
Circadian patterns (T3 & T4)
Other organs and tissue structure
6
44 + 12 g
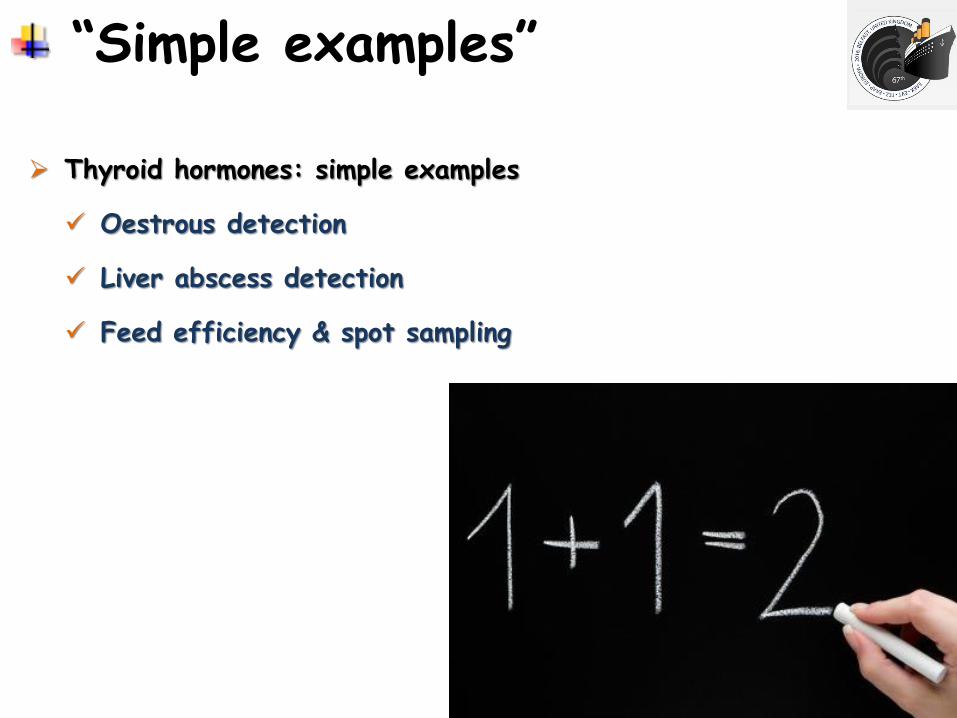
“Simple examples”
Thyroid hormones: simple examples
Oestrous detection
Liver abscess detection
Feed efficiency & spot sampling
7
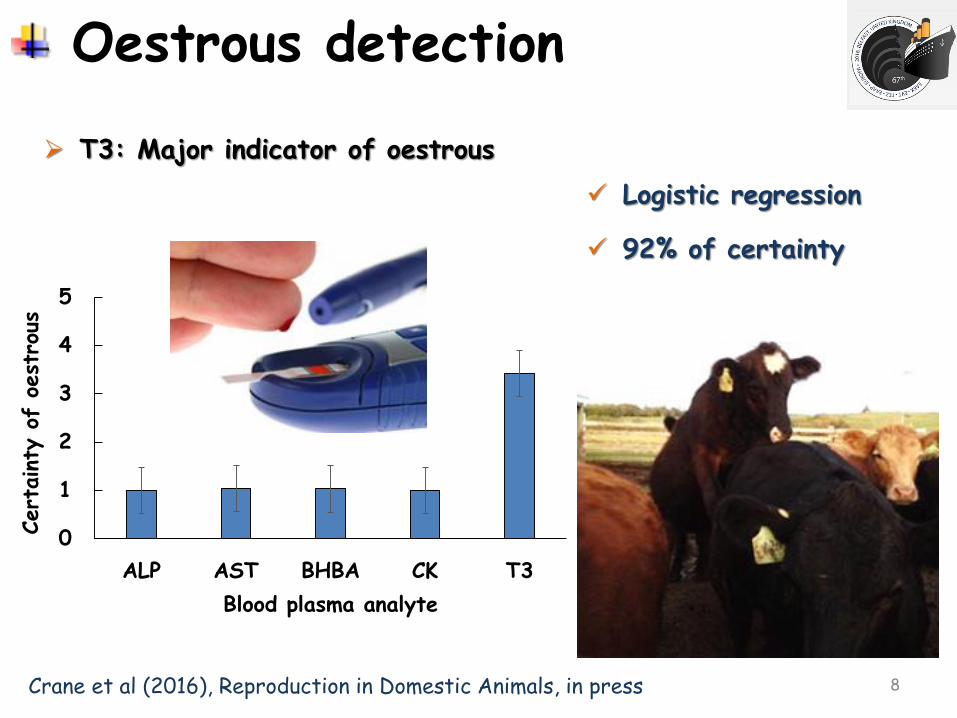
Oestrous detection
T3: Major indicator of oestrous
8 Crane et al (2016), Reproduction in Domestic Animals, in press
0
1
2
3
4
5
ALP AST BHBA CK T3
Cert
ainty
of
oest
rous
Blood plasma analyte
Logistic regression
92% of certainty
Biological characterization of the estrous cycle in lactating Holstein cows
Y. Montanholi1, S. Bourgon1, A. Macdonald2, P. Park2, S. Lam2, M.
Kozak2, B. Potvin2, K. Colliver2, L. Haas2, A. Rocha2, S. Miller2,3
1 2 3
9
Session # 70
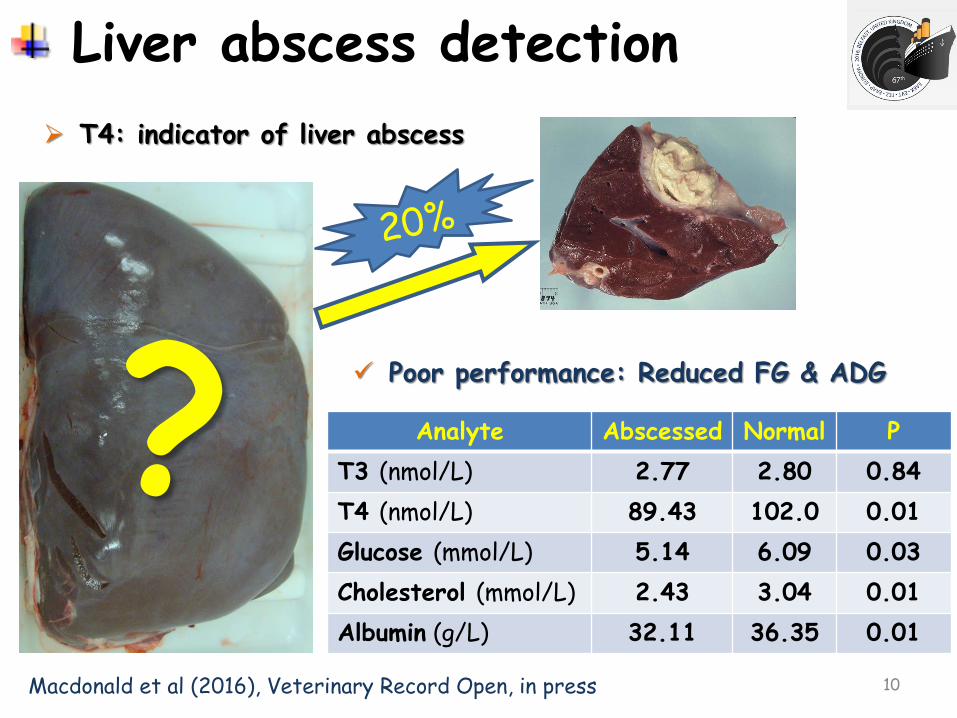
Liver abscess detection
T4: indicator of liver abscess
10 Macdonald et al (2016), Veterinary Record Open, in press
Poor performance: Reduced FG & ADG
Analyte Abscessed Normal P
T3 (nmol/L) 2.77 2.80 0.84
T4 (nmol/L) 89.43 102.0 0.01
Glucose (mmol/L) 5.14 6.09 0.03
Cholesterol (mmol/L) 2.43 3.04 0.01
Albumin (g/L) 32.11 36.35 0.01
?
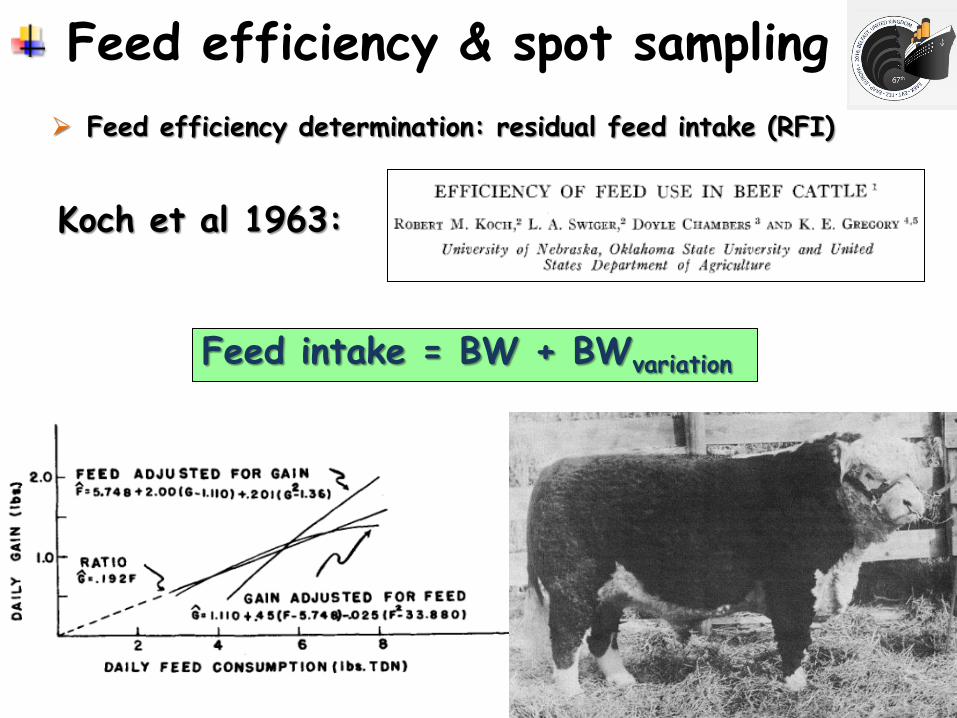
Feed efficiency & spot sampling
Feed efficiency determination: residual feed intake (RFI)
11
Koch et al 1963:
Feed intake = BW + BWvariation
Feed efficiency & spot sampling
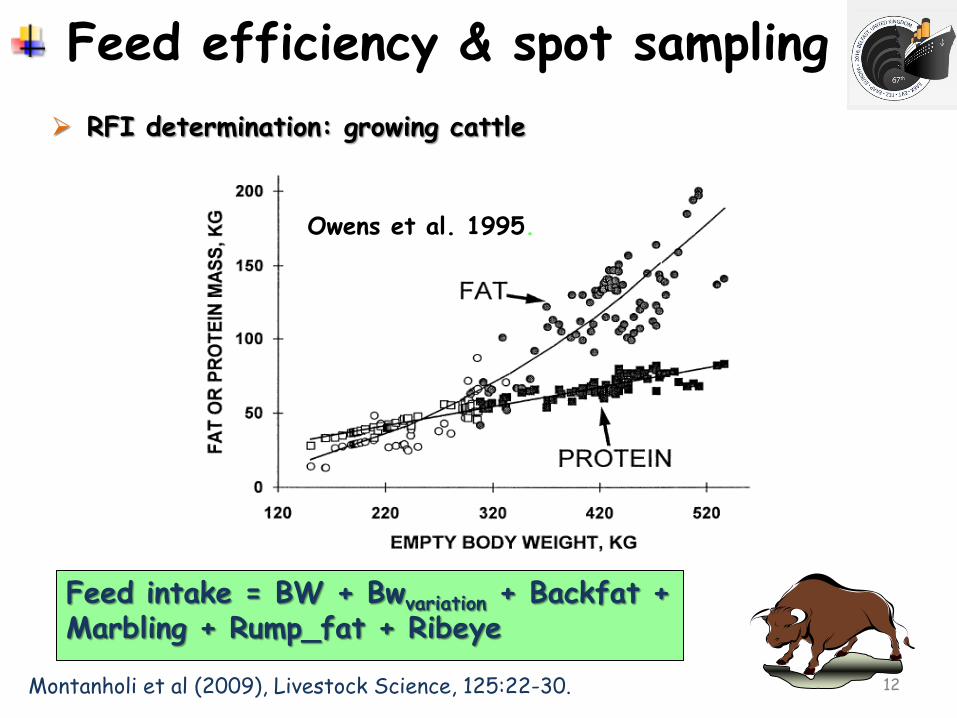
12
Owens et al. 1995.
Feed intake = BW + Bwvariation + Backfat + Marbling + Rump_fat + Ribeye
RFI determination: growing cattle
Montanholi et al (2009), Livestock Science, 125:22-30.
Feed efficiency & spot sampling
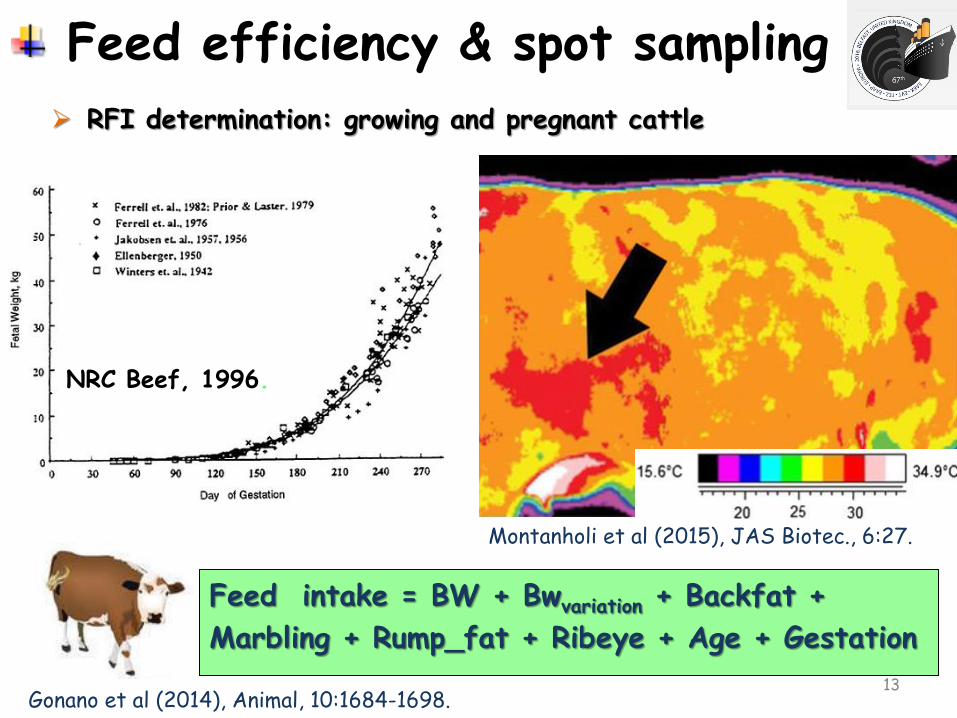
13 Gonano et al (2014), Animal, 10:1684-1698.
Feed intake = BW + Bwvariation + Backfat +
Marbling + Rump_fat + Ribeye + Age + Gestation
RFI determination: growing and pregnant cattle
NRC Beef, 1996.
Montanholi et al (2015), JAS Biotec., 6:27.
Feed efficiency & spot sampling
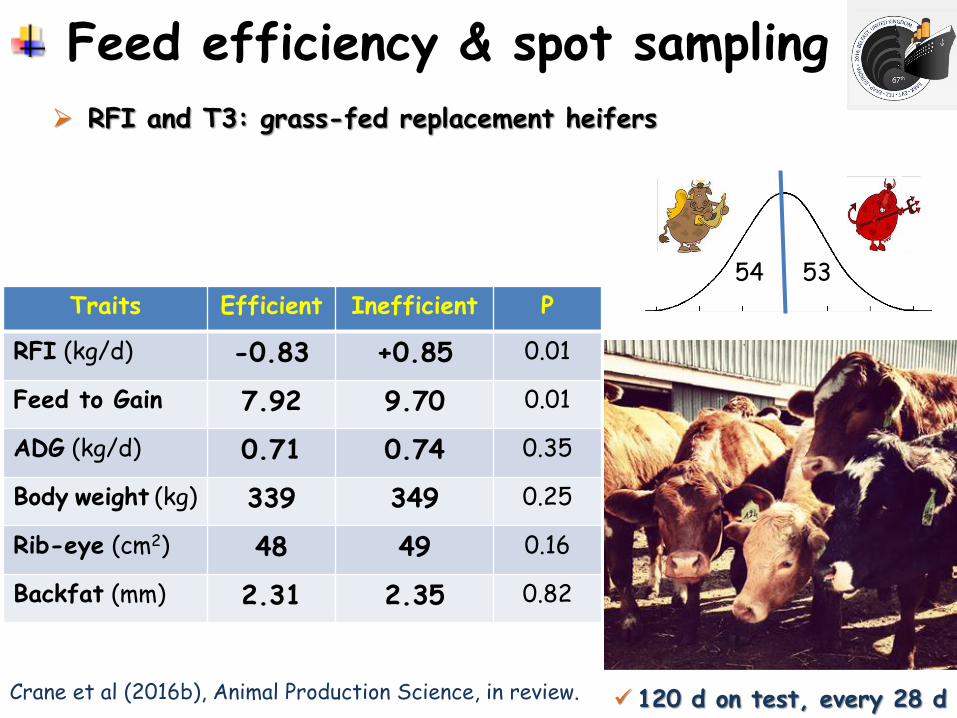
14 Crane et al (2016b), Animal Production Science, in review.
RFI and T3: grass-fed replacement heifers
120 d on test, every 28 d
Traits Efficient Inefficient P
RFI (kg/d) -0.83 +0.85 0.01
Feed to Gain 7.92 9.70 0.01
ADG (kg/d) 0.71 0.74 0.35
Body weight (kg) 339 349 0.25
Rib-eye (cm2) 48 49 0.16
Backfat (mm) 2.31 2.35 0.82
54 53
Mean cell hemoglobin (pg)
16.0 16.4 0.01
Red blood cell count (106 cells/uL)
7.65 7.67 0.92
Feed efficiency & spot sampling
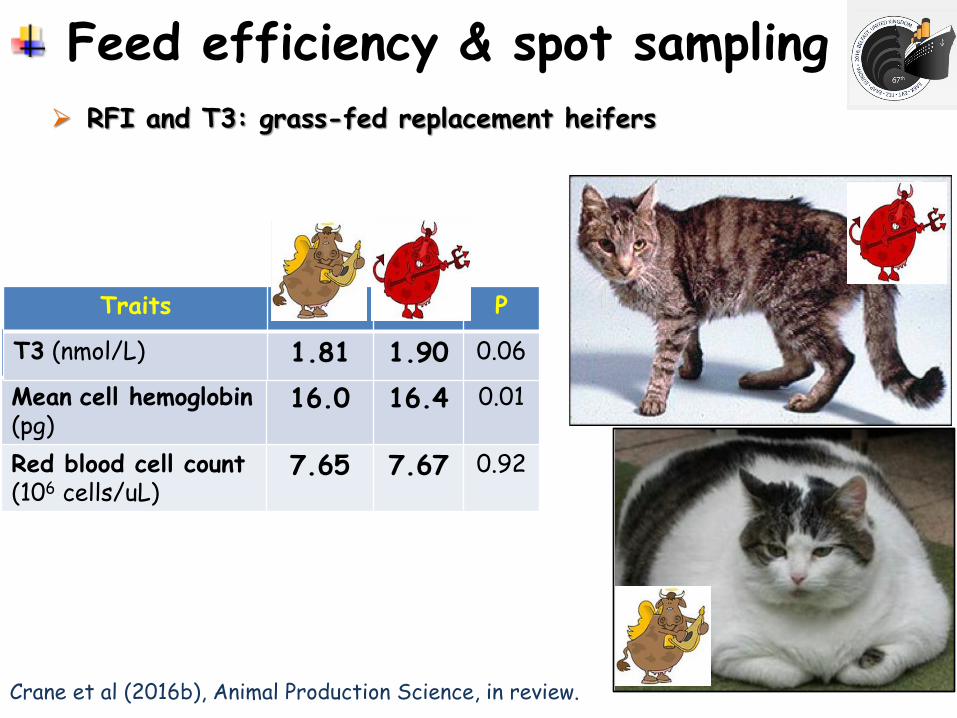
15 Crane et al (2016b), Animal Production Science, in review.
RFI and T3: grass-fed replacement heifers
Traits P
T3 (nmol/L) 1.81 1.90 0.06
Feed efficiency & spot sampling
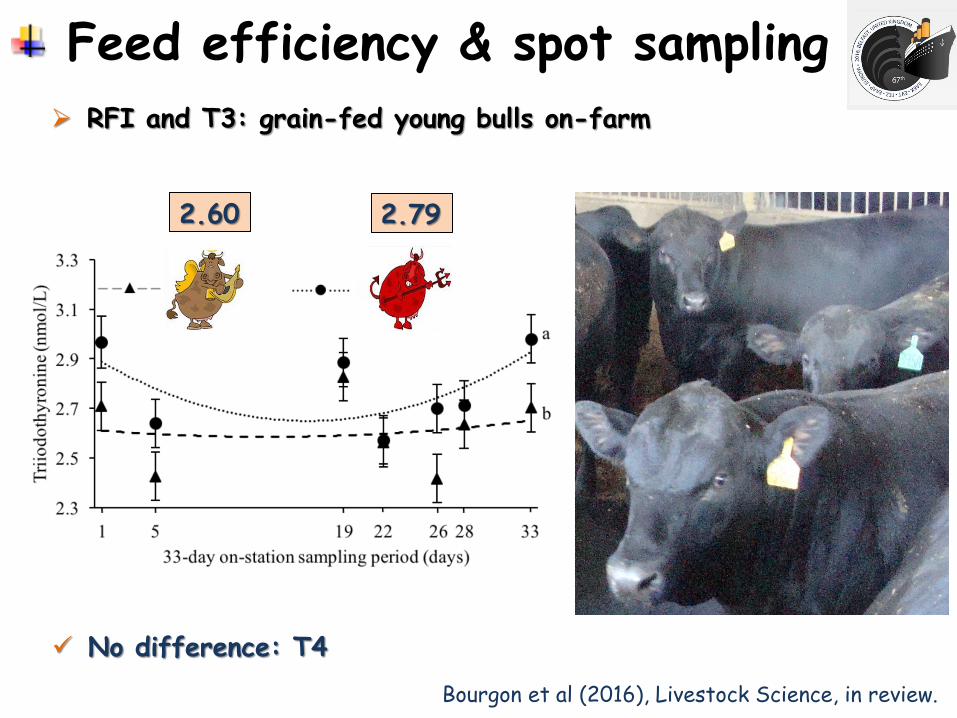
16 Bourgon et al (2016), Livestock Science, in review.
RFI and T3: grain-fed young bulls on-farm
No difference: T4
2.79 2.60
Feed efficiency & spot sampling
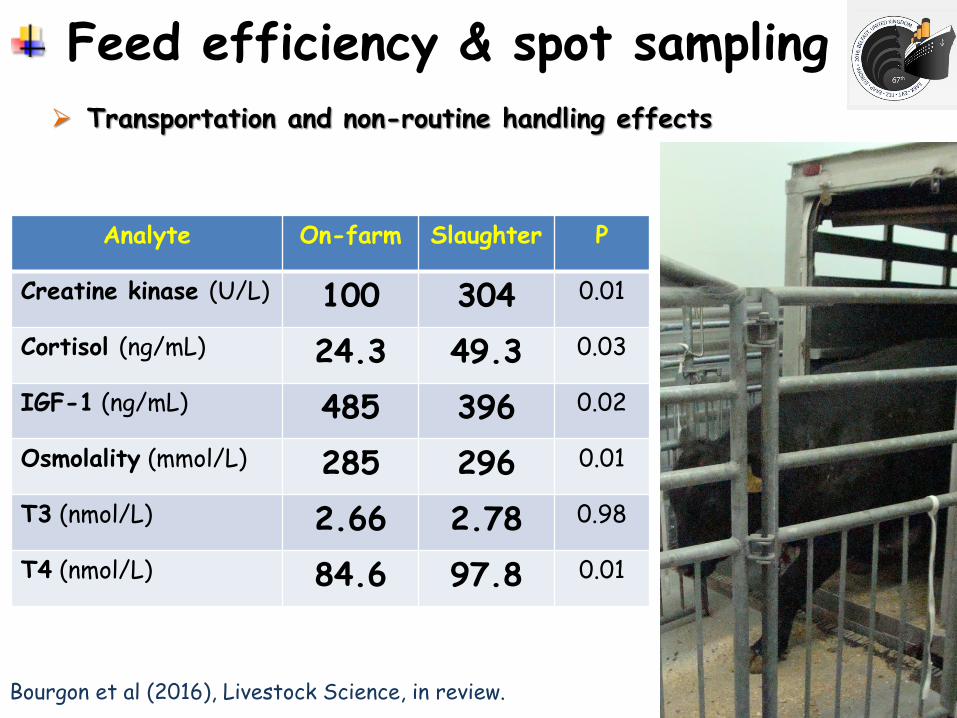
17 Bourgon et al (2016), Livestock Science, in review.
Transportation and non-routine handling effects
Analyte On-farm Slaughter P
Creatine kinase (U/L) 100 304 0.01
Cortisol (ng/mL) 24.3 49.3 0.03
IGF-1 (ng/mL) 485 396 0.02
Osmolality (mmol/L) 285 296 0.01
T3 (nmol/L) 2.66 2.78 0.98
T4 (nmol/L) 84.6 97.8 0.01
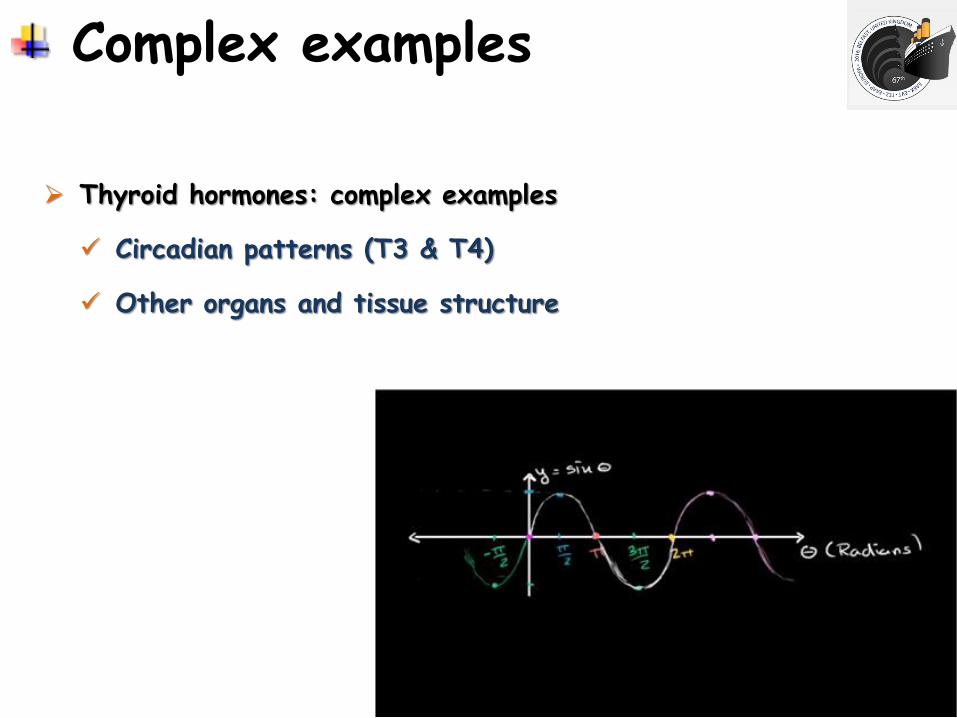
Complex examples
Thyroid hormones: complex examples
Circadian patterns (T3 & T4)
Other organs and tissue structure
18
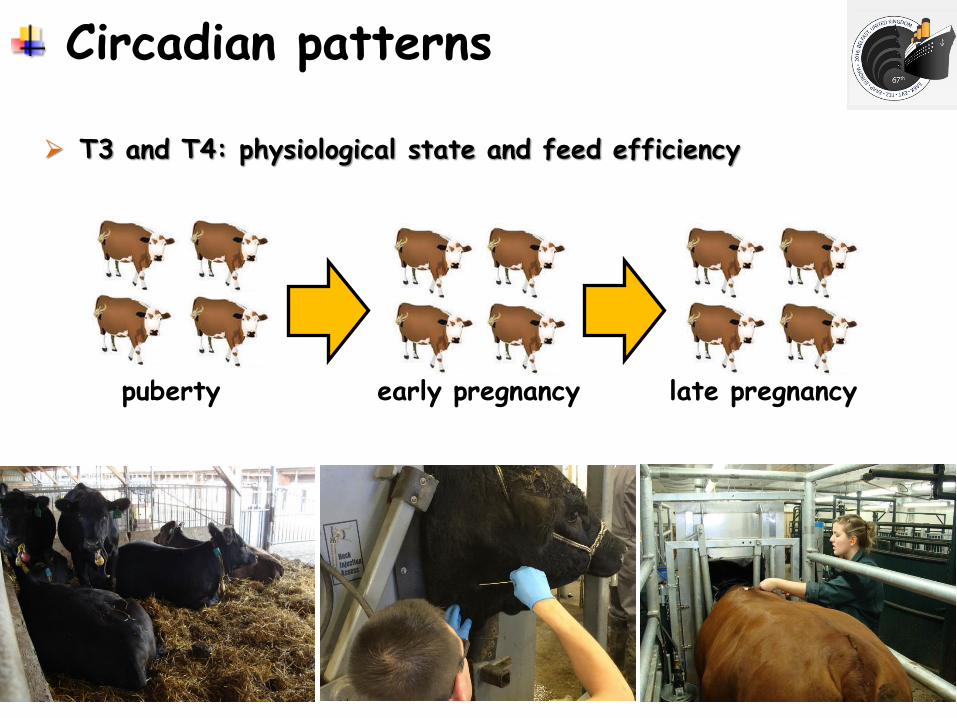
Circadian patterns
T3 and T4: physiological state and feed efficiency
19
puberty early pregnancy late pregnancy
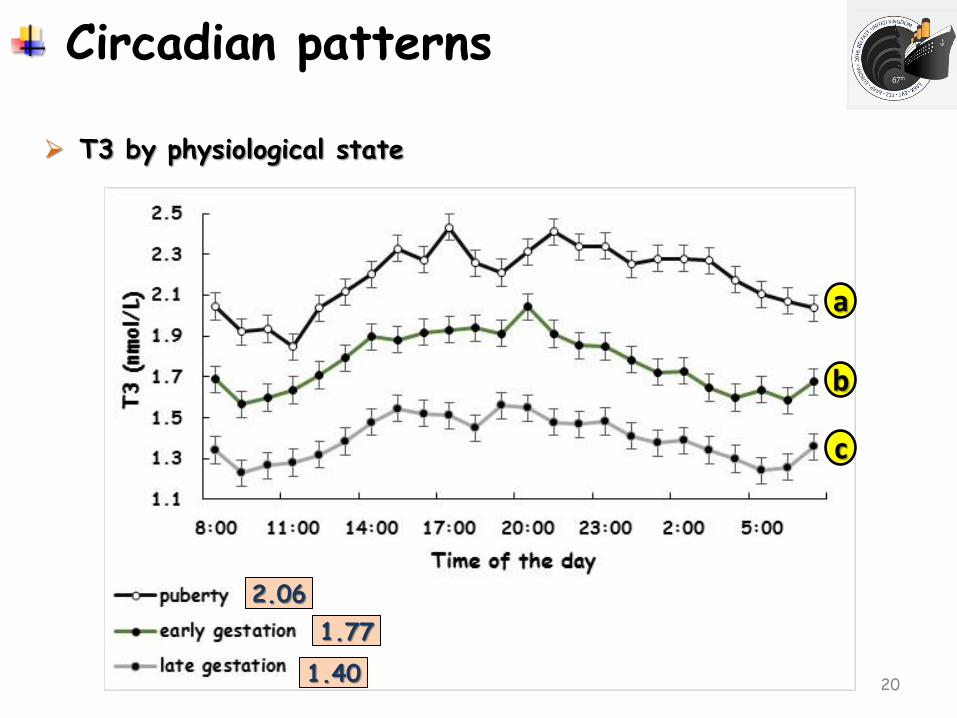
Circadian patterns
T3 by physiological state
20
2.06
1.77
1.40
a
b
c
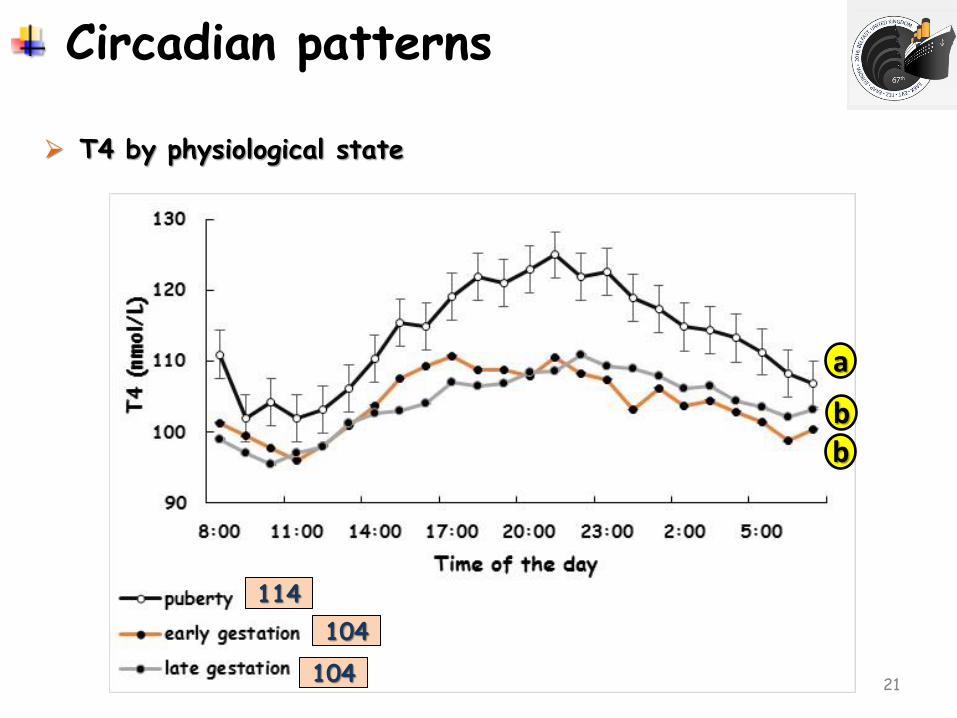
Circadian patterns
T4 by physiological state
21
114
104
104
a
b b
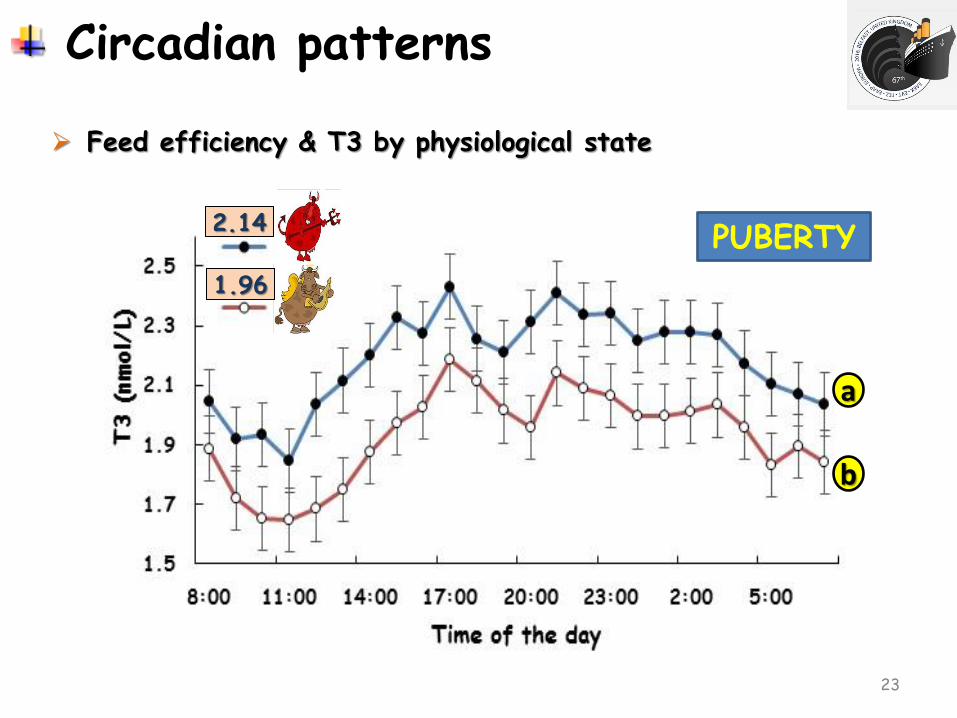
Circadian patterns
Feed efficiency & T3 by physiological state
23
a
b
1.96
2.14 PUBERTY
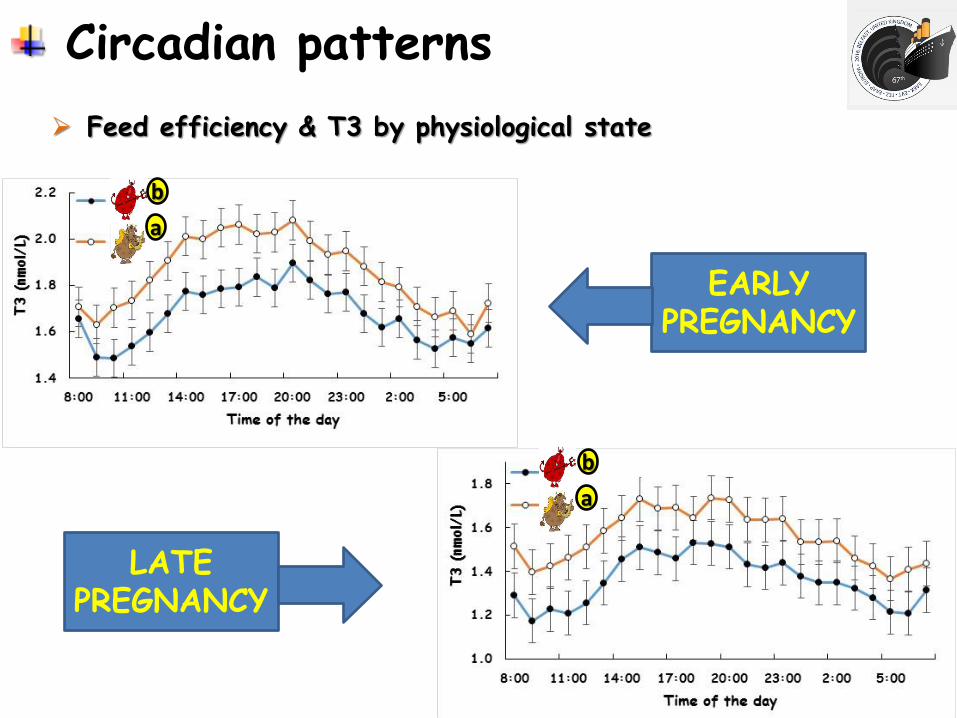
Circadian patterns
Feed efficiency & T3 by physiological state
24
LATE PREGNANCY
EARLY PREGNANCY
a
b
a
b
Circadian patterns
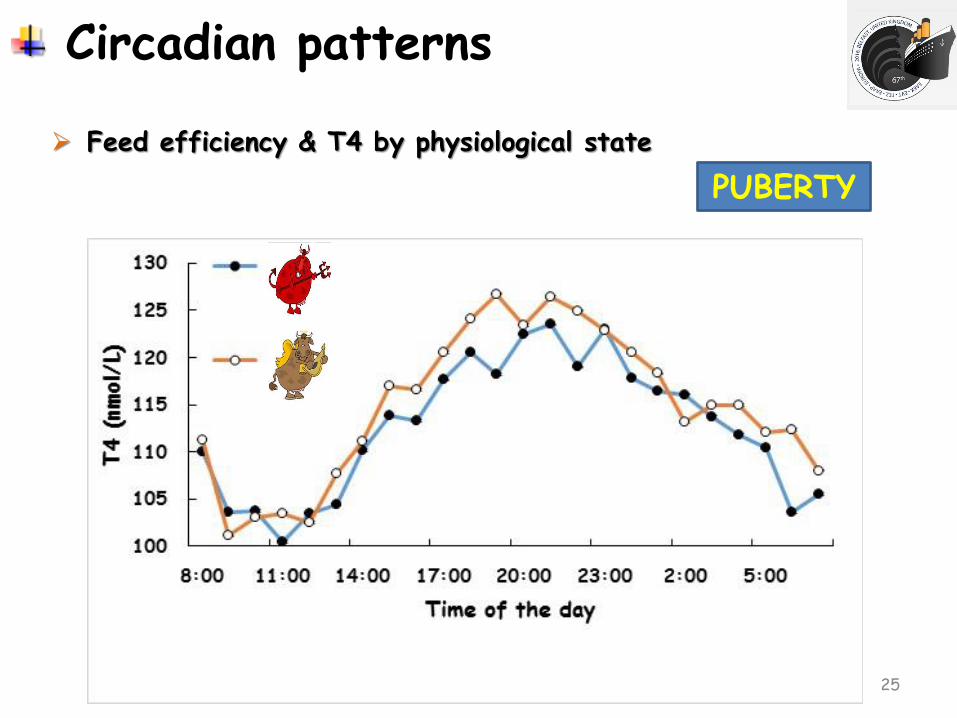
Feed efficiency & T4 by physiological state
25
PUBERTY
Circadian patterns
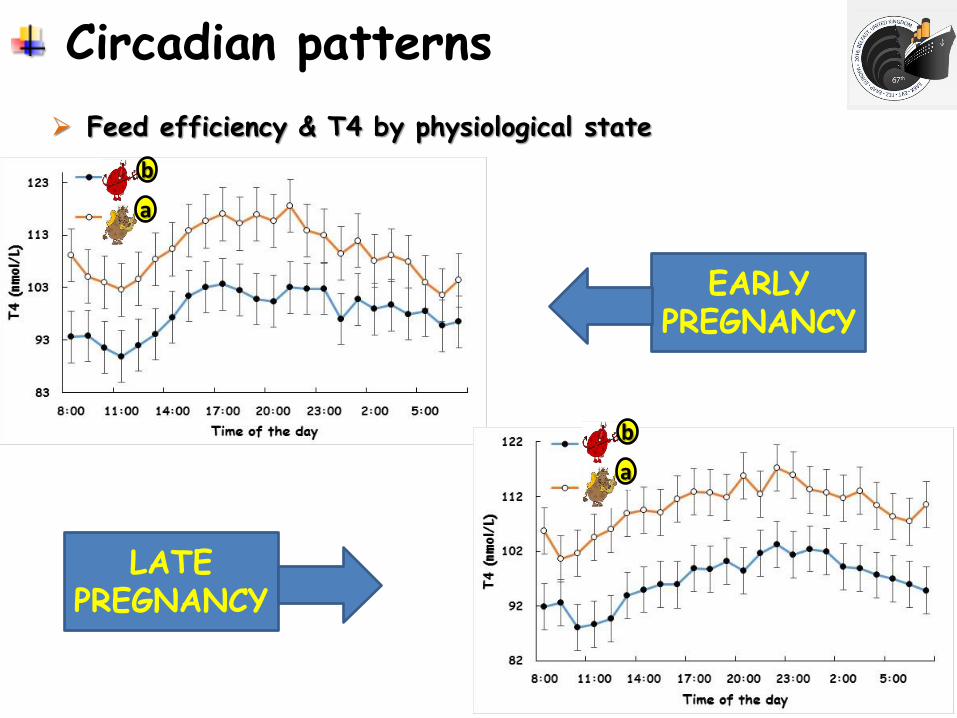
Feed efficiency & T4 by physiological state
26
LATE PREGNANCY
EARLY PREGNANCY
b
a
b
a
Circadian patterns
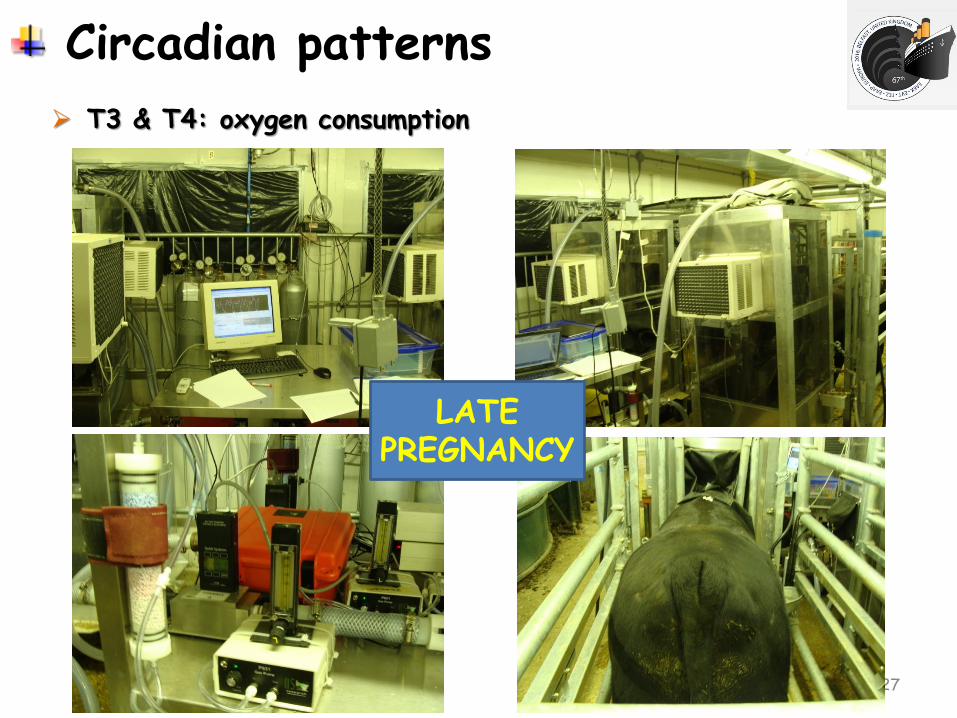
T3 & T4: oxygen consumption
27
LATE PREGNANCY
Circadian patterns
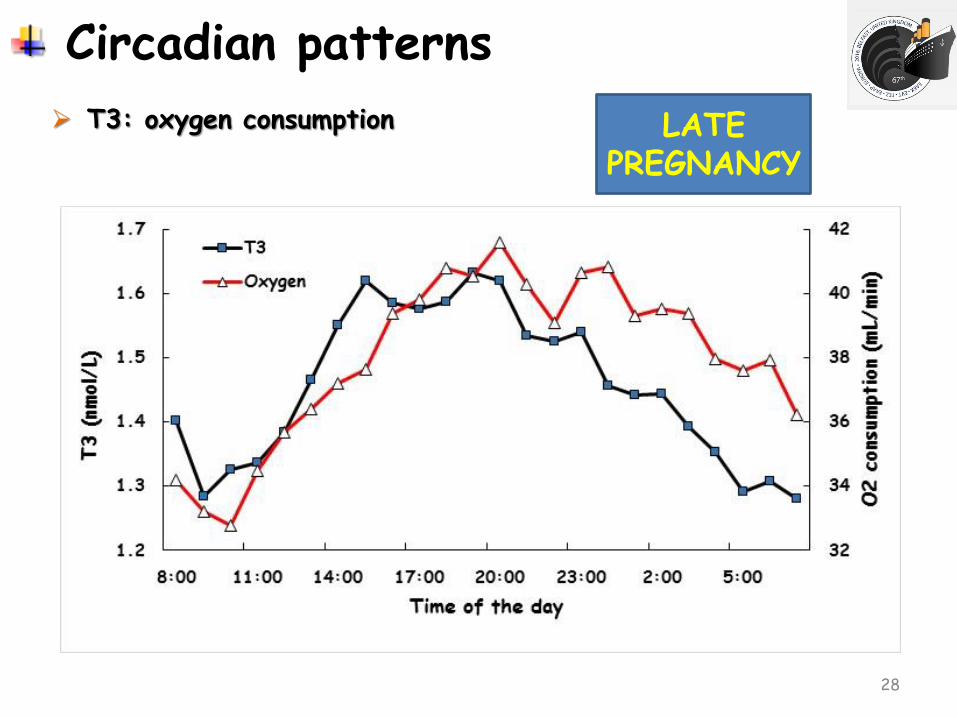
T3: oxygen consumption
28
LATE PREGNANCY
Circadian patterns
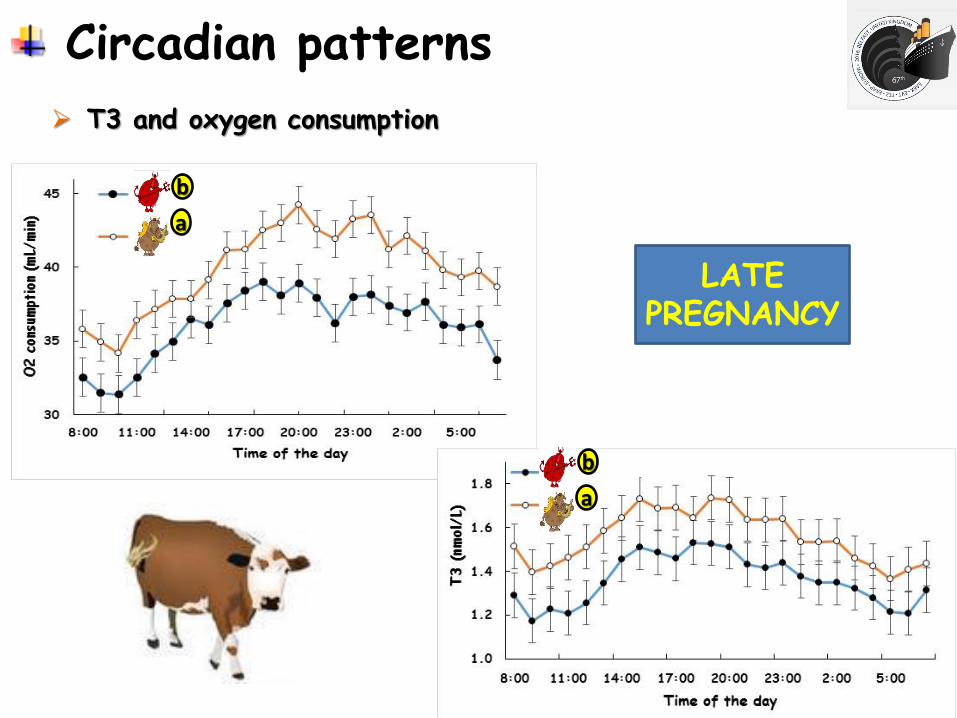
T3 and oxygen consumption
29
LATE PREGNANCY
a
b
a
b
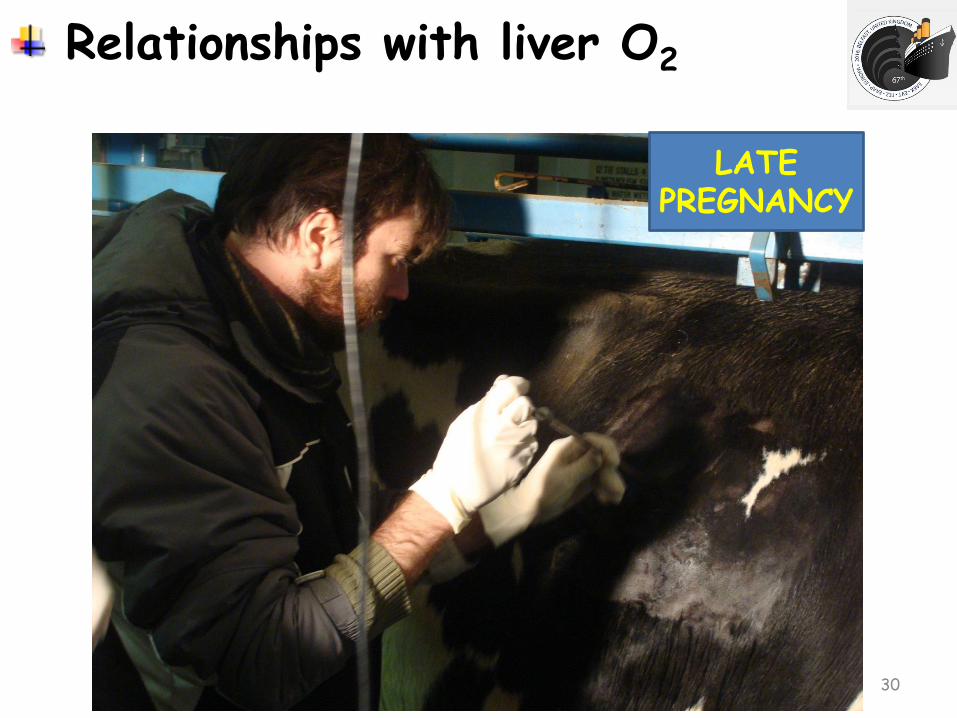
Relationships with liver O2
30
LATE PREGNANCY
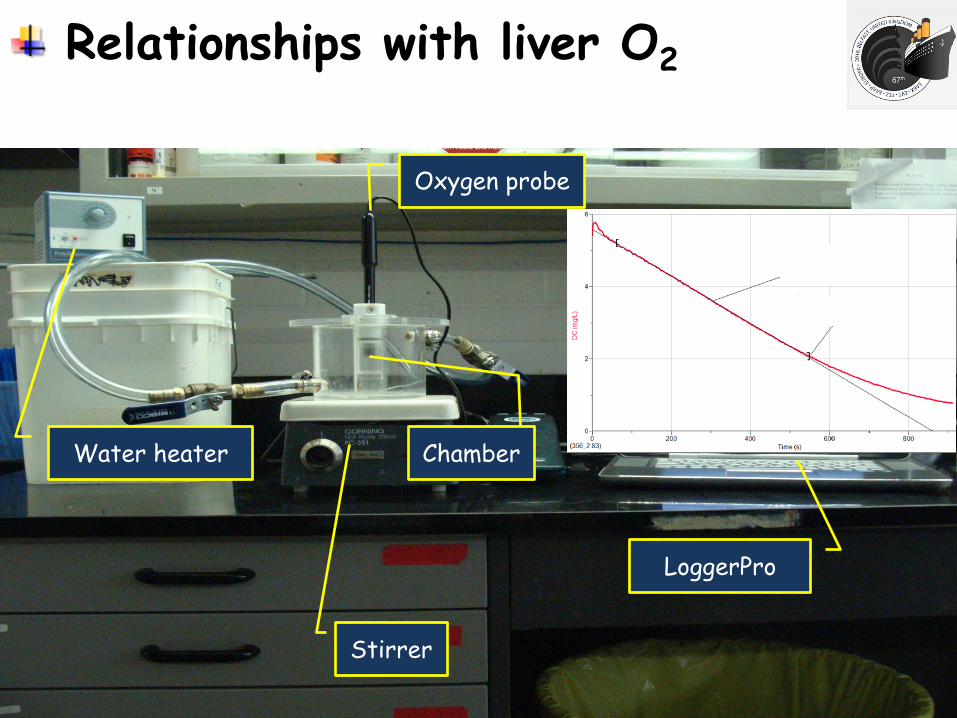
Relationships with liver O2
31
Oxygen probe
Chamber
LoggerPro
Water heater
Stirrer
Relationships with liver O2
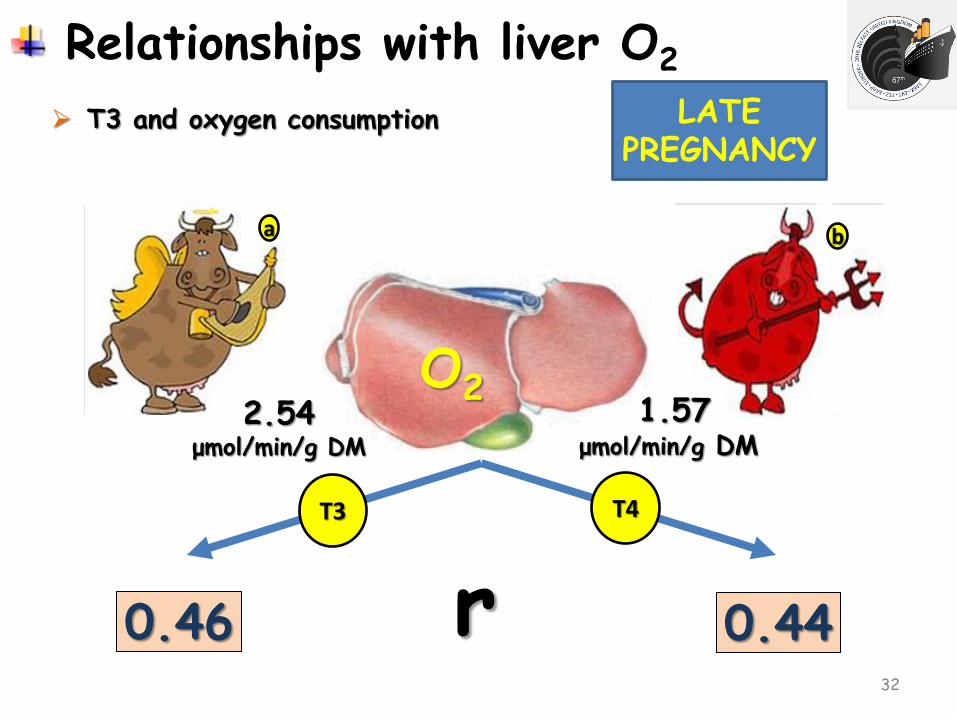
T3 and oxygen consumption
32
LATE PREGNANCY
2.54 μmol/min/g DM
1.57
μmol/min/g DM
a b
O2
T3 T4
r 0.46 0.44
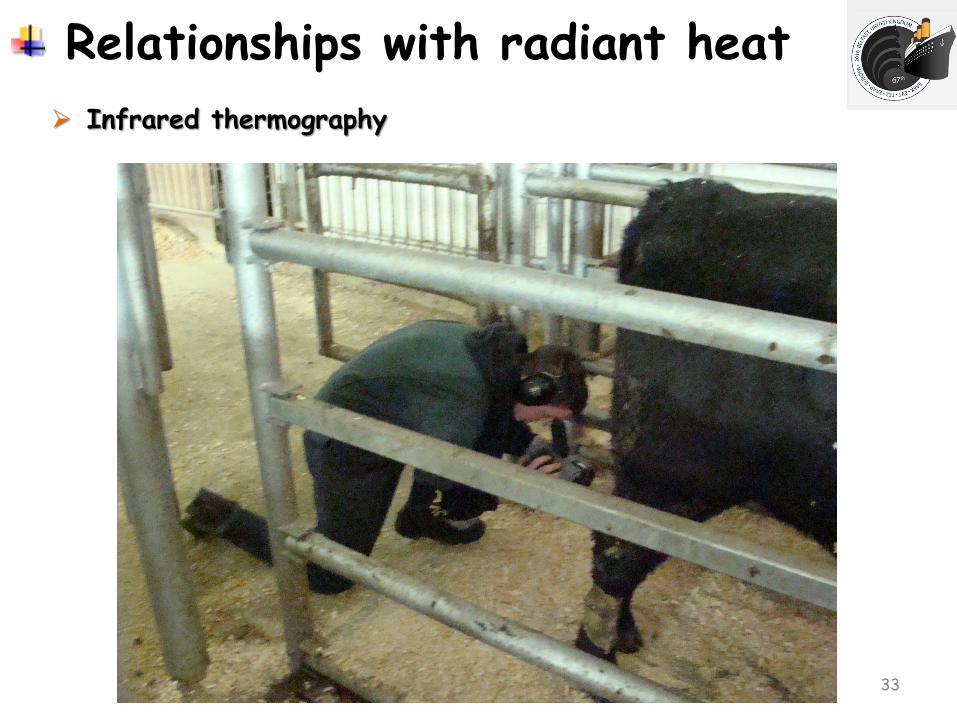
Relationships with radiant heat
Infrared thermography
33
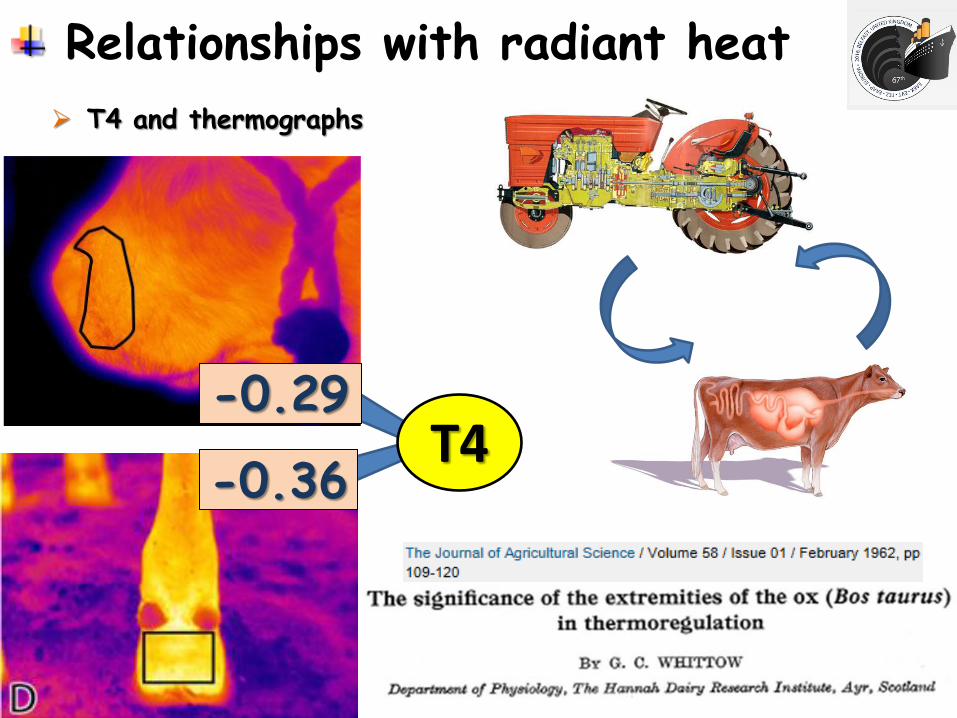
Relationships with radiant heat
T4 and thermographs
34
T4 -0.36
-0.29
35
36
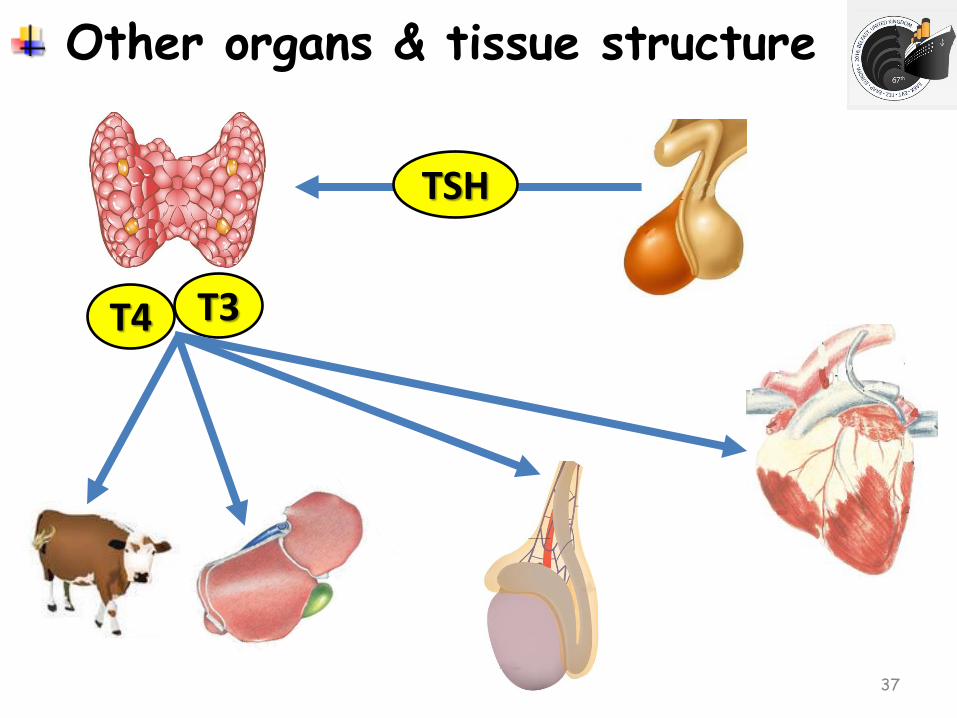
Other organs & tissue structure
37
TSH
T3 T4
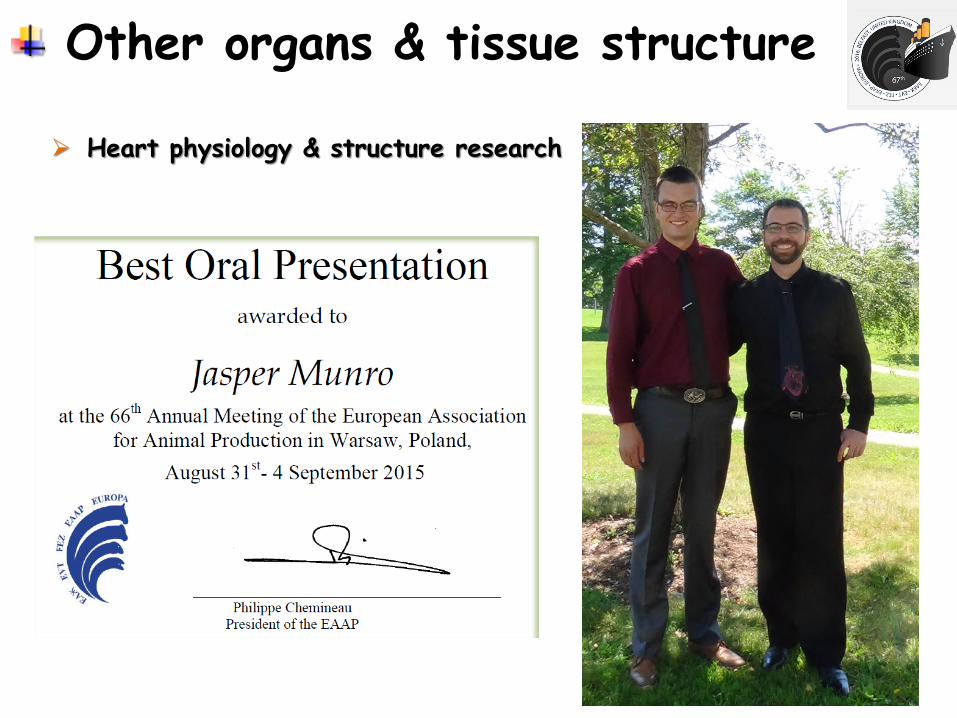
Other organs & tissue structure
Heart physiology & structure research
38
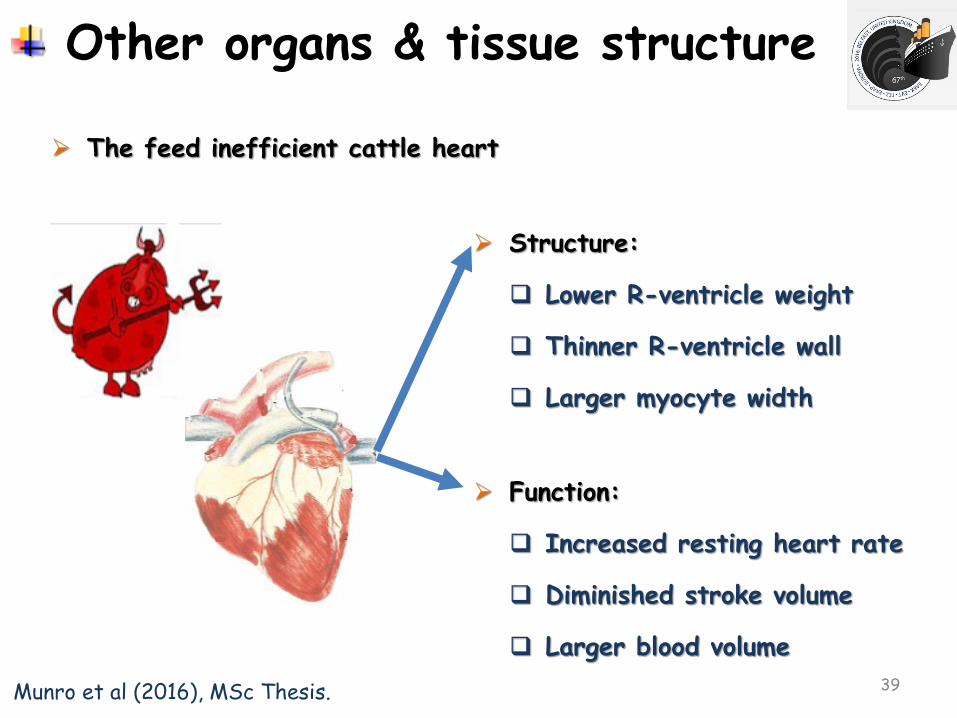
Other organs & tissue structure
The feed inefficient cattle heart
39
Structure:
Lower R-ventricle weight
Thinner R-ventricle wall
Larger myocyte width
Function:
Increased resting heart rate
Diminished stroke volume
Larger blood volume
Munro et al (2016), MSc Thesis.

Other organs & tissue structure Thyroid hormones & heart structure and function
40
A
B
Myocyte width
1000x
Sarcomere length
TSH
T3 Blood volume
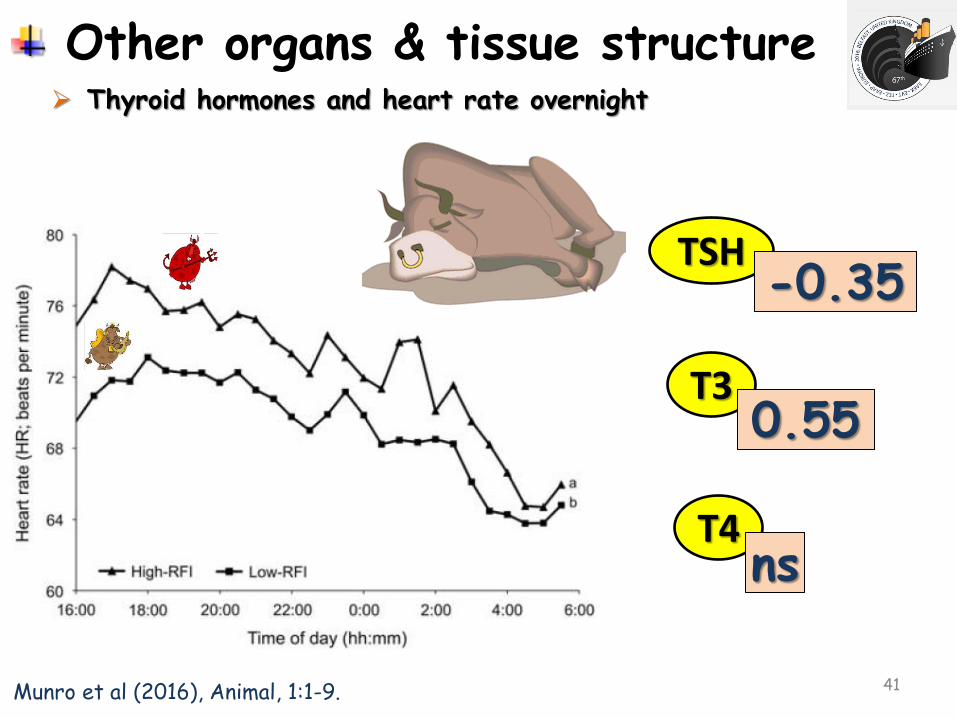
Other organs & tissue structure Thyroid hormones and heart rate overnight
41 Munro et al (2016), Animal, 1:1-9.
TSH
T3
-0.35
0.55
T4 ns
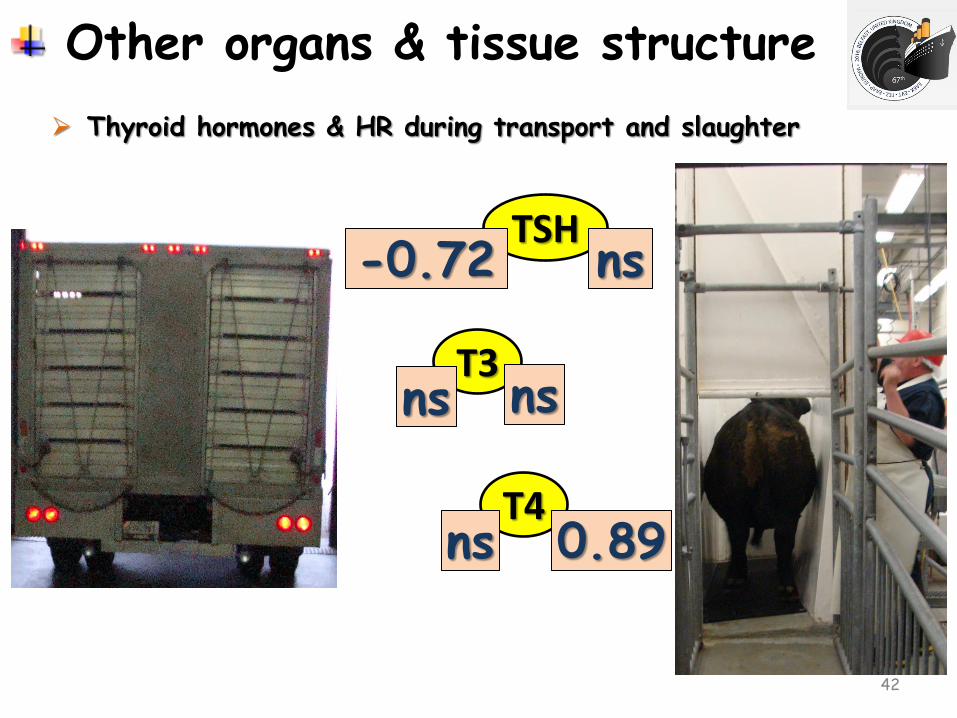
Other organs & tissue structure
Thyroid hormones & HR during transport and slaughter
42
TSH
T3
ns
T4 0.89
-0.72
ns
ns
ns
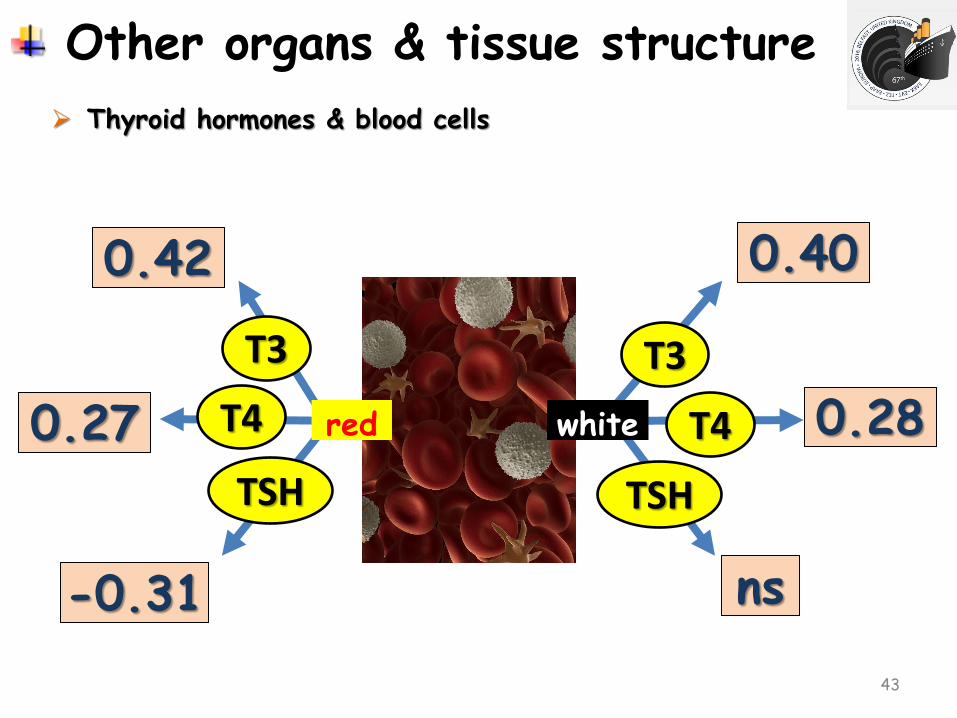
Other organs & tissue structure
Thyroid hormones & blood cells
43
ns
T3
0.40
white
T4
TSH
0.28
-0.31
T3
0.42
T4
TSH
0.27 red
Other organs & tissue structure
44
-
+
-
+
-
+
-
+
-
+
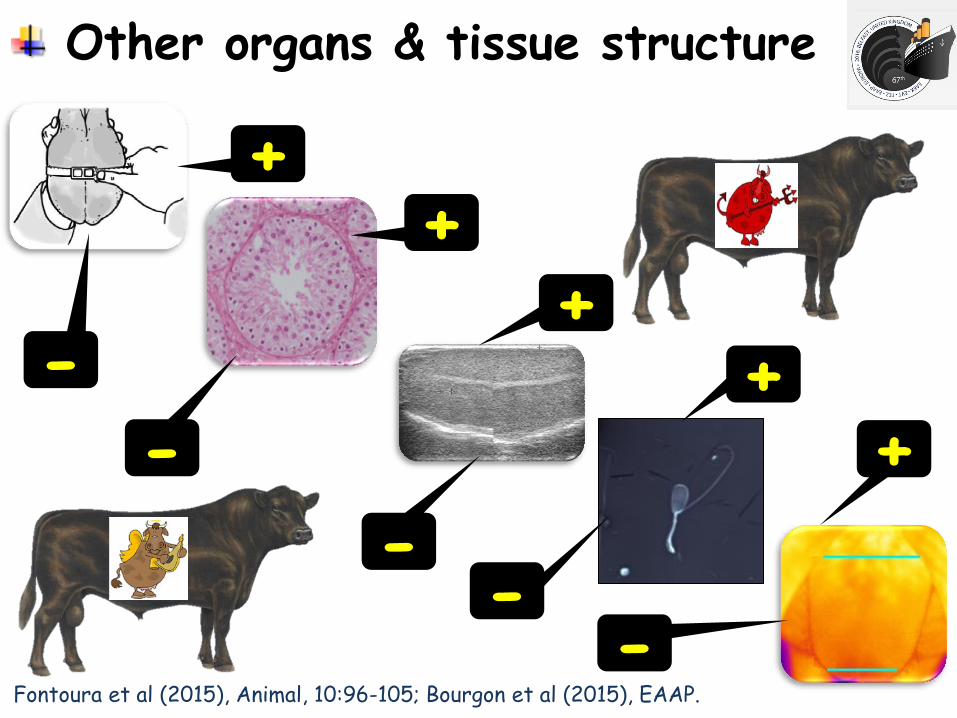
Other organs & tissue structure
Fontoura et al (2015), Animal, 10:96-105; Bourgon et al (2015), EAAP.
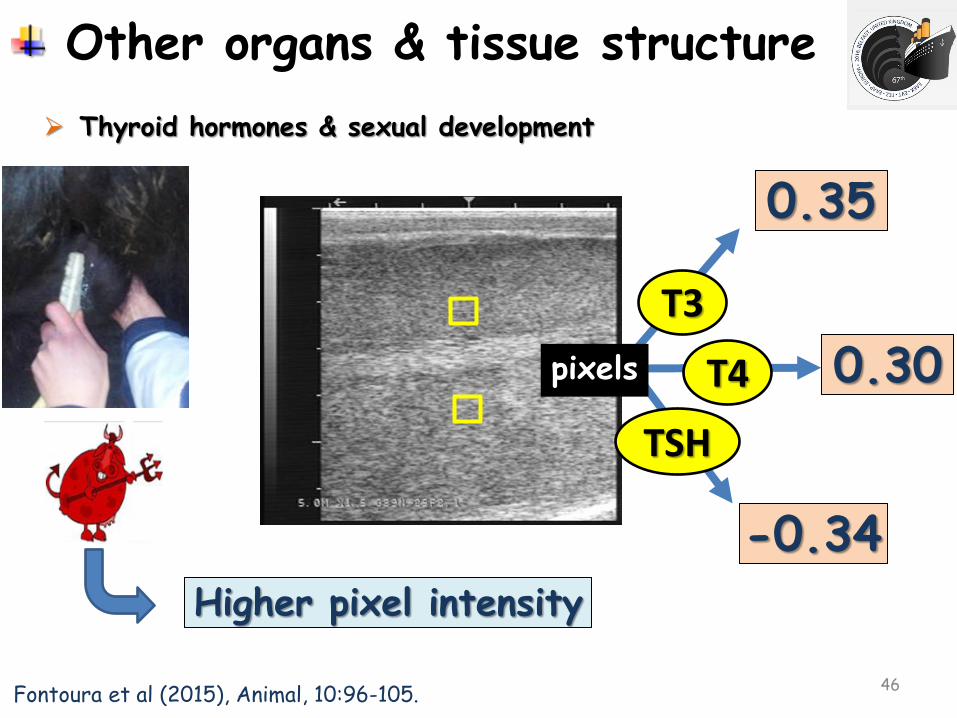
Other organs & tissue structure
Thyroid hormones & sexual development
46
-0.34
T3
0.35
T4
TSH
0.30 pixels
Fontoura et al (2015), Animal, 10:96-105.
Higher pixel intensity
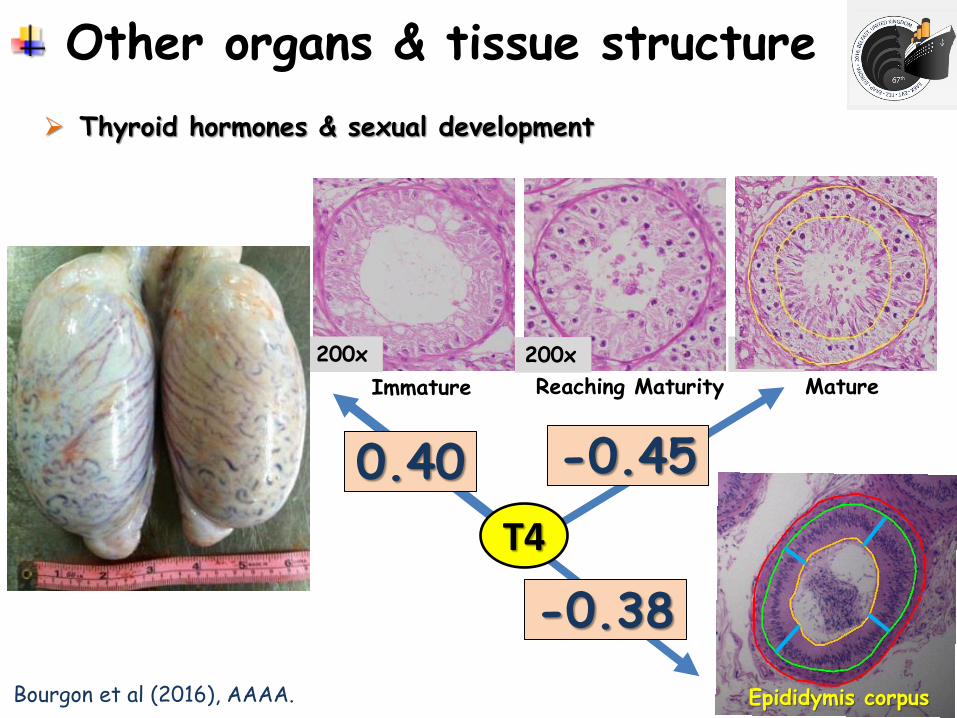
Other organs & tissue structure
Thyroid hormones & sexual development
47 Bourgon et al (2016), AAAA.
200x 200x 200x
Immature Reaching Maturity Mature
T4
0.40
-0.38
-0.45
Epididymis corpus
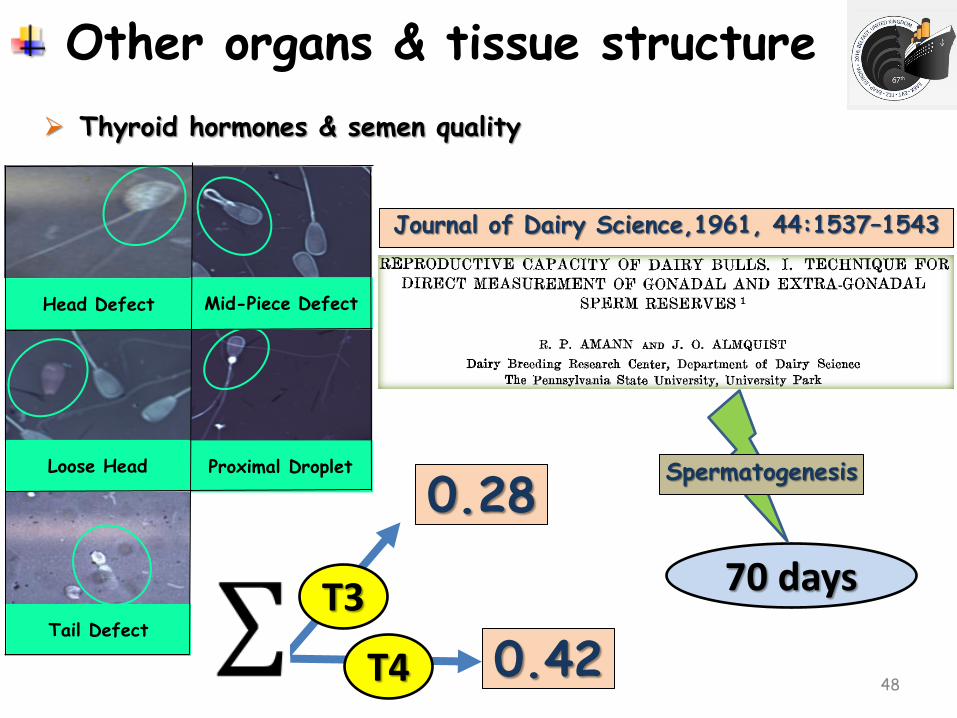
Other organs & tissue structure
Thyroid hormones & semen quality
48
Tail Defect
Head Defect Mid-Piece Defect
Loose Head Proximal Droplet
T3
0.28
T4 0.42
70 days
Journal of Dairy Science,1961, 44:1537–1543
Spermatogenesis
Other organs & tissue structure
49
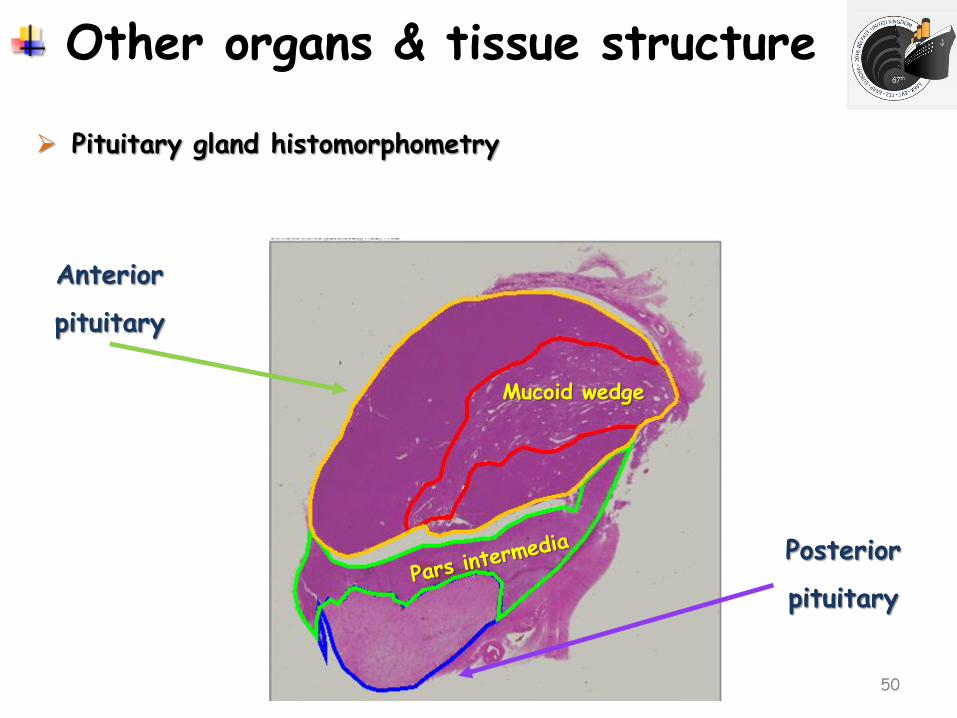
Other organs & tissue structure
Pituitary gland histomorphometry
50
Anterior
pituitary
Posterior
pituitary
Mucoid wedge
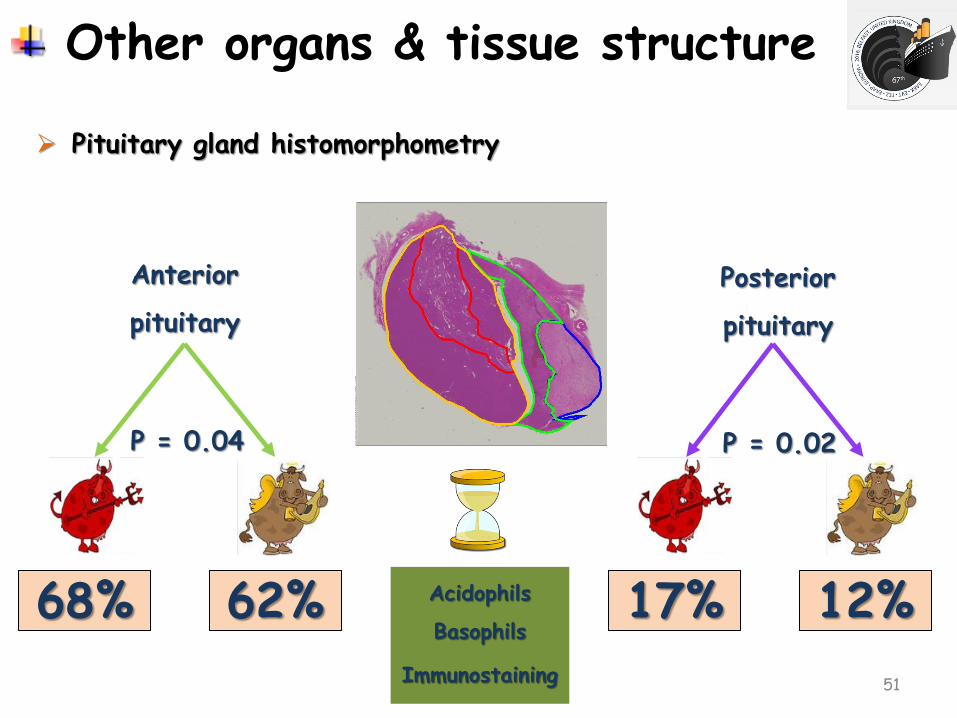
Other organs & tissue structure
Pituitary gland histomorphometry
51
Anterior
pituitary
Posterior
pituitary
68% 62% 17% 12%
P = 0.04 P = 0.02
Acidophils
Basophils
Immunostaining
Other organs & tissue structure
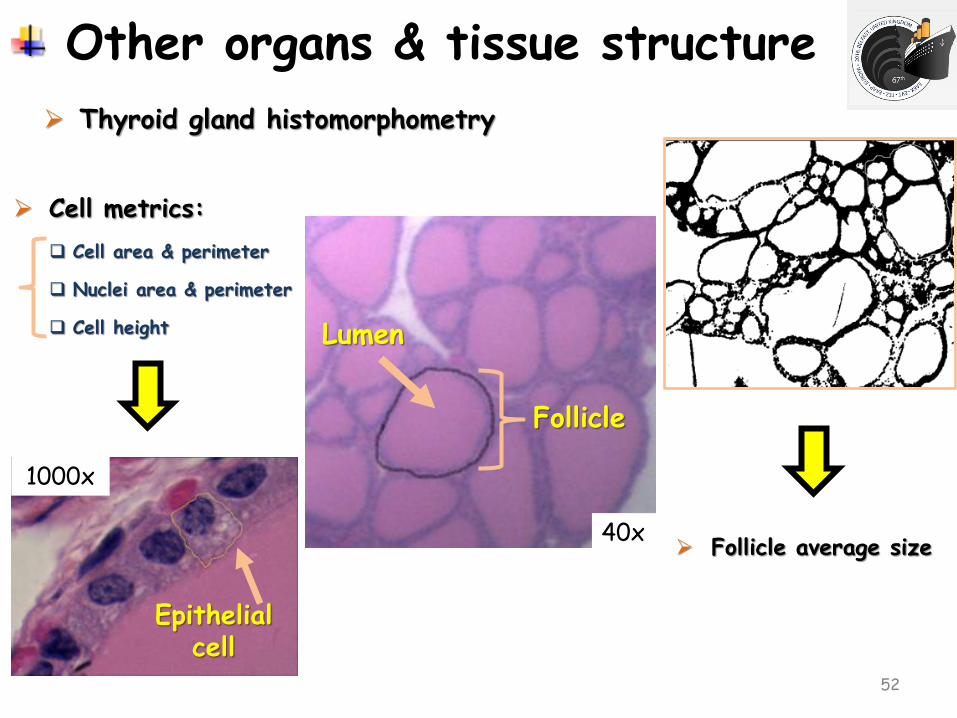
Thyroid gland histomorphometry
52
Epithelial cell
1000x
Follicle
40x
Lumen
Cell metrics:
Cell area & perimeter
Nuclei area & perimeter
Cell height
Follicle average size
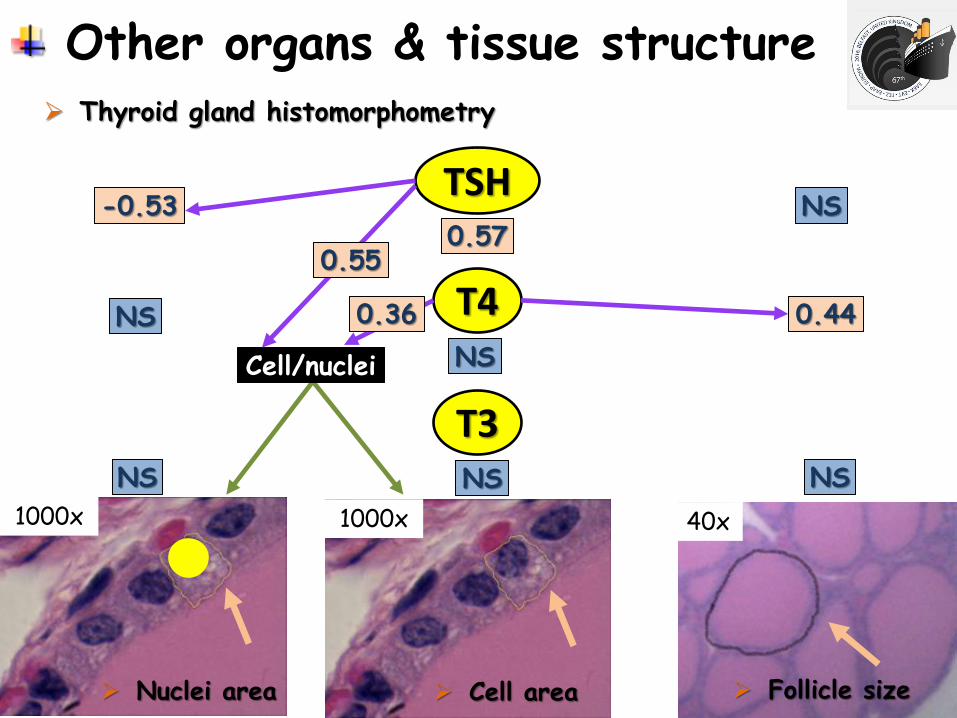
Other organs & tissue structure Thyroid gland histomorphometry
53
1000x
Cell area
TSH
T3
T4
1000x
Nuclei area Follicle size
NS NS NS
40x
0.44 NS
-0.53 0.57
NS
NS
Cell/nuclei
0.55
0.36
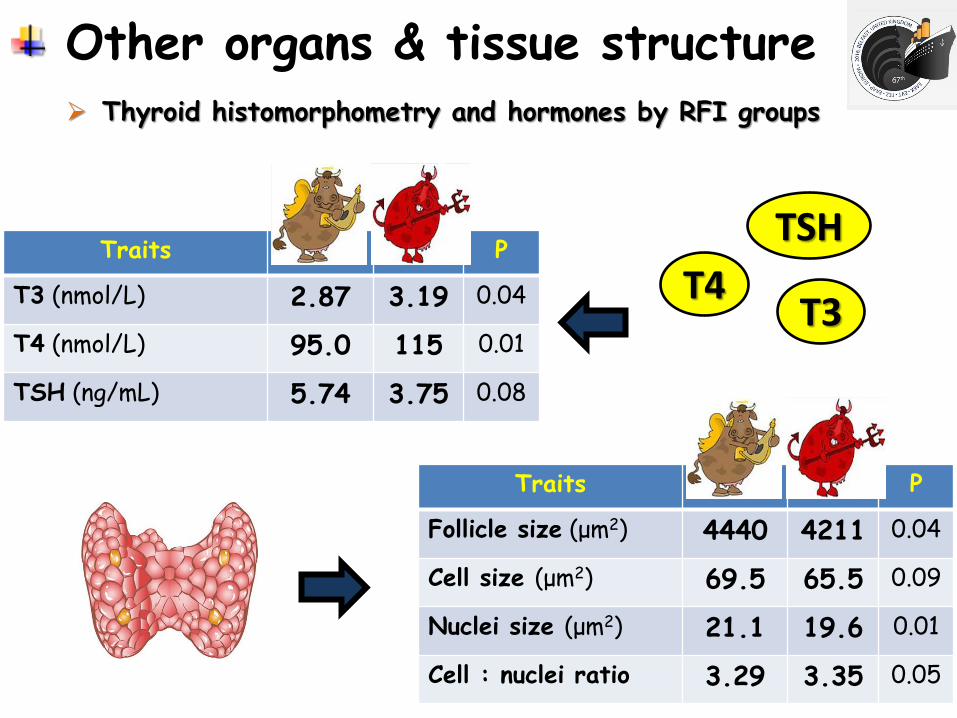
Other organs & tissue structure Thyroid histomorphometry and hormones by RFI groups
54
Traits P
T3 (nmol/L) 2.87 3.19 0.04
T4 (nmol/L) 95.0 115 0.01
TSH (ng/mL) 5.74 3.75 0.08
Traits P
Follicle size (μm2) 4440 4211 0.04
Cell size (μm2) 69.5 65.5 0.09
Nuclei size (μm2) 21.1 19.6 0.01
Cell : nuclei ratio 3.29 3.35 0.05
TSH
T3 T4
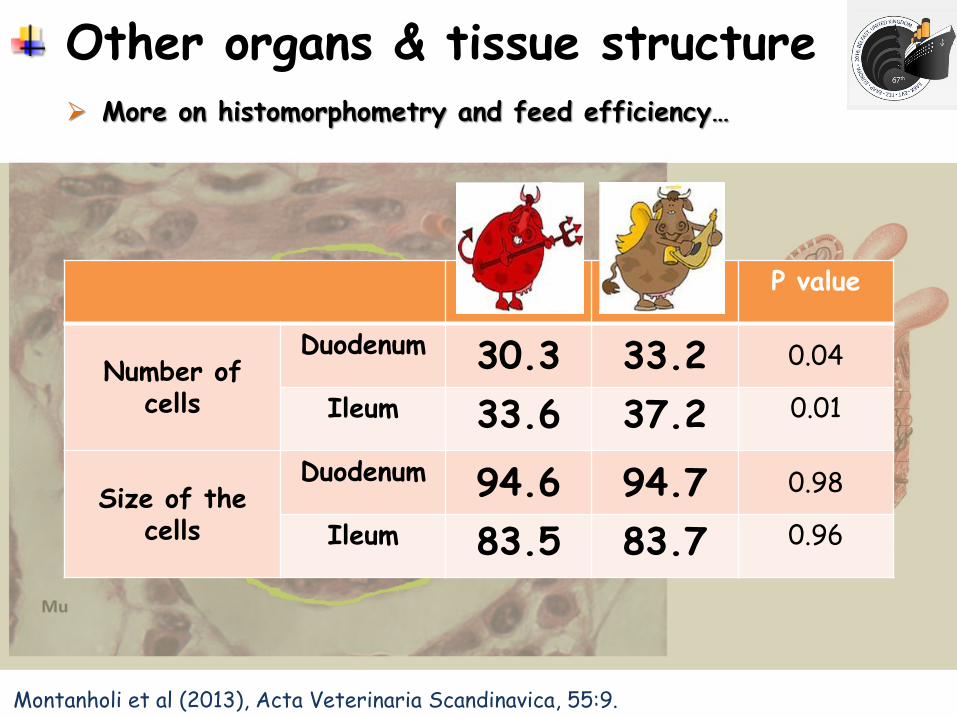
High-RFI Low-RFI P value
Number of cells
Duodenum 30.3 33.2 0.04
Ileum 33.6 37.2 0.01
Size of the cells
Duodenum 94.6 94.7 0.98
Ileum 83.5 83.7 0.96
Other organs & tissue structure More on histomorphometry and feed efficiency…
Montanholi et al (2013), Acta Veterinaria Scandinavica, 55:9.
56
Session # 16
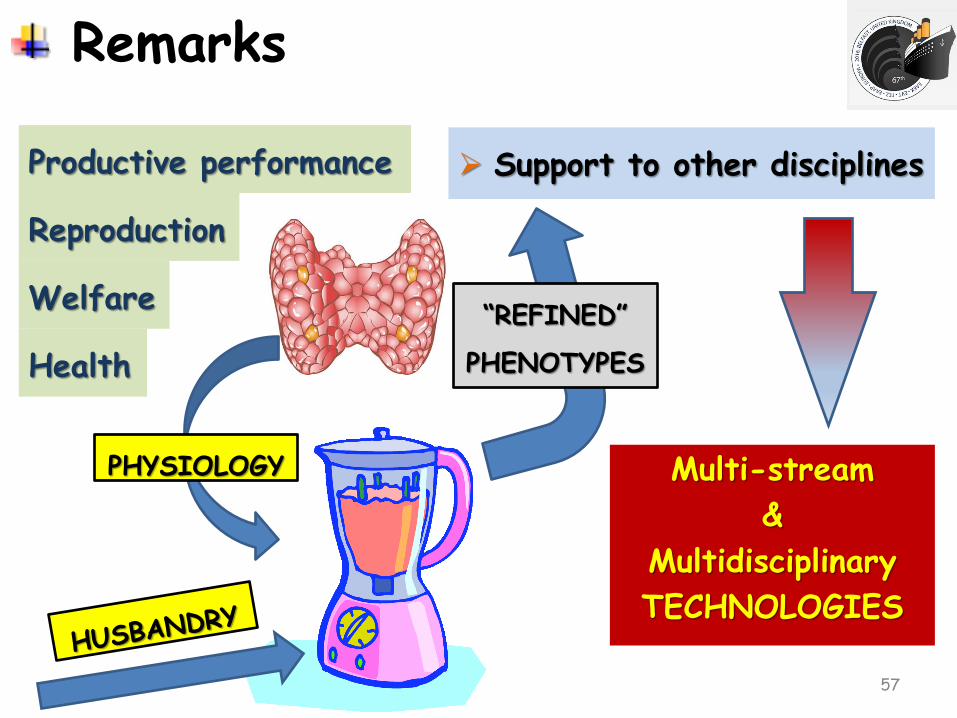
Remarks
57
Reproduction
Health
Productive performance
Welfare
PHYSIOLOGY
Support to other disciplines
Multi-stream
&
Multidisciplinary
TECHNOLOGIES
“REFINED”
PHENOTYPES
58
59