Embed Size (px)
Citation preview
Resumen
Martin Arnold, Director - FX & Macro Strategist
Nitesh Shah, Director - Commodities Strategist
ContenidoAnálisis del mercado de materias primas 1
Resumen de tablas de datos 4
Posicionamiento neto de la CFTC 5
Inventarios 9
Medias móviles y volúmenes 13
Curvas de futuros 17
Roll yields 21
Publicaciones recientes 27
Commodity Monthly Matrix1 Performance
2- 1 Mth - 6 Mth - 12 Mth
All Commodities 3.9% 4.4% -16.9%Energy 5.8% -11.4% -41.2%
WTI Oil 46 10.7% 16.2% 7.4% 4% -1.5% 0 (1) Industrial Metals -3.0% -0.6% -27.6%Brent Oil 48 8.3% 13.3% -1.1% -21% -0.6% 0 1 Precious Metals 2.7% 18.4% 2.7%Natural Gas 2.1 2.9% -5.1% 2.0% 6% -6.6% (1) 1 Agriculture 6.9% 9.5% 2.5%Gasoline 1.6 3.8% 19.7% -8.0% -6% -0.5% 0 0 MSCI World -1.9% -0.2% -8.3%
Heating Oil 1.4 10.9% 8.6% -24.0% 45% -0.6% 2 0 US Aggregate Bond 0.5% 3.9% 4.2%
Carbon 5.8 5.6% -17.1% - - 0.0% 0 0
Wheat 4.7 0.8% -2.9% 7.7% 34% -2.1% (1) (3)
Corn 3.8 2.3% 3.4% -0.8% 323% -2.2% 2 2
Soybeans 11 10.4% 17.1% -15.2% 100% -0.9% 2 2
Sugar 0.2 19.5% 19.5% -13.1% 38% -1.5% 2 (1)
Cotton 0.6 -1.6% -1.6% -7.3% 1210% -1.1% 0 2
Coffee 1.3 5.8% 6.4% - -41% -1.0% (3) (4)
Soybean Oil 0.3 -5.3% 6.9% 0.8% -24% -1.0% (3) 0
Cocoa 2,961 1.5% -4.2% - 95% -0.2% 0 (4) CFTC Net Speculative PositioningAluminium 1,517 -2.0% -0.8% -5.5% 21% -0.6% 0 2 (in '000 contracts)
Copper (COMEX) 2.1 -4.3% -5.4% -4.4% -2% 0.0% 0 (4)
Copper (LME) 4,637 -4.4% -4.8% -28.9% -27% 0.1% 0 0
Zinc 1,880 0.2% 10.5% -5.6% -5% -0.2% 0 (2)
Nickel 8,600 -3.9% -6.2% -6.1% 32% -0.2% 0 1
Lead 1,706 -2.6% -0.5% 5.3% 4% 0.0% (2) (2)
Tin 16,657 -2.6% 7.1% 49.6% -13% -0.1% (3) 0
Gold 1,273 2.1% 10.0% - 21% - 4 2
Silver 17 4.8% 13.3% - 28% - 4 4
Platinum 1,052 5.0% 11.6% - 32% - 4 0
Palladium 592 9.2% 2.9% - 136% - 4 (4)
Live Cattle 1.2 -6.6% -7.4% - -15% 4.0% (1) (1)
Lean Hogs 0.8 15.5% 15.6% - 2% -6.2% 1 (1)
Feeder Cattle 1.5 -5.0% -13.7% - -24% 0.5% (1) (1)Source: CFTC, Bloomberg
1
18 Apr
Score
Sources: Bloomberg, Bloomberg TR Indexes for basket returns, data to Friday 13 May
2016.
The score matrix is designed to highlight significant changes in key variables but should not be viewed as predictor of performance. Source: ETF Securities, Bloomberg
" - " Information not available. Green = returns positive, inventories falling, positioning rising, roll yield positive. Red = the opposite. Black = neutral. 1 Detailed explanation of the matrix calculations can be found at the end of this report. 2 All prices are futures
prices to May 13, 2016. Broad sector returns based on Bloomberg Commodity Index family. 3 % change in inventory over the past 3 months except for sugar and coffee which are based on past 6 months as data is updated bi-annually by USDA. 4 CFTC futures and
LME COTR net positioning as at May 13, 2016, and May 10, 2016 respectively, % change from previous month. 5 Calculated as % difference between front month and second month futures prices on report date.
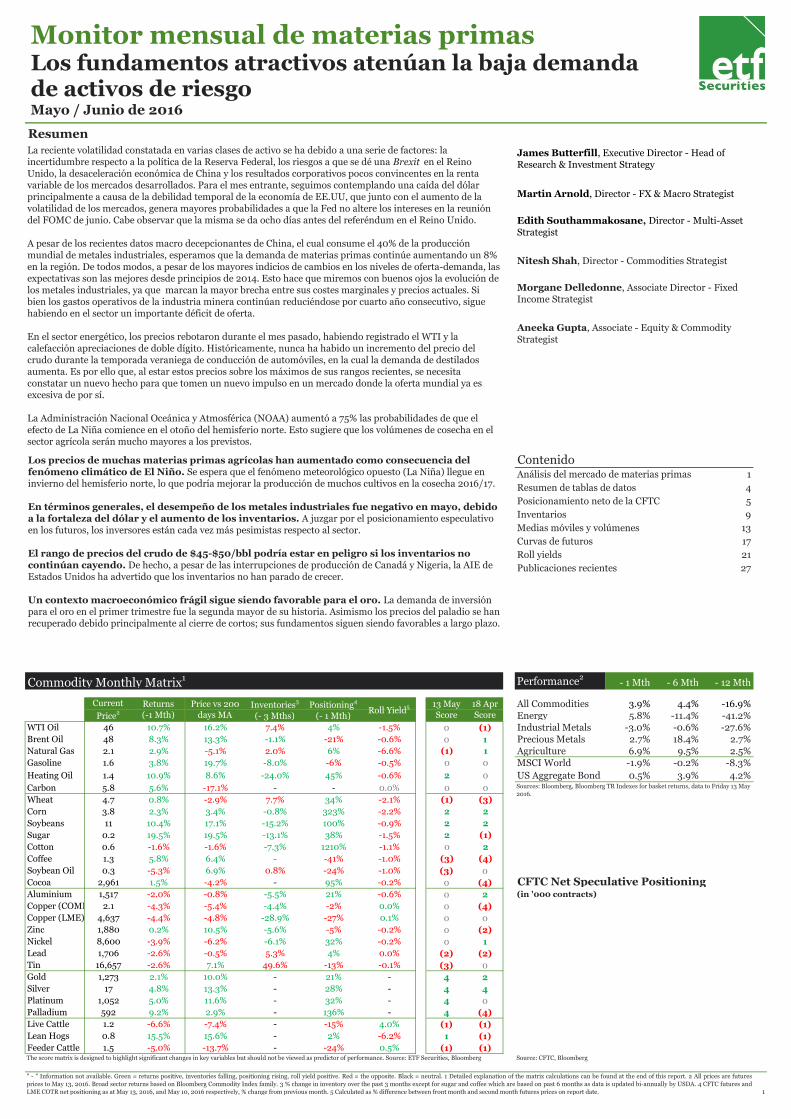
Los precios de muchas materias primas agrícolas han aumentado como consecuencia del fenómeno climático de El Niño. Se espera que el fenómeno meteorológico opuesto (La Niña) llegue en invierno del hemisferio norte, lo que podría mejorar la producción de muchos cultivos en la cosecha 2016/17.
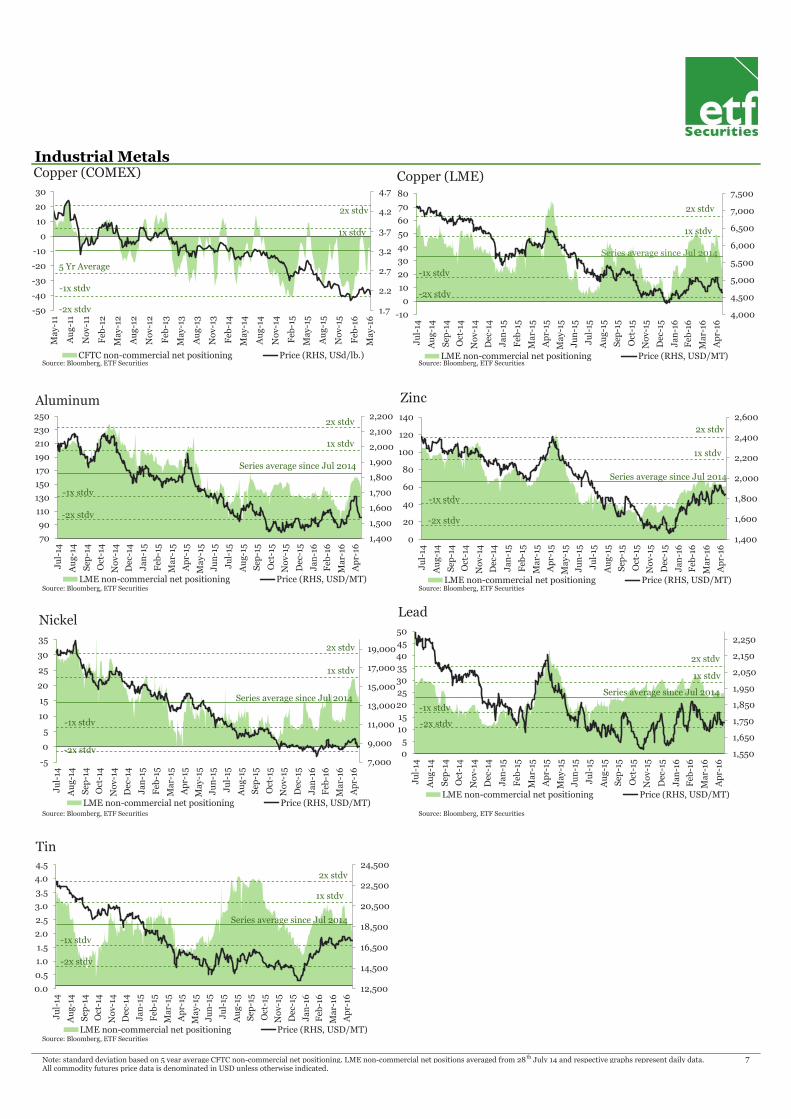
En términos generales, el desempeño de los metales industriales fue negativo en mayo, debido a la fortaleza del dólar y el aumento de los inventarios. A juzgar por el posicionamiento especulativo en los futuros, los inversores están cada vez más pesimistas respecto al sector.
El rango de precios del crudo de $45-$50/bbl podría estar en peligro si los inventarios no continúan cayendo. De hecho, a pesar de las interrupciones de producción de Canadá y Nigeria, la AIE de Estados Unidos ha advertido que los inventarios no han parado de crecer.
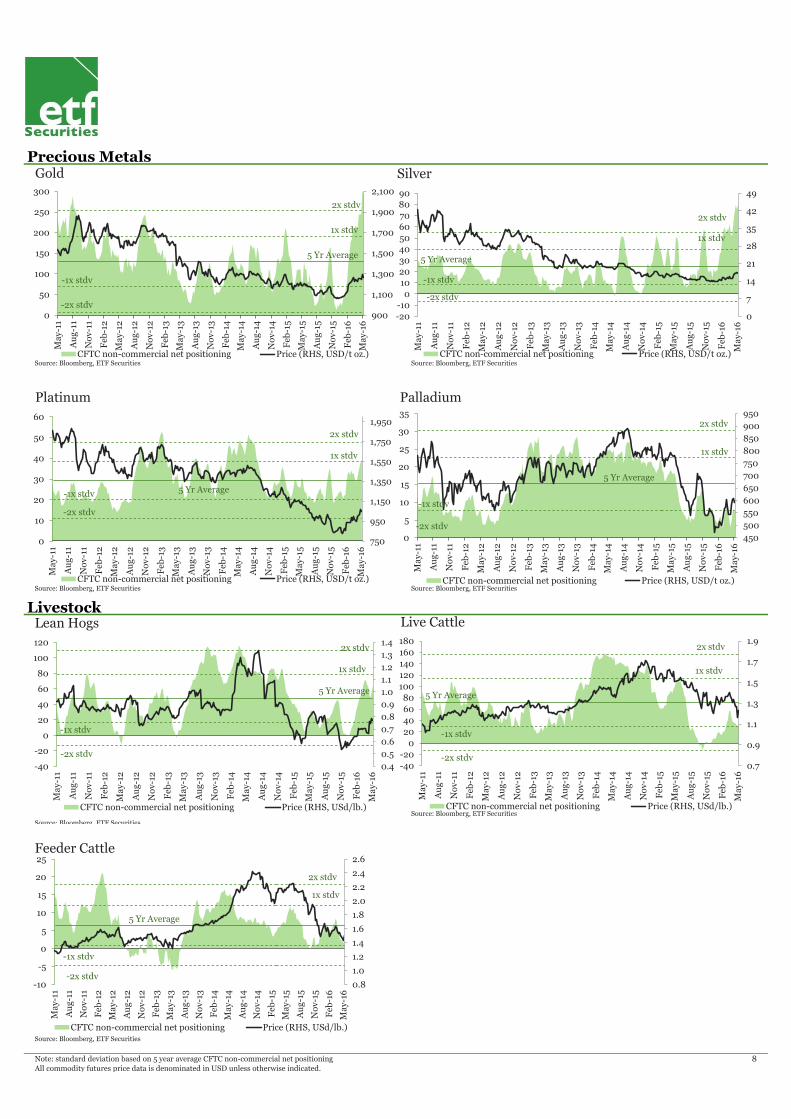
Un contexto macroeconómico frágil sigue siendo favorable para el oro. La demanda de inversión para el oro en el primer trimestre fue la segunda mayor de su historia. Asimismo los precios del paladio se han recuperado debido principalmente al cierre de cortos; sus fundamentos siguen siendo favorables a largo plazo.
Current
Price2
Returns
(-1 Mth)
Price vs 200
days MAInventories
3
(- 3 Mths)
Positioning4
(- 1 Mth)Roll Yield
5 13 May
Score
Monitor mensual de materias primasLos fundamentos atractivos atenúan la baja demanda de activos de riesgoMayo / Junio de 2016
La reciente volatilidad constatada en varias clases de activo se ha debido a una serie de factores: la incertidumbre respecto a la política de la Reserva Federal, los riesgos a que se dé una Brexit en el Reino Unido, la desaceleración económica de China y los resultados corporativos pocos convincentes en la renta variable de los mercados desarrollados. Para el mes entrante, seguimos contemplando una caída del dólar principalmente a causa de la debilidad temporal de la economía de EE.UU, que junto con el aumento de la volatilidad de los mercados, genera mayores probabilidades a que la Fed no altere los intereses en la reunión del FOMC de junio. Cabe observar que la misma se da ocho días antes del referéndum en el Reino Unido.
A pesar de los recientes datos macro decepcionantes de China, el cual consume el 40% de la producción mundial de metales industriales, esperamos que la demanda de materias primas continúe aumentando un 8% en la región. De todos modos, a pesar de los mayores indicios de cambios en los niveles de oferta-demanda, las expectativas son las mejores desde principios de 2014. Esto hace que miremos con buenos ojos la evolución de los metales industriales, ya que marcan la mayor brecha entre sus costes marginales y precios actuales. Si bien los gastos operativos de la industria minera continúan reduciéndose por cuarto año consecutivo, sigue habiendo en el sector un importante déficit de oferta.
En el sector energético, los precios rebotaron durante el mes pasado, habiendo registrado el WTI y la calefacción apreciaciones de doble dígito. Históricamente, nunca ha habido un incremento del precio del crudo durante la temporada veraniega de conducción de automóviles, en la cual la demanda de destilados aumenta. Es por ello que, al estar estos precios sobre los máximos de sus rangos recientes, se necesita constatar un nuevo hecho para que tomen un nuevo impulso en un mercado donde la oferta mundial ya es excesiva de por sí.
La Administración Nacional Oceánica y Atmosférica (NOAA) aumentó a 75% las probabilidades de que el efecto de La Niña comience en el otoño del hemisferio norte. Esto sugiere que los volúmenes de cosecha en el sector agrícola serán mucho mayores a los previstos.
James Butterfill, Executive Director - Head of Research & Investment Strategy
Edith Southammakosane, Director - Multi-Asset Strategist
Morgane Delledonne, Associate Director - Fixed Income Strategist
Aneeka Gupta, Associate - Equity & Commodity Strategist
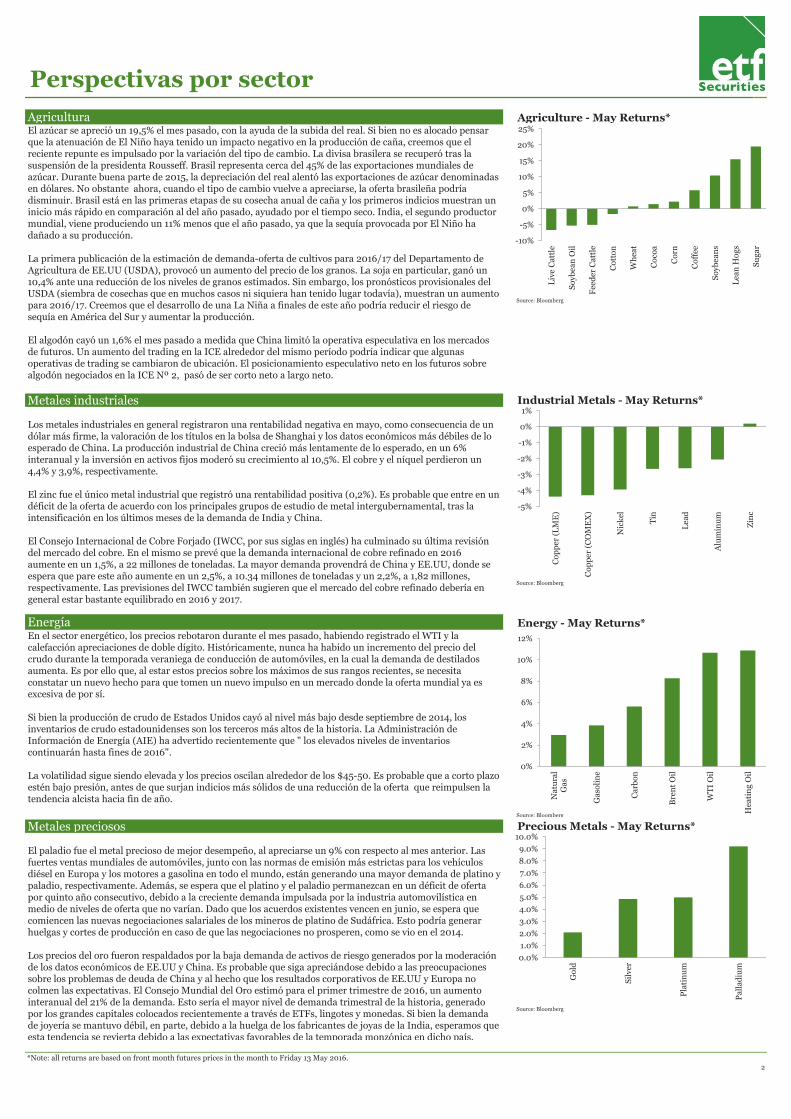
Agricultura Agriculture - May Returns*
Source: Bloomberg
Metales industriales Industrial Metals - May Returns*
Source: Bloomberg
Energía Energy - May Returns*
Source: Bloomberg
Metales preciosos Precious Metals - May Returns*
Source: Bloomberg
*Note: all returns are based on front month futures prices in the month to Friday 13 May 2016.2
El paladio fue el metal precioso de mejor desempeño, al apreciarse un 9% con respecto al mes anterior. Las fuertes ventas mundiales de automóviles, junto con las normas de emisión más estrictas para los vehículos diésel en Europa y los motores a gasolina en todo el mundo, están generando una mayor demanda de platino y paladio, respectivamente. Además, se espera que el platino y el paladio permanezcan en un déficit de oferta por quinto año consecutivo, debido a la creciente demanda impulsada por la industria automovilística en medio de niveles de oferta que no varían. Dado que los acuerdos existentes vencen en junio, se espera que comiencen las nuevas negociaciones salariales de los mineros de platino de Sudáfrica. Esto podría generar huelgas y cortes de producción en caso de que las negociaciones no prosperen, como se vio en el 2014.
Los precios del oro fueron respaldados por la baja demanda de activos de riesgo generados por la moderación de los datos económicos de EE.UU y China. Es probable que siga apreciándose debido a las preocupaciones sobre los problemas de deuda de China y al hecho que los resultados corporativos de EE.UU y Europa no colmen las expectativas. El Consejo Mundial del Oro estimó para el primer trimestre de 2016, un aumento interanual del 21% de la demanda. Esto sería el mayor nivel de demanda trimestral de la historia, generado por los grandes capitales colocados recientemente a través de ETFs, lingotes y monedas. Si bien la demanda de joyería se mantuvo débil, en parte, debido a la huelga de los fabricantes de joyas de la India, esperamos que esta tendencia se revierta debido a las expectativas favorables de la temporada monzónica en dicho país.
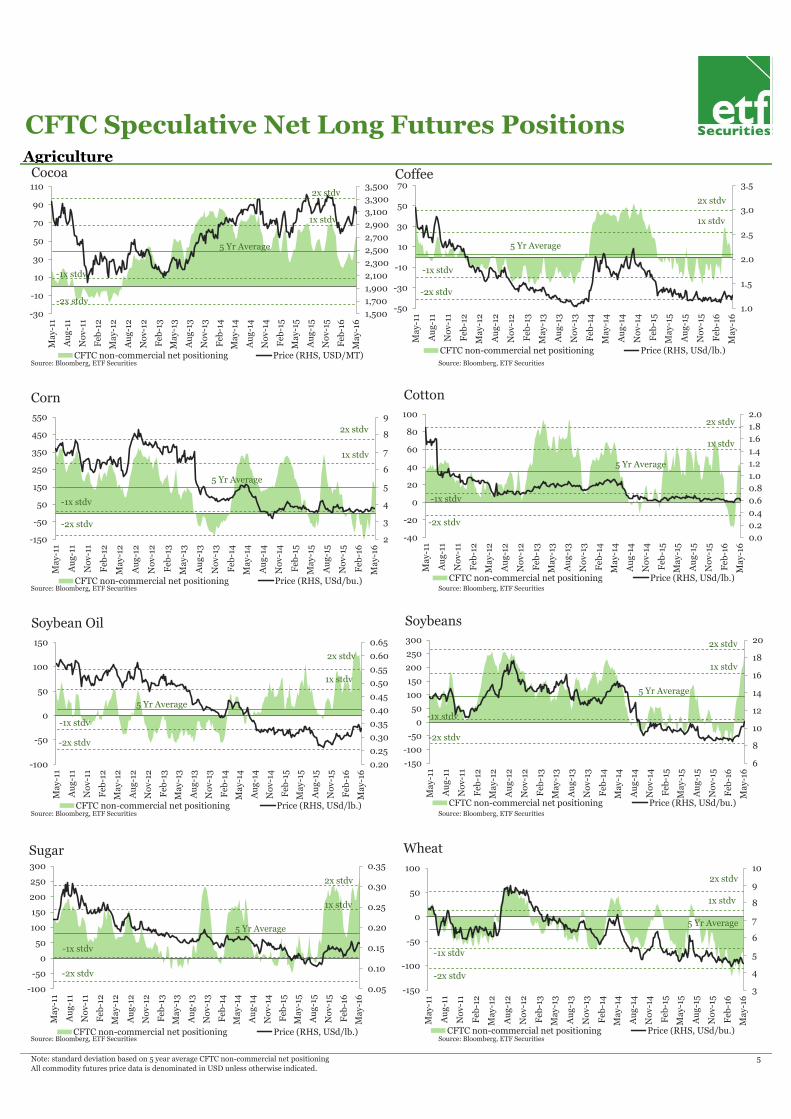
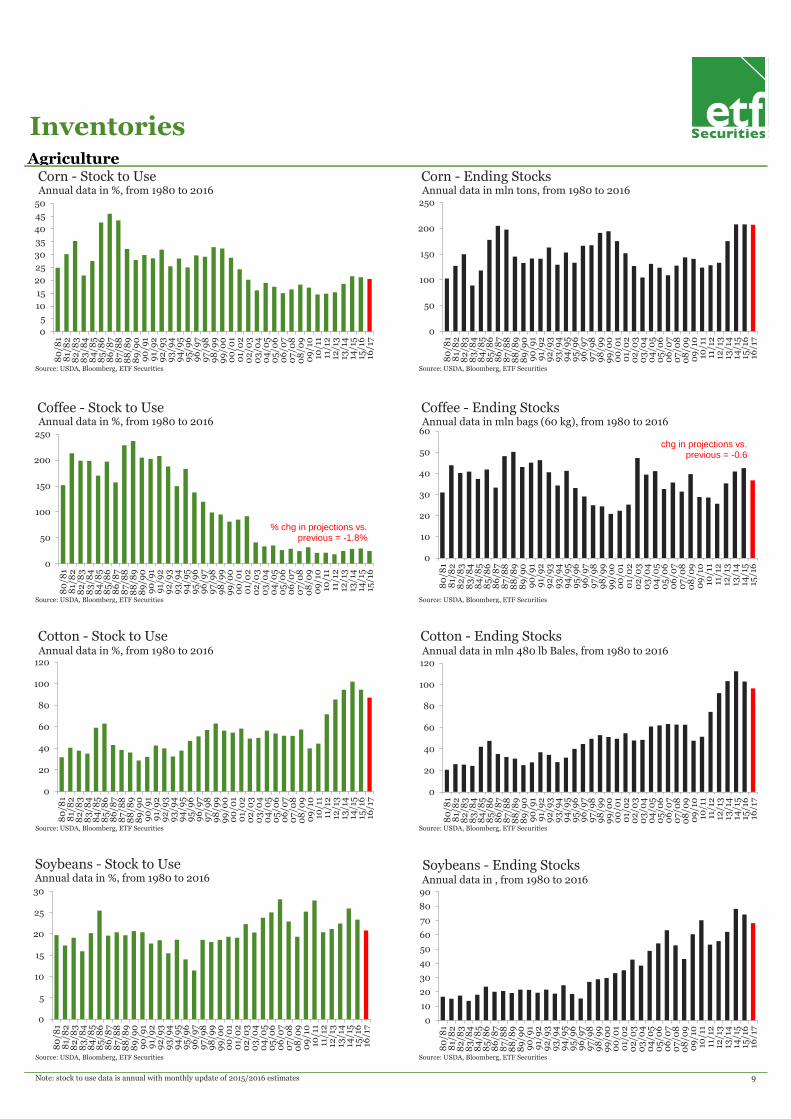
El azúcar se apreció un 19,5% el mes pasado, con la ayuda de la subida del real. Si bien no es alocado pensar que la atenuación de El Niño haya tenido un impacto negativo en la producción de caña, creemos que el reciente repunte es impulsado por la variación del tipo de cambio. La divisa brasilera se recuperó tras la suspensión de la presidenta Rousseff. Brasil representa cerca del 45% de las exportaciones mundiales de azúcar. Durante buena parte de 2015, la depreciación del real alentó las exportaciones de azúcar denominadas en dólares. No obstante ahora, cuando el tipo de cambio vuelve a apreciarse, la oferta brasileña podría disminuir. Brasil está en las primeras etapas de su cosecha anual de caña y los primeros indicios muestran un inicio más rápido en comparación al del año pasado, ayudado por el tiempo seco. India, el segundo productor mundial, viene produciendo un 11% menos que el año pasado, ya que la sequía provocada por El Niño ha dañado a su producción.
La primera publicación de la estimación de demanda-oferta de cultivos para 2016/17 del Departamento de Agricultura de EE.UU (USDA), provocó un aumento del precio de los granos. La soja en particular, ganó un 10,4% ante una reducción de los niveles de granos estimados. Sin embargo, los pronósticos provisionales del USDA (siembra de cosechas que en muchos casos ni siquiera han tenido lugar todavía), muestran un aumento para 2016/17. Creemos que el desarrollo de una La Niña a finales de este año podría reducir el riesgo de sequía en América del Sur y aumentar la producción.
El algodón cayó un 1,6% el mes pasado a medida que China limitó la operativa especulativa en los mercados de futuros. Un aumento del trading en la ICE alrededor del mismo período podría indicar que algunas operativas de trading se cambiaron de ubicación. El posicionamiento especulativo neto en los futuros sobre algodón negociados en la ICE Nº 2, pasó de ser corto neto a largo neto.
Los metales industriales en general registraron una rentabilidad negativa en mayo, como consecuencia de un dólar más firme, la valoración de los títulos en la bolsa de Shanghai y los datos económicos más débiles de lo esperado de China. La producción industrial de China creció más lentamente de lo esperado, en un 6% interanual y la inversión en activos fijos moderó su crecimiento al 10,5%. El cobre y el níquel perdieron un 4,4% y 3,9%, respectivamente. El zinc fue el único metal industrial que registró una rentabilidad positiva (0,2%). Es probable que entre en un déficit de la oferta de acuerdo con los principales grupos de estudio de metal intergubernamental, tras la intensificación en los últimos meses de la demanda de India y China.
El Consejo Internacional de Cobre Forjado (IWCC, por sus siglas en inglés) ha culminado su última revisión del mercado del cobre. En el mismo se prevé que la demanda internacional de cobre refinado en 2016 aumente en un 1,5%, a 22 millones de toneladas. La mayor demanda provendrá de China y EE.UU, donde se espera que pare este año aumente en un 2,5%, a 10.34 millones de toneladas y un 2,2%, a 1,82 millones, respectivamente. Las previsiones del IWCC también sugieren que el mercado del cobre refinado debería en general estar bastante equilibrado en 2016 y 2017.
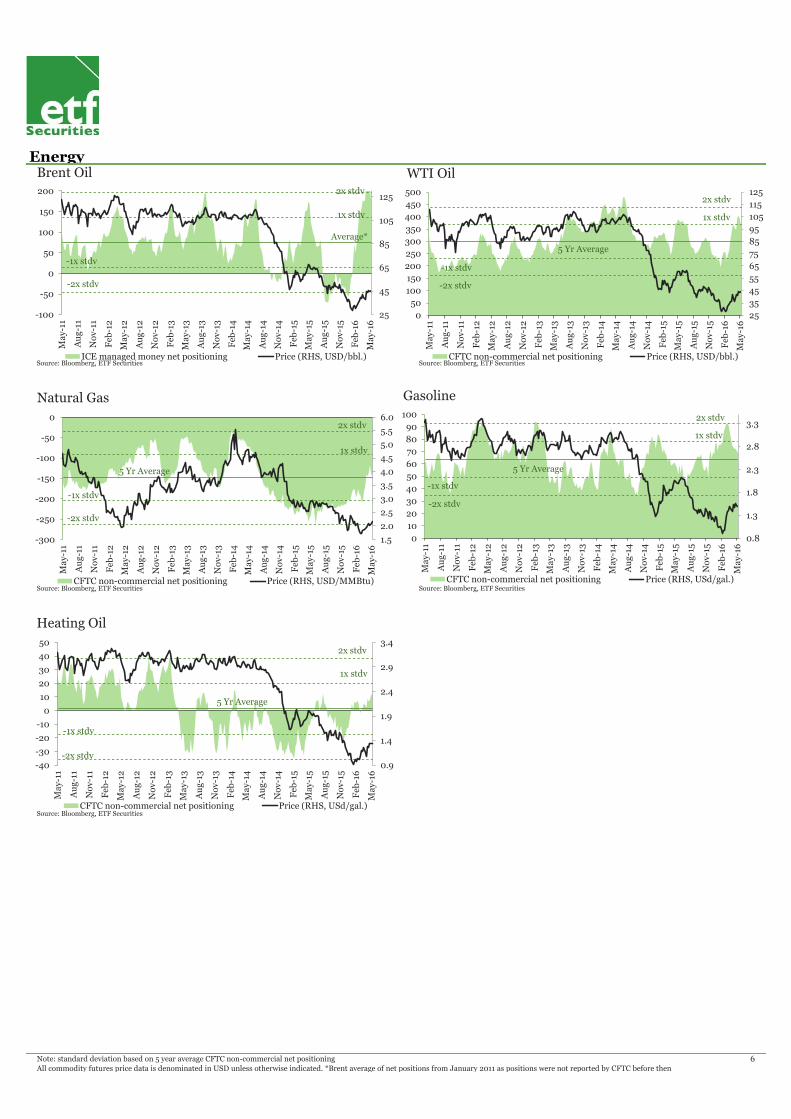
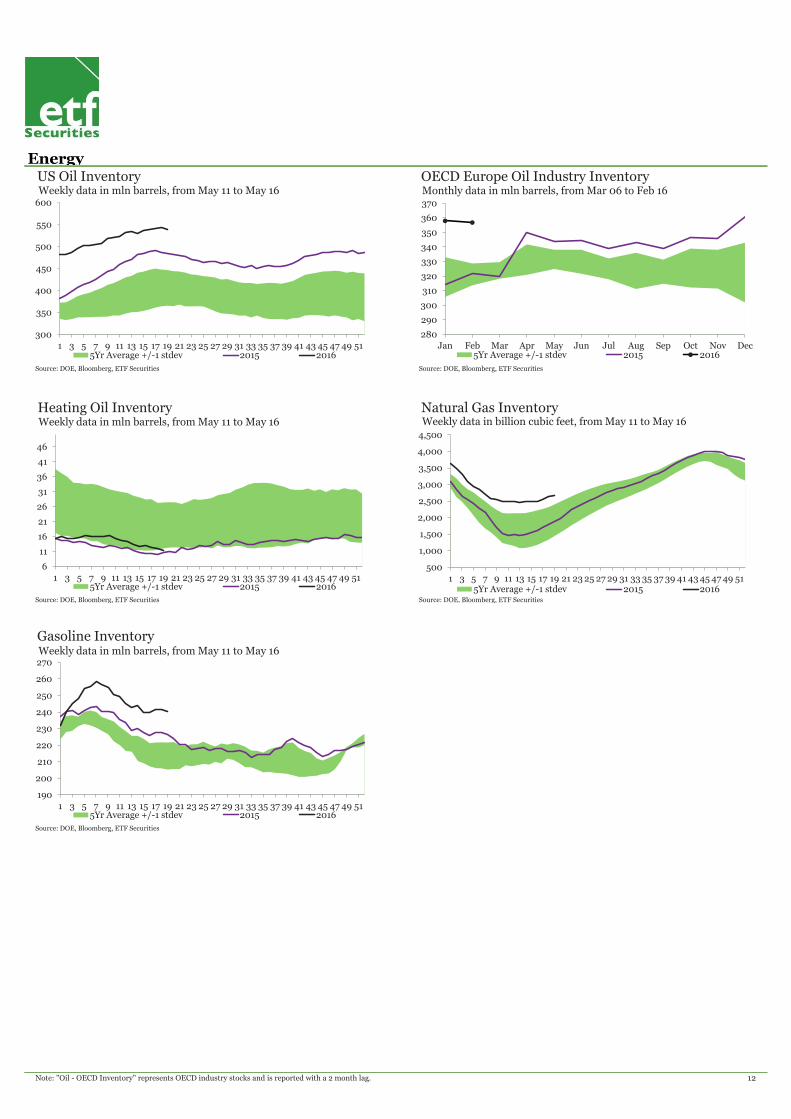
En el sector energético, los precios rebotaron durante el mes pasado, habiendo registrado el WTI y la calefacción apreciaciones de doble dígito. Históricamente, nunca ha habido un incremento del precio del crudo durante la temporada veraniega de conducción de automóviles, en la cual la demanda de destilados aumenta. Es por ello que, al estar estos precios sobre los máximos de sus rangos recientes, se necesita constatar un nuevo hecho para que tomen un nuevo impulso en un mercado donde la oferta mundial ya es excesiva de por sí. Si bien la producción de crudo de Estados Unidos cayó al nivel más bajo desde septiembre de 2014, los inventarios de crudo estadounidenses son los terceros más altos de la historia. La Administración de Información de Energía (AIE) ha advertido recientemente que " los elevados niveles de inventarios continuarán hasta fines de 2016".
La volatilidad sigue siendo elevada y los precios oscilan alrededor de los $45-50. Es probable que a corto plazo estén bajo presión, antes de que surjan indicios más sólidos de una reducción de la oferta que reimpulsen la tendencia alcista hacia fin de año.
Perspectivas por sector
0%
2%
4%
6%
8%
10%
12%
Hea
tin
g O
il
WT
I O
il
Bre
nt
Oil
Ca
rbo
n
Ga
soli
ne
Na
tura
lG
as
-10%
-5%
0%
5%
10%
15%
20%
25%
Su
ga
r
Le
an
Ho
gs
So
yb
ea
ns
Co
ffee
Co
rn
Co
coa
Wh
eat
Co
tto
n
Fee
der
Ca
ttle
So
yb
ea
n O
il
Liv
e C
att
le
0.0%
1.0%
2.0%
3.0%
4.0%
5.0%
6.0%
7.0%
8.0%
9.0%
10.0%
Pa
lla
diu
m
Pla
tin
um
Sil
ver
Go
ld
-5%
-4%
-3%
-2%
-1%
0%
1%
Zin
c
Alu
min
um
Le
ad
Tin
Nic
kel
Co
pp
er
(CO
ME
X)
Co
pp
er
(LM
E)
Posicionamiento Top 5/Bottom 5 Change in CFTC Net Positions1
Source: Bloomberg
Inventarios Top 5/Bottom 5 Change in Inventories2
Dinámica de curvas Top 5/Bottom 5 Roll Yields3
Source: Bloomberg
Indicadores técnicos Top 5/Bottom 5 Price Diff to 200 day moving av. (dma)4
Source: Bloomberg
1 CFTC futures net positioning as at report date, percent change from previous month.
2 Percent change in inventory based on 3 month change (in %).
3 Roll yields calculated as percent change between front month futures price and next month futures price on May 13, 2016.
4 Percent difference between the front month futures price and its 200 day moving average on May 13, 2016. 3
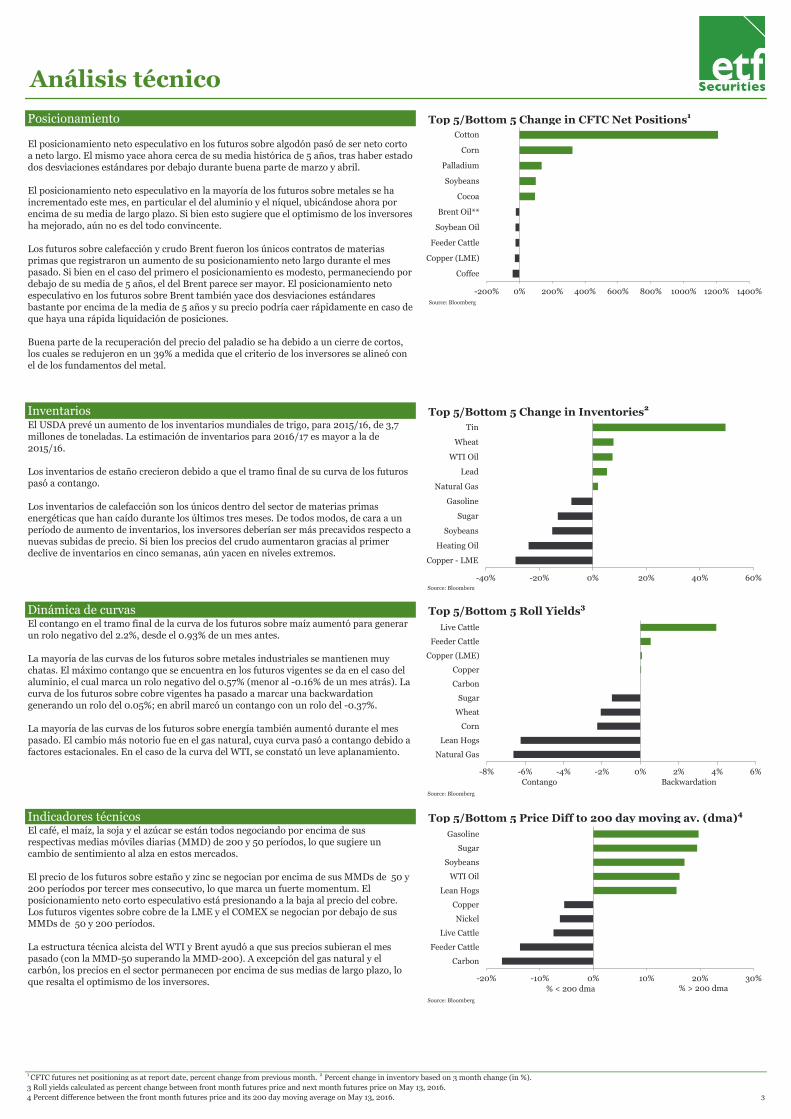
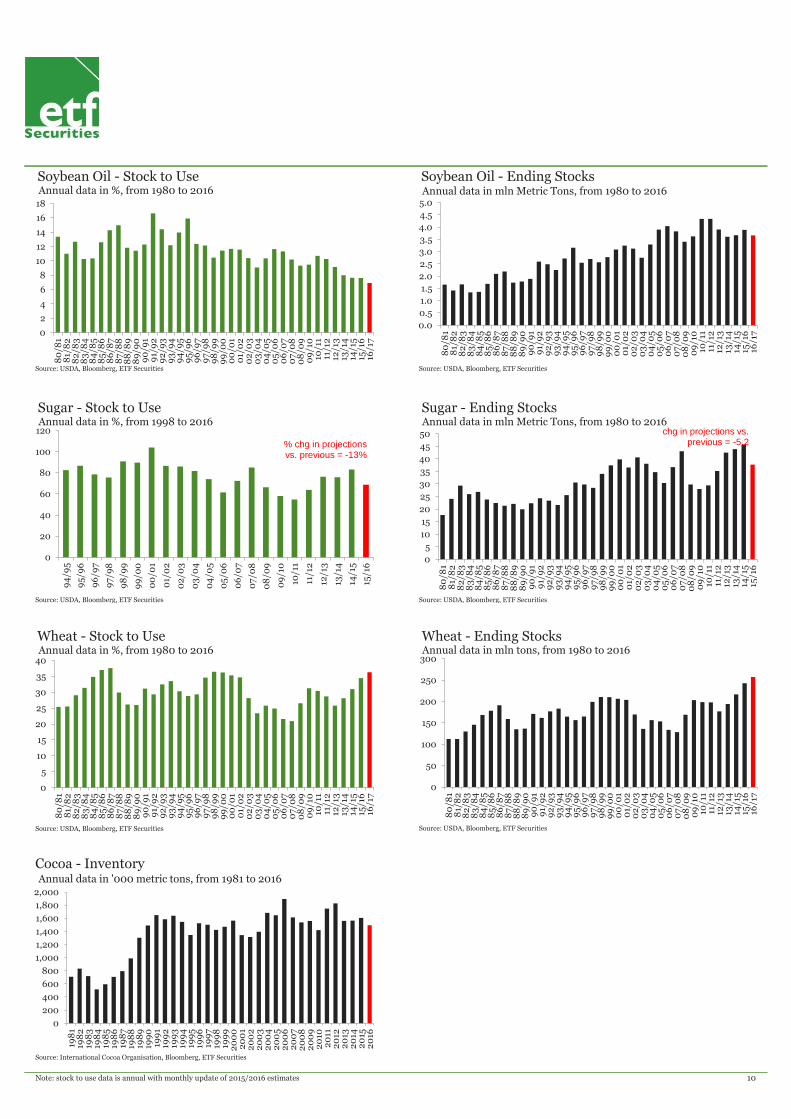
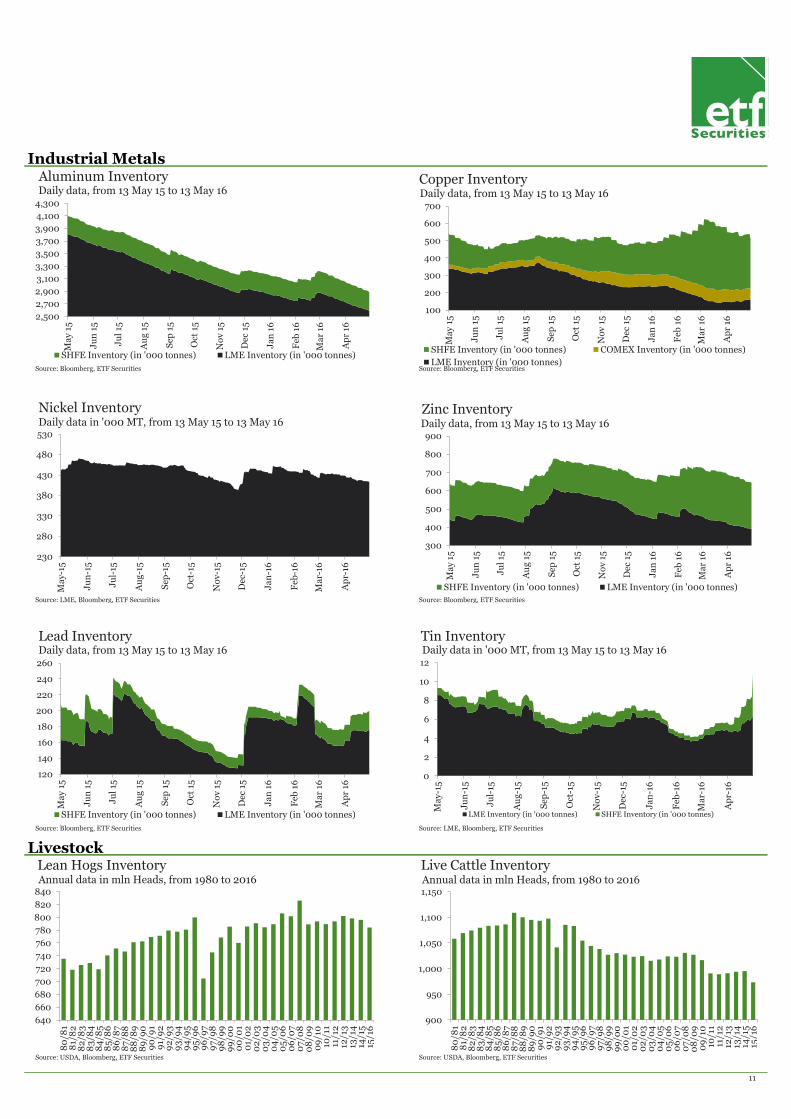
El USDA prevé un aumento de los inventarios mundiales de trigo, para 2015/16, de 3,7 millones de toneladas. La estimación de inventarios para 2016/17 es mayor a la de 2015/16.
Los inventarios de estaño crecieron debido a que el tramo final de su curva de los futuros pasó a contango.
Los inventarios de calefacción son los únicos dentro del sector de materias primas energéticas que han caído durante los últimos tres meses. De todos modos, de cara a un período de aumento de inventarios, los inversores deberían ser más precavidos respecto a nuevas subidas de precio. Si bien los precios del crudo aumentaron gracias al primer declive de inventarios en cinco semanas, aún yacen en niveles extremos.
Source: Bloomberg
El contango en el tramo final de la curva de los futuros sobre maíz aumentó para generar un rolo negativo del 2.2%, desde el 0.93% de un mes antes.
La mayoría de las curvas de los futuros sobre metales industriales se mantienen muy chatas. El máximo contango que se encuentra en los futuros vigentes se da en el caso del aluminio, el cual marca un rolo negativo del 0.57% (menor al -0.16% de un mes atrás). La curva de los futuros sobre cobre vigentes ha pasado a marcar una backwardation generando un rolo del 0.05%; en abril marcó un contango con un rolo del -0.37%.
La mayoría de las curvas de los futuros sobre energía también aumentó durante el mes pasado. El cambio más notorio fue en el gas natural, cuya curva pasó a contango debido a factores estacionales. En el caso de la curva del WTI, se constató un leve aplanamiento.
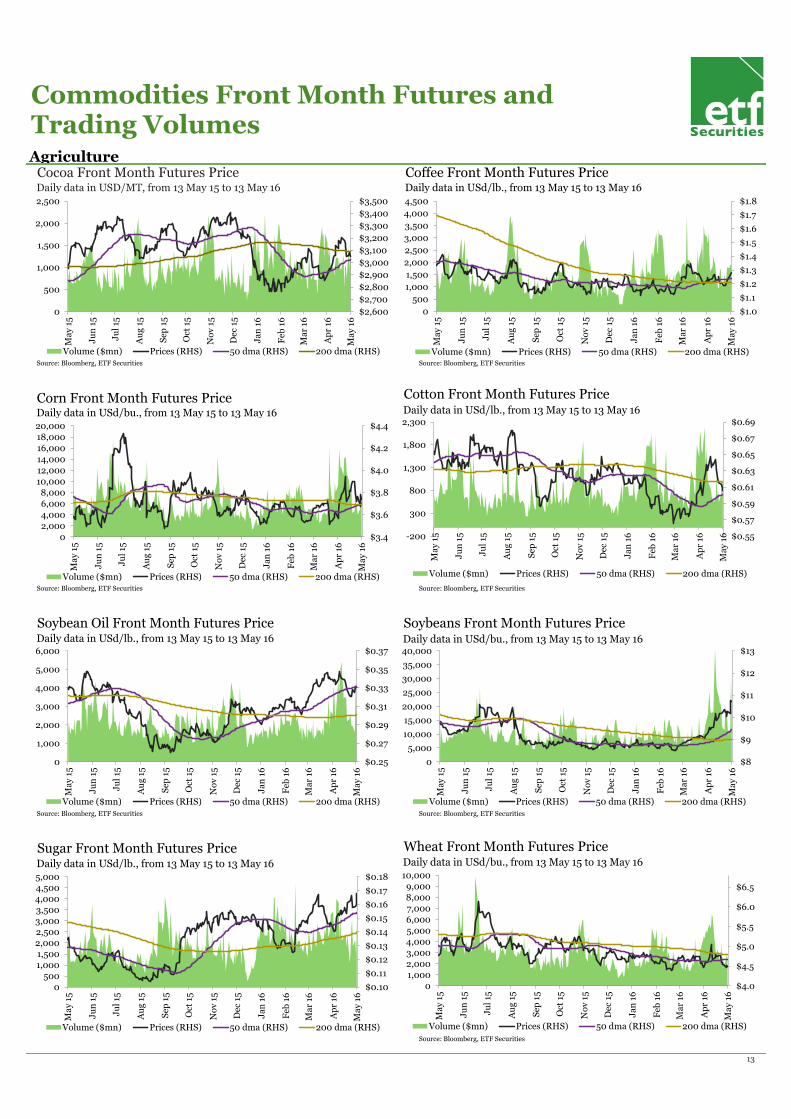
El café, el maíz, la soja y el azúcar se están todos negociando por encima de sus respectivas medias móviles diarias (MMD) de 200 y 50 períodos, lo que sugiere un cambio de sentimiento al alza en estos mercados.
El precio de los futuros sobre estaño y zinc se negocian por encima de sus MMDs de 50 y 200 períodos por tercer mes consecutivo, lo que marca un fuerte momentum. El posicionamiento neto corto especulativo está presionando a la baja al precio del cobre. Los futuros vigentes sobre cobre de la LME y el COMEX se negocian por debajo de sus MMDs de 50 y 200 períodos.
La estructura técnica alcista del WTI y Brent ayudó a que sus precios subieran el mes pasado (con la MMD-50 superando la MMD-200). A excepción del gas natural y el carbón, los precios en el sector permanecen por encima de sus medias de largo plazo, lo que resalta el optimismo de los inversores.
Análisis técnico
El posicionamiento neto especulativo en los futuros sobre algodón pasó de ser neto corto a neto largo. El mismo yace ahora cerca de su media histórica de 5 años, tras haber estado dos desviaciones estándares por debajo durante buena parte de marzo y abril.
El posicionamiento neto especulativo en la mayoría de los futuros sobre metales se ha incrementado este mes, en particular el del aluminio y el níquel, ubicándose ahora por encima de su media de largo plazo. Si bien esto sugiere que el optimismo de los inversores ha mejorado, aún no es del todo convincente.
Los futuros sobre calefacción y crudo Brent fueron los únicos contratos de materias primas que registraron un aumento de su posicionamiento neto largo durante el mes pasado. Si bien en el caso del primero el posicionamiento es modesto, permaneciendo por debajo de su media de 5 años, el del Brent parece ser mayor. El posicionamiento neto especulativo en los futuros sobre Brent también yace dos desviaciones estándares bastante por encima de la media de 5 años y su precio podría caer rápidamente en caso de que haya una rápida liquidación de posiciones.
Buena parte de la recuperación del precio del paladio se ha debido a un cierre de cortos, los cuales se redujeron en un 39% a medida que el criterio de los inversores se alineó con el de los fundamentos del metal.
-40% -20% 0% 20% 40% 60%
Tin
Wheat
WTI Oil
Lead
Natural Gas
Gasoline
Sugar
Soybeans
Heating Oil
Copper - LME
-20% -10% 0% 10% 20% 30%
Gasoline
Sugar
Soybeans
WTI Oil
Lean Hogs
Copper
Nickel
Live Cattle
Feeder Cattle
Carbon
% < 200 dma % > 200 dma
-8% -6% -4% -2% 0% 2% 4% 6%
Live Cattle
Feeder Cattle
Copper (LME)
Copper
Carbon
Sugar
Wheat
Corn
Lean Hogs
Natural Gas
Contango Backwardation
-200% 0% 200% 400% 600% 800% 1000% 1200% 1400%
Cotton
Corn
Palladium
Soybeans
Cocoa
Brent Oil**
Soybean Oil
Feeder Cattle
Copper (LME)
Coffee
4 23 42 61 4 3
Energy Energy
WTI Oil 46 10.7% 57.0% 13.4% -23.6% WTI Oil USD/bbl. NYMEX -1.5% -1.5% -2.9% -6.2%
Brent Oil 48 8.3% 43.4% 9.7% -28.4% Brent Oil USD/bbl. ICE -0.6% -1.1% -0.1% -2.0%
Natural Gas 2.1 2.9% 6.6% -11.2% -28.6% Natural Gas USD/MMBtu NYMEX -6.6% -6.3% -3.9% -3.4%
Gasoline 1.6 3.8% 52.2% 28.2% -22.2% Gasoline USd/gal. NYMEX -0.5% -0.6% -0.9% -19.2%
Heating Oil 1.4 10.9% 31.2% 1.6% -30.0% Heating Oil USd/gal. NYMEX -0.6% -0.7% -0.7% -1.2%
Carbon 5.8 5.6% 15.6% -30.4% -23.6% 5 Carbon EUR/MT ICE 0.0% 0.0% 0.0% 0.0%
Agriculture Agriculture
Wheat 4.7 0.8% 1.6% -6.2% -3.3% Wheat USd/bu. CBOT -2.1% -2.3% -1.3% -1.0%
Corn 3.8 2.3% 6.5% 6.6% 7.3% Corn USd/bu. CBOT -2.2% -0.4% -0.9% -1.3%
Soybeans 10.6 10.4% 20.9% 22.8% 8.2% Soybeans USd/bu. CBOT -0.9% -0.8% -0.9% -0.3%
Sugar 0.2 19.5% 27.3% 11.3% 29.2% Sugar USd/lb. NYBOT -1.5% -2.2% -2.0% 0.2%
Cotton 0.6 -1.6% 2.9% -1.7% -7.8% Cotton USd/lb. NYBOT -1.1% -0.3% 0.6% 0.2%
Coffee 1.3 5.8% 11.5% 14.8% -4.2% Coffee USd/lb. NYBOT -1.0% -0.8% -1.5% -1.8%
Soybean Oil 0.3 -5.3% 1.2% 19.0% -2.8% Soybean Oil USd/lb. CBOT -1.0% -0.8% -0.8% -0.7%
Cocoa 2,961 1.5% 4.7% -11.5% -1.3% Cocoa USD/MT NYBOT -0.2% -0.9% -1.2% -1.4%
Industrial Metals Industrial Metals
Aluminum 1,517 -2.0% 1.3% 2.6% -18.0% Aluminum USD/MT LME -0.6% -0.5% -0.2% -0.3%
Copper 2.1 -4.3% 2.3% -4.3% -29.7% 4 Copper USd/lb. COMEX 0.0% -0.1% -0.4% -0.3%
Copper (LME) 4,637 -4.4% 2.9% -4.0% -27.7% 3 Copper (LME) USD/MT LME 0.1% 0.1% 0.2% 0.1%
Zinc 1,880 0.2% 9.9% 17.3% -19.6% Zinc USD/MT LME -0.2% 0.0% -0.2% -0.1%
Nickel 8,600 -3.9% 10.4% -8.4% -38.6% Nickel USD/MT LME -0.2% -0.1% -0.1% -0.1%
Lead 1,706 -2.6% -8.2% 6.6% -15.1% 6 Lead USD/MT LME 0.0% -0.1% -0.2% 0.0%
Tin 16,657 -2.6% 7.4% 12.8% 6.3% Tin USD/MT LME -0.1% 0.0% 0.0% 0.2%
Precious Metals Precious Metals
Gold 1,273 2.1% 2.7% 17.7% 4.5% Gold USD/t oz. COMEX -0.2% -0.2% -0.1% 0.0%
Silver 17.1 4.8% 8.4% 20.5% -0.5% 7 Silver USD/t oz. COMEX -0.1% -0.1% -0.2% -0.2%
Platinum 1,052 5.0% 9.8% 21.8% -8.6% 9 Platinum USD/t oz. NYMEX -0.1% -0.1% -0.1% 0.0%
Palladium 592 9.2% 12.4% 9.9% -25.0% Palladium USD/t oz. NYMEX -0.2% -0.2% -0.2% -0.1%
Livestock Livestock
Live Cattle 1.2 -6.6% -5.0% -5.5% -18.8% 1 Live Cattle USd/lb. CME 4.0% 2.4% 8.6% 0.6%
Lean Hogs 0.8 15.5% 16.5% 40.2% -5.6% Lean Hogs USd/lb. CME -6.2% -5.5% -10.3% -7.6%
Feeder Cattle 1.5 -5.0% -2.0% -16.0% -32.8% 2 Feeder Cattle USd/lb. CME 0.5% 0.1% 3.3% 0.4%Sources: Bloomberg, ETF Securities Sources: Bloomberg, ETF Securities
Energy Energy
WTI Oil 362,159 300,028 349,788 294,340 384,799 6 Oil - US 541,294 33% 1% 7% 11%
Brent Oil** 176,801 74,940 225,161 -10,546 167,634 Oil - OECD Europe** 357 11% - -1% 5%
Natural Gas -135,841 -148,158 -144,869 -213,001 -240,150 5 Natural Gas - DOE 2,754 40% 11% 2% -31%
Gasoline 68,869 63,660 73,410 58,351 58,588 Gasoline - DOE 238,068 13% -1% -8% 11%
Heating Oil 12,767 1,253 8,782 -10,971 -10,764 Heating Oil - DOE 12,055 -42% -4% -24% -24%
Agriculture Industrial Metals
Wheat -80,845 -26,446 -122,852 -32,545 -82,399 Aluminum 2,877,587 -41% -6% -5% -12%
Corn 134,391 148,597 -60,198 21,695 -57,655 Aluminum - LME 2,584,400 -43% -5% -6% -13%
Soybeans 246,150 93,948 123,113 -36,542 13,064 Aluminium - SHFE 293,187 -4% -9% -1% 5%
Sugar 262,049 80,599 190,534 202,486 75,423 Copper 506,155 -6% -12% -4% -2%
Cotton 37,139 35,268 -3,346 41,764 56,660 Copper - LME 156,675 -52% 7% -29% -39%
Coffee 6,790 2,259 11,462 -19,878 -5,256 Copper - SHFE 286,210 79% -21% 19% 45%
Soybean Oil 92,729 12,772 121,268 13,500 69,529 Copper - COMEX 63,270 21% -11% -7% 1%
Cocoa 55,020 38,048 28,241 53,734 48,626 Nickel - LME 412,344 61% -4% -6% -1%
Industrial Metals5 Zinc 642,208 -40% -7% -6% -13%
Copper (COMEX) -22,808 -9,789 -22,309 -27,412 8,607 Zinc - LME 390,375 -51% -7% -15% -30%
Copper (LME) 23,995 23,995 32,856 24,890 74,128 Zinc - SHFE 251,833 -4% -6% 14% 42%
Aluminum 147,922 147,922 122,150 148,062 203,074 Lead 200,452 -35% 10% 5% 34%
Nickel 13,691 13,691 10,410 1,164 14,736 Lead - LME 176,075 -30% 8% -3% 30%
Zinc 60,863 60,863 63,867 26,382 118,344 Lead - SHFE 24,377 -57% 19% 174% 74%
Lead 23,870 23,870 22,904 24,832 36,662 Tin6 10,913 -13% 94% 131% 63%
Tin 2,091 2,091 2,400 2,779 1,412 Tin - LME 6,425 -44% 33% 50% 19%
Precious Metals Tin - SHFE 4,488 354% 477% 927% 252%
Gold 293,409 130,133 242,724 64,776 82,733 Agriculture
Silver 80,275 24,288 62,746 36,003 27,611 Wheat - USDA 257,340 32.5% 7.6% 7.7% 13.2%
Platinum 39,518 29,504 29,912 29,737 25,804 Corn - USDA 207,040 48% -0.9% -0.8% -2.3%
Palladium 7,442 15,161 3,160 10,285 18,458 Soybeans - USDA 68,210 13% -13.7% -15.2% -18%
Livestock Sugar - USDA 32,828 -8% -13.1% -13.1% -17%
Live Cattle 30,684 71,017 36,115 1,580 105,481 Cotton - USDA 96,480 31% -5.6% -7.3% -9.1%
Lean Hogs 64,048 48,078 62,961 13,922 29,879 Coffee - USDA 36,692 1% - - 16%
Feeder Cattle 2,106 6,536 2,759 793 8,552 Soybean Oil - USDA 3,670 -7% -1.9% 1% -1%
Sources: Bloomberg, ETF Securities1Performance of front month futures from 13 May 15 (1 Year), 13 Nov 15 (6 Month), 13 Feb 16 (3 Month) and 13 Apr 16 (1 Month) to 13 May 16.
2Roll return non-annualised from front month futures into second " month on 16 Feb 16 (3 Month), 13 Apr 16 (1 Month), 06 May 16 (1 Week), 13 May 16.
4
1 Month ROLL YIELDS2 13-May
Summary Tables
6 Month6 Month 5 Yr Average 1 Month 3 MonthINVENTORY LEVELS4 Current
1 Month6 Month 1 WeekExchangeUnit 3 Month
3Net positions in number of contracts.
4Current inventories relative to 1, 3, 6 months ago. Under the column "5 yr average" is the current inventory level relative to 5 year average inventory. For energy, 5 yr average is the average of the same month as report
month over the past 5 years. **Brent 5 Yr average of net positions from January 2011 as positions were not reported by CFTC before then and inventory data (OECD) reported with 2 month lag with current = Dec 2015.5All Industrial metals positioning data
(excluding copper) is sourced from LME COTR data in Bloomberg from 28th July 14 (first available date). 6
SHFE started reporting inventory data from April 2015
1 YearCurrent
Current 1 Year
5 Yr Average
1 MonthCFTC NET
POSITIONING3
PRICES1 3 Month
Agriculture
Source: Bloomberg, ETF Securities Source: Bloomberg, ETF Securities
Source: Bloomberg, ETF Securities Source: Bloomberg, ETF Securities
Source: Bloomberg, ETF Securities Source: Bloomberg, ETF Securities
Source: Bloomberg, ETF Securities Source: Bloomberg, ETF Securities
Note: standard deviation based on 5 year average CFTC non-commercial net positioning 5All commodity futures price data is denominated in USD unless otherwise indicated.
CFTC Speculative Net Long Futures Positions
1,500
1,700
1,900
2,100
2,300
2,500
2,700
2,900
3,100
3,300
3,500
-30
-10
10
30
50
70
90
110
Ma
y-11
Au
g-1
1
No
v-1
1
Feb
-12
Ma
y-1
2
Au
g-1
2
No
v-1
2
Feb
-13
Ma
y-1
3
Au
g-1
3
No
v-1
3
Feb
-14
Ma
y-1
4
Au
g-1
4
No
v-1
4
Feb
-15
Ma
y-1
5
Au
g-1
5
No
v-1
5
Feb
-16
Ma
y-16
Cocoa
CFTC non-commercial net positioning Price (RHS, USD/MT)
-1x stdv
-2x stdv
1x stdv
2x stdv
5 Yr Average
1.0
1.5
2.0
2.5
3.0
3.5
-50
-30
-10
10
30
50
70
Ma
y-1
1
Au
g-1
1
No
v-1
1
Feb
-12
Ma
y-1
2
Au
g-1
2
No
v-1
2
Feb
-13
Ma
y-1
3
Au
g-1
3
No
v-1
3
Feb
-14
Ma
y-14
Au
g-1
4
No
v-1
4
Feb
-15
Ma
y-1
5
Au
g-1
5
No
v-1
5
Feb
-16
Ma
y-1
6
Coffee
CFTC non-commercial net positioning Price (RHS, USd/lb.)
1x stdv
-1x stdv
2x stdv
-2x stdv
5 Yr Average
2
3
4
5
6
7
8
9
-150
-50
50
150
250
350
450
550
Ma
y-1
1
Au
g-1
1
No
v-1
1
Feb
-12
Ma
y-1
2
Au
g-1
2
No
v-1
2
Feb
-13
Ma
y-1
3
Au
g-1
3
No
v-1
3
Feb
-14
Ma
y-1
4
Au
g-1
4
No
v-1
4
Feb
-15
Ma
y-15
Au
g-1
5
No
v-1
5
Feb
-16
Ma
y-1
6
Corn
CFTC non-commercial net positioning Price (RHS, USd/bu.)
1x stdv
-1x stdv
2x stdv
-2x stdv
5 Yr Average
0.0
0.2
0.4
0.6
0.8
1.0
1.2
1.4
1.6
1.8
2.0
-40
-20
0
20
40
60
80
100M
ay-
11
Au
g-1
1
No
v-1
1
Feb
-12
Ma
y-1
2
Au
g-1
2
No
v-1
2
Feb
-13
Ma
y-1
3
Au
g-1
3
No
v-1
3
Feb
-14
Ma
y-1
4
Au
g-1
4
No
v-1
4
Feb
-15
Ma
y-15
Au
g-1
5
No
v-1
5
Feb
-16
Ma
y-1
6
Cotton
CFTC non-commercial net positioning Price (RHS, USd/lb.)
1x stdv
-1x stdv
2x stdv
-2x stdv
5 Yr Average
0.20
0.25
0.30
0.35
0.40
0.45
0.50
0.55
0.60
0.65
-100
-50
0
50
100
150
Ma
y-1
1
Au
g-1
1
No
v-1
1
Feb
-12
Ma
y-1
2
Au
g-1
2
No
v-1
2
Feb
-13
Ma
y-1
3
Au
g-1
3
No
v-1
3
Feb
-14
Ma
y-14
Au
g-1
4
No
v-1
4
Feb
-15
Ma
y-1
5
Au
g-1
5
No
v-1
5
Feb
-16
Ma
y-1
6
Soybean Oil
CFTC non-commercial net positioning Price (RHS, USd/lb.)
1x stdv
-1x stdv
2x stdv
-2x stdv
5 Yr Average
6
8
10
12
14
16
18
20
-150
-100
-50
0
50
100
150
200
250
300
Ma
y-1
1
Au
g-1
1
No
v-1
1
Feb
-12
Ma
y-12
Au
g-1
2
No
v-1
2
Feb
-13
Ma
y-13
Au
g-1
3
No
v-1
3
Feb
-14
Ma
y-14
Au
g-1
4
No
v-1
4
Feb
-15
Ma
y-1
5
Au
g-1
5
No
v-1
5
Feb
-16
Ma
y-16
Soybeans
CFTC non-commercial net positioning Price (RHS, USd/bu.)
1x stdv
-1x stdv
2x stdv
-2x stdv
5 Yr Average
0.05
0.10
0.15
0.20
0.25
0.30
0.35
-100
-50
0
50
100
150
200
250
300
Ma
y-11
Au
g-1
1
No
v-1
1
Feb
-12
Ma
y-1
2
Au
g-1
2
No
v-1
2
Feb
-13
Ma
y-1
3
Au
g-1
3
No
v-1
3
Feb
-14
Ma
y-1
4
Au
g-1
4
No
v-1
4
Feb
-15
Ma
y-15
Au
g-1
5
No
v-1
5
Feb
-16
Ma
y-1
6
Sugar
CFTC non-commercial net positioning Price (RHS, USd/lb.)
1x stdv
-1x stdv
2x stdv
-2x stdv
5 Yr Average
3
4
5
6
7
8
9
10
-150
-100
-50
0
50
100
Ma
y-11
Au
g-1
1
No
v-1
1
Feb
-12
Ma
y-12
Au
g-1
2
No
v-1
2
Feb
-13
Ma
y-1
3
Au
g-1
3
No
v-1
3
Feb
-14
Ma
y-1
4
Au
g-1
4
No
v-1
4
Feb
-15
Ma
y-1
5
Au
g-1
5
No
v-1
5
Feb
-16
Ma
y-16
Wheat
CFTC non-commercial net positioning Price (RHS, USd/bu.)
1x stdv
-1x stdv
2x stdv
-2x stdv
5 Yr Average
Energy
Source: Bloomberg, ETF Securities Source: Bloomberg, ETF Securities
Source: Bloomberg, ETF Securities Source: Bloomberg, ETF Securities
Source: Bloomberg, ETF Securities
Note: standard deviation based on 5 year average CFTC non-commercial net positioning 6All commodity futures price data is denominated in USD unless otherwise indicated. *Brent average of net positions from January 2011 as positions were not reported by CFTC before then
0.9
1.4
1.9
2.4
2.9
3.4
-40
-30
-20
-10
0
10
20
30
40
50
Ma
y-11
Au
g-1
1
No
v-1
1
Feb
-12
Ma
y-1
2
Au
g-1
2
No
v-1
2
Feb
-13
Ma
y-1
3
Au
g-1
3
No
v-1
3
Feb
-14
Ma
y-1
4
Au
g-1
4
No
v-1
4
Feb
-15
Ma
y-15
Au
g-1
5
No
v-1
5
Feb
-16
Ma
y-1
6
Heating Oil
CFTC non-commercial net positioning Price (RHS, USd/gal.)
1x stdv
-1x stdv
2x stdv
-2x stdv
5 Yr Average
1.5
2.0
2.5
3.0
3.5
4.0
4.5
5.0
5.5
6.0
-300
-250
-200
-150
-100
-50
0
Ma
y-11
Au
g-1
1
No
v-1
1
Feb
-12
Ma
y-1
2
Au
g-1
2
No
v-1
2
Feb
-13
Ma
y-1
3
Au
g-1
3
No
v-1
3
Feb
-14
Ma
y-1
4
Au
g-1
4
No
v-1
4
Feb
-15
Ma
y-1
5
Au
g-1
5
No
v-1
5
Feb
-16
Ma
y-16
Natural Gas
CFTC non-commercial net positioning Price (RHS, USD/MMBtu)
1x stdv
-1x stdv
2x stdv
-2x stdv
5 Yr Average
0.8
1.3
1.8
2.3
2.8
3.3
0
10
20
30
40
50
60
70
80
90
100M
ay
-11
Au
g-1
1
No
v-1
1
Feb
-12
Ma
y-1
2
Au
g-1
2
No
v-1
2
Feb
-13
Ma
y-1
3
Au
g-1
3
No
v-1
3
Feb
-14
Ma
y-1
4
Au
g-1
4
No
v-14
Feb
-15
Ma
y-1
5
Au
g-1
5
No
v-1
5
Feb
-16
Ma
y-1
6
Gasoline
CFTC non-commercial net positioning Price (RHS, USd/gal.)
1x stdv
-1x stdv
2x stdv
-2x stdv
5 Yr Average
25
45
65
85
105
125
-100
-50
0
50
100
150
200
Ma
y-1
1
Au
g-1
1
No
v-1
1
Feb
-12
Ma
y-12
Au
g-1
2
No
v-1
2
Feb
-13
Ma
y-13
Au
g-1
3
No
v-1
3
Feb
-14
Ma
y-1
4
Au
g-1
4
No
v-1
4
Feb
-15
Ma
y-1
5
Au
g-1
5
No
v-1
5
Feb
-16
Ma
y-16
Brent Oil
ICE managed money net positioning Price (RHS, USD/bbl.)
1x stdv
-1x stdv
2x stdv
-2x stdv
Average*
25
35
45
55
65
75
85
95
105
115
125
0
50
100
150
200
250
300
350
400
450
500
Ma
y-1
1
Au
g-1
1
No
v-1
1
Feb
-12
Ma
y-1
2
Au
g-1
2
No
v-12
Feb
-13
Ma
y-1
3
Au
g-1
3
No
v-1
3
Feb
-14
Ma
y-14
Au
g-1
4
No
v-1
4
Feb
-15
Ma
y-1
5
Au
g-1
5
No
v-1
5
Feb
-16
Ma
y-1
6
WTI Oil
CFTC non-commercial net positioning Price (RHS, USD/bbl.)
1x stdv
-1x stdv
2x stdv
-2x stdv
5 Yr Average
-50
-40
-30
-20
-10
10
20
30
Copper (COMEX)
Industrial Metals
Source: Bloomberg, ETF Securities Source: Bloomberg, ETF Securities
Source: Bloomberg, ETF Securities Source: Bloomberg, ETF Securities
Source: Bloomberg, ETF Securities Source: Bloomberg, ETF Securities
Source: Bloomberg, ETF Securities
Note: standard deviation based on 5 year average CFTC non-commercial net positioning. LME non-commercial net positions averaged from 28th
July 14 and respective graphs represent daily data. 7All commodity futures price data is denominated in USD unless otherwise indicated.
1,400
1,500
1,600
1,700
1,800
1,900
2,000
2,100
2,200
70
90
110
130
150
170
190
210
230
250
Ju
l-14
Au
g-1
4
Sep
-14
Oct
-14
No
v-1
4
Dec
-14
Ja
n-1
5
Feb
-15
Ma
r-15
Ap
r-15
Ma
y-1
5
Ju
n-1
5
Ju
l-15
Au
g-1
5
Sep
-15
Oct
-15
No
v-1
5
Dec
-15
Ja
n-1
6
Feb
-16
Ma
r-16
Ap
r-16
Aluminum
LME non-commercial net positioning Price (RHS, USD/MT)
1x stdv
-1x stdv
2x stdv
-2x stdv
Series average since Jul 2014
1.7
2.2
2.7
3.2
3.7
4.2
4.7
-50
-40
-30
-20
-10
0
10
20
30
Ma
y-11
Au
g-1
1
No
v-1
1
Feb
-12
Ma
y-1
2
Au
g-1
2
No
v-1
2
Feb
-13
Ma
y-1
3
Au
g-1
3
No
v-1
3
Feb
-14
Ma
y-1
4
Au
g-1
4
No
v-1
4
Feb
-15
Ma
y-15
Au
g-1
5
No
v-1
5
Feb
-16
Ma
y-1
6
Copper (COMEX)
CFTC non-commercial net positioning Price (RHS, USd/lb.)
1x stdv
-1x stdv
2x stdv
-2x stdv
5 Yr Average
7,000
9,000
11,000
13,000
15,000
17,000
19,000
-5
0
5
10
15
20
25
30
35
Ju
l-14
Au
g-1
4
Sep
-14
Oct
-14
No
v-1
4
Dec
-14
Ja
n-1
5
Feb
-15
Ma
r-15
Ap
r-15
Ma
y-1
5
Ju
n-1
5
Ju
l-15
Au
g-1
5
Sep
-15
Oct
-15
No
v-1
5
Dec
-15
Ja
n-1
6
Feb
-16
Ma
r-16
Ap
r-16
Nickel
LME non-commercial net positioning Price (RHS, USD/MT)
1x stdv
-1x stdv
2x stdv
-2x stdv
Series average since Jul 2014
1,400
1,600
1,800
2,000
2,200
2,400
2,600
0
20
40
60
80
100
120
140J
ul-
14
Au
g-1
4
Sep
-14
Oct
-14
No
v-1
4
Dec
-14
Ja
n-1
5
Feb
-15
Ma
r-15
Ap
r-15
Ma
y-1
5
Ju
n-1
5
Ju
l-15
Au
g-1
5
Sep
-15
Oct
-15
No
v-1
5
Dec
-15
Ja
n-1
6
Feb
-16
Ma
r-16
Ap
r-16
Zinc
LME non-commercial net positioning Price (RHS, USD/MT)
1x stdv
-1x stdv
2x stdv
-2x stdv
Series average since Jul 2014
1,550
1,650
1,750
1,850
1,950
2,050
2,150
2,250
0
5
10
15
20
25
30
35
40
45
50
Ju
l-14
Au
g-1
4
Sep
-14
Oct
-14
No
v-1
4
Dec
-14
Ja
n-1
5
Feb
-15
Ma
r-15
Ap
r-15
Ma
y-1
5
Ju
n-1
5
Ju
l-15
Au
g-1
5
Sep
-15
Oct
-15
No
v-1
5
Dec
-15
Ja
n-1
6
Feb
-16
Ma
r-16
Ap
r-16
Lead
LME non-commercial net positioning Price (RHS, USD/MT)
1x stdv
-1x stdv
2x stdv
-2x stdv
Series average since Jul 2014
12,500
14,500
16,500
18,500
20,500
22,500
24,500
0.0
0.5
1.0
1.5
2.0
2.5
3.0
3.5
4.0
4.5
Ju
l-14
Au
g-1
4
Sep
-14
Oct
-14
No
v-1
4
Dec
-14
Ja
n-1
5
Feb
-15
Ma
r-15
Ap
r-15
Ma
y-15
Ju
n-1
5
Ju
l-15
Au
g-1
5
Sep
-15
Oct
-15
No
v-1
5
Dec
-15
Ja
n-1
6
Feb
-16
Ma
r-16
Ap
r-16
Tin
LME non-commercial net positioning Price (RHS, USD/MT)
1x stdv
-1x stdv
2x stdv
-2x stdv
Series average since Jul 2014
4,000
4,500
5,000
5,500
6,000
6,500
7,000
7,500
-10
0
10
20
30
40
50
60
70
80
Ju
l-14
Au
g-1
4
Sep
-14
Oct
-14
No
v-1
4
Dec
-14
Ja
n-1
5
Feb
-15
Ma
r-15
Ap
r-15
Ma
y-15
Ju
n-1
5
Ju
l-15
Au
g-1
5
Sep
-15
Oct
-15
No
v-1
5
Dec
-15
Ja
n-1
6
Feb
-16
Ma
r-16
Ap
r-16
Copper (LME)
LME non-commercial net positioning Price (RHS, USD/MT)
1x stdv
-1x stdv
2x stdv
-2x stdv
Series average since Jul 2014
Precious Metals
Source: Bloomberg, ETF Securities Source: Bloomberg, ETF Securities
Source: Bloomberg, ETF Securities Source: Bloomberg, ETF Securities
Livestock
Source: Bloomberg, ETF Securities
Source: Bloomberg, ETF Securities
Source: Bloomberg, ETF Securities
Note: standard deviation based on 5 year average CFTC non-commercial net positioning 8All commodity futures price data is denominated in USD unless otherwise indicated.
0.4
0.5
0.6
0.7
0.8
0.9
1.0
1.1
1.2
1.3
1.4
-40
-20
0
20
40
60
80
100
120
Ma
y-1
1
Au
g-1
1
No
v-1
1
Feb
-12
Ma
y-1
2
Au
g-1
2
No
v-1
2
Feb
-13
Ma
y-1
3
Au
g-1
3
No
v-1
3
Feb
-14
Ma
y-1
4
Au
g-1
4
No
v-1
4
Feb
-15
Ma
y-1
5
Au
g-1
5
No
v-1
5
Feb
-16
Ma
y-1
6
Lean Hogs
CFTC non-commercial net positioning Price (RHS, USd/lb.)
1x stdv
-1x stdv
2x stdv
-2x stdv
5 Yr Average
0.7
0.9
1.1
1.3
1.5
1.7
1.9
-40
-20
0
20
40
60
80
100
120
140
160
180
Ma
y-1
1
Au
g-1
1
No
v-1
1
Feb
-12
Ma
y-12
Au
g-1
2
No
v-1
2
Feb
-13
Ma
y-13
Au
g-1
3
No
v-1
3
Feb
-14
Ma
y-14
Au
g-1
4
No
v-1
4
Feb
-15
Ma
y-1
5
Au
g-1
5
No
v-1
5
Feb
-16
Ma
y-1
6
Live Cattle
CFTC non-commercial net positioning Price (RHS, USd/lb.)
1x stdv
-1x stdv
2x stdv
-2x stdv
5 Yr Average
0.8
1.0
1.2
1.4
1.6
1.8
2.0
2.2
2.4
2.6
-10
-5
0
5
10
15
20
25
Ma
y-11
Au
g-1
1
No
v-1
1
Feb
-12
Ma
y-1
2
Au
g-1
2
No
v-1
2
Feb
-13
Ma
y-1
3
Au
g-1
3
No
v-1
3
Feb
-14
Ma
y-1
4
Au
g-1
4
No
v-1
4
Feb
-15
Ma
y-15
Au
g-1
5
No
v-1
5
Feb
-16
Ma
y-1
6
Feeder Cattle
CFTC non-commercial net positioning Price (RHS, USd/lb.)
1x stdv
-1x stdv
2x stdv
-2x stdv
5 Yr Average
0
7
14
21
28
35
42
49
-20
-10
0
10
20
30
40
50
60
70
80
90
Ma
y-1
1
Au
g-1
1
No
v-1
1
Feb
-12
Ma
y-1
2
Au
g-1
2
No
v-1
2
Feb
-13
Ma
y-1
3
Au
g-1
3
No
v-1
3
Feb
-14
Ma
y-14
Au
g-1
4
No
v-1
4
Feb
-15
Ma
y-1
5
Au
g-1
5
No
v-1
5
Feb
-16
Ma
y-1
6
Silver
CFTC non-commercial net positioning Price (RHS, USD/t oz.)
1x stdv
-1x stdv
2x stdv
-2x stdv
5 Yr Average
900
1,100
1,300
1,500
1,700
1,900
2,100
0
50
100
150
200
250
300
Ma
y-11
Au
g-1
1
No
v-1
1
Feb
-12
Ma
y-12
Au
g-1
2
No
v-1
2
Feb
-13
Ma
y-13
Au
g-1
3
No
v-1
3
Feb
-14
Ma
y-1
4
Au
g-1
4
No
v-1
4
Feb
-15
Ma
y-1
5
Au
g-1
5
No
v-1
5
Feb
-16
Ma
y-16
Gold
CFTC non-commercial net positioning Price (RHS, USD/t oz.)
1x stdv
-1x stdv
2x stdv
-2x stdv
5 Yr Average
450
500
550
600
650
700
750
800
850
900
950
0
5
10
15
20
25
30
35M
ay
-11
Au
g-1
1
No
v-1
1
Feb
-12
Ma
y-12
Au
g-1
2
No
v-1
2
Feb
-13
Ma
y-13
Au
g-1
3
No
v-1
3
Feb
-14
Ma
y-1
4
Au
g-1
4
No
v-1
4
Feb
-15
Ma
y-1
5
Au
g-1
5
No
v-1
5
Feb
-16
Ma
y-16
Palladium
CFTC non-commercial net positioning Price (RHS, USD/t oz.)
1x stdv
-1x stdv
2x stdv
-2x stdv
5 Yr Average
750
950
1,150
1,350
1,550
1,750
1,950
0
10
20
30
40
50
60
Ma
y-1
1
Au
g-1
1
No
v-1
1
Feb
-12
Ma
y-1
2
Au
g-1
2
No
v-1
2
Feb
-13
Ma
y-1
3
Au
g-1
3
No
v-1
3
Feb
-14
Ma
y-1
4
Au
g-1
4
No
v-14
Feb
-15
Ma
y-1
5
Au
g-1
5
No
v-1
5
Feb
-16
Ma
y-1
6
Platinum
CFTC non-commercial net positioning Price (RHS, USD/t oz.)
1x stdv
-1x stdv
2x stdv
-2x stdv
5 Yr Average
Agriculture
Source: USDA, Bloomberg, ETF Securities Source: USDA, Bloomberg, ETF Securities
Source: USDA, Bloomberg, ETF Securities Source: USDA, Bloomberg, ETF Securities
Source: USDA, Bloomberg, ETF Securities Source: USDA, Bloomberg, ETF Securities
Source: USDA, Bloomberg, ETF Securities Source: USDA, Bloomberg, ETF Securities
Note: stock to use data is annual with monthly update of 2015/2016 estimates 9
Inventories
0
5
10
15
20
25
30
35
40
45
50
80
/81
81/
82
82
/83
83
/84
84
/85
85
/86
86
/87
87
/88
88
/89
89
/90
90
/91
91/
92
92
/93
93
/94
94
/95
95
/96
96
/97
97
/98
98
/99
99
/00
00
/01
01/
02
02
/03
03
/04
04
/05
05
/06
06
/07
07
/08
08
/09
09
/10
10/1
111
/12
12/1
313
/14
14/1
515
/16
16/1
7
Corn - Stock to Use Annual data in %, from 1980 to 2016
% chg in projections vs. previous = -4.9%
0
50
100
150
200
250
80
/81
81/
82
82
/83
83
/84
84
/85
85
/86
86
/87
87
/88
88
/89
89
/90
90
/91
91/
92
92
/93
93
/94
94
/95
95
/96
96
/97
97
/98
98
/99
99
/00
00
/01
01/
02
02
/03
03
/04
04
/05
05
/06
06
/07
07
/08
08
/09
09
/10
10/1
111
/12
12/1
313
/14
14/1
515
/16
Coffee - Stock to Use Annual data in %, from 1980 to 2016
% chg in projections vs. previous = -1.8%
0
20
40
60
80
100
120
80
/81
81/
82
82
/83
83
/84
84
/85
85
/86
86
/87
87
/88
88
/89
89
/90
90
/91
91/
92
92
/93
93
/94
94
/95
95
/96
96
/97
97
/98
98
/99
99
/00
00
/01
01/
02
02
/03
03
/04
04
/05
05
/06
06
/07
07
/08
08
/09
09
/10
10/1
111
/12
12/1
313
/14
14/1
515
/16
16/1
7
Cotton - Stock to Use Annual data in %, from 1980 to 2016 % chg in projections vs.
previous = -7.1%
0
5
10
15
20
25
30
80
/81
81/
82
82
/83
83
/84
84
/85
85
/86
86
/87
87
/88
88
/89
89
/90
90
/91
91/
92
92
/93
93
/94
94
/95
95
/96
96
/97
97
/98
98
/99
99
/00
00
/01
01/
02
02
/03
03
/04
04
/05
05
/06
06
/07
07
/08
08
/09
09
/10
10/1
111
/12
12/1
313
/14
14/1
515
/16
16/1
7
Soybeans - Stock to Use Annual data in %, from 1980 to 2016
% chg in projections vs. previous = -16.7%
0
10
20
30
40
50
60
70
80
90
80
/81
81/
82
82
/83
83
/84
84
/85
85
/86
86
/87
87
/88
88
/89
89
/90
90
/91
91/
92
92
/93
93
/94
94
/95
95
/96
96
/97
97
/98
98
/99
99
/00
00
/01
01/
02
02
/03
03
/04
04
/05
05
/06
06
/07
07
/08
08
/09
09
/10
10/1
111
/12
12/1
313
/14
14/1
515
/16
16/1
7
Soybeans - Ending Stocks Annual data in , from 1980 to 2016
chg in projections vs. previous = -10.8
0
10
20
30
40
50
608
0/8
18
1/8
28
2/8
38
3/8
48
4/8
58
5/8
68
6/8
78
7/8
88
8/8
98
9/9
09
0/9
19
1/9
29
2/9
39
3/9
49
4/9
59
5/9
69
6/9
79
7/9
89
8/9
99
9/0
00
0/0
10
1/0
20
2/0
30
3/0
40
4/0
50
5/0
60
6/0
70
7/0
80
8/0
90
9/1
010
/11
11/1
212
/13
13/1
414
/15
15/1
6
Coffee - Ending Stocks Annual data in mln bags (60 kg), from 1980 to 2016
chg in projections vs. previous = -0.6
0
20
40
60
80
100
120
80
/81
81/
82
82
/83
83
/84
84
/85
85
/86
86
/87
87
/88
88
/89
89
/90
90
/91
91/
92
92
/93
93
/94
94
/95
95
/96
96
/97
97
/98
98
/99
99
/00
00
/01
01/
02
02
/03
03
/04
04
/05
05
/06
06
/07
07
/08
08
/09
09
/10
10/1
111
/12
12/1
313
/14
14/1
515
/16
16/1
7
Cotton - Ending Stocks Annual data in mln 480 lb Bales, from 1980 to 2016
chg in projections vs. previous = -5.7
0
50
100
150
200
250
80
/81
81/
82
82
/83
83
/84
84
/85
85
/86
86
/87
87
/88
88
/89
89
/90
90
/91
91/
92
92
/93
93
/94
94
/95
95
/96
96
/97
97
/98
98
/99
99
/00
00
/01
01/
02
02
/03
03
/04
04
/05
05
/06
06
/07
07
/08
08
/09
09
/10
10/1
111
/12
12/1
313
/14
14/1
515
/16
16/1
7
Corn - Ending Stocks Annual data in mln tons, from 1980 to 2016
chg in projections vs. previous = -1.9
Source: USDA, Bloomberg, ETF Securities Source: USDA, Bloomberg, ETF Securities
Source: USDA, Bloomberg, ETF Securities Source: USDA, Bloomberg, ETF Securities
Source: USDA, Bloomberg, ETF Securities Source: USDA, Bloomberg, ETF Securities
Source: International Cocoa Organisation, Bloomberg, ETF Securities
Note: stock to use data is annual with monthly update of 2015/2016 estimates 10
0
5
10
15
20
25
30
35
40
80
/81
81/
82
82
/83
83
/84
84
/85
85
/86
86
/87
87
/88
88
/89
89
/90
90
/91
91/
92
92
/93
93
/94
94
/95
95
/96
96
/97
97
/98
98
/99
99
/00
00
/01
01/
02
02
/03
03
/04
04
/05
05
/06
06
/07
07
/08
08
/09
09
/10
10/1
111
/12
12/1
313
/14
14/1
515
/16
16/1
7
Wheat - Stock to Use Annual data in %, from 1980 to 2016
% chg in projections vs. previous = 7.0%
0
20
40
60
80
100
120
94
/95
95
/96
96
/97
97
/98
98
/99
99
/00
00
/01
01/
02
02
/03
03
/04
04
/05
05
/06
06
/07
07
/08
08
/09
09
/10
10/1
1
11/1
2
12/1
3
13/1
4
14/1
5
15/1
6
Sugar - Stock to Use Annual data in %, from 1998 to 2016
% chg in projections vs. previous = -13%
0
2
4
6
8
10
12
14
16
18
80
/81
81/
82
82
/83
83
/84
84
/85
85
/86
86
/87
87
/88
88
/89
89
/90
90
/91
91/
92
92
/93
93
/94
94
/95
95
/96
96
/97
97
/98
98
/99
99
/00
00
/01
01/
02
02
/03
03
/04
04
/05
05
/06
06
/07
07
/08
08
/09
09
/10
10/1
111
/12
12/1
313
/14
14/1
515
/16
16/1
7
Soybean Oil - Stock to Use Annual data in %, from 1980 to 2016
% chg in projections vs. previous = -5.3%
0
50
100
150
200
250
300
80
/81
81/
82
82
/83
83
/84
84
/85
85
/86
86
/87
87
/88
88
/89
89
/90
90
/91
91/
92
92
/93
93
/94
94
/95
95
/96
96
/97
97
/98
98
/99
99
/00
00
/01
01/
02
02
/03
03
/04
04
/05
05
/06
06
/07
07
/08
08
/09
09
/10
10/1
111
/12
12/1
313
/14
14/1
515
/16
16/1
7
Wheat - Ending Stocks Annual data in mln tons, from 1980 to 2016
chg in projections vs. previous = 18.1
0
5
10
15
20
25
30
35
40
45
508
0/8
18
1/8
28
2/8
38
3/8
48
4/8
58
5/8
68
6/8
78
7/8
88
8/8
98
9/9
09
0/9
19
1/9
29
2/9
39
3/9
49
4/9
59
5/9
69
6/9
79
7/9
89
8/9
99
9/0
00
0/0
10
1/0
20
2/0
30
3/0
40
4/0
50
5/0
60
6/0
70
7/0
80
8/0
90
9/1
010
/11
11/1
212
/13
13/1
414
/15
15/1
6
Sugar - Ending Stocks Annual data in mln Metric Tons, from 1980 to 2016
chg in projections vs. previous = -5.2
0.0
0.5
1.0
1.5
2.0
2.5
3.0
3.5
4.0
4.5
5.0
80
/81
81/
82
82
/83
83
/84
84
/85
85
/86
86
/87
87
/88
88
/89
89
/90
90
/91
91/
92
92
/93
93
/94
94
/95
95
/96
96
/97
97
/98
98
/99
99
/00
00
/01
01/
02
02
/03
03
/04
04
/05
05
/06
06
/07
07
/08
08
/09
09
/10
10/1
111
/12
12/1
313
/14
14/1
515
/16
16/1
7
Soybean Oil - Ending Stocks Annual data in mln Metric Tons, from 1980 to 2016
chg in projections vs. previous = -0.1
0
200
400
600
800
1,000
1,200
1,400
1,600
1,800
2,000
198
119
82
198
319
84
198
519
86
198
719
88
198
919
90
199
119
92
199
319
94
199
519
96
199
719
98
199
92
00
02
00
12
00
22
00
32
00
42
00
52
00
62
00
72
00
82
00
92
010
20
112
012
20
132
014
20
152
016
Cocoa - Inventory Annual data in '000 metric tons, from 1981 to 2016
Industrial Metals
Source: Bloomberg, ETF Securities Source: Bloomberg, ETF Securities
Source: LME, Bloomberg, ETF Securities Source: Bloomberg, ETF Securities
Source: Bloomberg, ETF Securities Source: LME, Bloomberg, ETF Securities
Livestock
Source: USDA, Bloomberg, ETF Securities Source: USDA, Bloomberg, ETF Securities
11
0
2
4
6
8
10
12
Ma
y-1
5
Ju
n-1
5
Ju
l-15
Au
g-1
5
Sep
-15
Oct
-15
No
v-1
5
Dec
-15
Ja
n-1
6
Feb
-16
Ma
r-16
Ap
r-16
Tin Inventory
LME Inventory (in '000 tonnes) SHFE Inventory (in '000 tonnes)
Daily data in '000 MT, from 13 May 15 to 13 May 16
120
140
160
180
200
220
240
260
Ma
y 1
5
Ju
n 1
5
Ju
l 15
Au
g 1
5
Sep
15
Oct
15
No
v 1
5
Dec
15
Ja
n 1
6
Feb
16
Ma
r 16
Ap
r 16
Lead Inventory
SHFE Inventory (in '000 tonnes) LME Inventory (in '000 tonnes)
Daily data, from 13 May 15 to 13 May 16
230
280
330
380
430
480
530
Ma
y-1
5
Ju
n-1
5
Ju
l-15
Au
g-1
5
Sep
-15
Oct
-15
No
v-1
5
Dec
-15
Ja
n-1
6
Feb
-16
Ma
r-16
Ap
r-16
Nickel Inventory Daily data in '000 MT, from 13 May 15 to 13 May 16
300
400
500
600
700
800
900
Ma
y 1
5
Ju
n 1
5
Ju
l 15
Au
g 1
5
Sep
15
Oct
15
No
v 1
5
Dec
15
Ja
n 1
6
Feb
16
Ma
r 16
Ap
r 16
Zinc Inventory
SHFE Inventory (in '000 tonnes) LME Inventory (in '000 tonnes)
Daily data, from 13 May 15 to 13 May 16
2,500
2,700
2,900
3,100
3,300
3,500
3,700
3,900
4,100
4,300
Ma
y 1
5
Ju
n 1
5
Ju
l 15
Au
g 1
5
Sep
15
Oct
15
No
v 1
5
Dec
15
Ja
n 1
6
Feb
16
Ma
r 16
Ap
r 16
Aluminum Inventory
SHFE Inventory (in '000 tonnes) LME Inventory (in '000 tonnes)
Daily data, from 13 May 15 to 13 May 16
100
200
300
400
500
600
700
Ma
y 1
5
Ju
n 1
5
Ju
l 15
Au
g 1
5
Sep
15
Oct
15
No
v 1
5
Dec
15
Ja
n 1
6
Feb
16
Ma
r 16
Ap
r 16
Copper Inventory
SHFE Inventory (in '000 tonnes) COMEX Inventory (in '000 tonnes)
LME Inventory (in '000 tonnes)
Daily data, from 13 May 15 to 13 May 16
640
660
680
700
720
740
760
780
800
820
840
80
/81
81/
82
82
/83
83
/84
84
/85
85
/86
86
/87
87
/88
88
/89
89
/90
90
/91
91/
92
92
/93
93
/94
94
/95
95
/96
96
/97
97
/98
98
/99
99
/00
00
/01
01/
02
02
/03
03
/04
04
/05
05
/06
06
/07
07
/08
08
/09
09
/10
10/1
111
/12
12/1
313
/14
14/1
515
/16
Lean Hogs Inventory Annual data in mln Heads, from 1980 to 2016
900
950
1,000
1,050
1,100
1,150
80
/81
81/
82
82
/83
83
/84
84
/85
85
/86
86
/87
87
/88
88
/89
89
/90
90
/91
91/
92
92
/93
93
/94
94
/95
95
/96
96
/97
97
/98
98
/99
99
/00
00
/01
01/
02
02
/03
03
/04
04
/05
05
/06
06
/07
07
/08
08
/09
09
/10
10/1
111
/12
12/1
313
/14
14/1
515
/16
Live Cattle Inventory Annual data in mln Heads, from 1980 to 2016
Energy
Source: DOE, Bloomberg, ETF Securities Source: DOE, Bloomberg, ETF Securities
Source: DOE, Bloomberg, ETF Securities Source: DOE, Bloomberg, ETF Securities
Source: DOE, Bloomberg, ETF Securities
Note: "Oil - OECD Inventory" represents OECD industry stocks and is reported with a 2 month lag. 12
300
350
400
450
500
550
600
1 3 5 7 9 11 13 15 17 19 21 23 25 27 29 31 33 35 37 39 41 43 45 47 49 51
US Oil Inventory
5Yr Average +/-1 stdev 2015 2016
Weekly data in mln barrels, from May 11 to May 16
190
200
210
220
230
240
250
260
270
1 3 5 7 9 11 13 15 17 19 21 23 25 27 29 31 33 35 37 39 41 43 45 47 49 51
Gasoline Inventory
5Yr Average +/-1 stdev 2015 2016
Weekly data in mln barrels, from May 11 to May 16
500
1,000
1,500
2,000
2,500
3,000
3,500
4,000
4,500
1 3 5 7 9 11 13 15 17 19 21 23 25 27 29 31 33 35 37 39 41 43 45 47 49 51
Natural Gas Inventory
5Yr Average +/-1 stdev 2015 2016
Weekly data in billion cubic feet, from May 11 to May 16
6
11
16
21
26
31
36
41
46
1 3 5 7 9 11 13 15 17 19 21 23 25 27 29 31 33 35 37 39 41 43 45 47 49 51
Heating Oil Inventory
5Yr Average +/-1 stdev 2015 2016
Weekly data in mln barrels, from May 11 to May 16
280
290
300
310
320
330
340
350
360
370
Jan Feb Mar Apr May Jun Jul Aug Sep Oct Nov Dec
OECD Europe Oil Industry Inventory
5Yr Average +/-1 stdev 2015 2016
Monthly data in mln barrels, from Mar 06 to Feb 16
Agriculture
Source: Bloomberg, ETF Securities Source: Bloomberg, ETF Securities
Source: Bloomberg, ETF Securities Source: Bloomberg, ETF Securities
Source: Bloomberg, ETF Securities Source: Bloomberg, ETF Securities
Source: Bloomberg, ETF Securities
13
Commodities Front Month Futures and Trading Volumes
$2,600
$2,700
$2,800
$2,900
$3,000
$3,100
$3,200
$3,300
$3,400
$3,500
0
500
1,000
1,500
2,000
2,500
Ma
y 1
5
Ju
n 1
5
Ju
l 15
Au
g 1
5
Sep
15
Oct
15
No
v 1
5
Dec
15
Ja
n 1
6
Feb
16
Ma
r 16
Ap
r 16
Ma
y 1
6
Cocoa Front Month Futures Price
Volume ($mn) Prices (RHS) 50 dma (RHS) 200 dma (RHS)
Daily data in USD/MT, from 13 May 15 to 13 May 16
$1.0
$1.1
$1.2
$1.3
$1.4
$1.5
$1.6
$1.7
$1.8
0
500
1,000
1,500
2,000
2,500
3,000
3,500
4,000
4,500
Ma
y 1
5
Ju
n 1
5
Ju
l 15
Au
g 1
5
Sep
15
Oct
15
No
v 1
5
Dec
15
Ja
n 1
6
Feb
16
Ma
r 16
Ap
r 16
Ma
y 1
6
Coffee Front Month Futures Price
Volume ($mn) Prices (RHS) 50 dma (RHS) 200 dma (RHS)
Daily data in USd/lb., from 13 May 15 to 13 May 16
$3.4
$3.6
$3.8
$4.0
$4.2
$4.4
0
2,000
4,000
6,000
8,000
10,000
12,000
14,000
16,000
18,000
20,000
Ma
y 1
5
Ju
n 1
5
Ju
l 15
Au
g 1
5
Sep
15
Oct
15
No
v 1
5
Dec
15
Ja
n 1
6
Feb
16
Ma
r 16
Ap
r 16
Ma
y 1
6
Corn Front Month Futures Price
Volume ($mn) Prices (RHS) 50 dma (RHS) 200 dma (RHS)
Daily data in USd/bu., from 13 May 15 to 13 May 16
$0.55
$0.57
$0.59
$0.61
$0.63
$0.65
$0.67
$0.69
-200
300
800
1,300
1,800
2,300M
ay
15
Ju
n 1
5
Ju
l 15
Au
g 1
5
Sep
15
Oct
15
No
v 1
5
Dec
15
Ja
n 1
6
Feb
16
Ma
r 16
Ap
r 16
Ma
y 1
6
Cotton Front Month Futures Price
Volume ($mn) Prices (RHS) 50 dma (RHS) 200 dma (RHS)
Daily data in USd/lb., from 13 May 15 to 13 May 16
$0.25
$0.27
$0.29
$0.31
$0.33
$0.35
$0.37
0
1,000
2,000
3,000
4,000
5,000
6,000
Ma
y 1
5
Ju
n 1
5
Ju
l 15
Au
g 1
5
Sep
15
Oct
15
No
v 1
5
Dec
15
Ja
n 1
6
Feb
16
Ma
r 16
Ap
r 16
Ma
y 16
Soybean Oil Front Month Futures Price
Volume ($mn) Prices (RHS) 50 dma (RHS) 200 dma (RHS)
Daily data in USd/lb., from 13 May 15 to 13 May 16
$8
$9
$10
$11
$12
$13
0
5,000
10,000
15,000
20,000
25,000
30,000
35,000
40,000
Ma
y 1
5
Ju
n 1
5
Ju
l 15
Au
g 1
5
Sep
15
Oct
15
No
v 1
5
Dec
15
Ja
n 1
6
Feb
16
Ma
r 16
Ap
r 16
Ma
y 16
Soybeans Front Month Futures Price
Volume ($mn) Prices (RHS) 50 dma (RHS) 200 dma (RHS)
Daily data in USd/bu., from 13 May 15 to 13 May 16
$0.10
$0.11
$0.12
$0.13
$0.14
$0.15
$0.16
$0.17
$0.18
0500
1,0001,5002,0002,5003,0003,5004,0004,5005,000
Ma
y 15
Ju
n 1
5
Ju
l 15
Au
g 1
5
Sep
15
Oct
15
No
v 1
5
Dec
15
Ja
n 1
6
Feb
16
Ma
r 16
Ap
r 16
Ma
y 1
6
Sugar Front Month Futures Price
Volume ($mn) Prices (RHS) 50 dma (RHS) 200 dma (RHS)
Daily data in USd/lb., from 13 May 15 to 13 May 16
$4.0
$4.5
$5.0
$5.5
$6.0
$6.5
0
1,0002,000
3,000
4,000
5,0006,000
7,000
8,000
9,000
10,000
Ma
y 1
5
Ju
n 1
5
Ju
l 15
Au
g 1
5
Sep
15
Oct
15
No
v 1
5
Dec
15
Ja
n 1
6
Feb
16
Ma
r 16
Ap
r 16
Ma
y 1
6
Wheat Front Month Futures Price
Volume ($mn) Prices (RHS) 50 dma (RHS) 200 dma (RHS)
Daily data in USd/bu., from 13 May 15 to 13 May 16
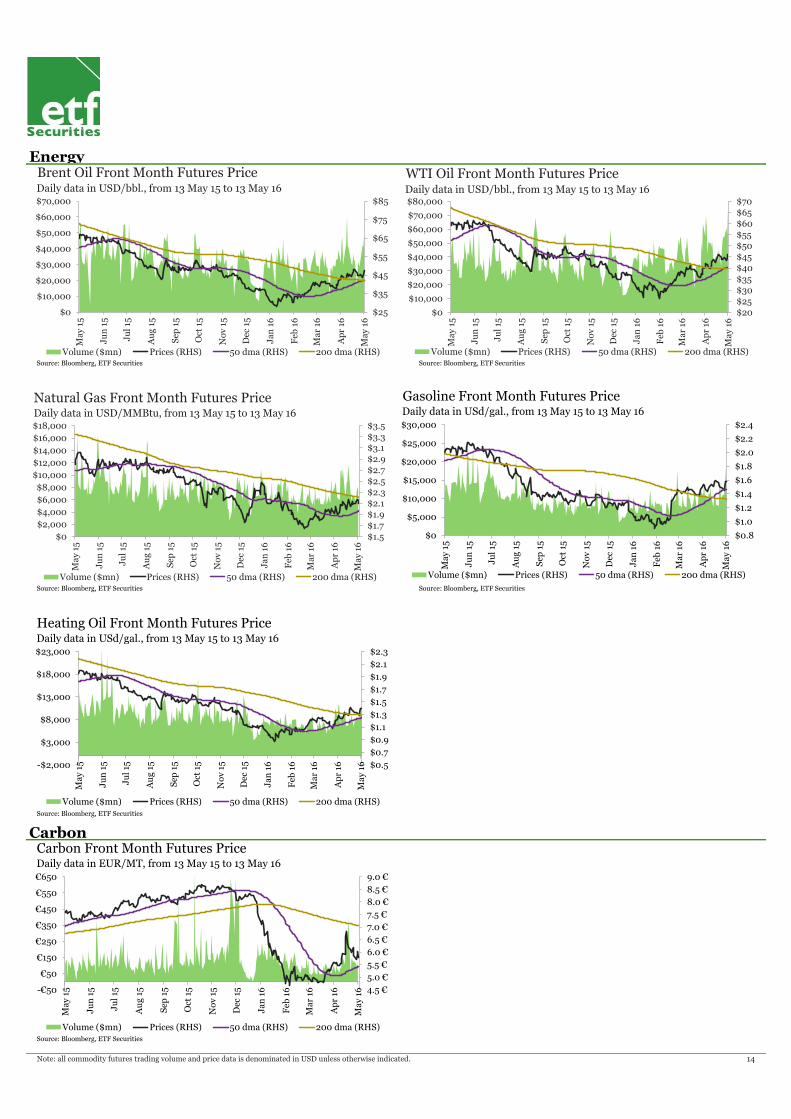
Energy
Source: Bloomberg, ETF Securities Source: Bloomberg, ETF Securities
Source: Bloomberg, ETF Securities Source: Bloomberg, ETF Securities
Source: Bloomberg, ETF Securities
Carbon
Source: Bloomberg, ETF Securities
Note: all commodity futures trading volume and price data is denominated in USD unless otherwise indicated. 14
$25
$35
$45
$55
$65
$75
$85
$0
$10,000
$20,000
$30,000
$40,000
$50,000
$60,000
$70,000
Ma
y 1
5
Ju
n 1
5
Ju
l 15
Au
g 1
5
Sep
15
Oct
15
No
v 1
5
Dec
15
Ja
n 1
6
Feb
16
Ma
r 16
Ap
r 16
Ma
y 1
6
Brent Oil Front Month Futures Price
Volume ($mn) Prices (RHS) 50 dma (RHS) 200 dma (RHS)
Daily data in USD/bbl., from 13 May 15 to 13 May 16
$20
$25
$30
$35
$40
$45
$50
$55
$60
$65
$70
$0
$10,000
$20,000
$30,000
$40,000
$50,000
$60,000
$70,000
$80,000
Ma
y 1
5
Ju
n 1
5
Ju
l 15
Au
g 1
5
Sep
15
Oct
15
No
v 1
5
Dec
15
Ja
n 1
6
Feb
16
Ma
r 16
Ap
r 16
Ma
y 16
WTI Oil Front Month Futures Price
Volume ($mn) Prices (RHS) 50 dma (RHS) 200 dma (RHS)
Daily data in USD/bbl., from 13 May 15 to 13 May 16
$1.5
$1.7
$1.9
$2.1
$2.3
$2.5
$2.7
$2.9
$3.1
$3.3
$3.5
$0
$2,000
$4,000
$6,000
$8,000
$10,000
$12,000
$14,000
$16,000
$18,000
Ma
y 1
5
Ju
n 1
5
Ju
l 15
Au
g 1
5
Sep
15
Oct
15
No
v 1
5
Dec
15
Ja
n 1
6
Feb
16
Ma
r 16
Ap
r 16
Ma
y 1
6
Natural Gas Front Month Futures Price
Volume ($mn) Prices (RHS) 50 dma (RHS) 200 dma (RHS)
Daily data in USD/MMBtu, from 13 May 15 to 13 May 16
$0.8
$1.0
$1.2
$1.4
$1.6
$1.8
$2.0
$2.2
$2.4
$0
$5,000
$10,000
$15,000
$20,000
$25,000
$30,000
Ma
y 1
5
Ju
n 1
5
Ju
l 15
Au
g 1
5
Sep
15
Oct
15
No
v 1
5
Dec
15
Ja
n 1
6
Feb
16
Ma
r 16
Ap
r 16
Ma
y 1
6
Gasoline Front Month Futures Price
Volume ($mn) Prices (RHS) 50 dma (RHS) 200 dma (RHS)
Daily data in USd/gal., from 13 May 15 to 13 May 16
$0.5
$0.7
$0.9
$1.1
$1.3
$1.5
$1.7
$1.9
$2.1
$2.3
-$2,000
$3,000
$8,000
$13,000
$18,000
$23,000
Ma
y 1
5
Ju
n 1
5
Ju
l 15
Au
g 1
5
Sep
15
Oct
15
No
v 1
5
Dec
15
Ja
n 1
6
Feb
16
Ma
r 16
Ap
r 16
Ma
y 1
6
Heating Oil Front Month Futures Price
Volume ($mn) Prices (RHS) 50 dma (RHS) 200 dma (RHS)
Daily data in USd/gal., from 13 May 15 to 13 May 16
4.5 €
5.0 €
5.5 €
6.0 €
6.5 €
7.0 €
7.5 €
8.0 €
8.5 €
9.0 €
-€50
€50
€150
€250
€350
€450
€550
€650
Ma
y 1
5
Ju
n 1
5
Ju
l 15
Au
g 1
5
Sep
15
Oct
15
No
v 1
5
Dec
15
Ja
n 1
6
Feb
16
Ma
r 16
Ap
r 16
Ma
y 16
Carbon Front Month Futures Price
Volume ($mn) Prices (RHS) 50 dma (RHS) 200 dma (RHS)
Daily data in EUR/MT, from 13 May 15 to 13 May 16
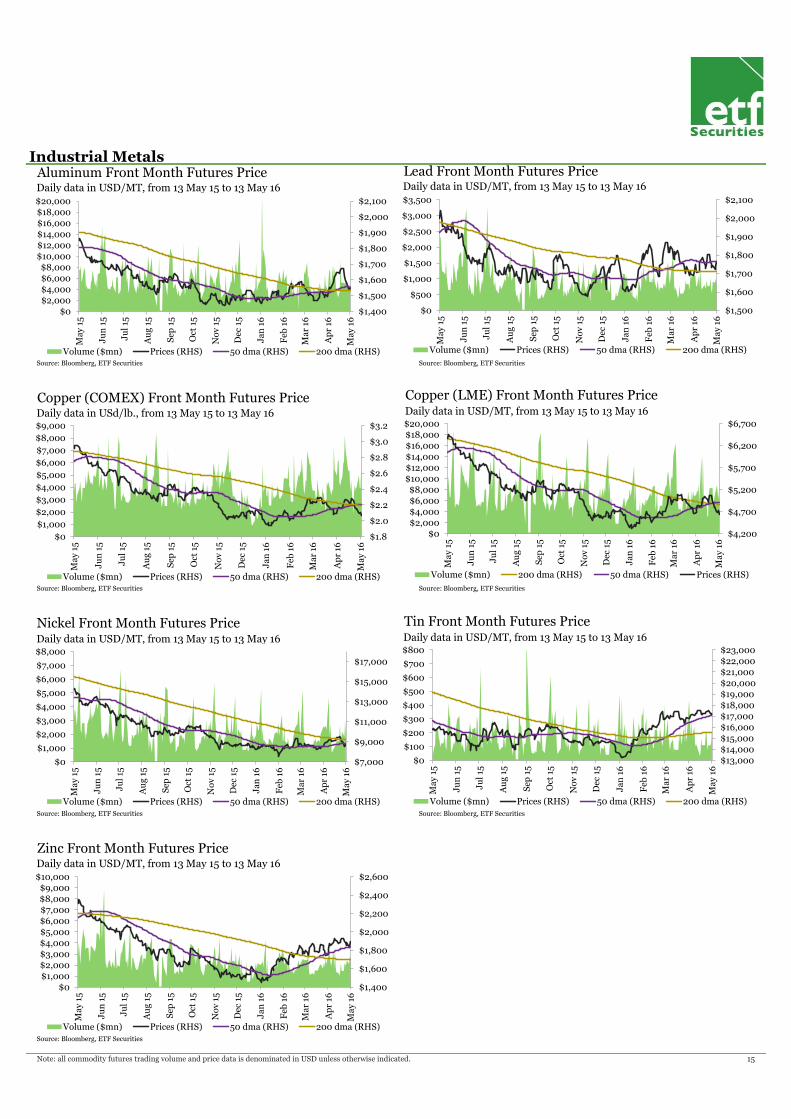
Industrial Metals
Source: Bloomberg, ETF Securities Source: Bloomberg, ETF Securities
Source: Bloomberg, ETF Securities Source: Bloomberg, ETF Securities
Source: Bloomberg, ETF Securities Source: Bloomberg, ETF Securities
Source: Bloomberg, ETF Securities
Note: all commodity futures trading volume and price data is denominated in USD unless otherwise indicated. 15
$1,400
$1,500
$1,600
$1,700
$1,800
$1,900
$2,000
$2,100
$0$2,000$4,000$6,000$8,000
$10,000$12,000$14,000$16,000$18,000$20,000
Ma
y 1
5
Ju
n 1
5
Ju
l 15
Au
g 1
5
Sep
15
Oct
15
No
v 1
5
Dec
15
Ja
n 1
6
Feb
16
Ma
r 16
Ap
r 16
Ma
y 1
6
Aluminum Front Month Futures Price
Volume ($mn) Prices (RHS) 50 dma (RHS) 200 dma (RHS)
Daily data in USD/MT, from 13 May 15 to 13 May 16
$13,000$14,000$15,000$16,000$17,000$18,000$19,000$20,000$21,000$22,000$23,000
$0
$100
$200
$300
$400
$500
$600
$700
$800
Ma
y 1
5
Ju
n 1
5
Ju
l 15
Au
g 1
5
Sep
15
Oct
15
No
v 1
5
Dec
15
Ja
n 1
6
Feb
16
Ma
r 16
Ap
r 16
Ma
y 1
6
Tin Front Month Futures Price
Volume ($mn) Prices (RHS) 50 dma (RHS) 200 dma (RHS)
Daily data in USD/MT, from 13 May 15 to 13 May 16
$1,400
$1,600
$1,800
$2,000
$2,200
$2,400
$2,600
$0$1,000$2,000$3,000$4,000$5,000$6,000$7,000$8,000$9,000
$10,000
Ma
y 1
5
Ju
n 1
5
Ju
l 15
Au
g 1
5
Sep
15
Oct
15
No
v 1
5
Dec
15
Ja
n 1
6
Feb
16
Ma
r 16
Ap
r 16
Ma
y 16
Zinc Front Month Futures Price
Volume ($mn) Prices (RHS) 50 dma (RHS) 200 dma (RHS)
Daily data in USD/MT, from 13 May 15 to 13 May 16
$7,000
$9,000
$11,000
$13,000
$15,000
$17,000
$0
$1,000
$2,000
$3,000
$4,000
$5,000
$6,000
$7,000
$8,000
Ma
y 1
5
Ju
n 1
5
Ju
l 15
Au
g 1
5
Sep
15
Oct
15
No
v 1
5
Dec
15
Ja
n 1
6
Feb
16
Ma
r 16
Ap
r 16
Ma
y 1
6
Nickel Front Month Futures Price
Volume ($mn) Prices (RHS) 50 dma (RHS) 200 dma (RHS)
Daily data in USD/MT, from 13 May 15 to 13 May 16
$1.8
$2.0
$2.2
$2.4
$2.6
$2.8
$3.0
$3.2
$0
$1,000
$2,000
$3,000
$4,000
$5,000
$6,000
$7,000
$8,000
$9,000
Ma
y 1
5
Ju
n 1
5
Ju
l 15
Au
g 1
5
Sep
15
Oct
15
No
v 1
5
Dec
15
Ja
n 1
6
Feb
16
Ma
r 16
Ap
r 16
Ma
y 1
6
Copper (COMEX) Front Month Futures Price
Volume ($mn) Prices (RHS) 50 dma (RHS) 200 dma (RHS)
Daily data in USd/lb., from 13 May 15 to 13 May 16
$1,500
$1,600
$1,700
$1,800
$1,900
$2,000
$2,100
$0
$500
$1,000
$1,500
$2,000
$2,500
$3,000
$3,500
Ma
y 15
Ju
n 1
5
Ju
l 15
Au
g 1
5
Sep
15
Oct
15
No
v 1
5
Dec
15
Ja
n 1
6
Feb
16
Ma
r 16
Ap
r 16
Ma
y 1
6
Lead Front Month Futures Price
Volume ($mn) Prices (RHS) 50 dma (RHS) 200 dma (RHS)
Daily data in USD/MT, from 13 May 15 to 13 May 16
$4,200
$4,700
$5,200
$5,700
$6,200
$6,700
$0$2,000$4,000$6,000$8,000
$10,000$12,000$14,000$16,000$18,000$20,000
Ma
y 1
5
Ju
n 1
5
Ju
l 15
Au
g 1
5
Sep
15
Oct
15
No
v 1
5
Dec
15
Ja
n 1
6
Feb
16
Ma
r 16
Ap
r 16
Ma
y 1
6
Copper (LME) Front Month Futures Price
Volume ($mn) 200 dma (RHS) 50 dma (RHS) Prices (RHS)
Daily data in USD/MT, from 13 May 15 to 13 May 16
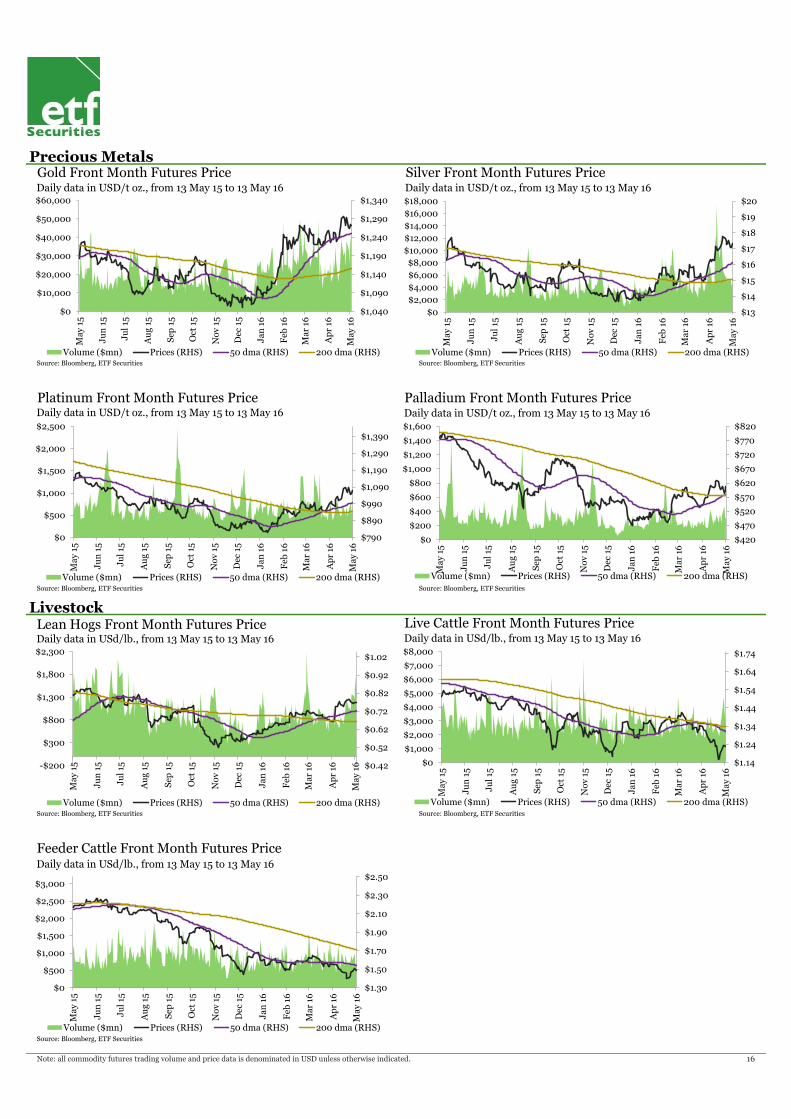
Precious Metals
Source: Bloomberg, ETF Securities Source: Bloomberg, ETF Securities
Source: Bloomberg, ETF Securities Source: Bloomberg, ETF Securities
Livestock
Source: Bloomberg, ETF Securities Source: Bloomberg, ETF Securities
Source: Bloomberg, ETF Securities
Note: all commodity futures trading volume and price data is denominated in USD unless otherwise indicated. 16
$1.30
$1.50
$1.70
$1.90
$2.10
$2.30
$2.50
$0
$500
$1,000
$1,500
$2,000
$2,500
$3,000
Ma
y 1
5
Ju
n 1
5
Ju
l 15
Au
g 1
5
Sep
15
Oct
15
No
v 1
5
Dec
15
Ja
n 1
6
Feb
16
Ma
r 16
Ap
r 16
Ma
y 1
6
Feeder Cattle Front Month Futures Price
Volume ($mn) Prices (RHS) 50 dma (RHS) 200 dma (RHS)
Daily data in USd/lb., from 13 May 15 to 13 May 16
$0.42
$0.52
$0.62
$0.72
$0.82
$0.92
$1.02
-$200
$300
$800
$1,300
$1,800
$2,300
Ma
y 1
5
Ju
n 1
5
Ju
l 15
Au
g 1
5
Sep
15
Oct
15
No
v 1
5
Dec
15
Ja
n 1
6
Feb
16
Ma
r 16
Ap
r 16
Ma
y 1
6
Lean Hogs Front Month Futures Price
Volume ($mn) Prices (RHS) 50 dma (RHS) 200 dma (RHS)
Daily data in USd/lb., from 13 May 15 to 13 May 16
$1.14
$1.24
$1.34
$1.44
$1.54
$1.64
$1.74
$0
$1,000
$2,000
$3,000
$4,000
$5,000
$6,000
$7,000
$8,000
Ma
y 1
5
Ju
n 1
5
Ju
l 15
Au
g 1
5
Sep
15
Oct
15
No
v 1
5
Dec
15
Ja
n 1
6
Feb
16
Ma
r 16
Ap
r 16
Ma
y 1
6
Live Cattle Front Month Futures Price
Volume ($mn) Prices (RHS) 50 dma (RHS) 200 dma (RHS)
Daily data in USd/lb., from 13 May 15 to 13 May 16
$790
$890
$990
$1,090
$1,190
$1,290
$1,390
$0
$500
$1,000
$1,500
$2,000
$2,500
Ma
y 1
5
Ju
n 1
5
Ju
l 15
Au
g 1
5
Sep
15
Oct
15
No
v 1
5
Dec
15
Ja
n 1
6
Feb
16
Ma
r 16
Ap
r 16
Ma
y 16
Platinum Front Month Futures Price
Volume ($mn) Prices (RHS) 50 dma (RHS) 200 dma (RHS)
Daily data in USD/t oz., from 13 May 15 to 13 May 16
$420
$470
$520
$570
$620
$670
$720
$770
$820
$0
$200
$400
$600
$800
$1,000
$1,200
$1,400
$1,600
Ma
y 15
Ju
n 1
5
Ju
l 15
Au
g 1
5
Sep
15
Oct
15
No
v 1
5
Dec
15
Ja
n 1
6
Feb
16
Ma
r 16
Ap
r 16
Ma
y 1
6
Palladium Front Month Futures Price
Volume ($mn) Prices (RHS) 50 dma (RHS) 200 dma (RHS)
Daily data in USD/t oz., from 13 May 15 to 13 May 16
$1,040
$1,090
$1,140
$1,190
$1,240
$1,290
$1,340
$0
$10,000
$20,000
$30,000
$40,000
$50,000
$60,000
Ma
y 1
5
Ju
n 1
5
Ju
l 15
Au
g 1
5
Sep
15
Oct
15
No
v 1
5
Dec
15
Ja
n 1
6
Feb
16
Ma
r 16
Ap
r 16
Ma
y 1
6
Gold Front Month Futures Price
Volume ($mn) Prices (RHS) 50 dma (RHS) 200 dma (RHS)
Daily data in USD/t oz., from 13 May 15 to 13 May 16
$13
$14
$15
$16
$17
$18
$19
$20
$0
$2,000
$4,000
$6,000
$8,000
$10,000
$12,000
$14,000
$16,000
$18,000
Ma
y 1
5
Ju
n 1
5
Ju
l 15
Au
g 1
5
Sep
15
Oct
15
No
v 1
5
Dec
15
Ja
n 1
6
Feb
16
Ma
r 16
Ap
r 16
Ma
y 16
Silver Front Month Futures Price
Volume ($mn) Prices (RHS) 50 dma (RHS) 200 dma (RHS)
Daily data in USD/t oz., from 13 May 15 to 13 May 16
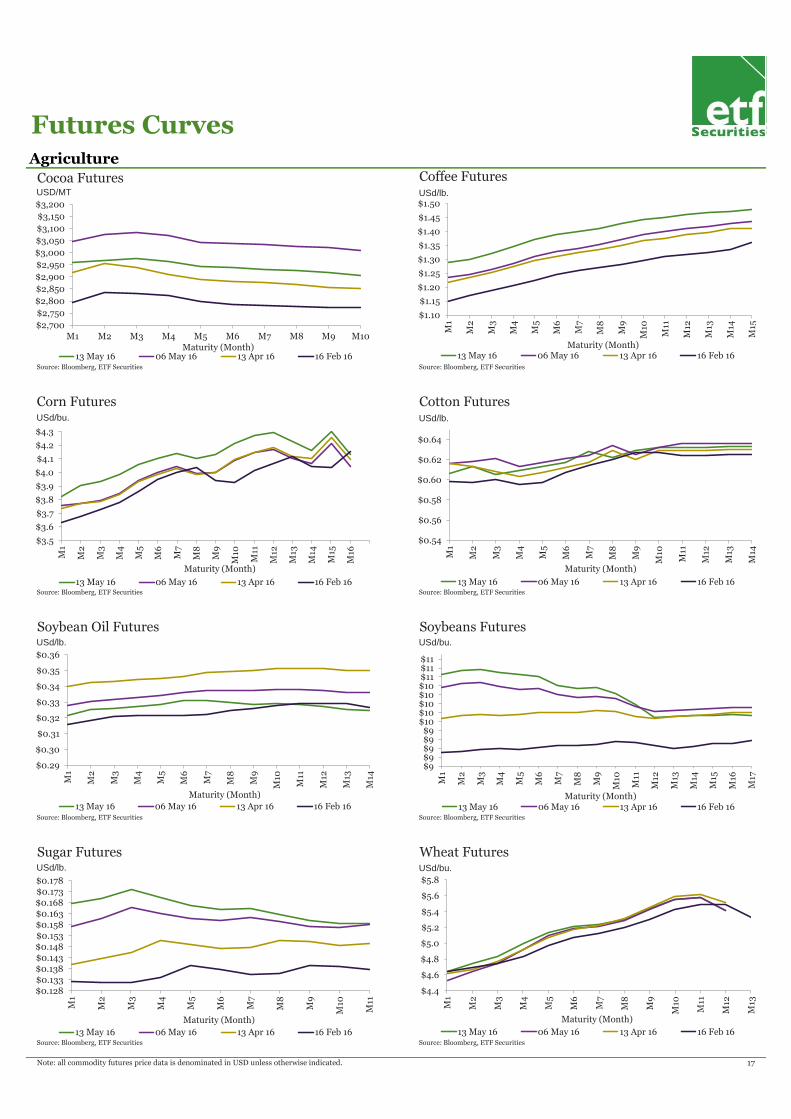
Agriculture
Source: Bloomberg, ETF Securities Source: Bloomberg, ETF Securities
Source: Bloomberg, ETF Securities Source: Bloomberg, ETF Securities
Source: Bloomberg, ETF Securities Source: Bloomberg, ETF Securities
Source: Bloomberg, ETF Securities Source: Bloomberg, ETF Securities
Note: all commodity futures price data is denominated in USD unless otherwise indicated. 17
Futures Curves
$2,700
$2,750
$2,800
$2,850
$2,900
$2,950
$3,000
$3,050
$3,100
$3,150
$3,200
M1 M2 M3 M4 M5 M6 M7 M8 M9 M10Maturity (Month)
Cocoa Futures
13 May 16 06 May 16 13 Apr 16 16 Feb 16
USD/MT
$1.10
$1.15
$1.20
$1.25
$1.30
$1.35
$1.40
$1.45
$1.50
M1
M2
M3
M4
M5
M6
M7
M8
M9
M10
M11
M12
M13
M14
M15
Maturity (Month)
Coffee Futures
13 May 16 06 May 16 13 Apr 16 16 Feb 16
USd/lb.
$3.5
$3.6
$3.7
$3.8
$3.9
$4.0
$4.1
$4.2
$4.3
M1
M2
M3
M4
M5
M6
M7
M8
M9
M10
M11
M12
M13
M14
M15
M16
Maturity (Month)
Corn Futures
13 May 16 06 May 16 13 Apr 16 16 Feb 16
USd/bu.
$0.54
$0.56
$0.58
$0.60
$0.62
$0.64M
1
M2
M3
M4
M5
M6
M7
M8
M9
M10
M11
M12
M13
M14
Maturity (Month)
Cotton Futures
13 May 16 06 May 16 13 Apr 16 16 Feb 16
USd/lb.
$0.29
$0.30
$0.31
$0.32
$0.33
$0.34
$0.35
$0.36
M1
M2
M3
M4
M5
M6
M7
M8
M9
M10
M11
M12
M13
M14
Maturity (Month)
Soybean Oil Futures
13 May 16 06 May 16 13 Apr 16 16 Feb 16
USd/lb.
$9$9$9$9$9
$10$10$10$10$10$11$11$11
M1
M2
M3
M4
M5
M6
M7
M8
M9
M10
M11
M12
M13
M14
M15
M16
M17
Maturity (Month)
Soybeans Futures
13 May 16 06 May 16 13 Apr 16 16 Feb 16
USd/bu.
$0.128$0.133$0.138$0.143$0.148$0.153$0.158$0.163$0.168$0.173$0.178
M1
M2
M3
M4
M5
M6
M7
M8
M9
M10
M11
Maturity (Month)
Sugar Futures
13 May 16 06 May 16 13 Apr 16 16 Feb 16
USd/lb.
$4.4
$4.6
$4.8
$5.0
$5.2
$5.4
$5.6
$5.8
M1
M2
M3
M4
M5
M6
M7
M8
M9
M10
M11
M12
M13
Maturity (Month)
Wheat Futures
13 May 16 06 May 16 13 Apr 16 16 Feb 16
USd/bu.
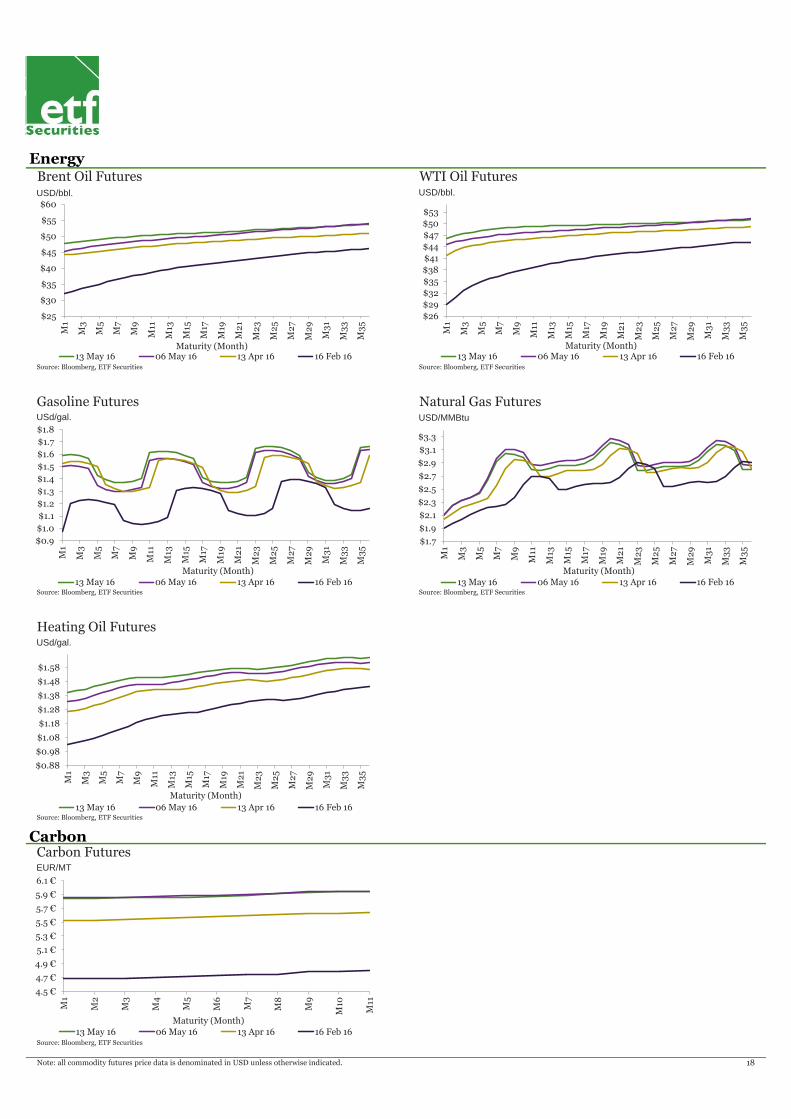
Energy
Source: Bloomberg, ETF Securities Source: Bloomberg, ETF Securities
Source: Bloomberg, ETF Securities Source: Bloomberg, ETF Securities
Source: Bloomberg, ETF Securities
Carbon
Source: Bloomberg, ETF Securities
Note: all commodity futures price data is denominated in USD unless otherwise indicated. 18
$25
$30
$35
$40
$45
$50
$55
$60
M1
M3
M5
M7
M9
M11
M13
M15
M17
M19
M2
1
M2
3
M2
5
M2
7
M2
9
M3
1
M3
3
M3
5
Maturity (Month)
Brent Oil Futures
13 May 16 06 May 16 13 Apr 16 16 Feb 16
USD/bbl.
$26
$29
$32
$35
$38
$41
$44
$47
$50
$53
M1
M3
M5
M7
M9
M11
M13
M15
M17
M19
M2
1
M2
3
M2
5
M2
7
M2
9
M3
1
M3
3
M3
5
Maturity (Month)
WTI Oil Futures
13 May 16 06 May 16 13 Apr 16 16 Feb 16
USD/bbl.
$1.7
$1.9
$2.1
$2.3
$2.5
$2.7
$2.9
$3.1
$3.3M
1
M3
M5
M7
M9
M11
M13
M15
M17
M19
M2
1
M2
3
M2
5
M2
7
M2
9
M3
1
M3
3
M3
5
Maturity (Month)
Natural Gas Futures
13 May 16 06 May 16 13 Apr 16 16 Feb 16
USD/MMBtu
$0.9
$1.0
$1.1
$1.2
$1.3
$1.4
$1.5
$1.6
$1.7
$1.8
M1
M3
M5
M7
M9
M11
M13
M15
M17
M19
M2
1
M2
3
M2
5
M2
7
M2
9
M3
1
M3
3
M3
5
Maturity (Month)
Gasoline Futures
13 May 16 06 May 16 13 Apr 16 16 Feb 16
USd/gal.
$0.88
$0.98
$1.08
$1.18
$1.28
$1.38
$1.48
$1.58
M1
M3
M5
M7
M9
M11
M13
M15
M17
M19
M2
1
M2
3
M2
5
M2
7
M2
9
M3
1
M3
3
M3
5
Maturity (Month)
Heating Oil Futures
13 May 16 06 May 16 13 Apr 16 16 Feb 16
USd/gal.
4.5 €
4.7 €
4.9 €
5.1 €
5.3 €
5.5 €
5.7 €
5.9 €
6.1 €
M1
M2
M3
M4
M5
M6
M7
M8
M9
M10
M11
Maturity (Month)
Carbon Futures
13 May 16 06 May 16 13 Apr 16 16 Feb 16
EUR/MT
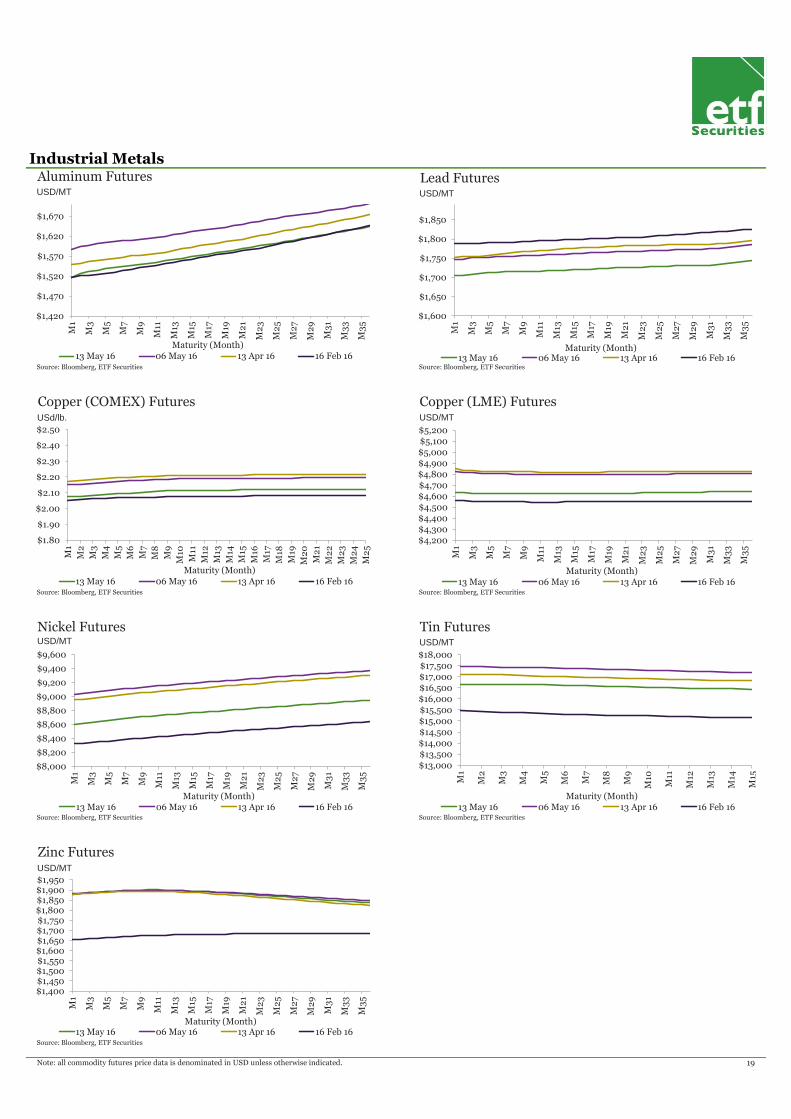
Industrial Metals
Source: Bloomberg, ETF Securities Source: Bloomberg, ETF Securities
Source: Bloomberg, ETF Securities Source: Bloomberg, ETF Securities
Source: Bloomberg, ETF Securities Source: Bloomberg, ETF Securities
Source: Bloomberg, ETF Securities
Note: all commodity futures price data is denominated in USD unless otherwise indicated. 19
$1,420
$1,470
$1,520
$1,570
$1,620
$1,670
M1
M3
M5
M7
M9
M11
M13
M15
M17
M19
M2
1
M2
3
M2
5
M2
7
M2
9
M3
1
M3
3
M3
5
Maturity (Month)
Aluminum Futures
13 May 16 06 May 16 13 Apr 16 16 Feb 16
USD/MT
$1,600
$1,650
$1,700
$1,750
$1,800
$1,850
M1
M3
M5
M7
M9
M11
M13
M15
M17
M19
M2
1
M2
3
M2
5
M2
7
M2
9
M3
1
M3
3
M3
5
Maturity (Month)
Lead Futures
13 May 16 06 May 16 13 Apr 16 16 Feb 16
USD/MT
$1.80
$1.90
$2.00
$2.10
$2.20
$2.30
$2.40
$2.50
M1
M2
M3
M4
M5
M6
M7
M8
M9
M10
M11
M12
M13
M14
M15
M16
M17
M18
M19
M2
0
M2
1
M2
2
M2
3
M2
4
M2
5
Maturity (Month)
Copper (COMEX) Futures
13 May 16 06 May 16 13 Apr 16 16 Feb 16
USd/lb.
$4,200$4,300$4,400$4,500$4,600$4,700$4,800$4,900$5,000$5,100$5,200
M1
M3
M5
M7
M9
M11
M13
M15
M17
M19
M2
1
M2
3
M2
5
M2
7
M2
9
M3
1
M3
3
M3
5
Maturity (Month)
Copper (LME) Futures
13 May 16 06 May 16 13 Apr 16 16 Feb 16
USD/MT
$13,000
$13,500$14,000
$14,500
$15,000$15,500
$16,000$16,500$17,000$17,500
$18,000
M1
M2
M3
M4
M5
M6
M7
M8
M9
M10
M11
M12
M13
M14
M15
Maturity (Month)
Tin Futures
13 May 16 06 May 16 13 Apr 16 16 Feb 16
USD/MT
$8,000
$8,200
$8,400
$8,600
$8,800
$9,000
$9,200
$9,400
$9,600
M1
M3
M5
M7
M9
M11
M13
M15
M17
M19
M2
1
M2
3
M2
5
M2
7
M2
9
M3
1
M3
3
M3
5
Maturity (Month)
Nickel Futures
13 May 16 06 May 16 13 Apr 16 16 Feb 16
USD/MT
$1,400$1,450$1,500$1,550$1,600$1,650$1,700$1,750$1,800$1,850$1,900$1,950
M1
M3
M5
M7
M9
M11
M13
M15
M17
M19
M2
1
M2
3
M2
5
M2
7
M2
9
M3
1
M3
3
M3
5
Maturity (Month)
Zinc Futures
13 May 16 06 May 16 13 Apr 16 16 Feb 16
USD/MT
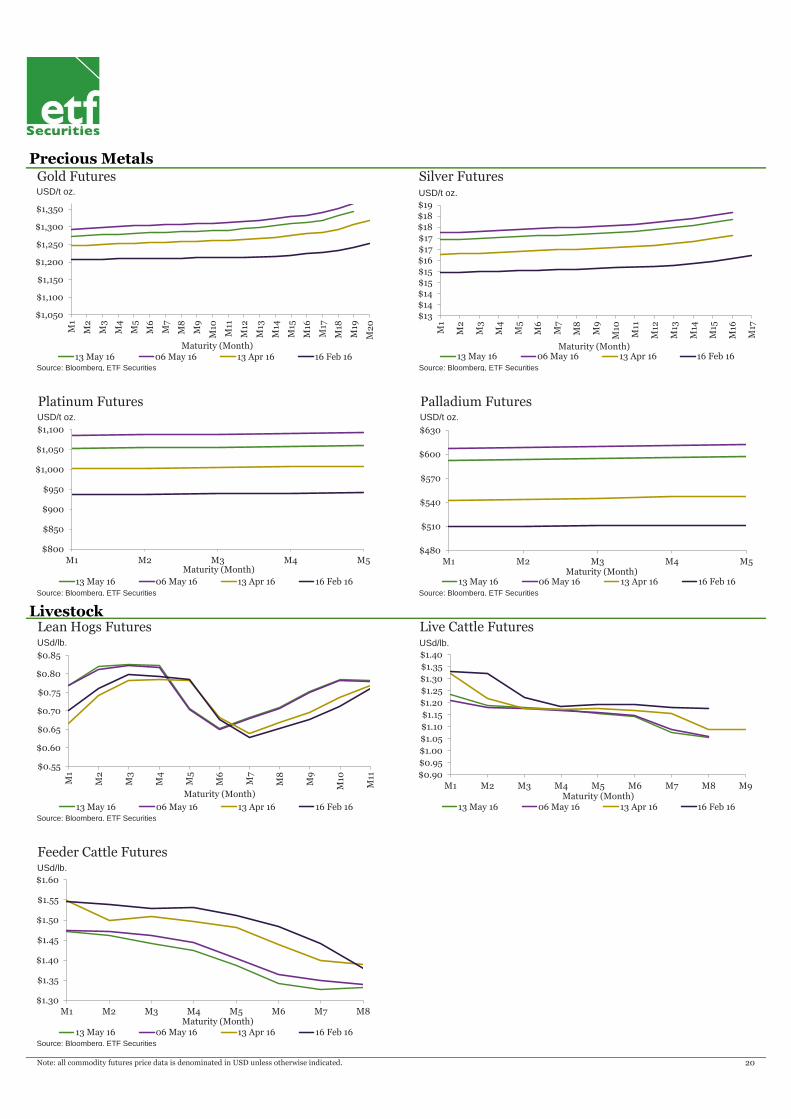
Precious Metals
Source: Bloomberg, ETF Securities Source: Bloomberg, ETF Securities
Source: Bloomberg, ETF Securities Source: Bloomberg, ETF Securities
Livestock
Source: Bloomberg, ETF Securities
Source: Bloomberg, ETF Securities
Note: all commodity futures price data is denominated in USD unless otherwise indicated. 20
$13
$14
$14
$15
$15
$16
$17
$17
$18
$18
$19
M1
M2
M3
M4
M5
M6
M7
M8
M9
M10
M11
M12
M13
M14
M15
M16
M17
Maturity (Month)
Silver Futures
13 May 16 06 May 16 13 Apr 16 16 Feb 16
USD/t oz.
$1,050
$1,100
$1,150
$1,200
$1,250
$1,300
$1,350
M1
M2
M3
M4
M5
M6
M7
M8
M9
M10
M11
M12
M13
M14
M15
M16
M17
M18
M19
M2
0
Maturity (Month)
Gold Futures
13 May 16 06 May 16 13 Apr 16 16 Feb 16
USD/t oz.
$800
$850
$900
$950
$1,000
$1,050
$1,100
M1 M2 M3 M4 M5Maturity (Month)
Platinum Futures
13 May 16 06 May 16 13 Apr 16 16 Feb 16
USD/t oz.
$480
$510
$540
$570
$600
$630
M1 M2 M3 M4 M5Maturity (Month)
Palladium Futures
13 May 16 06 May 16 13 Apr 16 16 Feb 16
USD/t oz.
$0.55
$0.60
$0.65
$0.70
$0.75
$0.80
$0.85
M1
M2
M3
M4
M5
M6
M7
M8
M9
M10
M11
Maturity (Month)
Lean Hogs Futures
13 May 16 06 May 16 13 Apr 16 16 Feb 16
USd/lb.
$0.90
$0.95
$1.00
$1.05
$1.10
$1.15
$1.20
$1.25
$1.30
$1.35
$1.40
M1 M2 M3 M4 M5 M6 M7 M8 M9Maturity (Month)
Live Cattle Futures
13 May 16 06 May 16 13 Apr 16 16 Feb 16
USd/lb.
$1.30
$1.35
$1.40
$1.45
$1.50
$1.55
$1.60
M1 M2 M3 M4 M5 M6 M7 M8Maturity (Month)
Feeder Cattle Futures
13 May 16 06 May 16 13 Apr 16 16 Feb 16
USd/lb.
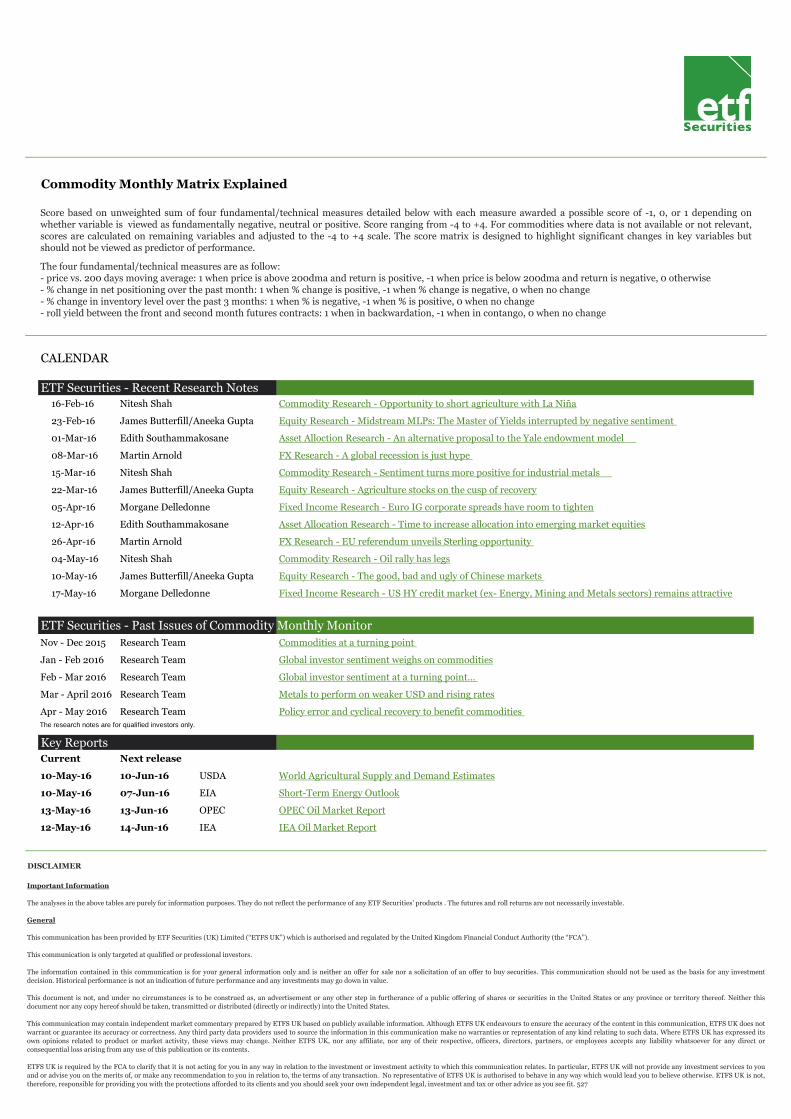
C
Commodity Monthly Matrix Explained
CALENDAR
ETF Securities - Recent Research Notes16-Feb-16 Nitesh Shah Commodity Research - Opportunity to short agriculture with La Niña
23-Feb-16 James Butterfill/Aneeka Gupta Equity Research - Midstream MLPs: The Master of Yields interrupted by negative sentiment
01-Mar-16 Edith Southammakosane Asset Alloction Research - An alternative proposal to the Yale endowment model
08-Mar-16 Martin Arnold FX Research - A global recession is just hype
15-Mar-16 Nitesh Shah Commodity Research - Sentiment turns more positive for industrial metals
22-Mar-16 James Butterfill/Aneeka Gupta Equity Research - Agriculture stocks on the cusp of recovery
05-Apr-16 Morgane Delledonne Fixed Income Research - Euro IG corporate spreads have room to tighten
12-Apr-16 Edith Southammakosane Asset Allocation Research - Time to increase allocation into emerging market equities
26-Apr-16 Martin Arnold FX Research - EU referendum unveils Sterling opportunity
04-May-16 Nitesh Shah Commodity Research - Oil rally has legs
10-May-16 James Butterfill/Aneeka Gupta Equity Research - The good, bad and ugly of Chinese markets
17-May-16 Morgane Delledonne Fixed Income Research - US HY credit market (ex- Energy, Mining and Metals sectors) remains attractive
ETF Securities - Past Issues of Commodity Monthly Monitor
Nov - Dec 2015 Research Team Commodities at a turning point
Jan - Feb 2016 Research Team Global investor sentiment weighs on commodities
Feb - Mar 2016 Research Team Global investor sentiment at a turning point…
Mar - April 2016 Research Team Metals to perform on weaker USD and rising rates
Apr - May 2016 Research Team Policy error and cyclical recovery to benefit commodities
The research notes are for qualified investors only.
Key ReportsCurrent Next release
10-May-16 10-Jun-16 USDA World Agricultural Supply and Demand Estimates
10-May-16 07-Jun-16 EIA Short-Term Energy Outlook
13-May-16 13-Jun-16 OPEC OPEC Oil Market Report
12-May-16 14-Jun-16 IEA IEA Oil Market Report
DISCLAIMER
Important Information
The analyses in the above tables are purely for information purposes. They do not reflect the performance of any ETF Securities' products . The futures and roll returns are not necessarily investable.
General
This communication has been provided by ETF Securities (UK) Limited (“ETFS UK”) which is authorised and regulated by the United Kingdom Financial Conduct Authority (the “FCA”).
This communication is only targeted at qualified or professional investors.
The information contained in this communication is for your general information only and is neither an offer for sale nor a solicitation of an offer to buy securities. This communication should not be used as the basis for any investment
decision. Historical performance is not an indication of future performance and any investments may go down in value.
This document is not, and under no circumstances is to be construed as, an advertisement or any other step in furtherance of a public offering of shares or securities in the United States or any province or territory thereof. Neither this
document nor any copy hereof should be taken, transmitted or distributed (directly or indirectly) into the United States.
This communication may contain independent market commentary prepared by ETFS UK based on publicly available information. Although ETFS UK endeavours to ensure the accuracy of the content in this communication, ETFS UK does not
warrant or guarantee its accuracy or correctness. Any third party data providers used to source the information in this communication make no warranties or representation of any kind relating to such data. Where ETFS UK has expressed its
own opinions related to product or market activity, these views may change. Neither ETFS UK, nor any affiliate, nor any of their respective, officers, directors, partners, or employees accepts any liability whatsoever for any direct or
consequential loss arising from any use of this publication or its contents.
ETFS UK is required by the FCA to clarify that it is not acting for you in any way in relation to the investment or investment activity to which this communication relates. In particular, ETFS UK will not provide any investment services to you
and or advise you on the merits of, or make any recommendation to you in relation to, the terms of any transaction. No representative of ETFS UK is authorised to behave in any way which would lead you to believe otherwise. ETFS UK is not,
therefore, responsible for providing you with the protections afforded to its clients and you should seek your own independent legal, investment and tax or other advice as you see fit. 527
Score based on unweighted sum of four fundamental/technical measures detailed below with each measure awarded a possible score of -1, 0, or 1 depending onwhether variable is viewed as fundamentally negative, neutral or positive. Score ranging from -4 to +4. For commodities where data is not available or not relevant,scores are calculated on remaining variables and adjusted to the -4 to +4 scale. The score matrix is designed to highlight significant changes in key variables butshould not be viewed as predictor of performance.
The four fundamental/technical measures are as follow:- price vs. 200 days moving average: 1 when price is above 200dma and return is positive, -1 when price is below 200dma and return is negative, 0 otherwise- % change in net positioning over the past month: 1 when % change is positive, -1 when % change is negative, 0 when no change- % change in inventory level over the past 3 months: 1 when % is negative, -1 when % is positive, 0 when no change- roll yield between the front and second month futures contracts: 1 when in backwardation, -1 when in contango, 0 when no change

CONTACT DETAILS
[email protected] ETF Securities (UK) Limited
TEL +44 20 7448 4330 3 Lombard Street
FAX +44 20 7448 4366 London EC3V 9AA
United Kingdom