Embed Size (px)
Citation preview

C E R T I F I E D F A R M E R S ’ M A R K E T S
M O N T E R E Y C O U N T Y
2015 CROP REPORT
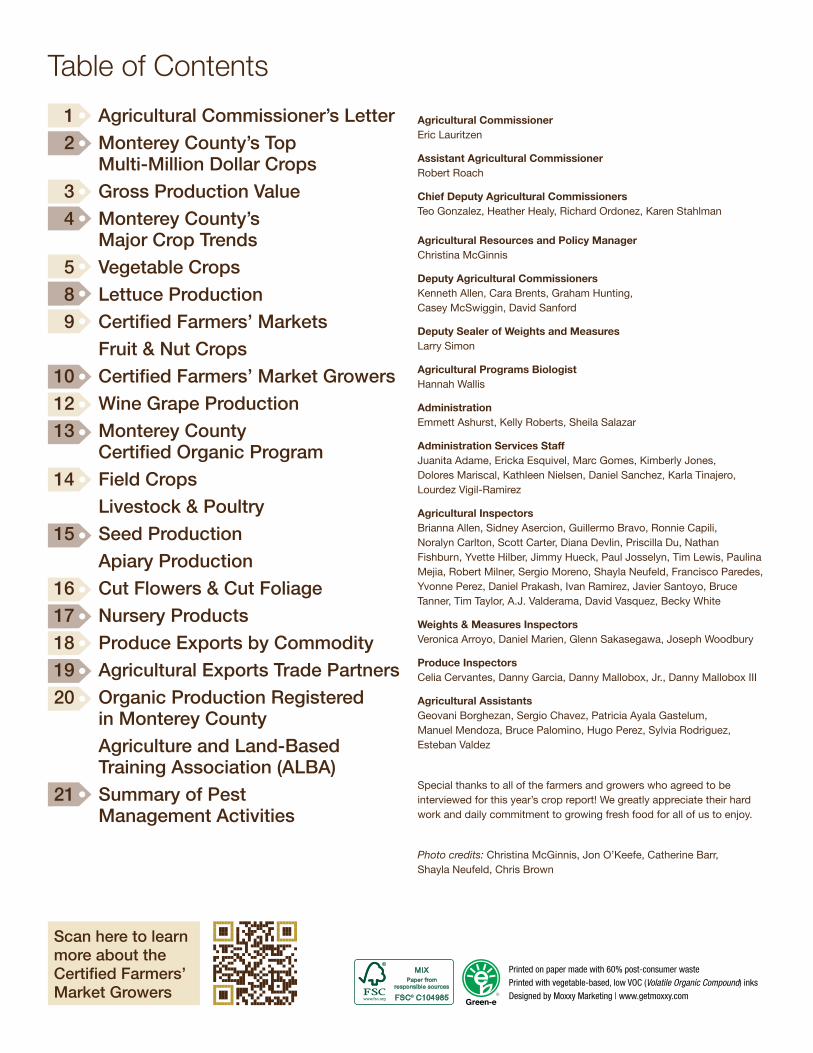
Table of ContentsAgricultural Commissioner Eric Lauritzen
Assistant Agricultural Commissioner Robert Roach
Chief Deputy Agricultural Commissioners Teo Gonzalez, Heather Healy, Richard Ordonez, Karen Stahlman
Agricultural Resources and Policy Manager Christina McGinnis
Deputy Agricultural Commissioners Kenneth Allen, Cara Brents, Graham Hunting, Casey McSwiggin, David Sanford
Deputy Sealer of Weights and Measures Larry Simon
Agricultural Programs Biologist Hannah Wallis
Administration Emmett Ashurst, Kelly Roberts, Sheila Salazar
Administration Services Staff Juanita Adame, Ericka Esquivel, Marc Gomes, Kimberly Jones, Dolores Mariscal, Kathleen Nielsen, Daniel Sanchez, Karla Tinajero, Lourdez Vigil-Ramirez
Agricultural Inspectors Brianna Allen, Sidney Asercion, Guillermo Bravo, Ronnie Capili, Noralyn Carlton, Scott Carter, Diana Devlin, Priscilla Du, Nathan Fishburn, Yvette Hilber, Jimmy Hueck, Paul Josselyn, Tim Lewis, Paulina Mejia, Robert Milner, Sergio Moreno, Shayla Neufeld, Francisco Paredes, Yvonne Perez, Daniel Prakash, Ivan Ramirez, Javier Santoyo, Bruce Tanner, Tim Taylor, A.J. Valderama, David Vasquez, Becky White
Weights & Measures Inspectors Veronica Arroyo, Daniel Marien, Glenn Sakasegawa, Joseph Woodbury
Produce Inspectors Celia Cervantes, Danny Garcia, Danny Mallobox, Jr., Danny Mallobox III
Agricultural Assistants Geovani Borghezan, Sergio Chavez, Patricia Ayala Gastelum, Manuel Mendoza, Bruce Palomino, Hugo Perez, Sylvia Rodriguez, Esteban Valdez
Special thanks to all of the farmers and growers who agreed to be interviewed for this year’s crop report! We greatly appreciate their hard work and daily commitment to growing fresh food for all of us to enjoy.
Photo credits: Christina McGinnis, Jon O’Keefe, Catherine Barr, Shayla Neufeld, Chris Brown
1 Agricultural Commissioner’s Letter 2 Monterey County’s Top
Multi-Million Dollar Crops 3 Gross Production Value 4 Monterey County’s
Major Crop Trends 5 Vegetable Crops 8 Lettuce Production 9 CertifiedFarmers’Markets Fruit & Nut Crops10 CertifiedFarmers’MarketGrowers 12 Wine Grape Production 13 Monterey County
CertifiedOrganicProgram 14 Field Crops Livestock&Poultry 15 Seed Production Apiary Production16 CutFlowers&CutFoliage 17 Nursery Products 18 Produce Exports by Commodity 19 Agricultural Exports Trade Partners 20 Organic Production Registered
in Monterey County Agriculture and Land-Based Training Association (ALBA) 21 Summary of Pest
Management Activities
Scan here to learn more about the CertifiedFarmers’MarketGrowers
Printed on paper made with 60% post-consumer wastePrinted with vegetable-based, low VOC (Volatile Organic Compound) inksDesigned by Moxxy Marketing | www.getmoxxy.com

1AG.CO.MONTEREY.CA.US • 2015 MONTEREY COUNTY CROP REPORT
It is a pleasure to present the 2015 Monterey County Crop Report that is prepared pursuant to the provisions of Section 2279 of the California Food & Agriculture Code. This report reflects a production value of $4.84 billion for Monterey County, which is an increase of 7.75% or $348 million over the previous year.
Crop values vary from year to year based on production, market and weather conditions. As often the case, there was much fluctuation in the 2015 values, with 22 commodities down and 29 commodities increasing in value. The high level of diversity in our agricultural industry provides resiliency and reduces the risk of economic shocks.
Leaf lettuce values increased 12% on better pricing. Head lettuce showed a decline of 2% with fewer acres planted but higher prices. Spring mix and salad products also declined in overall value. Strawberry values increased by 21% on increased acreage and higher production. Cauliflower and celery each saw values increase by approximately 25%. Celery showed a decrease in production with stronger pricing and cauliflower posted increases in both production and pricing. Wine grapes declined 25% in 2015, after above average production in previous years. This followed the statewide trend, with lower production and slightly higher prices. Despite reduced acreage related to the drought, the value of nursery products increased by 11% on stronger pricing for many products.
Each year we like to highlight a component of the industry in our report and this year chose Certified Farmers’ Markets. We include a short piece on some of the people who produce and sell their own products directly to consumers at the 14 markets in Monterey County and elsewhere. This important segment of our industry lets consumers meet farmers face-to-face and to become more directly connected with the food they eat.
It is always important to note that the figures provided here are gross values and do not represent or reflect net profit or loss experienced by individual growers or by the industry as a whole. Growers do not have control over input costs such as fuel, fertilizers and packaging nor can they significantly affect market prices. The fact that the gross value of agriculture increased reflects positively on the diversity and strength of our agriculture industry.
This report is our yearly opportunity to recognize the growers, shippers, ranchers, and other businesses ancillary to and supportive of agriculture, which is the largest driver of Monterey County’s economy. As such, we would like to extend our thanks to the industry for their continued effort to provide vital information that enables the compilation of the Monterey County Crop Report. While we continually strive to improve upon this information, without their assistance, this report would not be possible.
Special recognition for the production of this report goes to Christina McGinnis, Graham Hunting, Shayla Neufeld, and all of the staff who assisted in compiling this information and improving the quality of the report. Respectfully submitted,
Eric Lauritzen Agricultural Commissioner
Monterey County Agricultural Commissioner
COUNTY OF MONTEREY AGRICULTURAL COMMISSIONER1428 Abbott St., Salinas, CA 93901 • tel (831) 759-7325 • fax (831) 759-2268 • ag.co.monterey.ca.us
ERIC LAURITZEN Agricultural Commissioner
Karen Ross, SecretaryCalifornia Department of Food & Agriculture andThe Honorable Board of Supervisors of Monterey County
Jane Parker 4th District, ChairDave Potter 5th District, Vice ChairFernando Armenta 1st District John M. Phillips 2nd DistrictSimón Salinas 3rd District

2015 MONTEREY COUNTY CROP REPORT • AG.CO.MONTEREY.CA.US 2
Monterey County’s Top Multi-Million Dollar CropsCROP 2015 CROP VALUE 2015 CROP RANKING 2014 CROP RANKING
Leaf Lettuce $869,447,000 1 1
Strawberry $861,438,000 2 2
Head Lettuce $637,104,000 3 3
Broccoli $423,006,000 4 4
Nursery $313,689,000 5 5
Cauliflower $238,004,000 6 7
Celery $225,789,000 7 8
Wine Grapes $185,925,000 8 6
Misc. Vegetables $150,389,000 9 9
Spinach $141,856,000 10 10
Mushrooms $95,001,000 11 11
Beef Cattle $80,793,000 12 14
Spring Mix $69,300,000 13 12
Salad Products $54,290,000 14 13
Lemon $53,808,000 15 19
Artichokes $49,725,000 16 17
Cabbage $46,761,000 17 15
Raspberries $39,680,000 18 16
Kale $32,487,000 19 18
Brussels Sprouts $31,280,000 20 —
Carrots $26,506,000 21 22
Onions, Green $25,380,000 22 20
Peas $24,120,000 23 23
Onions, Dry $21,786,000 24 21
Rangeland $18,609,000 25 24
Asparagus $13,431,000 26 25

3AG.CO.MONTEREY.CA.US • 2015 MONTEREY COUNTY CROP REPORT
Gross Production Value
CATEGORIES 2015 2014
Vegetable Crops $3,261,521,000 $3,084,577,000*
Fruit & Nuts $1,149,353,000 $1,033,798,000
Nursery Crops $313,689,000 $286,577,000
Livestock & Poultry $91,228,000 $64,286,000
Field Crops $20,748,000 $18,724,000
Seed Crops & Apiary $4,980,000 $5,466,000
TOTAL $4,841,519,000 $4,493,428,000
2015
2014
$2,500,000,000
$2,000,000,000
$1,500,000,000
$1,000,000,000
$500,000,000
$100,000,000
$50,000,000
$10,000,000
$5,000,000
$3,000,000,000
$3,500,000,000
$0
VEGETABLECROPS
NURSERYCROPS
FIELDCROPS
FRUIT& NUTS
LIVESTOCK& POULTRY
SEED CROPS& APIARY
* Adjusted Figure

2015 MONTEREY COUNTY CROP REPORT • AG.CO.MONTEREY.CA.US 4
* Consumer Price Index Conversion http://liberalarts.oregonstate.edu/sites/liberalarts.oregonstate.edu/files/polisci/faculty-research/sahr/inflation-conversion/pdf/cv2015.pdf
Monterey County’s Major Crop Trends
CROP 1995 2005 2015
Artichokes
Acre
Value
2015 CPI Adjusted*
6,344
$37,655,000
$59,206,000
6,081
$54,674,000
$67,085,000
4,659
$49,725,000
—
Broccoli
Acre
Value
2015 CPI Adjusted
61,447
$264,396,000
$415,717,000
38,863
$216,575,000
$265,736,000
61,697
$423,006,000
—
Cauliflower
Acre
Value
2015 CPI Adjusted
23,569
$125,000,000
$196,541,000
16,380
$93,386,000
$114,584,000
18,655
$238,004,000
—
Celery
Acre
Value
2015 CPI Adjusted
7,445
$62,854,000
$98,827,000
10,138
$104,144,000
$127,784,000
12,098
$225,789,000
—
Grapes (Wine)
Acre
Value
2015 CPI Adjusted
30,483
$79,309,000
$124,700,000
38,179
$254,615,000
$312,411,000
44,296
$185,925,000
—
Head Lettuce
Acre
Value
2015 CPI Adjusted
71,700
$481,593,000
$757,222,000
64,456
$311,813,000
$382,593,000
42,802
$637,104,000
—
Leaf Lettuce
Acre
Value
2015 CPI Adjusted
33,822
$184,393,000
$289,926,000
103,159
$600,808,000
$737,188,000
64,817
$869,447,000
—
Mushrooms
Pounds
Value
2015 CPI Adjusted
48,624,000
$51,541,000
$81,039,000
45,766,000
$65,983,000
$80,961,000
44,393,000
$95,001,000
—
Nursery Products
Acre
Value
2015 CPI Adjusted
1,575
$111,199,000
$174,841,000
1,699
$276,235,000
$338,939,000
1,167
$313,689,000
—
Spinach
Acre
Value
2015 CPI Adjusted
8,700
$43,721,000
$68,744,000
16,937
$188,224,000
$230,950,000
13,919
$141,856,000
—
Strawberries
Acre
Value
2015 CPI Adjusted
7,022
$192,714,000
$303,009,000
9,294
$390,898,000
$479,629,000
12,646
$861,438,000
—
Acre 252,107 305,186 276,756
Value $1,634,375,000 $2,557,355,000 $4,040,984,000
CPI Adjusted $2,569,772,000 $3,137,860,000 —
TOTAL OF MAJOR CROPS ABOVE
5AG.CO.MONTEREY.CA.US • 2015 MONTEREY COUNTY CROP REPORT
Vegetable Crops
1 Organic production included.2 Totals may not calculate due to rounding.3 Bulk may include one or more of the following: food service, processing and/or value added.4 Previously in Misc. Vegetables
CROP1 YEAR ACREAGE PRODUCTION PER ACRE TOTAL UNIT VALUE PER UNIT TOTAL2
Anise2015
2014
769
699
17.00
17.21
13,100
12,000
ton
ton
$810.00
$756.00
$10,611,000
$9,072,000
Artichokes2015
2014
4,659
4,996
4.75
5.42
22,100
27,100
ton
ton
$2,250.00
$1,500.00
$49,725,000
$40,650,000
Asparagus2015
2014
1,631
2,130
4.00
4.16
6,520
8,860
ton
ton
$2,060.00
$1,890.00
$13,431,000
$16,745,000
Bok Choy2015
2014
422
411
21.00
20.58
8,860
8,460
ton
ton
$508.00
$456.00
$4,501,000
$3,858,000
Broccoli, Bulk32015
2014
—
—
—
—
117,000
114,000
ton
ton
$801.00
$781.00
$93,717,000
$89,034,000
Fresh2015
2014
45,447
47,945
7.20
7.30
327,000
350,000
ton
ton
$1,007.00
$923.00
$329,289,000
$323,050,000
Total2015
2014
61,697
63,561
—
—
—
—
—
—
—
—
$423,006,000
$412,084,000
Brussel Sprouts4 2015 1,835 10.03 18,400 ton $1,700.00 $31,280,000
Cabbage, Bulk2015
2014
—
—
—
—
65,300
69,800
ton
ton
$240.00
$220.00
$15,672,000
$15,356,000
Fresh2015
2014
2,998
3,261
21.50
22.99
64,500
75,000
ton
ton
$482.00
$432.00
$31,089,000
$32,400,000
Cabbage, Total2015
2014
6,035
6,297
—
—
—
—
—
—
—
—
$46,761,000
$47,756,000

2015 MONTEREY COUNTY CROP REPORT • AG.CO.MONTEREY.CA.US 6
Vegetable Crops (continued)
5 Includes: Dill, Oregano, Rosemary, Sage and Thyme.6 See Lettuce Production, page 8.7 Includes: Arugula, Beets, Broccolini, Cactus Pears, Cardone, Chicory, Corn, Cucumbers, Fava Beans, Frisee, Garlic, Mache, Potato, Pumpkins, Radicchio and Rappini.
CROP YEAR ACREAGE PRODUCTION PER ACRE TOTAL UNIT VALUE PER UNIT TOTAL
Carrots, Bulk2015
2014
—
—
—
—
33,300
34,800
ton
ton
$336.00
$248.00
$11,189,000
$8,630,000
Fresh2015
2014
1,433
1,424
20.83
21.58
29,800
30,700
ton
ton
$514.00
$421.00
$15,317,000
$12,925,000
Carrots, Total2015
2014
3,033
3,036
—
—
—
—
—
—
—
—
$26,506,000
$21,555,000
Cauliflower, Bulk2015
2014
—
—
—
—
33,000
26,500
ton
ton
$802.00
$682.00
$26,466,000
$18,073,000
Fresh2015
2014
15,385
14,683
10.07
9.19
155,000
135,000
ton
ton
$1,363.00
$1,260.00
$211,538,000
$170,100,000
Cauliflower, Total2015
2014
18,655
17,566
—
—
—
—
—
—
—
—
$238,004,000
$188,173,000
Celery, Bulk2015
2014
—
—
—
—
31,600
35,000
ton
ton
$540.00
$384.00
$17,064,000
$13,440,000
Fresh2015
2014
11,129
11,592
32.62
34.80
363,000
403,000
ton
ton
$575.00
$415.00
$208,725,000
$167,245,000
Celery, Total2015
2014
12,098
12,597
—
—
—
—
—
—
—
—
$225,789,000
$180,685,000
Chard2015
2014
641
627
9.28
9.35
5,950
5,860
ton
ton
$1,080.00
$987.00
$6,426,000
$5,784,000
Cilantro2015
2014
1,350
1,565
6.85
5.29
9,250
8,280
ton
ton
$1,340.00
$1,170.00
$12,395,000
$9,688,000
Herbs52015
2014
97
89
7.55
7.52
732
669
ton
ton
$2,260.00
$2,690.00
$1,654,000
$1,800,000
Kale2015
2014
2,534
2,553
12.57
12.25
31,850
31,300
ton
ton
$1,020.00
$994.00
$32,487,000
$31,112,000
Leeks2015
2014
334
329
12.60
12.99
4,210
4,270
ton
ton
$1,500.00
$1,500.00
$6,315,000
$6,405,000
Lettuce, Total62015
2014
107,619
109,157
—
—
—
—
—
—
—
—
$1,506,551,000
$1,426,568,000
Misc. Vegetables,
Bulk
2015
2014
—
—
—
—
127,000
138,000
ton
ton
$715.00
$645.00
$90,805,000
$89,010,000
Fresh2015
2014
9,820
8,468
5.42
6.47
53,200
54,800
ton
ton
$1,120.00
$1,290.00
$59,584,000
$70,692,000
Misc. Vegetables,
Total72015
2014
33,251
29,797
—
—
—
—
—
—
—
—
$150,389,000
$159,702,000

7AG.CO.MONTEREY.CA.US • 2015 MONTEREY COUNTY CROP REPORT
Vegetable Crops (continued)
8 Includes: Bulk.9 Includes: Bell Peppers, Chili Peppers and Pimentos.*Adjusted Figure
$3,261,521,000
$3,084,577,000*
2015
2014
286,637
287,700
VEGETABLE CROPS TOTAL
CROP YEAR ACREAGE PRODUCTION PER ACRE TOTAL UNIT VALUE PER UNIT TOTAL
Mushrooms2015
2014
148
155
—
—
44,393,000
47,028,000
lbs
lbs
$2.14
$2.26
$95,001,000
$106,283,000
Napa Cabbage2015
2014
541
550
29.20
33.63
15,800
18,500
ton
ton
$815.00
$498.00
$12,877,000
$9,213,000
Onions, Dry2015
2014
2,296
1,875
42.00
40.00
96,400
75,000
ton
ton
$226.00
$240.00
$21,786,000
$18,000,000
Onions, Green2015
2014
922
1,005
15.26
15.32
14,100
15,400
ton
ton
$1,800.00
$1,700.00
$25,380,000
$26,180,000
Parsley2015
2014
651
670
18.34
18.21
11,900
12,200
ton
ton
$1,132.00
$931.00
$13,471,000
$11,358,000
Peas82015
2014
1,528
1,485
—
—
—
—
—
—
—
—
$24,120,000
$24,331,000
Peppers92015
2014
1,091
1,144
21.08
20.38
23,000
23,300
ton
ton
$312.00
$359.00
$7,176,000
$8,365,000
Radish2015
2014
141
166
15.25
14.98
2,150
2,490
ton
ton
$1,180.00
$505.00
$2,537,000
$1,257,000
Salad Products2015
2014
—
—
—
—
122,000
154,000
ton
ton
$445.00
$421.00
$54,290,000
$64,834,000
Spinach, Bulk2015
2014
—
—
—
—
113,000
127,000
ton
ton
$1,100.00
$1,090.00
$124,300,000
$138,430,000
Fresh2015
2014
1,460
1,509
9.07
10.20
13,200
15,400
ton
ton
$1,330.00
$1,260.00
$17,556,000
$19,404,000
Spinach, Total2015
2014
13,919
13,959
—
—
—
—
—
—
—
—
$141,856,000
$157,834,000
Spring Mix2015
2014
8,030
8,060
8.63
9.78
69,300
78,800
ton
ton
$1,000.00
$1,120.00
$69,300,000
$88,256,000
Squash2015
2014
209
247
11.09
11.01
2,320
2,700
ton
ton
$532.00
$593.00
$1,234,000
$1,601,000
Tomatoes2015
2014
501
574
18.05
17.92
9,040
10,300
ton
ton
$737.00
$527.00
$6,662,000
$5,428,000

2015 MONTEREY COUNTY CROP REPORT • AG.CO.MONTEREY.CA.US 8
Lettuce Production
10 Carton11 Includes Romaine Hearts
CROP YEAR ACREAGE PRODUCTION PER ACRE TOTAL UNIT VALUE PER UNIT TOTAL
HEAD LETTUCE
Spring2015
2014
11,428
12,208
—
—
—
—
—
—
—
—
—
—
Summer2015
2014
9,267
10,441
—
—
—
—
—
—
—
—
—
—
Fall2015
2014
14,137
12,733
—
—
—
—
—
—
—
—
—
—
Naked Pack2015
2014
—
—
—
—
5,326,000
6,131,000
ctn10
ctn
$16.35
$17.40
$87,080,000
$106,679,000
Wrapped Pack2015
2014
—
—
—
—
23,355,000
23,437,000
ctn
ctn
$17.25
$16.50
$402,874,000
$386,711,000
Head Lettuce, Bulk2015
2014
—
—
—
—
327,000
366,000
ton
ton
$450.00
$431.00
$147,150,000
$157,746,000
Head Lettuce,
Total
2015
2014
42,802
44,208
1,000
1,000
42,898,000
44,208,000
ctn
ctn
$14.85
$14.70
$637,104,000
$651,136,000
LEAF LETTUCE
Butter Leaf
Lettuce
2015
2014
750
728
1,302
1,230
977,000
895,000
ctn
ctn
$10.44
$9.19
$10,200,000
$8,225,000
Endive2015
2014
265
250
1,265
1,250
335,000
313,000
ctn
ctn
$11.70
$11.76
$3,920,000
$3,681,000
Escarole2015
2014
268
210
1,265
1,250
339,000
263,000
ctn
ctn
$12.78
$11.97
$4,332,000
$3,148,000
Green Leaf
Lettuce
2015
2014
7,725
7,907
1,050
1,044
8,111,000
8,255,000
ctn
ctn
$10.51
$9.85
$85,247,000
$81,312,000
Red Leaf Lettuce2015
2014
3,651
2,076
1,050
1,040
3,834,000
2,159,000
ctn
ctn
$10.38
$8.74
$39,797,000
$18,870,000
Romaine Lettuce112015
2014
38,474
39,602
1,050
1,010
40,398,000
39,998,000
ctn
ctn
$13.30
$12.19
$537,293,000
$487,576,000
Leaf Lettuce, Bulk2015
2014
N/A
N/A
N/A
N/A
282,000
274,000
ton
ton
$669.00
$630.00
$188,658,000
$172,620,000
Leaf Lettuce, Total2015
2014
64,817
64,949
N/A
N/A
69,288,000
68,007,000
ctn
ctn
$12.68
$11.40
$869,447,000
$775,432,000
$1,506,551,000
$1,426,568,000
2015
2014
107,619
109,157
LETTUCE CROPS TOTAL

9AG.CO.MONTEREY.CA.US • 2015 MONTEREY COUNTY CROP REPORT
Nearly every day of the week for much of the year, a Certified Farmers’ Market (CFM)—and often more than one—offers fresh produce in Monterey County. It’s another indication of our local agricultural bounty with a bonus: consumers meet farmers face–to–face and have an opportunity to learn more about how their food is grown.
While roadside fruit and vegetable stands have been around for decades, savvy customers often prefer a CFM because of the variety of fruits and vegetables available at reasonable prices. Government assistance programs also provide opportunities for low-income families to purchase nutritious food at the local CFM.
Buyers may not be aware that CFMs provide a desirable level of consumer protection. Some vendors obtain wholesale produce and pass it off as their own at farmers’ markets, resulting in an increase of undercover inspections and investigations. New rules give county agricultural commissioners more authority to regulate markets in coordination with the California Department of Food and Agriculture. Today, customers at CFMs can shop with confidence, knowing their produce was
grown by the vendor who is selling it. The fruits and vegetables are inspected to meet state quality standards and the scales on which the produce is weighed and sold are sealed by the Agricultural Commissioner’s office to be accurate.
Here’s how the regulatory system works: consumers should always be able to find the certified producer’s certificate posted in their stall. Market vendors must obtain the certificate annually from the county agricultural commissioner’s office, and the certificate is valid in any county in California. Obtaining a producer’s
certificate requires inspectors to verify growers are producing what they sell. County commissioners across the state coordinate enforcement activities, and county inspectors check market stalls to ensure compliance. Apart from market certification, county inspectors may also take produce samples to assure state standards for pesticide residues. Farmer’s market produce is not necessarily organic.
If a market vendor is found to be out of compliance, county inspectors issue violations. Once substantiated, violations may lead to civil penalties from $50 to $1,000, depending on the severity of the case, and vendors may be suspended for up to 18 months.
While consumer protection is vital, the Monterey County Agricultural Commissioner’s Office also supports CFMs as a way to bring our agricultural and urban communities together. Markets provide a social setting where food is sold and friendships grow between vendors and their regular customers. For a list of local markets, including hours of operation and locations, go online to our interactive map found at http://ag.co.monterey.ca.us/CFM-Locations
Fruit & Nut Crops
12 Previously in Misc. Fruit.13 Represents Bearing Acres only; see Wine Grape Production, pages 12-13.14 Includes: Apples, Blueberries, Kiwi, Loganberries, Olallieberries, Olives and Walnuts.
$1,149,353,000
$1,033,798,000
2015
2014
59,513
59,495
FRUIT & NUT CROPS TOTAL
Certified Farmers’ Markets
CFM Inspector Shayla Neufeld along with Donna Iles, President of the Monterey Bay Farmers’ Market Board of Directors
CROP YEAR ACREAGE PRODUCTION PER ACRE TOTAL UNIT VALUE PER UNIT TOTAL
Avocados2015
2014
229
229
2.19
2.51
503
575
ton
ton
$2,910.00
$2,120.00
$1,464,000
$1,219,000
Blackberries12 2015 204 7.00 1,430 ton $3,130.00 $4,476,000
Grapes (Wine)132015
2014
44,296
45,993
3.16
4.35
140,000
200,000
ton
ton
$1,328.00
$1,240.00
$185,925,000
$247,357,000
Lemons2015
2014
1,294
1,284
35.26
29.99
45,600
38,500
ton
ton
$1,180.00
$729.00
$53,808,000
$28,067,000
Misc. Fruit142015
2014
133
153
5.50
5.78
732
884
ton
ton
$3,500.00
$3,250.00
$2,562,000
$2,873,000
Raspberries2015
2014
711
782
9.00
9.00
6,400
7,040
ton
ton
$6,200.00
$6,390.00
$39,680,000
$44,986,000
Strawberries2015
2014
12,646
11,054
36.09
34.70
456,000
384,000
ton
ton
$1,833.00
$1,800.00
$835,848,000
$691,200,000
Processing2015
2014
—
—
—
—
70,300
29,000
ton
ton
$364.00
$624.00
$25,590,000
$18,096,000
Strawberries Total2015
2014
12,646
11,054
—
—
526,000
413,000
ton
ton
—
—
$861,438,000
$709,296,000

2015 MONTEREY COUNTY CROP REPORT • AG.CO.MONTEREY.CA.US 10
Catherine Barr MONTEREY BAY CERTIFIED FARMERS’ MARKETSThe Monterey Bay Certified Farmers’ Markets (MBCFM) is an organization comprised of a team of farmers, vendors and marketing staff led by Executive Director, Catherine Barr. Since 1993, Catherine has dedicated her efforts to expanding the markets throughout
local communities and championing the preservation of small family farmers. From humble beginnings, MBCFM has expanded into a thriving group of farmers’ markets that bring our communities together in appreciation of the rich bounty of our region. Today, there are approximately fourteen Certified Farmers’ Markets run by six different associations stretching from as far south as King City to as far west as Carmel and north to Marina.
In 2010, Catherine was awarded the prestigious “Al Smith Friend of Agriculture Award” by the Santa Cruz County Farm Bureau for her outstanding service to the agricultural community. In addition to serving as Executive Director, Catherine directly manages a few of the markets. She is passionate about ensuring that all of the Certified Farmers’ Markets she oversees adhere to the standards and policies enforced by the Monterey County Agricultural Commissioner’s Office. Catherine believes the markets are ever-evolving and provide an amazing opportunity for the community to meet local farmers who grow the food that ends up on everyone’s table.
Jake ReisdorfCARMEL HONEY COMPANYJake Reisdorf, founder of the Carmel Honey Company, is a 12 year-old boy whose business emerged from a 5th grade homework assignment. His teacher asked the class to research how professionals in different fields spend their day. Jake chose to research beekeeping—a hobby he developed a
passion for after receiving a hive from an older beekeeper and taking classes with his father. The class project was so successful that people wanted to start buying his honey, so Jake and his mom created a label and began selling it at farmers’ markets. Less than two years after starting the business, Carmel Honey Company has 40 wholesale accounts in the Monterey area and sells honey online at carmelhoneycompany.com. The company also sells and places beehives which, for a monthly fee, Jake monitors and maintains in addition to his own. Jake also enjoys sharing his ever-growing knowledge of bees, the importance of pollination and the benefits of honey bees with classrooms and the community.
Stevie HallHALL’S ORGANIC FARMSStevie Hall’s interest in agriculture started in high school. He raised animals in Future Farmers’ of America (FFA) and 4-H, learning ownership and responsibility at a young age. While at Hartnell College, where he took classes in crop production and food safety, he also interned at the D’Arrigo Bros. cooler. To gain more hands-on experience, Stevie
took a part-time field position at USDA Agricultural Research Service as a biological science aid assisting in lettuce breeding research. He then enrolled in ALBA (see article on page 20), and received college credit and the skills to start his own farm. After completing the ALBA program, he began farming on a half-acre parcel made available through ALBA. Over the next three years he juggled school, work and his farming business. After five years, he made the commitment to become a full-time organic farmer and resigned from the USDA. Stevie now farms five acres, growing more than 30 commodities, and sells his produce wholesale to brokers, at local and Bay Area farmers’ markets, and directly to restaurants and other foodservice companies.
Certified Farmers’ Market Growers
68
1
183
156
101
101
13
14
4
5
111012
13
2
986
7

11AG.CO.MONTEREY.CA.US • 2015 MONTEREY COUNTY CROP REPORT
Flora RipleyFLORA FARMSFlora Ripley and her family have a farm in the foothills and floodplain of the Arroyo Seco River, near Greenfield, CA. After having a floral business for 30 years, she started growing tomatoes in a 40’ by 40’ home garden. Her love of farming grew and she and her family now plant many other seasonal crops, including lettuces and vegetables.
The farm expanded to about 4 acres and became a family operation. Her daughter, her husband and Flora all work on the farm. They wake at around 4 a.m. to begin their daily maintenance and usually end around 9 p.m. Whether it’s harvesting, weeding or planting new crops, there is never a shortage of things to do. Flora’s family came from Switzerland in the 1930s and started a dairy in Gonzales, CA, so farming is in her heritage. When she realized she could begin to sell at the farmers’ markets in her area of the county, Flora became a certified producer, and has been selling her produce for more than eight years.
Maria Luz Reyes LA MILPA FARMMaria Luz Reyes got her start in farming through the nonprofit ALBA program (see article on page 20). She took classes at ALBA for about six months, gaining skills on how to start a farm through hands-on classes. She learned how to farm organically and do things like set up irrigation systems, prepare the soil for various
types of produce, apply fertilizer and harvest crops. Maria is now a successful farmer who earns more than 85 percent of her income from selling her produce at farmers’ markets in Monterey County and beyond. She often gets up at 4 a.m. to prepare to sell at markets outside the Monterey region, like San Francisco, then returns to the field the same day in the afternoon to harvest more vegetables for the following day. She also sells her organic produce to small stores and other organizations.
68
1
183
156
101
101
13
14
4
5
111012
13
2
986
7
CERTIFIED FARMER’S MARKETS
CARMEL1 Carmel Barnyard Market The Carmel Barnyard (South parking lot)2 Carmel–By–The–Sea CFM 6th Ave. between Mission & Junipero (Devendorf Park)3 Carmel Valley CFM 77 Carmel Valley Rd. (Carmel Valley Community Park)
KING CITY4 King City CFM 200 Broadway St. & 2nd St.
MARINA5 Marina CFM 215 Reservation Rd. & Vista Del Camino
MONTEREY6 Del Monte Market 800 Del Monte Center (Whole Foods parking lot)7 Monterey Pennisula College Market Fishnet Rd. & Via Lavandera (North parking lot)8 The Old Monterey Market Place Alvarado St. between Pearl St. & Del Monte Ave.
PACIFIC GROVE9 Pacific Grove CFM Central Ave. & Grand Ave. (Jewell Park)
SALINAS10 Alisal CFM 632 East Alisal St. & Pearl St. (Gabby Plaza)11 Natividad Medical Center CFM Laurel Dr. & Constitution Blvd. (Southeast parking lot)12 Old Town Salinas CFM Gabilan St. between Salinas St. & Main St.13 Salinas Valley Memorial CFM Romie Ln. & Wilgart Way (Northwest parking lot)
SOLEDAD14 Soledad CFM Soledad St. between Front St. & Monterey St.
For hours of operation, visit our interactive map at http://ag.co.monterey.ca.us/CFM-Locations

2015 MONTEREY COUNTY CROP REPORT • AG.CO.MONTEREY.CA.US 12
Wine Grape Production
15 Grenache Blanc, Marsanne, Muscat Orange, Picpoul Blanc, Roussanne, Sauvignon Musque, Semillon, Tocai Friulano and Vermentino.16 Barbera, Carignane, Cinsaut, Counoise, Mataro, Sangiovese, Souzao, Tempranillo, and Touriga Nacional.
WHITE GRAPEVARIETIES
HARVESTED ACRES
AVERAGE PRICEPER TON TOTAL TONS TOTAL VALUE
Chardonnay 17,044 $1,270 64,100 $81,407,000
Riesling 1,908 $992 6,600 $6,547,000
Pinot Gris 1,302 $1,410 4,360 $6,148,000
Sauvignon Blanc 945 $1,100 3,960 $4,356,000
Gewurztraminer 832 $911 4,530 $4,127,000
Muscat Blanc 199 $1,110 931 $1,033,000
Gruner Veltliner 88 $1,160 704 $817,000
Malvasia Bianca 153 $1,190 367 $437,000
Albarino 60 $1,290 312 $402,000
Chenin Blanc 127 $849 357 $303,000
Other Whites15 129 $1,120 230 $258,000
Pinot Blanc 101 $1,230 187 $230,000
Vioginier 116 $1,300 134 $174,000
SUBTOTAL WHITE GRAPE 23,004 — 86,772 $106,239,000
RED GRAPEVARIETIES
HARVESTED ACRES
AVERAGE PRICEPER TON TOTAL TONS TOTAL VALUE
Pinot Noir 8,345 $1,890 20,400 $38,556,000
Merlot 5,195 $1,170 13,300 $15,561,000
Cabernet Sauvignon 4,536 $1,310 11,200 $14,672,000
Syrah 1,649 $1,220 3,590 $4,380,000
Malbec 325 $1,340 1,140 $1,528,000
Petite Sirah 257 $1,230 1,230 $1,513,000
Grenache 236 $1,610 838 $1,349,000
Other Reds16 296 $1,290 689 $889,000
Cabernet Franc 108 $1,180 334 $394,000
Petit Verdot 162 $1,060 322 $341,000
Valdiguie 30 $1,130 171 $193,000
Tannat 35 $1,250 133 $166,000
Zinfandel 118 $797 181 $144,000
SUBTOTAL RED GRAPE 21,292 — 53,528 $79,686,000

13AG.CO.MONTEREY.CA.US • 2015 MONTEREY COUNTY CROP REPORT
Wine Grape Production (continued)
Monterey County Certified Organic Program
Monterey County’s Agricultural Commissioner’s Office was the first to be registered as an organic certifier with the State of California and accredited by the United States Department of Agriculture (USDA), and is one of only three in the state. In addition to Monterey County, Marin and Yolo Counties are registered as organic certifiers in California.
Since 2002, the Monterey County Certified Organic (MCCO) program has certified crop production, handlers, processors and wild crops, and we are accredited by the USDA National Organic Program (NOP). Our certification program is designed to help facilitate the sale of fresh and processed food that is produced organically in Monterey County. We certify that products labeled “organic” are actually grown and processed using organic practices and comply with NOP standards for agricultural products. Our aim is to enhance the credibility of organic agriculture in Monterey County as a viable approach that helps preserve our environment. We also make sure that organically-produced products adhere to the USDA National Organic Program and the California State Organic Program standards.
Our organic certification program is an important aspect of the entire portfolio of regulatory functions handled by the Monterey County Agricultural Commissioner’s Office. The MCCO program also offers the opportunity to support local agriculture.
Organic certification is a complex process that requires farmers, handlers, shippers and certifiers to register with the California Department of Food and Agriculture, and food processors are required
to register with California Department of Public Health. The organic certification program helps to ensure the integrity of certified organic products produced in Monterey County is maintained and transparent throughout production.
With the development of new ideas and more efficient practices, organic certification requirements are constantly evolving to support a healthy and diverse environment and the availability of certified organic products. Government agencies, accredited certifiers and organic operators work with each
other on the organic certification process. All involved strive to coordinate on developing effective organic production practices and the best ways to monitor and enforce these standards.
For more information, visit http://ag.co.monterey.ca.us/MCCO
YEAR NONBEARING ACRES BEARING ACRES TOTAL TONS VALUE
2015 2,549 44,296 140,300 $185,925,000
2014 2,512 45,993 200,000 $247,357,000
2013 1,531 42,986 185,000 $226,982,000
2012 1,936 45,130 172,000 $214,306,000
2011 2,006 43,034 124,000 $140,976,000
2010 2,572 43,321 177,000 $172,916,000
2009 3,975 40,792 204,000 $238,082,000
2008 4,006 40,144 201,000 $238,366,000
2007 3,068 39,636 224,000 $251,604,000
2006 3,144 38,165 210,000 $217,983,000

2015 MONTEREY COUNTY CROP REPORT • AG.CO.MONTEREY.CA.US 14
Field Crops
17 Includes: Peruano, Pintos, Pink, Pinquito and Lima Beans18 Includes: Safflower, Pasture and Barley.19 Includes: Hay Oats and Misc. Oats.
20 Includes: Bulls, Cull Cows, Dairy Cows, Milk Manufacturing, Market Milk and Wool.21 Includes: Eggs, Fertilizer, Hatcheries and Poultry.+Hundredweight (100 pounds)
CROP YEAR ACREAGE PRODUCTION PER ACRE TOTAL UNIT VALUE PER UNIT TOTAL
Barley, Grain2015
2014
4,163
3,854
0.50
0.50
2,080
1,930
ton
ton
$142.00
$287.00
$295,000
$554,000
Beans172015
2014
340
490
1.45
1.00
493
490
ton
ton
$1,880.00
$1,120.00
$927,000
$549,000
Hay, Alfalfa2015
2014
233
140
5.50
6.40
1,280
896
ton
ton
$260.00
$280.00
$333,000
$251,000
Misc. Field Crops182015
2014
994
1,200
1.91
1.54
1,900
1,850
ton
ton
$103.00
$87.30
$196,000
$162,000
Oats192015
2014
451
305
2.00
1.81
902
552
ton
ton
$205.00
$200.00
$185,000
$110,000
Rangeland2015
2014
1,063,390
1,063,390
—
—
—
—
acre
acre
$17.50
$16.00
$18,609,000
$17,014,000
Wheat, Grain2015
2014
1,100
800
0.88
1.08
968
864
ton
ton
$210.00
$96.60
$203,000
$83,500
CROP YEAR HEAD PRODUCTION UNIT VALUE PERUNIT TOTAL
Cattle & Calves2015
2014
19,300
11,200
184,000
90,500
cwt+
cwt
$146.00
$201.00
$26,864,000
$18,191,000
Stocker2015
2014
36,400
24,000
271,000
176,000
cwt
cwt
$199.00
$204.00
$53,929,000
$35,904,000
Sheeps & Lambs2015
2014
1,400
1,600
1,940
2,160
cwt
cwt
$107.00
$131.00
$208,000
$283,000
Hogs2015
2014
900
1,000
243,000
270,000
lbs
lbs
$0.69
$1.04
$168,000
$281,000
Misc. Livestock20 &
Poultry21 Products
2015
2014— — — —
$10,059,000
$9,627,000
$20,748,000
$18,724,000
2015
2014
1,070,671
1,070,179
FIELD CROPS TOTAL
$91,228,000
$64,286,000
2015
2014
LIVESTOCK & POULTRY TOTAL
Livestock & Poultry

15AG.CO.MONTEREY.CA.US • 2015 MONTEREY COUNTY CROP REPORT
Seed ProductionCROP YEAR ACREAGE PRODUCTION
PER ACRE TOTAL UNIT VALUE PER UNIT TOTAL
Bean Seed, All2015
2014
1,041
1,804
0.83
0.95
864
1,710
ton
ton
$3,280.00
$2,110.00
$2,834,000
$3,608,000
Misc. Seed222015
2014
925
998
0.69
0.89
638
888
ton
ton
$3,010.00
$1,940.00
$1,920,000
$1,723,000
$4,754,000
$5,331,000
2015
2014
1,966
2,802
SEED PRODUCTION TOTAL
Apiary Production
22 Includes: Barley, Broccoli, Carrots, Cauliflower, Celery, Corn, Cucumber, Flowers, Kohlrabi, Onions, Peas, Peppers, Radish, Soybean and Squash.23 Seed Crops: Broccoli, Cauliflower, Cucumber, Onion, Squash and Raspberry Fruit.
CROP YEAR COLONIES PRODUCTION UNIT VALUE PER UNIT TOTAL
Honey2015
2014
—
—
6,000
8,700
lbs
lbs
$2.10
$2.25
$12,600
$19,600
Pollination232015
2014
3,525
2,250
—
—
colony
colony
$60.00
$50.00
$212,000
$113,000
Wax2015
2014
—
—
300
420
lbs
lbs
$4.50
$4.60
$1,350
$1,930
$226,000
$135,000
2015
2014
APIARY PRODUCTION TOTAL

2015 MONTEREY COUNTY CROP REPORT • AG.CO.MONTEREY.CA.US 16
Cut Flowers & Cut Foliage
24 Includes: Amaryllis, Amarnthus, Anemones, Anthurium, Asters, Azalea, Bells of Ireland, Belladona, Bulperum, Calendula, Calla Lily, Campanula, Coleus, Corn Flower, Craspedia, Crocosmia, Curly Willow, Cyclamen, Daffodils, Dahlias, Delphinium, Euphorbia, Ferns, Freesia, Gardenia, Gladiolus, Godetia, Gypsophila, Hydrangea, Kale, Kangaroo Paw, Larkspur, Lavender, Liatris, Leather Leaf, Leptospermum, Leucodendron, Leucospermum, Limonium, Lisianthus, Marigold, Millet, Portulaca, Protea, Queen Anne’s Lace, Ranunculus, Safflower, Scabiosa, Solidacious, Statice, Stock, Sunflower, Sweet Peas, Tuberose, Tweedia and Yarrow.
CROP YEAR ACREAGE PRODUCTION QUANTITY SOLD UNIT VALUE PER
UNIT TOTAL
Alstroemeria2015
2014
2.2
2.7
55,900
55,600
per bunch
per bunch
$2.27
$2.15
$127,000
$120,000
Asiatic Lily2015
2014
0.9
0.9
34,400
33,100
per bunch
per bunch
$4.42
$4.38
$152,000
$145,000
Carnations2015
2014
2.1
4.9
715,000
1,153,000
per bloom
per bloom
$0.13
$0.15
$93,000
$173,000
Chrysanthemums2015
2014
21.7
23.7
1,852,000
2,031,000
per bloom
per bloom
$0.93
$1.36
$1,722,000
$2,762,000
Eucalyptus2015
2014
71.0
72.1
187,000
190,000
per bunch
per bunch
$1.58
$1.57
$295,000
$298,000
Gerbera2015
2014
9.2
9.2
4,234,000
4,228,000
per bloom
per bloom
$0.46
$0.45
$1,948,000
$1,903,000
Iris2015
2014
7.7
8.0
200,000
202,000
per bunch
per bunch
$3.06
$2.99
$612,000
$604,000
Miniature
Carnations
2015
2014
1.5
2.7
51,400
98,500
per bunch
per bunch
$1.63
$1.55
$83,800
$153,000
Misc. Cut Flowers
& Cut Foliage24
2015
2014
194.1
189.4
10,950,000
11,602,000
various
various
$2.20
$2.05
$24,090,000
$23,784,000
Oriental Lilies2015
2014
4.7
3.1
145,000
101,000
per bunch
per bunch
$9.30
$9.98
$1,349,000
$1,008,000
Roses2015
2014
8.9
9.4
2,734,000
2,903,000
per bloom
per bloom
$1.23
$1.14
$3,363,000
$3,309,000
Snapdragon2015
2014
12.6
12.7
355,000
362,000
per bunch
per bunch
$3.94
$4.41
$1,399,000
$1,596,000
Tulips2015
2014
1.8
1.8
22,500
24,900
per bunch
per bunch
$4.43
$4.42
$100,000
$110,000
$35,334,000
$35,965,000
2015
2014
338
341
CUT FLOWERS & CUT FOLIAGE TOTAL

17AG.CO.MONTEREY.CA.US • 2015 MONTEREY COUNTY CROP REPORT
Nursery Products
25 Includes: Begonia, Bromeliads, Bulbs, Christmas Trees, Clivia, Corms, Cypress, Euonymus, Ficus, Fruit & Nut Trees, Jasmine, Milkweed, Myrtle, Native Plants, Rhizomes, Tubers, Turf and Water Pond Plants.26 Totals from Cut Flower & Cut Foliage and Nursery Products.
CROP YEAR ACREAGE PRODUCTION QUANTITY SOLD UNIT VALUE PER
UNIT TOTAL
Bedding Plants2015
2014
126.3
128.9
19,100,000
23,315,000
per plant
per plant
$1.76
$1.68
$33,616,000
$33,743,000
Misc. Nursery
Products25
2015
2014
241.8
296.8
6,741,000
16,363,000
various
various
$2.36
$0.91
$15,909,000
$14,890,000
Orchids2015
2014
72.9
73.2
11,615,000
11,591,000
per plant
per plant
$7.92
$7.33
$91,991,000
$84,962,000
Poinsettia2015
2014
53.1
54.0
1,175,000
1,426,000
per plant
per plant
$4.31
$4.26
$5,064,000
$6,075,000
Potted Plants2015
2014
210.8
211.8
13,917,000
13,682,000
per plant
per plant
$3.02
$2.41
$42,029,000
$32,974,000
Propagative
Materials
2015
2014
6.2
9.3
958,000
1,888,000
per plant
per plant
$0.42
$0.51
$402,000
$963,000
Vegetable
Transplants
2015
2014
82.2
82.7
1,217,649,000
1,209,143,000
per plant
per plant
$0.07
$0.06
$85,235,000
$72,549,000
Woody
Ornamentals
2015
2014
36.0
38.8
735,000
867,000
per plant
per plant
$5.59
$5.14
$4,109,000
$4,456,000
$313,689,000
$286,577,000
2015
2014
1,167
1,236
OVERALL NURSERY26 TOTAL
$278,355,000
$250,612,000
2015
2014
829
895
NURSERY PRODUCTS TOTAL

2015 MONTEREY COUNTY CROP REPORT • AG.CO.MONTEREY.CA.US 18
Produce Exports by Commodity
COMMODITY 2015 TOTAL POUNDS COMMODITY 2014 TOTAL POUNDS
Lettuce 373,448,000 Lettuce 414,554,000
Strawberry 86,645,000 Broccoli 92,636,000
Broccoli 83,245,000 Strawberry 79,268,000
Celery 42,754,000 Celery 56,029,000
Cauliflower 29,323,000 Cauliflower 25,773,000
Value Added 16,917,000 Value Added 23,985,000
Fennel 9,870,000 Anise 11,928,000
Carrot 3,772,000 Carrot 4,668,000
Raspberry 3,515,000 Seed 4,024,000
Green Onion 3,335,000 Green Onion 3,435,000
Seed 2,298,000 Raspberry 3,046,000
Nursery Stock 2,289,000 Cactus Pears 2,963,000
Other 26,746,000 Other 21,921,000
TOTAL 684,157,000 744,230,000
LETTUCE 55%
STRAWBERRY 13%
BROCCOLI 12%
CELERY 6%
CAULIFLOWER 4%
OTHER 4%
VALUE ADDED 3%
FENNEL 1%
SEEDS .3%
NURSERY STOCK .3%
RASPBERRY .5%
CARROT .5%
GREEN ONION .5%

19AG.CO.MONTEREY.CA.US • 2015 MONTEREY COUNTY CROP REPORT
JAPAN7%
TAIWAN13%
HONG KONG3%
REPUBLICOF KOREA
1%CANADA63%
MEXICO7% SINGAPORE
2%
Agricultural Exports Trade Partners
COUNTRY 2015 TOTAL POUNDS COUNTRY 2014 TOTAL POUNDS
Canada 430,700,000 Canada 476,961,000
Taiwan 86,721,000 Taiwan 79,301,000
Mexico 49,846,000 Japan 59,906,000
Japan 48,672,000 Mexico 42,753,000
Hong Kong 21,570,000 Hong Kong 18,964,000
Singapore 11,486,000 Korea, Republic of 11,637,000
European Union 10,655,000 Singapore 10,685,000
Puerto Rico 5,567,000 European Union 9,147,000
Korea, Republic of 5,370,000 Puerto Rico 5,501,000
Saudi Arabia 4,751,000 Kuwait 2,362,000
United Arab Emirates 2,746,000 United Arab Emirates 1,085,000
Kuwait 1,199,000 Malaysia 1,073,000
Panama 872,000 New Zealand 1,026,000
Australia 709,000 Panama 445,000
Malaysia 614,000 Saudi Arabia 313,000
China 576,000 Australia 223,000
New Zealand 561,000 Thailand 220,000
Qatar 486,000 Brazil 164,000
Thailand 352,000 Qatar 162,000
Philippines 180,000 French Polynesia 150,000
French Polynesia 130,000 Kenya 147,000
Brazil 105,000 Philippines 144,000
Peru 67,600 Colombia 116,000
Colombia 59,100 Norway 62,900
Chile 28,000 South Africa 58,300
Kenya 15,300 Chile 50,700
South Africa 15,200 Guatemala 13,500

2015 MONTEREY COUNTY CROP REPORT • AG.CO.MONTEREY.CA.US 20
Agriculture and Land-Based Training Association (ALBA)by Chris Brown, Executive Director
Founded in 2001, ALBA’s mission is to help aspiring, low-income farm workers establish their own small-scale organic farming businesses. In doing so, ALBA promotes new business establishment, job creation and retention, workforce skills development, and eco-friendly farming practices. Headquartered on 150 acres of farmland on Old Stage Road between Salinas and Chualar, ALBA has educated 350 aspiring farmers in organic farming practices and helped launch more than 100 small farm businesses.
ALBA’s Farmer Education and Enterprise Development (FEED) Program provides participants low-cost access to land, equipment and assistance, lowering the barriers to starting a farm business. FEED is comprised of three main services which are designed to develop the necessary knowledge, skills and resources to successfully establish a small farm business over
the course of five years: Farmer Education, Organic Farm Incubator, and ALBA Organics.
The Farmer Education course is a nine-month, intensive, bilingual education program that includes both classroom instruction and field-based training. Each year 30 participants are enrolled in the Hartnell College-accredited curriculum. The course is designed and taught by ALBA staff members with masters’ degrees in crop science, environmental policy and business. In addition, local professionals contribute to classroom discussion from the agribusiness and non-profit sectors.
In the second year of the program, about a dozen aspiring farmers launch their business in the Organic Farm Incubator where they spend up to four years establishing their farming business in a supervised lower-risk environment. Farmers
receive subsidized access to land, equipment and technical assistance, effectively lowering the barriers to establishing an organic farm business.
ALBA Organics—a licensed food hub—provides access to markets for the participants’ produce, allowing them to focus on agricultural production and other aspects of the complex business of farming in their initial years. Sales of their produce has grown by ten times over five years to $5.2 million, reflecting the significant and rising impact ALBA has on the lives of participating farmers.
Currently, 42 small farm businesses operate on ALBA’s land. In the last three years, twelve farmers have transitioned from ALBA land to continue farming independently. With rapidly growing markets for local, organic produce, prospects for ALBA farmers have never been better. For more information, visit albafarmers.org
Organic Production Registered in Monterey CountyYEAR PRODUCERS ACRES GROSS SALES
2015 178 66,636 $335,090,000
2014 158 46,579 $277,294,000
2013 131 33,381 $214,437,000
2012 131 22,288 $182,657,000
2011 113 19,863 $170,352,000
2010 87 19,945 $168,956,0002010
Gross SalesAcres
2011 2012 2013 2014 2015
Graduating Class of 2015, ALBA One Year Farmer Education Course

21AG.CO.MONTEREY.CA.US • 2015 MONTEREY COUNTY CROP REPORT
Summary of Pest Management ActivitiesPEST AGENT / MECHANISM SCOPE OF PROGRAMCOUNTY BIOLOGICAL CONTROL
Yellow Starthistle, Centaurea solstitialis Seedhead Weevils/Fly,Bangasternus orientalis, Eustenopus villosus, Urophora sirunaseva, Larinus curtus
47 sites
Italian Thistle, Carduus spp. Seedhead weevil, Rhinocyllus conicus General Distribution
Russian Thistle, Salsola australis Leaf & stem mining moths, Coleophora spp. General Distribution
Puncture Vine, Tribulus terrestris Stem & Seed weevils, and Microlarinus spp. General and Local Distribution
Ash Whitefly, Siphoninus phillyreae Parasitic wasp, Encarsia inaron General Distribution
PEST ERADICATION
Scotch Thistle, Onopordum acanthium Mechanical/Chemical One Infestation
Skeletonweed, Chrondrilla junceae Mechanical/Chemical One Infestation
Puna Grass, Achnatherum brachychaetum Mechanical/Chemical Nine Infestations
Hydrilla (Hydrilla verticillata), and biddy-biddy (Acaena novae-zelandiae) have been eradicated.
PEST MANAGEMENT
Roadside (virus host) Weeds Chemical County right-of-ways, spot treatment
Roadside, Targeted Noxious Weeds Chemical County right-of-ways, spot treatment
Lettuce Mosaic Virus Virus-Free Seed Indexing of all county-planted seed
Lettuce Mosaic Virus Host-Free Period No lettuce above ground 12/7-12/21
Celery Mosaic Virus Host-Free Period No celery above ground in January
Lettuce Root Aphid Host-Free District Lombardy poplar prohibition
PEST DETECTION/EXCLUSION
Pest detection is the systematic search for pests outside of a known infested area or for pests not known to occur in California. The general goal is to detect pests before they become established over an area so large that eradication is no longer biologically or economically feasible. Pest exclusion refers to the process of denying entry of pests into an area by routine inspection of incoming plant shipments and rejection of infested material. Detection trapping is performed primarily by the County Agricultural Commissioner’s offices.
TARGET PEST INSECT HOSTS NO. OF TRAP SERVICINGS
Medfly Fruit Trees 2,858
Melon Fruit Fly Vegetable Gardens 915
Mexican Fruit Fly Fruit Trees 1,978
Oriental Fruit Fly Fruit Trees 2,853
Misc. Fruit Flies Fruits and Vegetables 948
Gypsy Moth Shade Trees 1,050
Japanese Beetle Turf, Roses 1,014
Trogoderma Beetle High Hazard Commodities 125
Glassy Winged Sharpshooter Nurseries/Vineyards/Urban Areas 9,185
Light Brown Apple Moth Ornamental/Commercial Crops 1,998
European Grapevine Moth Grapes 22,639
Asian Citrus Psyllid Citrus 4,252
Pest detection trapping activities accounted for 13,896 hours, with a total of 49,815 trap services being made. A total of 773 inspections were made on incoming plant shipments at parcel terminals, with three rejections issued. For the glassy-winged sharpshooter program, 1,387 incoming nursery stock shipments were inspected from regulated areas and no viable life stages of the pest were detected. Another 485 incoming plant material inspections were performed for in-state and out-of-state shipments. Phytosanitary field inspections for seed accounted for 2,652 hours, with a total of 630 inspections being completed on 1,984 acres. Special surveys were made for exotic invasive weeds, cymbalaria aphid, karnal bunt, citrus greening disease, sudden oak death disease, Asian citrus psyllid, brown marmorated stink bug, and glassy-winged sharpshooter.

MONTEREY COUNTY AGRICULTURAL COMMISSIONER’S OFFICE
1428 Abbott St., Salinas, CA 93901tel (831) 759-7325 • fax (831) 759-2268 • ag.co.monterey.ca.us


![Crop Circles[1]](https://img.pdfslide.tips/doc/110x75/5559a793d8b42a5b2a8b4d0e/crop-circles1.jpg)