Embed Size (px)
Citation preview

MSU Design Team 10
Final Report
12/9/2015
Dryer Moisture Sensor System
William Wang
Qi Luo
Ariadna Fernandez
James Fashoda
Thurakij Praditukrit
1
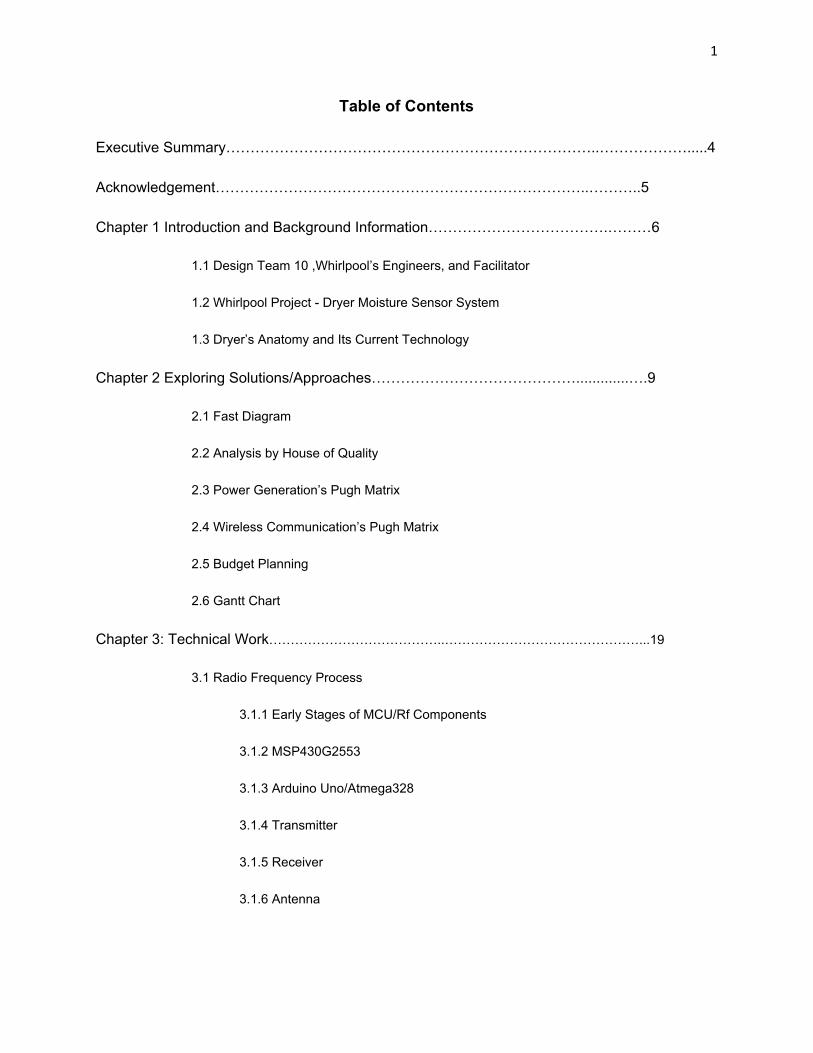
Table of Contents
Executive Summary…………………………………………………………………..……………….....4
Acknowledgement…………………………………………………………………..………..5
Chapter 1 Introduction and Background Information……………………………….………6
1.1 Design Team 10 ,Whirlpool’s Engineers, and Facilitator
1.2 Whirlpool Project Dryer Moisture Sensor System
1.3 Dryer’s Anatomy and Its Current Technology
Chapter 2 Exploring Solutions/Approaches…………………………………….............….9
2.1 Fast Diagram
2.2 Analysis by House of Quality
2.3 Power Generation’s Pugh Matrix
2.4 Wireless Communication’s Pugh Matrix
2.5 Budget Planning
2.6 Gantt Chart
Chapter 3: Technical Work…………………………………..………………………………………...19
3.1 Radio Frequency Process
3.1.1 Early Stages of MCU/Rf Components
3.1.2 MSP430G2553
3.1.3 Arduino Uno/Atmega328
3.1.4 Transmitter
3.1.5 Receiver
3.1.6 Antenna
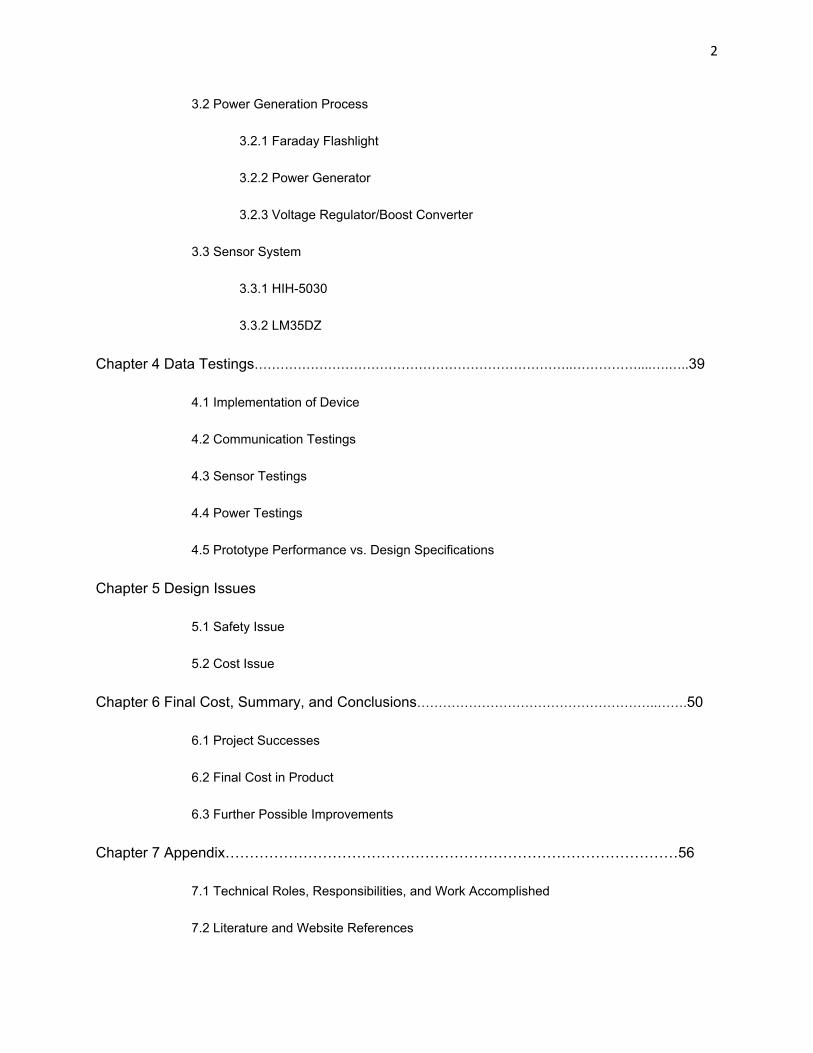
2
3.2 Power Generation Process
3.2.1 Faraday Flashlight
3.2.2 Power Generator
3.2.3 Voltage Regulator/Boost Converter
3.3 Sensor System
3.3.1 HIH5030
3.3.2 LM35DZ
Chapter 4 Data Testings………………………………………………………………..……………....….…..39
4.1 Implementation of Device
4.2 Communication Testings
4.3 Sensor Testings
4.4 Power Testings
4.5 Prototype Performance vs. Design Specifications
Chapter 5 Design Issues
5.1 Safety Issue
5.2 Cost Issue
Chapter 6 Final Cost, Summary, and Conclusions………………………………………………..…….50
6.1 Project Successes
6.2 Final Cost in Product
6.3 Further Possible Improvements
Chapter 7 Appendix…………………………………………………………………………………56
7.1 Technical Roles, Responsibilities, and Work Accomplished
7.2 Literature and Website References

3
7.3 Flowchart and Programming Codes
7.3.1 Transmitter Flowchart
7.3.2 Transmitter Code
7.3.3 Receiver Flowchart
7.3.4 Receiver Code
4
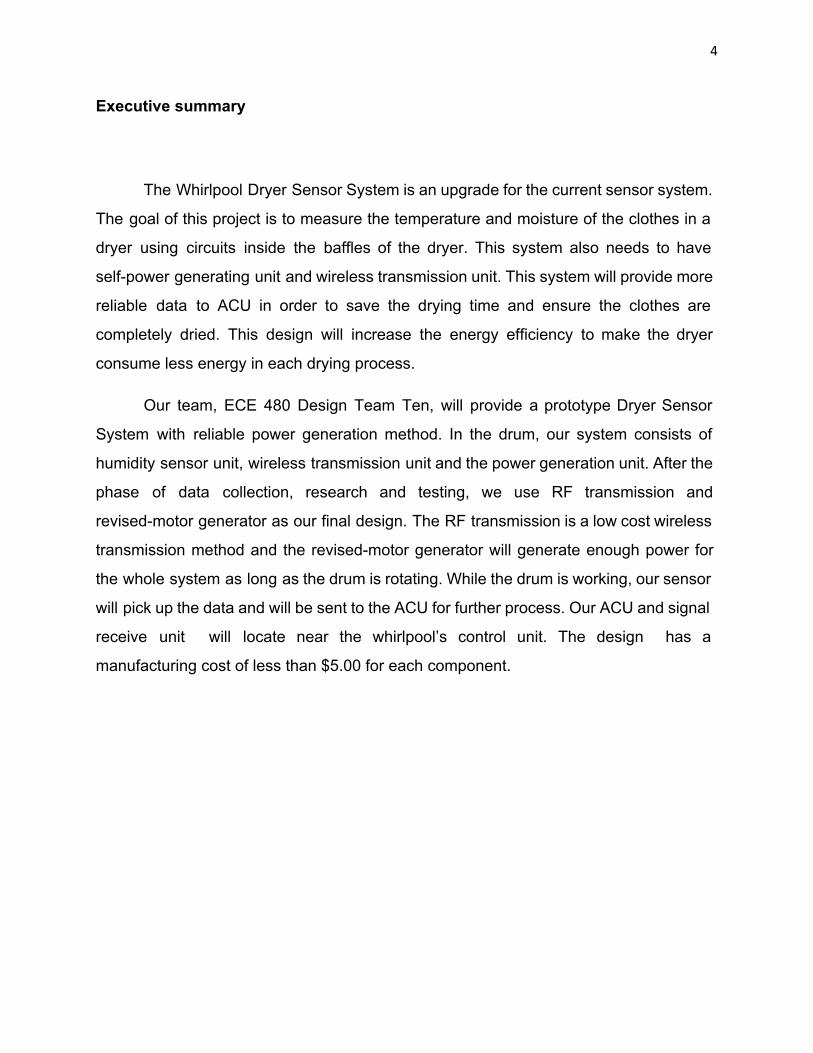
Executive summary
The Whirlpool Dryer Sensor System is an upgrade for the current sensor system.
The goal of this project is to measure the temperature and moisture of the clothes in a
dryer using circuits inside the baffles of the dryer. This system also needs to have
selfpower generating unit and wireless transmission unit. This system will provide more
reliable data to ACU in order to save the drying time and ensure the clothes are
completely dried. This design will increase the energy efficiency to make the dryer
consume less energy in each drying process.
Our team, ECE 480 Design Team Ten, will provide a prototype Dryer Sensor
System with reliable power generation method. In the drum, our system consists of
humidity sensor unit, wireless transmission unit and the power generation unit. After the
phase of data collection, research and testing, we use RF transmission and
revisedmotor generator as our final design. The RF transmission is a low cost wireless
transmission method and the revisedmotor generator will generate enough power for
the whole system as long as the drum is rotating. While the drum is working, our sensor
will pick up the data and will be sent to the ACU for further process. Our ACU and signal
receive unit will locate near the whirlpool’s control unit. The design has a
manufacturing cost of less than $5.00 for each component.

5
Acknowledgements:
On behalf of ECE 480 Design Team Ten, we would like to thank the following people:
Our sponsors from Whirlpool Corporation, Josh Paul Fisher ,Mike Range and Cory Timothy Graves
for their advice and support in the development of our project
Our facilitator, Dr. Mukkamala
for his guidance and critique
MSU ECE Technical Services: Mr. Brian Wright and Mrs. Roxanne Peacock,
for supplying and ordering parts
6
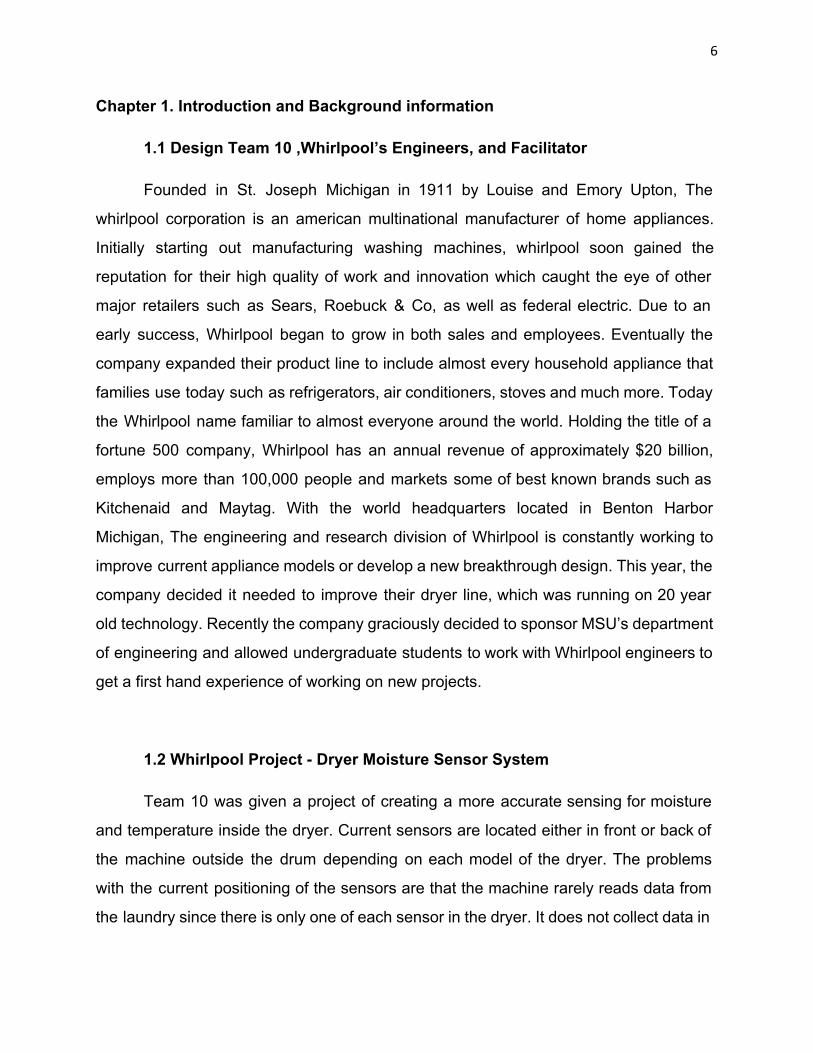
Chapter 1. Introduction and Background information
1.1 Design Team 10 ,Whirlpool’s Engineers, and Facilitator
Founded in St. Joseph Michigan in 1911 by Louise and Emory Upton, The
whirlpool corporation is an american multinational manufacturer of home appliances.
Initially starting out manufacturing washing machines, whirlpool soon gained the
reputation for their high quality of work and innovation which caught the eye of other
major retailers such as Sears, Roebuck & Co, as well as federal electric. Due to an
early success, Whirlpool began to grow in both sales and employees. Eventually the
company expanded their product line to include almost every household appliance that
families use today such as refrigerators, air conditioners, stoves and much more. Today
the Whirlpool name familiar to almost everyone around the world. Holding the title of a
fortune 500 company, Whirlpool has an annual revenue of approximately $20 billion,
employs more than 100,000 people and markets some of best known brands such as
Kitchenaid and Maytag. With the world headquarters located in Benton Harbor
Michigan, The engineering and research division of Whirlpool is constantly working to
improve current appliance models or develop a new breakthrough design. This year, the
company decided it needed to improve their dryer line, which was running on 20 year
old technology. Recently the company graciously decided to sponsor MSU’s department
of engineering and allowed undergraduate students to work with Whirlpool engineers to
get a first hand experience of working on new projects.
1.2 Whirlpool Project Dryer Moisture Sensor System
Team 10 was given a project of creating a more accurate sensing for moisture
and temperature inside the dryer. Current sensors are located either in front or back of
the machine outside the drum depending on each model of the dryer. The problems
with the current positioning of the sensors are that the machine rarely reads data from
the laundry since there is only one of each sensor in the dryer. It does not collect data in
7
more than one spot of the laundry load resulting in the accuracy drop of the output data.
Whirlpool does not specify which method we use to solve the problem but the only two
specifications that are of concern to them are to limit the cost of implementation to $5
and the design should last the duration of the dryer’s life.
1.3 Dryer’s Anatomy and Its Current Technology
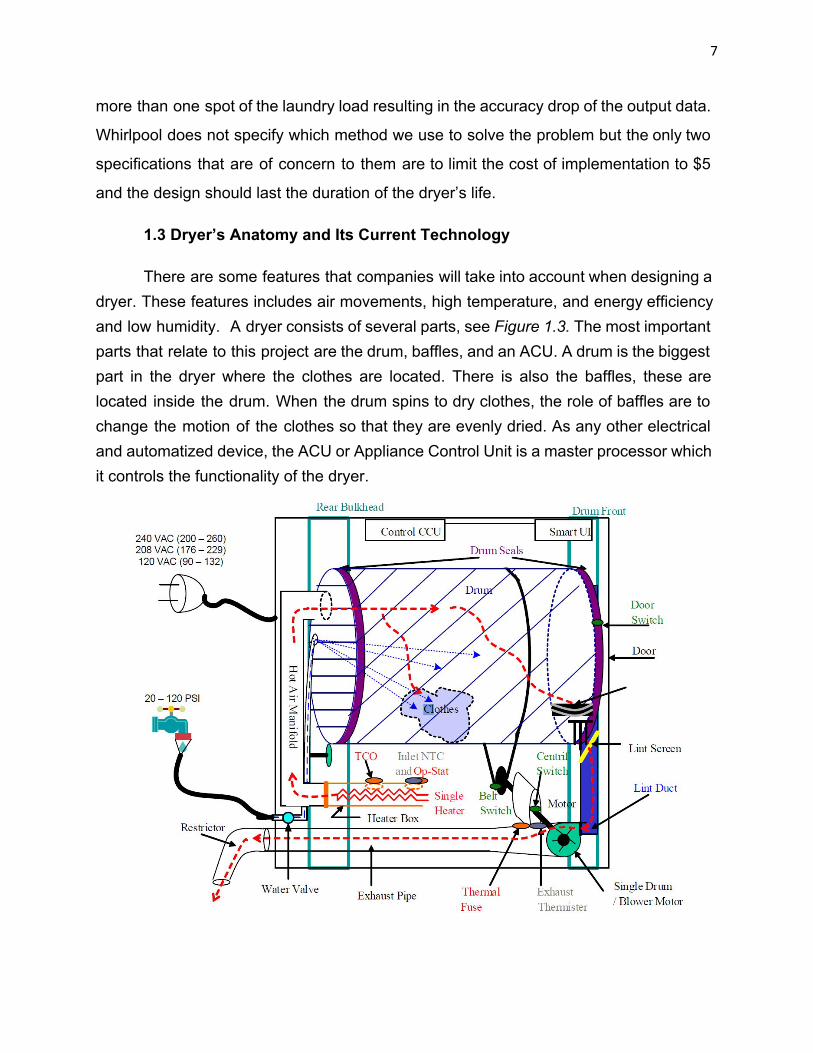
There are some features that companies will take into account when designing a dryer. These features includes air movements, high temperature, and energy efficiency and low humidity. A dryer consists of several parts, seeFigure 1.3. The most important parts that relate to this project are the drum, baffles, and an ACU. A drum is the biggest part in the dryer where the clothes are located. There is also the baffles, these are located inside the drum. When the drum spins to dry clothes, the role of baffles are to change the motion of the clothes so that they are evenly dried. As any other electrical and automatized device, the ACU or Appliance Control Unit is a master processor which it controls the functionality of the dryer.
8
Figure 1.3 Schematic of a Functional Dryer
The current sensing technology such as moisture sensor in Whirlpool’s dryer is located
next to the lint screen in front of the machine. This sensors are able to sense the
moisture in the laundry load, and the temperature sensor is located at the back of the
machine outside of the drum. The issue with this current technology is that those are
located at specific places inside the dryer. Team 10’s design objective is to increase the
number of sensors in order to have a more accurately sense of moisture and
temperature in the laundry load.

9
Chapter 2. Exploring Solutions Selecting a specific approach
2.1 Strategizing the goals Fast Diagram
Before building a prototype, Team 10 used a Function Analysis System
Technique (FAST diagram) to help communication between team members. By using
this technique the team will have a clear understanding of the project and key functions
of the product. The FAST diagram shown in figure 2.1 explains the main function:
sense moisture inside a dryer and in the right side the steps the team will cover to
accomplished the main objective.
Team 10’s design uses moisture sensors connected to a Microcontroller
ATMEGA328. The sensors are placed inside a baffle located in the dryer’s drum. Once
the dryer is running, the sensors measured humidity and this reading will be send to the
other microcontroller working as an ACU that controls the dryer’s functionality.
Figure 2.1. FAST Diagram
As it is shown in the FAST diagram, the project is divided on two main parts:
signal transmission and power generator. The first one should be a reliable wireless
application able to transfer data and read information from the sensors. The power
generation part could not be connected to AC power and be able to produce enough
10
power for the signal transmission process. The design should be also be able to work
properly under hazardous conditions like high temperatures and constant movement.
2.2 Analysis by House of Quality Technique
A house of quality is a voice of customer analysis tool. In order to guarantee our
design will meet our sponsor’s expectation, the group uses this technique to understand
what Whirlpool Corporation would like to add/improve in their current product. This
process was completed by the second week of the semester and it is based on the
customer requirements. Below in figure 2.2.1, it could be seen at the top (the roof) the
design requirements for our design and how these features are correlated between
each other. The left side of the matrix expresses the sponsor’s needs. The bottom part
displays the percent of how important these requirements are for their current product.
At the end, the house of quality is a technique the group used to improve the planning
process so our customer (Whirlpool Corporation) will be satisfy with the solution the
group decided to use.
11
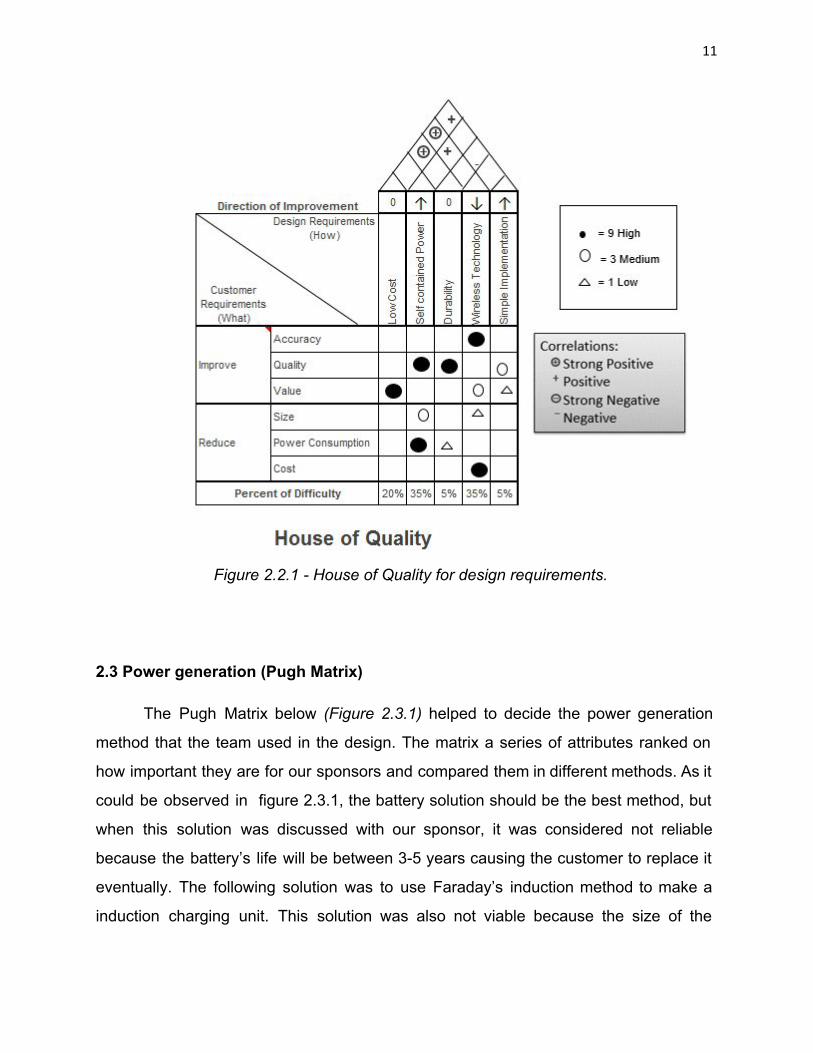
Figure 2.2.1 House of Quality for design requirements.
2.3 Power generation (Pugh Matrix)
The Pugh Matrix below (Figure 2.3.1) helped to decide the power generation
method that the team used in the design. The matrix a series of attributes ranked on
how important they are for our sponsors and compared them in different methods. As it
could be observed in figure 2.3.1, the battery solution should be the best method, but
when this solution was discussed with our sponsor, it was considered not reliable
because the battery’s life will be between 35 years causing the customer to replace it
eventually. The following solution was to use Faraday’s induction method to make a
induction charging unit. This solution was also not viable because the size of the
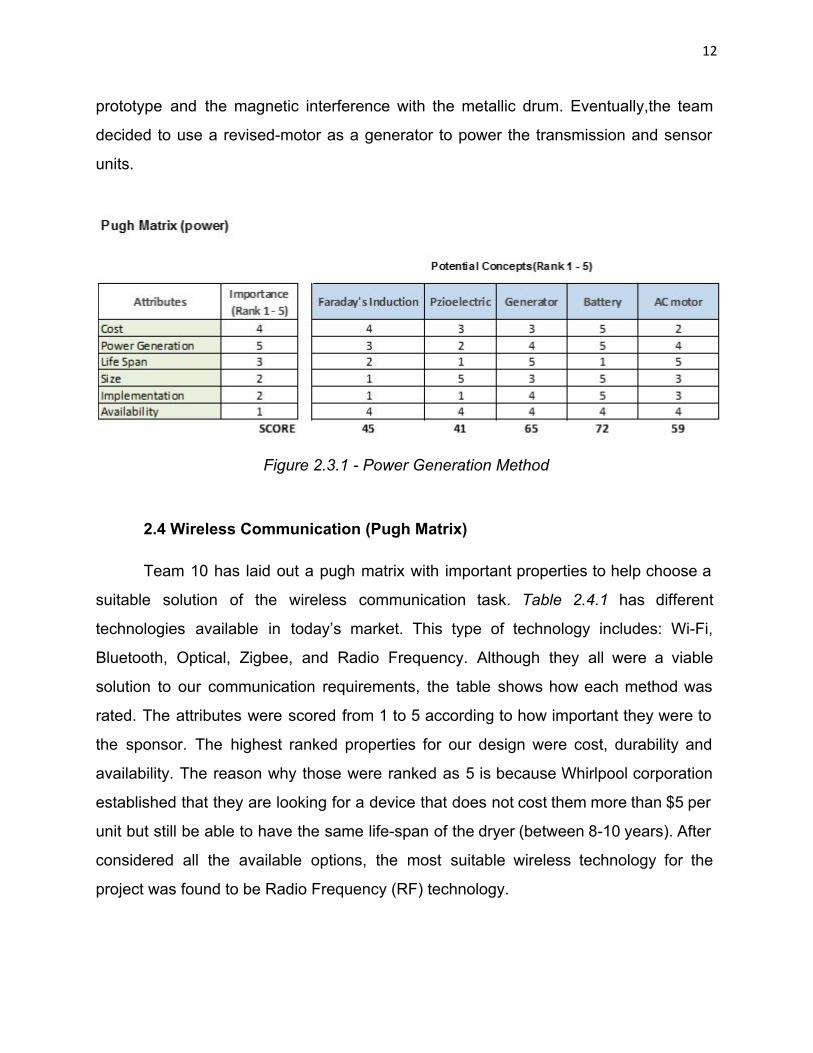
12
prototype and the magnetic interference with the metallic drum. Eventually,the team
decided to use a revisedmotor as a generator to power the transmission and sensor
units.
Figure 2.3.1 Power Generation Method
2.4 Wireless Communication (Pugh Matrix)
Team 10 has laid out a pugh matrix with important properties to help choose a
suitable solution of the wireless communication task. Table 2.4.1 has different
technologies available in today’s market. This type of technology includes: WiFi,
Bluetooth, Optical, Zigbee, and Radio Frequency. Although they all were a viable
solution to our communication requirements, the table shows how each method was
rated. The attributes were scored from 1 to 5 according to how important they were to
the sponsor. The highest ranked properties for our design were cost, durability and
availability. The reason why those were ranked as 5 is because Whirlpool corporation
established that they are looking for a device that does not cost them more than $5 per
unit but still be able to have the same lifespan of the dryer (between 810 years). After
considered all the available options, the most suitable wireless technology for the
project was found to be Radio Frequency (RF) technology.

13
Potential Concepts
(Rank 1 5)
Attributes Importance
(Rank 1 5) WiFi Bluetooth Optical ZigBee Radio
Power
Consumption 4 3 3 5 4 5
Data packets 2 4 3 5 3 4
Range/distance 3 3 3 5 3 4
Frequency 2 4 5 5 5 4
Cost 5 3 1 3 4 4
Durability 5 4 3 4 5 3
Size 2 2 4 3 3 4
Simplicity 4 2 4 4 3 4
Availability 5 3 3 3 4 5
SCORE 97 96 127 124 132
Table 2.4.1 Communication Pugh Matrix
2.5 Budget Planning and Price per Device
Whirlpool Corporation established that regardless of the design the team will use
to approach the problem, the total cost per device should be less or equal to $5. The
price per unit was based on how many parts a large sized company like Whirlpool
Corporation will buy in order to integrate the device in their current and future products.
As every other senior design team, Team 10 was provided with a budget of $500 .
Based on the selected type of wireless communication and power generator, the team
was initially expecting to spend $94 for the prototype. The breakdown price by parts for
the initial prototype is described in figure 2.5.1 but as any other engineer project, the
design was modified based on the testing process giving a result of new prototype cost
of $90.08 (refer to figure 2.5.2).

14
Figure 2.5.1 Budget Planning Initial Prototype
Team 10 ended the semester with a $87.20 left in its budget. The team spent
$185 in building a prototype and $88 in materials to support the testing process and
other expenses. Some of the auxiliary components the team bought includes:
capacitors, sensors, motors, different variations of motors among other components.
Figure 2.5.2 Budget planning of Iterative design
As it was stated before, the price to put the prototype in production should not
cost more than $5. To establish a reference price of the device, the engineers from
Whirlpool coworking with the team established that a good reference could be half of
the cost of a part when the highest quantity is ordered through the website
www.digikey.com. In other words, for example if the moisture sensor HIH5030001 is
listed as $3.55 when 5000 units are ordered, then the price estimation for this part
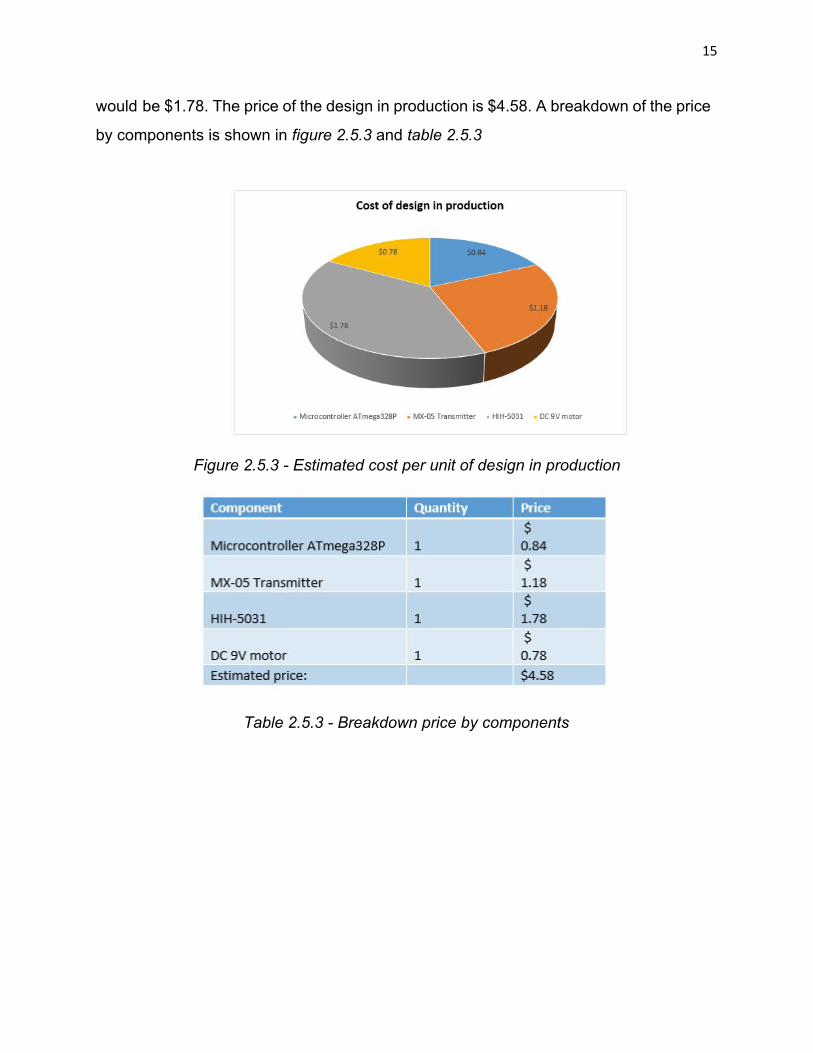
15
would be $1.78. The price of the design in production is $4.58. A breakdown of the price
by components is shown in figure 2.5.3 and table 2.5.3
Figure 2.5.3 Estimated cost per unit of design in production
Table 2.5.3 Breakdown price by components
16
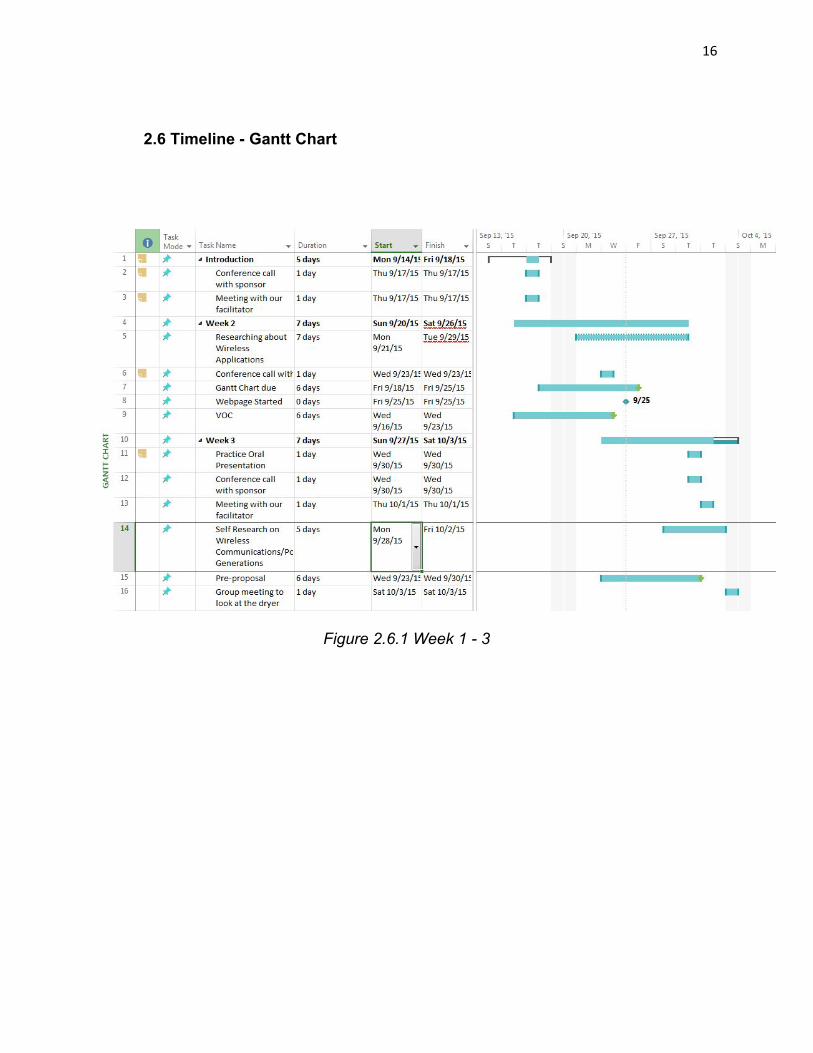
2.6 Timeline Gantt Chart
Figure 2.6.1 Week 1 3
17
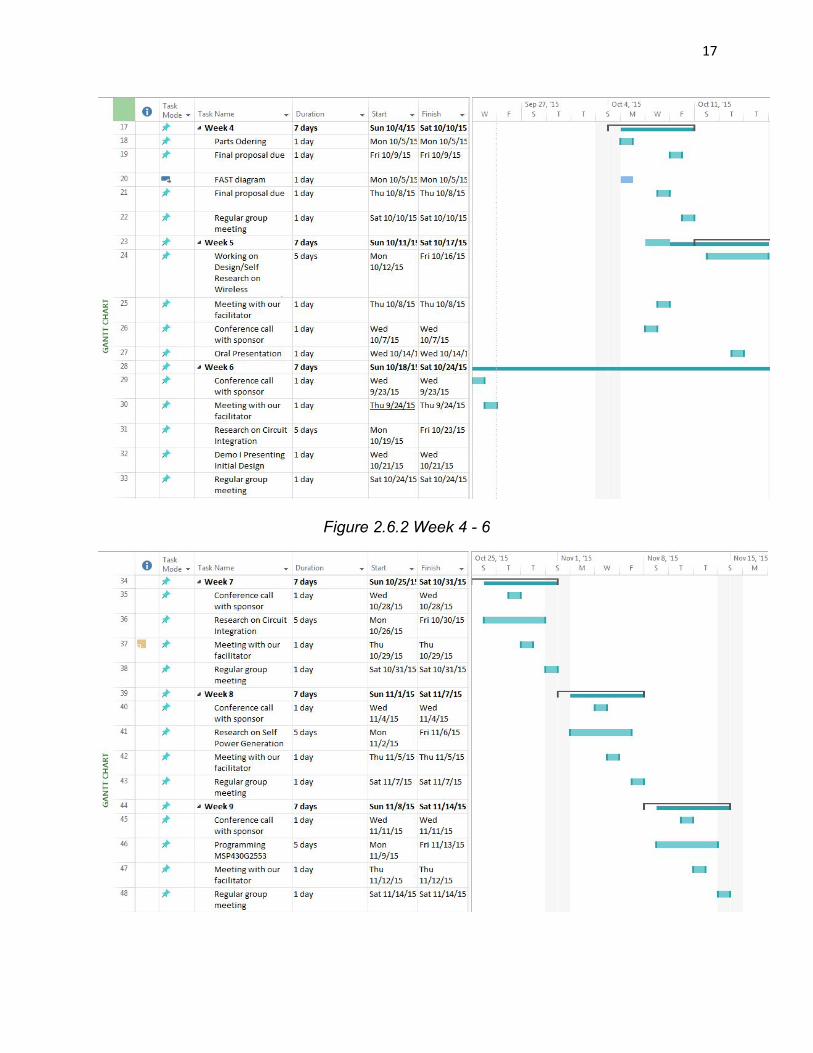
Figure 2.6.2 Week 4 6
18
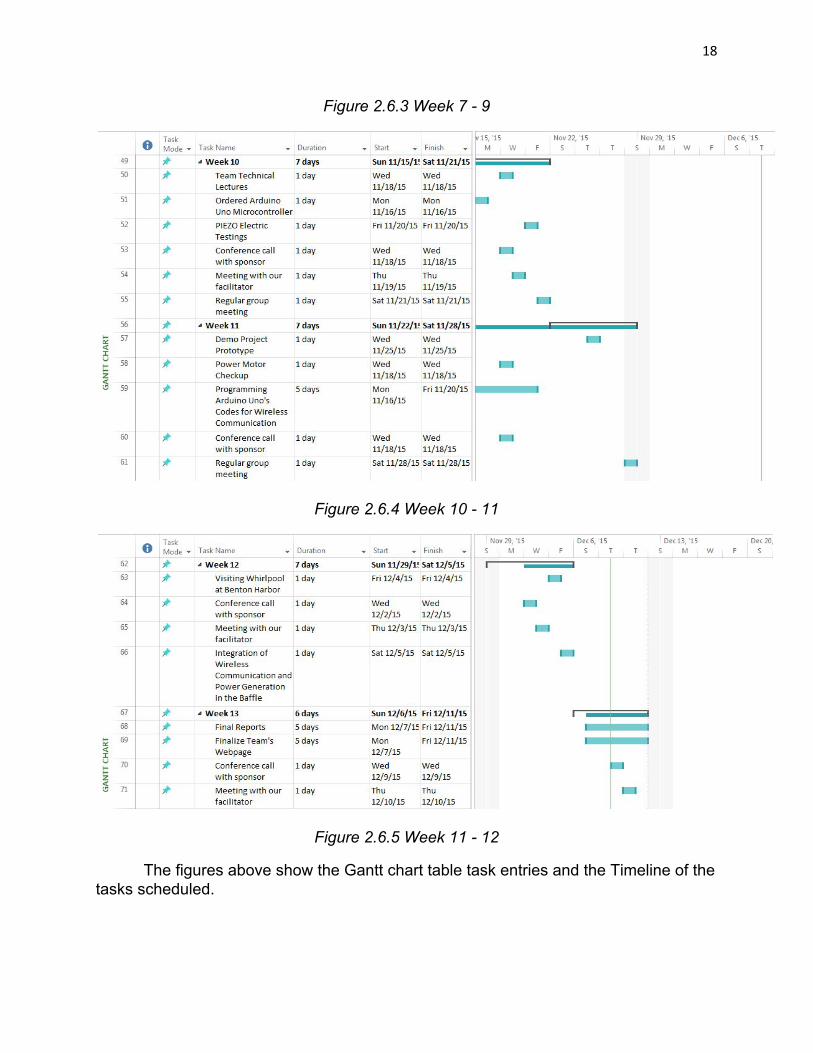
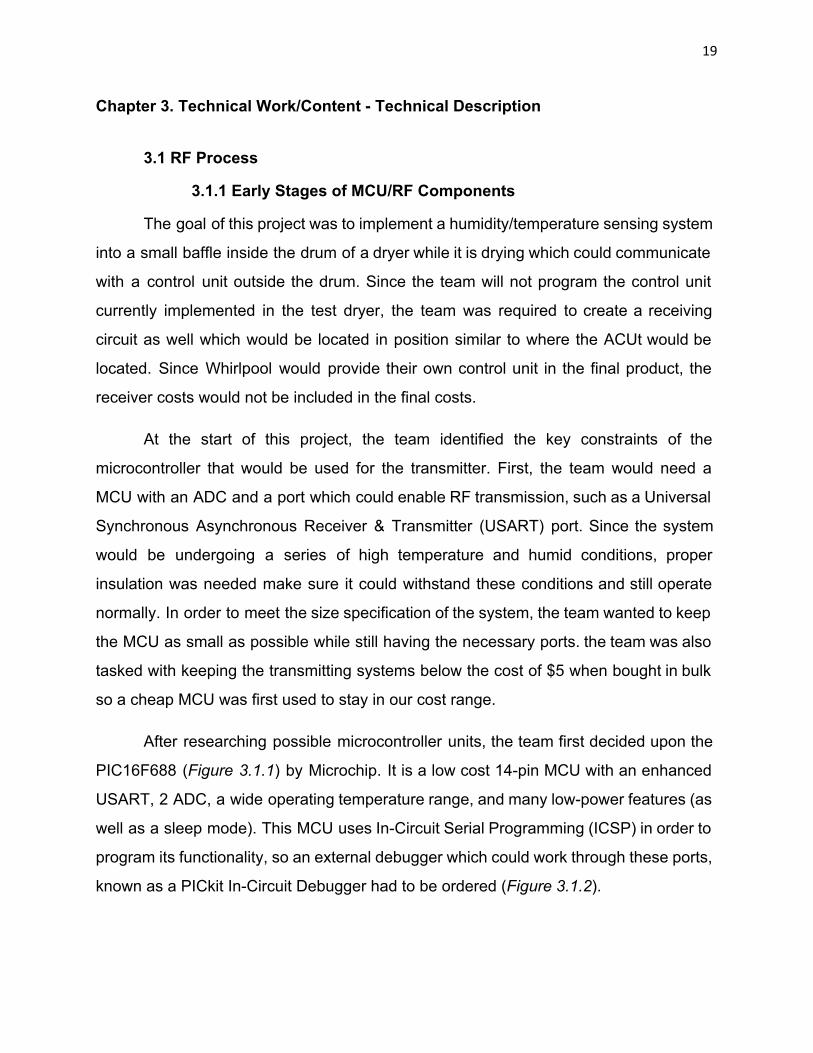
Figure 2.6.3 Week 7 9
Figure 2.6.4 Week 10 11
Figure 2.6.5 Week 11 12
The figures above show the Gantt chart table task entries and the Timeline of the tasks scheduled.
19
Chapter 3. Technical Work/Content Technical Description
3.1 RF Process
3.1.1 Early Stages of MCU/RF Components
The goal of this project was to implement a humidity/temperature sensing system
into a small baffle inside the drum of a dryer while it is drying which could communicate
with a control unit outside the drum. Since the team will not program the control unit
currently implemented in the test dryer, the team was required to create a receiving
circuit as well which would be located in position similar to where the ACUt would be
located. Since Whirlpool would provide their own control unit in the final product, the
receiver costs would not be included in the final costs.
At the start of this project, the team identified the key constraints of the
microcontroller that would be used for the transmitter. First, the team would need a
MCU with an ADC and a port which could enable RF transmission, such as a Universal
Synchronous Asynchronous Receiver & Transmitter (USART) port. Since the system
would be undergoing a series of high temperature and humid conditions, proper
insulation was needed make sure it could withstand these conditions and still operate
normally. In order to meet the size specification of the system, the team wanted to keep
the MCU as small as possible while still having the necessary ports. the team was also
tasked with keeping the transmitting systems below the cost of $5 when bought in bulk
so a cheap MCU was first used to stay in our cost range.
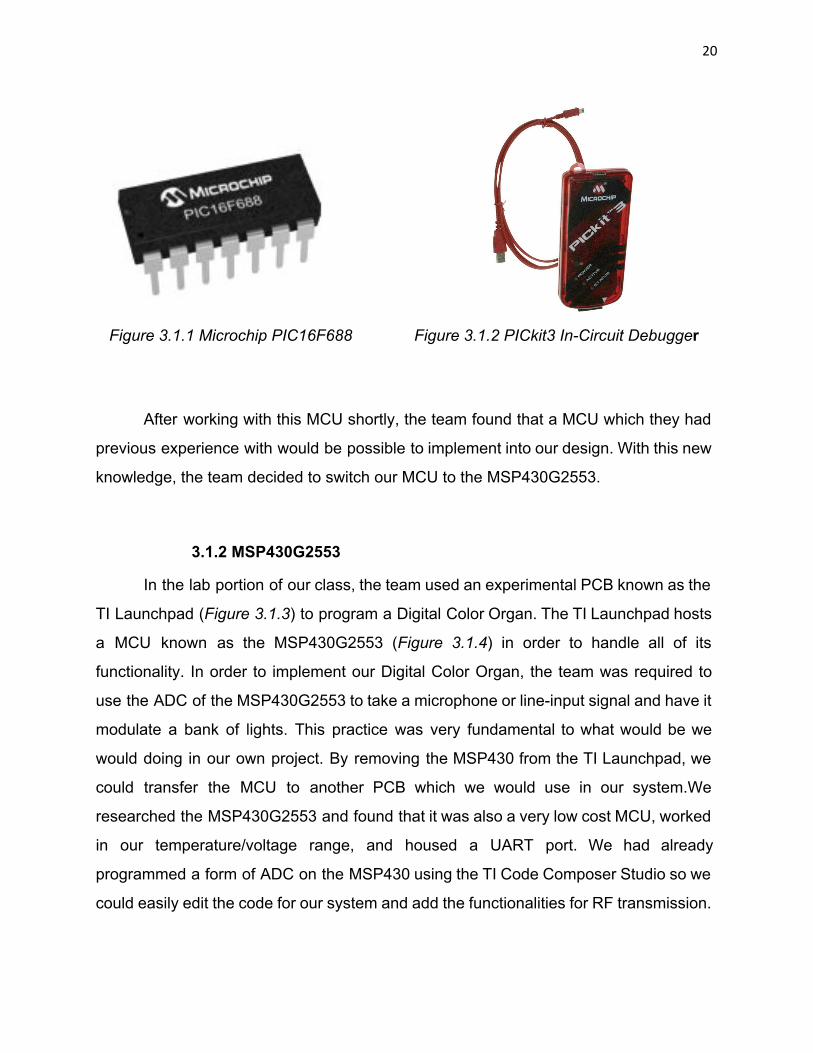
After researching possible microcontroller units, the team first decided upon the
PIC16F688 (Figure 3.1.1) by Microchip. It is a low cost 14pin MCU with an enhanced
USART, 2 ADC, a wide operating temperature range, and many lowpower features (as
well as a sleep mode). This MCU uses InCircuit Serial Programming (ICSP) in order to
program its functionality, so an external debugger which could work through these ports,
known as a PICkit InCircuit Debugger had to be ordered (Figure 3.1.2).
20
Figure 3.1.1 Microchip PIC16F688 Figure 3.1.2 PICkit3 InCircuit Debugger
After working with this MCU shortly, the team found that a MCU which they had
previous experience with would be possible to implement into our design. With this new
knowledge, the team decided to switch our MCU to the MSP430G2553.
3.1.2 MSP430G2553
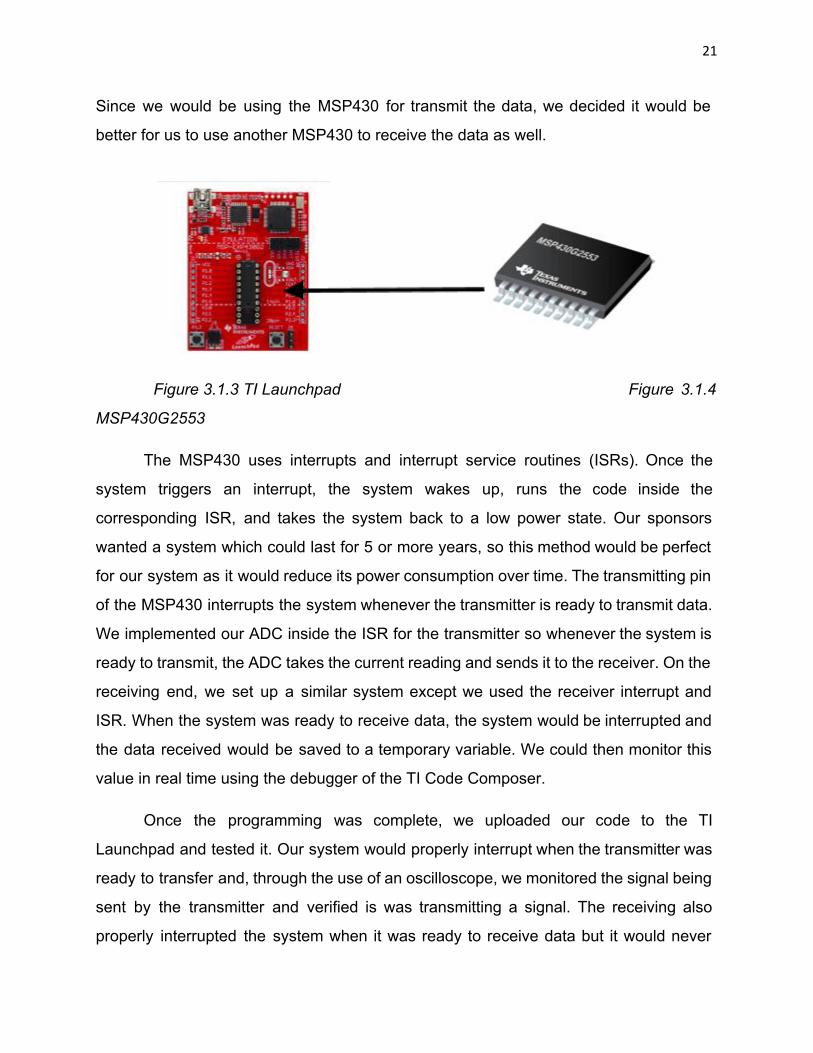
In the lab portion of our class, the team used an experimental PCB known as the
TI Launchpad (Figure 3.1.3) to program a Digital Color Organ. The TI Launchpad hosts
a MCU known as the MSP430G2553 (Figure 3.1.4) in order to handle all of its
functionality. In order to implement our Digital Color Organ, the team was required to
use the ADC of the MSP430G2553 to take a microphone or lineinput signal and have it
modulate a bank of lights. This practice was very fundamental to what would be we
would doing in our own project. By removing the MSP430 from the TI Launchpad, we
could transfer the MCU to another PCB which we would use in our system.We
researched the MSP430G2553 and found that it was also a very low cost MCU, worked
in our temperature/voltage range, and housed a UART port. We had already
programmed a form of ADC on the MSP430 using the TI Code Composer Studio so we
could easily edit the code for our system and add the functionalities for RF transmission.
21
Since we would be using the MSP430 for transmit the data, we decided it would be
better for us to use another MSP430 to receive the data as well.
Figure 3.1.3 TI Launchpad Figure 3.1.4
MSP430G2553
The MSP430 uses interrupts and interrupt service routines (ISRs). Once the
system triggers an interrupt, the system wakes up, runs the code inside the
corresponding ISR, and takes the system back to a low power state. Our sponsors
wanted a system which could last for 5 or more years, so this method would be perfect
for our system as it would reduce its power consumption over time. The transmitting pin
of the MSP430 interrupts the system whenever the transmitter is ready to transmit data.
We implemented our ADC inside the ISR for the transmitter so whenever the system is
ready to transmit, the ADC takes the current reading and sends it to the receiver. On the
receiving end, we set up a similar system except we used the receiver interrupt and
ISR. When the system was ready to receive data, the system would be interrupted and
the data received would be saved to a temporary variable. We could then monitor this
value in real time using the debugger of the TI Code Composer.
Once the programming was complete, we uploaded our code to the TI
Launchpad and tested it. Our system would properly interrupt when the transmitter was
ready to transfer and, through the use of an oscilloscope, we monitored the signal being
sent by the transmitter and verified is was transmitting a signal. The receiving also
properly interrupted the system when it was ready to receive data but it would never

22
receive the data. We initially assumed there was a problem with our transmitter and
receiver. At the time, we were using a straight wire for an antenna. To optimize our
signal, we created a quarter wavelength antenna and used it in our system, to no avail.
We also researched possible mistakes we could have made with our program but could
not find any possible solutions.
At this point, it seemed that our current design would not work. Consequently, we
researched other MCUs which we could implement in our system. The Arduino Uno,
which hosts the Atmega328 in the same fashion as the TI Launchpad, seemed very
promising for our system but its cost seemed to be a possible issue. After researching
the Bare Bones Arduino project, in which Arduino PCB such as the Uno were recreated
on another PCB using no other components except those necessary for functionality,
we decided it was possible to implement into our system if we used this method as well
as the correctly priced components we need for full functionality of our system.
3.1.3 Arduino Uno/Atmega328
For our final design, we used the Arduino Uno R3 which hosts the Atmega328
microcontroller. The Atmega328 (Figure 3.1.3) is a low power MCU that hosts multiple
analog comparators which we could use to read our sensors, as well as USART ports
for our transmitter/receiver. An advantage of this MCU is that can be pulled directly from
the Arduino Uno PCB and implemented directly into our design with its most recently
uploaded program.
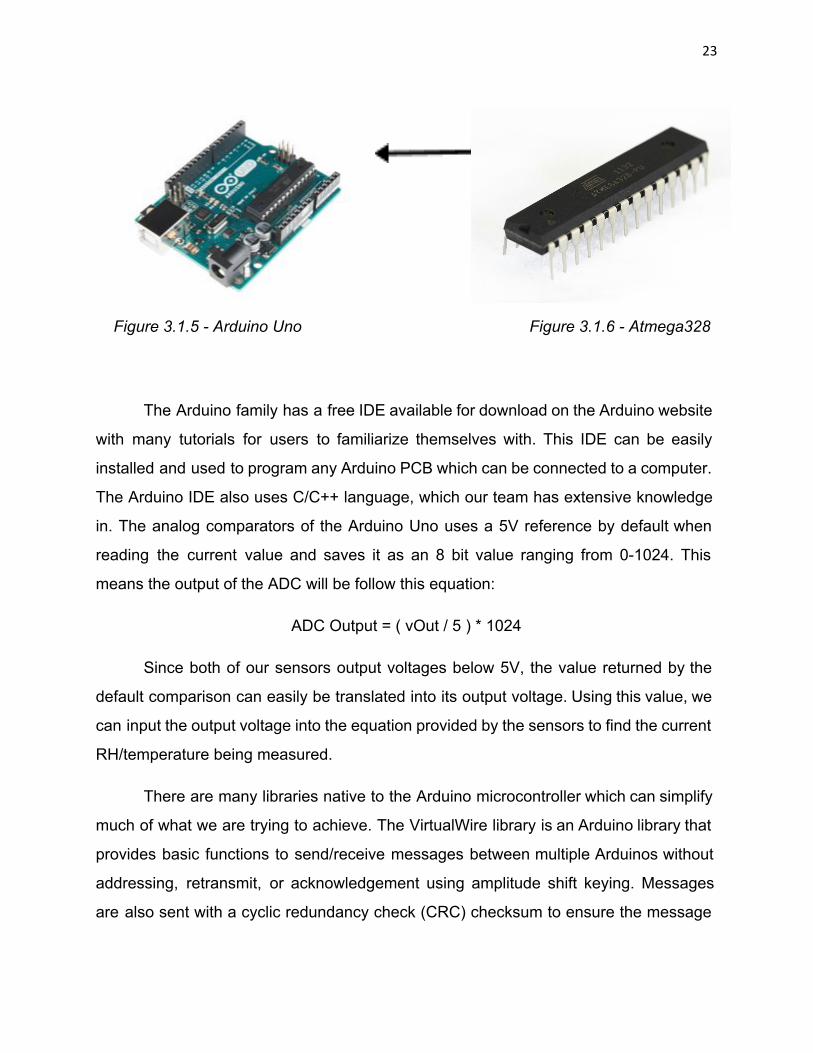
23
Figure 3.1.5 Arduino Uno Figure 3.1.6 Atmega328
The Arduino family has a free IDE available for download on the Arduino website
with many tutorials for users to familiarize themselves with. This IDE can be easily
installed and used to program any Arduino PCB which can be connected to a computer.
The Arduino IDE also uses C/C++ language, which our team has extensive knowledge
in. The analog comparators of the Arduino Uno uses a 5V reference by default when
reading the current value and saves it as an 8 bit value ranging from 01024. This
means the output of the ADC will be follow this equation:
ADC Output = ( vOut / 5 ) * 1024
Since both of our sensors output voltages below 5V, the value returned by the
default comparison can easily be translated into its output voltage. Using this value, we
can input the output voltage into the equation provided by the sensors to find the current
RH/temperature being measured.
There are many libraries native to the Arduino microcontroller which can simplify
much of what we are trying to achieve. The VirtualWire library is an Arduino library that
provides basic functions to send/receive messages between multiple Arduinos without
addressing, retransmit, or acknowledgement using amplitude shift keying. Messages
are also sent with a cyclic redundancy check (CRC) checksum to ensure the message
24
is sent correctly. Using the functions provided in the VirtualWire library, we were able to
easily implement communication between 2 Arduino Unos. We then used the serial
monitor of the Arduino IDE to monitor the value in real time and test our system. After
we ensured our system was communicating properly, we were tasked with
implementing the Atmega328 into our circuit outside of the Arduino Uno PCB.
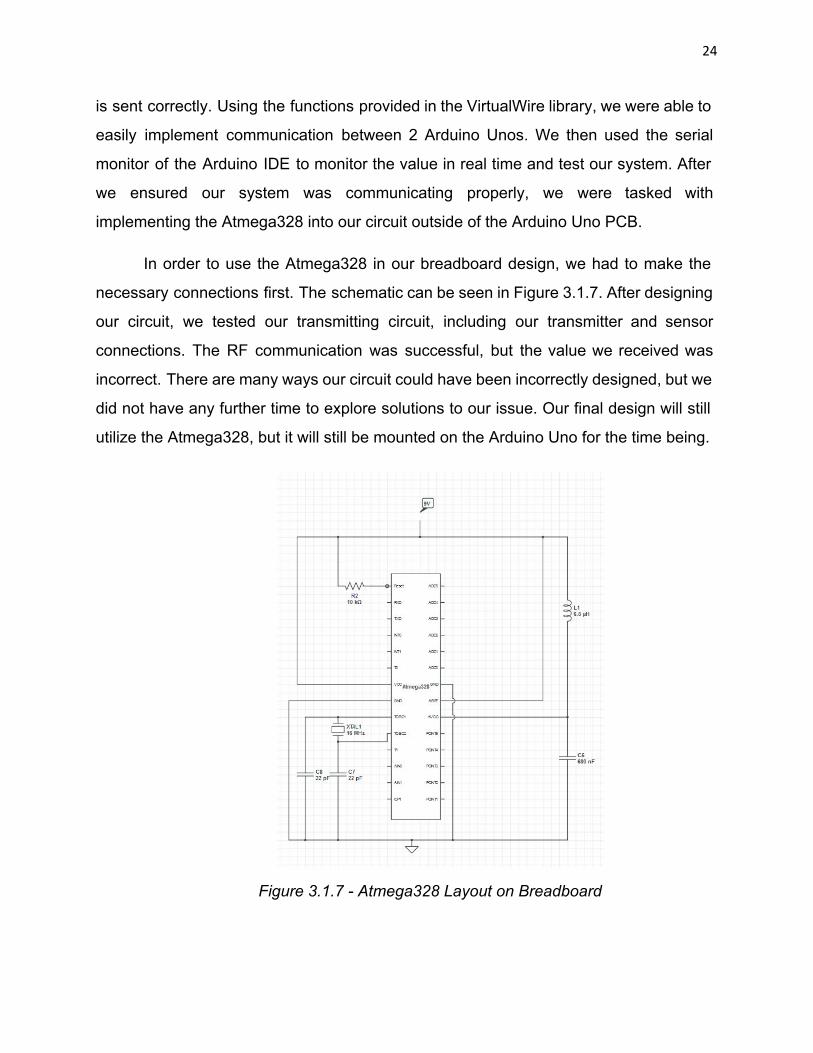
In order to use the Atmega328 in our breadboard design, we had to make the
necessary connections first. The schematic can be seen in Figure 3.1.7. After designing
our circuit, we tested our transmitting circuit, including our transmitter and sensor
connections. The RF communication was successful, but the value we received was
incorrect. There are many ways our circuit could have been incorrectly designed, but we
did not have any further time to explore solutions to our issue. Our final design will still
utilize the Atmega328, but it will still be mounted on the Arduino Uno for the time being.
Figure 3.1.7 Atmega328 Layout on Breadboard
25
3.1.4 Transmitter
Every RF (radio frequency) system includes a transmitter. This component is the
one in charge of generating and amplifying a carrier wave. The process of transmission
occurs when the electric current of the power source is converted into a radio frequency
alternating current. This energy will radiate off from an antenna as radio waves until this
signal is received by another device operating in the same frequency.RF transmitters
are often used in products such as remote control, garage doors, alarm systems or
antitheft products.
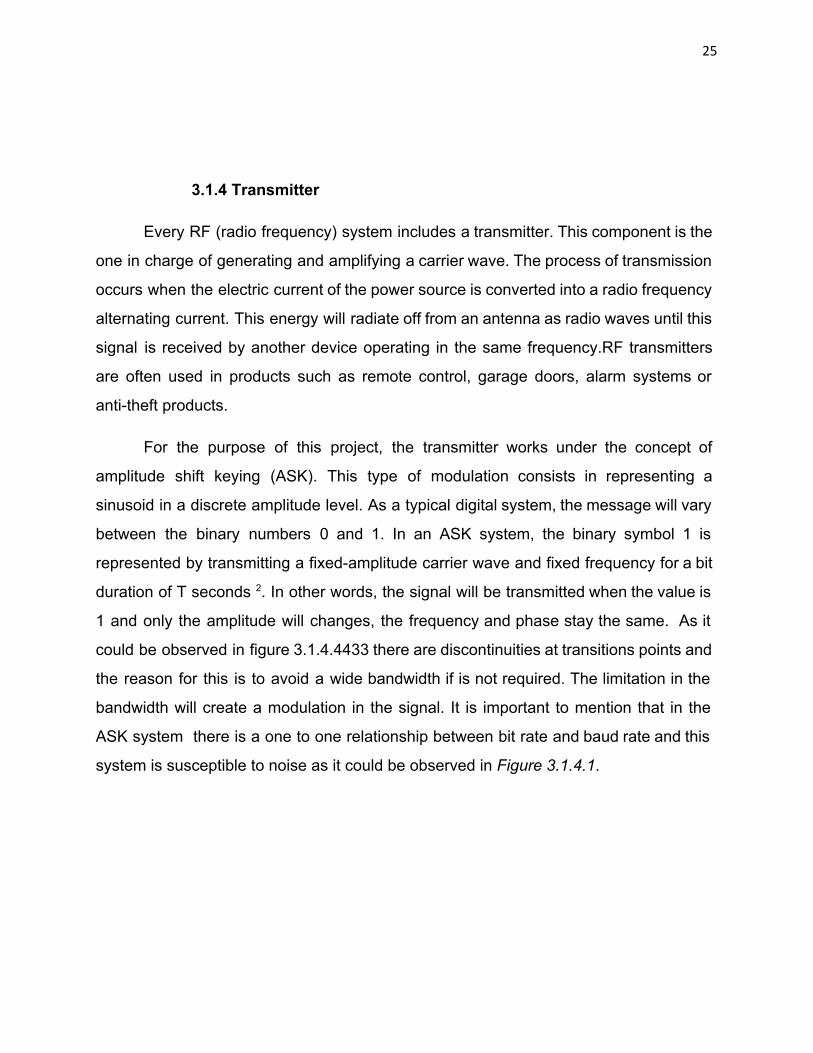
For the purpose of this project, the transmitter works under the concept of
amplitude shift keying (ASK). This type of modulation consists in representing a
sinusoid in a discrete amplitude level. As a typical digital system, the message will vary
between the binary numbers 0 and 1. In an ASK system, the binary symbol 1 is
represented by transmitting a fixedamplitude carrier wave and fixed frequency for a bit
duration of T seconds 2. In other words, the signal will be transmitted when the value is
1 and only the amplitude will changes, the frequency and phase stay the same. As it
could be observed in figure 3.1.4.4433 there are discontinuities at transitions points and
the reason for this is to avoid a wide bandwidth if is not required. The limitation in the
bandwidth will create a modulation in the signal. It is important to mention that in the
ASK system there is a one to one relationship between bit rate and baud rate and this
system is susceptible to noise as it could be observed in Figure 3.1.4.1.
26
Figure 3.1.4.1 Amplitude changes in ASK method.
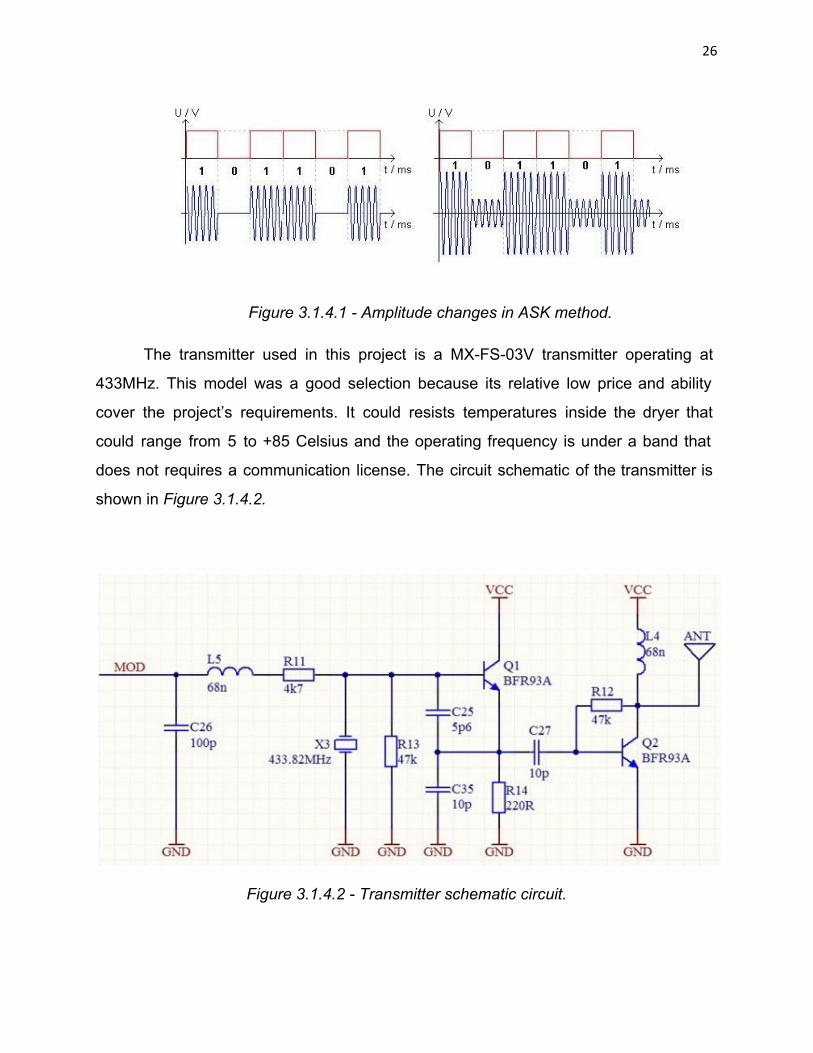
The transmitter used in this project is a MXFS03V transmitter operating at
433MHz. This model was a good selection because its relative low price and ability
cover the project’s requirements. It could resists temperatures inside the dryer that
could range from 5 to +85 Celsius and the operating frequency is under a band that
does not requires a communication license. The circuit schematic of the transmitter is
shown in Figure 3.1.4.2.
Figure 3.1.4.2 Transmitter schematic circuit.
27
The previous schematic will work under an operating voltage between 5 to 12
Volts, 35 mA and output power between 4 to 12 dBm. The transmission of data occurs
at a rate between 1Kpbs up to 10 Kbps. Although the range is not a main concern for
this project, this model could transmit up to 90m in open area so the signal inside the
dryer is guaranteed.
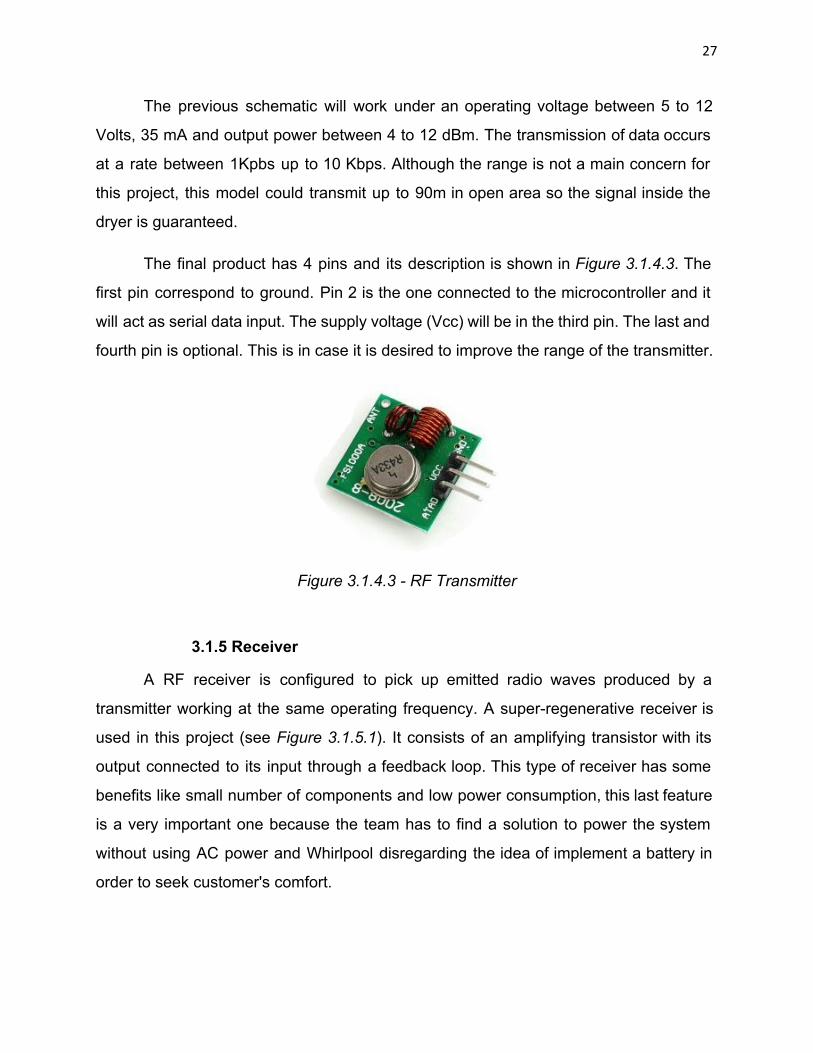
The final product has 4 pins and its description is shown in Figure 3.1.4.3. The
first pin correspond to ground. Pin 2 is the one connected to the microcontroller and it
will act as serial data input. The supply voltage (Vcc) will be in the third pin. The last and
fourth pin is optional. This is in case it is desired to improve the range of the transmitter.
Figure 3.1.4.3 RF Transmitter
3.1.5 Receiver
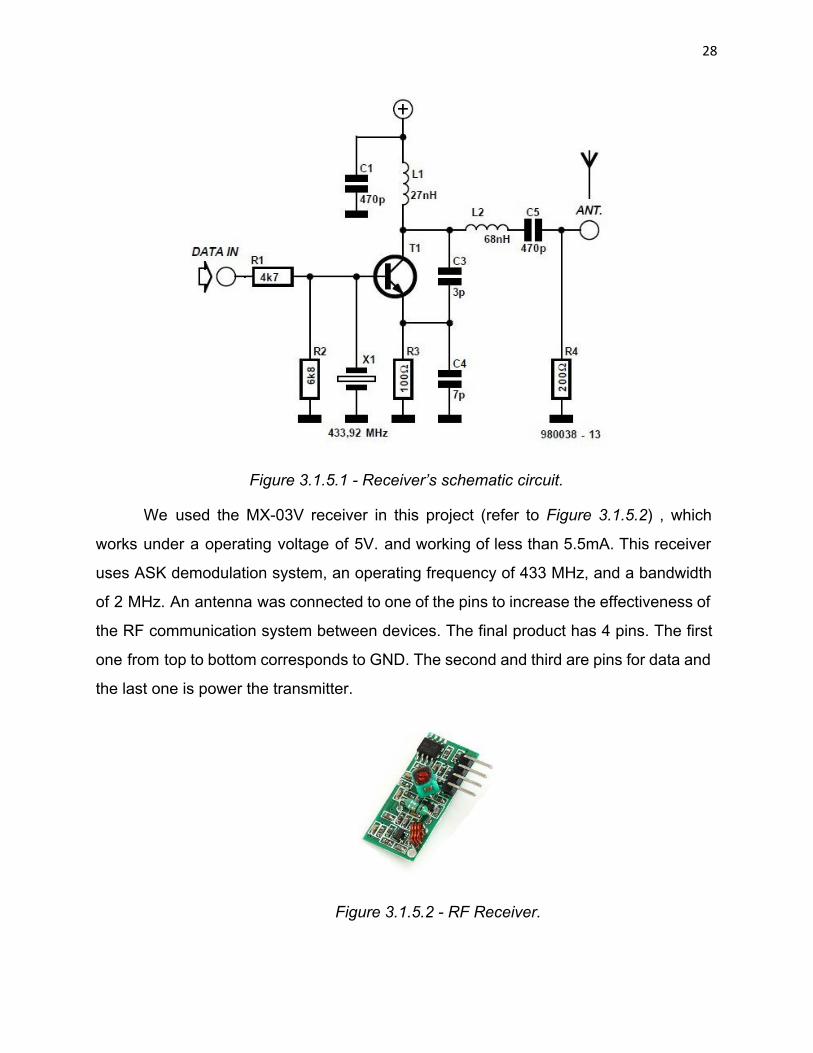
A RF receiver is configured to pick up emitted radio waves produced by a
transmitter working at the same operating frequency. A superregenerative receiver is
used in this project (see Figure 3.1.5.1). It consists of an amplifying transistor with its
output connected to its input through a feedback loop. This type of receiver has some
benefits like small number of components and low power consumption, this last feature
is a very important one because the team has to find a solution to power the system
without using AC power and Whirlpool disregarding the idea of implement a battery in
order to seek customer's comfort.
28
Figure 3.1.5.1 Receiver’s schematic circuit.
We used the MX03V receiver in this project (refer to Figure 3.1.5.2) , which
works under a operating voltage of 5V. and working of less than 5.5mA. This receiver
uses ASK demodulation system, an operating frequency of 433 MHz, and a bandwidth
of 2 MHz. An antenna was connected to one of the pins to increase the effectiveness of
the RF communication system between devices. The final product has 4 pins. The first
one from top to bottom corresponds to GND. The second and third are pins for data and
the last one is power the transmitter.
Figure 3.1.5.2 RF Receiver.
29
3.1.6 Antenna
An antenna is defined as a device used to transform an RF signal into an
electromagnetic wave in free space and to transform an RF electromagnetic wave into
an electrical signal. In order to extend the range of the communication between the
sensors circuit and the ACU, Team 10 used a helical quarter wave antenna
constructed from copper. The design of the antenna it is very important because
different types provide different parameters such like gain, radiation pattern and
bandwidth.The helix antenna was the perfect team for the design because it will provide
a reasonable range but without compromising the space inside the baffle.
A helix antenna consists in a specific number of turn and specific length
according to the desired wavelength. The team used a 31.75 mm radius with 5 turns coil
shaped. The length of our antenna was calculated to be 16.4 cm and it will operate at
433MHz. Without adding this component to the circuit, the communication between
devices was found to be around 25 cm, after the antenna the communication part was
tested to be able to work up to more than 7 meters. The antenna was located as far
away possible from shielded areas, high voltages or any other component that could my
created interference with our design.
3.2 Power Generation Process
3.2.1 Faraday Flashlight
Eventually the team decided that using batteries to power the sensor module was
not practical in terms of longevity and appeal. A more sustainable way to power the
sensors had to be developed...and the initial idea was to use induction. By utilizing the
dryer drum’s rotational motion, the team was hoping to implement an induction device
inside the drum to power the sensors. This idea was derived from the concept of a
faraday flashlight. Which is a type of flashlight which is powered by kinetic motion
30
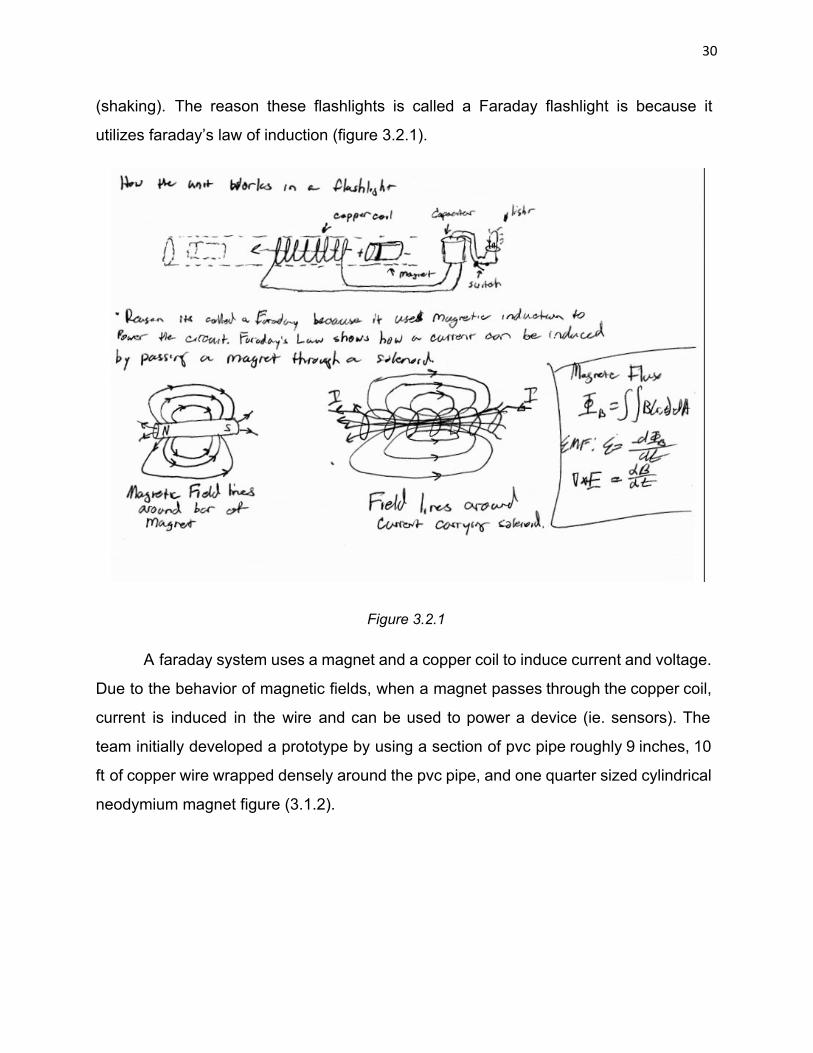
(shaking). The reason these flashlights is called a Faraday flashlight is because it
utilizes faraday’s law of induction (figure 3.2.1).
Figure 3.2.1
A faraday system uses a magnet and a copper coil to induce current and voltage.
Due to the behavior of magnetic fields, when a magnet passes through the copper coil,
current is induced in the wire and can be used to power a device (ie. sensors). The
team initially developed a prototype by using a section of pvc pipe roughly 9 inches, 10
ft of copper wire wrapped densely around the pvc pipe, and one quarter sized cylindrical
neodymium magnet figure (3.1.2).
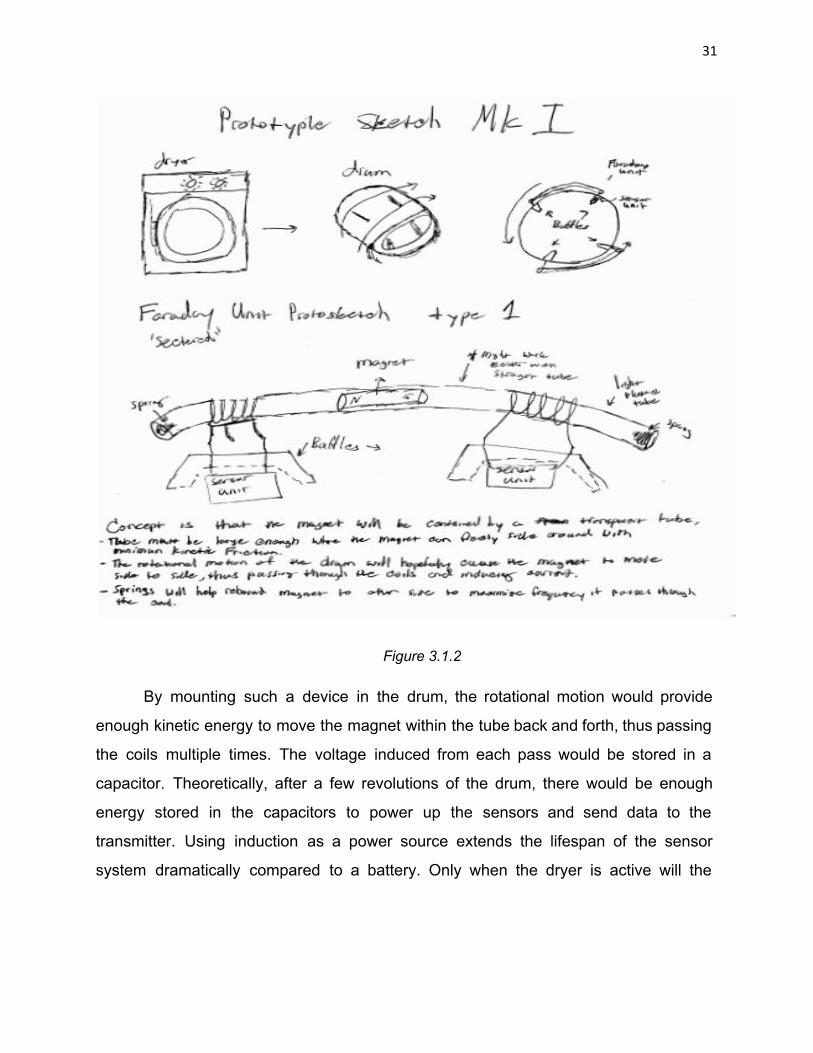
31
Figure 3.1.2
By mounting such a device in the drum, the rotational motion would provide
enough kinetic energy to move the magnet within the tube back and forth, thus passing
the coils multiple times. The voltage induced from each pass would be stored in a
capacitor. Theoretically, after a few revolutions of the drum, there would be enough
energy stored in the capacitors to power up the sensors and send data to the
transmitter. Using induction as a power source extends the lifespan of the sensor
system dramatically compared to a battery. Only when the dryer is active will the
32
sensors be on and drawing power, thus preventing any excessive fatigue on the
electrical components.
However the induction system did have It’s drawbacks when trying to implement
it into the dryer. First, since neodymium magnets are very strong, it will catch any
ferrous material within about 5 inches of it...including the drum. This became a major
problem as when the magnet came closest to the drum during its oscillation to the tube,
the magnet would get caught in that position, thus restricting it from freely moving
through the tube and passing through the coils. Initially the team suggested to created a
buffer to increase the distance between the drum and the magnet to minimize any
attraction between the two, however doing that made the device much more bulky and
may reduce effectiveness of tumbling clothes in the dryer. Another problem was that
since the prototype was composed of the cheapest materials the team could find,
quality of the parts were lacking, and only a small amount of voltage was induced per
pass between the magnet and coil, not enough to power the sensors. This could have
been solved by using high quality magnetic wire, and a larger and stronger magnetic
wire. Unfortunately the level of quality of those components was extremely expensive
and impractical for the team’s design budget goal. This required us to once again
rethink our strategy on how we would accomplish this task.
3.2.2 Power Generator
The group explored the option of using a motor working as a generator. For the
purpose of this project, a 12 V DC 600 rpm motor was used in order to power the
sensing device. Our decision of using this type of motor was based on the rpm of a
typical size dryer (around 4.3 cu ft). An average dryer will produce 60 rpm but this
amount will vary according to its drum’s diameter, so if the motor is connected to a
rubber wheel then the rotation across the motor will increase up to 10 times the dryer’s
rotation, in addition a gear box was installed with an appropriate gear ratio to help
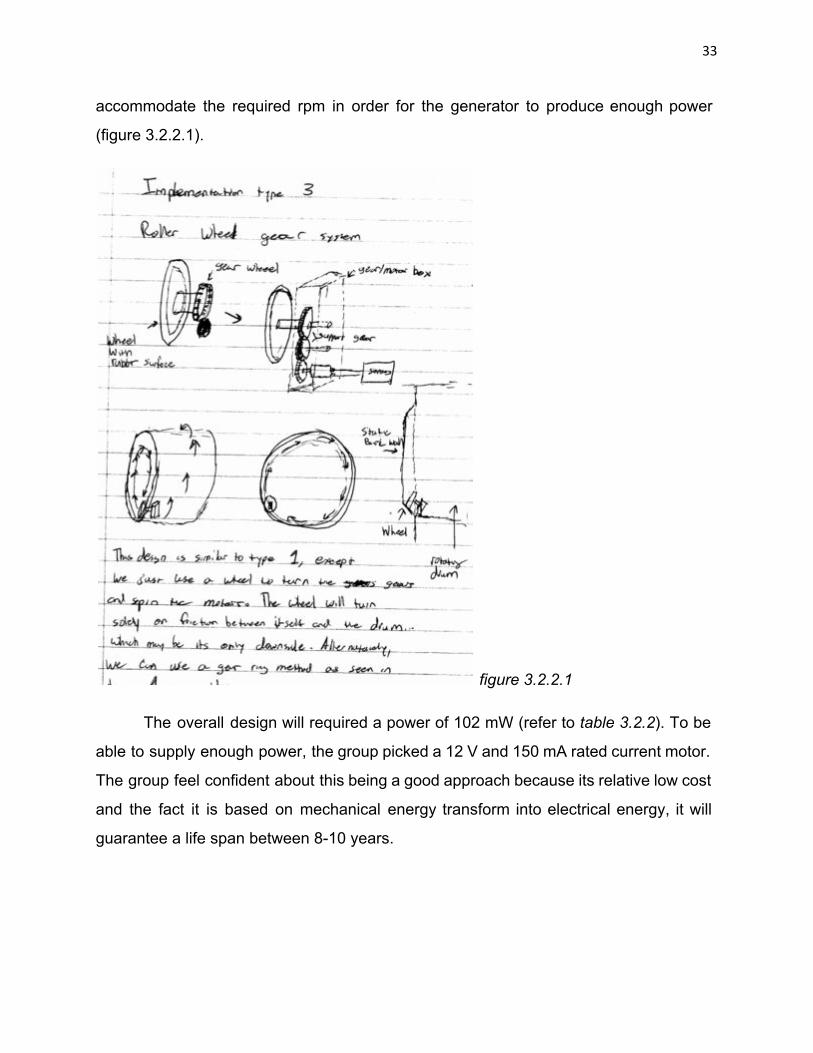
33
accommodate the required rpm in order for the generator to produce enough power
(figure 3.2.2.1).
figure 3.2.2.1
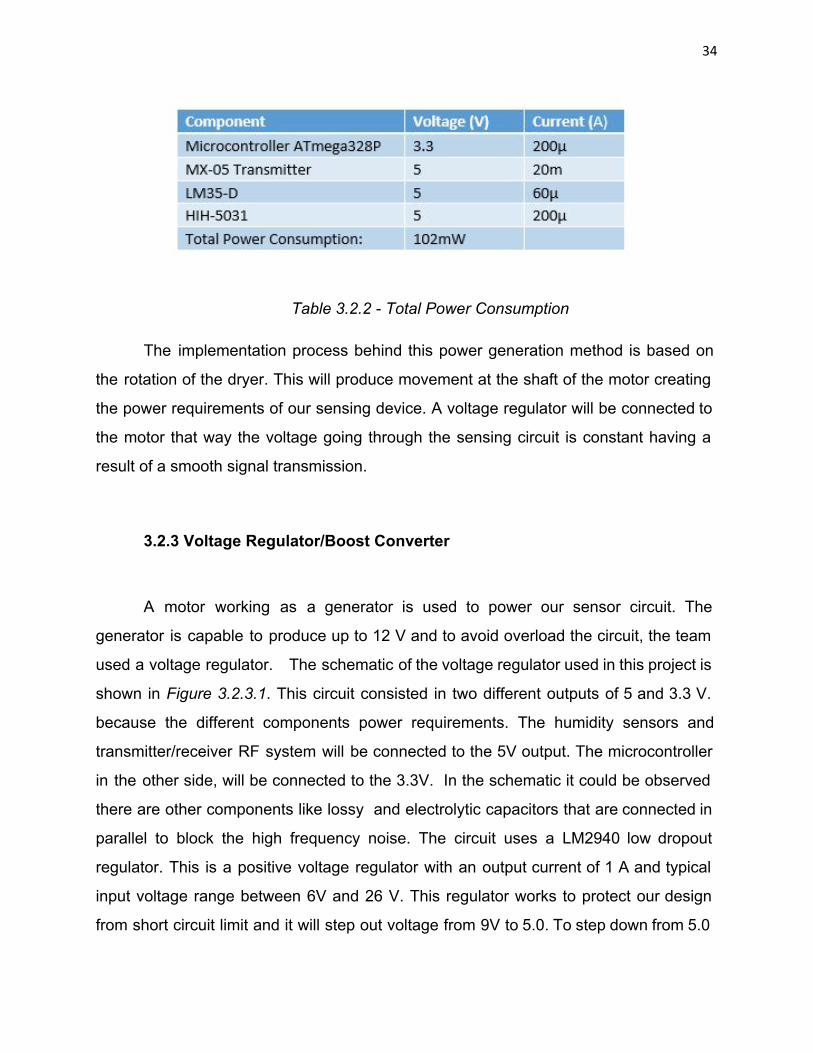
The overall design will required a power of 102 mW (refer to table 3.2.2). To be
able to supply enough power, the group picked a 12 V and 150 mA rated current motor.
The group feel confident about this being a good approach because its relative low cost
and the fact it is based on mechanical energy transform into electrical energy, it will
guarantee a life span between 810 years.
34
Table 3.2.2 Total Power Consumption
The implementation process behind this power generation method is based on
the rotation of the dryer. This will produce movement at the shaft of the motor creating
the power requirements of our sensing device. A voltage regulator will be connected to
the motor that way the voltage going through the sensing circuit is constant having a
result of a smooth signal transmission.
3.2.3 Voltage Regulator/Boost Converter
A motor working as a generator is used to power our sensor circuit. The
generator is capable to produce up to 12 V and to avoid overload the circuit, the team
used a voltage regulator. The schematic of the voltage regulator used in this project is
shown in Figure 3.2.3.1. This circuit consisted in two different outputs of 5 and 3.3 V.
because the different components power requirements. The humidity sensors and
transmitter/receiver RF system will be connected to the 5V output. The microcontroller
in the other side, will be connected to the 3.3V. In the schematic it could be observed
there are other components like lossy and electrolytic capacitors that are connected in
parallel to block the high frequency noise. The circuit uses a LM2940 low dropout
regulator. This is a positive voltage regulator with an output current of 1 A and typical
input voltage range between 6V and 26 V. This regulator works to protect our design
from short circuit limit and it will step out voltage from 9V to 5.0. To step down from 5.0
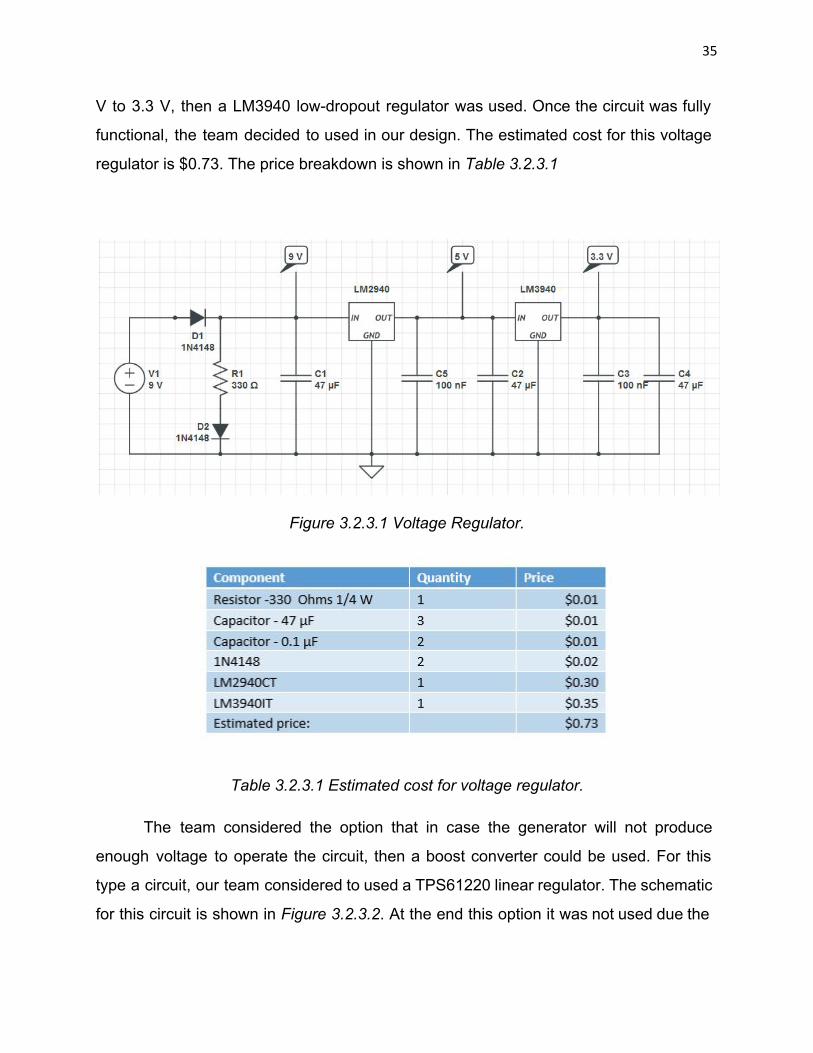
35
V to 3.3 V, then a LM3940 lowdropout regulator was used. Once the circuit was fully
functional, the team decided to used in our design. The estimated cost for this voltage
regulator is $0.73. The price breakdown is shown in Table 3.2.3.1
Figure 3.2.3.1 Voltage Regulator.
Table 3.2.3.1 Estimated cost for voltage regulator.
The team considered the option that in case the generator will not produce
enough voltage to operate the circuit, then a boost converter could be used. For this
type a circuit, our team considered to used a TPS61220 linear regulator. The schematic
for this circuit is shown in Figure 3.2.3.2. At the end this option it was not used due the
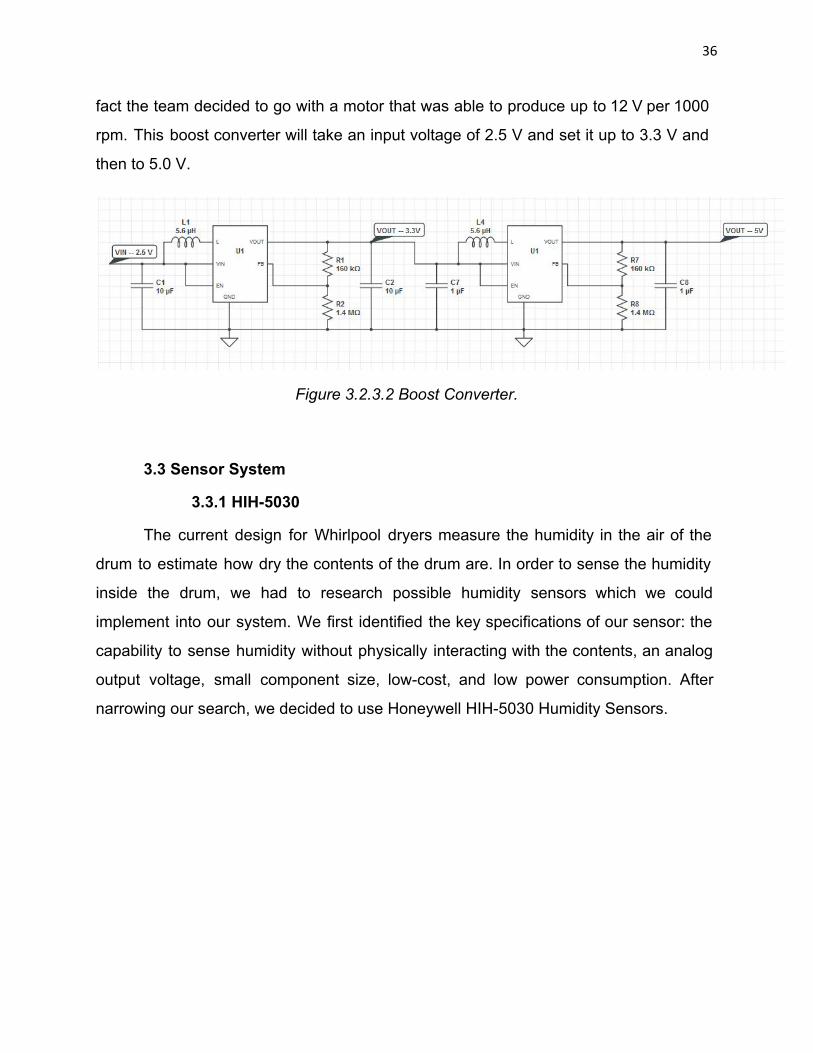
36
fact the team decided to go with a motor that was able to produce up to 12 V per 1000
rpm. This boost converter will take an input voltage of 2.5 V and set it up to 3.3 V and
then to 5.0 V.
Figure 3.2.3.2 Boost Converter.
3.3 Sensor System
3.3.1 HIH5030
The current design for Whirlpool dryers measure the humidity in the air of the
drum to estimate how dry the contents of the drum are. In order to sense the humidity
inside the drum, we had to research possible humidity sensors which we could
implement into our system. We first identified the key specifications of our sensor: the
capability to sense humidity without physically interacting with the contents, an analog
output voltage, small component size, lowcost, and low power consumption. After
narrowing our search, we decided to use Honeywell HIH5030 Humidity Sensors.
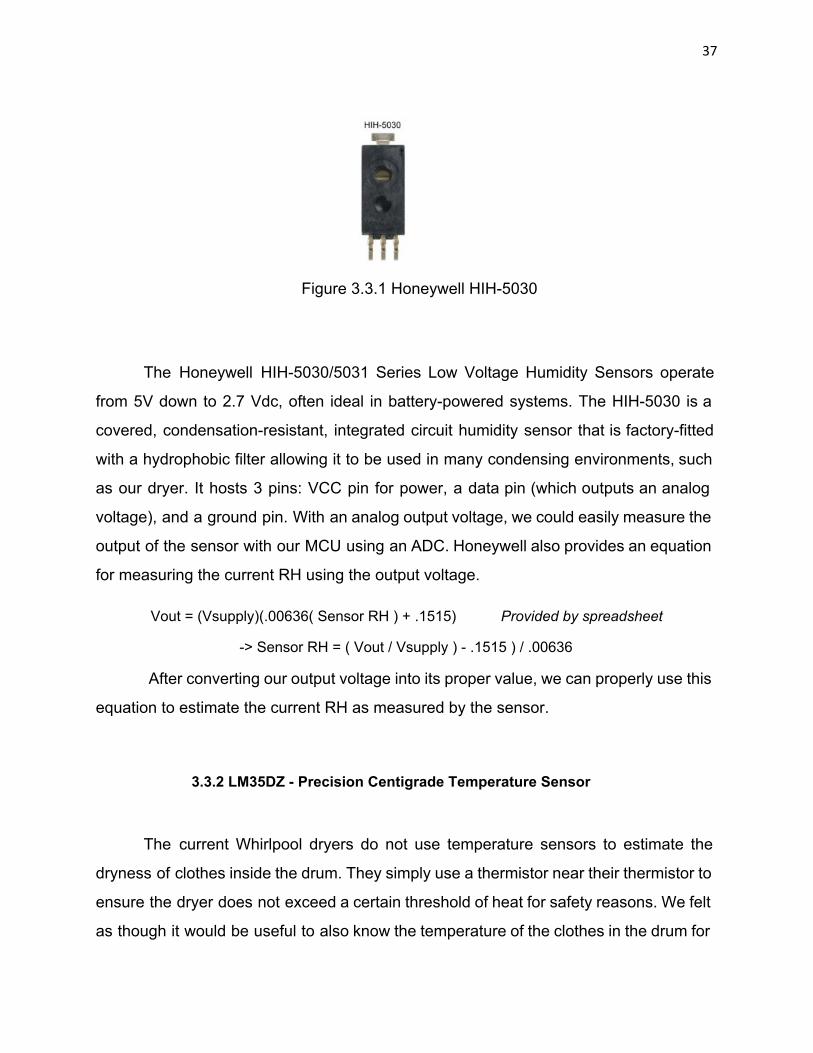
37
Figure 3.3.1 Honeywell HIH5030
The Honeywell HIH5030/5031 Series Low Voltage Humidity Sensors operate
from 5V down to 2.7 Vdc, often ideal in batterypowered systems. The HIH5030 is a
covered, condensationresistant, integrated circuit humidity sensor that is factoryfitted
with a hydrophobic filter allowing it to be used in many condensing environments, such
as our dryer. It hosts 3 pins: VCC pin for power, a data pin (which outputs an analog
voltage), and a ground pin. With an analog output voltage, we could easily measure the
output of the sensor with our MCU using an ADC. Honeywell also provides an equation
for measuring the current RH using the output voltage.
Vout = (Vsupply)(.00636( Sensor RH ) + .1515) Provided by spreadsheet
> Sensor RH = ( Vout / Vsupply ) .1515 ) / .00636
After converting our output voltage into its proper value, we can properly use this
equation to estimate the current RH as measured by the sensor.
3.3.2 LM35DZ Precision Centigrade Temperature Sensor
The current Whirlpool dryers do not use temperature sensors to estimate the
dryness of clothes inside the drum. They simply use a thermistor near their thermistor to
ensure the dryer does not exceed a certain threshold of heat for safety reasons. We felt
as though it would be useful to also know the temperature of the clothes in the drum for
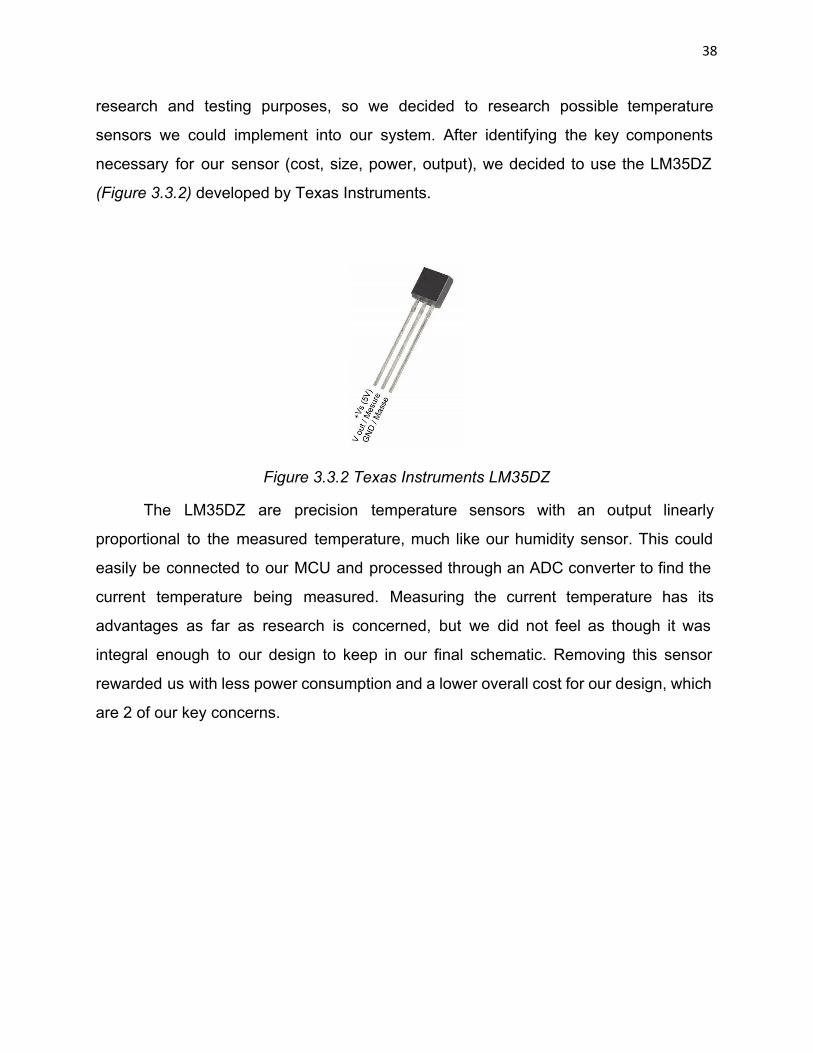
38
research and testing purposes, so we decided to research possible temperature
sensors we could implement into our system. After identifying the key components
necessary for our sensor (cost, size, power, output), we decided to use the LM35DZ
(Figure 3.3.2) developed by Texas Instruments.
Figure 3.3.2 Texas Instruments LM35DZ
The LM35DZ are precision temperature sensors with an output linearly
proportional to the measured temperature, much like our humidity sensor. This could
easily be connected to our MCU and processed through an ADC converter to find the
current temperature being measured. Measuring the current temperature has its
advantages as far as research is concerned, but we did not feel as though it was
integral enough to our design to keep in our final schematic. Removing this sensor
rewarded us with less power consumption and a lower overall cost for our design, which
are 2 of our key concerns.
39
Chapter 4. Data Testings
4.1 Implementation of Devices
Once the sensors were operational and connected to the transmitter unit, it was
time to install the sensor and power system inside the dryer for final testing. The first
step in the implementation phase was to develop some sort of housing for the sensor
and power supply so that they would be immune to any heat and moisture that drier
conditions would produce. At the same time, the housing had to offer a way for the
sensors to detect temperature and humidity accurately as well as allowing radio
transmission to pass through. Initially the team wanted to fit the sensors and transmitter
inside one of the polymer baffles inside the dryer. The biggest obstacle with this idea is
that the baffles had very limited space and would be difficult fitting the bulky circuitry
inside. Next was to cut out openings on the baffles where the sensors would be
exposed to environment inside the dryer. Careful measurements had to be taken when
making the cuts to ensure that the sensors would fit tight enough so that no moisture
could leak into the housing and damage the circuit. Caulk was applied around the cut to
further insulate the circuit housing.
The generator unit was a bit more trickier to fit within the dryer because of its
orientation and size. Since the generator had a wheel that had to ride up against static
areas inside the drum placement was very limited and had to be precise. After further
examination, the best place to mount the generator unit was on the lip of the drum
housing on the front of the dryer. A mount had to be made that would give the correct
height for the wheel of the generator to make contact with the lip at all times when
spinning. The voltage regulator would also have to be hooked up with the generator so
the team found a medium sized metal box to use as the mount and housing. Generator
would be mounted outside of the box and the wires would run from the motor to the
inside of the box through a small cut to feed the voltage regulator. Once the generator
box was mounted properly, insulated wires would ran from the voltage regulator inside
the box to the sensor unit inside the baffle located directly behind it.
40
Finally The dryer was hooked up and the team ran the entire system. Once the
dryer cycle was started and the drum started spinning, the generator did infact was able
to produce power from the drum’s rotation to feed the sensor unit.
4.2 Communication Testings
In our final design, we used the Atmega328 as our MCU to control the flow of our
transmitter circuit. We initially programmed the Atmega328 using the Arduino IDE while
it was mounted on an Arduino Uno and removed it to be used in our circuit. Our receiver
was also designed using an Arduino Uno, but our sponsors were more concerned with
the transmitter. In their final production, they would be providing their own MCU with a
receiver for a control unit that would interface with the current transmitter that we were
creating.
Our transmitter/receiver program uses the VirtualWire library for access functions
which greatly simplify RF communication using Arduino PCB. The VirtualWire library is
an Arduino library that provides basic functions to send/receive messages between
multiple Arduinos. Much like UDP in networks, the VirtualWire library can send
messages without addressing, retransmit, or acknowledgement by using amplitude shift
keying. Using a checksum field, the messages are checked to ensure they have been
correctly received, although at a highly simple level.
Our transmitter code begins by initializing the ports to receive the transmitter data
as well as initializing an I/O port connected to an LED (initially connected to an LED on
the Arduino Uno) . We then begin our loop which controls our RF transmission and
ADC. First, we process the current value of our sensor output through the ADC. We
then convert the data to a character string which we can transmit properly through the
transmitter. Once this signal was sent, we modulated our LED to visually show that a
signal was sent by the circuit. This process continuously loops until the circuit eventually
loses power after the cycle has finished.
41
The receiver code follows a similar process as the transmitter. We first initialize
the receiver pin and the serial monitor, which we can use to output information to an
external window. Our main code, implemented in a loop, first reads the output of the
ADC being received by the receiver. This value is then processed through an equation
which can estimate the current RH being measured.
We initially tested the RF communication by placing the circuits next to each
other on a table. After verifying our circuits were functioning properly, we placed the
transmitting circuit inside the drum to ensure the signal could be received through the
metal of the drum. We mounted our receiver circuit in the same location as the control
unit of the dryer, which is where Whirlpool would implement their own receiver if this
were to be put into production. Our tests showed that we were properly receiving a
signal through the drum without any interference. On our trip to the Whirlpool
headquarters, located in Benton Harbor, MI, we were also able to test our transmitting
circuit inside of other dryers made up of different materials as well as a Thermotron, all
without any interference.
4.3 Sensor Testings
The team visited the Whirlpool global headquarters located in Benton Harbor, MI
on December 4th. After we updated our sponsors on our progress thus far in the
project, we received a tour of their facilities. While on our tour, we were able to test our
design in a Thermotron, which can simulate certain temperatures and humidities inside
of a machine. We placed our transmitter inside the Thermotron and tested our system
by monitoring the receiver outside of the Thermotron. The signal was successfully
received outside of the Thermotron and stayed constant with no errors.At this point,
however, our design simply took the analog output and compared it to its maximum
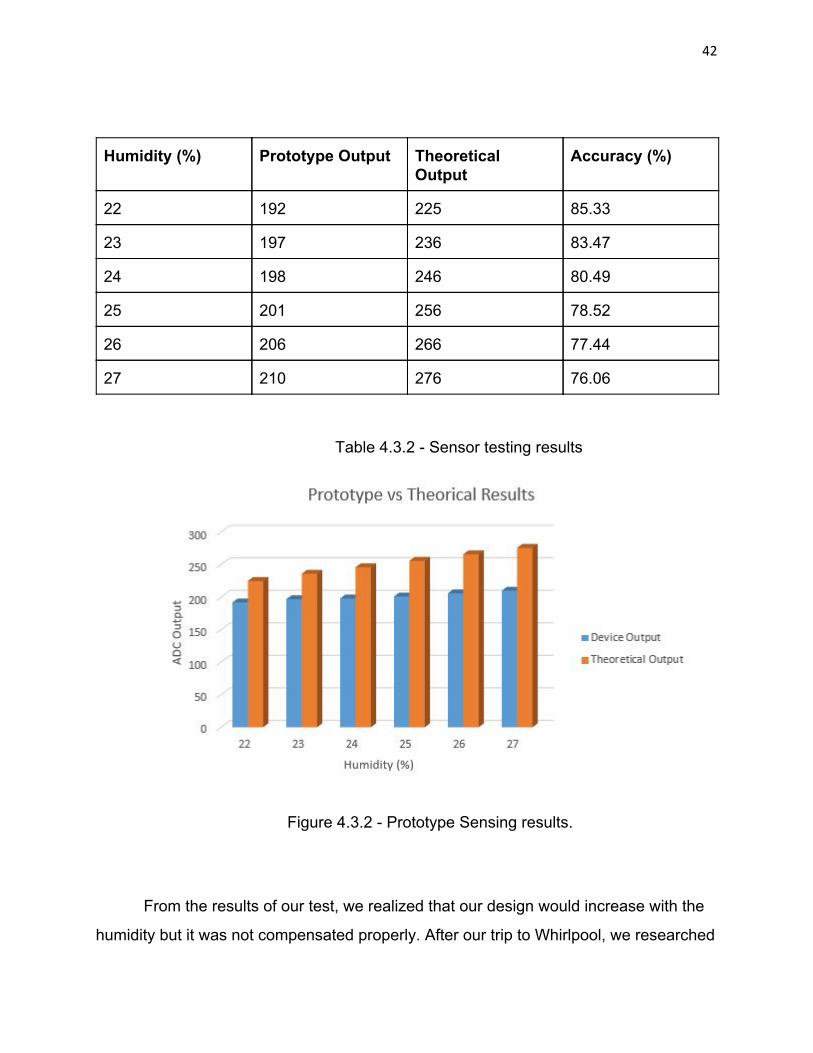
output of 3.3V to estimate the humidity. Our results can be seen in figure 4.3.2 and table
4.3.2.
42
Humidity (%) Prototype Output Theoretical Output
Accuracy (%)
22 192 225 85.33
23 197 236 83.47
24 198 246 80.49
25 201 256 78.52
26 206 266 77.44
27 210 276 76.06
Table 4.3.2 Sensor testing results
Figure 4.3.2 Prototype Sensing results.
From the results of our test, we realized that our design would increase with the
humidity but it was not compensated properly. After our trip to Whirlpool, we researched
43
our sensor and found an equation provided on the datasheet which we could use to
properly identify the current humidity.
Vout = (Vsupply)(.00636( Sensor RH ) + .1515) Provided by datasheet
> Sensor RH = ( Vout / Vsupply ) .1515 ) / .00636
After properly adjusting our programming code, it was decided to test one more
time the functionality of our circuit design . The group didn’t have the luxury of using a
Thermotron to test our system so this time a humidity sensor by Acurite Company was
placed inside the Senior Design lab to compared our outputs, the results are shown in
table 4.3.3
Humidity (%) DT10 Sensor (%) Acurite Sensor Model(5)
29 226 28.76 29%
31 238 31.55 31% Table 4.3.3 Results measured inside 480 Senior Design Lab.
4.4 Power Testings
The power generation was one the most difficult task in this project. The group
tried two different power generation methods (Piezoelectric sensor transducer and
Faraday’s Induction method) before decided that for our final design, the most suitable
solution could be a motor working as a generator.
A piezoelectric vibration sensor (see Figure 4.4.1) was tested inside the dryer.
The idea was that the rotation of the dryer will create enough vibrations in order the
sensor could transduce the input and produce certain amount of power. This sensor by
Measurement Specialities could create up to +/ 90V when it under constant flexibility,
touch or vibration. Some of the features of this film include a higher voltage output and a
great flexibility what will guarantee a lifespan of 23 after being under constant
vibration. At the beginning this looks like a good alternative for our power generation
problem because if the dryer is OFF, then there won’t be voltage produced. In other
44
words this means,it will contribute to avoid more complex programing coding like a
switch or active/sleep mode. With this power generation method there were two main
problems : the first one was that the transducer will not produce more than 2.5 V and
the second problem correspond to the implementation part. In order to keep a constant
voltage, a beam will be required so there will be more vibration per rotation. The group
considered the idea of a simple beam that will add mass to the film and oscillate aftering
being in contact with the drum but there was not enough space to implement this idea
outside the dryer. To solve the problem of low voltage, the group considered to use a
DCtoDC converter but this will add more components to our design and it might cause
the price per device to increase.
Figure 4.4.1 Piezo Vibration Sensor
The following generation method the group decided to explore was based on
Faraday’s Induction law. The group used the example of how flashlights are able to light
a bulb. Flashlights produces a certain amount of power when a changing magnetic field
induces an electromotive force producing an electric current. Basically, a flashlight is
coil of wire and magnet moving back and forward to induces a field. This prototype
sounds reasonable because its low cost price (it was calculated to cost around $2) and
45
very easy implementation process but there was a problem, the metallic material of the
drum will create an interference of the magnet’s movement.
Once the group decided to tested this prototype inside the drum, it was found
that when the drum/prototype were in a distance around 5 inches, the magnet will get
attached to the drum. One possible solution to fix this problem was to use a less
powerful magnet (the group was using a Neodymium magnet) but then, the prototype
will not produce the desired voltage to power the sensors and microcontroller. Because
the magnet and drum interference, the group decided to disregard the Faraday's
induction method.
Because the pugh matrix for power generation method helped the group to
brainstorm different power alternatives, the third method the group decided to use was
a motor uses a generator. As the piezoelectric sensor, the generator will avoid complex
software coding because the only way data would be transmitted is when the dryer is
under constant rotation. When this idea was discussed to our sponsor, the engineers
though this could be a good and factible approach to solve the power generation task.
The first generator the group decided to use was a 9 V DC motor. This first motor is a
high speed (19000 rpm without load) and low torque. The group opted for this option
because its relative low price (a per unit price of $4.99 and production cost of $0.78)
and small size. Unfortunately, the rotation per minute required by to run the desired
power were too high versus the rotation produced by the dryer. It is important to
mentioned that the motor was tested in different location of the dryer such as the
outside of the drum or inside the drum but using the back of dryer as the rotor or
stationary part as it is shown in Figure 4.4.2. The first solution the group decided to
apply in order to increase the rotation of the shaft was to add a gear set but even with
this implementation, the rotation of the dryer was not fast enough to produce the desired
voltage (between 6 9 V).
46
Figure 4.4.2 Generator located outside the drum
The generator method was still suitable but the group considered to explore different
kind of motors before disregard this idea. For example, the next motor the group tested
was a 12 V DC motor, 1.1W and 5400 rpm. This generator also did not produce enough
power but this time it was higher voltage (around 3V were produced with this generator).
The motor was tested outside and inside the drum and a rubber wheel was used as a
gear.
After analyzed the previous results, the next approach was to use a motor with
less rpm. The issue with a motor of this feature is that in order to compensate a slower
rpm and produced the same voltage, then usually the value of the torque will be higher
(see Figure 4.4.3). For example, the group decided to try a 12V DC geared motor, rated
current of 150mA, torque of 17 kgcm and 60 rpm. Again, this intent was not successful
because although the dryer will produce the amount of rotation required by this motor,
the force is not strong enough to produce movement at the shaft. An alternative solution
for this issue was to add a gear with a bigger diameter to overcome the torque value but
the group decided not to approach this solution because it is very important that our
47
design is as small as possible in order not create interference or add more components
to the current dryer design .
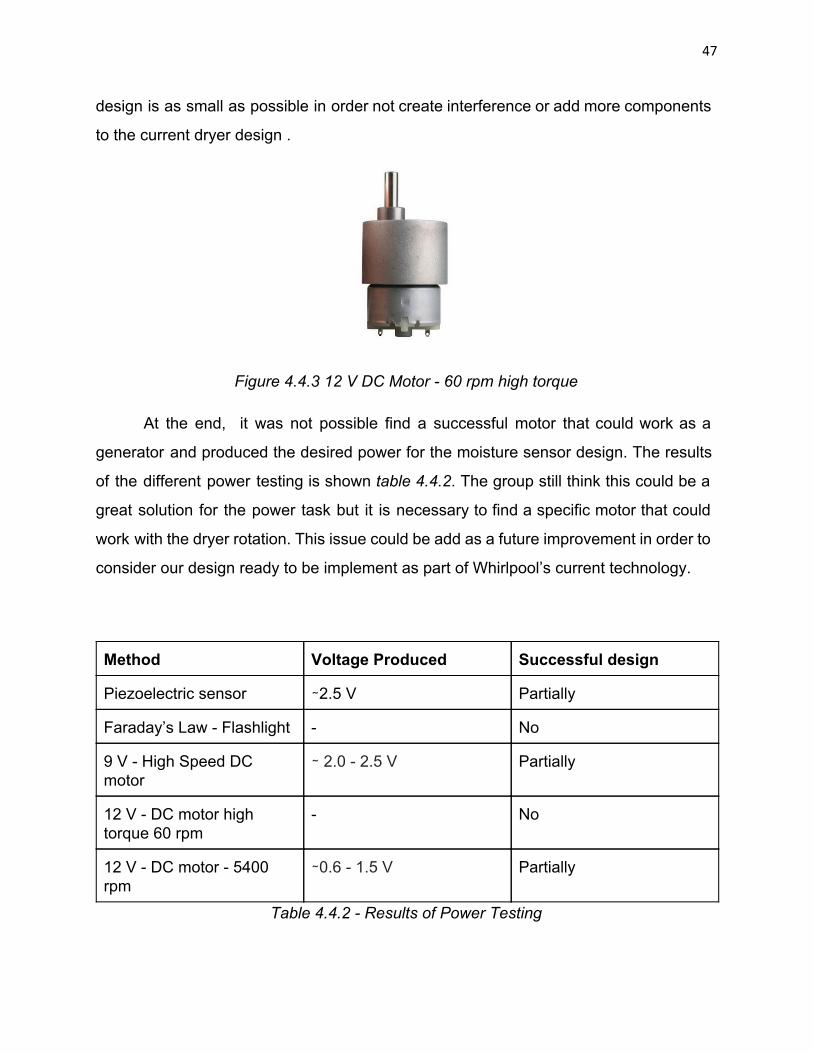
Figure 4.4.3 12 V DC Motor 60 rpm high torque
At the end, it was not possible find a successful motor that could work as a
generator and produced the desired power for the moisture sensor design. The results
of the different power testing is shown table 4.4.2. The group still think this could be a
great solution for the power task but it is necessary to find a specific motor that could
work with the dryer rotation. This issue could be add as a future improvement in order to
consider our design ready to be implement as part of Whirlpool’s current technology.
Method Voltage Produced Successful design
Piezoelectric sensor ∼2.5 V Partially
Faraday’s Law Flashlight No
9 V High Speed DC motor
∼ 2.0 2.5 V Partially
12 V DC motor high torque 60 rpm
No
12 V DC motor 5400 rpm
∼0.6 1.5 V Partially
Table 4.4.2 Results of Power Testing
48
4.5 Prototype Performance vs. Design Specifications
After extensive testing and troubleshooting, the prototype performance fell below
expectations. The main problem was that the generator unit was not providing sufficient
power from the drum spin to power the sensors and transmitter. The motor used was a
12V high rpm rotor which meant that the generator needed a much higher frequency in
order to reach it’s 12V potential. With the frequency of the drum, the motor was only
able to produce around 2 Volts which was quite a bit short from the required 9 Volts.
Other generator models were available, such as high torque low rpm generators, but
there was not nearly enough rotational energy nor friction between the generator wheel
and the drum to spin the high torque rotor. The generation idea is still valid in the
prototype, a new selection of generators and perhaps a more efficient method to spin
the rotor are the only changes to have to be made to meet design specifications and
performance.
On the other hand, the communication between the Transmitter and Receiver
was working flawlessly, which was a great news especially when operating inside a
spinning metal drum where interference was feared to be an issue. The sensors were
also functioning, by connecting the receiver module to a computer, a live feed of
temperature readings can be obtained, to test accuracy, the team used a blowdryer on
the sensors, and as predicted the readings shot up as well as dropped down when the
blow dryer was turned off.
49
Chapter 5. Design Issues
This project design is marketdriven which is to be served to the customers in the
far end and two of the main issues that are of concern to the team and Whirlpool
themselves are as follow.
5.1 Safety Issue
The team has to design the system in accordance to safety standards that
Whirlpool has. During the process of the design in this semester, the team always has
safety concerns in minds. The team bought supplies that are first handed with perfect
conditions from reliable sources. The team thinks that the current design could be safer
in integrating the design circuit in the baffle of the drum because the sensors are
exposed to the laundry load which could be an issue when the clothes’ hanging strings
were to get caught with the sensors could result in sensor damagings. The way to
improve this issue is to create new designed baffles specifically for putting this project’s
design circuit inside and protect the sensors from outer unreliable source environment.
Another issue that is related to safety is the accuracy of the sensors. The accuracy of
the sensors could be source of safety issue since the team wants to output the data as
exact as it has to be. One of the options to improve this is to obtain a higher price which
leads to a higher quality sensor.
5.2 Cost Issue
The team has come across cost issue which is to be expected as the final
product of the design cost needs to be as low as possible to be able to compete with
other competitors. This issue has become quite a large problem to the team because it
took us a long time to find the parts and components needed for the design that fit
within the price range required. This also makes the implementation harder as well due
to the low level aspect of the design, meaning that the team has to work on some
aspects of the design that more expensive parts already have ready, resulting in more
time spent with more complexity. Cost issue becomes a tradeoff between itself and
50
safety issue because some of the components are cheap because the materials and
production processes may not be as high quality as they should be.
Chapter 6. Final cost, schedule, summary and conclusions
6.1 Project Successes (includes cost, schedule)
Our project took many turns throughout the course of the semester. The majority
of our project dealt with 2 major concerns: RF communication of the transmitting system
and a power supply which could supply the transmitter over a lifespan of 5 years.
Team 10’s prototype was successfully able to measure temperature and humidity
of inside the drum and transmit the data wirelessly to the receiver module for the dryer
ACU to analyze. The entire sensor unit costs roughly $4.97 to make, and that satisfies
the five dollar budget given for the design. However to be able to transmit the data
wirelessly was one of the main design parameters requested by whirlpool. Our final
design can be seen in Figure 6.1.1
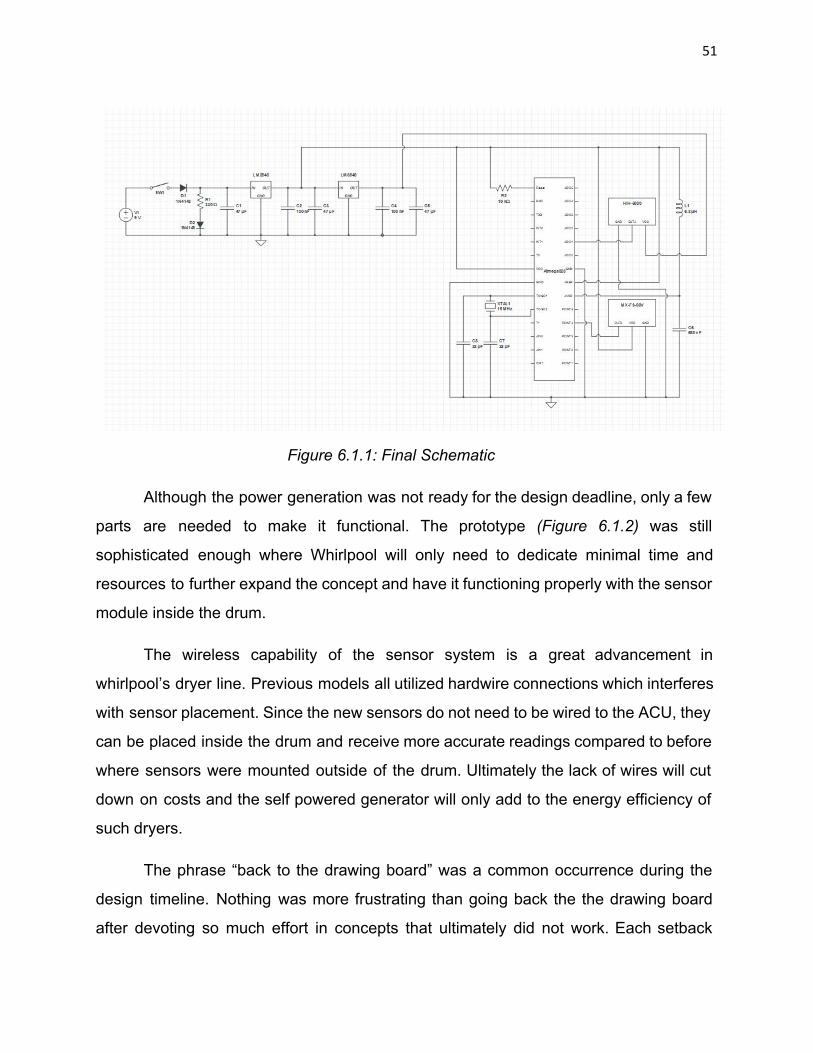
51
Figure 6.1.1: Final Schematic
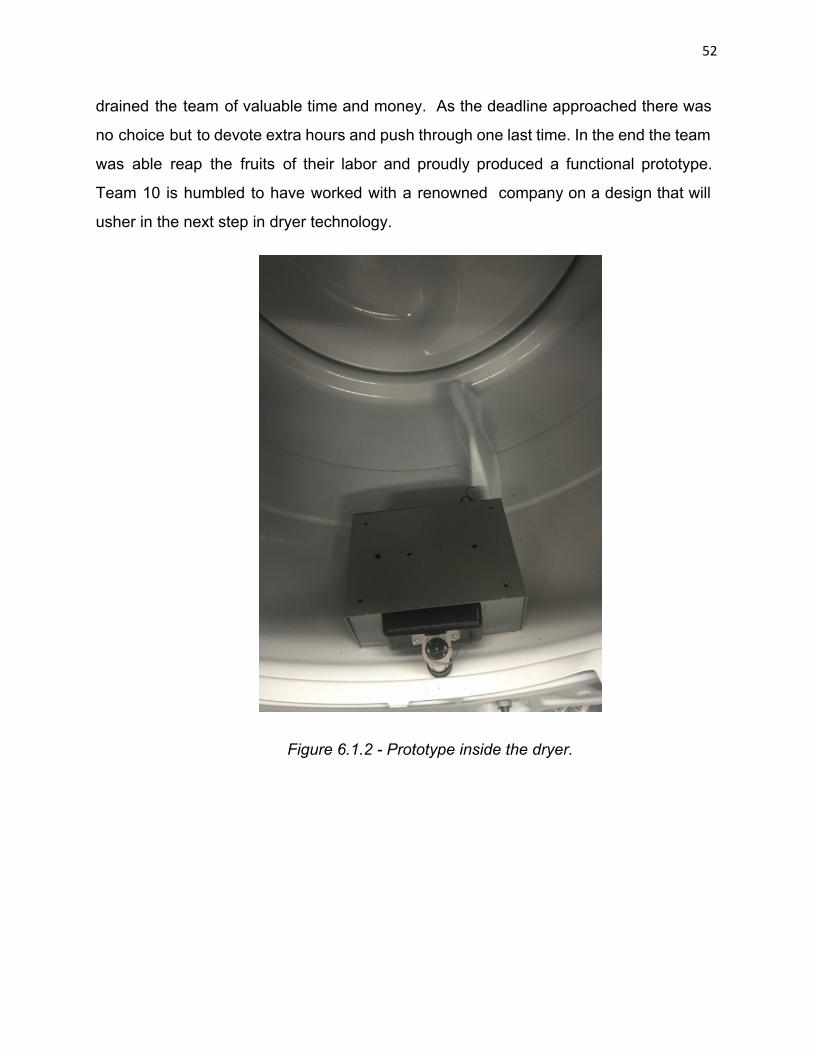
Although the power generation was not ready for the design deadline, only a few
parts are needed to make it functional. The prototype (Figure 6.1.2) was still
sophisticated enough where Whirlpool will only need to dedicate minimal time and
resources to further expand the concept and have it functioning properly with the sensor
module inside the drum.
The wireless capability of the sensor system is a great advancement in
whirlpool’s dryer line. Previous models all utilized hardwire connections which interferes
with sensor placement. Since the new sensors do not need to be wired to the ACU, they
can be placed inside the drum and receive more accurate readings compared to before
where sensors were mounted outside of the drum. Ultimately the lack of wires will cut
down on costs and the self powered generator will only add to the energy efficiency of
such dryers.
The phrase “back to the drawing board” was a common occurrence during the
design timeline. Nothing was more frustrating than going back the the drawing board
after devoting so much effort in concepts that ultimately did not work. Each setback
52
drained the team of valuable time and money. As the deadline approached there was
no choice but to devote extra hours and push through one last time. In the end the team
was able reap the fruits of their labor and proudly produced a functional prototype.
Team 10 is humbled to have worked with a renowned company on a design that will
usher in the next step in dryer technology.
Figure 6.1.2 Prototype inside the dryer.
53
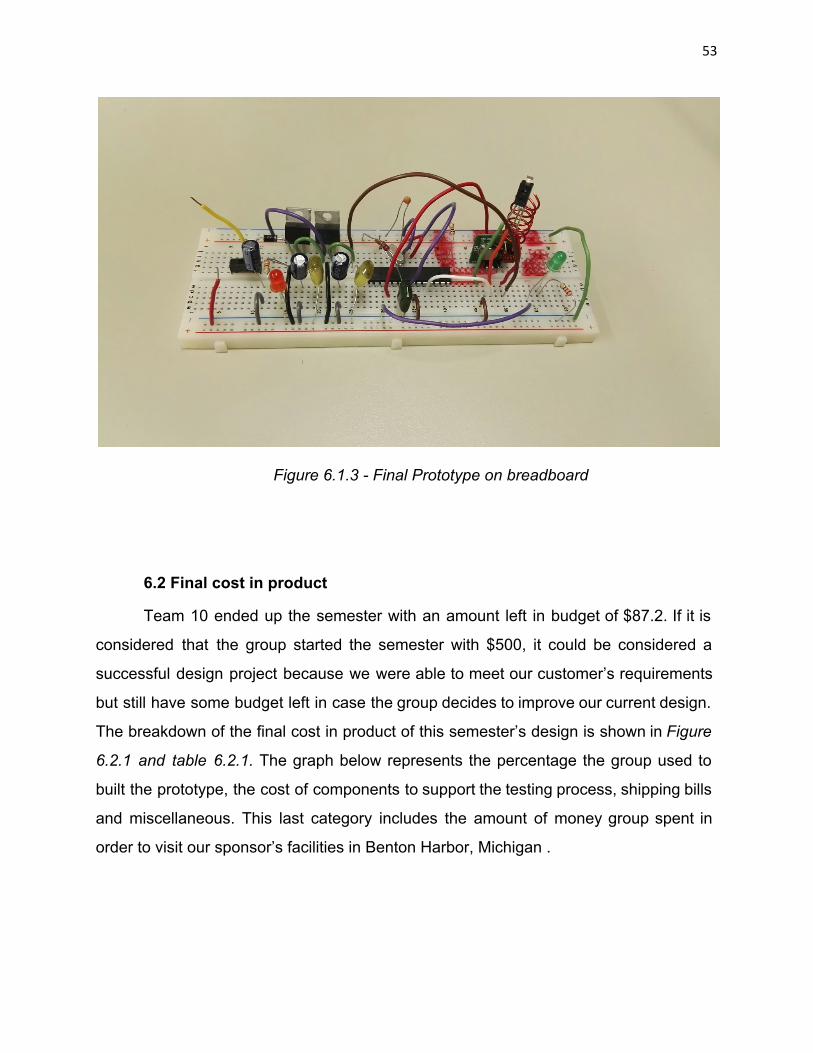
Figure 6.1.3 Final Prototype on breadboard
6.2 Final cost in product
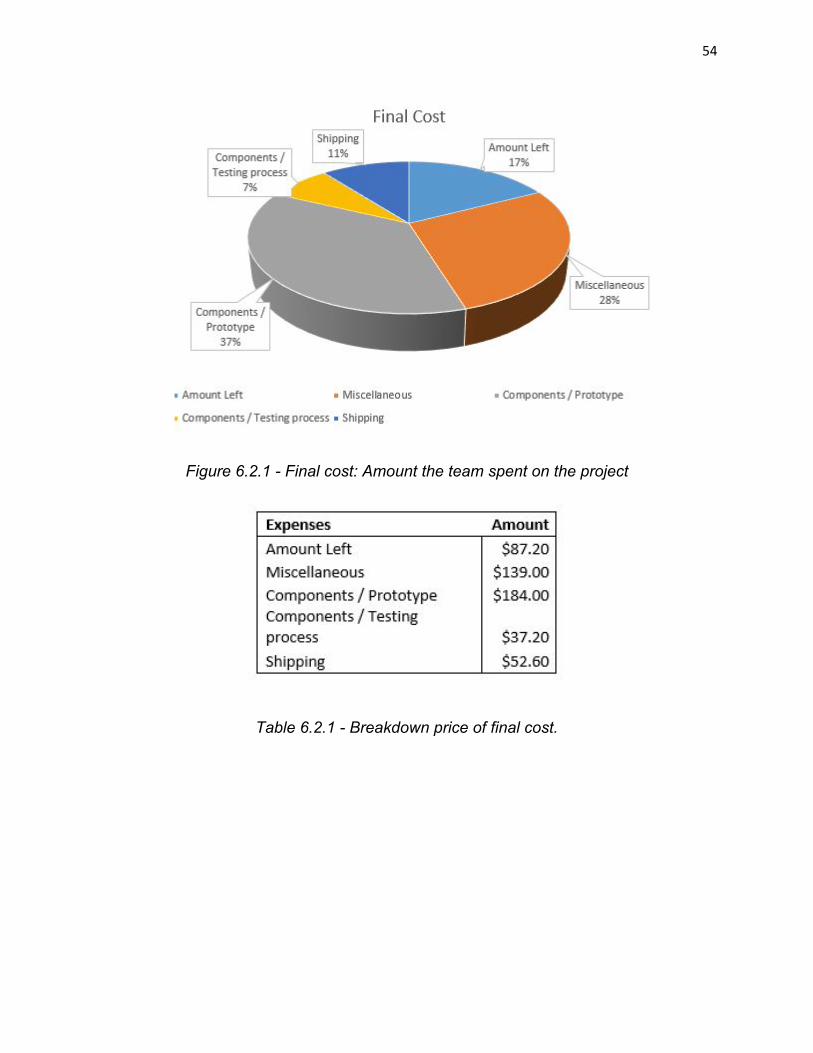
Team 10 ended up the semester with an amount left in budget of $87.2. If it is
considered that the group started the semester with $500, it could be considered a
successful design project because we were able to meet our customer’s requirements
but still have some budget left in case the group decides to improve our current design.
The breakdown of the final cost in product of this semester’s design is shown inFigure
6.2.1 and table 6.2.1. The graph below represents the percentage the group used to
built the prototype, the cost of components to support the testing process, shipping bills
and miscellaneous. This last category includes the amount of money group spent in
order to visit our sponsor’s facilities in Benton Harbor, Michigan .
54
Figure 6.2.1 Final cost: Amount the team spent on the project
Table 6.2.1 Breakdown price of final cost.
55
6.3 Further Possible Improvements
There were multiple ways our team could have improved the communication of
our design to be much more efficient. We initially planned to implement more than one
transmitter into our system since there are multiple baffles inside of the drum. If we
could have produced a program which could interface multiple transmitters into a single
receiver, we could have more sources from which we could collect data about the
contents of the drum. However, this would only be cost effective if we significantly
reduced the price of our transmitter so that 3 transmitting circuits could still cost less
than $5. We could have also placed temperature sensors to measure the temperature
of the drum. We felt it was not worth the cost and power constraints for our initial
design, but could be very useful for a later design which had less concern for such
constraints
The motor could be improved as well as the current low cost motor using in the
design has very high rotations per minute causing it to produce a lot more voltage and
current needed to run the transmitter module which could cause it to not last as long as
it needs to be, so the motor needs to have lower rotations per minute.
56
Chapter 7: Appendix
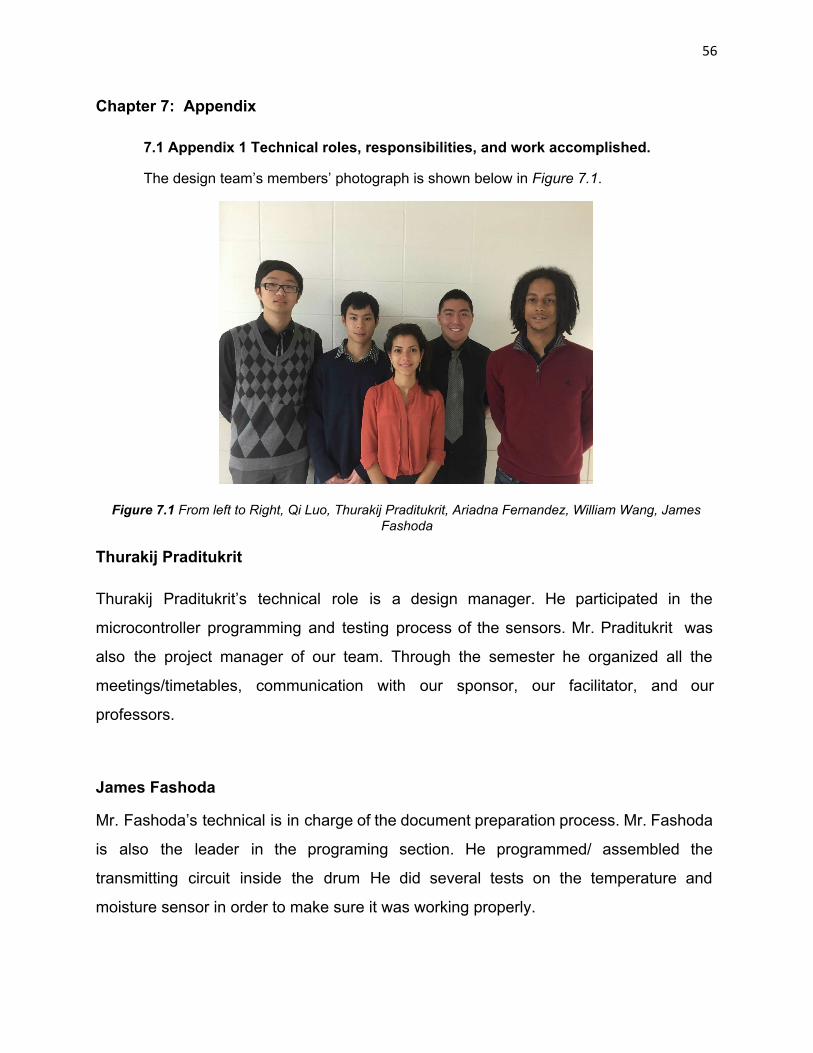
7.1 Appendix 1 Technical roles, responsibilities, and work accomplished.
The design team’s members’ photograph is shown below in Figure 7.1.
Figure 7.1 From left to Right, Qi Luo, Thurakij Praditukrit, Ariadna Fernandez, William Wang, James Fashoda
Thurakij Praditukrit
Thurakij Praditukrit’s technical role is a design manager. He participated in the
microcontroller programming and testing process of the sensors. Mr. Praditukrit was
also the project manager of our team. Through the semester he organized all the
meetings/timetables, communication with our sponsor, our facilitator, and our
professors.
James Fashoda
Mr. Fashoda’s technical is in charge of the document preparation process. Mr. Fashoda
is also the leader in the programing section. He programmed/ assembled the
transmitting circuit inside the drum He did several tests on the temperature and
moisture sensor in order to make sure it was working properly.
57
Ariadna Fernandez
Ms. Fernandez’s technical role is the lab coordinator. Ms. Fernandez ordered all the
parts and equipments that were required for this project. Ms. Fernandez also is a lead
member of the power generation section. She helped the group to solve the energy task
and tested the different types of generators.
William Wang
Mr. Wang’s technical role is the presentation coordinator. Mr. Wang is a member of the
power generation section and did the housing to assemble the power generation parts.
Mr. Wang contributed to test different power generation methods. He also created the
housing for our final design.
Qi Luo
Mr. Luo’s technical role is the application software manager. Mr. Luo focused on our
team’s website. He built the schematic of our circuits. and he is a member of the power
generation group. Mr. Luo has contributed to test the different power generation
methods.

58
7.2 Appendix 2 Literature and website references
Chapter 1.
Whirlpool Corporation Background information
http://www.whirlpoolcorp.com/
Chapter 2.
Hauser, John R. The House of Quality
https://hbr.org/1988/05/thehouseofquality
Chapter 3.
MSP430G2553 Mixed Signal Microcontroller
http://www.ti.com/lit/ds/symlink/msp430g2553.pdf
ATmega328P 8 bit Microcontroller
http://www.atmel.com/Images/doc8161.pdf
LM35 Precision Centigrade Temperature Sensor
http://www.ti.com/lit/ds/symlink/lm35.pdf
ASK Amplitude Shift Keying
http://www.eng.auburn.edu/~roppeth/courses/TIMSmanualsr5/TIMS%20Experiment%20Manuals/Student_Text/VolD1/D106.pdf
Data sheet Receiver R33A
http://www.msilverman.me/wpcontent/uploads/2014/01/K1037299581.pdf

59
Chapter 4.
Humidity sensor HIH5030001
http://sensing.honeywell.com/index.php/ci_id/49692/la_id/1/document/1/re_id/0
60
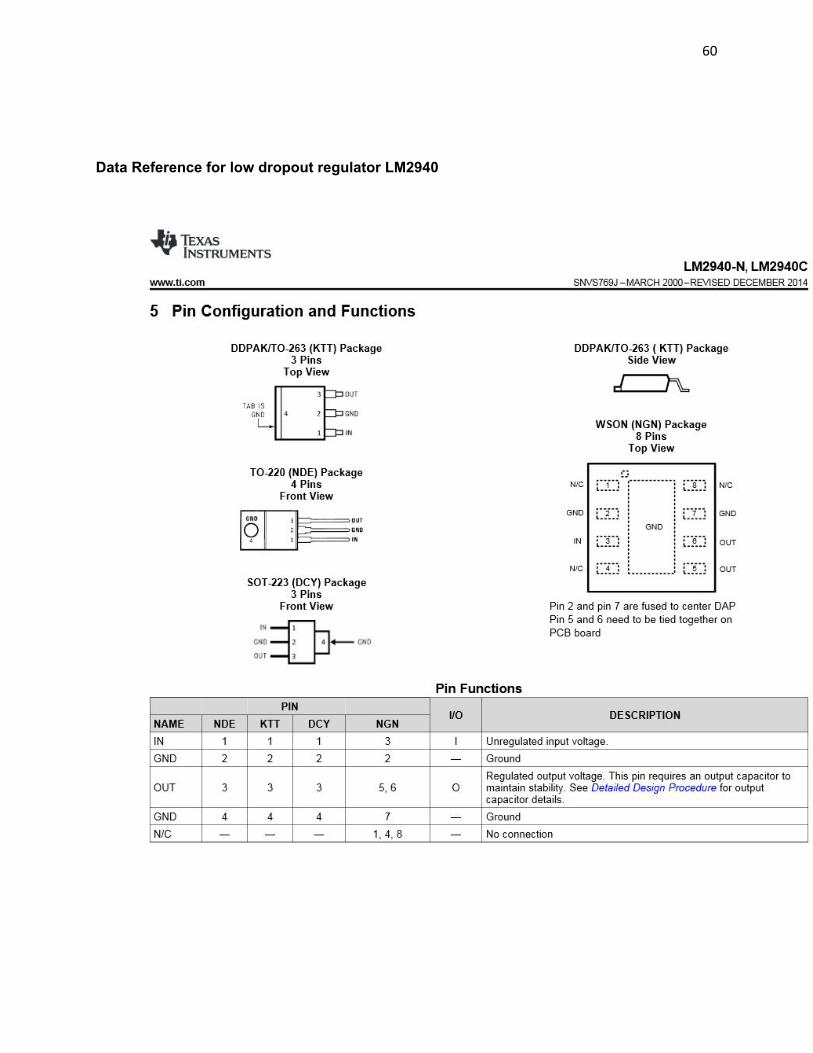
Data Reference for low dropout regulator LM2940
61
62
63
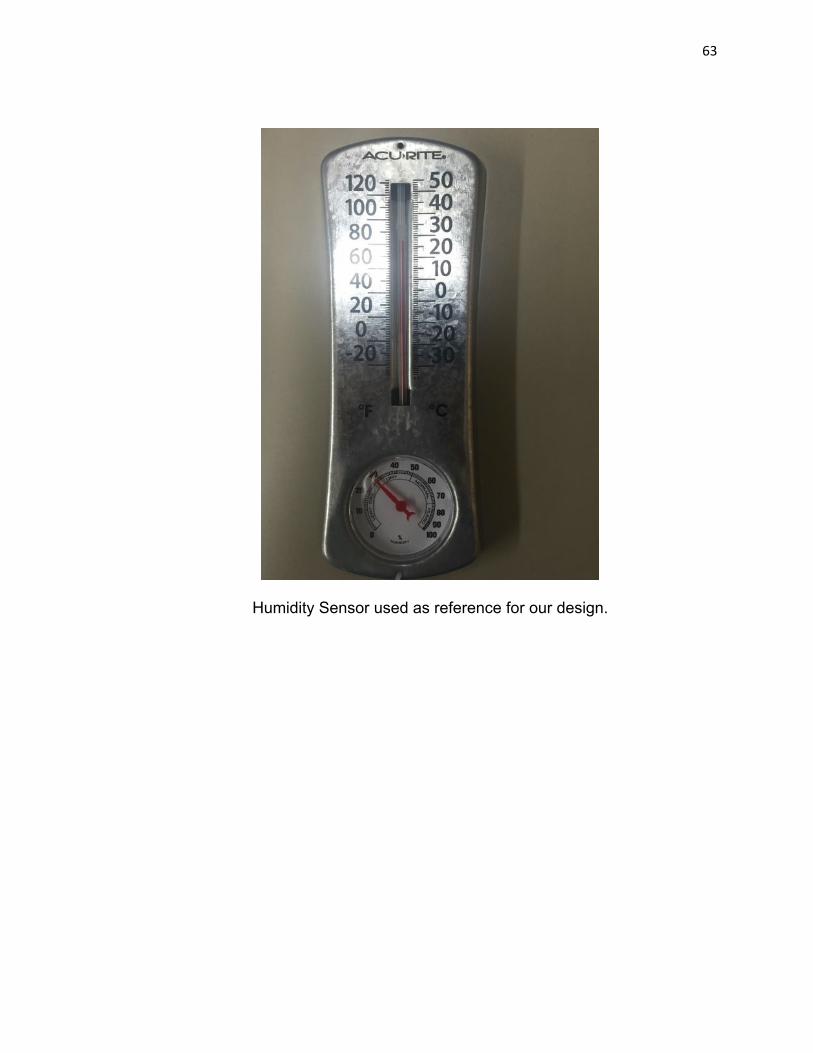
Humidity Sensor used as reference for our design.
64
7.3 Appendix 3 Program Codes, Flowchart of the Codes
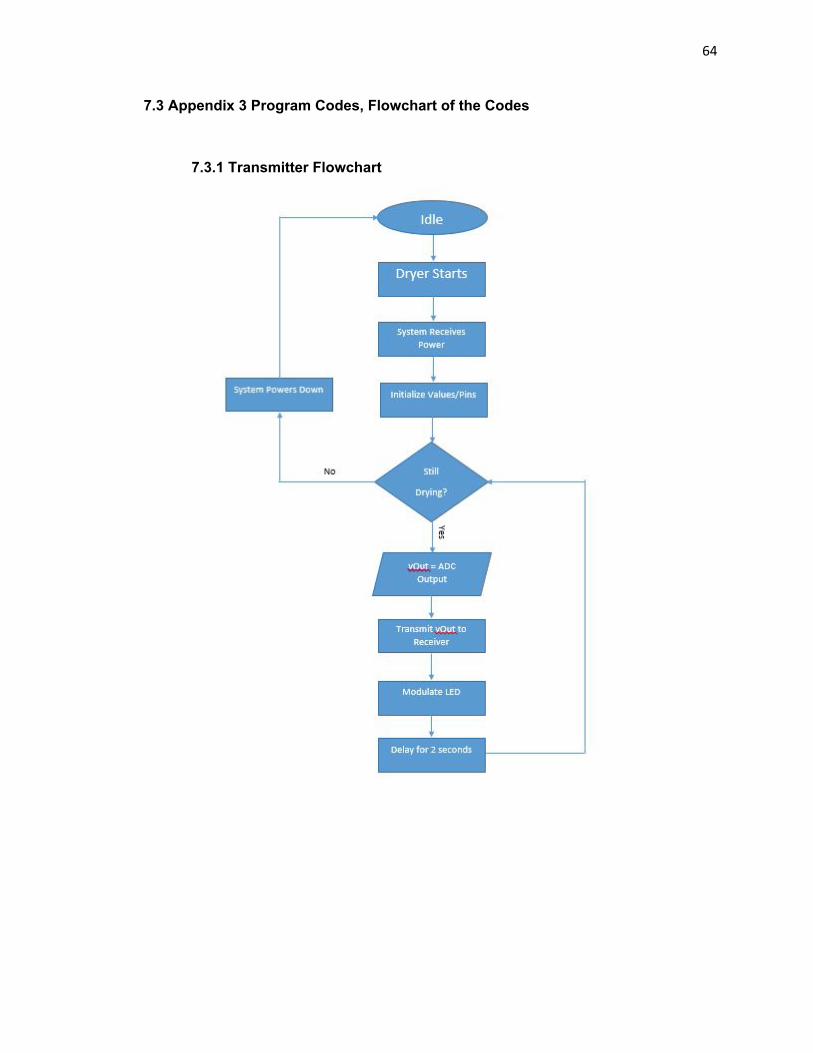
7.3.1 Transmitter Flowchart

65
7.3.2 Transmitter Code
#include <VirtualWire.h>
char *controller;
char charBuf[50];
int value = 0;
void setup()
pinMode(13,OUTPUT); // Set pin 13 as output for LED
vw_set_ptt_inverted(true); //
vw_set_tx_pin(12); // Set transmitter on pin 12
vw_setup(4000);// speed of data transfer Kbps
void loop()
value = analogRead(1); // Current ADC output saved to value
String svalue = String(value); // Convert output to string
svalue.toCharArray(charBuf, 50); // Convert string to char array
send(charBuf); // Transmit output
digitalWrite(13,1); // Turn on LED
delay(2000); // Delay the system
// The same process is repeated to modulate LED
value = analogRead(1);
svalue = String(value);
svalue.toCharArray(charBuf, 50);
66
send(charBuf);
digitalWrite(13,0);
delay(2000);
void send(char *message)
vw_send((uint8_t *)message, strlen(message));
vw_wait_tx();
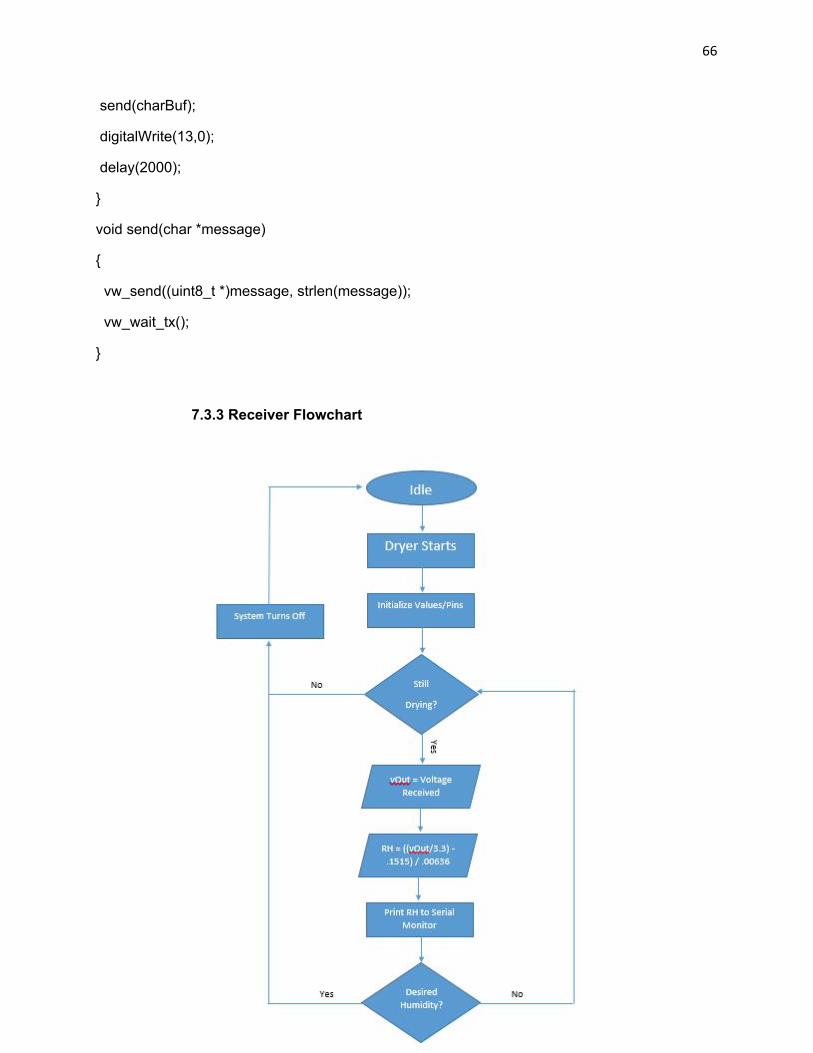
7.3.3 Receiver Flowchart

67
7.3.4 Receiver Code
#include <VirtualWire.h>
byte message[VW_MAX_MESSAGE_LEN];
byte messageLength = VW_MAX_MESSAGE_LEN;
long val;
long endVal;
float vOut;
float RH;
String line;
void setup()
Serial.begin(9600); // Set serial monintor at 9600 bits/sec
Serial.println("Device is ready"); // Show the device is ready
// Initialize Receiver
vw_set_ptt_inverted(true);
vw_set_rx_pin(12); // Set receiver on pin 12
vw_setup(4000); // Bits per sec
vw_rx_start(); // Start receiver
void loop()
if(vw_get_message(message, &messageLength)) // Retrieve message
line = "";
val = 0;
Serial.print("Received: ");

68
for(int i = 0; i < messageLength; i++)
val = (int)message[i] '0'; // Save char as integer
line += String(val); // Append int to string
endVal = line.toInt(); // Convert message to int
vOut = (float(endVal) / 1024) * 5; // Compute vOut from datasheet equation
RH = ((vOut/3.3) .1515) / .00636; // Compute RH using vOut
// Output Calculated RH
Serial.print(" Humidity: ");
Serial.print(RH);
Serial.print("%");
Serial.println();


![[AIESEC EAFIT]IM TEAM REPORT Q1 2008](https://img.pdfslide.tips/doc/110x75/54538de2af795940458b69e8/aiesec-eafitim-team-report-q1-2008.jpg)