Embed Size (px)
DESCRIPTION
AC Circuits, RC ,RL, RLC
Citation preview

Refresher course IN
Experimental physics INDAIN ACADEMY OF SCIENCE
Course Director: Dr R. Srinivasan
Neelam KapoorR. K. Talreja CollegeMumbai University
AC Circuits and Resonance

Alternating Current Circuits
w is the angular frequency (angular speed) [radians per second].Sometimes instead of w we use the frequency f [cycles per second] Frequency f [cycles per second, or Hertz (Hz)] w = 2p f
V = VP sin (wt - fv ) I = IP sin (wt - fI )
An “AC” circuit is one in which the driving voltage andhence the current are sinusoidal in time.
pfv
2p
V(t)
wt
Vp
-Vp

Resistors in AC Circuits
ER
~EMF (and also voltage across resistor): V = VP sin (wt)Hence by Ohm’s law, I=V/R:
I = (VP /R) sin(wt) = IP sin(wt) (with IP=VP/R)
V and I“In-phase”
V
wtp
I
2p

This looks like IP=VP/R for a resistor (except for the phase change). So we call Xc = 1/(wC) the Capacitive Reactance
Capacitors in AC Circuits
E~
C Start from: q = C V [V=Vpsin(wt)]Take derivative: dq/dt = C dV/dtSo I = C dV/dt = C VP w cos (wt) I = C w VP sin (wt + p/2)
The reactance is sort of like resistance in that IP=VP/Xc. Also, the current leads the voltage by 90o (phase difference).
V
wtp 2p
I
V and I “out of phase” by 90º. I leads V by 90º.

Again this looks like IP=VP/R for aresistor (except for the phase change).
So we call XL = w L the Inductive Reactance
Inductors in AC Circuits
LV = VP sin (wt)Loop law: V +VL= 0 where VL = -L dI/dtHence: dI/dt = (VP/L) sin(wt).Integrate: I = - (VP / Lw) cos (wt)
or I = [VP /(wL)] sin (wt - p/2)
~
Here the current lags the voltage by 90o.
V
wtp 2p
I
V and I “out of phase” by 90º. I lags V by 90º.


Phasor diagram
• The projection of OP on the vertical axis (Oy) is ON, represents the instantaneous value.• Ao is the peak value of the quantity.
t0 TT21 T2T
23
ωN
O
PAo
tAA o wsin=y y
A phasor is an arrow whose length represents the amplitude ofan AC voltage or current.
The phasor rotates counterclockwise about the origin with the angular frequency of the AC quantity.
Phasor diagrams are useful in solving complex AC circuits.The “y component” is the actual voltage or current.

Phasor Diagrams
Vp
Ipw t
Resistor
A phasor is an arrow whose length represents the amplitude ofan AC voltage or current.
The phasor rotates counterclockwise about the origin with the angular frequency of the AC quantity.
Phasor diagrams are useful in solving complex AC circuits.The “y component” is the actual voltage or current.

Phasor Diagrams
Vp
Ipw t
Vp
Ip
w t
Resistor Capacitor
A phasor is an arrow whose length represents the amplitude ofan AC voltage or current.The phasor rotates counterclockwise about the origin with the angular frequency of the AC quantity.Phasor diagrams are useful in solving complex AC circuits. The “y component” is the actual voltage or current.

Phasor Diagrams
Vp
Ipw t
Vp
Ip
w t
Vp Ip
w t
Resistor Capacitor Inductor
A phasor is an arrow whose length represents the amplitude ofan AC voltage or current.The phasor rotates counterclockwise about the origin with the angular frequency of the AC quantity.Phasor diagrams are useful in solving complex AC circuits. The “y component” is the actual voltage or current.

i) RC in series circuitR
IRV
V
CV
C
f
ω
CV
IRV
V
Phasor diagram
voltagesupply angle phase:
=Vf
In the circuit diagram :• VR and VC represent the instantaneous voltage across the resistor and the capacitor.
In the phasor diagram :• VR and VC represent the peak voltage across the resistor and the capacitor.

i) RC in series circuitf
ω
CV
IRV
V
Phasor diagram ) ) ) ) ) )
) ) ) )
)2
222
22
22
22
22
222
222
1
=
=
=
=
=
=
=
CRIV
XRIV
XRIV
XRIV
XIRIV
XIRIV
VVV
C
Crmsrms
Coo
Looo
Looo
CoRoo
w
2by side both ...divide

f
ω
CV
IRV
V
Phasor diagram
voltagesupply angle phase:
=Vf
• The total p.d (supply voltage), V across R and C is equal to the vector sum of VR and VC as shown in the phasor diagram.
2C
2R
2 VVV =
) )2C22 IXIRV =
)2C
222 XRIV =
ωC1X C =
222
Cω1RIV =
and
CC IXV =
IRV R =
Argand diagram as follows
O A
B
VR = IR
V
q

f
ω
CV
IRV
V
Phasor diagram
i) RC in series circuit
f
ω
CX
R
Z
• The impedance in RC circuit,
222
222
1
1
CRZ
IC
RI
IVZ
rms
rms
w
w
=
==
R
C
VV
=ftan
IRIX C=ftan
RX C=ftan
ωCR1
=ftan
• From the phasor diagrams,
or
I leads V by Φ
Impedance diagram

f0
fCRCRIXIR
VcV
C
R pw 2===
VcV R
Thus if this ratio is measured at various frequencies & plotted as a function of frequency then slop =2p CRThus C=slop/ 2pR

ii) RL in series circuitR
I
RV
V
L
LV f
ω
LV
IRV
V
Phasor diagram
voltagesupply angle phase:
=Vf
• The total p.d (supply voltage), V across R and L is equal to the vector sum of VR and VL as shown in the phasor diagram.
2L
2R
2 VVV =
) )2L22 IXIRV =
)2L
222 XRIV =
ωLX L =
222 LωRIV =
and

f
ω
LV
IRV
V
Phasor diagram
ii) RL in series circuit
f
ω
LXZ
RImpedance diagram
• The impedance in RC circuit,
• From the phasor diagrams,
222
222
LRZ
ILRI
IVZ
rms
rms
w
w
=
== R
L
VV
=ftan
IRIX L=ftan
RX L=ftan
RωL
=ftan
or
V leads I by Φ

If a resistance R is in Series with a coil of self resistance RL and Inductance L. Zcoil (w) = RL+jwL The magnitude of the impedance is =(RL 2+w2L2)1/2
the rms voltage across R and across the coil will be in the ratio Vcoil/VR = |Zcoil|/R = (RL
2+w2L2)1/2/R
(Vcoil/VR ) 2 = (RL2+(2p f)2L2) /R2
If we measure Vcoil/VR at different frequencies, a plot of (Vcoil/VR)2 vs. f2 will give a straight line, the slope of which is given by (2pL/ R)2. From the slope one can determine L knowing R.

Since Vapp2 = VR
2 + Vcoil2 + 2VRVcoil cos f
Thus cos f & hence tan f can be calculated.
phase angle f given by fR
LRωL
LL
pf 2tan ==
0 200 400 600 800 1000 1200 1400 1600 1800 2000 22000
1
2
3
4
5
6
7
8
9
slope 0.00409 s
tan(f)
Frequency in Hz
A plot of tanf against the frequency f can be fitted to a straight line to give the slop= 2pL/RL. Since L has been measured earlier one may obtain RL, the resistance of the coil from such a plot.

The two terminals of the signal generator are connected to the terminals A and C on the R-L-C box. Signal generator voltage is adjusted =1V. The frequency of the signal is varied between 200 and 2000 Hz in steps of 200 Hz and Vcoil, VR and Vapp are measured. A graph of (Vcoil/VR)2 vs. f2 is ploted & the slope is calculated. Since slop= (2pL/ R)2. From the slope one can determine L knowing R.Then cos f & hence tan f is calculated & a graph oftan f against the frequency f is ploated which gives slop= 2pL/RL from slop RL can be calculated.

0 1 2 3 4
0.0
0.2
0.4
0.6
0.8
1.0
1.2
1.4
1.6
1.8
slope 0.399 x 10⁻⁶ s2
(Vco
il/VR)2
Frequency2 kHz2
0 200 400 600 800 1000 1200 1400 1600 1800 2000 22000
1
2
3
4
5
6
7
8
9
slope 0.00409 s
tan(f)
Frequency in Hz

iii) RLC in series circuit
I
V
R
RV
L
LV CV
C
LL IXV = IRVR = CC IXV =
The voltage across the inductor VL resistor VR and capacitor VC are

I
V
R
RV
L
LV CV
Ciii) RLC in series circuit
f
ωLV
IRV
V
Phasor diagramCV
)CL VV
iii) RLC in series circuit
I
V
R
RV
L
LV CV
C
f
ωLV
IRV
V
Phasor diagramCV
)CL VV
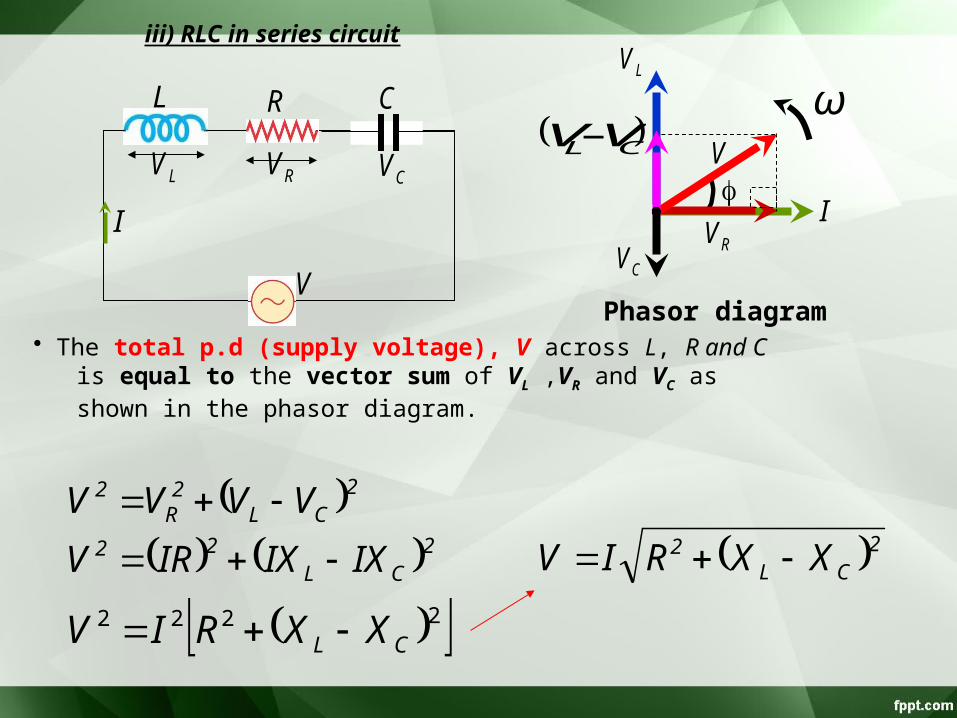
• The total p.d (supply voltage), V across L, R and C is equal to the vector sum of VL ,VR and VC as shown in the phasor diagram.
)2CL2
R2 VVVV =
) )2CL22 IXIXIRV =
) 2222CL XXRIV =
)2CL2 XXRIV =

iii) RLC in series circuit
)CL XX
f
ωLX
R
Z
CXf
ωLV
IRV
V
Phasor diagramCV
)CL VV
Impedance diagram
• The impedance in RLC circuit,
• From the phasor diagrams,
)
)22
22
CL
CL
rms
rms
XXRZ
IXXRI
IVZ
=
==
V leads I by Φ
R
CL
VVV
=ftan )IR
XXI CL =ftan
RXX CL =ftan
RωC
ωL
=
1
tanf

Resonance in RLC series circuit
• Resonance is defined as the phenomenon that occurs when the frequency of the applied voltage is equal to the frequency of the LRC series circuit.
Z
fX L
R
f1X C
0 f
ZRXX LC ,,,
rfGraph of impedance Z, inductive reactance XL, capacitive reactance XC and resistance R with frequency.
The series resonancecircuit is used for tuning a radio receiver.
At resonance the phase goes to zero (when the circuit becomespurely resistive, the current and voltage are in phase).

Resonance in RLC circuitZ
fX L
R
f1X C
0 f
ZRXX LC ,,,
rf
The graph shows that :
• at low frequency, impedance Z is large because 1/ωC is large.
• at high frequency, impedance Z is high because ωL is large.
• at resonance, impedance Z is minimum (Z=R) which is
)2CL2 XXRZ =CL XX =
0RZ 2 =min
RZ =min
LCf
CfLf
r
rr
p
pp
212
12
=
=
resonant frequency
and I is maximumR
VZ
VI rmsrmsrms ==

Vz = is the voltage across the series combination of L and C.
VR = is the voltage across the resistor R
When the inductance and capacitance are in series the total impedance is Z=ZL+ZC = RL + jwL -j/wC
This has a minimum value RL at the resonance frequency.
)
) )R
CLR
RXXR
RZ
VV
L
CLL
R
Z
22
22
1
=
==
ww
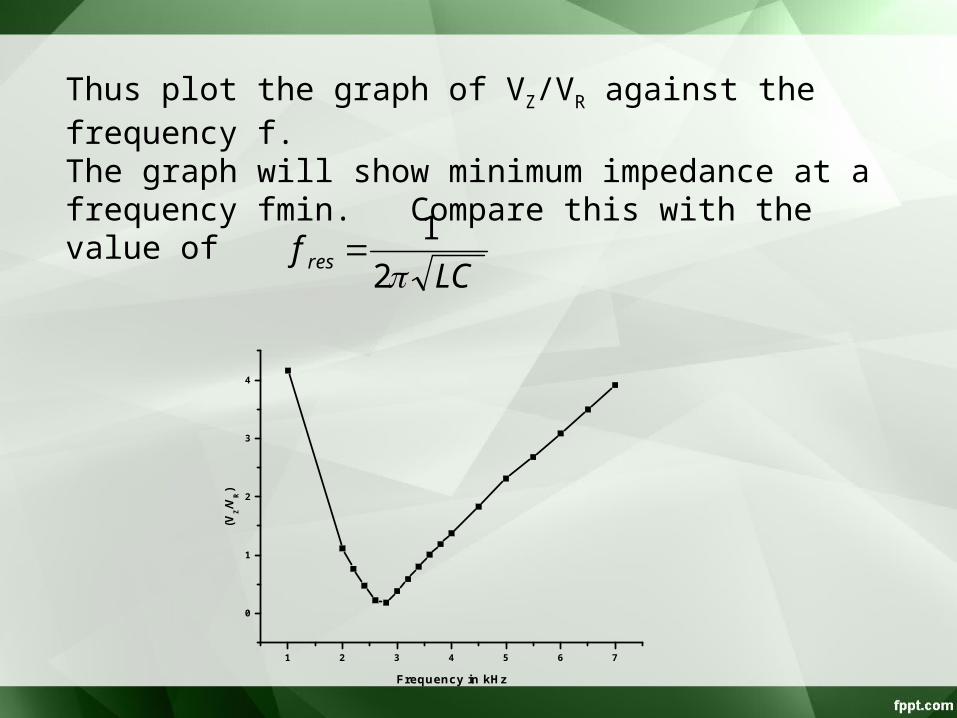
LCf res p2
1=
Thus plot the graph of VZ/VR against the frequency f. The graph will show minimum impedance at a frequency fmin. Compare this with the value of
1 2 3 4 5 6 7
0
1
2
3
4
(VZ/V
R)
Frequency in kHz

If the coil and capacitance are connected in parallel, the effective impedance of the combination is Z = ZLZC/ (ZL+ZC) (II.4.4.1)At resonance frequency ZL+ZC is a minimum. If RL were zero, then ZLZC would be independent of frequency while ZL+ZC would be zero at the resonance frequency, making the effective impedance infinite at the resonance frequency. However RL is non-zero and small for the coil. This makes the impedance to go through a finite, but maximum, value at a frequency close to the resonant frequency.The graph of VZ/VR shows a sharp maximum at a frequency fmax. Verify that fmax is nearly equal to
LCf res p2
1=

1 2 3 4 5 6 7
0
5
10
15
20
25
(VZ/V
R)
Frequency in kHz
(VZ/VR) against frequency in kHz for a parallel resonant circuit

A, B, C, and D are banana terminals. Between A and B is connected a resistance R of 1 kW, Between B and C is connected a coil L of inductance 100 mH. Between C and D is connected a capacitance C of 0.033 mf. One may choose other values depending on the availability. Depending on the circuit RL /RC or LCR do proper connections. Take voltage readings at various frequencies & plot appropriate graph. Do calculations .
PROCEDURE
A B C D
1kW 100mH 0.033mF

i) RC in series circuit A B C D
SG
A B C D
SGA B C D
1kW 100mH 0.033mFSG
ii) RL in series circuit
iii) RLC in series circuit
A B C D
SG
iv) LC in parallelcircuit

THANK YOU
![[XLS] · Web viewAC UARINI AC URUCARA AC URUCURITUBA AC AGRESTE AC AMAPA AC BAILIQUE AC BEIROL AC CALCOENE AC CENTRO AC CUTIAS AC EQUATORIAL AC FERREIRA GOMES AC ITAUBAL AC LARANJAL](https://img.pdfslide.tips/doc/110x75/5c5be47c09d3f245368c84d6/xls-web-viewac-uarini-ac-urucara-ac-urucurituba-ac-agreste-ac-amapa-ac-bailique.jpg)