Embed Size (px)
Citation preview

This document is downloaded at: 2017-12-22T10:52:55Z
Title Investment Spikes and Adjustment toward Target Leverage: Evidence fromJapan
Author(s) Shikimi, Masayo; Matsuura, Katsumi
Citation 経営と経済, 96(1-2), pp.77-106; 2016
Issue Date 2016-09-25
URL http://hdl.handle.net/10069/36883
Right
NAOSITE: Nagasaki University's Academic Output SITE
http://naosite.lb.nagasaki-u.ac.jp
Investment Spikes and Adjustment towardTarget Leverage: Evidence from Japan 77
AbstractThis study presents an empirical investigation whether lumpy in-
vestment behaviors by firms affect their readjustment toward targetleverage ratios. Using a data sample of Japanese listed firms from1978‒2008, it is found that firm investment spikes have a larger ef-fect on debt than equity issuances. The positive effect of invest-ments on debt issue is greater for firms with below-target debt thanfor those with above-target debt. The results imply that firms withbelow-target debt might move toward the target whereas those withabove-target debt move away from it during large investments. It isalso found that financially constrained firms, with above-target debt,are more responsive to investment spikes than their financially un-constrained counterparts.
Keywords : Information asymmetry, lumpy investment, financialconstraint
KEIEI TO KEIZAI, Vol. 96 No. 1・2, September 2016
*Professor, Faculty of Economics, Nagasaki University, 4-2-1, Katafuchi, Nagasaki 850-8506, Japan. Phone : +81-95-820-6323 ; Fax : +81-95-820-6370 ; E-mail : [email protected]
†Professor, Graduate School of Social Sciences, Hiroshima University, 1-1-89, Higashi-senda-cho, Naka-ku, Hiroshima 730-0053, Japan. E-mail : [email protected]
Investment Spikes and Adjustment towardTarget Leverage: Evidence from Japan
Masayo Shikimi*Katsumi Matsuura†
78 KEIEI TO KEIZAI
1 See Shyam-Sunder and Myers(1999), Fama and French(2002), Flannery andRangan(2006), and Kayhan and Titman(2007).2 See Caballero et al.(1995).
1 Introduction
How firms determine their capital structure and when and how they
change it are one of the most important topics in corporate finance. Ac-
cording to the trade-off theory, firms determine their optimal capital
structure to balance the marginal benefits and costs of debt. Many em-
pirical studies support the trade-off theory that firms adjust their capi-
tal structure toward the target debt ratio. Moreover, recent studies have
concluded that the speed of this adjustment differs depending on
whether firms have a financial deficit or surplus, suggesting the influ-
ence on the target behavior by other factors, such as the asymmetric in-
formation costs of external financing(Byoun 2008 ; Faulkender et al.
2012).A faster adjustment is enabled among firms in case of a financial
deficit(surplus)because the adjustment costs are lower when shared
with other transaction costs.
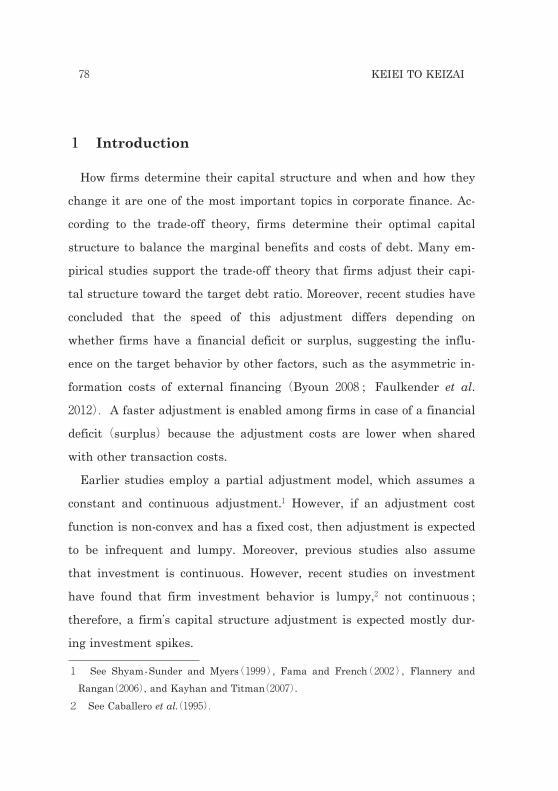
Earlier studies employ a partial adjustment model, which assumes a
constant and continuous adjustment.1 However, if an adjustment cost
function is non-convex and has a fixed cost, then adjustment is expected
to be infrequent and lumpy. Moreover, previous studies also assume
that investment is continuous. However, recent studies on investment
have found that firm investment behavior is lumpy,2 not continuous ;
therefore, a firm’s capital structure adjustment is expected mostly dur-
ing investment spikes.

Investment Spikes and Adjustment towardTarget Leverage: Evidence from Japan 79
This study investigates how firms’ investment activities influence
their debt and equity issuance decisions and their corresponding rebal-
ancing behavior toward a target debt level. We test whether firms move
toward or away from their debt target during large investments. We
also analyze whether the impact of large investments differ among firms
with heterogeneous characteristics.
This study differs from previous studies in two ways. First, we inves-
tigate the effects of large investments on financial decisions of debt and
equity issues. Using financing decisions as dependent variables, we
avoid the mechanical mean reversion problems associated with the use
of the debt ratio as the dependent variable(Chen and Zhao 2007 ;
Chang and Dasgupta 2009).Second, we focus on the influence of firms’
lumpy investment behaviors instead of continuous investment behav-
iors.
Using the data on Japanese listed firms, we find that lumpy invest-
ments positively affect debt and equity issuances ; however, this effect
varies depending on a firm’s debt position and firm characteristics.
Firms with below-target debt are more likely to issue debt to move to-
ward the target ; however, firms with above-target debt also issue debt
to move away from the target. On the other hand, the effects of spikes
on equity issues are consistent with the target behavior that firms with
below-target debt are less likely to issue equity. The effects of spikes on
debt issues are found to vary with firm characteristics. Financially con-
strained firms are more sensitive to spikes, suggesting greater benefits
of adjustment during spikes. Mature firms with blow-target debt issue
debt more, while those with above-target debt issue less than growing
firms. In contrast, the effects of spikes on equity do not vary with firm

80 KEIEI TO KEIZAI
characteristics.
The remainder of the paper is organized as follows. Section 2 reviews
previous empirical studies on changes in capital structure and highlight
their shortcomings. Section 3 describes our sample data and the basic
estimation strategy. Section 4 presents the estimation results of the ef-
fect of lumpy investments on debt(equity)issuance and firm target be-
havior. Section 5 discusses the results and presents the study conclu-
sions.
2 Capital structure adjustments toward the target :theory and evidence
This section reviews previous theoretical and empirical studies on
capital structure adjustments. Many studies have tested the dynamic
trade-off theory, which predicts that firms adjust their capital structure
toward their debt target, and have found supporting evidence by estima-
tion, using the partial adjustment model. However, since the estimated
adjustment speed is very slow(Fama and French 2002),some recent
studies have explored its reasons. One of the impediments for adjust-
ment toward the debt target is the high transaction cost. Leary and
Roberts(2005)found that the adjustment speed of firms is slow when the
non-convex adjustment cost functions are assumed. With fixed costs for
adjustments, firms do not adjust their capital structure continuously,
but periodically ; therefore, the observed adjustments are lumpy over
time.
Some other studies have explored the possibility of asymmetric adjust-
ment cost. With informational asymmetry costs, the issue of equity is

Investment Spikes and Adjustment towardTarget Leverage: Evidence from Japan 81
more costly than debt due to adverse selection(Majluf and Myers
1984).Therefore, to minimize these transaction costs, firms find it opti-
mal to adjust their capital structure at the time of investments. Byoun
(2008)found that adjustment is faster for over-leveraged(under-lever-
aged)firms with financial surplus(deficit)compared to over-leveraged
firms(under -leveraged)with financial deficit(surplus).Faulkender et
al.(2012)found that firms with larger cash flows adjust faster than those
with smaller cash flows. They argue that adjustment costs are low dur-
ing investments because transaction costs are shared between the bene-
fits of approaching the target and funding investments. Dudley(2012)
also found evidence that firms move toward the target when they invest.
On the other hand, DeAngelo et al.(2011)argue that firms temporarily
move away from their target when the investment benefits are greater
than the costs of deviation from the target. Using data from Japanese
listed firms, Shikimi(2014)findings are consistent with those of DeAn-
gelo et al.(2011).
Together, these findings imply that the functional form of adjustment
costs and asymmetry in adjustment costs result in slower adjustments,
on average. However, studies exploring real investment effects estimate
the partial adjustment model and do not consider the possibility that
lumpy real investment patterns result in lumpy capital structure adjust-
ments. Given this disparity in the literature, this present study investi-
gates the effect of lumpy investments on firms’ financing decisions re-
garding the issuance of debt and equity.

82 KEIEI TO KEIZAI
3 Data and empirical specification
3.1 Empirical specification
We assume that firms’ financing decisions can be described as follows :
Y*it=α(Debtit-1-Target*it)+βSit+Xitγ+mi+uit, (1)
Yit=1 if Y*it>0,
Yit=0 otherwize,
where Yit is the financing decision of firm i in year t. Debtit-1 is the
firm’s debt ratio, defined as the sum of short-term and long-term debts
divided by the sum of short-term debt, long-term debt, and capital. Tar-
get*it is the firm’s target debt ratio, Sit is an investment spike, Xit is a
vector of control variables, and mi is a measure of the firm’s heterogene-
ity. We assume that the firm’s heterogeneity is correlated with the firm’
s average of observable characteristic variables, and employ the Mund-
lak probit model to obtain estimators(Wooldridge 2010).The expected
sign of α is negative for the issue of debt and is positive for that of eq-
uity. β is expected to be positive. We regard an investment spike as an
exogeneous variable since the Durbin-Wu- Hausman test rejects the en-
dogenenity.
3.2 Data
Our sample comprises non-financial firms listed on the first or second
sections of Japanese stock markets from 1978 to 2008. We restrict our
sample to those firms that have been listed for at least five consecutive
years, and obtain accounting and stock price data from Firm Financial
Statement Data Bank, supplied by the Development Bank of Japan. We

Investment Spikes and Adjustment towardTarget Leverage: Evidence from Japan 83
Table 1. Summary statistics
exclude the electricity, gas, and water supply industries because they
tend to be heavily regulated. Firms whose book debt-asset ratio exceed
one or take a negative value and those with missing stock price infor-
mation are eliminated from the sample. Firms whose growth rate of to-
tal assets is more than 100% or less than -100% are also eliminated,
since their involvement in a merger, acquisition, or large asset sale is
likely. The lower and upper 0.5% tails of the distribution of financial
variables are trimmed to eliminate outliers. Variables are deflated by
the consumer price index. Summary statistics are presented in Table 1.
Financing decisions
Debt and equity issuances are the two types of financial decisions to be

84 KEIEI TO KEIZAI
considered here. Debt issuance includes public debt and bank loan debt.
Following Chang and Dasgupta(2009),net debt issue and net equity is-
sue are defined as follows : Net equity issue is a change in book capital
minus a change in retained earnings, whereas net debt issue is a
change in total assets minus a change in retained earnings and net eq-
uity issue. Net debt(equity)issues are divided by total assets at the be-
ginning of the year. Following Hovakimin et al.(2001),Hovakimin
(2004),and Leary and Roberts(2005), a firm that has a net debt(eq-
uity)issuance exceeds 5% of total assets at the beginning of the year is
defined to issue debt(equity).
Investment spikes
Following Caballero et al.(1995), an investment spike is defined as fol-
lows :
Spike=1 if ((Iit-Ii)/σIi)>1.5,
where Iit is firm i ’s investment rate at time t, Ii is the firm’s mean of
investment rate, and σIi is the firm-level standard deviation. Following
Shima(2005), the investment rate is defined as an increase in fixed tan-
gible assets minus depreciation divided by capital stock at the beginning
of the year. Figure 1 plots the number of firms that have issued debt
(equity)and have experienced investment spikes during the period
from 1978 to 2008.
Determinants of target capital structure
Target capital structure is described as follows :

Investment Spikes and Adjustment towardTarget Leverage: Evidence from Japan 85
Figure 1. Financing choice and investment spikes
This figure plots the number of firms that have issued debt(equity)and have ex-perienced investment spikes during the period from 1978 to 2008.
Target*it=Wit-1 δ+fi+δt+εit,
where Wit-1 is a vector of firm characteristics, such as firm size, growth,
profitability, and collateral (Rajan and Zingales 1995 ; Hovakimian et
al.2001 ; Frank and Goyal 2008 ; Lemmon et al.2008).fi is firm fixed
effects, δt denotes the year dummy to control for macroeconomic shocks
such as the inflation rate. For firm size, we use the ln(sales)as a
proxy.For firm growth, we use the market-to-book ratio as a proxy.
EBITDA / total assets and tangible fixed assets / total assets, respec-
tively, are used as proxies for profitability and collateral. Industry me-
dian debt ratios are also included to control for variations across indus-
tries. We regress firm observable debt ratio on those determinants, and
obtain fitted values as target debt ratio. The firm fixed effects are also
included in the fitted values(Flannery and Rangan 2006 ; Lemmon et

86 KEIEI TO KEIZAI
3 Regulations on bond issuances were gradually relaxed after 1987. Equity issue atmarket price was banned during 1990‒1995.
Table 2. Estimation results of target capital structure
Note : The dependent variable is firm debt ratio, defined as the sum of short-term plus long-term debts divided by sum of the shot-term debt, long-term debt,and capital. Robust standard errors are in parentheses. Significance at the 10%,
5%, and 1% level is denoted by *, **, and ***, respectively.
al.2008). We divide the time frame into three financial periods : 1976‒
1986, 1987‒1995, and 1996‒2008 to consider the possibility that a firm’s
decisions regarding its target capital structure might be affected by fi-
nancial regulations.3 Table 2 tabulates the estimation results.

Investment Spikes and Adjustment towardTarget Leverage: Evidence from Japan 87
Other variables
To control for other factors explained by the pecking-order hypothesis
and market timing hypothesis, cash plus marketable securities divided
by total assets and the price-to-earnings ratio are included. We expect
the cash ratio to have negative effects for both issues. The price-to-earn-
ings ratio is expected to have a positive effect on the issue of equity. The
shareholdings ratio for the top 10 shareholders, banks, and foreigners is
also included to control for the effect of the agency problem. To control
for industry variation and macroeconomic shocks, industry and year
dummies are included, respectively.
4 Debt (equity) issue and real investments
4.1 Base model
Estimation results for Equation(1)are presented in Table 3. The co-
efficients of deviation from the target have the expected signs and have
highly significant effects on debt(equity)issue, suggesting that firms are
more likely to adjust their capital structure in case of higher deviation.
Although the investment spikes have a positive effect at the 1% level
for both debt and equity, their effect is greater for debt than for equity.
When firms make large investments, firms’ probabilities of debt issu-
ance increases by 15.6% ; whereas, equity issuance increases by 1.1%.
Cash divided by total assets have a negative effect on debt(equity)is-
sue,suggesting that firms with more internal funds are less likely to use
external financing ; this is consistent with the pecking-order hypothesis.
The coefficients of the price-to-earnings ratio are positive and significant
at the 1% level for both debt and equity issuance. None of shareholding

88 KEIEI TO KEIZAI
Table 3. Estimation results of debt (equity) issue and investment spikes
Bootstrap standard errors for estimated coefficients and Delta-method standarderrors for average marginal effects (AME) are in parentheses. Significance at the
10%, 5%, and 1% level is denoted by *, **, and ***, respectively.

Investment Spikes and Adjustment towardTarget Leverage: Evidence from Japan 89
Figure 2. The average marginal effect of spikes
Panel A. The effect of spikes on debt issue
Panel B. The effect of spikes on equity issue

90 KEIEI TO KEIZAI
ratio variables are significant for debt issue. On the other hand, share-
holding by the top 10(foreigners)has a negative(positive)effect on eq-
uity(debt)issue at the 5%(1%)significance level, suggesting that cross
-shareholding weakens shareholder discipline ; however, the presence of
foreign shareholders lowers the agency costs.
To further evaluate the effects of investment spikes on financing deci-
sions, Figure 2 plots the average marginal effects of investment spikes
at the firm’s debt position. Firms are more likely to issue debt when ac-
tual debt is below-target(Panel A); however, they are also observed to
do so when it is above-target. On the other hand, firms are likely to is-
sue equity when their debt is above-target, but not when it is below-tar-
get(Panel B).
4.2 Target behavior and investment by firm characteristics
In this section, we examine whether the effect of investment spikes
vary with firm characteristics and market conditions. We split the sam-
ple according to firm characteristics, such as financial constraints, in-
vestment opportunities, earnings volatility, profitability, and their mar-
ket-to-book ratio, and compare their target behaviors and the effects of
spikes in those samples.
A. Financial constraints
Financially constrained firms have greater difficulty in issuing debt or
equity compared with financially unconstrained firms, due to high
transaction costs. Therefore, we expect financially constrained firms to
be less likely to issue debt(equity)and adjust their capital structure
compared with unconstrained firms(Korajczyk and Levy 2003).On the

Investment Spikes and Adjustment towardTarget Leverage: Evidence from Japan 91
Table 4. Estimation results of debt (equity) issue by firm characteristics
other hand, financially constrained firms are expected to make less fre-
quent, but lumpy adjustments since the opportunity costs of forgoing in-
vestments and the timing of adjustment are higher compared with fi-
nancially unconstrained firms. Thus, they are expected to be more re-
sponsive to investment spikes. Samples are divided into financially con-

92 KEIEI TO KEIZAI
strained and financially unconstrained firms. Firms whose annual total
assets are less(greater)than the 30th(70th)percentile are defined as
financially constrained(unconstrained)firms.
The estimation results are presented in Panel A of Table 4. Other

Investment Spikes and Adjustment towardTarget Leverage: Evidence from Japan 93
All the equations include all the other variables in Table 3. In Panel A, firms
whose annual total assets are less(greater)than the 30th(70th)percentile aredefined as financially constrained(unconstrained)firms. Firms whose market-to-book ratio is greater(less)than one are classified as firms with high(low)invest-ment opportunities in Panel B. If the coefficient of variation of firms’ EBITDA toassets is greater(less)than 70th(30th)percentile, they are classified as high(low)volatile in Panel C. High(low)profitability firms are defined as firms withan EBITDA-to-assets ratio greater(less)than the 70th(30th)percentile in PanelD. Samples are divided into two groups based on whether a firm’s market-to book-ratio is greater than the industry median or not in Panel E. Bootstrap standarderrors for estimated coefficients and Delta-method standard errors for averagemarginal effects(AME)are in parentheses. * p<0.1, ** p<0.05, *** p<0.01
MB ratio < industry median MB ratio
MB ratio < industry median MB ratio
variables used in Table 3 are also included(not reported due to space
constraints).Deviations from target and investment spikes have the ex-
pected sign, demonstrating highly significant effects on debt issuance by
financially constrained and unconstrained firms. It is also noteworthy
that those effects differ between the two groups. On the other hand, al-

94 KEIEI TO KEIZAI
Figure 3. The average marginal effect of spike by financial constraintsPanel A. Average marginal effects of spikes on debt issue by financial constraints
Panel B. Average marginal effects of spikes on equity issue by financial constraints

Investment Spikes and Adjustment towardTarget Leverage: Evidence from Japan 95
though deviations from targets have a 1% positive effect on equity is-
sue for both groups, investment spikes matter only for financially con-
strained firms. A comparison of the average marginal effects on both
groups is illustrated in Panels A and B of Figure 3. Panel A of Figure 3
shows that financially constrained firms are more sensitive to spikes,
suggesting that the benefits of financing investments are greater, and
due to limited internal funds they are more likely to depend on external
funds. On the other hand, large financially unconstrained firms can
fund investments with internal funds and are less likely to issue debt or
equity.
B. Investment opportunities
Firms whose market-to-book ratio is greater(less)than one are classi-
fied as firms with high(low)investment opportunities. Panel B of Table
4 shows the estimation results. Deviations from target and investment
spikes have the expected signs and are significant at the 1% level for
the issue of both debt and equity. The test statistics of equal coefficients
for two groups are also significant at the 1% level, suggesting that
firms’ target behaviors differ between growing and mature firms. The ef-
fects of investment spikes are shown in Panels A and B of Figure 4.
Panel A of Figure 4 shows that mature firms with below-target debt are
more likely to issue debt compared with growing firms. Moreover, it re-
veals that debt issues by growth firms with above-target debt are more
sensitive to spikes compared with mature firms with above-target debt,
suggesting that the benefits of financing investments by debt issue are
greater for growing firms with above-target debt compared with mature
firms with above-target debt, despite deviating further from the target.

96 KEIEI TO KEIZAI
Figure 4. The average marginal effect of spikes by investment opportunity
Panel A. Average marginal effects of spikes on debt issue by investment opportunity
Panel B. Average marginal effects of spikes on equity issue by investment opportunity

Investment Spikes and Adjustment towardTarget Leverage: Evidence from Japan 97
Figure 5. The average marginal effect of spikes by cash flow volatility
Panel A. Average marginal effects of spikes on debt issue by cash flow volatility
In other words, the opportunity costs of forgoing the investment oppor-
tunities are greater for growing firms compared with mature firms with
above-target debt.
C. Earnings volatilities
Firms with high earnings volatility incur higher costs for issuing debt
or equity ; therefore, they are less likely to adjust their capital structure
and less responsive to investment spikes. If the coefficient of variation of
firms’ EBITDA to assets is greater(less)than 70th(30th)percentile, they
are classified as high(low)volatile. In Panel C of Table 4, the coefficients
of deviation from the target in the equity issue equation differ signifi-
cantly between the two samples but not in the debt issue equation. Ex-

98 KEIEI TO KEIZAI
Panel B. Average marginal effects of spikes on equity issue by cash flow volatility
pectedly, Panel A of Figure 5 indicates that the effect of investment
spikes on debt issue is greater for lower volatility firms with below-tar-
get debt, suggesting that high volatility firms have difficulty attracting
external financing investment.
D. Profitability
Profitable firms have more retained earnings and can rebalance their
capital structure with internal funds ; therefore, they are less likely to
issue debt when they have below-target debt. High(low)profitability
firms are defined as firms with an EBITDA-to-assets ratio greater
(less)than the 70th(30th)percentile. In Panel D of Table 4, the devia-
tions from the target have the expected signs and are significant at the
1% level. Contrary to expectations, however, there are no significantly
different effects of deviation on debt issue between two groups. On the

Investment Spikes and Adjustment towardTarget Leverage: Evidence from Japan 99
Figure 6. The average marginal effect of spikes by profitability
Panel A. Average marginal effects of spikes on debt issue by profitability
Panel B. Average marginal effects of spikes on equity issue by profitability

100 KEIEI TO KEIZAI
Figure 7. The average marginal effect of spikes by market timing
Panel A. Average marginal effects of spikes on debt issue by market timing
other hand, when the deviation increases, the probability of equity issu-
ance is higher for profitable firms than for their less profitable counter-
parts, suggesting that adjustments can be made more easily because the
transaction costs of equity issue are lower for profitable firms. Regard-
ing the effect of investment spikes, Panels A and B of Figure 6 reveal no
differences between the two groups.
E. Market timing
Firms issue equity when they are highly evaluated(Baker and Wur-
gler 2002, Welch 2004, Alti 2006).Following Faulkender et al.(2012),
samples are divided into two groups based on whether a firm’s market-
to book-ratio is greater than the industry median or not. The results
listed in Panel E of Table 4 indicate that target behavior does not differ

Investment Spikes and Adjustment towardTarget Leverage: Evidence from Japan 101
Panel B. Average marginal effects of spikes on equity issue by market timing
among these two groups ; indeed, the effect of investment spikes on
debt issuances is significantly greater for firms with lower market-to-
book ratios than for firms with higher market-to-book ratios. Panel A in
Figure 7 indicates that under-leveraged firms with low market-to-book
ratios are more likely to issue debt during investment spikes compared
with those firms with higher market-to-book ratios.
4.3 Firm's rebalancing behavior following investment shocks
Prior sub-section reveals that firms with above-target debt are likely
to issue debt when they have investment spikes and deviate further
from the target. Since having above-target debt is costly, it is expected
that they may rebalance their capital structure toward the target in the
following years. Figure 8 shows the deviation from the target in the 12
year window, from ‒2 to 9 years. We set the year when a firm hits an

102 KEIEI TO KEIZAI
Figure 8. Over-leveraged firms' deviation from the target following investment shocks
Table 5. The effect of investment spike on changes in deviation from the target
Sample consist of firms who issue debt when they have above-target debt. Thedependent variable is changes in deviation from the target. Independent vari-ables are investment spike, industry dummies, and year dummies. Robust stan-
dard errors are in parenthesis. * p<0.1, ** p<0.05, *** p<0.01.
investment spike and issues debt to 0. Sample firms are those who have
above-target debt at the event year(0). Although debt issuers move
away from the target during investment spikes, the median firm rebal-
ances their capital structure within four years. Next, we explore the ef-
fect of investment spikes on capital structure by regressing changes in

Investment Spikes and Adjustment towardTarget Leverage: Evidence from Japan 103
deviation from the target on investment spikes. Estimation results are
presented in Table 5. The dependent variable in the first row(Debt issue
+1)is the change in deviation from the event year to the event year+
1 year. Likewise, the one in the Debt issue+t row denotes the changes
in deviation from the event year to the event year+t. Besides an invest-
ment spike variable, all models include year dummies and firm fixed ef-
fects. The results show that investment spikes have a positive effect on
changes in deviation even three years after the investment shock, sug-
gesting that shock do not disappear immediately.
5 Conclusion
This study analyzes the effect of a firm’s real investments on their
target behavior. Using data from listed Japanese companies in 1978‒
2008, we first find that debt issue is more sensitive to deviation from the
target compared to equity issue. Second, the effects of deviation are
found to differ between financially constrained and financially uncon-
strained firms, and growth and non-growth firms. As for the economic
impact, the effects of deviation are found to be relatively small com-
pared to investment spikes. Moreover, we found asymmetry in the ef-
fects of spikes. The positive effect of investments on debt issue is greater
for firms with below-target debt than for those with above-target debt.
The results imply that firms with below-target might move toward the
target debt whereas those with above-target debt move away from it
during large investments. On the other hand, the effect of investment
on equity issue is consistent with the trade-off theory.
Some studies on capital structure adjustment have found evidence

104 KEIEI TO KEIZAI
that adjustment speed is asymmetric. This study finds that firms can
move toward their target during large investments even if the sensitiv-
ity of debt(equity)issuance to deviation is constant. Adjustment asym-
metry is possibly caused by either a variation in adjustment costs or the
varying effects of investments, depending on the firm’s debt position. An
investigation in to which factors are dominant is left for future research.
Acknowledgements :
We thank the seminar participants at the Japanese Economic Associa-
tion Spring Meeting, the 9th International Conference on Asian Finan-
cial Markets and Economic Development, Development Bank of Japan
and Hiroshima University for their helpful comments. This research is
financially supported by JSPS KAKENHI Grant Number 1526380394
(Shikimi).
References :Alti, A.(2006)“How Persistent is the Impact of Market Timing on Capital Structure?”
Journal of Finance, Vol.61, No.4, pp. 1681‒1710.
Baker, M. and J. Wurgler(2002)“Market Timing and Capital Structure,” Journal of
Finance, Vol.57, No.1, pp.‒32.
Byoun, S.(2008)“How and When do Firms Adjust their Capital Structures toward
Targets?”Journal of Finance, Vol. 63, No. 6, pp. 3069‒3096.
Caballero, R. E. Engel, and J. C. Haltiwanger(1995)“Plant-Level Adjustment and Ag-
gregate Investment Dynamics,” Brookings Papers on Economic Activities 2, No. 2,
1‒54.
Chang, X. and S. Dasgupta(2009)“Target Behavior and Financing : How Conclusive
Is the Evidence?” Journal of Finance, Vol.64, No.4, pp. 1767‒1796.
Chen, L. and X. Zhao(2007)“Mechanical Mean Reversion of Leverage Ratios,” Eco-
nomic Letters, Vol.95, No.2, pp. 223‒229.
DeAngelo, H., L. DeAngelo, and T. M. Whited(2011)“Capital Structure Dynamics and
Transitory Debt,”Journal of Financial Economics, Vol. 99, No. 2, pp. 235‒261.

Investment Spikes and Adjustment towardTarget Leverage: Evidence from Japan 105
Dudley, E.(2012)“Capital Structure and Large Investment Projects,” Journal of Cor-
porate Finance, Vol. 18, No. 5, 1168‒1192.
Fama, E. and K. French(2002)“Testing Trade-off and Pecking Order Predictions
about Dividends and Debts,” Review of Financial Studies, Vol.15, No.1, pp. 1‒34.
Faulkender, M., M. J. Flannery, K. W. Hankins, and J. M. Smith(2012)“Cash Flows
and Leverage Adjustments,” Journal of Financial Economics, Vol.103, No.3, 632‒
646.
Flannery, M. J. and K. P. Rangan(2006)“Partial Adjustment towards Target Capital
Structures,” Journal of Financial Economics, Vol.79, No.3, pp. 469‒506.
Frank, M. Z. and V. K. Goyal(2008)“Trade-off and Pecking Order Theories of Debt,”
Eckbo, B. E.(ed), Handbook of Corporate Finance : Empirical Corporate Finance,
Vol. 2, pp.136‒202.
Hovakimian, A., T. Opler, and S. Titman(2001)“The Debt-Equity Choice,” Journal of
Financial and Quantitative Analysis, Vol.36, No.1, pp. 1‒24.
―(2004)“The Role of Target Leverage in Security Issues and Repurchases,” Journal
of Business, Vol.77, No.4, pp. 1041‒1071.
Kayhan, A. and S. Titman(2007)“Firms’ Histories and Their Capital Structure,” Jour-
nal of Financial Economics, Vol.83, No.1, pp. 1‒37.
Korajczyk, R. A. and A. Levy(2003)“Capital Structure Choice : Macroeconomic Condi-
tions and Financial Constraints,” Journal of Financial Economics, Vol.68, No. 1, pp.
75‒109.
Leary, M. T. and M. R. Roberts(2005)“Do Firms Rebalance Their Capital Structure,”
Journal of Finance, Vol.60, No.6, pp. 2575‒2619.
Lemmon, M. L., M. R. Roberts, and J. F. Zender(2008)“Back to the Beginning : Per-
sistence and the Cross-Section of Corporate Capital Structure,” Journal of Finance,
Vol.60, No.4, pp.2575‒2619.
Myers, S.C. and N. S. Majluf(1984)"Corporate Financing and Investment Decisions
when Firms have Information that Investors do not have,”Journal of Financial
Economics, Vol. 13, No. 2, pp.187‒221.
Öztekin, Ö. and M. J. Flannery(2012)“Institutional Determinants of Capital Struc-
ture Adjustment Speeds,”Journal of Financial Economics Vol. 103, No. 1, pp.88‒
112.
Rajan, R. G. and L. Zingales(1995)“What Do We Know about Capital Structure?

106 KEIEI TO KEIZAI
Some Evidence from International Data,” Journal of Finance, Vol.50, No.5, pp. 1421
‒1460.
Shikimi, M.(2014)“Financing decisions and target behavior,” Review of Monetary and
Financial Studies, No. 36, pp. 67-90(in Japanese).
Shima, K.(2005)“Lumps in equipment investment of Japanese firms : a hazardanalysis,”Journal of Socio Economic Research, No. 54, 1‒17(in Japanese).
Shyam-Sunder, L. and Myers, S. C.(1999)“Testing Static Tradeoff against Pecking
Order Models of Capital Structure,” Journal of Financial Economics, Vol.51, No. 2,
pp. 219‒244.
Welch, I.(2004)“Capital Structure and Stock Returns,”Journal of Political Economy,
Vol.112, No.1, pp.106‒131.
Wooldridge, J.(2010)Econometric Analysis of Cross Section and Panel Data, Second
ed., MIT Press, Cambridge.