Embed Size (px)
Citation preview

Navigating the Landscape of Data Literacy: It IS Complex
Ellen B. Mandinach, WestEd
Edith S. Gummer, Education Northwest1
July 27, 2012
1 As of September, 2012, Dr. Gummer became an employee of WestEd.

CONTENTS
Acknowledgments………………………………………………………………………………..i
Executive Summary………………………………………………………………………...…....ii
Introduction ................................................................................................................................... 1
Issues and Context ...................................................................................................................... 1 Literature ..................................................................................................................................... 3 Our Approach.............................................................................................................................. 4
Methods and Components of the Work—Triangulation .......................................................... 6
Materials Analyses ...................................................................................................................... 6 Definitions of Data Literacy………………………………………………………………......10 Hands-On Activity .................................................................................................................... 11 Transcript Analyses………………………………………………………………………….. 11
Findings ........................................................................................................................................ 12
Materials Analyses .................................................................................................................... 12 Definitions of Data Literacy ..................................................................................................... 20 Hands-On Activity .................................................................................................................... 23 Transcript Analyses .................................................................................................................. 24
Summary and Recommended Next Steps ................................................................................. 40
Summary of the Findings .......................................................................................................... 40 Next Steps ................................................................................................................................. 41
References ……………………………………………………………………………………... 46
Appendices ................................................................................................................................... 51
Appendix A—Agenda for the Meeting..................................................................................... 51 Appendix B—List of Attendees................................................................................................ 58 Appendix C—Materials Codes and Subcodes ………………………………………………..60 Appendix D—Color-Coded Tables of Relative Distribution of Concepts ............................... 64 Appendix E—Pre-Meeting Definitions .................................................................................... 98 Appendix F—Hands-On Activity Depictions ......................................................................... 101 Appendix G—Comments from the Transcripts ...................................................................... 104

i
ACKNOWLEDGMENTS
The authors wish to acknowledge the support of the Bill & Melinda Gates Foundation in enabling us to conduct this work, convene this meeting, and produce this white paper. In particular, the authors would like to recognize Don Mitchell, the project officer. The results reported here are based on findings from the project and do not necessarily reflect the views of the Bill & Melinda Gates Foundation. The authors wish to thank all the meeting participants for providing their expertise, insights, and candid comments, on which this work is based. It is a true collaboration. The authors also wish to acknowledge the organizational support that WestEd and Education Northwest provided to help convene the meeting, conduct the materials analysis, offer library assistance, and aid in other aspects of the work. In particular, the authors would like to thank the following individuals from these two organizations: Marty Orland for his facilitation of the meeting; Chris Mazzeo, Rob Larson, Sri Ananda, and Andrea Lash for facilitating breakout sessions; Glen Harvey for leadership and initial framing of the discussion at the beginning of the meeting; Elizabeth Autio and Jeremy Friedman for their work on the materials analysis; Patti Tucci for transcription assistance and data displays; Traci Franz for work on the data displays; Linda Fitch for her work on the references; Rhonda Barton for editorial assistance; Terri Akey for project oversight at Education Northwest; Jackie Silva, Cynthia Ng, and Jason Hayes for technological assistance; and, last but not least, Jennifer Verrier for pulling together the meeting and all the logistics. For Edith Gummer, this material is based upon work while serving at the National Science Foundation. Any opinions, findings, and conclusions or recommendations expressed in this material are those of the author(s) and do not necessarily reflect the views of the National Science Foundation.

ii
EXECUTIVE SUMMARY
Data-driven decision making has gained substantial traction in education circles over the past decade, with an increasing emphasis in the past few years. The focus on using data and evidence to inform practice is seen by many policymakers as a positive trend. The U. S. Department of Education has devoted more than $610 million to build the technological infrastructure for it; however, comprehensive efforts to build the human capacity of educators to use data have been limited. Part of the issue pertains to a question of responsibility—that is, who is responsible for training current and future educators to use data? Another part of the issue is that the fields of policy, practice, and research do not have a common, agreed-upon definition of what it means to be data literate. Different stakeholders and experts interpret “data literacy” to mean different things. There is no common understanding of the skills and knowledge that comprise the construct. Achieving a common definition of data literacy would serve positively to inform the field in order to facilitate progress in research and development, support the implementation of measures of data literacy, inform the refinement of professional development materials and services, support formal preparation in data literacy within higher education programs, inform funding agendas, and connect policymaking with research and practice. This white paper reports on a project whose intent was to develop a working or operational definition of data literacy. The project consisted of two components: an analysis of professional development texts on data literacy and a meeting of experts from the fields of research, policy, professional development and funding who inform the field of data-driven decision making. The data collected during the meeting included transcript analyses from the meeting, definitions provided by the experts, and outcomes of an activity that attempted to differentiate between data literacy and assessment literacy. Findings from the project indicated that it is possible to identify many of the elements of knowledge and skills that comprise data literacy but that a formal, simple definition remains elusive. From a cognitive perspective, the components of declarative, procedural, schematic, and strategic knowledge that make up data literacy are complex and intertwined. These components clarify the problems that the use of data is intended to address, the nature of the data that have utility and sufficiency, and the inquiry processes that need to be undertaken to turn data into information. These components of knowledge and skills have complex interactions with disciplinary areas that are taught in schools and with dispositions educators need in order to be continually seeking improvement. Ultimately, the meeting yielded agreement about roughly 95 percent of the complex construct, with 5 percent remaining ill-defined or underspecified. The findings also indicated that there are complex interactions between data literacy and assessment literacy, with considerable overlap and at least the potential for differing knowledge and skills across the two forms of literacy. The materials that are used to train educators to use data contain the specific skill sets, but also are interconnected with the skills and knowledge required for teachers or administrators to be effective. In other words, data literacy is not applied in a vacuum; it is part of a repertoire of tools that enable educators to function more effectively and that continually inform their practice. It is difficult to differentiate those sets of knowledge and skills that are relevant to data literacy

iii
and those that apply more generally to the practice of education, as shown multiple times in the following discussion. Based on the components of the project, it is clear that data literacy is complex and highly systemic. Data literacy may form the foundation for data use, but there is an entire landscape around the construct that facilitates or impedes effective data use. It is necessary to examine the knowledge and skills required to understand the landscape in order to understand data literacy as a complex construct.

1
INTRODUCTION
This white paper examines the landscape of data literacy, based on preparation for and convening of a meeting on May 3 and 4, 2012, which brought together the foremost researchers and professional development providers in the field of educational data-driven decision making. The meeting also included other relevant stakeholders, such as representatives from funding agencies, state and federal education officials, and experts in assessment. The meeting sought to develop a working or operational definition of data literacy for educators, which that has been lacking in the field2 over the past decade. The objective of the meeting was to define what it means to be data literate in education. Although an explicit definition of data literacy is an elusive and challenging task, the meeting was able to contribute to an in-depth understanding of the complexity of the construct, explore the interrelatedness of contextual components, and identify knowledge and skills that comprise data literacy. The meeting invoked the 95/5 percent rule—that is, the experts were able to agree on 95 percent of what it means to be data literate, with the remaining 5 percent open for discussion. This white paper describes the process of striving toward operationalizing the construct. The paper begins with an examination of relevant issues and the context in which data literacy resides, followed by a brief and targeted exploration of relevant literature and an explication of our approach to the project. The paper then describes the methods used in the project, and the project’s findings. The concluding section contains a summary of the findings and a description of potential next steps. References and appendices follow.
ISSUES AND CONTEXT Although data-driven decision making is not new to education, emphasis on this practice has grown substantially in the past few years, with the nation’s highest-ranking education officials stressing the importance of data use (Duncan, 2009a, 2009b, 2009c, 2010a, 2010b, 2012; Easton, 2009). It is widely acknowledged that data use must be part of an educator’s arsenal of tools and that all educators should be prepared to use data effectively to inform their practice (NCATE, 2010). However, despite this emphasis by and attention from policymakers, data literacy remains an elusive construct in an emerging field. There is no agreed-upon definition of data literacy across researchers, professional development providers, policymakers, and other relevant stakeholders, and the field often confuses data literacy with assessment literacy (e.g., Greenberg & Walsh, 2012), a trend that is problematic for systematically preparing educators to use data. Data literacy must be considered from a broad and comprehensive perspective, taking into account the widest possible range of data, not just student assessment results. Further, the messaging related to data-driven decision making in general has been quite negative, linking the use of data with accountability and compliance. 2 We define the field as people and institutions who, by way of their professional activities and connections to others, self-identify and function within the infrastructure of data use in education. The field comprises multiple sectors (e.g., classroom, school, district, state, federal) and lies within a domain defined as inclusive of all data-driven decision making endeavors, including those undertaken outside the scope of the field per se (i.e., superordinate to the field).

2
The attainment of a working definition of data literacy has the potential to impact the field in a number of ways. It can influence how professional development providers consider which skills and knowledge are essential to be taught, how they structure their materials, and how they focus their models of data use. It can affect how schools of education incorporate data-driven skills and knowledge into their curricula, and whether they do so as new stand-alone courses or integrated into existing courses. It can influence how state policymakers include and implement requirements for data literacy in credentialing and licensure procedures. It can impact how researchers operationalize data literacy, specifying the skills and knowledge that educators must implement in order to use data effectively in their practice. It can help to create a research and development agenda. It can influence the development of tools, technologies, and resources that can be used to support data-driven decision making. It can provide a positive message to educators and stakeholders about what educators need to know and do to support the use of data as a tool to influence and inform their practices. Finally, it can influence the kinds of data that are viable, usable, and actionable for a variety of educators and stakeholders throughout the educational system.
The emphasis on using data and evidence to inform educational practice has been emerging over the past decade, gaining prominence in educational policy and research in the past few years as the field has begun to respond to U. S. Secretary of Education Arne Duncan’s (2009a. 2009b. 2009c, 2010a, 2010b) insistence that all educators use data. However, the extent to which educators are changing their practice as a result of this emphasis remains in question. Recognizing that change in education comes slowly, it is also unclear how quickly other stakeholders (e.g., schools of education and boards that regulate licensure and certification) are taking steps to ensure that educators are data literate. Data-driven decision making is not a passing fad; yet many educators still do not see the need to use data in their practice, and view data-driven decision making in a negative context because of its link to accountability and compliance, rather than acknowledging its use for continuous improvement. These educators see it as a ball and chain, a hammer, or a four-letter word, and they are skeptical and concerned about how data are going to be used (for example, to evaluate their performance). Many do not understand that data-driven decision making is a tool that can help them improve their students’ outcomes.3 These attitudes reflect a deeply ingrained mindset that stems from educators who have failed to see positive outcomes tied to their data use. Establishing a definition of data literacy can help facilitate the process by which educators can become data literate and recognize data use as a productive tool. Much of the difficulty of this task relates to a messaging problem that requires providing evidence of positive impact. First, however, the field needs to understand what data literacy is, what skills and knowledge comprise the construct, and how best to provide training so that educators become data literate. These complex and systemic issues will require the attention and input of diverse stakeholder groups.
3 The reactions, comments, and concerns described in this paragraph were raised by educators during presentations at various conferences and events around data use. Such skepticism has not been well documented in the literature.

3
LITERATURE U. S. Secretary of Education Arne Duncan has asserted that data can be used to guide instruction, as part of a continuous improvement process, in order to help all students learn. Secretary Duncan has said (2009c), “I am a believer in the power of data to drive our decisions. Data gives us the roadmap to reform. It tells us where we are, where we need to go, and who is most at risk. [. . .] Our best teachers today are using real-time data in ways that would have been unimaginable just five years ago. They need to know how well their students are performing. They want to know exactly what they need to do to teach and how to teach it.” Stating the case for teachers to acquire data literacy, Duncan commented, “[P]art of what we need to do is figure out how we challenge schools of education to make sure teachers come into the profession not just with classroom management skills intact, and not just understand[ing] some of the philosophy of education, but being able to use data from day one to really drive instruction.” He further noted that “teachers were not generally being taught to use data to differentiate and improve instruction” (Duncan, 2010b). The U. S. Department of Education’s recognition of the importance of data use goes beyond the rhetoric of policymakers. The Institute of Education Sciences identified data use to improve student achievement as a key topic and devoted one of its practice guides to the subject (Hamilton et al., 2009).4 This guide identified five recommendations related to data use: (a) the recognition of an inquiry cycle of data use for instructional improvement; (b) the importance of students being their own data-driven decision-makers; (c) the creation of a vision for data use; (d) the establishment of a data culture; and (e) the implementation of a data system. The guide also recognizes the need to provide focused training and professional development for educators, and also describes different kinds of professional development regarding data for educators with different roles in schools and districts (e.g., teachers, principals, data-system staff). The National Council for Accreditation of Teacher Education (NCATE)’s Blue Ribbon Panel on Clinical Preparation and Partnerships for Improved Student Learning released a comprehensive, far-reaching set of recommendations for the future of teacher preparation (NCATE, 2010), which is intended to directly affect educator training on data use. The recommendations state that teacher candidates “need to have opportunities to reflect upon and think about what they do, how they make decisions, and how they ‘theorize’ their work, and how they integrate their content knowledge and pedagogical knowledge into what they do” (p. 9). They further state that teacher preparation must provide “the opportunity to make decisions and to develop skills to analyze student needs and adjust practices using student performance data while receiving continuous monitoring and feedback from mentors” (p. 10). These recommendations represent the principles of data-driven decision making and continuous improvement applied to teacher preparation and to practice. It is clear, from the expanding literature base on data literacy, that many educators do not have the data literacy skills necessary to use data effectively (Choppin, 2002; Feldman & Tung, 2001; Hamilton et al., 2009; Herman & Gribbons, 2001; Ikemoto & Marsh, 2007: Mandinach, 2009, 2012; Mandinach & Honey, 2008; Mason, 2002; Miller, 2009; Wayman & Stringfield, 2006). 4 It is important to note that this document focused solely on the literature on data that pertain to student achievement. It did not approach the field using a broad lens on data use.

4
NCATE’s recommendations recognize the role that schools of education must play in preparing educators to use data. However, this preparation requires a multipronged approach. It also requires a concerted effort among professional development providers to address in-service needs. Districts that cannot afford to bring in formal professional development providers may have to resort to having the most knowledgeable staff within a district or school provide training. While professional development related to data is growing, the extensiveness of such training is still sporadic and not as comprehensive as it needs to be (Means, Padilla, & Gallagher, 2010). The literature is clear that it is no longer acceptable for educators to rely solely on gut feeling, anecdotes, and opinions; they must be able to use data to inform practice (Duncan, 2009a, 2009c; Hamilton et al., 2009; Mandinach, 2012). They must also be able to cope with the proliferation of data and the variety of data sources. To do that, they must be able to transform data into actionable knowledge in order to inform decisions, whether instructional or administrative (Mandinach, Honey, Light, & Brunner, 2008). This also means that data skills must be infused with knowledge of content, pedagogy, and administration. Thus, teachers must show evidence of pedagogical data literacy (Mandinach, 2012) or instructional data literacy (Means, Chen, DeBarger, & Padilla, 2011). There is likely to be a parallel need for administrators to show data literacy within the context of administrative functions (Mandinach, Gummer, & Muller, 2011). What specific knowledge and skills comprise data literacy remains unclear in existing literature. Researchers addressing that question have presented different findings; in some cases, different authors may mean the same or similar things but use different terminology to refer to a particular skill. Mandinach and Jackson (2012) analyzed several existing theoretical frameworks and a small number of professional development programs for data-driven decision making. They found at least 21 processes and skills posited by researchers as essential components of data use. Further, in a meeting funded by the Spencer Foundation, Mandinach, Gummer, and Muller (2011) identified some skill sets culled from the literature and noted that there are fundamental missing aspects of the professional development models as they link to the conceptual frameworks. For example, professional development programs on data use typically do not make the connection to instructional actions. Based on the initial analyses, it is clear that there are similarities, inconsistencies, and missing components among the existing training programs and theories for data-driven decision making and data literacy. Organizational context is also emerging to influence the acquisition of data literacy. Research has begun to examine the many components within schools and districts, as learning organizations, that facilitate or impede the establishment and enculturation of data-driven decision making (Anderson, Leithwood, & Strauss, 2010; Hamilton et al., 2009; Mandinach & Jackson, 2012).
OUR APPROACH Recognizing that the field of data-driven decision making is highly complex, systemic in nature, and informed by a diverse set of stakeholders with unique perspectives, our objective was to bring together experts from relevant stakeholder groups to clarify what it means to be data literate in education. We also sought to understand the contextual conditions that can facilitate or impede data-driven decision making. Our approach was to adopt a systems perspective, noting that data literacy does not occur in isolation. We recognized that there must be precursor

5
conditions in place to allow and nurture development of data literacy and establishment of a data culture, and we believed that defining data literacy requires understanding the interconnectedness of the landscape in which data-driven decision making evolves. As we planned this project and its components, we seriously considered how best to elicit thoughts, advice, and recommendations from those most expert in the field. The resulting project, as described in the following sections, is a two-pronged approach of the meeting and data collection. These activities allowed us to capitalize on bringing together many of the best minds who are thinking about data-driven decision making in education, and triangulating data collection activities with the objective of defining what it means to be data literate in educational settings.

6
METHODS AND COMPONENTS OF THE WORK—TRIANGULATION
This project comprised two key activities. The first and primary activity was convening a meeting of diverse stakeholders who are relevant to the field of data-driven decision making. Appendix A contains the agenda for the meeting, and Appendix B contains a list of attendees. As illustrated in Appendix B, attending stakeholders included researchers, professional development providers (in both data and assessment), funders, government representatives, policymakers, and other experts. The meeting was structured to bring these stakeholders together for a day and a half to discuss issues related to data literacy, with an expectation that a common definition of the construct might be reached. The agenda was developed to maximize open discussion, interaction, exchange of ideas, and active participation. The meeting consisted of five full-group sessions. The opening session was intended to provide context and set an objective for the meeting. It contained the only formal presentation. The two following sessions consisted of moderated panels of experts on classroom-level decision making and school and district decision making. Experts were asked structured questions, and a moderator probed for key responses. Following each panel, the discussion was opened to the entire session group for input and reaction. The meeting then dispersed into breakout groups that focused on specific topics, including precursor conditions; data properties; statistical/technical skills and knowledge; assessment/instrument development; instructional decision making; programmatic decision making; and data literacy and school change. Each group was asked to address specific questions. A report-out session, including all of the breakout groups, followed. A second set of breakout groups was then convened, with the objective of bringing together specific stakeholders to discuss common topics. These group categories were funders and policymakers; researchers; professional development providers; and other stakeholders. The final session consisted of another report-out session including all of the breakout groups, followed by discussions of targeted questions. At the end of the meeting, each participant reported what he or she had learned and what next steps he or she believed were needed to move the field along. The data-collection activity consisted of four components, all of which were structured to inform a definition of data literacy. First, the meeting organizers examined materials in the public domain from professional development providers. Second, meeting attendees were asked to provide a definition of data literacy prior to the meeting. As a third component of the meeting, attendees were asked to partake in an activity designed to distinguish between data literacy and assessment literacy. Finally, the conveners examined transcripts from the meeting’s sessions for key insights, issues, and recommendations to inform the emerging data literacy definition.
MATERIALS ANALYSES PURPOSE OF THE TEXT ANALYSES We analyzed selected texts authored and used by professional development providers for in-service trainings on data use, in order to determine the content areas addressed in these materials. The analyses focused on identifying a content framework for the knowledge and skills that educators might develop as they worked through the texts. It identified the relative emphases on speicific skills and knowledge. This framework provides an additional lens for defining data

7
literacy for educators. For example, some texts included measurement or statistical concepts in their materials, whereas others included instructional or pedagogical concepts. In many ways, the text analysis comes closest among the project’s activities to identifying an operational definition of data literacy, as it establishes the potential objectives of educator training in a way that aligns most closely with the development of instruments to measure the relevant knowledge and skills. An operational definition, originally associated with the philosophy of Bridgeman (1959), assigns the meaning of a construct based on the operations that are employed in its measurement. Although this definition is a positivist restriction of the theoretical or conceptual definition of a construct, it is the starting point for the development of measurement instruments. By identifying what the texts typically used in professional development provide in terms of learning opportunities, instrument developers can construct a table of specification of learning outcomes that frame data literacy. METHODOLOGY We started these analyses by polling the professional development providers we knew who offered data literacy training for educators, in order to identify the texts that these providers used or that they knew were used by others. This resulted in a relatively limited list of texts, including those by the following authors:
Nancy Love (Love, Stiles, Mundry, & DiRanna, 2008) Victoria Bernhardt (Bernhardt, 2004; Bernhardt & Hébert, 2011) Stephen White (White, 2011) Ellen Goldring (Goldring & Berends, 2009)
We then identified the terms used to describe the texts by these authors in the Google Scholar search engine, and followed “cited by” links to identify additional texts that also addressed professional development in data literacy. We deliberately omitted from our identification any citations that referenced research on data literacy, as such citations had previously been analyzed in other ways5 in an IES Practice Guide (Hamilton et al., 2009) and in texts6 authored by the first author of this white paper (Mandinach & Honey, 2008; Mandinach & Jackson, 2012). We also searched Google Scholar for books on use of data in schools, published between 2000 and 2012. Our search used the following words and phrases in multiple combinations:
Data-use Data-driven decision making Professional development Classroom Schools Teachers Educators Administrators
5 The IES Practice Guide reviewed the literature in accordance with the standards and criteria laid out by the What Works Clearinghouse.
6 Mandinach and Jackson examined existing frameworks for the cognitive skills identified as part of data literacy.

8
Forty-one book titles and one website on the use of data in schools were located. We then expanded the search to identify texts that might be used in professional development of educators in the use of formative assessments, particularly at the classroom level; this helped us begin to identify the similarities and differences between these texts and those that address data literacy. Our search for books on formative assessment, published between 1995 and 2012, located 35 titles.Of the 76 texts that were identified, a subset of 33 texts was chosen for this analysis. Authors who had multiple texts identified in the literature search were contacted, and they identified the most representative of their texts for this analysis. Because the focus of this analysis was on data literacy, not formative assessment, only six of these texts were included in the analysis. Based on recommendations from multiple professional development providers, we started the analysis with two texts identified as most commonly used. One of these texts (Love et al., 2008) was also recommended by program officers at the National Science Foundation that provided funding for its development. The second text (White, 2011) was selected because of its wide use in professional development settings of which the second author was aware. The texts were initially read by both of us, and a beginning set of constructs was identified by Gummer, the second author of this white paper. All of the texts were annotated with notes about the nature of the content that the text and activities addressed. These annotations were transcribed and organized into two lists. Both researchers worked together to consolidate the two lists into one list that identified the terms and concepts that the two texts had in common and identified any differences in the content they addressed. This list was then organized into unique categories and subcategories to develop a coding framework for use by research associates. Two research associates used the framework to analyze the Love et al. (2008) text; their analysis was then compared to that of the second author to determine degree of match. The content focus categories of the framework were assigned eight superordinate codes: precursor conditions, inquiry process, assessment, data, data analysis, instructional planning, programmatic planning, and understanding research evidence. Each code is associated with a level of subcodes; for instance, the precursor conditions code includes subcodes for school vision, connection to other initiatives, authority, understanding of change process, collaboration, focus on equity, cultural proficiency, school culture, and characteristics of professional development. Appendix C includes the full list of codes and their subcodes; the examples of categories of text assigned to the different codes are described in more detail in the Findings section of this report (page 15). The original spreadsheets used for the analysis of each text included the page numbers on which the concepts and skills represented by the codes were addressed. In order to make the results of the analyses more interpretable, we established a process to ascertain the relative emphases of the texts on the various categories and subcategories of concepts and skills represented by the codes. Table 1 shows our initial correlations between the values assigned for different levels of emphasis and the numbers of pages that addressed a particular concept/skill.

9
Table 1. Initial Values Assigned to Numbers of Pages That Address a Concept/Skill
Extent of Coverage of Concept/Skill Value Mentioned the concept/skill and was up to a full page 1 2–5 pages 2 6–10 pages 3 11–20 pages 4 > 21 pages 5
For these initial analyses of the extent to which a topic was addressed in the texts, we established that a value of 5 would be assigned to the highest level of coverage for that topic that a text would be given. The assignment of a value of 3 indicated a medium level of coverage for that topic, while a value of 1 would be assigned to the lowest level of coverage of a topic. We then consolidated the initial analyses into three levels of high, medium, and low coverage, in order to simplify the summary description of the texts as we sought to provide a description of the distributions of the extent to which the different topics were addressed in each of the texts. Because these analyses were initial and exploratory, we did not seek to quantitatively determine the correlations among the three analyses of the Love et al. (2008) text. The framework developed for the text analysis is based on the content of both of the initial texts examined. Furthermore, the framework lacks sufficient robustness to support a quantitative comparison of raters. In order to produce a more rigorous analysis, the quality of the framework that emerged through this process would have to be validated by an external advisory board and compared to frameworks developed by other researchers. That validation process is beyond the scope of the current award for this work. Similarities and differences in coding were moderated by the primary researchers. Using the framework described above, the remaining 31 texts were coded by the two research associates. They read through the texts and assigned the codes appropriate to the content that was addressed in each of the chapters and appendices of the books. They conducted moderation on four additional texts, and differences in coding were discussed with the second author. We conducted member checks of the codes of the framework and the extent to which we had adequately identified the concepts and skills in a particular text. Seven of the authors of the texts or website responded in time for the discussion of the texts at the conference. Each of the authors consulted indicated that we had adequately identified the concepts and skills they had included, though there were differences between the terminology that we used in the framework and the terminology used in the texts. Displaying the data from these analyses in a manner that captured sufficient information about the content of the texts, without being overwhelming, was challenging. We decided to use two different formats to display the conceptual content areas and skill sets of the texts: the summary table in Appendix C and the color-coded tables in Appendix D. The summary table shows the relative levels of emphasis (high, medium, or low) of each of the subcodes in the different texts.

10
The color-coded tables show the first two or three levels of codes used to ascertain the categories of content foci. CAVEATS The findings from these analyses should be interpreted with significant caveats. The intent of the analyses was not to develop a “consumer’s guide” to professional development programs. Also, we did not set out to compare the ranges of knowledge and skills that each professional development program or publisher addressed. Such an analysis is beyond the scope of this project. It would have required that we examine not only the identified texts from each publisher but multiple other texts that comprise all of the material that each publisher provides to the field. Additionally, we would have had to move beyond examining multiple print materials to also include materials in other media, such as DVDs. A more rigorous analysis would have also required that the emergent framework be vetted not only by the authors of the materials analyzed, but also by an expert panel, through a more systematic validation and moderation process. We would have had to conduct more intensive co-coding and use multiple raters on texts in order to more thoroughly determine consistency. These efforts are also beyond the current scope of work. With these caveats firmly in mind, the analyses of the textual materials do provide another source of data, which we are triangulating with the definitions of data literacy provided by the participants in the workshop and with the discourse during the meeting. Findings from these analyses may also provide the authors of the analyzed materials, and those who receive related professional development, an initial roadmap showing the variability of the various offerings.
DEFINITIONS OF DATA LITERACY As a precursor activity to the meeting, all participants were asked to define data literacy. Participants’ definitions were emailed to the meeting organizers for analysis and presentation. The definitions were then compiled and a Wordle produced. A Wordle is a graphical representation of word frequency, based on relative emphasis and produced from an analysis of Microsoft Word documents by frequency of words and phrases (see Figure 1). The definitions also were cognitively analyzed to discern specific knowledge and skills noted by meeting participants as components of data literacy. A cognitive framework, prevalent in science education research, provides a mechanism to characterize the facets of data literacy. The cognitive framework identifies declarative, schematic, procedural, and strategic knowledge components that need to be addressed to ensure effective use of data by educators. Declarative knowledge involves “knowing that” and includes understanding the language and terminology that pertain to data use. Schematic knowledge involves “knowing why” and includes understanding of the purposes for which different sources of data might be used and the decisions those uses inform. Procedural knowledge involves “knowing how” and includes the understanding of how data are organized and how they might be analyzed to inform a decision. Strategic knowledge involves “knowing when, where, and how” knowledge of data literacy might be applied (Shavelson, Ruiz-Primo, & Wiley, 2005). The cognitive elements of data literacy are not the only components that need to be addressed. As will be described later, a common theme that arose from the meeting was the volitional

11
aspects of a data-literate educator, one who is reflective about practice, continually working to improve the learning experiences of students and actively seeking evidence upon which to base decisions7. The knowledge and skills were then categorized in an attempt to understand how different types of skills and knowledge (e.g., statistical skills, knowledge of data, understanding of measurement) were seen by participants as important to data literacy.
HANDS-ON ACTIVITY We designed a hands-on activity for the meeting participants with two objectives in mind. The first objective was to have the participants distinguish between data literacy and assessment literacy, determining the extent of overlap between the two constructs as well as unique components of each. A second objective was to actively engage the participants in conversation about the distinctions and similarities between data literacy and assessment literacy. During the opening session of the meeting, participants were given two sheets of transparency paper, one labeled “data literacy” and the other labeled “assessment literacy.” Participants were asked to produce a Venn diagram of the overlap between the two constructs. This diagram provided insights into how stakeholders differentiated data literacy and assessment literacy, and the extent of similarities and differences between the two.
TRANSCRIPT ANALYSES Each session of the meeting was audio recorded to ensure an accurate record of participants’ comments and discussion. The audio recordings were transcribed into Microsoft Word documents and checked for accuracy against the recordings. Attributions were attached to statements through voice recognition and notes taken during the meeting. These attributions enabled us to determine if the comments were made by a researcher, professional development provider, funder, stakeholder, or someone else. The attributions were an analytic tool, helping to contextualize the comments. Appendix G, however, provides a summary of the highlighted comments without attribution to protect the identity of the speaker. The end products were transcripts for the five full-group sessions and the 11 breakout sessions. These transcripts were analyzed for key comments made by participants, challenges, contextual issues that affect data literacy and data use, recommendations, and next steps. A list of participants in each breakout session is provided in Appendix A; selected comments from the transcripts are provided in Appendix G.
7 The volitional component was not one we had expected nor was it one identified in the text analyses.

12
FINDINGS
This section reports on the results from the four data collection components of the project. Specific details of portions of the findings are provided in Appendices C through G.
MATERIALS ANALYSES DEFINITIONS OF THE CATEGORIES AND CODES The following sections describe the categories that we have used to describe the concepts and skills addressed by the analyzed professional development materials on data literacy for educators. We recognize that we are potentially contributing to the profusion of terminology in the field and have endeavored to describe concepts and skills in the most general terms we encountered. However, given the influence of the first texts that we examined on the framework we have developed, we will continue to work on the clarification of terminology that can be used to analyze such texts. Precursor Conditions The analyzed texts frequently included—often at the beginning—discussion of the contextual aspects of schools that need to be in place in order to establish and nurture a culture around data; the issue of the context of schools also came up repeatedly in discussions during the meeting. We have labeled these aspects the precursor conditions. These conditions include the need for a common school vision that describes the school’s mission and operating principles, frequently invoking a perspective of enhancing education for all students. The connection to other initiatives was frequently seen as an important issue related to an understanding of the change process that educators need to consider as they use data to inform decisions. The texts also described the need for some consideration of the authority of the group or groups engaging in examining and acting on data, in order to be able to address the issues encountered and to carry out solutions. The initial analyzed text (Love et al., 2008) had a strong focus on equity, as did a few other texts, emphasizing the importance of a vision of education as being inclusive of all learners. This concept was frequently connected to the need for educators to understand and possess skills related to cultural proficiency, i.e., being aware of the influence of culture on learning, instruction, and school practices. School culture is a broad term that texts used to address multiple aspects of the way that schools operate, including issues of preferential treatment of students, safety, and opportunity to learn. The characteristics of professional development were frequently invoked by the texts, at least superficially, to remind readers that professional development needs to be deep, sustained, and connected directly to the work that educators do within the contexts in which they work. Collaboration processes made up a substantive section of most texts. Inquiry Process The process by which educators engage in examining the use of data for multiple purposes was clearly addressed by most of the texts, though more directly in the texts on data use than in those on formative assessment or assessment literacy. This process is most frequently referred to as an inquiry process, a term denoting various cycles of data use that start with examination of data; move on to identification of specific questions of importance, additional data that are needed to more fully understand the issue behind the question, potential causes of the issue, and potential

13
solutions to the issue; and continue with collection of evidence that the issue has been addressed by the identified solutions. Formative assessment texts more frequently started with the identification of an important learning outcome or standard around which probes of student understanding were focused and for which interpretations of student performances were intended. Often interwoven throughout the publications, and frequently included in these inquiry sections of texts, were discussions of the purpose/use of data. Authors generally invoked the need to connect the purpose of data use with the nature and quality of the data being examined, and often provided examples of the appropriate use and misuse of data. Assessment Sections of texts were assigned to this category based on the extent to which the authors addressed the types and processes of different types of assessment and the conditions for them. Most of the texts differentiated between summative and formative assessments, though those distinctions often only included brief descriptions of those types of assessments; texts often cited relevant research synthesis papers that make more detailed distinctions. The texts frequently paid relatively superficial attention to the nature of the data that are obtained through summative assessments, referring most frequently to the data available through state testing efforts or end- of-course examinations conducted at the school level. The texts that addressed data literacy more frequently made relatively superficial reference to formative assessments, again often citing research synthesis literature and other texts that addressed the category in more depth. Data This was the most frequently assigned category and had the greatest number of categories. The term data was defined in multiple ways in the different texts, and the nature of the data that were addressed varied widely. In the formative assessment texts, data most frequently referred to student achievement data. The texts that addressed data literacy tended to have more expansive definitions of what counted as important data. Data access or the process of obtaining data was an important construct in the texts and was associated with a number of subcodes, including discussions of the nature of the data systems¸ processes for how educators engage in accessing or getting into systems, and methods for collecting new data. Some texts addressed this area relatively more superficially, while others rated it as more important and devoted more space to the construct. A focus on data types was also an important aspect of the texts, with data types ranging from demographic data, to surveys that might be constructed by educators intending to use data, to external tests, including both norm-referenced and criterion-referenced assessments. Data types were sometimes distinguished by the types of school or district data that might be available to educators, including district administrative data or data from benchmark or interim assessments. Classroom assessments were frequently identified as an important source of data, and a subcode included the notion that these data sources might be teacher/curriculum designed. The technical quality of data was addressed by some of the texts, though the ways in which this category was covered varied widely and this content was most often addressed superficially. Authors invoked the concept that educators should be concerned about test fairness and recognized concerns about test bias. The timeliness of data for particular decision making processes was frequently identified as a concern and a limiting factor in the utility of data.

14
Concerns about the reliability of data was raised by some authors, but deep discussions of the different aspects of reliability were not addressed. Texts that addressed preparation in the use of data and formative assessment professional development texts both discussed the importance of data alignment to standards and alignment to curriculum. Authors noted that without consideration of such alignment, data did not have sufficient power to inform decisions. The few texts that addressed instrument/test design frequently focused on the importance of domain representation and test structure, though neither the data literacy texts nor the formative assessment texts addressed these issues in depth. Scoring practices were occasionally addressed with relatively simple discussions of the importance of appropriate rubric design and rubric use. Texts addressed data use/sufficiency in various ways and at varied levels. Most frequently invoked was the need for multiple forms and types of data that should be brought to bear in discussing different questions during the inquiry process. The importance of multiple forms of data was occasionally connected to the concept of triangulation as a part of the inquiry process with users employing multiple forms to better understand a question or issue. Authors less frequently explored the sufficiency of data needed in prioritizing/discrimination between options. Data Analysis Texts occasionally addressed the importance of understanding data displays or the skills in developing such displays. These displays include the use of Venn diagrams and other diagrams such as fishbone diagrams. The appropriate use of data displays to support connection of multiple forms of data and to facilitate data analysis was addressed by some of the texts. In multiple texts, the varied types of analysis actions that make up the knowledge and skills that educators need to make sense of data were generally described and occasionally connected to specific examples. These actions include observing patterns, summarizing data, and making comparisons at a number of different levels. The texts differentiated among the different levels for comparisons, including student/student, class/class, school/school, school/district, and school/district/state. Other analysis actions that were identified by the texts include the ability to identify trends and know which analysis levels to address, such as analyzing aggregated data versus data disaggregated based on race (ethnicity), FRL/SES (free or reduced-price lunch or socioeconomic status), and analyzing assessment data at the level of test strand or test item. Both the data use and formative assessment texts provided few opportunities for educators to learn about issues of statistics in data use. The texts most frequently discussed descriptive statistics, including mean, median, mode, and range, though these concepts were only more generally defined rather than specifically addressed in the context of the use of data. The texts invoked relatively superficial discussions about correlation and causation, and the distinction between the two was not deeply addressed. The texts infrequently discussed more nuanced aspects of statistics or data quality in defining effect size, significance, measurement error, sample size, or sampling error. When present, these discussions more frequently focused on the definition of these terms than on how and why these concepts are central to data use and interpretation. The sections of the texts that addressed inferences/interpretations were frequently interwoven with the sections that discussed analysis actions. It was often difficult to ascertain how educators

15
were being directed to move from analysis to the actual use of data to inform decisions. Clearly understanding how to engage in both analysis and use of data are of central importance; however, determining the ways in which the knowledge and skills that are shared or unique to the different processes needs further articulation. These two areas of knowledge and skill were occasionally addressed by a discussion of the use of a logic model or some structured theory of action. Such discussions included the ability to interpret trends, moving beyond the more simple practice of identifying trends. Inferences and interpretations include a variety of sophisticated cognitive actions, such as the following:
Explaining patterns Identifying hypotheses Connecting multiple observations Interpreting performance Conducting causal analysis or root-cause analysis Linking performance to goals/learning objectives (for groups or for individuals) Linking student performance to learning needs Linking student assessment performance patterns to multiple potential causal factors Linking data to instruction
This category of topics within the texts was the most frustrating to analyze, given the importance of being able to articulate the use of data to inform decision making. The language that authors use to describe inferences and interpretations is the most discursive of the categories. Few texts addressed the knowledge and skills needed to make inferences and interpretations in great detail, and this paucity of description may point to another limitation of the analysis of texts as a way to describe professional development related to data literacy knowledge and skills. We conjecture that many processes of inferences and interpretations are explained in additional materials used to supplement the texts (e.g., videos) and during the professional development activities that occur in response to those materials. We would need to analyze those additional materials to test the validity of this conjecture and get a better picture of how this construct is handled. The analysis of such materials is outside the scope of this effort. However, the lack of extended examples of the connection of data to inferences and interpretations in the texts and the relatively low frequency of text associated with this category are a concern for the authors. Instructional and Programmatic Planning We differentiated several decision-making categories in order to address the extent to which the texts provided opportunities to learn about different types of decisions or actions that arise in the inquiry process. These decisions include the subcategories of the need to differentiate instruction for learners, based on their performance and data, as well as decisions based on the role of data as educators plan daily instructional moves for different individuals and for groups of students. The decisions addressed by the texts also include program changes, frequently discussed in general terms and occasionally addressed specifically as curricular changes or schedule changes. As was the case with the category of inferences/interpretations, these constructs were not addressed in most texts with sufficient details or with specific examples. It is not clear whether or not these categories should be collapsed into a smaller number of categories in future analyses.

16
Understand Research/Evidence Categories Analysis of these categories also sought to ascertain the extent to which the texts connected data use to research regarding the potential causes of particular issues that surfaced during the data use/inquiry process. These categories include linking research evidence to student performance, linking research evidence to instructional practices, and linking research evidence to programmatic planning. All of these categories were infrequently referenced in the texts. We highlighted each of them as specific categories because we were especially interested in the extent to which the texts transition from a focus on data structures and data analysis to interpretation and actions. This translation of data to actionable knowledge is a key concern in data literacy. RELATIVE EMPHASES OF TEXTS ON DIFFERENT ANALYSIS CATEGORIES The preceding sections explained the nature of the codes that we used to analyze the texts. What follows is a description of the extent to which the texts addressed the different categories summarized by the codes, which we believe are an initial approximation of the knowledge and skills needed in data literacy. Again, we emphasize that our findings are not meant to be comparative, and we recognize the tentative nature of these findings. Our analysis provided us with an initial framework for describing the information that professional development texts use to provide opportunities for educators to learn about data literacy. The list of topics is not yet exhaustive, as there are sections of the texts that did not coherently fit into the coding structure, so some aspects of the texts remain unexplored. However, we believe that our coding system contains the main categories into which the components of data literacy might be placed. To begin to address the question of how deeply these content topics were addressed, we conducted an analysis of the relative frequency of each of these codes assigned to the categories and subcategories across all of the texts. Again, we emphasize that this analysis is tentative and purely descriptive. We collapsed the five levels of representation described in the Methodology section of this report into four levels, to determine whether coverage was high (3), medium (2), low (1), or not at all (0) for each of the main constructs and their subcodes. This analysis was conducted on 33 of the texts that were considered to most closely address professional development of educators. We then determined the maximum rating that could be assigned to each text, and determined the relative rating of each of the texts on each of the constructs and their subcodes. Table 2 represents the overall findings from this analysis, showing the numbers and percentages of the 33 texts that had at least a low (1) rating in each of the categories and subcategories. Appendix C includes a summary data table for all of the texts in this analysis.

17
Table 2. Subcategory Coverage Across 33 Analyzed Texts
Categories and subcategories
Number of texts with subcategory covered (n = 33)
Percent of texts with subcategory covered (n = 33)
Precursor Conditions School vision 16 48% Connection to other initiatives 20 61% Authority 14 42% Understand change process 17 52% Collaboration 25 76% Focus on equity 17 52% Cultural proficiency 5 15% School culture 18 55% Characteristics of PD 23 70% Inquiry Process Purpose/use 27 82% Assessment Types of processes 24 73% Data Data access—obtaining data 22 67% Data types 29 88% Data quality 25 76% Data use/sufficiency 22 67% Data Analysis Data displays 17 52% Analysis actions 25 76% Statistics 15 45% Inferences/interpretations 29 88% Instructional Planning Differentiate instruction/program 15 45% Plan daily instruction 17 52% Programmatic Planning Program changes 13 39% Understand Research Evidence Link research evidence to student performances 2 6% Link research evidence to instructional practices 9 27% Link research evidence to programmatic planning 5 15% Almost half of the texts addressed the importance of school vision, while more than half discussed the need to connect a focus on data use to other school initiatives. Roughly half of the texts addressed the need to consider having the authority to make the changes that are indicated by the data, to understand the change process, to focus on equity, and to address issues of school culture. Roughly 75 percent of the texts addressed the need for collaboration and the requisite characteristics of effective professional development. Relatively few of the texts addressed the need for cultural proficiency in considering the use of data for decision making. Some form of the inquiry process or problem-solving cycle of using data to surface questions and address them was indicated in more than three-quarters of the texts. As previously discussed, the texts that focused on formative assessment typically did not use this language and instead

18
emphasized the use of standards or learning outcomes to generate questions that structure data use. Roughly 75 percent of the texts addressed some aspects of the types of assessment that would be used to generate data for decision making. Less than 75 percent of the texts contained some references to the processes of obtaining data. A much larger proportion of the texts included a discussion of the types of data that educators need to consider, and data quality was addressed by roughly 75 percent of the texts. Roughly 67 percent of the texts addressed issues of data use/sufficiency. The different aspects of data analysis were addressed at various levels in the texts. More than half of the texts provided some information about data displays, while more than three-quarters discussed some sort of data analysis actions. Issues related to statistics were addressed by less than half of the texts. Considerations of the inferences or interpretations of data use were identified in over three-quarters of the texts. Less than half of the texts provided much information about how educators might use data to differentiate instruction/programs, and roughly half addressed the use of data to plan daily instruction. Using data to inform program changes was addressed by relatively few texts. Perhaps the least well addressed constructs were those that discussed the understanding and use of data and research evidence to inform instructional practices or to make programmatic plans. There was a considerable range in the extent to which the different texts addressed the major constructs. The following subsections discuss, for each of the major categories, the degrees of coverage in the texts and of the subcategories that appeared to have the greatest emphases on those constructs. Appendix C includes an overview of the analysis of construct coverage in each of the texts. Precursor Conditions Across the nine subcategories of the precursor conditions category, one text had the most coverage: five of the nine subcategories had high coverage and eight of nine subcategories had at least low coverage, for a total of 74 percent of the possible coverage of the category. Three other texts also addressed eight of nine subcategories, and two additional texts had at least low coverage across all nine subcategories. Of the nine subcategories, the cultural proficiency subcategory was least present in texts, with only five texts having at least low coverage. This subcategory was one of two subcategories with the second lowest presence, across the 25 total subcategories, of low coverage across texts. Twenty-eight of 33 texts had less than 50 percent of the maximum possible coverage across the nine precursor conditions subcategories. Within this category, the collaboration subcategory had the strongest presence, with at least low coverage indicated in 25 of 33 texts. Inquiry Process Eighty-two percent of the texts (27 of 33) had at least low coverage for the purpose/use subcategory of the inquiry process category. After the data types and inferences/interpretations subcategories, which both had at least low coverage in 88 percent of the texts (29 of 33),

19
purpose/use had the third highest percentage of presence in texts across all 25 subcategories. Of the 27 texts with at least some coverage of this subcategory, 15 of the texts had high coverage. An additional four texts had medium coverage; six texts had no coverage indicated. As previously discussed, texts with no coverage of this category tended to be texts that focused on formative assessment or on statistics. Assessment Fifteen of the 33 texts had high coverage of the types of processes subcategory of the assessment category. An additional nine texts had either low or medium coverage of this subcategory. Data The levels of coverage represented across the four subcategories of the data category varied across texts. The highest overall coverage of this category was found in one text with 92 percent of possible coverage. Fifteen of the 33 texts had at least low coverage across all four subcategories. Twenty-eight texts had between 25 and 75 percent coverage across the four subcategories. The subcategory of data types had at least low coverage in 29 of the 33 texts (88 percent), which was one of the two highest percentages of coverage for subcategories across the texts. Thirteen of these texts had high coverage. Data Analysis Two texts had 83 percent of the possible coverage across the four subcategories of data analysis. An additional nine texts had at least low coverage in each of the subcategories. Twenty-three of the 33 texts had 50 percent or less of possible coverage indicated across the four subcategories. Within the data analysis category, the statistics subcategory was addressed the least across the texts, with only 45 percent of texts having even low coverage. Coverage of the Inferences/interpretations subcategory was found in 29 of the 33 texts (88 percent), one of the two highest percentages of coverage across all 25 subcategories. Eleven of the 29 texts had high coverage of this subcategory. Instructional Planning Of the two subcategories of instructional planning, 15 texts had at least low coverage of the differentiate instruction/program subcategory and 17 texts had at least low coverage of the plan daily instruction subcategory. Fourteen of the 33 texts had coverage indicated for either subcategory. Two texts had medium coverage in each of the subcategories. Programmatic Planning Programmatic planning had one subcategory, program changes; 20 of 33 texts had coverage indicated for this subcategory. Only one text had high coverage of this subcategory, and three texts had medium coverage. Understand Research Evidence The understand research evidence category had minimal coverage in the texts, and the presence of coverage across the three subcategories was less than 50 percent for all texts. Nine of the 33

20
texts had at least low coverage for the subcategory of link research evidence to instructional practices, while link research evidence to student performances was indicated for only two texts. One text had at least low coverage in each of the three subcategories. Another text had high coverage for link research evidence to programmatic planning, and a third text had high coverage for link research evidence to instructional practices. Conclusions These analyses point to some potentially interesting variations among texts that address professional development in data literacy for educators. Clearly there are differences in how thoroughly the different texts address the constructs we identified. There are also differences between the texts that address formative assessment and those that address data use, with differences in processes for teacher inquiry being particularly noteworthy. Although we have not specifically analyzed the different subjects addressed by these two types of texts, our initial examination suggests that assessment texts focus more clearly on the nature of the instruments and processes used to gather evidence or data from students.
DEFINITIONS OF DATA LITERACY Prior to the meeting, attendees submitted definitions of data literacy, which we used to determine how the experts conceptualized the construct. These definitions were quite varied in terms of their characteristics: some were quite thoughtful and philosophical, and some were quite lengthy and detailed, whereas others were less considered. Some definitions identified specific knowledge and skills, while other definitions approached the construct in a more comprehensive and systemic manner. For example, several attendees highlighted a major issue pertaining to all forms of literacy: the need to understand the continuum of literacy from basic to advanced. These attendees queried what levels of skills and knowledge need to be identified along that continuum. At the meeting, questions arose about what “complete data fluency” or “complete data literacy” is and what the appropriate level of competency is for an individual to be considered data literate. Attendees also highlighted the complex nature of issues surrounding data literacy, as illustrated in the comments of one attendee:
At the state department and college/university levels, we are doing a damn lousy job of teaching data literacy. Too few states demand courses on testing and measurement. Too few colleges have those courses taught (when taught at all) by people who could plausibly be described as psychometrically competent. We spend too much time on the statistics of data and too little on [. . .] “how to make constructive use of data” and the ethics of data gathering and use.
Participants’ definitions of data literacy reflected many different perspectives, yet encompassed the myriad knowledge and skills that make up data literacy. Language about similar skills often differed, making it challenging to discern whether the skills described are truly parallel or slightly different. Figure 1 is a graphical representation of an analysis of the most common terminology used in participants’ definitions. This graphical representation, known as a Wordle, illustrates the

21
relative emphasis of words used in the definitions. Appendix E lists specific skills identified in the definitions and notes the frequency with which these skills were mentioned by members of specific stakeholder groups. Figure 1. Wordle for Pre-Meeting Definitions
For ease of reporting, our analysis of data literacy definitions is discussed in terms of four categories of focus. PROBLEM FOCUS The first category focuses on how educators identify the problem, topics, issues, or questions that they will use in what was termed, the data process. Schematic, strategic, and procedural knowledge and skills needed in this category include knowing how to frame questions, understanding the purposes of the inquiry, identifying problems of practice, and understanding the context in which a decision will be made. These skills help the data user frame and contextualize why data are being used and focus on the objective of the inquiry process. DATA FOCUS The second category incorporates the many sets of schematic, strategic, and procedural knowledge and skills that involve how educators actually use data. One skill set includes knowing where to find data and knowing how to access these data. Educators also need to know how to generate and collect data, not just how to access them, as well as how to identify and select the right data that are aligned to specific and intended purposes. A related skill involves being able to identify and know what data are actionable. At the same time, educators must know when to use quantitative versus qualitative data and must be able to understand differences across various kinds of measures, such as summative, formative, and diagnostic assessments.

22
Within this category of focus, data literacy also entails understanding differences in grain size (e.g., cohorts, courses, and grades) and reporting levels (e.g., scaled scores, percentiles, and performance levels). Understanding uses of data quality (e.g., accuracy, completeness) and data limitations is also key. Participants identified a host of data manipulation skills as important. Once data have been collected, generated, or accessed, educators need to know how to organize, summarize or synthesize, prioritize, and manipulate the data before they are analyzed. Further, educators need to understand how to troubleshoot problematic data as needed, including being able to diagnose out-of-range, inaccurate, incomplete, or unreliable data. Data skills identified by participants also include the ability to identify and understand patterns and trends yielded from analyses. Additionally, participants observed that educators should recognize the importance of using multiple sources of data and determine when it is necessary to acquire more data or information. Finally, educators should understand when it is necessary to drill down to more finely grained levels of data, such as items rather than total scores. PROCESS FOCUS The third category relates to the processes by which data are used to inform decisions. Participants stressed the importance of collaboration to improve the use of data. This is often referred to as collaborative inquiry (Love et al., 2008). Participants indicated that educators need to engage in an inquiry cycle as part of data-driven decision making, and that, moreover, this inquiry process is about being able to transform data into actionable knowledge. Educators must understand the sequence of steps needed, starting with generating hypotheses and being able to think critically and solve problems; they also must be able to test assumptions (either to support or refute them) and critique arguments. Educators should be able to probe for causality, linking actions to outcomes. With regard to outcomes, educators need to know how to evaluate situations and impact; correspondingly, they should understand consequences, both intended and unintended, from those outcomes. Educators must also understand how to implement decisions and make and apply interpretations based on the outcomes. This means knowing how to make inferences, draw conclusions, and use the findings in their practice, oftentimes unpacking a vast amount of information. A final set of process skills relates to technology to support data-driven decision making. Given the proliferation of data, participants noted that technological tools can help educators to use data effectively. They identified the need to understand how to use data systems, tools, and applications. Correspondingly, educators also need to understand data displays and data reporting that are generated from various technologies (e.g., data warehouses, assessment systems, instructional management systems). DISCIPLINARY, TOPICAL, DISPOSITIONAL, AND OTHER KNOWLEDGE The fourth category consists of a collection of important skills that generally do not fall into the three other categories. This category includes disciplinary knowledge, proclivity to use data, knowledge of related fields, and involvement of other potential users and stakeholders.

23
One of the primary issues in the field is that data literacy involves more than knowledge of data. It must be aligned with a teacher’s ability to use pedagogical content knowledge (Shulman, 1986) and transform the data into instructional action, often referred to as instructional decision making (Means et al., 2011) or pedagogical data literacy (Mandinach, 2012). Teachers need to know how the data can be used to inform instructional adjustments, at both the whole-class level and the individual student level. Relatedly, particular administrative knowledge must be drawn upon by principals, superintendents, and other leaders when making decisions. Participants reported a number of related skills from the fields of statistics and measurement as part of their definitions of data literacy. However, there was some disagreement among the participants about whether educators actually need to know statistics and measurement, and, if they do, which skills, and how advanced the knowledge should be. Most participants agreed that educators do not need to be statisticians or psychometricians, but they do need some level of understanding of related concepts. They also need some fluency in how to develop assessments and understand the purposes of different kinds of measures. Another composite of knowledge identified by the participants—that is, that data literacy is a habit of mind, and involves a proclivity to use data— is more dispositional. Educators should have a disposition toward data-driven decision making. According to the participants, they also should believe that data can be effective tools to inform their practice. Participants recognized that such a model is personal and deeply engrained in educators’ styles of practice. Other skills in this category include involving students in the data process, one of the recommendations discussed in an IES Practice Guide (Hamilton et al., 2009); involving other stakeholders, such as parents, school boards, and the community; and knowing how to use research findings to inform practice and how to use data in an ethical manner.
HANDS-ON ACTIVITY A hands-on activity was used during the meeting to determine the commonalities and differences between data literacy and assessment literacy, given that the professional community and other stakeholders often conflate the two constructs. We received 24 depictions of the relationship between data literacy and assessment literacy from participants, which can be essentially summarized in three diagrams (shown in Appendix F). Three depictions were similar to, but slightly different from, one of the three summary diagrams. The first diagram shown in Appendix F illustrates that there is a small amount of overlap between the constructs and a great deal of uniqueness in each. Five participants (21 percent) characterized the relationship in this way. These participants did not provide an indication of what might be contained in the unique areas. Another participant basically drew the same model but added another circle that identified content knowledge as another important component. This participant drew overlap between content knowledge and data literacy, but not between content knowledge and assessment literacy, perhaps indicating that content knowledge impacts only data literacy and not assessment literacy. This indicates that 25 percent of the participants believed that there is some overlap between the two constructs, but that the constructs also have substantial unique components.

24
The second diagram in Appendix F shows significant overlap between the two constructs. One circle is assessment literacy and the other is data literacy, with only a small sliver of unique area. Five (21 percent) of the participants depicted this model. One of them annotated the model by indicating that there are unique aspects to data literacy that do not involve assessment data. This individual was taking a broad view of the complete range of possible data. The final depiction in Appendix F was the most prevalent, with 13 (54 percent) of the participants indicating that the construct of assessment literacy is subsumed within the construct of data literacy. However, the respondents used differing sizes to show how large a component of data literacy they believed assessment literacy to be. The depictions included assessment literacy as one-quarter, as one-third, and as half of the construct of data literacy. One individual indicated that data literacy was the foundational skill set of a multidimensional model, with assessment literacy depicted as two pillars extending from data literacy. Another participant labeled assessment literacy as a specialized skill set that is part of the broader construct of data literacy.
TRANSCRIPT ANALYSES The analyses of the meeting transcripts provided additional information on a number of components of data literacy. This information relates directly to the core of knowledge and skills that make up data literacy. It also describes understandings about the contextual surroundings of the educational environment in which data use is situated. As discussed at the beginning of this white paper, it is difficult to separate out those sets of knowledge and skills that apply directly to data literacy from those that are needed in more general education contexts. This section individually addresses each of the components of data literacy that were identified during the meeting, noting issues that influence the components as well as challenges of the components. It also includes analyses of gaps in knowledge within some of the components. The topics of each section have been extracted directly from the transcripts of the meeting. Appendix G provides a compilation of related comments made by the meeting attendees, organized by topic. In most instances, the comments in Appendix G represent direct quotes; less frequently, they are distilled from comments made by several participants. In all instances, the comments are objectively reported, staying as close as possible to the language used in the original discourse. It is important to note the extent to which the topics identified in this section and in Appendix G overlap across the stakeholder groups represented by the attendees. This shows the interconnected nature of the field and suggests that promoting the effective use of data will require a systemic perspective. For example, one of the main outcomes of the meeting was the explicit recognition that, although all meeting attendees are working in the area of data-driven decision making, their perspectives are diverse, their messaging is distinct, and there is limited cross-fertilization among the stakeholder groups. There is a need for a common language with which to discuss data use so that researchers, professional development providers, policymakers, technology developers, funders, state and local education officials, and others can communicate with a shared understanding. DATA LITERACY Data literacy is multifaceted. It is role-based, and it interacts with content knowledge as well as with assessment, developmental, pedagogical, and administrative knowledge. It is important for

25
the field to have a conceptual or theoretical model for data literacy and data-driven decision making. A number of models currently exist for data-driven decision making (Abbott, 2008; Easton, 2009; Hamilton et al., 2009; Ikemoto & Marsh, 2007; Mandinach et al., 2008; Means et al., 2010). Some models (Mandinach et al., 2008; Means et al., 2010) provide insights into some of the related skills and knowledge that educators need. However, the field currently lacks a comprehensive framework that specifically focuses on data literacy. Such a framework will help the field to identify professional development needs, build a research agenda, and create a funding stream. The following issues summarize the discourse about the development of a framework for data literacy:
The meeting participants were unanimous in their agreement on the need to provide conceptual and operational frameworks related to what it means for educators to be data literate. They recognized that, although their language differed, they agreed on 95 percent of the elements of data literacy. However, variations in terminology made these agreements difficult to ascertain. The remaining 5 percent of disagreement was seen as having the potential to inform each participant’s perspective.
Achieving these conceptual and operational frameworks of data literacy has the potential to influence the field in a number of ways:
o The development or modification of professional development models that support turning data into actionable knowledge;
o The ways in which data concepts are introduced or integrated into educator preparation courses;
o The development of a shared research agenda; o The funding of research and development projects that are intended to inform new
resources, models, tools, and data systems; o The ways in which policymakers view data-driven decision making, thereby
influencing licensure and certification practices; o The hiring practices of educators; and o The development of assessments and other measurement instruments based on
specific competencies, skills, and knowledge that educators need in order to be considered data literate.
Participants also agreed that data literacy involves a continuum from basic to advanced proficiency. The levels of this continuum need to be defined in order to understand what a minimum or basic level of competency with data entails (i.e., how data literate educators need to be in order to be good teachers or administrators). The field also needs to understand what it means to have advanced proficiency. The extent to which educators at all levels need to be good consumers of data, in contrast to those having a deep understanding of the technical aspects of data quality and generation, is unclear.
Data literacy is nested within multiple other spheres of knowledge and skills that educators need, including content, developmental, pedagogical, assessment, and administrative literacy. The relationships among these spheres are complex, and the participants found that discussions of data literacy frequently overlapped with discussions of other domains of literacy.
The role-based aspects of data literacy were an important issue to which the participants returned iteratively across the meeting. Clearly, different stakeholders in education have

26
different decision making needs. Characterizing the requisite knowledge and skills needed for each of these stakeholders to make decisions will inform the frameworks of data literacy.
ORGANIZATIONAL FACTORS The systemic nature of data literacy was a theme that arose repeatedly across the meeting sessions. Participants recognized that significantly increasing the use of evidence for decision making in educational organizations is an extremely complex and highly systemic endeavor, with interrelated components and multiple stakeholders. Data literacy as an educational practice has strong policy drivers, but policy alone is not a sufficient lever to influence the translation of data to evidence that supports decision making at all levels of education (e.g., local, state, and federal). Participants identified a strong need to identify the levers for stimulating change with respect to the components of the enculturation of data literacy and of bringing effective use of data to scale. It is also necessary to understand how effective data use intersects with the components, structures, supports, complexities, and relatedness of the system in which the data are being used. Following is a summary of meeting discussions on the theme of systemic organizational factors. These issues are essential in identifying the levers of change needed for establishing and enculturating data-driven decision making within educational systems and bringing it to scale.
Components o A number of important components that make data use possible have appeared in
the literature (Hamilton et al, 2009) and were mentioned by participants. One component is students, who are often omitted from discussion of data use. Participants made clear that students must be part of this discussion. Hamilton et al. (2009) list as one of their five recommendations that students should become their own data-driven decision-makers.
o Participants also emphasized that the field needs to consider the conditions that enable data use and how those conditions play out in schools. Those conditions might include allocation of time devoted to data teaming or to helping teachers to navigate issues related to pacing guides and time constraints.
o Participants noted that it is important to be explicit about describing the data competencies, skills, and knowledge that educators need. Such explicitness will help districts strive toward meeting those educator needs.
o Participants acknowledged the importance of leadership in data use. It is critical for leadership to create a vision for data use (Hamilton et al., 2009) and to communicate it to staff. That vision provides the rationale for acquiring data literacy and using data to inform practice.
o Districts need to have accessible and relevant data systems, tools, and applications that are add value and useful for end users.
Structures o Participants noted the many organizational influences that affect the
implementation of data use. It is important to understand and consider the contexts and precursor conditions that facilitate data literacy.

27
Supports and Barriers o Data-driven decision making is systemic and important because of the decision-
making process, the allocation of resources and the ultimate decision makers in an educational agency. It impacts professional development opportunities, released or shared planning time in schools, the extent of data teaming and data leadership, the availability of data coaches, the establishment of a data culture, and provision of a data system and related tools. The field needs to explore the structures, processes, and barriers to implementation of data use for both teachers and principals. For example:
The field needs to understand how to handle district and educator resistance to data use, data literacy, and the change process. There needs to be recognition that, even if a district seeks to change, the process can be challenging.
The field also needs to understand the policy and system levers and incentives that will make a difference in stimulating change.
o Participants recognized that value and utility are related. Data use must be valued and communicated to educators, and educators need to recognize and observe the utility of data pertaining to their practice.
o Participants raised issues related to how hiring practices can influence the degree to which schools and districts have staff with data literacy. The field must address how the instructional arms of districts can become involved in hiring decisions so that data literacy comes to the fore. Districts must determine the role that data literacy plays in hiring practices (e.g., the core competencies candidates are expected to have).
Relatedness o Participants raised the issue of where data literacy and data use fit into schools
and districts as learning organizations, and how they relate to other school and district practices and policies.
Complexities o Participants asked whether data are being used appropriately for the intended
purposes. Educational agencies need to ensure ethical practices around data use, and consider how they can be created, sustained, and taught.
o Participants noted that data use needs to become a normal and regular part of educators’ practice. It should be an integrated component of practice, rather than an isolated event, and it should be part of a culture of data use.
DATA PROPERTIES A third key theme to which the participants returned iteratively during the meeting was the important role data properties play in supporting utility and interpretability. The data that educators are being asked to use must make sense to them, and they must perceive that there is a valid and understandable rationale for the purposes for which the data are being used and for how the data are interpreted. Validity does not necessarily reside in the data or the instruments per se; validity resides in the interpretations of the data. The following themes summarize the issues related to educators’ need for valid data:

28
A fundamental principle in data literacy is that there are different data, different purposes, and different users. The same data will have different meanings and be used for different purposes, depending on the role of the end user. Different data are needed by educators with different roles. Thus, there is a need for educators to understand the many different kinds of data and data use and the target audiences; also, the properties of the data or information need to be well articulated for each audience.
Educators need to understand a full range of data types and sources. Data include more than assessments or quantitative measurements; the conceptualization of data needs to be expanded to include qualitative data as well. Educators need to understand formal and informal, local, formative, diagnostic, and attendance, health, attitudinal, efficacy, behavioral, and other types and sources of data that can inform decision making.
Data collection needs to make sense, have a purpose, have relevance, and have utility in terms of supporting the translation from data to action. Educators need to understand why they are being asked to collect or use the data. It is imperative that the data given to educators align with and address the questions the educators are being asked to consider. Similarly, the data currently available to educators, particularly in statewide longitudinal data systems and local data systems, must meet educators’ needs, and types of available data must be expanded beyond accountability data.
The data and the systems within which educators use data need to be manageable and support the contexts in which they work. They need to provide data that is actionable, accessible, timely, and useful for educator needs. Educators need to understand what these systems can and cannot do and how to most effectively use them.
PROFESSIONAL DEVELOPMENT All of the participants indicated that professional development is central to building human capacity to use data. They recognized that educators who have different roles in teaching and administration have different professional development needs. They also indicated that role-based aspects of data literacy evolve over time and therefore may require different training strategies. Participants identified a wide range of professional development knowledge and skills that both educators and those who provide their professional development need to know and be able to use. Perhaps one of the most surprising findings of the meeting was the professional developers’ lack of familiarity with other models of training provided in the use of data in education. The following issues arose in the multiple discussions of professional development:
Participants wondered how professional development based on a common definition of data literacy should inform teacher and administrator preparation programs. They questioned whether it was better to address elements of data literacy during pre-service programs or to wait until educators are working within the system to introduce data literacy knowledge and practice into professional development.
The question of whether it is viable to have one model or platform or many competing models was raised. Participants recommended a common language and definition of data literacy applied across models, across platforms, as a form of USB (that is, a one-size fits all device or mechanism) for professional development. This common language and definition would support systematic and in-depth examination of the essential elements, commonalities, and differences across models. From there, resources could be developed

29
around the commonalities. Participants also felt that there needs to be a market analysis and comparison of the existing professional development models. Such an analysis would:
o Provide a synthesis of the models and their materials, theories of change, and expected impacts;
o Support the development of measures to show the extent to which data literacy was developed using the models; and
o Offer an objective comparison of the models that would support ascertaining what training is available and for whom it is intended.
Participants indicated that there is a need to pay attention to the development of teachers, depending on where they are in their careers. They agreed that it is unreasonable to expect certain skills and knowledge from beginning teachers. For example, beginning teachers may not have sufficient experience aligning appropriate instructional strategies with specific learning deficits identified in the data. Further, teachers are expected to be lifelong learners, and incorporating data-driven practices is an important addition to their developing expertise. An understanding of teacher development is crucial for supporting the development of data literacy knowledge and skills.
Participants also recognized that the data literacy field could benefit from understanding how professional development providers adopt and adapt models, and from determining the minimum level of training that is viable and that can yield evidence of the impact of data use practices on student learning.
There was a recommendation that data literacy and assessment literacy training be integrated. Participants were not in total agreement, but a number of them stated that assessment literacy should be subsumed within the broader conceptualization of data literacy training.
Gaps in Professional Development Listening to professional development providers describe their offerings, it became clear that there are gaps in what is being provided. The participants acknowledged that professional development providers need to expand their models to incorporate training for a diversity of educators and stakeholders—including superintendents, district office staff, and school board members, not just teachers and perhaps principals. At the state level, there is a need to educate legislators about the data inquiry process. Gaps also exist in the professional development that is provided to educators during their pre-service and subsequent formal training experiences. Participants suggested that as schools of education consider developing courses on data-driven decision making or integrating data concepts into teacher and administrator courses, institutions of higher education can benefit from the experiences of the professional development providers. Moreover, the field needs to consider how to scale professional development, because many schools and districts cannot afford the providers’ full models and therefore may rely on internal mechanisms for training their staff. Sustainability—how districts take ownership of the enculturation of data use once a training has concluded—is also a major issue, and a systemic problem, for schools and districts that have engaged professional development providers.

30
Another gap in the field’s knowledge about data literacy is when it is best to provide training to educators. This topic affects professional development by identifying when to introduce data literacy to educators. This relates to the developmental continuum, from pre-service to novice teacher to experienced educator. One participant posited that educators should enter the profession as a “tabula rasa” and become trained on the job; that is, that educators best begin with no knowledge of data literacy and then gain the skills and knowledge through experience and training while on the job. Others indicated that educators should experience opportunities to develop data literacy throughout their professional preparation. How professional development providers communicate to practitioners that learning about data is an ongoing process remains in question. As one participant stated, if data use is approached as an event as opposed to a continuous process, educators are not using data effectively. Similarly, data literacy training cannot be accomplished in a one- or two-hour in-service session; becoming data literate takes a more substantial investment of time. BEST PRACTICES AND MODELS As the professional development experts shared elements of their models, they recognized that they engaged the educators in many of the same experiences and activities during their training sessions. However, the language that both groups used to talk about those elements differed, as does the comprehensiveness of a number of the models. This observation is supported by the analysis of the data literacy training texts. Among the models of professional development, it may be possible to extract best practices from the field and begin to understand the key elements that each provider espouses. It may be also be possible to triangulate these best practices into a singular model that incorporates the best of the field, but also allows for customization. The following issues emerged from the multiple meeting sessions on best practices and models:
It is important to systematically identify and disseminate similarities and variability in the different models of professional development and practice, so that both providers and consumers become aware of the various options. Participants differed on whether selecting one common model of professional development is a positive idea, and they questioned whether it is preferable to encourage multiple models that ensure customization to local contexts, but they agreed that knowledge of the various options that are available is important for educators to have.
The articulation of best practices in professional development is both necessary and challenging to accomplish. A component of this issue is the extent to which the efficacy of models of professional development can be ascertained. A second component of this issue is the extent to which models of professional development are replicable and scalable across varying district contexts at differing stages of maturity with respect to data use.
STAKEHOLDERS AND ROLE-BASED ISSUES Participants recognized that much of the focus around data use has been on teachers’ use of data to inform instructional practice. This is a major component of data use, but it is not the only one. Other educators, including principals, curriculum supervisors, guidance counselors, superintendents, and staff at state educational agencies, must also use data. While the issues that surround teachers’ use of data and their acquisition of data literacy are important, participants

31
indicated that it is equally important for the field to gain a better understanding of the role-based nature of defining data literacy for other end users. This role-based nature has significant importance for the identification of the specific knowledge and skills different types of educators need. The following issues arose in the multiple discussions of the theme of stakeholders and their roles:
Participants indicated that the roles of different stakeholders determine how they use the data; the extent to which different roles influence data use strategies; and the kinds of training needed to improve data literacy. Data use is contextual; some groups may simply need to be consumers of distilled information whereas others may need to be data users. To address these issues, the field needs to understand what, on the subject of data use, is being asked of different groups of educators.
Because of potential differences among stakeholder groups, the participants questioned the influence of content expertise, pedagogical content knowledge, and administrative skills of educators in different content areas and at different levels of a school system. All of these are complex areas of educator knowledge and skills and will need to be examined based on roles and across multiple stakeholder groups.
The participants raised the topic of the situational aspects of educators’ work and how they may impact different stakeholders’ use of data. For example, superintendents may defer to the advice of colleagues or to political expedience rather than hard evidence, and teachers may defer to the way they want to teach or to gut feelings rather than engaging in evidence-based practices. Regardless of their roles, educators must reflect on practice and make intelligent use of data.
SCHOOLS OF EDUCATION AND INSTITUTIONS OF HIGHER EDUCATION Participants recognized the role that schools of education have in building educators’ capacity to use data. The relationships between what professional development providers do and what institutions of higher education can support are not clear. Determining what are the appropriate early experiences for future teachers and administrators will help clarify those roles, as will figuring out how to embed educators’ continuing education experiences into the data terrain of schools and districts. The following issues around the theme of the role of schools of education in the development of data-literate educators emerged:
Participants clearly indicated that higher education must play an important role in preparing educators to use data, but they acknowledged that preparation programs for teachers and administrators cannot be expected “to do it all.” It was not clear whether schools of education have faculty with the requisite experiences, knowledge, and skills to support the development of data literacy in educators.
Participants encouraged the linking of higher education to the professional development community in terms of preparing educators to use data. Institutions of higher education could capitalize on virtual courses and provide outreach, continuing education credit, and courses via the Internet. Partnerships with professional development providers would provide much needed resources for schools of education.
Participants questioned how schools of education can be held accountable.

32
State credentialing and licensure agencies and professional organizations were also seen as important partners for schools of education to leverage and affect change.
Other forms of support and accountability in terms of preparing educators to use data effectively might come from partnering institutes of higher education more closely with nearby districts that ultimately employ their graduates.
Participants questioned whether there was a disconnect in the expectations of higher education, between what data skills teachers and administrators need as they enter the profession and what districts and schools feel they need.
Participants acknowledged that having stand-alone courses on data-driven decision making may not be the most effective means by which to build human capacity. Instead, the concepts around data use should be threaded throughout preparation programs, perhaps through an integrated suite of courses. Modifying existing courses in order to integrate a more systematic focus was seen as important.
Participants recognized that courses or other data literacy experiences should be based on real-world experience, thereby connecting learning about data literacy with the practice of data use. The experiences should be situational and content based.
STATE EDUCATION AGENCIES AND POLICYMAKERS Participants were concerned about the role of state education agencies and the state credentialing agencies in emphasizing the importance of data literacy. Participants felt that one way to leverage these organizations’ influence is to require all educators to show capacity to use data in their practice. The following issues emerged during the discussions of the important role of state education and credentialing agencies:
Participants recognized that educators who are in leadership positions in state education agencies may not have a current understanding of the potential and the role of educational data to inform different levels of decisions. There is evidence that focus on data literacy differs across states. Participants were unclear on how to bring about changes in state education agencies’ focus on data literacy.
Participants questioned the extent to which states require evidence of data literacy as part of the credentialing process. This was connected to the discussion of the need for additional instrumentation to develop such evidence in that there needs to be sound measures of data literacy if the construct is to be part of the processes for obtaining credentials and licenses.
Participants raised the issue of the relationship between data collected for accountability purposes and data collected to improve student achievement, and whether this relationship was well articulated in state education policies.
In general, current policy and regulations related to data literacy are not well understood. Additional information, beyond that currently collected in the annual survey conducted by the Data Quality Campaign (2012), is needed. The implications of changing state requirements for data literacy prior to licensing and certification need to be examined.
Participants identified the need for accountability measures for teacher preparation, which would hold schools of education responsible for producing educators who are considered data literate. One of the only ways to hold institutions accountable is if state

33
education agencies and credentialing and licensure agencies incorporate data literacy into their required skills and competencies.
Gaps in Policymaking Policymakers at both the state and federal levels need to move beyond rhetoric to action about the need for educators to become data literate. Despite best intentions, little is being done in a comprehensive manner at the state and federal levels to help educators acquire the skills and knowledge to use data effectively. Current efforts are sporadic. The Regional Education Laboratories (RELs), through their research alliances, are trying to improve capacity for data literacy, but these efforts are limited in scope and content because the alliances can reach only a small number of educators within states and regions. The Comprehensive Centers have a data-based decision making component as one of their seven priority areas, but, again, their efforts are not sufficiently broad in scope. Federal policymakers, in conjunction with state policymakers, may be able to bring about change by helping state education agencies to incorporate policies, practices, and regulations in which data literacy is a key element. As previously noted, one possible approach is for state accreditation and licensure agencies to include data literacy as a requirement. According to the Data Quality Campaign (2012), few states currently have such requirements for teachers, principals, and superintendents. Over time, there has been little improvement in the implementation of requirements. There is still a need to identify the levers of change to enculturate data literacy on a broad scale. The notion of systemic change is central to this effort. Policymakers need to begin to explore how such change can be facilitated and sustained. STATEWIDE LONGITUDINAL DATA SYSTEMS Statewide longitudinal data systems (SLDSs) are the primary repositories of educational data. However, the data that reside in these systems are primarily for accountability and reporting purposes. Although they are not sufficiently aligned with local needs to inform instructional decision making, the SLDSs play a major role in the landscape of educational decision making. The following issues were identified as relevant to the SLDSs:
There is a growing recognition that the SLDSs do not provide locally relevant data. There needs to be an exploration of the role the SLDSs might play in providing better and more relevant data to local education agencies (LEAs), and whether this role is even possible. From a district perspective, data systems must be able to supply locally and instructionally relevant data, which the SLDSs do not currently do. This issue relates to the knowledge and skills that educators need to develop in order to identify useful and relevant data.
State policymakers need to understand that there are more types and forms of data than those currently in their SLDSs.
A question arose about how to position the SLDSs to make the data useful for different users, given that the data typically have been for accountability and compliance. These users might include LEAs, legislators, policymakers, parents, students, researchers, and the media. The data must have relevance and utility for all stakeholder groups.

34
There needs to be an exploration of state and federal data standards because they determine which data are collected and how the data elements are defined.
TECHNOLOGIES AND SUPPORTING RESOURCES AND TOOLS Increasingly sophisticated technology was seen as both an asset and a possible challenge in supporting the use of data in educational decision making. Participants were clear that the SLDSs’ lack of alignment to local and instructional use makes them of limited benefit to LEAs. Participants also indicated that other technologies, tools, and resources are needed to assist districts and schools. In particular, they identified the promise of emerging technologies in helping classroom teachers to make instructional decisions. The following issues were identified as relevant to the theme of emerging technologies:
Participants indicated that data systems (state and local) must become more locally relevant, containing data that will help inform local administrative and instructional decisions. These data systems should include innovative data displays, data dashboards, and reports that benefit end users. Implementing dashboards, such as those used by Khan Academy, can provide real-time instructional data. The production of a video on data use (such as Khan Academy’s) is seen as a valuable resource for educators.
Participants also questioned the utility of many of the data systems that are currently being sold to schools and districts. Systems may have many flashy components, but their complexity might impair their actual use.
The question of what kinds of resources teachers need arose. Participants felt that the array of tasks, tools, and blended sets of resources that are linked to communities of practice needs to be richer. These resources need to be available to all educators, perhaps through an online community repository.
The technologies that are available for collecting and managing classroom-level information that emerges from student engagement in various learning environments (e.g., virtual, out-of-school) need to be expanded and made more practical for classroom use. New and different assessment resources need to be developed and provided to educators.
RESEARCH All of the meeting participants contributed energetically to the discussion of the research issues related to data literacy for educators. The discourse focused iteratively on the research agenda in the field of data literacy and on appropriate designs and methods for conducting such research. The value of having a strong slate of practitioners among the participants was a continual focus on the alignment and intersection of research with practice. Participants indicated that the context for research on data literacy is very rich, with policy-driven practice ahead of research and multiple variations in how data are being used in education to inform a rich, complex, and interconnected research terrain. The ubiquitous need for evidence of the effectiveness of interventions or practices means that research on data use may incorporated into effectiveness studies. In addition, participants had a caveat about using student achievement data in simplistic models to directly measure the impact of increasing educator data use. The causal models by which data use influences student outcomes are complex, with multiple intermediary variables. The research agenda must seek to understand the natures of and relationships among these

35
intermediary variables, as well as simple outcomes. In the field of data literacy, there are many precursor, contextual, and implementation questions that may fall through the cracks. This is a complex issue, which gave rise to the following comments during the meeting:
Participants indicated that, as the conceptual and operational definition of data literacy becomes more sophisticated and articulated, the research agenda around data literacy needs to be more clearly identified. The question of how researchers and practitioners in the field of data literacy build a knowledge base and improve the level of evidence arose multiple times. Having an operational definition can provide the framework and grounding for the research and development agenda.
The intersection of research and practice in data literacy is a wide area that includes research in multiple settings, from classrooms to state educational agencies. Participants recognized the need for research to be intentional and focused on how to move the field forward with actionable outcomes. Integrated research needs to be focused on how data are made usable by practitioners across a range of models of professional development support.
Researchers should focus on selecting a few promising studies that could populate an evidence base and provide examples of best practice and indications of changes to management processes. It would be helpful for the field to see examples of what has been deemed to “work,” based on the research.
The question of shared lessons from the amassed studies arose. This question goes well beyond the scope of the IES Practice Guide (Hamilton et al., 2009), which only reported on studies that met the What Works Clearinghouse criteria (Institute of Education Sciences, n.d.). A meta-analysis of current research and development studies in the field could be conducted to examine the impact of data use on educational practices. The collection of these studies could then be used to frame what the field knows about data literacy. Such a meta-analysis may be more inclusive than the IES Practice Guide, because that document was published three years ago, and many informative studies were omitted.
In terms of methodology, many participants believe that the only acceptable method to show the causal link between data use and student performance is a randomized controlled trial, the gold standard of experimentation. However, the practicality and feasibility of such a method, either for answering questions about student performance or for programmatic decision making, must be questioned. While some experts maintain that experimental design is the only acceptable method, others believe that quasi-experimental studies, correlational studies, case studies, and implementation studies should be conducted, depending upon the questions being addressed to inform the field and contribute to an informative and useful portfolio of research studies.
The participants identified multiple research foci and design and implementation issues, including the following:
o The tools, instruments, and methods for future studies; o Methods to determine how to address the issue of fidelity of implementation; o Designs and methodology to focus on the systemic complexities of implementing
data use in education; and

36
o Methods for scaling interventions, studying the scaling process, and exploring how to decrease the scaling cycle (that is, taking less time to apply the research findings in other sites).
Gaps in Research Knowledge Based on these findings, we were able to identify specific gaps in the field’s knowledge that pertain to research. There is much that the research field does not currently know about data literacy and data-driven decision making, and as described in the preceding section and in Appendix G, there is a long list of topics that experts recommend addressing. For example, once the field identifies what data literacy is (i.e., how the construct is defined and what specific skills and knowledge are tied to it), developing psychometrically sound instruments to measure the construct is key. A second identified issue is determining how to measure the impact of data-literate educators. Whether improved student performance alone is the correct measure of impact is unclear. To address this issue, the field needs to develop a logic model that describes the acquisition of data literacy and its potential effects. Related to this issue is improving understanding of the complex landscape in which data literacy is developed, nurtured, and sustained. Currently, researchers do not have a systemic approach to examining the context of data-driven decision making in education. Another important topic that emerged from our analysis of the meeting is the gap in understanding of what it means to fall at various points along the continuum of data literacy, from basic data competence to advanced fluency. Related to this is the need to determine when it might be acceptable for an educator to have basic literacy, and when advanced data literacy may be required. Another related issue is understanding the components or ancillary skills that may be needed by educators, such as statistical or measurement knowledge. Yet another important topic is the role-based nature of data-driven decision making and data literacy. The following questions represent significant gaps in the existing knowledge base: To what degree are there differences in data literacy across occupations in the education system? How does data literacy differ for a teacher, a principal, a guidance counselor, a curriculum supervisor, a school counselor, a superintendent, or a chief state school officer? Should these individuals be actual data users (that is, individuals who examine the real data) or merely consumers of information (that is, individuals who read synthesized information or reports culled from data analyses)? Are there differences across the elementary, middle, and high school levels, or across content areas?
INSTRUMENTATION An operational definition of data literacy provides the structure to develop instrumentation needed for researchers to measure the impact of various data use practices. Instruments to provide evidence of data literacy knowledge and practices that result from professional development are also needed. Ultimately, this evidence can be used to help identify the specific training needs of educators and inform improvements in those trainings. The following instrumentation issues were raised by participants:

37
Participants identified a number of technical aspects of the need for adequate instrumentation.
o It is not clear how data literacy might be measured. There appear to be preliminary instruments, but they are not well shared and have not been systematically examined for technical quality.
o It is not clear that these preliminary instruments address differences that may be important among the different stakeholder groups.
o Instrumentation that measures the overall landscape of the use of data in education is lacking.
There is a need to assess the knowledge and skills that teachers and administrators exhibit in relation to the components of data use. Such assessment will inform an understanding of what educators are doing with data and how to assess their actions.
Some items and instruments already exist to measure data knowledge, beliefs about data, expectations, efficacy, data culture, and supports. These items and instruments need to be made more public and aligned to the emerging definition of data literacy.
FUNDING Having four different funding agencies represented at the meeting provided an opportunity for participants to explore the essential roles the funders might play in helping to define data literacy and the use of data by educators. Participants recognized the influence that funders have in terms of setting priorities for supporting different aspects of data use. The following issues characterize this key theme:
Participants recognized that the emphasis of funding across both public and private agencies has been on first supporting the development of data systems, especially at the state level. They indicated that the emphasis on building human capacity to use data, though it is important, is less supported and should become a focus of funders. In addition, they indicated that the growing emphasis on local data systems and on the needs and opportunities for research at that level requires a change in the focus of funding.
Access to resources is a driver for many of the other recommendations articulated during the meeting. For instance, collaboration among professional development providers to create a network will require support, as will the creation of a collaborative of researchers and professional development providers. There should also be collaboration among funders, including foundations, governmental funding agencies, and other governmental stakeholders and policymakers. Such a collaborative of funders would contribute to a shared conceptualization of the needs of the field and the role each agency can play.
Participants identified a number of types of efforts that might be considered for support, including a high-level conference (such as a Wingspread Conference) that would include representatives from various stakeholder groups, especially policymakers, accreditation agencies, and professional organizations. Such a group could consider how to leverage change in the field, develop a forum for shared models and materials, and create instrumentation to study data literacy of educators.
Gaps in Funding Funding related to data-driven decision making has been spotty at best, and is limited in scope, funds, and methods. In order for a proposal to be submittable to the Institute of Education

38
Sciences (IES), it has typically had to relate to a topical or content area, because of IES’s specific lines of funding. Within the past few years, a strand involving use of statewide longitudinal data has been established, but this strand is about using data to solve educational problems, not about studying the impact or components of data-driven decision making. The National Science Foundation is beginning to fund data-related projects, and certain foundations, such as those represented at this meeting, are funding data projects within the scope of each foundation’s agenda. Perhaps one of the most pressing funding challenges is the methodology that some funders require for use in funded studies. As previously discussed, randomized controlled trials may not be the most appropriate or effective method for answering many of the questions facing the field. A fundamental principle of research is that research questions and their associated methods must be aligned. Funding agencies need to recognize that many of the difficult questions that need to be addressed may require diverse qualitative as well as quantitative methods, and that, given the complexity of the landscape, systems analyses also may be needed, to address the interrelatedness of the components that contribute to effective data use. COLLABORATION A key theme that arose in multiple sessions of the meeting was the need for collaboration within and across groups of stakeholders. Participants agreed that such collaboration is perhaps the prime mechanism by which data literacy for educators might progress. The following collaboration issues were identified by participants:
Collaboration needs to be a primary commitment, both within and across the various groups of stakeholders that support data literacy, so that multiple types of expertise can be coordinated. In particular, links among the research, practice, and policy communities need to be supported.
Professional development providers can be connected through conferences and online communities, thereby facilitating discussion about sharing models, materials, and resources.
The development of a research/professional development collaborative would create an important partnership, from which each of the various included groups could learn and benefit.
Gaps in Included Stakeholders for the Data Literacy Meeting Although collaboration has been identified as a key topic to facilitate progress in the field, the meeting and its discussions failed to include all possible stakeholders and collaborators. The meeting was constrained by the number of invitees it could include. We saw it as a first step, recognizing that certain stakeholder groups were not represented. From the proceedings, it became increasingly clear that other stakeholders must be brought into the ongoing discussion, including state credentialing and licensure agencies. This stakeholder group can play a key role by incorporating data literacy into requirements for educators. A second group whose perspective should be included in the future is the practitioners. The discussion would benefit from including a variety of practitioners, or at least getting their reactions to the findings.8 8 Feedback is being obtained from practitioners when presentations are made to diverse audiences.

39
MESSAGING Messaging on the use of data is essential. Participants agreed that the use of data in education currently has a negative connotation, frequently being connected to teacher evaluation and the identification of failing systems. Participants further agreed that improving understanding of how and why data inform continuous improvement needs to be the focus of messaging, rather than punitive or accountability purposes. Data use must be seen as an effective tool for educators. Messaging emerged as a topic of interest among the participants, including:
The use of different terminology by different stakeholders is a barrier to widespread acceptance of data use by educators. Data use is a complex process, but a common language and voice would improve communication and understanding across stakeholder groups. Messaging should describe the competencies needed for educators to be considered data literate, in language that resonates with educators.
Messaging needs to counter the fear that data will be misused for teacher evaluation, accountability, and purposes other than those for which the data have been collected. Instead, data should be used to help and support educators, and should become a component of good teaching.
Participants identified multiple avenues by which messaging on data use might be improved. The development of a positive video, perhaps similar to those of Khan Academy, might help to improve the message.
Messaging should have an evidentiary basis, as it currently exists in the field, noting the limitations of research to support data-driven decision making. The messaging should provide some sense of validity, utility, and the tools needed to support the process. There also needs to be a research agenda on which the evidentiary base is grounded, and that agenda should be communicated to the field.

40
SUMMARY AND RECOMMENDED NEXT STEPS
The meeting yielded a wealth of information, not just about defining data literacy but also about the landscape in which data use exists. It is impossible to separate what it means to be data literate from that landscape because of the complexities and systemic nature of the use of data in education. This section presents a summary of the findings, across the different areas of inquiry and discourse, that have informed this report. From these findings, we have discerned recommendations for next steps that can move the field forward in terms of professional development; the integration of data-driven decision making into institutions of higher education; the development of a research agenda; information for funders, policymakers, and other stakeholders; instrument development; and other areas of potentially fruitful work.
SUMMARY OF THE FINDINGS It is clear that “data literacy” is an umbrella term that is complex and difficult to reduce and define without considerable thought, as evidenced by the extensive lists of terms representing different types of knowledge (e.g., declarative, procedural, schematic, and strategic) that emerged from our analysis of texts, the participants’ initial definitions of data literacy, and the discourse captured in the meeting transcripts. Nonetheless, it is important to work toward an operational definition upon which the field and its various stakeholder groups can all agree. A widely agreed upon definition will help the development of measures of data literacy and will help identify effective uses of data in educational settings. Based on the text analysis, it is also clear that the knowledge and skills involved in being literate in the use of data are interconnected with the knowledge and skills involved in being an effective teacher and administrator. The texts indicate that, from a teacher perspective, data literacy is complex and includes knowledge and skills in multiple areas of instructional design and lesson planning, implementation of coherent lessons in the classroom, the collection of evidence of student learning, and reflection on the characteristics of teaching that support student learning. The interconnectedness among the different roles that teachers and other educators play in carrying out the myriad activities of the school day or year, in a way that is based on evidence rather than on anecdotes and belief systems, is interwoven throughout the texts. The different aspects of data literacy that are necessary for different stakeholders in education are also indicated by the texts, including fundamental areas such as what counts as data that are appropriate to inform a stakeholder’s decision. Findings from the text analysis also suggest the difficulty of capturing what educators need to know and be able to do with data. Describing, in unambiguous, easily interpreted terms, the knowledge and skills that make up the processes of using data for multiple types of decisions is a challenge for text authors. The challenge of bringing together a group of professionals who must address difficult and potentially intractable decisions is easy to talk about when describing how collaborative data teams must work, but carrying out the processes that are necessary for a group of educators to use to bring practice to life is much more difficult. The definitions provided by participants before the meeting show that individuals’ constructs of data literacy are influenced by their roles and agendas. Clearly there were areas of agreement,

41
including the importance of collaborative opportunities, the need for a structured process by which data and questions of inquiry are connected, and how to accurately analyze data to inform inferences of meaning. Likewise as an area of agreement, there were shared concerns about the utility and quality of data and the need to maximize access to data. The participants also expressed differences of opinion, particularly regarding the level of expertise that educators need in order to be considered data literate. The extents to which educators need to understand the statistical properties of data and need to use different technologies that support data use are two other obvious areas of disagreement. The analysis of the hands-on activity that we used to evaluate perceptions of the relationship between assessment and data literacy indicates some of the difficulties that have been expressed in the field as a whole. It found that the two constructs are intertwined and that the unique aspects of each require more thought and explication. The focus of data literacy on sources of data that are more than just measures of student achievement is an important difference between the two constructs. The meeting discussions demonstrated the interconnectedness of the constructs that make up data literacy. The importance of understanding the contexts of education was a recurrent theme that demonstrates how data literacy is intertwined with education reform and school and district improvement. Other themes that repeatedly emerged from the meeting discussions were the need to find a common language to discuss and conduct research on data use and data literacy; the clear differences in the types of data that are useful to various stakeholder groups; and the need for developing a continuum of skills that defines levels of data use, from novice to expert. The complexity of specific sets of knowledge and skills and the areas of agreement related to them were readily apparent, as were the differences in terminology that different groups use to talk about data literacy. The differences in views on important aspects of data literacy are important, as they can provide opportunities for different groups to learn from each other. They may also lead to the identification of barriers that, like differences in terminology, may prevent researchers, policymakers, professional development providers, and other stakeholders from working together. Role-related differences in identifying what data literacy entails and what knowledge and skills are needed were very apparent during the meeting discussions. It is also clear that data interpretation needs are different for teachers connecting data to classroom-level decisions than for administrators thinking about school schedules and other functions. The developmental continuum of data use is a characteristic of data literacy that influences how one defines the term. These multiple aspects of data literacy present a challenge for the systems that prepare educators to use data.
NEXT STEPS This project yielded a wealth of information about the landscape of data literacy and data-driven decision making. However, as previously noted, it also identified clear gaps in the field. Given the complexity of this issue, filling those gaps will present significant challenges and require collaborative efforts by the diverse stakeholder groups. This section presents next steps for three primary foci that emerged from the meeting: research, convenings, and professional

42
development. It also discusses next steps by other stakeholder groups, such as higher education, state credentialing agencies, and practitioners, and provides concluding comments. RESEARCH The meeting yielded a clear sense of the research that will inform the field. However, the methodologies to address the pressing research questions were not as clear. Research on data literacy requires rigorous methods, but it must be recognized that not all studies must use randomized controlled trials—although some experts insist that these are the only acceptable study designs—and that methods and questions must be aligned. Based on their substantial expertise, meeting participants recommended formation of a research collaborative to collectively address some of the outstanding research questions and methodological issues. Once the collaborative is formed, a next step would be the development of a comprehensive research agenda, informed by the collaborative and updated as the field’s knowledge base evolves. Part of that agenda must be the distinction between the need for evidence of effectiveness and the need for evidence of contextual issues, including what works, for whom, under what circumstances, and why. Another set of steps focuses on instrument development. The goal of the meeting was to define data literacy. Once the field has operationalized the construct, there is a need for psychometrically sound instruments to measure data literacy. To date, different researchers have used their own instruments, which, most likely, have not been submitted to sound psychometric testing. To that end, a concrete next step is for a subset of researchers who have worked in the area of data-driven decision making and who have measurement expertise to come together and use their collective knowledge to develop and vet instruments to measure data literacy knowledge and skills, beliefs, dispositions, and mindsets. A parallel instrument development activity might be to build practice-based instruments that can help teachers in their practice and that are locally relevant and can help LEAs determine educators’ ability to use data. An additional focus is to continue to understand the 95/5 percent definition of data literacy; that is what are the knowledge and skills upon which there is agreement and those where there is disagreement. The meeting did not reach the intended common operationalization of the construct. However, participants did find substantial consensus around the topic, while acknowledging that some aspects of data literacy and its components will require further exploration. Research can continue to address and further refine the operationalization of the construct, with an ultimate goal of a working definition of data literacy. CONVENINGS The meeting yielded a distinct need for a variety of convenings for different purposes, including convenings to bring together like-minded stakeholder groups and to bring together individuals within groups. There is also a need to communicate the importance of data literacy to various stakeholder groups that have not been involved in discussions of the topic to date. Meeting participants felt strongly that the field could benefit from collaborative meetings of funders, in which they would discuss their agendas on data-driven decision making. In that way, funders could identify common themes, overlaps, and gaps. Such meetings would include

43
representatives from foundations as well as from governmental sources. Noting the systemic nature of the field and of enculturating data literacy, such a convening must be informed by the research and practice needs of the field. Participants also expressed the need for convenings of researchers, to discuss common objectives; of professional developers, to understand one another’s models, similarities, differences, gaps, and potential collaborations; and of combinations of these groups, because of their interconnectedness. There is also a need to involve other stakeholders, such as representatives from higher education, credentialing agencies, professional policy organizations, related professional organizations (e.g., for school boards, superintendents, school leaders, and educators), and other groups of practitioners. Since convenings are able to reach only limited numbers of individuals, a communication plan is also needed in order to reach the various stakeholder groups. Presentations strategically given at a number of high-profile meetings can begin to disseminate information about data literacy. These meetings might include the annual conferences of the American Educational Research Association, the National Education Association, the Council of Chief State School Officers, the National School Boards Association, the American Association of School Administrators, the National Association of Elementary School Principals, the National Board for Professional Teaching Standards, the National Council for Accreditation of Teacher Education, the American Association of Colleges for Teacher Education, the National Staff Development Council, and other related organizations. Beyond such presentations, messaging could also be undertaken through briefs and articles in professional magazines, journals, and popular media, including the Chronicle of Higher Education, Education Week, and Education Daily. PROFESSIONAL DEVELOPMENT The next steps for professional development revolve around gaining a more thorough and comprehensive understanding of the existing professional development models than was possible within the scope of this work. There still needs to be a thorough examination of existing materials to understand what gaps exist, based on the needs of practitioners and findings in the research literature. Such a gap analysis can stimulate subsequent development of materials among the professional development providers. We are aware of two particular gaps that might be starting points for the analysis: extending the models from simply using data to understanding how data can transform instructional or administrative action, and addressing habits of mind.9 The professional development providers at the meeting expressed a lack of understanding of one another’s models, despite the fact that many have borrowed from one another. The field could be rewarded by helping the providers understand the work of their colleagues, in a manner that promotes mutually beneficial sharing of models. The professional development community can benefit from considering new and innovative delivery media, such as modeling their work on that of the Khan Academy and considering virtual platforms. One immediate next step could be the production of a video showing the best practices from different models of professional development. Such a video could be used for informational purposes and for technical assistance. It would go beyond what currently exists on
9 Our thanks to the attendee at the NCES STATS-DC 2012 Data Conference who provided us this feedback.

44
the Doing What Works website (see http://dww.ed.gov/Data-Driven-Instructional-Decisionmaking/topic/index.cfm?T_ID=30). OTHER STAKEHOLDER GROUPS As noted in the preceding Convenings section, there is a need to reach out to stakeholder groups that have not traditionally been part of conversations about data literacy. Foremost among these groups are the practitioner groups that have the most to gain by understanding the importance of data literacy: the groups associated with teachers and administrators. Other key stakeholder groups are those that represent decision making and policy settings, such as superintendents, school boards, and chief state school officers, and the state credentialing agencies, which set policies that potentially influence schools of education. Practitioners are necessarily the primary target audience for the discussion around data literacy. They should and must become part of the conversation, particularly in the area of implementing and sustaining a culture of data use for decision making. As noted in the meeting findings, data literacy has a dispositional component, and teacher mindset is often extremely personal.10 That is, some educators have a proclivity toward data use, whereas other take a strong anti-data stance. The message to teachers, and educators more generally, must be that becoming data literate and using data will help them accomplish their work objectives. Thus, including educators in any subsequent work in this area will be beneficial to the field. CONCLUDING COMMENTS Data-driven decision making is here to stay. It is not a passing fad, as many educators may have expected or assumed based on other educational fads. It is no longer acceptable for educators to rely simply on gut feelings or anecdotes. Educators must be armed with data and evidence on which to base decisions. Learning to use data is an ongoing process of professional growth and exploration. As one educator from another event said, “Without data, you are only an opinion.” “Data” can no longer be considered figuratively a “four-letter word.” Data must become a tool to benefit educators’ practice, and educators must be trained in how to use data effectively to inform their practice. It is no longer an elective; it is a requirement of the field. Given this new reality, the field must consider how its leverage can change so that all educators become data literate. Some in the field recognize the complexity of the challenge, but the benefits of data literacy far outweigh the obstacles. The intent of this work was to develop an operational definition of data literacy that could be used to inform the professional development, research, and funding decisions needed to improve how educators use data. In the end, we find ourselves agreeing with Francis Crick, who writes about the research agenda needed to support the development of a scientific explanation of consciousness:
What I have tried to do here is to sketch the general nature of consciousness and to make some tentative suggestions about how to study it experimentally. I am proposing a particular research strategy, not a fully developed theory. What I want to know is exactly what is going on in my brain when I see something.
10 Our thanks to the attendee at the NCES STATS-DC 2012 Data Conference who provided us this feedback.

45
Some readers will find this approach disappointing since, as a matter of tactics, it deliberately leaves out many aspects of consciousness they would love to hear discussed—in particular, how one should define it. You do not win battles by debating exactly what is meant by the word battle. You need to have good troops, good weapons, a good strategy, and then hit the enemy hard. The same applies to solving a difficult scientific problem. (Crick, 1995, p. xi)
The research and development agenda to support data literacy needs to give educators useful, relevant data; equip them to use data to inform decisions and improve outcomes; and provide the context within which they can use those data.

46
REFERENCES
Abbott, D. V. (2008). A functionality framework for educational organizations: Achieving accountability at scale. In E.B. Mandinach & M. Honey (Eds.), Data-driven school improvement: Linking data and learning (pp. 257–276). New York, NY: Teachers College Press.
Ainsworth, L., & Viegut, D. (2006). Common formative assessments: How to connect standards-based instruction and assessment. Thousand Oaks, CA: Corwin Press.
Anderson, K. R. (2010). Data teams success stories: Vol. 1. Englewood, CO: Lead+Learn Press.
Anderson, S., Leithwood, K., & Strauss, T. (2010). Leading data use in schools: Organizational conditions and practices at the school and district levels. Leadership and Policy in Schools, 9, 292–327.
Ankeney, K. S. (2011). System-wide change and the use of data to inform instructional practice (Doctoral dissertation). San Diego State University, San Diego, CA. Retrieved from http://sdsu-
dspace.calstate.edu/xmlui/bitstream/handle/10211.10/1418/Ankeney_Kirk.pdf?sequence=1
Bambrick-Santoyo, P. (2010). Driven by data: A practical guide to improve instruction. San Francisco, CA: Jossey-Bass.
Benjamin, A. (2008). Formative assessment for English language arts: A guide for middle and high school teachers. Larchmont, NY: Eye on Education.
Bernhardt, V. L. (2004). Data analysis for continuous school improvement (2nd ed.). Larchmont, NY: Eye on Education.
Bernhardt, V. L., & Hébert, C. L. (2011). Response to Intervention (RTI) and Continuous School Improvement (CSI): Using data, vision, and leadership to design, implement, and evaluate a schoolwide prevention system. Larchmont, NY: Eye on Education.
Boudett, K. P., City, E. A., & Murnane, R. J. (Eds.). (2005). Data wise: A step-by-step guide to using assessment results to improve teaching and learning. Cambridge, MA: Harvard Educational Publishing Group.
Brady, L., & McColl, L. (2010). Test less, assess more: A K–8 guide to formative assessment. Larchmont, NY: Eye on Education.
Bridgeman, P. W. (1959). The way things are. Cambridge, MA: Harvard University Press.
Carlson, M. O., Humphrey, G. E., & Reinhardt, K. S. (2003). Weaving science inquiry and continuous assessment: Using formative assessment to improve learning. Thousand Oaks, CA: Corwin Press.
Carroll, S. R., & Carroll, D. J. (2002). Statistics made simple for school leaders: Data-driven decision making. Lanham, MD: Scarecrow Press.
Chappuis, S., Stiggins, R. J., Arter, J. A., & Chappuis, J. (2009). Assessment for learning: An action guide for school leaders (2nd ed.). Boston, MA: Allyn & Bacon.

47
Chappuis, J., Stiggins, R. J., Chappuis, S., & Arter, J. A. (2012). Classroom assessment for student learning: Doing it right—using it well (2nd ed.). Boston, MA: Allyn & Bacon.
Choppin, J. (2002, April). Data use in practice: Examples from the school level. Paper presented at the annual meeting of the American Educational Research Association, New Orleans, LA.
Crick, F. (1995). The astonishing hypothesis: The scientific search for the soul. New York, NY: Smon & Schuster.
Data Quality Campaign. (2012). State analysis by action: Action 9. Promote educator professional development and credentialing. In Data for Action 2011. Retrieved from http://www.dataqualitycampaign.org/stateanalysis/actions/9/
Duncan, A. (2009a, March). Federal leadership to support state longitudinal data systems. Comments made at the Data Quality Campaign conference, Leveraging the Power of Data to Improve Education, Washington, DC.
Duncan, A. (2009b, May 20). Secretary Arne Duncan testifies before the House Education and Labor Committee. Retrieved from http://www2.ed.gov/news/speeches/2009/05/05202009.html
Duncan, A. (2009c, June). Robust data gives up the roadmap to reform. Keynote address at the Fourth Annual IES Research Conference, Washington, DC. Retrieved from http://www2.ed.gov/news/speeches/2009/06/06082009.pdf
Duncan, A. (2010a, July). Unleashing the power of data for school reform. Keynote address at the STATS-DC 2010 National Center for Education Statistics Data Conference, Bethesda, MD. Retrieved from http://www.ed.gov/news/speeches/unleashing-power-data-school-reform-secretary-arne-duncans-remarks-stats-dc-2010-data-
Duncan, A. (2010b, November). Secretary Arne Duncan’s remarks to National Council for Accreditation of Teacher Education. Retrieved from http://www.ed.gov/news/speeches/secretary-arne-duncans-remarks-national-council-accreditation-teacher-education
Duncan, A. (2012, January). Leading education into the information age: Improving student outcomes with data. Roundtable discussion at the Data Quality Campaign National Data Summit, Washington, DC. Retrieved from http://www.dataqualitycampaign.org/events/details/299/
Earl, L. M., & Katz, S. (2006). Leading schools in a data-rich world: Harnessing data for school improvement. Thousand Oaks, CA: Corwin Press.
Easton, J. Q. (2009, July). Using data systems to drive school improvement. Keynote address at the STATS-DC 2009 National Center for Education Statistics Data Conference, Bethesda, MD.
Feldman, J., & Tung, R. (2001). Using data-based inquiry and decision making to improve instruction. ERS Spectrum, 19(3), 10–19.
Fisher, D., & Frey, N. (2007). Checking for understanding: Formative assessment techniques for your classroom. Alexandria, VA: Association for Supervision and Curriculum Development.

48
Goldring, E., & Berends, M. (2009). Leading with data: Pathways to improve your school. Thousand Oaks, CA: Corwin Press.
Greenberg, J., & Walsh, K. (2012). What teacher preparation programs teach about K–12 assessment: A review (Rev. ed.). Retrieved from http://www.nctq.org/p/publications/docs/assessment_report.pdf
Hamilton, L., Halverson, R., Jackson, S. S., Mandinach, E., Supovitz, J. A., & Wayman, J. C. (2009). Using student achievement data to support instructional decision making (IES Practice Guide, NCEE 2009-4067). Retrieved from http://ies.ed.gov/ncee/wwc/pdf/practice_guides/dddm_pg_092909.pdf
Harlen, W. (2007). Assessment of learning. Thousand Oaks, CA: SAGE.
Heritage. M. (2010). Formative assessment: Making it happen in the classroom. Thousand Oaks, CA: Corwin.
Herman, J., & Gribbons, B. (2001). Lessons learned in using data to support school inquiry and continuous improvement: Final report to the Stuart Foundation (CSE Tech. Rep. 535). Retrieved from http://www.cse.ucla.edu/products/reports/TR535.pdf
Holcomb, E. L. (2004). Getting excited about data: Combining people, passion, and proof to maximize student achievement (2nd ed.). Thousand Oaks, CA: Corwin Press.
Ikemoto, G. S., & Marsh, J. A. (2007). Cutting through the “data-driven” mantra: Different conceptions of data-driven decision making. In P.A. Moss (Ed.), Evidence and decision making: The 106th yearbook of the National Society for the Study of Education, part 1 (pp. 105–131). Malden, MA: Blackwell.
Institute of Education Sciences. (n.d.). Publications and reviews. Retrieved from http://ies.ed.gov/ncee/wwc/reports/
James, E. A., Milenkiewicz, T., & Bucknam, A. J. (2008). Participatory action research for educational leadership: Using data-driven decision making to improve schools. Thousand Oaks, CA: SAGE.
Johnson, R. S. (2002). Using data to close the achievement gap: How to measure equity in our schools. Thousand Oaks, CA: Corwin Press.
Johnson, R. S., & La Salle, R. A. (2010). Data strategies to uncover and eliminate hidden inequities: The wallpaper effect. Thousand Oaks, CA: Corwin.
Kelley, A., & Downey, C. (2011). Using effectiveness data for school improvement: Developing and utilizing metrics. New York, NY: Routledge.
Love, N., Stiles, K. E., Mundry, S. E., & DiRanna, K. (2008). The data coach’s guide to improving learning for all students: Unleashing the power of collaborative inquiry. Thousand Oaks, CA: Corwin Press.
Mandinach, E. B. (2009, October). Data use: What we know about school-level use. Presentation at the Special Education Data Accountability Center Retreat, Rockville, MD.
Mandinach, E. B. (2012). A perfect time for data use: Using data-driven decision making to inform practice. Educational Psychologist, 47(2), 71–85.

49
Mandinach, E. B., Gummer, E. S., & Muller, R. (2011). The complexities of integrating data-driven decision making into professional preparation in schools of education: It’s harder than you think. Retrieved from http://educationnorthwest.org/resource/1660
Mandinach, E. B., & Honey, M. (Eds.). (2008). Data-driven school improvement: Linking data and learning. New York, NY: Teachers College Press.
Mandinach, E. B., Honey, M., Light, D., & Brunner, C. (2008). A conceptual framework for data-driven decision making. In E. B. Mandinach & M. Honey (Eds.), Data-driven school improvement: Linking data and learning (pp. 13–31). New York, NY: Teachers College Press.
Mandinach, E. B., & Jackson, S. S. (2012). Transforming teaching and learning through data-driven decision making. Thousand Oaks, CA: Corwin.
Mason, S. (2002, April). Turning data into knowledge: Lessons from six Milwaukee public schools. Paper presented at the annual meeting of the American Educational Research Association, New Orleans, LA.
McMillan, J. H. (Ed.). (2007). Formative classroom assessment: Theory into practice. New York, NY: Columbia University, Teachers College.
Means, B., Chen, E., DeBarger, A., & Padilla, C. (2011). Teachers’ ability to use data to inform instruction: Challenges and supports. Retrieved from http://www2.ed.gov/rschstat/eval/data-to-inform-instruction/report.doc
Means, B., Padilla, C., & Gallagher, L. (2010). Use of education data at the local level: From accountability to instructional improvement. Retrieved from http://www2.ed.gov/rschstat/eval/tech/use-of-education-data/use-of-education-data.pdf
Miller, M. (2009). Achieving a wealth of riches: Delivering on the promise of data to transform teaching and learning [Policy brief]. Retrieved from http://www.all4ed.org/files/AchievingWealthOfRiches.pdf
National Council for Accreditation of Teacher Education (NCATE), Blue Ribbon Panel on Clinical Preparation and Partnerships for Improved Student Learning. (2010). Transforming teacher education through clinical practice: A national strategy to prepare effective teachers. Retrieved from http://www.ncate.org/LinkClick.aspx?fileticket=zzeiB1OoqPk%3D&tabid=715
Oregon Department of Education. (2012). The Oregon Direct Access to Achievement (Data) Project. Retrieved from http://www.oregondataproject.org/
Pete, B., & Duncan, C. S. (2004). Data! Dialogue! Decisions! The data difference. Thousand Oaks, CA: Corwin Press.
Popham, W. J. (2011). Transformative assessment in action: An inside look at applying the process. Alexandria, VA: Association for Supervision and Curriculum Development.
Shavelson, R. J., Ruiz-Primo, M. A., & Wiley, E. W. (2005). Windows into the mind. Higher Education, 49(4), 413–430.
Shulman, L. S. (1986). Those who understand: Knowledge growth in teaching. Educational Researcher, 15(2), 4–14.
50
Tucker, B. (2010). Putting data into practice: Lessons from New York City. Retrieved from http://www.educationsector.org/sites/default/files/publications/Putting%20Data%20Into%20Practice_RELEASE.pdf
Wayman, J. C., & Stringfield, S. (2006). Technology-supported involvement of entire faculties in examination of student data for instructional improvement. American Journal of Education, 112(4), 549–571.
Wellman, B., & Lipton, L. (2004). Data-driven dialogue: A facilitator’s guide to collaborative inquiry. Sherman, CT: Mira Via.
White, S. (2011). Show me the proof! Tools and strategies to make data work for the Common Core State Standards (2nd ed.). Englewood, CO: Lead+Learn Press.
Wiliam, D. (2009). Assessment for learning: Why, what and how? London, England: University of London, Institute of Education.
Wiliam, D. (2011). Embedded formative assessment. Bloomington, IN: Solution Tree Press.

51
APPENDICES
APPENDIX A—AGENDA FOR THE MEETING
The following is the agenda for the meeting.
Agenda for the Gates Foundation Data Literacy Meeting
May 3
4:00 Welcome – Glen Harvey, CEO WestEd 4:15 Introduction to the Meeting and Setting the Stage Agenda for the Meeting, Structured Dinner Discussion,
Purpose of the Breakout Groups Gaining Conceptual Clarity – Toward a Common Definition of Data Literacy What are the Key Skills and Knowledge in Data Literacy – Marty Orland
4:30 – 5:30 Purpose and Intended Outcomes Pointillism Metaphor Operational Definition Activity for Defining Data Literacy Discussion of the Data Definitions Presentation of the Materials Analysis
– Ellen Mandinach and Edith Gummer 5:30 – 6:30 Dinner and Structured Discussions 6:30 – 7:30 Panel 1 –Data at the Classroom Level and Formative Assessment Moderated by Edith Gummer Possible Panelists Margaret Heritage Jan Chappuis Joan Herman Audrey Champagne Stanley Rabinowitz Full Group Discussion 7:30 – 8:15 Full Group Discussion of the First Day– Marty Orland 8:15 Adjourn for the Evening

52
May 4
8:15 – 9:00 Breakfast Available 9:00 – 9:15 Recap of Yesterday Structure for the Day Questions and Comments General Discussion Led by Marty Orland 9:15 – 10:15 Panel 2 – Data-Driven Decision Making at the School and District Level Moderated by Ellen Mandinach Possible Panelists Victoria Bernhardt Kathy Boudett Stephen White Diana Nunnaley Sam Stringfield Cynthia Coburn Jeff Wayman Full Group Discussion 10:15 - 10:25 Break 10:30 – 11:30 Session 1 - Small Group Discussions – Examining Data Literacy Constructs:
Helping to Define Data Literacy Objective – Examine specific knowledge and skills for each topic 11:35 – 12:00 Reporting Out From Small Group Led by Marty Orland 12:00 – 12:45 Lunch with Structured Discussion Questions 12:45 – 12:55 Reporting Out 1:00 – 1:45 Session 2 - New Discussion Groups 1:45 – 2:00 Break 2:00 – 2:10 Redo the Data Literacy Activity 2:10 – 4:10 Reporting Out From Groups
Full Group Discussion How had our Conceptualization of Data Literacy Changed? What are the Commonalities? What are the Differences?

53
What is Missing? How are we Defining Data Literacy Now? More Questions and Discussion What Do We Know about the Evidence for Data Literacy? What Do We Need to Know? What Can the PD Providers Learn from this Meeting? Wrapping Up Next Steps and Outcomes Led by Marty Orland, Ellen Mandinach, and Edith Gummer

54
First Discussion Groupings
1. Precursor Conditions
a. Eli Pristoop b. Rob Larson c. Pat Sherrill d. Barbara Means (V)11 e. Denise Airola f. Diana Nunnaley g. John Tyler
2. Data Properties – Location
a. Don Mitchell b. Ellen Mandinach c. Jeff Wayman d. Arie van der Ploeg e. Neal Gibson f. Nancy Smith g. Stephen White
3. Statistics/Technical Knowledge and Skills
a. Helen Chong b. Andrea Lash c. Joan Herman d. John Maycock e. Ellen Goldring f. Victoria Bernhardt g. Jessica Heppen (V)
4. Assessment – Instrument Development
a. David Parker b. Sri Arnanda c. Laura Hamilton (V) d. Audrey Champagne e. Ruth Johnson f. Jan Chappuis g. Martin West h. Edys Quellmalz
11 Indicates virtual participation.

55
5. Decision Making – Instructional a. Micah Sagebiel b. Edith Gummer c. Margaret Heritage d. Chris Padilla e. Kathy Boudett f. Stanley Rabinowitz g. Ann-Marie Faria h. Jon Supovitz (V)
6. Decision Making – Programmatic
a. Ruth Neild (V) b. Marty Orland c. Paige Kowalski (V) d. Bill Slotnik e. Sam Stringfield f. Trent Kaufman g. Karee Dunn
7. Data Literacy and School Change
a. Neil Albert b. Chris Mazzeo c. Cynthia Coburn d. Lyndsay Pinkas e. Keith Menk f. Timothy Drake (V) g. Mickey Garrison

56
Afternoon Discussion Groups Question Based
1. What can the policymakers and funders do to move the field along? 2. What can the researchers do to move the field along? 3. What is needed in the PD models? 4. What systemic changes need to occur?
1. Led by Edith Gummer a. David Parker b. Don Mitchell c. Eli Pristoop d. Helen Chong e. Neil Albert f. Ruth Neild (V) g. Micah Sagebiel h. Keith Menk i. Pat Sherrill j. Paige Kowalski (V)
2. Led by Andrea Lash
a. Chris Padilla b. Cynthia Coburn c. Jeff Wayman d. Jessica Heppen (V) e. Denise Airola f. Karee Dunn g. Joan Herman h. Arie van der Ploeg i. Ann-Marie Faria j. John Tyler k. Edys Quellmalz l. Jon Supovitz (V) m. Rob Larson

57
3. Led by Ellen Mandinach a. Diana Nunnaley b. Kathy Boudett c. Victoria Bernhardt d. Mickey Garrison e. Jan Chappuis f. Stephen White g. Ruth Johnson h. Trent Kaufman i. Ellen Goldring j. Laura Hamilton (V) k. Margaret Heritage
4. Led by Marty Orland
a. Nancy Smith b. Barbara Means (V) c. Sam Stringfield d. Bill Slotnik e. John Maycock f. Neal Gibson g. Audrey Champagne h. Lyndsay Pinkus i. Timothy Drake (V) j. Martin West k. Chris Mazzeo

58
APPENDIX B—LIST OF ATTENDEES
The following is a list of the attendees and their affiliations. It includes several other individuals whose intentions were to attend the meeting, but who became unable to do so late in the preparation of the meeting.
Name Organization Stakeholder Group
Andrea Lash WestEd Researcher Ann-Marie Faria AIR Researcher Arie van der Ploeg AIR Researcher Audrey Champagne Independent Consultant Researcher Barbara Means* SRI Researcher Bill Slotnik CTAC Researcher Chris Mazzeo Education Northwest Researcher Chris Padilla SRI Researcher Cynthia Coburn* University of California, Berkeley Researcher David Parker Gates Foundation Funder Denise Airola University of Arkansas Researcher Diana Nunnaley TERC Professional Development Provider Don Mitchell Gates Foundation Funder Edith Gummer Education Northwest/NSF Researcher and Convener Edys Quellmalz WestEd Researcher Eli Pristoop Gates Foundation Funder Ellen Goldring Vanderbilt Researcher Ellen Mandinach WestEd Researcher and Convener Glen Harvey WestEd CEO Helen Chong Gates Foundation Funder Hilda Rosselli* Western Oregon University Higher Education Jan Chappuis Pearson Professional Development Provider Jeff Wayman University of Texas Researcher Jennifer Verrier WestEd Conference Organizer Jessica Heppen AIR Researcher Joan Herman CRESST Researcher John Tyler Brown University Researcher John Maycock Achievenet Researcher Jon Supovitz* University of Pennsylvania Researcher Karee Dunn University of Arkansas Researcher Kathryn Boudett Data Wise Professional Development Provider
Keith Menk Oregon Teacher Standards and Practices Commission
State Education Agency
Laura Hamilton RAND Researcher Lyndsay Pinkus Data Quality Campaign Policy Maker Margaret Heritage CRESST Professional Development Provider Martin West Harvard University Researcher Marty Orland WestEd Researcher
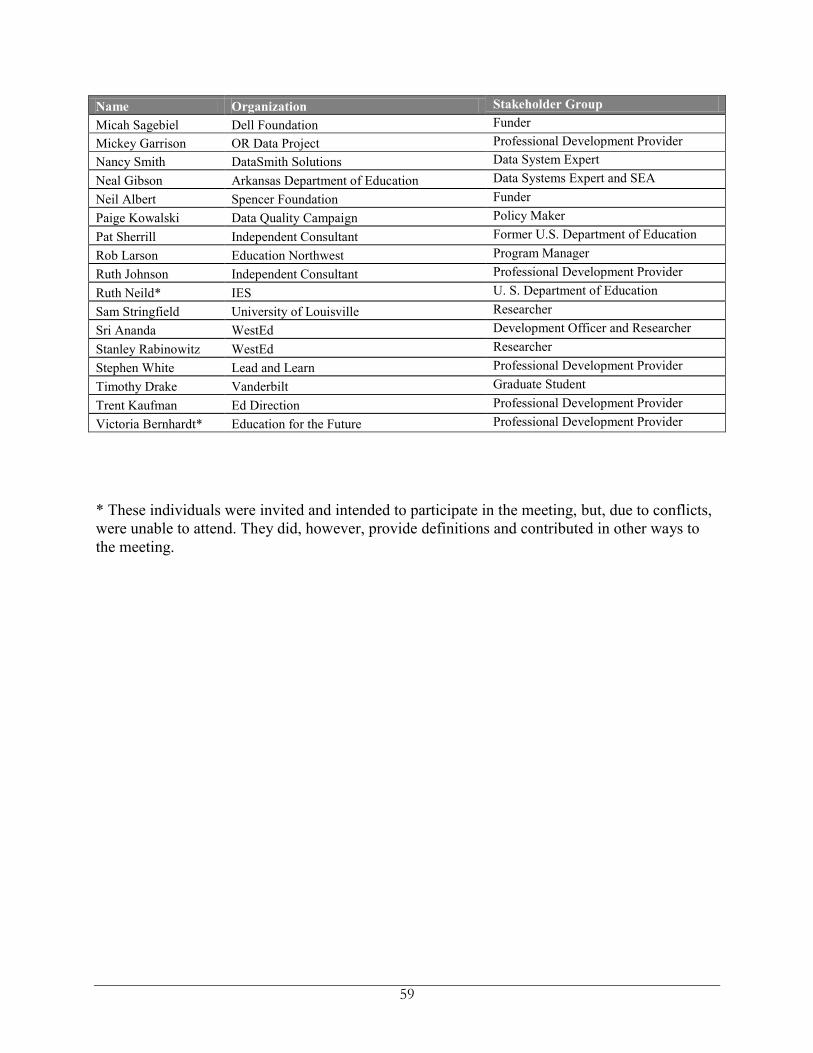
59
Name Organization Stakeholder Group
Micah Sagebiel Dell Foundation Funder Mickey Garrison OR Data Project Professional Development Provider Nancy Smith DataSmith Solutions Data System Expert Neal Gibson Arkansas Department of Education Data Systems Expert and SEA Neil Albert Spencer Foundation Funder Paige Kowalski Data Quality Campaign Policy Maker Pat Sherrill Independent Consultant Former U.S. Department of Education Rob Larson Education Northwest Program Manager Ruth Johnson Independent Consultant Professional Development Provider Ruth Neild* IES U. S. Department of Education Sam Stringfield University of Louisville Researcher Sri Ananda WestEd Development Officer and Researcher Stanley Rabinowitz WestEd Researcher Stephen White Lead and Learn Professional Development Provider Timothy Drake Vanderbilt Graduate Student Trent Kaufman Ed Direction Professional Development Provider Victoria Bernhardt* Education for the Future Professional Development Provider
* These individuals were invited and intended to participate in the meeting, but, due to conflicts, were unable to attend. They did, however, provide definitions and contributed in other ways to the meeting.

60
APPENDIX C—MATERIALS CODES AND SUBCODES USED TO GENERATE CATEGORIES
Categories Ain
swo
rth
an
d V
iegu
t
K..R
. A
nd
erso
n
An
ken
ey
Bam
bri
ck-S
anto
yo
Ben
jam
in
Ber
nh
ard
t
Ber
nh
ard
t an
d H
éber
t
Bo
ud
ett,
Cit
y, a
nd
Murn
ane
Bra
dy
and
McC
oll
Precursor Conditions
School Vision ** * * * ***
Connection to other initiatives *** * * **
Authority ** *** ** **
Understand change process * ** *** * **
Collaboration *** *** ** *** * *** *** **
Focus on equity * * **
Cultural proficiency
School culture ** ** * * *
Characteristics of PD ** ** *** *** ** *
Inquiry process
Purpose/Use *** * ** *** *** *** *** ***
Assessment
Types of processes *** *** ** *** ** ***
Data
Data access - obtaining data ** * * ***
Data types *** ** * * * *** *** *** *
Data quality *** ** ** * ** ***
Data use/sufficiency * * ** * ** *
Data Analysis
Data displays ** * *** ** *
Analysis actions * *** * * ***
Statistics ** **
Inferences/ Interpretations ** * * * ** * *** *
Instructional planning
Differentiate instruction/program ** ** * ** ** **
Plan daily instruction * * * ** ** *
Programmatic planning
Program changes * ** *
Understand research evidence
Link research evidence to student performances
Link research evidence to instructional practices * *
Link research evidence to programmatic planning
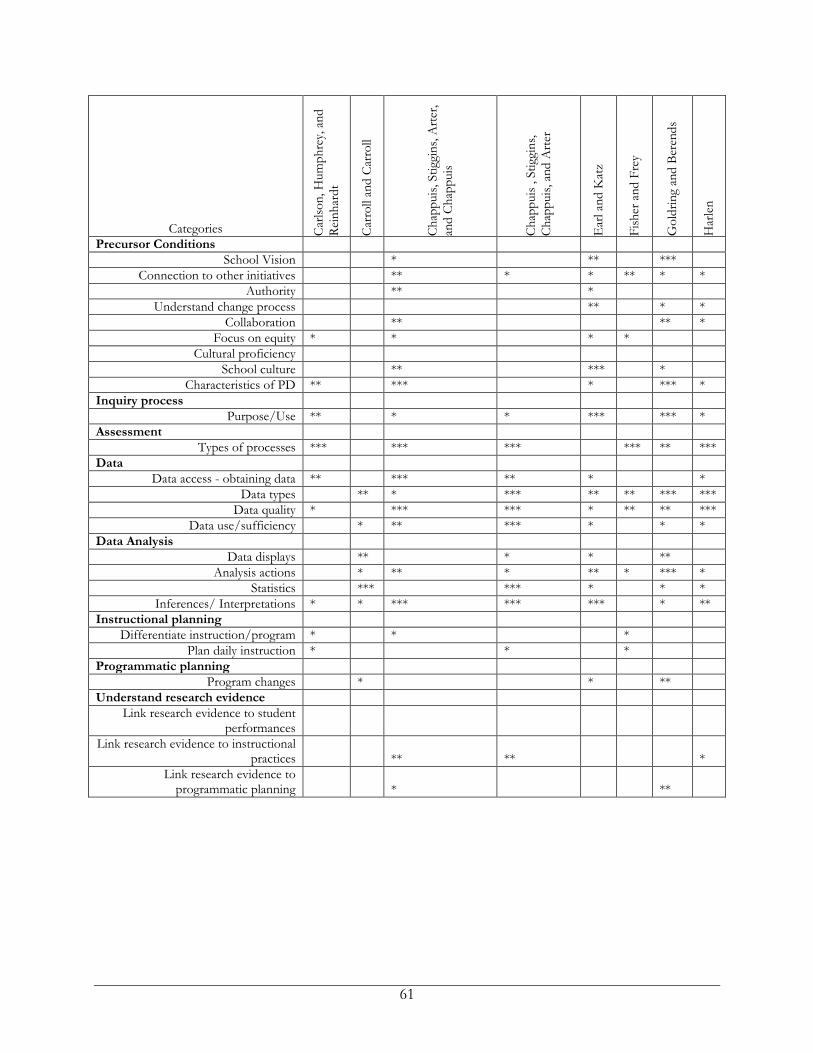
61
Categories Car
lso
n, H
um
ph
rey,
an
d
Rei
nh
ard
t
Car
roll
and
Car
roll
Ch
app
uis
, Sti
ggin
s, A
rter
,
and
Ch
app
uis
Ch
app
uis
, S
tigg
ins,
Ch
app
uis
, an
d A
rter
Ear
l an
d K
atz
Fis
her
an
d F
rey
Go
ldri
ng
and
Ber
end
s
Har
len
Precursor Conditions
School Vision * ** ***
Connection to other initiatives ** * * ** * *
Authority ** *
Understand change process ** * *
Collaboration ** ** *
Focus on equity * * * *
Cultural proficiency
School culture ** *** *
Characteristics of PD ** *** * *** *
Inquiry process
Purpose/Use ** * * *** *** *
Assessment
Types of processes *** *** *** *** ** ***
Data
Data access - obtaining data ** *** ** * *
Data types ** * *** ** ** *** ***
Data quality * *** *** * ** ** ***
Data use/sufficiency * ** *** * * *
Data Analysis
Data displays ** * * **
Analysis actions * ** * ** * *** *
Statistics *** *** * * *
Inferences/ Interpretations * * *** *** *** * **
Instructional planning
Differentiate instruction/program * * *
Plan daily instruction * * *
Programmatic planning
Program changes * * **
Understand research evidence
Link research evidence to student performances
Link research evidence to instructional practices ** ** *
Link research evidence to programmatic planning * **

62
Categories Her
itag
e
Ho
lco
mb
Jam
es, M
ilen
kie
wic
z,
and
Buck
nam
Joh
nso
n
Joh
nso
n a
nd
La
Sal
le
Kel
ley
and
Do
wn
ey
Lo
ve,
Sti
les,
Mun
dry
,
and
DiR
ann
a
McM
illan
Ore
gon
Dep
artm
ent
of
Ed
uca
tio
n
Precursor Conditions
School Vision * *** ** *** *
Connection to other initiatives * * *** ** **
Authority * * * * * *** ** *
Understand change process ** * *** * * * **
Collaboration ** *** ** *** * ** *** ***
Focus on equity ** * *** *** *** *
Cultural proficiency * ** *** ***
School culture *** * ** ** * *** *
Characteristics of PD ** *** ** * * ** * *
Inquiry process
Purpose/Use *** *** *** *** * *** * ***
Assessment
Types of processes ** * * * *** *** ***
Data
Data access - obtaining data ** *** * * ** * * *
Data types *** *** ** *** * *** ** ***
Data quality ** * * * * * *** **
Data use/sufficiency * ** * *** * ***
Data Analysis
Data displays * ** * *** *
Analysis actions ** *** * *** *** *** * ***
Statistics * ** *** * **
Inferences/ Interpretations *** ** * *** * *** ** **
Instructional planning
Differentiate instruction/program * ** *
Plan daily instruction * * * * *
Programmatic planning
Program changes *** * ** * ** *
Understand research evidence
Link research evidence to student performances * *
Link research evidence to instructional practices ** ** **
Link research evidence to programmatic planning * * ***

63
Categories Pet
e an
d D
un
can
Po
ph
am
Tuck
er
Wel
lman
an
d
Lip
ton
Wh
ite
Wili
am (
2009)
Wili
am (
2011)
Precursor Conditions
School Vision * * **
Connection to other initiatives ** * * * *
Authority
Understand change process ** **
Collaboration * * * ** ** *
Focus on equity * * * **
Cultural proficiency *
School culture * * *
Characteristics of PD * * * *
Inquiry process
Purpose/Use ** * *** * **
Assessment
Types of processes ** *** * *** ***
Data
Data access - obtaining data * ** *** * **
Data types *** * ** * *
Data quality * *** * ***
Data use/sufficiency ** * ** ***
Data Analysis
Data displays * ** **
Analysis actions * * * *** *
Statistics * * *
Inferences/ Interpretations ** *** * *** * ***
Instructional planning
Differentiate instruction/program * ** *
Plan daily instruction * ** *
Programmatic planning
Program changes *
Understand research evidence
Link research evidence to student performances
Link research evidence to instructional practices ***
Link research evidence to programmatic planning
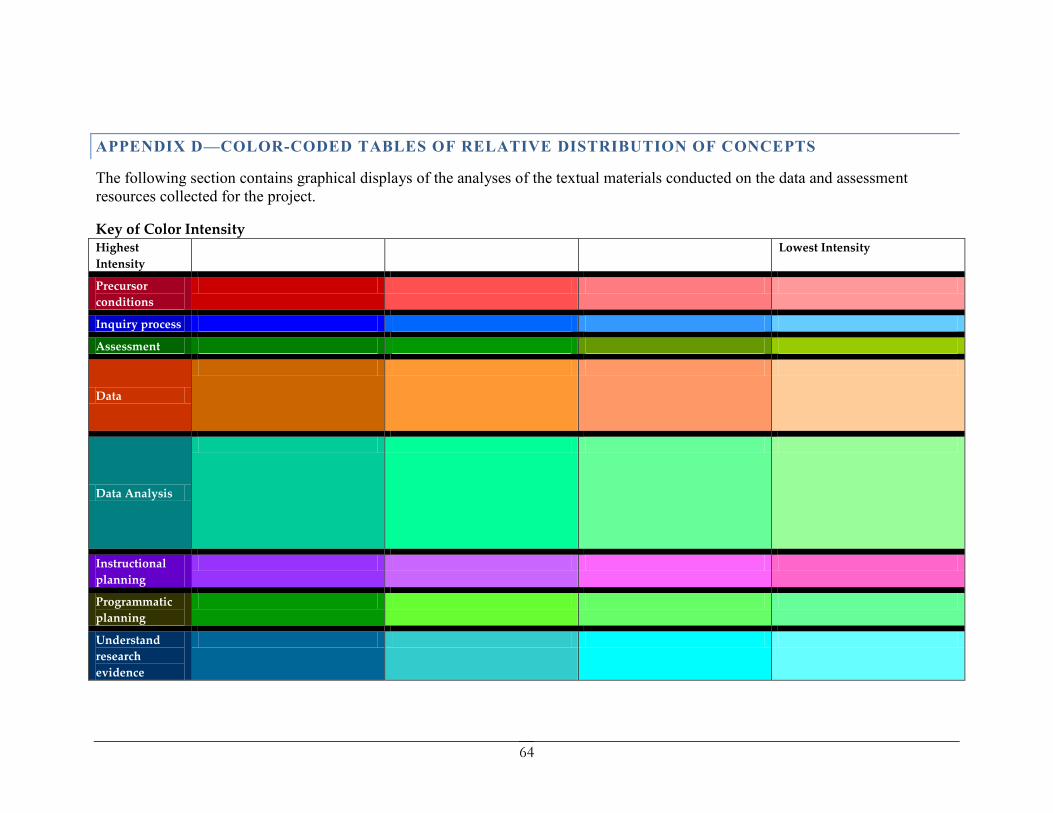
64
APPENDIX D—COLOR-CODED TABLES OF RELATIVE DISTRIBUTION OF CONCEPTS
The following section contains graphical displays of the analyses of the textual materials conducted on the data and assessment resources collected for the project.
Key of Color Intensity Highest
Intensity
Lowest Intensity
Precursor
conditions
Inquiry process
Assessment
Data
Data Analysis
Instructional
planning
Programmatic
planning
Understand
research
evidence

65
Ainsworth and Viegut (2006)
Precursor
conditions
School vision Connection to other initiatives Authority Understand change process
Collaboration Focus on equity Cultural proficiency School culture
Characteristics of PD
Inquiry process Purpose/Use
Assessment Types of processes Formative Summative
Data
Data access - obtaining data Nature of data systems Getting into system Collecting new data
Data types Demographic data Surveys External tests
School/district tests Classroom assessments
Data quality
Test fairness Test bias Timeliness
Reliability Alignment/standards Alignment/curriculum
Instrument/ test design Scoring
Data use/sufficiency Multiple forms Triangulation Prioritizing/discrimination
between options
Data Analysis
Data displays Appropriate use
Analysis actions
Observe patterns Summarize
Make comparisons Identify trends Analyze aggregated data
Analyze disaggregated data
Statistics
Correlation Causation Effect size
Descriptive analyses Significance Measurement error
Sample size Sampling error
Inferences/ Interpretations
Logic model Interpret trends Explain patterns
Identify hypotheses Connect multiple observations Interpret performance
Causal analysis Link performance to
goal/learning objective
Link student performance to
learning need
Link student performance
patterns to other causes Linking data to instruction
Instructional
planning
Differentiate instruction/program
Plan daily instruction Group Individuals
Programmatic
planning Program changes General Curricular changes Schedule changes
Understand research evidence Link research evidence to
student performances
Link research evidence to
instructional practices
Link research evidence to
programmatic planning
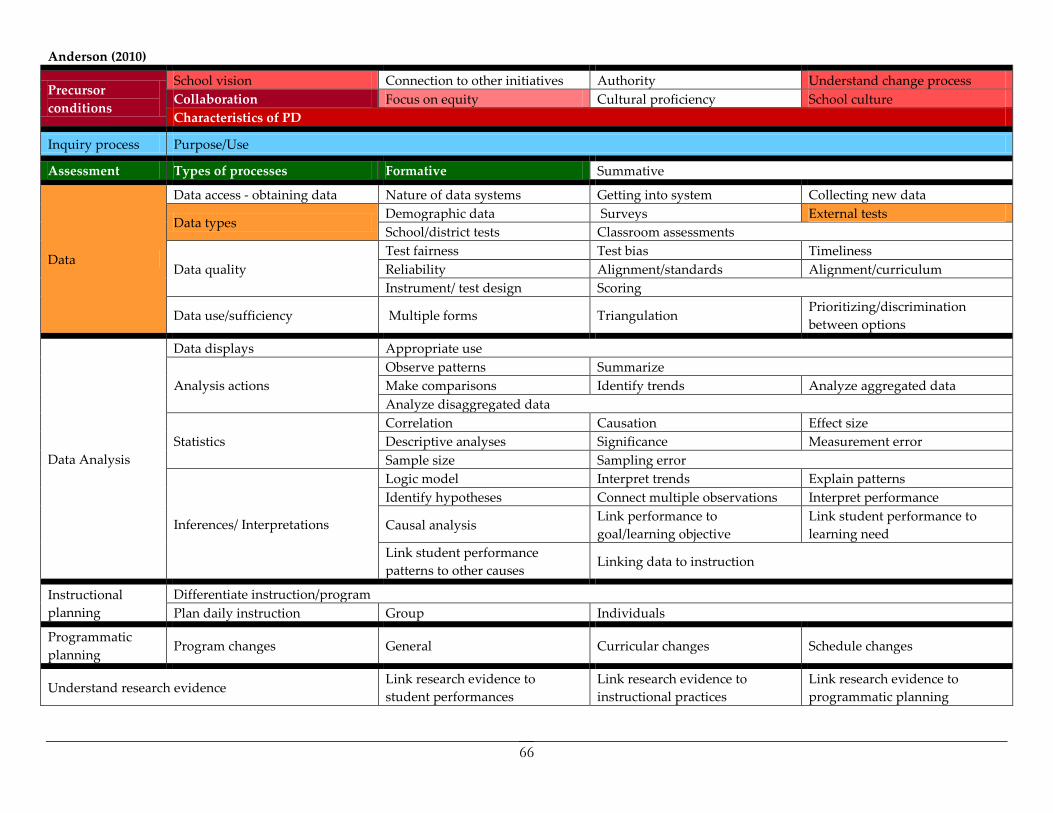
66
Anderson (2010)
Precursor
conditions
School vision Connection to other initiatives Authority Understand change process
Collaboration Focus on equity Cultural proficiency School culture
Characteristics of PD
Inquiry process Purpose/Use
Assessment Types of processes Formative Summative
Data
Data access - obtaining data Nature of data systems Getting into system Collecting new data
Data types Demographic data Surveys External tests
School/district tests Classroom assessments
Data quality
Test fairness Test bias Timeliness
Reliability Alignment/standards Alignment/curriculum
Instrument/ test design Scoring
Data use/sufficiency Multiple forms Triangulation Prioritizing/discrimination
between options
Data Analysis
Data displays Appropriate use
Analysis actions
Observe patterns Summarize
Make comparisons Identify trends Analyze aggregated data
Analyze disaggregated data
Statistics
Correlation Causation Effect size
Descriptive analyses Significance Measurement error
Sample size Sampling error
Inferences/ Interpretations
Logic model Interpret trends Explain patterns
Identify hypotheses Connect multiple observations Interpret performance
Causal analysis Link performance to
goal/learning objective
Link student performance to
learning need
Link student performance
patterns to other causes Linking data to instruction
Instructional
planning
Differentiate instruction/program
Plan daily instruction Group Individuals
Programmatic
planning Program changes General Curricular changes Schedule changes
Understand research evidence Link research evidence to
student performances
Link research evidence to
instructional practices
Link research evidence to
programmatic planning

67
Ankeney (2011)
Precursor
conditions
School vision Connection to other initiatives Authority Understand change process
Collaboration Focus on equity Cultural proficiency School culture
Characteristics of PD
Inquiry process Purpose/Use
Assessment Types of processes Formative Summative
Data
Data access - obtaining data Nature of data systems Getting into system Collecting new data
Data types Demographic data Surveys External tests
School/district tests Classroom assessments
Data quality
Test fairness Test bias Timeliness
Reliability Alignment/standards Alignment/curriculum
Instrument/ test design Scoring
Data use/sufficiency Multiple forms Triangulation Prioritizing/discrimination
between options
Data Analysis
Data displays Appropriate use
Analysis actions
Observe patterns Summarize
Make comparisons Identify trends Analyze aggregated data
Analyze disaggregated data
Statistics
Correlation Causation Effect size
Descriptive analyses Significance Measurement error
Sample size Sampling error
Inferences/ Interpretations
Logic model Interpret trends Explain patterns
Identify hypotheses Connect multiple observations Interpret performance
Causal analysis Link performance to
goal/learning objective
Link student performance to
learning need
Link student performance
patterns to other causes Linking data to instruction
Instructional
planning
Differentiate instruction/program
Plan daily instruction Group Individuals
Programmatic
planning Program changes General Curricular changes Schedule changes
Understand research evidence Link research evidence to
student performances
Link research evidence to
instructional practices
Link research evidence to
programmatic planning

68
Bambrick-Santoyo (2010)
Precursor
conditions
School vision Connection to other initiatives Authority Understand change process
Collaboration Focus on equity Cultural proficiency School culture
Characteristics of PD
Inquiry process Purpose/Use
Assessment Types of processes Formative Summative
Data
Data access - obtaining data Nature of data systems Getting into system Collecting new data
Data types Demographic data Surveys External tests
School/district tests Classroom assessments
Data quality
Test fairness Test bias Timeliness
Reliability Alignment/standards Alignment/curriculum
Instrument/ test design Scoring
Data use/sufficiency Multiple forms Triangulation Prioritizing/discrimination
between options
Data Analysis
Data displays Appropriate use
Analysis actions
Observe patterns Summarize
Make comparisons Identify trends Analyze aggregated data
Analyze disaggregated data
Statistics
Correlation Causation Effect size
Descriptive analyses Significance Measurement error
Sample size Sampling error
Inferences/ Interpretations
Logic model Interpret trends Explain patterns
Identify hypotheses Connect multiple observations Interpret performance
Causal analysis Link performance to
goal/learning objective
Link student performance to
learning need
Link student performance
patterns to other causes Linking data to instruction
Instructional
planning
Differentiate instruction/program
Plan daily instruction Group Individuals
Programmatic
planning Program changes General Curricular changes Schedule changes
Understand research evidence Link research evidence to
student performances
Link research evidence to
instructional practices
Link research evidence to
programmatic planning

69
Benjamin (2008)
Precursor
conditions
School vision Connection to other initiatives Authority Understand change process
Collaboration Focus on equity Cultural proficiency School culture
Characteristics of PD
Inquiry process Purpose/Use
Assessment Types of processes Formative Summative
Data
Data access - obtaining data Nature of data systems Getting into system Collecting new data
Data types Demographic data Surveys External tests
School/district tests Classroom assessments
Data quality
Test fairness Test bias Timeliness
Reliability Alignment/standards Alignment/curriculum
Instrument/ test design Scoring
Data use/sufficiency Multiple forms Triangulation Prioritizing/discrimination
between options
Data Analysis
Data displays Appropriate use
Analysis actions
Observe patterns Summarize
Make comparisons Identify trends Analyze aggregated data
Analyze disaggregated data
Statistics
Correlation Causation Effect size
Descriptive analyses Significance Measurement error
Sample size Sampling error
Inferences/ Interpretations
Logic model Interpret trends Explain patterns
Identify hypotheses Connect multiple observations Interpret performance
Causal analysis Link performance to
goal/learning objective
Link student performance to
learning need
Link student performance
patterns to other causes Linking data to instruction
Instructional
planning
Differentiate instruction/program
Plan daily instruction Group Individuals
Programmatic
planning Program changes General Curricular changes Schedule changes
Understand research evidence Link research evidence to
student performances
Link research evidence to
instructional practices
Link research evidence to
programmatic planning

70
Bernhardt (2004)
Precursor
conditions
School vision Connection to other initiatives Authority Understand change process
Collaboration Focus on equity Cultural proficiency School culture
Characteristics of PD
Inquiry process Purpose/Use
Assessment Types of processes Formative Summative
Data
Data access - obtaining data Nature of data systems Getting into system Collecting new data
Data types Demographic data Surveys External tests
School/district tests Classroom assessments
Data quality
Test fairness Test bias Timeliness
Reliability Alignment/standards Alignment/curriculum
Instrument/ test design Scoring
Data use/sufficiency Multiple forms Triangulation Prioritizing/discrimination
between options
Data Analysis
Data displays Appropriate use
Analysis actions
Observe patterns Summarize
Make comparisons Identify trends Analyze aggregated data
Analyze disaggregated data
Statistics
Correlation Causation Effect size
Descriptive analyses Significance Measurement error
Sample size Sampling error
Inferences/ Interpretations
Logic model Interpret trends Explain patterns
Identify hypotheses Connect multiple observations Interpret performance
Causal analysis Link performance to
goal/learning objective
Link student performance to
learning need
Link student performance
patterns to other causes Linking data to instruction
Instructional
planning
Differentiate instruction/program
Plan daily instruction Group Individuals
Programmatic
planning Program changes General Curricular changes Schedule changes
Understand research evidence Link research evidence to
student performances
Link research evidence to
instructional practices
Link research evidence to
programmatic planning

71
Bernhardt and Hébert (2011)
Precursor
conditions
School vision Connection to other initiatives Authority Understand change process
Collaboration Focus on equity Cultural proficiency School culture
Characteristics of PD
Inquiry process Purpose/Use
Assessment Types of processes Formative Summative
Data
Data access - obtaining data Nature of data systems Getting into system Collecting new data
Data types Demographic data Surveys External tests
School/district tests Classroom assessments
Data quality
Test fairness Test bias Timeliness
Reliability Alignment/standards Alignment/curriculum
Instrument/ test design Scoring
Data use/sufficiency Multiple forms Triangulation Prioritizing/discrimination
between options
Data Analysis
Data displays Appropriate use
Analysis actions
Observe patterns Summarize
Make comparisons Identify trends Analyze aggregated data
Analyze disaggregated data
Statistics
Correlation Causation Effect size
Descriptive analyses Significance Measurement error
Sample size Sampling error
Inferences/ Interpretations
Logic model Interpret trends Explain patterns
Identify hypotheses Connect multiple observations Interpret performance
Causal analysis Link performance to
goal/learning objective
Link student performance to
learning need
Link student performance
patterns to other causes 1 Linking data to instruction
Instructional
planning
Differentiate instruction/program
Plan daily instruction Group Individuals
Programmatic
planning Program changes General Curricular changes Schedule changes
Understand research evidence Link research evidence to
student performances
Link research evidence to
instructional practices
Link research evidence to
programmatic planning

72
Boudett, City, and Murnane (2005)
Precursor
conditions
School vision Connection to other initiatives Authority Understand change process
Collaboration Focus on equity Cultural proficiency School culture
Characteristics of PD
Inquiry process Purpose/Use
Assessment Types of processes Formative Summative
Data
Data access - obtaining data Nature of data systems Getting into system Collecting new data
Data types Demographic data Surveys External tests
School/district tests Classroom assessments
Data quality
Test fairness Test bias Timeliness
Reliability Alignment/standards Alignment/curriculum
Instrument/ test design Scoring
Data use/sufficiency Multiple forms Triangulation Prioritizing/discrimination
between options
Data Analysis
Data displays Appropriate use
Analysis actions
Observe patterns Summarize
Make comparisons Identify trends Analyze aggregated data
Analyze disaggregated data
Statistics
Correlation Causation Effect size
Descriptive analyses Significance Measurement error
Sample size Sampling error
Inferences/ Interpretations
Logic model Interpret trends Explain patterns
Identify hypotheses Connect multiple observations Interpret performance
Causal analysis Link performance to
goal/learning objective
Link student performance to
learning need
Link student performance
patterns to other causes Linking data to instruction
Instructional
planning
Differentiate instruction/program
Plan daily instruction Group Individuals
Programmatic
planning Program changes General Curricular changes Schedule changes
Understand research evidence Link research evidence to
student performances
Link research evidence to
instructional practices
Link research evidence to
programmatic planning

73
Brady and McColl (2010)
Precursor
conditions
School vision Connection to other initiatives Authority Understand change process
Collaboration Focus on equity Cultural proficiency School culture
Characteristics of PD
Inquiry process Purpose/Use
Assessment Types of processes Formative Summative
Data
Data access - obtaining data Nature of data systems Getting into system Collecting new data
Data types Demographic data Surveys External tests
School/district tests Classroom assessments
Data quality
Test fairness Test bias Timeliness
Reliability Alignment/standards Alignment/curriculum
Instrument/ test design Scoring
Data use/sufficiency Multiple forms Triangulation Prioritizing/discrimination
between options
Data Analysis
Data displays Appropriate use
Analysis actions
Observe patterns Summarize
Make comparisons Identify trends Analyze aggregated data
Analyze disaggregated data
Statistics
Correlation Causation Effect size
Descriptive analyses Significance Measurement error
Sample size Sampling error
Inferences/ Interpretations
Logic model Interpret trends Explain patterns
Identify hypotheses Connect multiple observations Interpret performance
Causal analysis Link performance to
goal/learning objective
Link student performance to
learning need
Link student performance
patterns to other causes Linking data to instruction
Instructional
planning
Differentiate instruction/program
Plan daily instruction Group Individuals
Programmatic
planning Program changes General Curricular changes Schedule changes
Understand research evidence Link research evidence to
student performances
Link research evidence to
instructional practices
Link research evidence to
programmatic planning

74
Carlson, Humphrey, and Reinhardt (2003)
Precursor
conditions
School vision Connection to other initiatives Authority Understand change process
Collaboration Focus on equity Cultural proficiency School culture
Characteristics of PD
Inquiry process Purpose/Use
Assessment Types of processes Formative Summative
Data
Data access - obtaining data Nature of data systems Getting into system Collecting new data
Data types Demographic data Surveys External tests
School/district tests Classroom assessments
Data quality
Test fairness Test bias Timeliness
Reliability Alignment/standards Alignment/curriculum
Instrument/ test design Scoring
Data use/sufficiency Multiple forms Triangulation Prioritizing/discrimination
between options
Data Analysis
Data displays Appropriate use
Analysis actions
Observe patterns Summarize
Make comparisons Identify trends Analyze aggregated data
Analyze disaggregated data
Statistics
Correlation Causation Effect size
Descriptive analyses Significance Measurement error
Sample size Sampling error
Inferences/ Interpretations
Logic model Interpret trends Explain patterns
Identify hypotheses Connect multiple observations Interpret performance
Causal analysis Link performance to
goal/learning objective
Link student performance to
learning need
Link student performance
patterns to other causes Linking data to instruction
Instructional
planning
Differentiate instruction/program
Plan daily instruction Group Individuals
Programmatic
planning Program changes General Curricular changes Schedule changes
Understand research evidence Link research evidence to
student performances
Link research evidence to
instructional practices
Link research evidence to
programmatic planning

75
Carroll and Carroll (2002)
Precursor
conditions
School vision Connection to other initiatives Authority Understand change process
Collaboration Focus on equity Cultural proficiency School culture
Characteristics of PD
Inquiry process Purpose/Use
Assessment Types of processes Formative Summative
Data
Data access - obtaining data Nature of data systems Getting into system Collecting new data
Data types Demographic data Surveys External tests
School/district tests Classroom assessments
Data quality
Test fairness Test bias Timeliness
Reliability Alignment/standards Alignment/curriculum
Instrument/ test design Scoring
Data use/sufficiency Multiple forms Triangulation Prioritizing/discrimination
between options
Data Analysis
Data displays Appropriate use
Analysis actions
Observe patterns Summarize
Make comparisons Identify trends Analyze aggregated data
Analyze disaggregated data
Statistics
Correlation Causation Effect size
Descriptive analyses Significance Measurement error
Sample size Sampling error
Inferences/ Interpretations
Logic model Interpret trends Explain patterns
Identify hypotheses Connect multiple observations Interpret performance
Causal analysis Link performance to
goal/learning objective
Link student performance to
learning need
Link student performance
patterns to other causes Linking data to instruction
Instructional
planning
Differentiate instruction/program
Plan daily instruction Group Individuals
Programmatic
planning Program changes General Curricular changes Schedule changes
Understand research evidence Link research evidence to
student performances
Link research evidence to
instructional practices
Link research evidence to
programmatic planning

76
Chappuis, Stiggins, Arter, and Chappuis (2009)
Precursor
conditions
School vision Connection to other initiatives Authority Understand change process
Collaboration Focus on equity Cultural proficiency School culture
Characteristics of PD
Inquiry process Purpose/Use
Assessment Types of processes Formative Summative
Data
Data access - obtaining data Nature of data systems Getting into system Collecting new data
Data types Demographic data Surveys External tests
School/district tests Classroom assessments
Data quality
Test fairness Test bias Timeliness
Reliability Alignment/standards Alignment/curriculum
Instrument/ test design Scoring
Data use/sufficiency Multiple forms Triangulation Prioritizing/discrimination
between options
Data Analysis
Data displays Appropriate use
Analysis actions
Observe patterns Summarize
Make comparisons Identify trends Analyze aggregated data
Analyze disaggregated data
Statistics
Correlation Causation Effect size
Descriptive analyses Significance Measurement error
Sample size Sampling error
Inferences/ Interpretations
Logic model Interpret trends Explain patterns
Identify hypotheses Connect multiple observations Interpret performance
Causal analysis Link performance to
goal/learning objective
Link student performance to
learning need
Link student performance
patterns to other causes Linking data to instruction
Instructional
planning
Differentiate instruction/program
Plan daily instruction Group Individuals
Programmatic
planning Program changes General Curricular changes Schedule changes
Understand research evidence Link research evidence to
student performances
Link research evidence to
instructional practices
Link research evidence to
programmatic planning
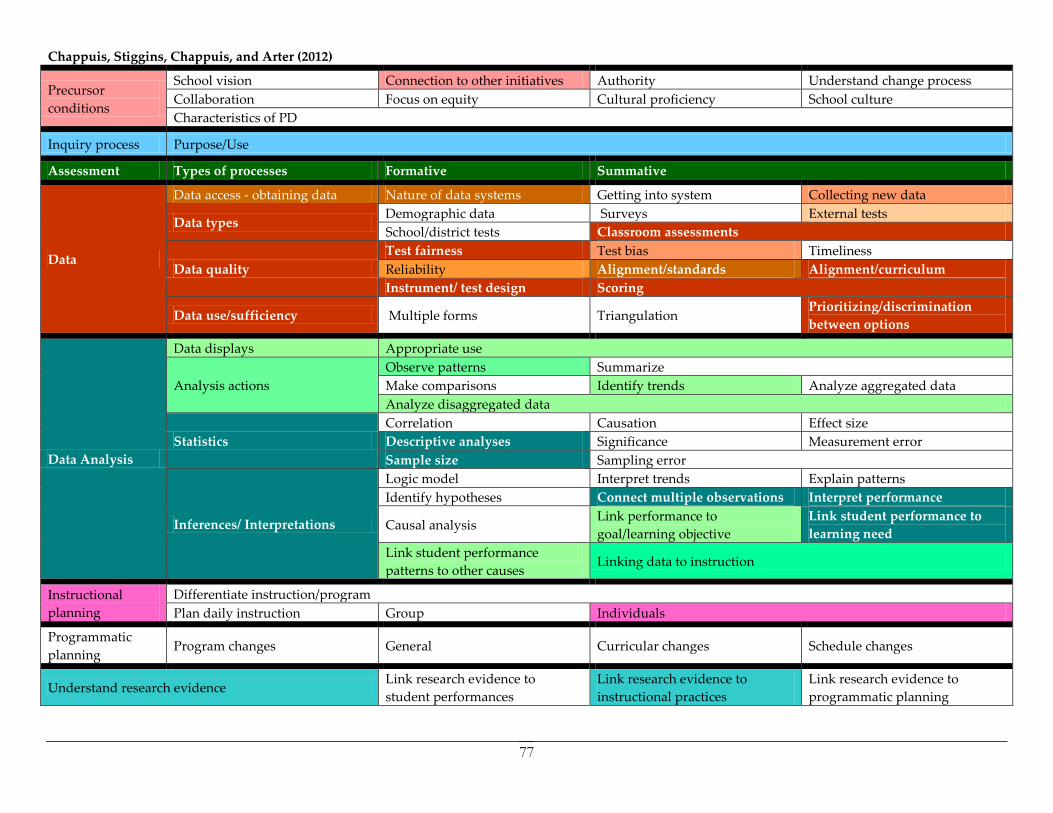
77
Chappuis, Stiggins, Chappuis, and Arter (2012)
Precursor
conditions
School vision Connection to other initiatives Authority Understand change process
Collaboration Focus on equity Cultural proficiency School culture
Characteristics of PD
Inquiry process Purpose/Use
Assessment Types of processes Formative Summative
Data
Data access - obtaining data Nature of data systems Getting into system Collecting new data
Data types Demographic data Surveys External tests
School/district tests Classroom assessments
Data quality
Test fairness Test bias Timeliness
Reliability Alignment/standards Alignment/curriculum
Instrument/ test design Scoring
Data use/sufficiency Multiple forms Triangulation Prioritizing/discrimination
between options
Data Analysis
Data displays Appropriate use
Analysis actions
Observe patterns Summarize
Make comparisons Identify trends Analyze aggregated data
Analyze disaggregated data
Statistics
Correlation Causation Effect size
Descriptive analyses Significance Measurement error
Sample size Sampling error
Inferences/ Interpretations
Logic model Interpret trends Explain patterns
Identify hypotheses Connect multiple observations Interpret performance
Causal analysis Link performance to
goal/learning objective
Link student performance to
learning need
Link student performance
patterns to other causes Linking data to instruction
Instructional
planning
Differentiate instruction/program
Plan daily instruction Group Individuals
Programmatic
planning Program changes General Curricular changes Schedule changes
Understand research evidence Link research evidence to
student performances
Link research evidence to
instructional practices
Link research evidence to
programmatic planning

78
Earl and Katz (2006)
Precursor
conditions
School vision Connection to other initiatives Authority Understand change process
Collaboration Focus on equity Cultural proficiency School culture
Characteristics of PD
Inquiry process Purpose/Use
Assessment Types of processes Formative Summative
Data
Data access - obtaining data Nature of data systems Getting into system Collecting new data
Data types Demographic data Surveys External tests
School/district tests Classroom assessments
Data quality
Test fairness Test bias Timeliness
Reliability Alignment/standards Alignment/curriculum
Instrument/ test design Scoring
Data use/sufficiency Multiple forms Triangulation Prioritizing/discrimination
between options
Data Analysis
Data displays Appropriate use
Analysis actions
Observe patterns Summarize
Make comparisons Identify trends Analyze aggregated data
Analyze disaggregated data
Statistics
Correlation Causation Effect size
Descriptive analyses Significance Measurement error
Sample size Sampling error
Inferences/ Interpretations
Logic model Interpret trends Explain patterns
Identify hypotheses Connect multiple observations Interpret performance
Causal analysis Link performance to
goal/learning objective
Link student performance to
learning need
Link student performance
patterns to other causes Linking data to instruction
Instructional
planning
Differentiate instruction/program
Plan daily instruction Group Individuals
Programmatic
planning Program changes General Curricular changes Schedule changes
Understand research evidence Link research evidence to
student performances
Link research evidence to
instructional practices
Link research evidence to
programmatic planning

79
Fisher and Frey (2007)
Precursor
conditions
School vision Connection to other initiatives Authority Understand change process
Collaboration Focus on equity Cultural proficiency School culture
Characteristics of PD
Inquiry process Purpose/Use
Assessment Types of processes Formative Summative
Data
Data access - obtaining data Nature of data systems Getting into system Collecting new data
Data types Demographic data Surveys External tests
School/district tests Classroom assessments
Data quality
Test fairness Test bias Timeliness
Reliability Alignment/standards Alignment/curriculum
Instrument/ test design Scoring
Data use/sufficiency Multiple forms Triangulation Prioritizing/discrimination
between options
Data Analysis
Data displays Appropriate use
Analysis actions
Observe patterns Summarize
Make comparisons Identify trends Analyze aggregated data
Analyze disaggregated data
Statistics
Correlation Causation Effect size
Descriptive analyses Significance Measurement error
Sample size Sampling error
Inferences/ Interpretations
Logic model Interpret trends Explain patterns
Identify hypotheses Connect multiple observations Interpret performance
Causal analysis Link performance to
goal/learning objective
Link student performance to
learning need
Link student performance
patterns to other causes Linking data to instruction
Instructional
planning
Differentiate instruction/program
Plan daily instruction Group Individuals
Programmatic
planning Program changes General Curricular changes Schedule changes
Understand research evidence Link research evidence to
student performances
Link research evidence to
instructional practices
Link research evidence to
programmatic planning

80
Goldring and Berends (2009)
Precursor
conditions
School vision Connection to other initiatives Authority Understand change process
Collaboration Focus on equity Cultural proficiency School culture
Characteristics of PD
Inquiry process Purpose/Use
Assessment Types of processes Formative Summative
Data
Data access - obtaining data Nature of data systems Getting into system Collecting new data
Data types Demographic data Surveys External tests
School/district tests Classroom assessments
Data quality
Test fairness Test bias Timeliness
Reliability Alignment/standards Alignment/curriculum
Instrument/ test design Scoring
Data use/sufficiency Multiple forms Triangulation Prioritizing/discrimination
between options
Data Analysis
Data displays Appropriate use
Analysis actions
Observe patterns Summarize
Make comparisons Identify trends Analyze aggregated data
Analyze disaggregated data
Statistics
Correlation Causation Effect size
Descriptive analyses Significance Measurement error
Sample size Sampling error
Inferences/ Interpretations
Logic model Interpret trends Explain patterns
Identify hypotheses Connect multiple observations Interpret performance
Causal analysis Link performance to
goal/learning objective
Link student performance to
learning need
Link student performance
patterns to other causes Linking data to instruction
Instructional
planning
Differentiate instruction/program
Plan daily instruction Group Individuals
Programmatic
planning Program changes General Curricular changes Schedule changes
Understand research evidence Link research evidence to
student performances
Link research evidence to
instructional practices
Link research evidence to
programmatic planning

81
Harlen (2007)
Precursor
conditions
School vision Connection to other initiatives Authority Understand change process
Collaboration Focus on equity Cultural proficiency School culture
Characteristics of PD
Inquiry process Purpose/Use
Assessment Types of processes Formative Summative
Data
Data access - obtaining data Nature of data systems Getting into system Collecting new data
Data types Demographic data Surveys External tests
School/district tests Classroom assessments
Data quality
Test fairness Test bias Timeliness
Reliability Alignment/standards Alignment/curriculum
Instrument/ test design Scoring
Data use/sufficiency Multiple forms Triangulation Prioritizing/discrimination
between options
Data Analysis
Data displays Appropriate use
Analysis actions
Observe patterns Summarize
Make comparisons Identify trends Analyze aggregated data
Analyze disaggregated data
Statistics
Correlation Causation Effect size
Descriptive analyses Significance Measurement error
Sample size Sampling error
Inferences/ Interpretations
Logic model Interpret trends Explain patterns
Identify hypotheses Connect multiple observations Interpret performance
Causal analysis Link performance to
goal/learning objective
Link student performance to
learning need
Link student performance
patterns to other causes Linking data to instruction
Instructional
planning
Differentiate instruction/program
Plan daily instruction Group Individuals
Programmatic
planning Program changes General Curricular changes Schedule changes
Understand research evidence Link research evidence to
student performances
Link research evidence to
instructional practices
Link research evidence to
programmatic planning

82
Heritage (2010)
Precursor
conditions
School vision Connection to other initiatives Authority Understand change process
Collaboration Focus on equity Cultural proficiency School culture
Characteristics of PD
Inquiry process Purpose/Use
Assessment Types of processes Formative Summative
Data
Data access - obtaining data Nature of data systems Getting into system Collecting new data
Data types Demographic data Surveys External tests
School/district tests Classroom assessments
Data quality
Test fairness Test bias Timeliness
Reliability Alignment/standards Alignment/curriculum
Instrument/ test design Scoring
Data use/sufficiency Multiple forms Triangulation Prioritizing/discrimination
between options
Data Analysis
Data displays Appropriate use
Analysis actions
Observe patterns Summarize
Make comparisons Identify trends Analyze aggregated data
Analyze disaggregated data
Statistics
Correlation Causation Effect size
Descriptive analyses Significance Measurement error
Sample size Sampling error
Inferences/ Interpretations
Logic model Interpret trends Explain patterns
Identify hypotheses Connect multiple observations Interpret performance
Causal analysis Link performance to
goal/learning objective
Link student performance to
learning need
Link student performance
patterns to other causes Linking data to instruction
Instructional
planning
Differentiate instruction/program
Plan daily instruction Group Individuals
Programmatic
planning Program changes General Curricular changes Schedule changes
Understand research evidence Link research evidence to
student performances
Link research evidence to
instructional practices
Link research evidence to
programmatic planning

83
Holcomb (2004)
Precursor
conditions
School vision Connection to other initiatives Authority Understand change process
Collaboration Focus on equity Cultural proficiency School culture
Characteristics of PD
Inquiry process Purpose/Use
Assessment Types of processes Formative Summative
Data
Data access - obtaining data Nature of data systems Getting into system Collecting new data
Data types Demographic data Surveys External tests
School/district tests Classroom assessments
Data quality
Test fairness Test bias Timeliness
Reliability Alignment/standards Alignment/curriculum
Instrument/ test design Scoring
Data use/sufficiency Multiple forms Triangulation Prioritizing/discrimination
between options
Data Analysis
Data displays Appropriate use
Analysis actions
Observe patterns Summarize
Make comparisons Identify trends Analyze aggregated data
Analyze disaggregated data
Statistics
Correlation Causation Effect size
Descriptive analyses Significance Measurement error
Sample size Sampling error
Inferences/ Interpretations
Logic model Interpret trends Explain patterns
Identify hypotheses Connect multiple observations Interpret performance
Causal analysis Link performance to
goal/learning objective
Link student performance to
learning need
Link student performance
patterns to other causes Linking data to instruction
Instructional
planning
Differentiate instruction/program
Plan daily instruction Group Individuals
Programmatic
planning Program changes General Curricular changes Schedule changes
Understand research evidence Link research evidence to
student performances
Link research evidence to
instructional practices
Link research evidence to
programmatic planning

84
James, Milenkiewicz, and Bucknam (2008)
Precursor
conditions
School vision Connection to other initiatives Authority Understand change process
Collaboration Focus on equity Cultural proficiency School culture
Characteristics of PD
Inquiry process Purpose/Use
Assessment Types of processes Formative Summative
Data
Data access - obtaining data Nature of data systems Getting into system Collecting new data
Data types Demographic data Surveys External tests
School/district tests Classroom assessments
Data quality
Test fairness Test bias Timeliness
Reliability Alignment/standards Alignment/curriculum
Instrument/ test design Scoring
Data use/sufficiency Multiple forms Triangulation Prioritizing/discrimination
between options
Data Analysis
Data displays Appropriate use
Analysis actions
Observe patterns Summarize
Make comparisons Identify trends Analyze aggregated data
Analyze disaggregated data
Statistics
Correlation Causation Effect size
Descriptive analyses Significance Measurement error
Sample size Sampling error
Inferences/ Interpretations
Logic model Interpret trends Explain patterns
Identify hypotheses Connect multiple observations Interpret performance
Causal analysis Link performance to
goal/learning objective
Link student performance to
learning need
Link student performance
patterns to other causes Linking data to instruction
Instructional
planning
Differentiate instruction/program
Plan daily instruction Group Individuals
Programmatic
planning Program changes General Curricular changes Schedule changes
Understand research evidence Link research evidence to
student performances
Link research evidence to
instructional practices
Link research evidence to
programmatic planning

85
Johnson (2002)
Precursor
conditions
School vision Connection to other initiatives Authority Understand change process
Collaboration Focus on equity Cultural proficiency School culture
Characteristics of PD
Inquiry process Purpose/Use
Assessment Types of processes Formative Summative
Data
Data access - obtaining data Nature of data systems Getting into system Collecting new data
Data types Demographic data Surveys External tests
School/district tests Classroom assessments
Data quality
Test fairness Test bias Timeliness
Reliability Alignment/standards Alignment/curriculum
Instrument/ test design Scoring
Data use/sufficiency Multiple forms Triangulation Prioritizing/discrimination
between options
Data Analysis
Data displays Appropriate use
Analysis actions
Observe patterns Summarize
Make comparisons Identify trends Analyze aggregated data
Analyze disaggregated data
Statistics
Correlation Causation Effect size
Descriptive analyses Significance Measurement error
Sample size Sampling error
Inferences/ Interpretations
Logic model Interpret trends Explain patterns
Identify hypotheses Connect multiple observations Interpret performance
Causal analysis Link performance to
goal/learning objective
Link student performance to
learning need
Link student performance
patterns to other causes Linking data to instruction
Instructional
planning
Differentiate instruction/program
Plan daily instruction Group Individuals
Programmatic
planning Program changes General Curricular changes Schedule changes
Understand research evidence Link research evidence to
student performances
Link research evidence to
instructional practices
Link research evidence to
programmatic planning

86
Johnson and La Salle (2010)
Precursor
conditions
School vision Connection to other initiatives Authority Understand change process
Collaboration Focus on equity Cultural proficiency School culture
Characteristics of PD
Inquiry process Purpose/Use
Assessment Types of processes Formative Summative
Data
Data access - obtaining data Nature of data systems Getting into system Collecting new data
Data types Demographic data Surveys External tests
School/district tests Classroom assessments
Data quality
Test fairness Test bias Timeliness
Reliability Alignment/standards Alignment/curriculum
Instrument/ test design Scoring
Data use/sufficiency Multiple forms Triangulation Prioritizing/discrimination
between options
Data Analysis
Data displays Appropriate use
Analysis actions
Observe patterns Summarize
Make comparisons Identify trends Analyze aggregated data
Analyze disaggregated data
Statistics
Correlation Causation Effect size
Descriptive analyses Significance Measurement error
Sample size Sampling error
Inferences/ Interpretations
Logic model Interpret trends Explain patterns
Identify hypotheses Connect multiple observations Interpret performance
Causal analysis Link performance to
goal/learning objective
Link student performance to
learning need
Link student performance
patterns to other causes Linking data to instruction
Instructional
planning
Differentiate instruction/program
Plan daily instruction Group Individuals
Programmatic
planning Program changes General Curricular changes Schedule changes
Understand research evidence Link research evidence to
student performances
Link research evidence to
instructional practices
Link research evidence to
programmatic planning

87
Kelley and Downey (2011)
Precursor
conditions
School vision Connection to other initiatives Authority Understand change process
Collaboration Focus on equity Cultural proficiency School culture
Characteristics of PD
Inquiry process Purpose/Use
Assessment Types of processes Formative Summative
Data
Data access - obtaining data Nature of data systems Getting into system Collecting new data
Data types Demographic data Surveys External tests
School/district tests Classroom assessments
Data quality
Test fairness Test bias Timeliness
Reliability Alignment/standards Alignment/curriculum
Instrument/ test design Scoring
Data use/sufficiency Multiple forms Triangulation Prioritizing/discrimination
between options
Data Analysis
Data displays Appropriate use
Analysis actions
Observe patterns Summarize
Make comparisons Identify trends Analyze aggregated data
Analyze disaggregated data
Statistics
Correlation Causation Effect size
Descriptive analyses Significance Measurement error
Sample size Sampling error
Inferences/ Interpretations
Logic model Interpret trends Explain patterns
Identify hypotheses Connect multiple observations Interpret performance
Causal analysis Link performance to
goal/learning objective
Link student performance to
learning need
Link student performance
patterns to other causes Linking data to instruction
Instructional
planning
Differentiate instruction/program
Plan daily instruction Group Individuals
Programmatic
planning Program changes General Curricular changes Schedule changes
Understand research evidence Link research evidence to
student performances
Link research evidence to
instructional practices
Link research evidence to
programmatic planning

88
Love, Stiles, Mundry, and DiRanna (2008)
Precursor
conditions
School vision Connection to other initiatives Authority Understand change process
Collaboration Focus on equity Cultural proficiency School culture
Characteristics of PD
Inquiry process Purpose/Use
Assessment Types of processes Formative Summative
Data
Data access - obtaining data Nature of data systems Getting into system Collecting new data
Data types Demographic data Surveys External tests
School/district tests Classroom assessments
Data quality
Test fairness Test bias Timeliness
Reliability Alignment/standards Alignment/curriculum
Instrument/ test design Scoring
Data use/sufficiency Multiple forms Triangulation Prioritizing/discrimination
between options
Data Analysis
Data displays Appropriate use
Analysis actions
Observe patterns Summarize
Make comparisons Identify trends Analyze aggregated data
Analyze disaggregated data
Statistics
Correlation Causation Effect size
Descriptive analyses Significance Measurement error
Sample size Sampling error
Inferences/ Interpretations
Logic model Interpret trends Explain patterns
Identify hypotheses Connect multiple observations Interpret performance
Causal analysis Link performance to
goal/learning objective
Link student performance to
learning need
Link student performance
patterns to other causes Linking data to instruction
Instructional
planning
Differentiate instruction/program
Plan daily instruction Group Individuals
Programmatic
planning Program changes General Curricular changes Schedule changes
Understand research evidence Link research evidence to
student performances
Link research evidence to
instructional practices
Link research evidence to
programmatic planning

89
McMillan (2007)
Precursor
conditions
School vision Connection to other initiatives Authority Understand change process
Collaboration Focus on equity Cultural proficiency School culture
Characteristics of PD
Inquiry process Purpose/Use
Assessment Types of processes Formative Summative
Data
Data access - obtaining data Nature of data systems Getting into system Collecting new data
Data types Demographic data Surveys External tests
School/district tests Classroom assessments
Data quality
Test fairness Test bias Timeliness
Reliability Alignment/standards Alignment/curriculum
Instrument/ test design Scoring
Data use/sufficiency Multiple forms Triangulation Prioritizing/discrimination
between options
Data Analysis
Data displays Appropriate use
Analysis actions
Observe patterns Summarize
Make comparisons Identify trends Analyze aggregated data
Analyze disaggregated data
Statistics
Correlation Causation Effect size
Descriptive analyses Significance Measurement error
Sample size Sampling error
Inferences/ Interpretations
Logic model Interpret trends Explain patterns
Identify hypotheses Connect multiple observations Interpret performance
Causal analysis Link performance to
goal/learning objective
Link student performance to
learning need
Link student performance
patterns to other causes Linking data to instruction
Instructional
planning
Differentiate instruction/program
Plan daily instruction Group Individuals
Programmatic
planning Program changes General Curricular changes Schedule changes
Understand research evidence Link research evidence to
student performances
Link research evidence to
instructional practices
Link research evidence to
programmatic planning

90
Oregon Department of Education (2012)
Precursor
conditions
School vision Connection to other initiatives Authority Understand change process
Collaboration Focus on equity Cultural proficiency School culture
Characteristics of PD
Inquiry process Purpose/Use
Assessment Types of processes Formative Summative
Data
Data access - obtaining data Nature of data systems Getting into system Collecting new data
Data types Demographic data Surveys External tests
School/district tests Classroom assessments
Data quality
Test fairness Test bias Timeliness
Reliability Alignment/standards Alignment/curriculum
Instrument/ test design Scoring
Data use/sufficiency Multiple forms Triangulation Prioritizing/discrimination
between options
Data Analysis
Data displays Appropriate use
Analysis actions
Observe patterns Summarize
Make comparisons Identify trends Analyze aggregated data
Analyze disaggregated data
Statistics
Correlation Causation Effect size
Descriptive analyses Significance Measurement error
Sample size Sampling error
Inferences/ Interpretations
Logic model Interpret trends Explain patterns
Identify hypotheses Connect multiple observations Interpret performance
Causal analysis Link performance to
goal/learning objective
Link student performance to
learning need
Link student performance
patterns to other causes Linking data to instruction
Instructional
planning
Differentiate instruction/program
Plan daily instruction Group Individuals
Programmatic
planning Program changes General Curricular changes Schedule changes
Understand research evidence Link research evidence to
student performances
Link research evidence to
instructional practices
Link research evidence to
programmatic planning
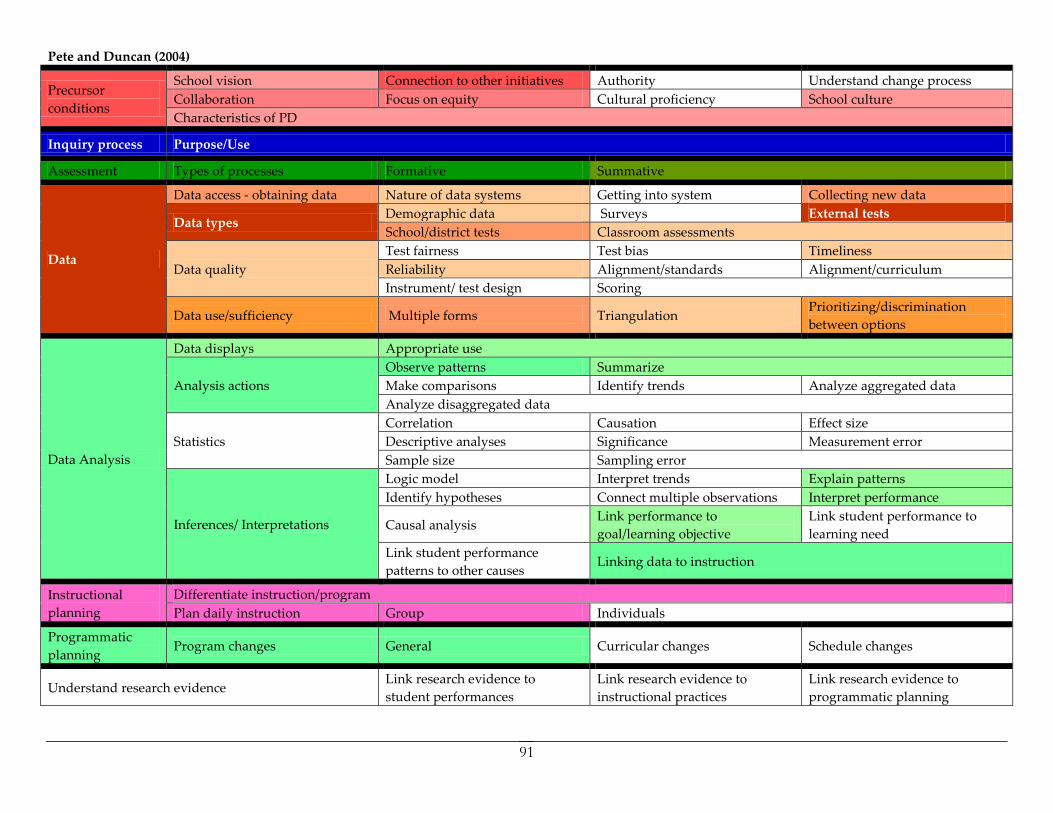
91
Pete and Duncan (2004)
Precursor
conditions
School vision Connection to other initiatives Authority Understand change process
Collaboration Focus on equity Cultural proficiency School culture
Characteristics of PD
Inquiry process Purpose/Use
Assessment Types of processes Formative Summative
Data
Data access - obtaining data Nature of data systems Getting into system Collecting new data
Data types Demographic data Surveys External tests
School/district tests Classroom assessments
Data quality
Test fairness Test bias Timeliness
Reliability Alignment/standards Alignment/curriculum
Instrument/ test design Scoring
Data use/sufficiency Multiple forms Triangulation Prioritizing/discrimination
between options
Data Analysis
Data displays Appropriate use
Analysis actions
Observe patterns Summarize
Make comparisons Identify trends Analyze aggregated data
Analyze disaggregated data
Statistics
Correlation Causation Effect size
Descriptive analyses Significance Measurement error
Sample size Sampling error
Inferences/ Interpretations
Logic model Interpret trends Explain patterns
Identify hypotheses Connect multiple observations Interpret performance
Causal analysis Link performance to
goal/learning objective
Link student performance to
learning need
Link student performance
patterns to other causes Linking data to instruction
Instructional
planning
Differentiate instruction/program
Plan daily instruction Group Individuals
Programmatic
planning Program changes General Curricular changes Schedule changes
Understand research evidence Link research evidence to
student performances
Link research evidence to
instructional practices
Link research evidence to
programmatic planning

92
Popham (2011)
Precursor
conditions
School vision Connection to other initiatives Authority Understand change process
Collaboration Focus on equity Cultural proficiency School culture
Characteristics of PD
Inquiry process Purpose/Use
Assessment Types of processes Formative Summative
Data
Data access - obtaining data Nature of data systems Getting into system Collecting new data
Data types Demographic data Surveys External tests
School/district tests Classroom assessments
Data quality
Test fairness Test bias Timeliness
Reliability Alignment/standards Alignment/curriculum
Instrument/ test design Scoring
Data use/sufficiency Multiple forms Triangulation Prioritizing/discrimination
between options
Data Analysis
Data displays Appropriate use
Analysis actions
Observe patterns Summarize
Make comparisons Identify trends Analyze aggregated data
Analyze disaggregated data
Statistics
Correlation Causation Effect size
Descriptive analyses Significance Measurement error
Sample size Sampling error
Inferences/ Interpretations
Logic model Interpret trends Explain patterns
Identify hypotheses Connect multiple observations Interpret performance
Causal analysis Link performance to
goal/learning objective
Link student performance to
learning need
Link student performance
patterns to other causes Linking data to instruction
Instructional
planning
Differentiate instruction/program
Plan daily instruction Group Individuals
Programmatic
planning Program changes General Curricular changes Schedule changes
Understand research evidence Link research evidence to
student performances
Link research evidence to
instructional practices
Link research evidence to
programmatic planning

93
Tucker (2010)
Precursor
conditions
School vision Connection to other initiatives Authority Understand change process
Collaboration Focus on equity Cultural proficiency School culture
Characteristics of PD
Inquiry process Purpose/Use
Assessment Types of processes Formative Summative
Data
Data access - obtaining data Nature of data systems Getting into system Collecting new data
Data types Demographic data Surveys External tests
School/district tests Classroom assessments
Data quality
Test fairness Test bias Timeliness
Reliability Alignment/standards Alignment/curriculum
Instrument/ test design Scoring
Data use/sufficiency Multiple forms Triangulation Prioritizing/discrimination
between options
Data Analysis
Data displays Appropriate use
Analysis actions
Observe patterns Summarize
Make comparisons Identify trends Analyze aggregated data
Analyze disaggregated data
Statistics
Correlation Causation Effect size
Descriptive analyses Significance Measurement error
Sample size Sampling error
Inferences/ Interpretations
Logic model Interpret trends Explain patterns
Identify hypotheses Connect multiple observations Interpret performance
Causal analysis Link performance to
goal/learning objective
Link student performance to
learning need
Link student performance
patterns to other causes Linking data to instruction
Instructional
planning
Differentiate instruction/program
Plan daily instruction Group Individuals
Programmatic
planning Program changes General Curricular changes Schedule changes
Understand research evidence Link research evidence to
student performances
Link research evidence to
instructional practices
Link research evidence to
programmatic planning

94
Wellman and Lipton (2004)
Precursor
conditions
School vision Connection to other initiatives Authority Understand change process
Collaboration Focus on equity Cultural proficiency School culture
Characteristics of PD
Inquiry process Purpose/Use
Assessment Types of processes Formative Summative
Data
Data access - obtaining data Nature of data systems Getting into system Collecting new data
Data types Demographic data Surveys External tests
School/district tests Classroom assessments
Data quality
Test fairness Test bias Timeliness
Reliability Alignment/standards Alignment/curriculum
Instrument/ test design Scoring
Data use/sufficiency Multiple forms Triangulation Prioritizing/discrimination
between options
Data Analysis
Data displays Appropriate use
Analysis actions
Observe patterns Summarize
Make comparisons Identify trends Analyze aggregated data
Analyze disaggregated data
Statistics
Correlation Causation Effect size
Descriptive analyses Significance Measurement error
Sample size Sampling error
Inferences/ Interpretations
Logic model Interpret trends Explain patterns
Identify hypotheses Connect multiple observations Interpret performance
Causal analysis Link performance to
goal/learning objective
Link student performance to
learning need
Link student performance
patterns to other causes Linking data to instruction
Instructional
planning
Differentiate instruction/program
Plan daily instruction Group Individuals
Programmatic
planning Program changes General Curricular changes Schedule changes
Understand research evidence Link research evidence to
student performances
Link research evidence to
instructional practices
Link research evidence to
programmatic planning

95
White (2011)
Precursor
conditions
School vision Connection to other initiatives Authority Understand change process
Collaboration Focus on equity Cultural proficiency School culture
Characteristics of PD
Inquiry process Purpose/Use
Assessment Types of processes Formative Summative
Data
Data access - obtaining data Nature of data systems Getting into system Collecting new data
Data types Demographic data Surveys External tests
School/district tests Classroom assessments
Data quality
Test fairness Test bias Timeliness
Reliability Alignment/standards Alignment/curriculum
Instrument/ test design Scoring
Data use/sufficiency Multiple forms Triangulation Prioritizing/discrimination
between options
Data Analysis
Data displays Appropriate use
Analysis actions
Observe patterns Summarize
Make comparisons Identify trends Analyze aggregated data
Analyze disaggregated data
Statistics
Correlation Causation Effect size
Descriptive analyses Significance Measurement error
Sample size Sampling error
Inferences/ Interpretations
Logic model Interpret trends Explain patterns
Identify hypotheses Connect multiple observations Interpret performance
Causal analysis Link performance to
goal/learning objective
Link student performance to
learning need
Link student performance
patterns to other causes Linking data to instruction
Instructional
planning
Differentiate instruction/program
Plan daily instruction Group Individuals
Programmatic
planning Program changes General Curricular changes Schedule changes
Understand research evidence Link research evidence to
student performances
Link research evidence to
instructional practices
Link research evidence to
programmatic planning

96
Wiliam (2009)
Precursor
conditions
School vision Connection to other initiatives Authority Understand change process
Collaboration Focus on equity Cultural proficiency School culture
Characteristics of PD
Inquiry process Purpose/Use
Assessment Types of processes Formative Summative
Data
Data access - obtaining data Nature of data systems Getting into system Collecting new data
Data types Demographic data Surveys External tests
School/district tests Classroom assessments
Data quality
Test fairness Test bias Timeliness
Reliability Alignment/standards Alignment/curriculum
Instrument/ test design Scoring
Data use/sufficiency Multiple forms Triangulation Prioritizing/discrimination
between options
Data Analysis
Data displays Appropriate use
Analysis actions
Observe patterns Summarize
Make comparisons Identify trends Analyze aggregated data
Analyze disaggregated data
Statistics
Correlation Causation Effect size
Descriptive analyses Significance Measurement error
Sample size Sampling error
Inferences/ Interpretations
Logic model Interpret trends Explain patterns
Identify hypotheses Connect multiple observations Interpret performance
Causal analysis Link performance to
goal/learning objective
Link student performance to
learning need
Link student performance
patterns to other causes Linking data to instruction
Instructional
planning
Differentiate instruction/program
Plan daily instruction Group Individuals
Programmatic
planning Program changes General Curricular changes Schedule changes
Understand research evidence Link research evidence to
student performances
Link research evidence to
instructional practices
Link research evidence to
programmatic planning

97
Wiliam (2011)
Precursor
conditions
School vision Connection to other initiatives Authority Understand change process
Collaboration Focus on equity Cultural proficiency School culture
Characteristics of PD
Inquiry process Purpose/Use
Assessment Types of processes Formative Summative
Data
Data access - obtaining data Nature of data systems Getting into system Collecting new data
Data types Demographic data Surveys External tests
School/district tests Classroom assessments
Data quality
Test fairness Test bias Timeliness
Reliability Alignment/standards Alignment/curriculum
Instrument/ test design Scoring
Data use/sufficiency Multiple forms Triangulation Prioritizing/discrimination
between options
Data Analysis
Data displays Appropriate use
Analysis actions
Observe patterns Summarize
Make comparisons Identify trends Analyze aggregated data
Analyze disaggregated data
Statistics
Correlation Causation Effect size
Descriptive analyses Significance Measurement error
Sample size Sampling error
Inferences/ Interpretations
Logic model Interpret trends Explain patterns
Identify hypotheses Connect multiple observations Interpret performance
Causal analysis Link performance to
goal/learning objective
Link student performance to
learning need
Link student performance
patterns to other causes Linking data to instruction
Instructional
planning
Differentiate instruction/program
Plan daily instruction Group Individuals
Programmatic
planning Program changes General Curricular changes Schedule changes
Understand research evidence Link research evidence to
student performances
Link research evidence to
instructional practices
Link research evidence to
programmatic planning

98
APPENDIX E—PRE-MEETING DEFINITIONS
List of Skills and Knowledge from Definitions
Identify problems of practice (R, PD, R) Synthesize diverse data/information/assimilate (R, R, R) Engage in inquiry cycle (PD, R) Identifying the right data/select data/qualitative and quantitative/evaluate applicability/understanding utility of data (PD, PD, R, R, R, R, PM/F, R, R, PM/F, PD, R, PD, R, R, R, R, R, O, PM/F) Understanding data quality and limitations – accuracy, completeness (PD, R, R, R, R, R, R, R, R, R, PM/F, PM/F, R, PD, R) Understanding how to use the findings (PD, O, R, PD, R) Understanding the purposes of different data (PD, R, R, PM/F, PD, PD, R, R, PD, PD) Framing questions (PD, R, R, R, R, R, R, PM/F, O, R) Using multiple sources of data (PD. PD, R, R, R, R, PD) Using formative and summative assessments/knowing which assessments/benchmarks (O, PD, PD, PD, PD) Knowing where to find the right data/data location (PD, R, R, R) Ability to assess patterns/trends (PD, R, PD) Knowing the research that can inform the issue (PD, R) Summarizing data/Explain (PD, R, R, R, R, PD) Communicating information/findings (PD, O, O, R, R, R, PD) Ability to use technology to support data use (PD, R, R) Collect data/store (R, PD, R, PD, PM/F, O, R, PM/F, PM/F, R, O) Analyze data (R, R, R, R, R, PD, R, R, R, PM/F, PM/F, PD, R, O, R, O, R) Analyze different levels of data – cohort, course, grade (PD) Drilling down to different layers of data – aggregate, disaggregate, strand, item (PD) Rethinking with new information (R) Collaboration (PD, R, R,R) Instructional decision making/pedagogical data literacy/instructional adjustments (R, R, R, PD, PD, PD, R, R, O, PD, PD) Interpretation (R, R, R, R, R, O, O, R, R, R, R, O, R, O, R, R, NA, RN, MH, NS, JC, KD, AC) Data comprehension [data displays and representations/reports/presentations/longitudinal, cross-sectional] (R, R, R, R, PM/F, R, PD, PD, R, PD, PD) Unpacking information (R, R) Ability to solve problems (R) Making meaning/identify and critique meaning (R, R, O, R, R, R, R, R, R, R) Marshal facts/Support or refute (R, R, R) Use of statistics (PD, R, R, O) Use of quantitative evidence (R, R) Use qualitative data (R) Draw inference (R, R, R, R) Knowledge of assessments/psychometrics (R, R, R, R, PD, PD, R, R, PD, R, R)

99
Application of interpretations (R, R, R, PD) Organizing (R) Understanding how to involve stakeholders (R) Evaluate outcomes/scrutinizing results (R, PM/F, R, PD) Action that leads to change (O, O, O, R, R, R PD, PD, R) Transforming data into information and knowledge and actionable decisions (R, R, R, R, R, PD, R, R) Translating knowledge into appropriate responses/implement decision/draw conclusions (R, R, R, PD, R, R, R, R) Ability to access data (O, O, R, PM/F, PM/F, R, O) Ability to evaluate success of proposed solution/feedback loop (PM/F, R) Ability to understand the data-driven process (PM/F) Understand the context in which decision is being made (R, R, R, PM/F, R, R, R) Probe for causality (R) Generate hypotheses (R) Test assumptions/hypotheses (R) Manipulate data (O) Using habits of mind (R) Think critically (R) Critique arguments (R) Considers impact, consequences – intended or unintended (R, R, R, R) Pedagogical content knowledge (R, R, PD) Administrative knowledge (R, R) Organize data (R, R, R) Prioritize data (R) Determines additional next steps (R) Communicate findings (R, R, PD) Understanding what data are not actionable (R, R) Troubleshooting problematic data (R) Ethics of data use (R, R, R, PM/F, R) Understanding scaled scores, percentiles, performance levels (PD) Belief in data (PD) Identifying purpose (PD) Developing a sound design of assessments (PD) Involve students (PD) Metacognitive aspects/knowing or nor knowing about data (KD) Generating data (R) Use data (R, R, PD, R, R, R, R, R, R, R, PM/F, R, O, R, O, R, PD, PM/F) Instructional data literacy = statistics literacy + assessment literacy + analysis literacy (R) Content [what] and Performance Components [how much knowledge and skills] (R) Understanding the difference along a continuum from basic skills in data literacy to complete fluency – level of ability necessary to be considered data literate (PM/F, R, R) Awareness of knowledge/skill – Application of knowledge/skill – Mastery of knowledge/skill (PD)

100
“At the state department and college/university levels we are doing a damn lousy job of teaching data literacy. Too few states demand courses on testing and measurement. Too few colleges have those courses taught (when taught at all) by people who could plausibly be described as psychometrically competent. We spend too much time on the statistics of data and too little on the ‘how to make constructive use of data’ and the ethics of data gathering and use.” (R) KEY Researcher Professional Developer Policymaker/Funder
Other

101
APPENDIX F—HANDS-ON ACTIVITY DEPICTIONS

102

103

104
APPENDIX G—COMMENTS FROM THE TRANSCRIPTS Transcripts from the meeting were audio taped and transcribed. These transcripts were used to analyze the comments made by the meeting participants. The transcripts were analyzed for key comments, challenges, recommendations, and next steps. We present a compilation of a subset of comments that help to illustrate the main points made by the experts over the course of the meeting.
DATA LITERACY
There is a need to provide a conceptual or operational framework around what it means to be data literate. This framework can serve as a platform for the training side to build human capacity around date use. It can inform both professional development of in-service education and institutions of higher education for the preparation of pre-service teachers and administrators.
Achieving a definition of data literacy has the potential to influence the field in a number of ways:
o It can inform the development or modification of professional development models.
o It can impact how data concepts are introduced or integrated into educator preparation courses.
o It can impact research projects and influence the development of a shared research agenda.
o It can influence the funding of research and development projects that are intended to inform new resources, models, and tools.
o It can impact how policy makers view data-driven decision making, thereby influencing licensure and certification practices.
o It can influence the hiring practices of educators. o It can impact the development of tools, data systems, and resources to help
educators use data effectively. If the field does not know what data literacy is, how can educators to become proficient
with data? There is a need for examples of data literacy because the field is unsure what it actually is.
The field needs to parse out the specific competencies, skills, and knowledge that educators need to be considered data literate.
There is a continuum of data literacy from basic to advanced proficiency. The field needs to understand what a minimum or basic level of competency with data entails; that is, how data literate do educators need to be. The field also needs to understand what it means to have advanced proficiency. How do all the component parts of data literacy fit together to form proficiency? The field needs to identify what it means to be completely data literate.
Also considering a continuum of experience among educators, how does the field define data literacy in terms of points along that continuum and different levels of a school system hierarchy?
The field needs to explore the relationship of data literacy with content knowledge, pedagogy, and administrative knowledge.

105
Can educators be good teachers or administrators without being data literate? Can they be considered effective without being data or assessment literate?
The field needs to explore the overlap between data literacy and assessment literacy. Experts that define data broadly beyond the scope of student test results maintain that assessment literacy is a component of data literacy because there are many more sources of data than just test results.
In parsing out the difference between data and assessment literacy, the field needs to understand what else is involved and what are the surrounds. How much assessment literacy do educators need? How does the field conceptualize assessment and data literacy and develop the competencies? What role do assessment skills have in improved teaching?
What is the literacy component in data literacy? Should educators simply be consumers of information? Does this differ based on roles? Data literacy is seen as a habit of mind or a disposition. How does the field create habits
of mind for educators to request evidence, to evaluate evidence, and to value evidence? Can the field distinguish between the “knowing how” versus the “knowing that” in terms
of data literacy, and how would the competencies be developed and measured? This relates to the need for declarative, procedural, strategic, and schematic knowledge. What are the variations in such knowledge?
How does the field help educators make better decisions and use evidence more effectively?
How do educators determine knowledge gaps of their students? How do teachers link data skills with instruction and pedagogical content knowledge to
make diagnoses? How do educators translate data into actionable knowledge? Is there a disposition among educators to look for information or data, form queries, and
provide evidence? How does the field develop human judgment among educators? How do teachers learn to evaluate the quality of evidence? How much statistical knowledge do educators need? Is this role-based? The expert
participants did not think that statistical knowledge for teachers was important, but that some knowledge for administrators was necessary.
Do educators understand some of the fundamental measurement concepts such as reliability and validity, as well as error of measurement.
Can educators be trained to: o Test their own thinking; o Challenge assumptions; o Show evidence of meta-cognition; o Formulate queries; and o Determine if there is sufficient supporting evidence?
Do educators know how to establish objectives and monitor outcomes? Do teachers know how to pose instructionally relevant questions? How do teachers develop interpretative strategies and skills and how do these translate
into instructionally action?

106
What knowledge do principals and administrators need to have and how does that differ from what is expected of teachers?
What are the data literacy challenges at all levels? What is the extent of data literacy needed among other stakeholder groups, such as school
board members, superintendents, state education agency staff? Might the field expect disciplinary differences in data literacy? Might the field expect teachers who teach at the elementary, middle, or high school levels
to differ in their data literacy? Can data literacy skills and knowledge be acquired in the abstract or do they need to be
linked to: o Real-world experiences; o Real activities; o Real data; and o Content?
There is a need to consider the differences between content-dependent and content-independent decision making processes.
How do educators learn to translate abstract concepts into real practice? How does the field establish a benchmark for next steps in skill acquisition and for a
progression of learning in terms of data literacy skills? Is there consistency across researchers, professional development providers, policy
makers, educator preparation experts, and other stakeholders about what it means to be data literate?
Is there consistency across and within districts on what teachers and administrators need to know and be able to exhibit in terms of proficiency with data?
CONCEPTUAL MODEL FOR DATA LITERACY There is a need to develop a conceptual model and framework for data literacy and
penetrate professional development. The field needs to lay out the conceptual terrain of data literacy, which is different from an operational definition.
The field would benefit from having a theoretical model that can undergird both research and practice.
An operational definition provides a framework to build a research and development agenda.
There is a need for a theory of change around data literacy. That is, what are the anticipated outcomes from data literate educators using data to inform their practice? What are the mechanisms by which the outcomes occur? What is the change process?
How does the field build bridges between data literacy and assessment literacy to create a shared framework?
Where does the expertise in data literacy need to reside?
ORGANIZATIONAL FACTORS Where do data literacy and data use fit into schools and districts as learning
organizations?

107
What are the organizational influences that impact the implementation of data use? What are the context and the surrounds that influence the landscape of data literacy? What are the precursor conditions that facilitate data literacy? What are the contextual factors?
The field needs to explore the structures and processes needed within a system to support data-driven decision making.
How do districts become data literate? How do they enculturate data-driven decision making?
How can one break into a system to affect change? How does an educational agency create a sustainable data culture?
The field needs to identify the levers for stimulating change in terms of the components needed for enculturating data-driven decision making and bringing it to scale. How does the field parse out the components, structures, supports, complexities, and relatedness of the system? What are the incentives?
There needs to be recognition that value and utility are related. Data use must be valued and communicated to educators. Educators need to recognize and observe the utility of data pertaining to their practice.
How do districts come to value data use? This is a critical component. Data use needs to become a normal and regular part of educators’ practice. It should not
be an isolated event. It must be an integrated component. It should be part of the culture of data use.
How does the field handle district and educator resistance to data use, data literacy, and the change process? There needs to be recognition that even if a district seeks to change, the process is challenging.
How do we get districts to own the process and own the problem? This is an ongoing issue that has to survive administrative changes and be sustained over time. It is not only a sustainability issue, but also a scalability issue. The demand must be created for data use and therefore training around data literacy. Districts must take responsibility.
The field needs to consider the conditions that relate to data use “working” and how the conditions intersect with factors in schools.
How can higher levels of school and district organizations better support classroom practices and teachers in terms of data use and the acquisition of data literacy?
Data-driven decision making is systemic and important because of who controls the resources, money, and opportunities for implementing data use in an educational agency. It impacts the provision for professional development opportunities, release or shared planning time, data teaming, data coaches, the establishment of a data culture, data leadership, a data system and related tools, and other relevant components.
It is important to be explicit about describing the data competencies, skills, and knowledge needed of educators.
What are the implications of data literacy on district hiring practices and policies? How does the instructional arm of the district become involved in hiring decisions so that the importance of data literacy comes to the fore? Should data literacy be a requirement for hiring? How does data literacy become integrated into job descriptions, describing the core competencies and credentialing requirements?
How do these hiring issues get fed back to feeder schools of education to promote the building of capacity in schools of education?

108
It is critical for leadership to create a vision for data use (Hamilton, et al., 2009). That vision needs to be communicated to staff and provides the rationale for acquiring data literacy and using data to inform practice. Data-informed leadership is essential. What kinds of supports and resources can be provided to principals and leaders to support the improvement of data literacy and the enculturation of data?
Administrators are not typically trained to know how to support the change process. The field needs to consider how to provide such supports and resources.
What is the role of the student in data use within district? The IES Practice Guide (Hamilton, et al., 2009) made clear as one of its five recommendations that students should become their own data-driven decision makers. How do districts and teachers make this happen?
How does a district introduce and implement standards for data use? Educational agencies need to ensure ethical practice around data use. How can it be
created? How can it be sustained? How can it be taught? A recommendation was made that a communication system within a school building be
established to facilitate shared data use. It would help to provide data analytic capacity for districts. This is not a typical skill set
that resides in most districts. Districts need to have accessible and relevant data systems, tools, and applications that
provide value-added and utility for end users. Pacing guides and time are two major challenges for educators. What are the
considerations for a work around in order for educators to use data without the use becoming overly burdensome? Time has become a four-letter word for educators. Eventually with experience, data use will become more enculturated and an integrated part of practice. It should not require additional time. It should become a regular tool in an educator’s repertoire.
DATA PROPERTIES
Data need to translate into action. Educators must be armed with data that are usable. The data collections need to make sense, have a purpose, have relevance, and have utility.
Educators need to understand why they are being asked to collect or use the data. Thus, there needs to be a direct alignment between the data and the needs and purposes.
The validity of the data types must be considered. This goes to purpose and use. Validity does not necessarily reside in the data or the instruments per se. Instead, validity resides in the interpretations made from the data.
Data have to be meaningful. Therefore, it is imperative that the testing or performance data given to educators align with and address the questions being asked. The data must be valid for the types of interpretations being made.
The concept of data should be broadened to evidence. What constitutes evidence to support a decision? A fundamental principle in data literacy is that there are different data, different purposes,
and different users. The same data will have different meaning and be used for different purposes depending on the role the end user plays. Different data are needed by educators with different roles. This notion of role-based data use is important. Thus, there is a need to articulate the many different kinds of data and data use and the target audiences.
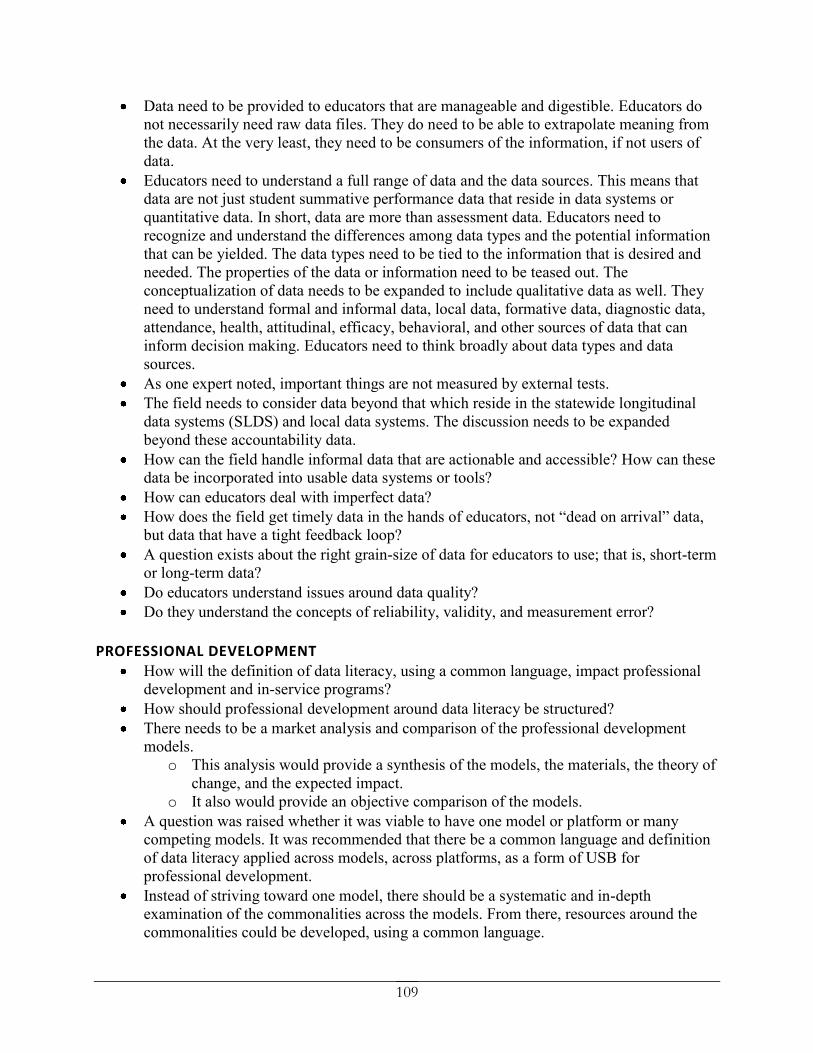
109
Data need to be provided to educators that are manageable and digestible. Educators do not necessarily need raw data files. They do need to be able to extrapolate meaning from the data. At the very least, they need to be consumers of the information, if not users of data.
Educators need to understand a full range of data and the data sources. This means that data are not just student summative performance data that reside in data systems or quantitative data. In short, data are more than assessment data. Educators need to recognize and understand the differences among data types and the potential information that can be yielded. The data types need to be tied to the information that is desired and needed. The properties of the data or information need to be teased out. The conceptualization of data needs to be expanded to include qualitative data as well. They need to understand formal and informal data, local data, formative data, diagnostic data, attendance, health, attitudinal, efficacy, behavioral, and other sources of data that can inform decision making. Educators need to think broadly about data types and data sources.
As one expert noted, important things are not measured by external tests. The field needs to consider data beyond that which reside in the statewide longitudinal
data systems (SLDS) and local data systems. The discussion needs to be expanded beyond these accountability data.
How can the field handle informal data that are actionable and accessible? How can these data be incorporated into usable data systems or tools?
How can educators deal with imperfect data? How does the field get timely data in the hands of educators, not “dead on arrival” data,
but data that have a tight feedback loop? A question exists about the right grain-size of data for educators to use; that is, short-term
or long-term data? Do educators understand issues around data quality? Do they understand the concepts of reliability, validity, and measurement error?
PROFESSIONAL DEVELOPMENT
How will the definition of data literacy, using a common language, impact professional development and in-service programs?
How should professional development around data literacy be structured? There needs to be a market analysis and comparison of the professional development
models. o This analysis would provide a synthesis of the models, the materials, the theory of
change, and the expected impact. o It also would provide an objective comparison of the models.
A question was raised whether it was viable to have one model or platform or many competing models. It was recommended that there be a common language and definition of data literacy applied across models, across platforms, as a form of USB for professional development.
Instead of striving toward one model, there should be a systematic and in-depth examination of the commonalities across the models. From there, resources around the commonalities could be developed, using a common language.

110
There is a question of whether the interventions are scalable. How does the field build expertise around data to provide better evidence and to make
better decisions? How does the field ensure that the educators have the abilities to make decisions? How
can that be measured? Teachers are expected to be lifelong learners. Incorporating data-driven practices into
their skill set is an important skill acquisition. Professional developers must help in this process. There is a need to pay attention to the development of teachers, depending on where they are in their career. It is unreasonable to expect certain skills and knowledge from beginning teachers, as experience and content knowledge is needed. It is also unreasonable to expect the absence of such skills from experienced or mature educators.
There needs to be consideration of how to help experienced teachers develop the knowledge and skills that comprise data literacy and how that differs from less experienced teachers.
Professional developers cannot simply dump knowledge on educators and expect action. There needs to be a learning and growth curve.
How do the professional development providers stimulate educators to analyze data to: o Evaluate programmatic effectiveness; and o Evaluate instructional effectiveness?
The field could benefit from understanding how professional development providers adopt and adapt models and what is the minimum level or amount of training that can be administered that is both viable and can yield evidence of data literacy.
There was a recommendation to integrate data literacy into assessment literacy training12. It could be argued that assessment literacy should be subsumed within the broader conceptualization of data literacy training.
There is a perception that there is a disconnect between the training and the practice. The professional development experts expressed concern about how local education agencies sustain the impact of the training once the professional development is completed.
What kinds of professional development opportunities exist: o For teachers? o For principals? o For superintendent? o For other educators?
What is the model for training around data teaming? What is the role of data analytics in data literacy training? What is the role of learning analytics and data mining? What is the role of data systems in data literacy training? Can and should professional development, based on the common definition of data
literacy, inform teacher and administrator preparation programs? It is better to train educators at the pre-service level around data literacy or have them
enter the profession as a tabla rasa?
12 It is important to note that this recommendation came from a professional development provider who focuses only on assessment.

111
BEST PRACTICES AND MODELS
It is important to disseminate information about different models of professional development and practice so that the field becomes aware of the various options.
A question was raised about whether the field could benefit from selecting one model or functioning with multiple models.
How should the field handle the issue of variation among models? The field should examine the systematic variation of components of the models. How do the models account for variations in context as applied to the implementation
process? There needs to be an objective discussion of the challenges and opportunities that result
from each model. What guidance can be given to handling districts that are at different stages of maturity
with respect to data use? When effective models are implemented and identified, how should the field deal with
the issues of scalability and replicability? There is a lack of knowledge about what exists in terms of good data practices. The field
needs to identify and extract emerging best practices around data use. However, the question remains how to do this.
TEACHER ISSUES AND ROLE-BASED ISSUES The field needs to parse out the roles of different stakeholders to determine what is
actually happening with teachers, principals, superintendents, curriculum supervisors, and other stakeholders.
What is the field asking teachers and administrators to do in terms of using data? In terms of data literacy?
Should educators be consumers of information or data-driven decision makers? This is a growing debate.
Data do not tell teachers what to do. Data do tell teachers that something has not worked. Data need to inform instruction and help to determine instructional next steps. There is a need for linking data literacy and pedagogical content knowledge so that the integration produces instructional decision making or pedagogical data literacy.
There should be a parallel of pedagogical data literacy for administrators, administrative data literacy.
There must be an alignment among goals, data, and actions. Teachers and administrators must understand the process of aligning educational objectives to the needed data, actions, and subsequent analyses.
How does the field balance the emphasis on and pressure for using data and the notion of teaching the way teachers want to teach?
How do educators communicate with data? How does the field handle the situationally-based aspect of educators’ work? There is a need for reflective practice. How do teachers look at or reflect upon their own
practice? What impact does this have on their practice? How does the field create circumstances or the environmental conditions in which reflections can take place? How does reflective practice become enculturated?

112
How do we help teachers think about the validity of their own judgments of student work, compared to standardized and other assessments?
Decision making is contextually bound. The question is how to connect the context and the surrounds to instruction or administrative action.
How do teachers evaluate instructional decisions? How do administrators evaluate administrative decisions?
How do educators balance assessment and data literacy and make intelligent use of data?
SCHOOLS OF EDUCATION AND INSTITUTIONS OF HIGHER EDUCATION What is the role of schools of education in training educators to use data? What can the field expect from teacher preparation programs and schools of education
and how can they support training and continuous improvement around data use? There was a clear message from the experts that higher education must play an important
role in preparing educators to use data. Yet, the experts acknowledge that preparation programs for teachers and administrators cannot be expected “to do it all.”
It may be possible to link higher education to the professional development community in terms of preparing educators to use data. Institutions of higher education could capitalize on virtual courses and provide outreach, continuing education credit, and courses via the internet.
How can schools of education be held accountable in terms of preparing graduates to use data effectively?
State credentialing and licensure agencies and professional organizations must work with schools of education to leverage and affect change.
There is a disconnect in the expectations from higher education around what teachers and administrators need for data skills and knowledge as they enter the profession.
The experts acknowledged that having stand-alone courses on data-driven decision making may not be the most effective means by which human capacity can be built. Instead, the concepts around data use should be threaded throughout preparation programs, perhaps through an integrated suite of courses.
Courses should be based on real-world experience, thereby concretizing the learning process. The experiences should be situationally-based and content-based.
What modifications can be made to existing courses to integrate data use?
STATE EDUCATION AGENCIES AND POLICYMAKERS What are the goals in the state education agencies with respect to data use? How will
educators and policy makers know if the objectives are attained? How can it be measured?
How can the field affect change in state education agencies? How does the field overcome resistance to change?
There needs to be an examination of the state policies mandating assessments without evidence of how they are related to student achievement.
Credentialing must include data literacy knowledge and skills. There needs to be an examination of the state policies for pre-service educators and understand what role data literacy can play in those regulations. What are the implications if data literacy becomes a requirement for licensing and certification? What is the current landscape across states?

113
This needs to go beyond the annual survey conducted by the Data Quality Campaign (2012).
There needs to be accountability measures for teacher preparation, holding schools of education responsible for producing educators that are considered data literate. The only way this can happen is if state education agencies and their credentialing and licensure arms incorporate data literacy into their required skills and competencies.
STATEWIDE LONGITUDINAL DATA SYSTEMS There is a growing recognition that the SLDSs do not provide locally relevant data. There
needs to be an exploration of the role the SLDSs might play in providing better and more relevant data to local education agencies, and if this is even possible. From the district perspective, data systems must be able to supply locally and instructionally relevant data, which currently the SLDSs do not do.
State policy makers need to understand that there is more to data than the data that currently reside in their SLDSs.
A question arose about how to position the SLDSs for different users. These users might include local education agencies, legislators, policy makers, parents, students, researchers, and the media. The data, however, must have relevance and utility.
There needs to be an explication of state data standards.
TECHNOLOGIES AND SUPPORTING RESOURCES AND TOOLS A question arose as to what kinds of resources teachers need. There needs to be a richer
array of tasks, tools, and resources – a blended set of resources. New and different assessment resources need to be developed and provided to educators
for appropriate and valid use. There is a need to consider what technologies are needed to support data-driven decision
making. There is a need to have the right kinds of tools and processes in place to facilitate data use.
Data systems need to be aligned to emerging educational needs and objectives. Data systems must become more locally relevant, containing data that will help inform
local administrative and instructional decisions. The provision of innovative data displays, data dashboards, and reports should benefit
end users. Resources need to be linked to communities of practice. There needs to be an online, community repository or resources available to all educators. Implementing dashboards like those used by the Khan Academy, can provide real-time
instructional data. The production of a video (like Khan Academy) around data use is seen as a valuable
resource for educators.
RESEARCH
A research agenda around data literacy needs to be developed. How does the field build its knowledge base and improve the level of evidence? Having an operational definition can provide the framework and grounding for the research and development agenda.

114
The field should be more comprehensive about the research needed to move the field forward. The outcome should be something that is actionable, not just informative. There needs to be an evidential base around data-driven decision making.
There needs to be evidence of effectiveness. Where does data use work? Where does it not work? Research can provide a systematic and objective comparison of the different models of professional development.
A meta-analysis of the current research and development studies in the field could be conducted to examine impact. The collection of these studies or examples could be used to frame what the field knows about data literacy. Researchers should focus on selecting a few promising studies deemed to have “worked” that could populate an evidence base and provide examples of best practice and indications of changes to the management process. What are the shared lessons from the amassed studies? This goes well beyond the scope of the IES Practice Guide (Hamilton, et al., 2009) which could only report on studies that passed the What Works Clearinghouse criteria (see http://ies.ed.gov/ncee/wwc/reports/).
There needs to be research about what happens around the implementation of professional development on data use.
The question many policy makers want to know is what is the impact of data use on student achievement. As noted above, the experts acknowledge that this is not the only question, but it is the looming question.
The field could benefit from understanding the impact of interventions and variations on models or interventions.
Research needs to focus on the teachers: o The role of the teachers in the ecosystem; o Teacher training; o Teacher knowledge; o The impact of teachers; and o The contextual factors that affect teacher performance.
Research needs to tease out issues around the properties of information/data, the capacities of educators, and the context in which educators are working.
The field could benefit from research on best practices. o What are the most effective data practices? o How can those practices be scaled?
There needs to be documentation of the change management and the implementation processes; also examples of the processes. This research should examine districts or schools at different stages of implementation.
Research needs to examine the differences across roles in terms of data literacy and refine the examination over time.
There needs to be research on the systemic complexities of implementing data-driven decision making in education. Research needs to examine how all the components intersect, taking a systemic perspective.
There is a need to examine the impact of data systems and their effectiveness. There needs to be contextual studies. There needs to be studies on precursor conditions. How does the field turn good actionable research into action in practice?

115
In terms of methodology, many believe that the only acceptable method is a randomized controlled trial, the gold standard of experimentation. The objective is to show the causal link between data use and student performance. Yet, the practicality and feasibility of such a method must be questioned, either to answer questions about student performance or programmatic decision making. Thus, the question remains, how does the field design studies and data collection methods for the evaluation of instructional and programmatic decision making. While some experts maintain that experimental design is the only way to go, others believe that there should be quasi-experimental studies, correlational studies, case studies, and implementation studies, depending upon the questions being addressed.
The field needs to develop the tools, instruments, and methods for such studies. The field needs methods for scaling interventions and for studying the scaling process. It
also needs to explore how to decrease the scaling cycle. The field needs to determine how to address the issue of fidelity of implementation. There needs to be research on the scaling process and the elements that need to be in
place for scaling to occur. There needs to be research on learning progressions and the systems that provide data to
facilitate such a process. There needs to be research on instructionally relevant data. Research should examine the differences in assessment data use at the classroom level, at
a broader level, and for administrative use. There needs to be an exploration of evidence standards.
INSTRUMENTATION There is a need to develop to instrumentation of various types. There is a need for
measures that educators can actually use to inform practice. There is a need for instruments researchers can use to measure data literacy and related skills.
For educators, there is a pressing need for instructionally sensitive measures, not just summative assessments.
There is a need to help teachers to select appropriate measures for the intended learning objectives.
The field needs adequate instrumentation. Major measurement questions exist. o How does the field measure data literacy? o What questions need to be asked? o How does the field know and recognize when data literacy competence exists and
how is it measured? o Are there differences for teachers versus administrators and other educators? o How does the field measure the overall landscape of data-driven decision
making? o How does the field validate such measures?
There is a need to assess the knowledge and skills teachers and administrators exhibit related to the components of data use. This will address the need to understand the kinds of things educators are doing with data and how to assess the actions. Some items and instrumentation already exist to measure data knowledge, beliefs about data, expectations, efficacy, data culture, and supports. These items and instruments need to be examined and aligned to the emerging definition of data literacy.

116
There is a need for valid and reliable instruments that measure data literacy skills and knowledge. This instrumentation needs to determine the different kinds of knowledge and skills; the how to and the what.
FUNDING There should be collaboration among funders, including foundations, governmental
funding agencies, and other governmental stakeholders and policy makers. Having a cross-agency collaborative of funders would be beneficial as there would be a shared conceptualization of the needs of the field and the role each agency can play.
Funders can stimulate collaboration among professional development providers to create a network.
Funders could support a collaborative of researchers and professional development providers.
What is the role of the U.S. Department of Education? The Department has funded the SLDSs. Data-driven decision making has become a vital part of ARRA, Race To The Top, the Regional Education Laboratories, the Comprehensive Centers, and other programs. Yet, no attention has been devoted to building human capacity to use data. What can and should the Department do to help develop data literacy among educators, beyond the policy rhetoric? The question remains how to get data into RFPs and solicitations for the National Science Foundation, the Institute of Education Sciences, and other funding sources?
There is a need for funding around local data systems, research, and local research analysts.
There also is a need for funding the infrastructure to improve data literacy. Attention needs to be devoted both to principals/leadership and to teachers. Funders could commission a series of working papers on data-driven decision making. Funders could support a conference for the professional development providers. Funders could support a forum for shared models and materials. Funders could support a high-level conference (such as a Wingspread Conference) that
includes representatives from various stakeholder groups, especially policy makers, accreditation agencies, professional organizations, and others to work out how to leverage change in the field.
Funders could support the development of instructionally relevant instrumentation.
COLLABORATION Develop an ecosystem of colleagues around data-driven decision making. There needs to
be a commitment to collaborate. There is a need for constituency building, perhaps through a toolkit for community
organizing around the need to build human capacity among educators to use data effectively. Create an online community around data-driven decision making.
The field would benefit from the creation of a community of professional development providers. There needs to be a forum whereby professional development providers (and others) can learn about each others’ models. This would connect professional development providers through conferences and online communities, thereby facilitating discussion about shared models, materials, and resources.

117
There needs to be cross-agency collaboration among funders. Links among the research, practice, and policy communities need to be established. Develop a research/professional development collaborative. This will create an important
partnership from which each group can learn and benefit. There need to be links between the research community and the practitioner community. Create practitioner collaboratives. Research has already shown the importance of
collaboration in terms of educators working together as a way of compensating for individual lack of skills. Such collaboration can help build capacity for data use. How are these collaborations created so that they are non-judgmental and constructive? This pertains to the stakeholder groups as well as the creation of data teams in schools and districts.
MESSAGING
The messaging around data literacy and data use has been a barrier. Different stakeholders mean different things when they refer to data literacy and data-driven decision making. There needs to be a common language and voice to improve communication and understandability across stakeholder groups.
There is a need for a clear image change around data use. Data-driven decision making should be billed as an enabler and a powerful tool. The messaging around data-driven decision making has generally been negative, threatening, and punitive. It relates to the use of data for accountability purposes rather than for continuous improvement.
The messaging needs to counter the fear around data of being misused for teacher evaluation, for accountability, and for purposes other than for which the data have been collected. Instead, data should be used to help and support educators, to become a component of good teaching, and a professional skill.
The messaging needs to communicate and describe the competencies needed for educators to be considered data literate.
Educators need to know and understand why they are being asked to do things, like using data. There needs to be a clear rationale provided to educators about the importance of using data. The question remains, however, how is this message communicated and by whom.
The messaging needs to acknowledge clearly the complexity of the issues surrounding the field.
There is a need to communicate to educators what they need to know around data-driven decision making and effective models of implementation. To this end, it is important to disseminate information about different professional development models.
The messaging needs to be written for various stakeholder audiences in non-technical language. This will help to break down the silos and the different dialects being spoken about data-driven decision making.
The messaging should have an evidentiary basis, as it currently exists in the field, noting the limitations in research to support data-driven decision making. The messaging should provide some sense of validity, utility, and the tools needed to support the process. There also needs to be a research agenda on which the evidentiary base is grounded, and that agenda should be communicated to the field.

118
Deciding on converging messages can help to minimize the ambiguity coming from different sources about the use of data.
The development of a positive video, perhaps in the genre of Khan Academy, might help to improve the messaging around data use.