Embed Size (px)
Citation preview
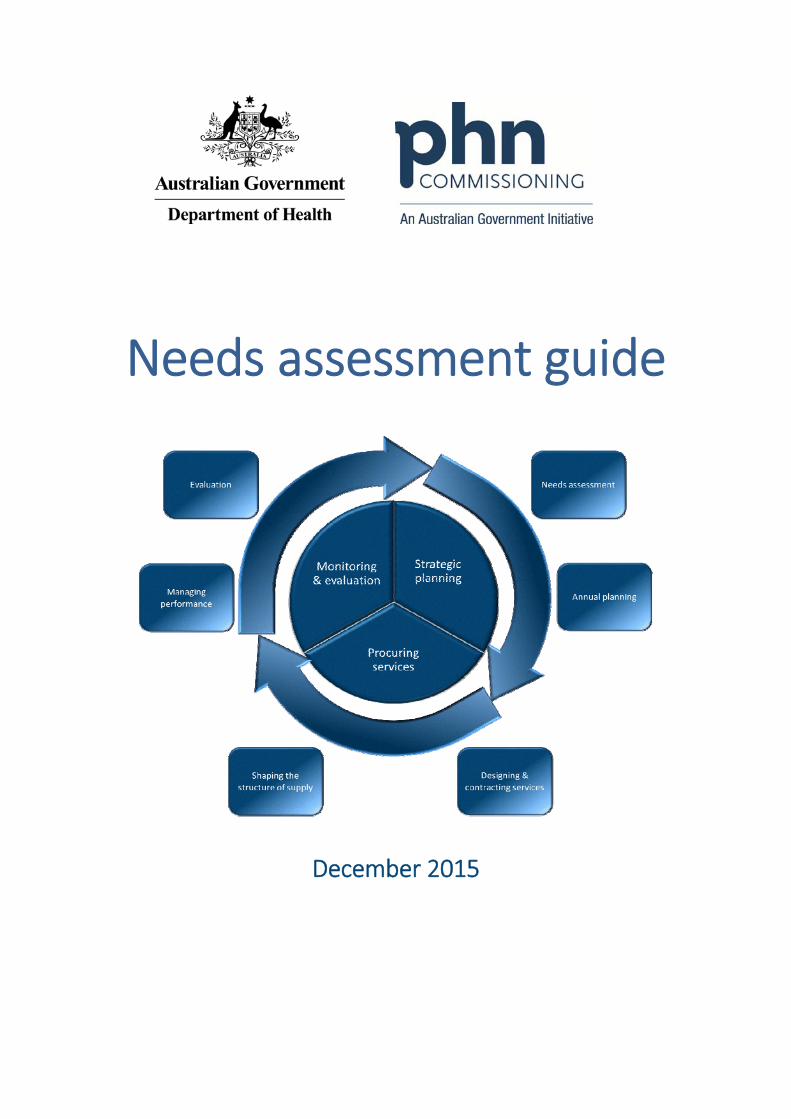
Needs assessment guide
December 2015

i
Acknowledgement
The Australian Government Department of Health acknowledges and appreciates
the input of Primary Health Networks in the development of this Guide.
Note
This guide does not override the requirements set out in the PHN Funding Agreement.
© Commonwealth of Australia 2015
This work is copyright. You may download, display, print and reproduce the whole or part of this work in
unaltered form for your own personal use or, if you are part of an organisation, for internal use within your
organisation, but only if you or your organisation do not use the reproduction for any commercial purpose and
retain this copyright notice and all disclaimer notices as part of that reproduction. Apart from rights to use as
permitted by the Copyright Act 1968 or allowed by this copyright notice, all other rights are reserved and you are
not allowed to reproduce the whole or any part of this work in any way (electronic or otherwise) without first
being given the specific written permission from the Commonwealth to do so. Requests and inquiries concerning
reproduction and rights are to be sent to the Communication Branch, Department of Health, GPO Box 9848,
Canberra ACT 2601, or via e‐mail to [email protected].
ii
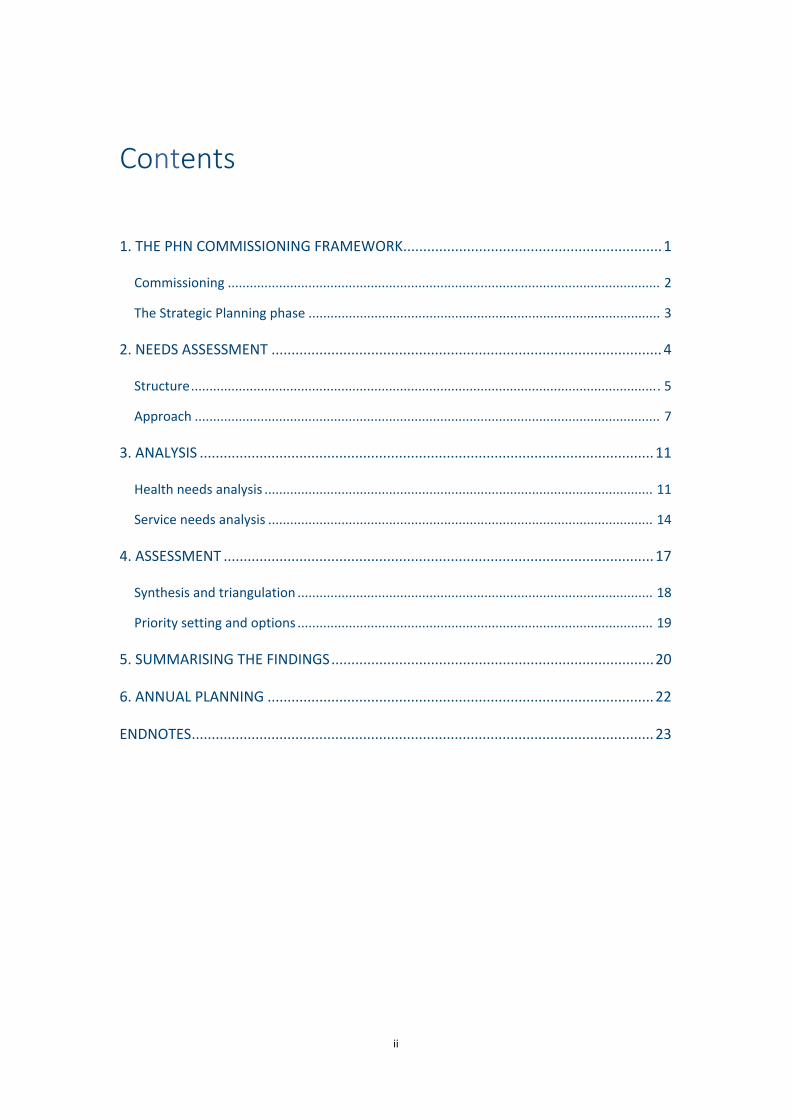
Contents
1. THE PHN COMMISSIONING FRAMEWORK ................................................................. 1
Commissioning ...................................................................................................................... 2
The Strategic Planning phase ................................................................................................ 3
2. NEEDS ASSESSMENT .................................................................................................. 4
Structure ................................................................................................................................ 5
Approach ............................................................................................................................... 7
3. ANALYSIS .................................................................................................................. 11
Health needs analysis .......................................................................................................... 11
Service needs analysis ......................................................................................................... 14
4. ASSESSMENT ............................................................................................................ 17
Synthesis and triangulation ................................................................................................. 18
Priority setting and options ................................................................................................. 19
5. SUMMARISING THE FINDINGS ................................................................................. 20
6. ANNUAL PLANNING ................................................................................................. 22
ENDNOTES .................................................................................................................... 23
iii
Figures and tables
Figure 1. The PHN Commissioning Framework ..................................................................... 1
Figure 2. The Strategic Planning phase ................................................................................. 3
Figure 3. Structure of the needs assessment ........................................................................ 6
Figure 4. Health needs analysis ........................................................................................... 11
Figure 5. Service needs analysis .......................................................................................... 14
Figure 6. Assessment, priorities and options ...................................................................... 17
Figure 7. Triangulation matrix ............................................................................................. 18
Table 1. Outcomes of the health needs analysis ................................................................. 20
Table 2. Outcomes of the service needs analysis ................................................................ 21
Table 3. Opportunities, priorities and options .................................................................... 21
1
1. THE PHN COMMISSIONING FRAMEWORK
Primary Health Networks (PHNs) were established in July 2015, with the objectives of:
increasing the efficiency and effectiveness of medical services for patients,
particularly those at risk of poor health outcomes; and
improving coordination of care to ensure patients receive the right care in the right place at the right time.
The PHN Guidelines state that:
PHNs will work towards achieving these objectives on the basis of an understanding of the
health care needs of their communities through analysis and planning. They will do this
through knowing what services are available and help to identify and address service gaps
where needed, including in rural and remote areas, while getting value for money.1
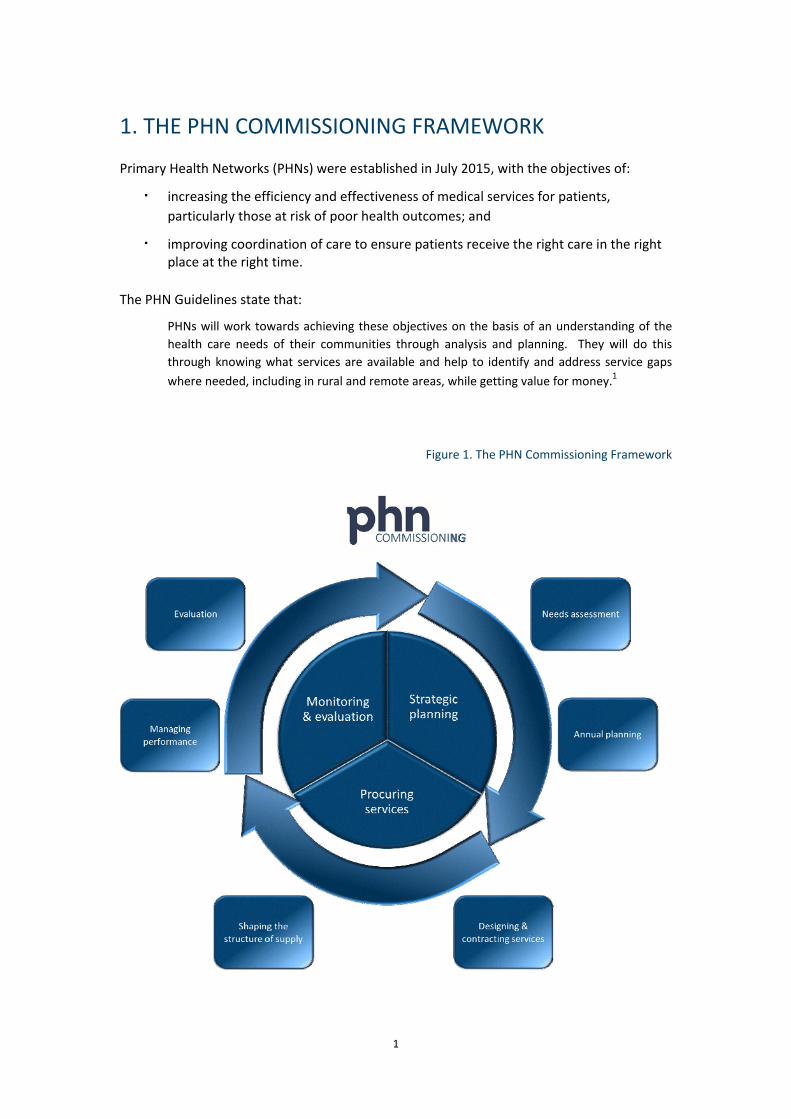
Figure 1. The PHN Commissioning Framework

2
Figure 1 depicts the PHN Commissioning Framework. There are three phases in the cycle –
strategic planning, procuring services, and monitoring and evaluation.2
This commissioning framework has been developed so that PHNs can ensure that their
commissioning approach is consistent with the approach adopted for the programme as a
whole and that the process results in consistent, comparable and measurable outputs and
outcomes.
It is important to keep in mind that commissioning is a holistic approach to enable PHNs to
work as strategic organisations at the system level. It is not merely a process. It is expected
that PHNs may well be engaged in different parts of the cycle throughout the year (such as
monitoring contracts). While PHNs are required to undertake a review and update of the
needs assessment annually, in practice the needs assessment should be under continual
review as new information, data and experience become available.
Commissioning
‘Commissioning’ is a continual and iterative cycle involving the development and
implementation of services based on planning, procurement, monitoring, and evaluation.
While a commissioning approach is used in a number of sectors other than health care it has
been a key feature of the health system in the United Kingdom since the 1990s and is also a
feature of health systems in New Zealand and the United States of America. Commissioning
describes a broad set of linked activities, including needs assessment, priority setting,
procurement through contracts, monitoring of service delivery, and review and evaluation.
A key characteristic of commissioning is that procuring or purchasing decisions occur within
a broader conceptual framework. The difference between purchasing and commissioning in
the health care context has been described as follows:
Commissioning is a term used most in the UK context and tends to denote a proactive
strategic role in planning, designing and implementing the range of services required, rather
than a more passive purchasing role. A commissioner decides which services or healthcare
interventions should be provided, who should provide them and how they should be paid
for, and may work closely with the provider in implementing changes. A purchaser buys
what is on offer or reimburses the provider on the basis of usage.3
As the health systems are different, PHN commissioning will of course differ from the
experiences of other countries. However, the fundamental elements remain valid in the
Australian context.
3
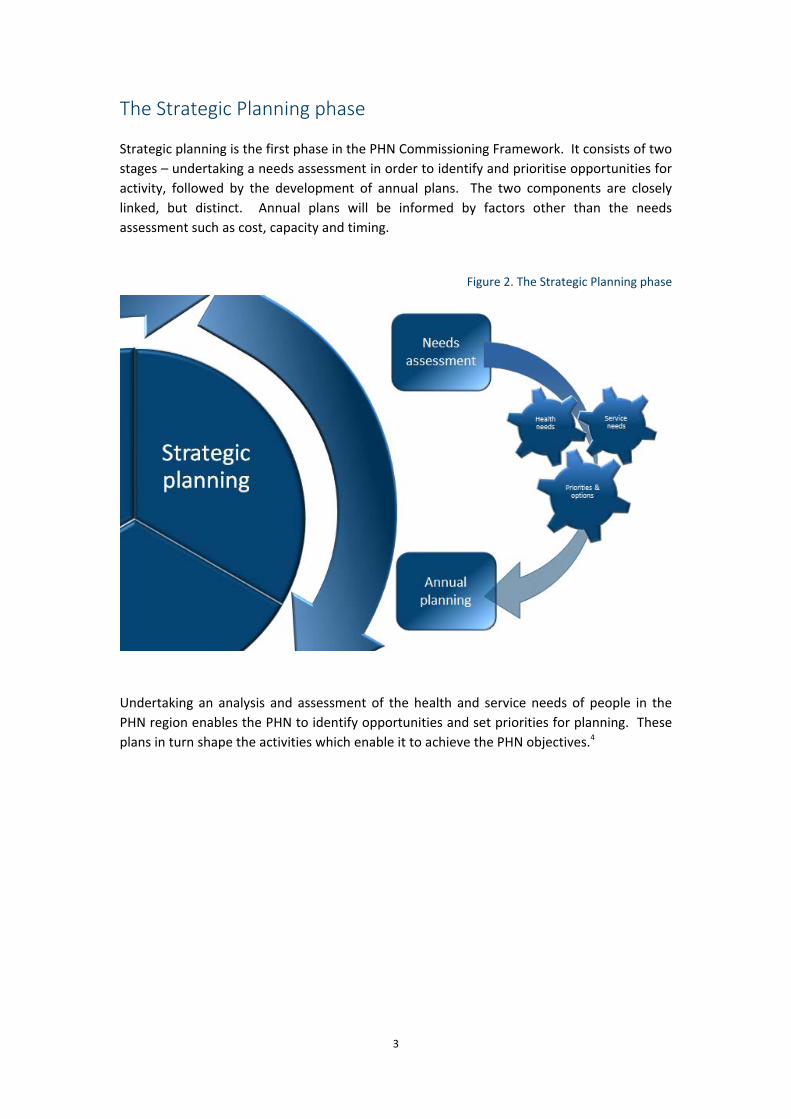
The Strategic Planning phase
Strategic planning is the first phase in the PHN Commissioning Framework. It consists of two
stages – undertaking a needs assessment in order to identify and prioritise opportunities for
activity, followed by the development of annual plans. The two components are closely
linked, but distinct. Annual plans will be informed by factors other than the needs
assessment such as cost, capacity and timing.
Figure 2. The Strategic Planning phase
Undertaking an analysis and assessment of the health and service needs of people in the
PHN region enables the PHN to identify opportunities and set priorities for planning. These
plans in turn shape the activities which enable it to achieve the PHN objectives.4
4
2. NEEDS ASSESSMENT
A Needs assessment is:
a systematic method of identifying unmet health and healthcare needs of a population and
making changes to meet these unmet needs. It involves an epidemiological and qualitative
approach to determining priorities which incorporates clinical and cost effectiveness and
patients' perspectives. This approach must balance clinical, ethical, and economic
considerations of need—that is, what should be done, what can be done, and what can be
afforded.5
Undertaking a needs assessment provides the PHN with the opportunity to engage with
Local Hospital Networks (or equivalents) and other key planning and funding agencies in
order to ensure alignment of effort and investment. This involves the identification and
analysis of key data and other forms of information.
Opportunities for community empowerment will also begin in the needs assessment stage.
Consulting communities is a key method for understanding factors which affect their health
and quality of life, and is a means of recognising the needs of disadvantaged groups which
may not be represented in routine statistical collections.6 While a range of engagement
approaches will need to be considered, Community Advisory Committees and Clinical
Councils must play key roles in the development of the needs analysis.
As commissioning is ongoing and iterative, the needs assessments of future years will
themselves be informed by the experience of previous years and by the learnings gained
from the experience of monitoring and evaluating previous activities and investment.
Needs assessments should use existing data and evidence where possible and not duplicate
the efforts of others, particularly Local Hospital Networks (or equivalents). Needs
assessments should also:
analyse relevant and current local and national health data including, but not limited
to, data collected by Local Hospital Networks (or equivalent);
review health service needs and available service provision in the region;
identify health services priorities based on an in‐depth understanding of the health
care needs of the communities within the PHN region; and
be informed by clinical and community consultation and market analysis.
The needs assessment will contribute to the development and implementation of an
evidence‐based Annual Plan to address national and PHN specific priorities relating to
patient needs and service availability and gaps in the PHN region.
5
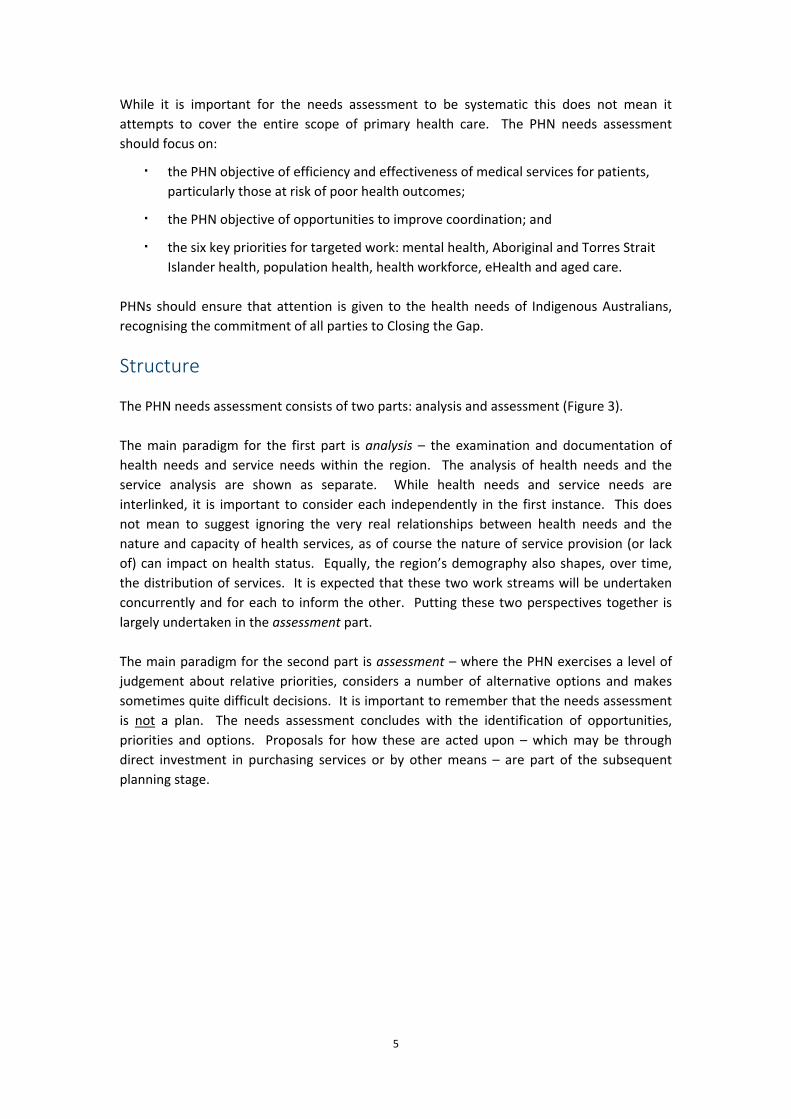
While it is important for the needs assessment to be systematic this does not mean it
attempts to cover the entire scope of primary health care. The PHN needs assessment
should focus on:
the PHN objective of efficiency and effectiveness of medical services for patients,
particularly those at risk of poor health outcomes;
the PHN objective of opportunities to improve coordination; and
the six key priorities for targeted work: mental health, Aboriginal and Torres Strait
Islander health, population health, health workforce, eHealth and aged care.
PHNs should ensure that attention is given to the health needs of Indigenous Australians,
recognising the commitment of all parties to Closing the Gap.
Structure
The PHN needs assessment consists of two parts: analysis and assessment (Figure 3).
The main paradigm for the first part is analysis – the examination and documentation of
health needs and service needs within the region. The analysis of health needs and the
service analysis are shown as separate. While health needs and service needs are
interlinked, it is important to consider each independently in the first instance. This does
not mean to suggest ignoring the very real relationships between health needs and the
nature and capacity of health services, as of course the nature of service provision (or lack
of) can impact on health status. Equally, the region’s demography also shapes, over time,
the distribution of services. It is expected that these two work streams will be undertaken
concurrently and for each to inform the other. Putting these two perspectives together is
largely undertaken in the assessment part.
The main paradigm for the second part is assessment – where the PHN exercises a level of
judgement about relative priorities, considers a number of alternative options and makes
sometimes quite difficult decisions. It is important to remember that the needs assessment
is not a plan. The needs assessment concludes with the identification of opportunities,
priorities and options. Proposals for how these are acted upon – which may be through
direct investment in purchasing services or by other means – are part of the subsequent
planning stage.
6
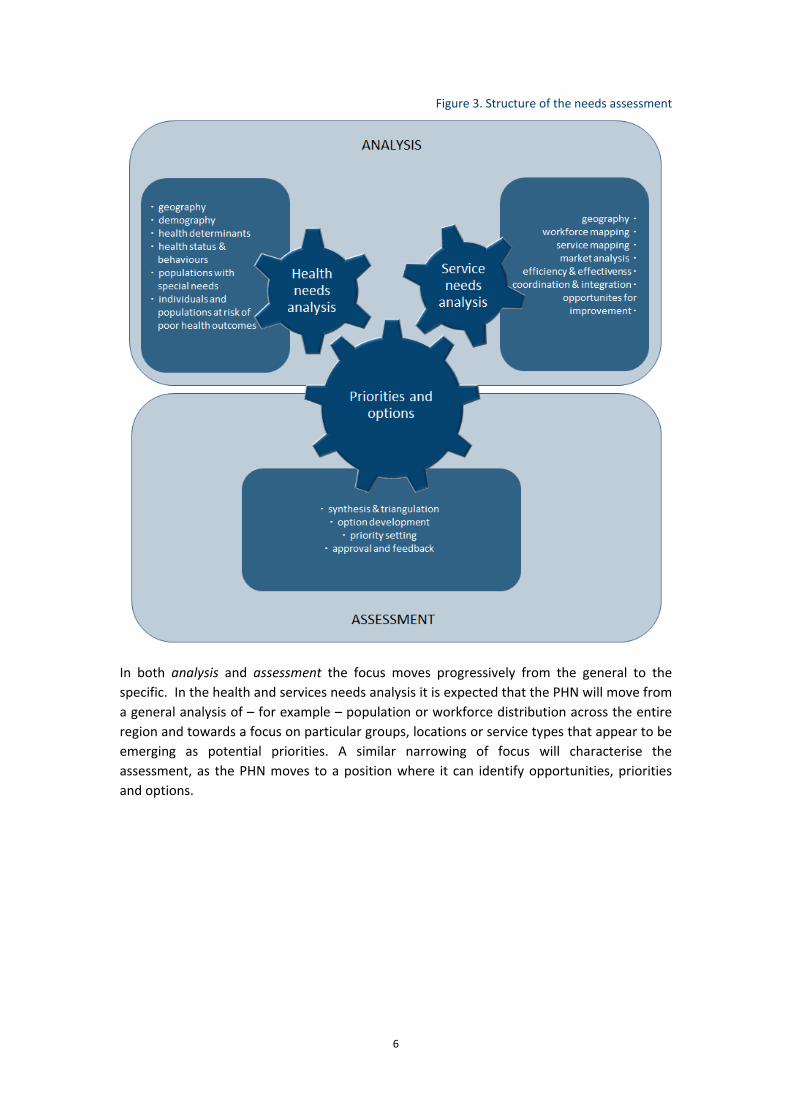
Figure 3. Structure of the needs assessment
In both analysis and assessment the focus moves progressively from the general to the
specific. In the health and services needs analysis it is expected that the PHN will move from
a general analysis of – for example – population or workforce distribution across the entire
region and towards a focus on particular groups, locations or service types that appear to be
emerging as potential priorities. A similar narrowing of focus will characterise the
assessment, as the PHN moves to a position where it can identify opportunities, priorities
and options.
7
Approach
Two broad kinds of information will be sourced throughout the needs assessment. The first
is information and data (both qualitative and quantitative) from a wide range of sources.
The second is from consultations with communities, health professionals and other
stakeholders.
Data and other sources of information
The Department of Health (the department) will consult with PHNs and other stakeholders
about data needs in general, and what might be provided through a national website. It is
also expected that through undertaking a baseline needs assessment PHNs will identify and
further clarify data needs, with a particular focus on the six key priority areas for targeted
work.
It is recognised that each PHN will have differing and sometimes unique sources of
information available to them, which may be in a variety of forms and in some cases subject
to restrictions on its use. As a result, there is no requirement for PHNs to develop a
standardised population health profile or description of the nature of the health system or
health service provision in the PHN.
PHNs can use information from the previous Medicare Locals, including the Comprehensive
Needs Analyses, data and other information available through corporate knowledge and
stakeholder networks. Potential data sources should be evaluated against standard
measures of quality, such as the ABS Data Quality Framework.7
A number of data sources may be useful for both health needs analysis and service needs
analysis. For the baseline needs assessment it is expected that the PHN will make use of a
wide range of sources, including but not limited to the following:
Australian Bureau of Statistics (ABS) Census and Census‐derived data on
demographics, including the Socio Economic Indices for Areas (SEIFA) and profiles of
health including the National Health Survey, the National Nutrition and Physical
Activity Survey and the National Health Measures Survey, the National Aboriginal
and Torres Strait Islander Health Survey, the National Aboriginal and Torres Strait
Islander Nutrition and Physical Activity Survey, and the National Aboriginal and
Torres Strait Islander Health Measures Survey
a range of Australian Institute of Health and Welfare (AIHW) and National Health
Performance Authority (NHPA) datasets and publications, including the METeOR
metadata registry
Medicare Benefits Schedule (MBS), Pharmaceutical Benefits Scheme (PBS) and
Practice Incentives Programme (PIP) data
aged care data (both residential and community based) such as Commonwealth
Home Support Programme, or Department of Veterans Affairs (DVA) data
mental health data such as the Access to Allied Psychological Services (ATAPS) data
collection

8
information on Indigenous data from a range of sources
the Australian Childhood Immunisation Register
the National Notifiable Diseases Surveillance System
resources from the Royal Australian College of General Practitioners (RACGP)
data from practices through clinical audit tools, and the Bettering the Evaluation
and Care of Health (BEACH) data
health workforce data
State and Territory Health Department data
data from Local Hospital Networks or equivalents (including individual acute and
community care services)
Local Government data
information on the PHCRIS website
information on the PHIDU website, such as the Social Health Atlas of Australia
National Health Services Directory (NHSD) and Healthdirect
there are also some mapping tools that may be useful to PHNs. 8
Other sources of information that may inform needs assessment are being considered in the
development of the PHN Performance Framework, during which the department will consult
with PHNs and other stakeholders. The Performance Framework will encompass three tiers
of performance. The national tier will centre on a small set of headline indicators to assess
performance against health outcomes. The local tier will assess performance using local
performance indicators selected by PHNs through formal planning processes. The
organisational tier will focus on compliance with contractual arrangements in key areas of
establishment, operations and activity.9
There are a number of other sources of information that PHNs can use in structuring their
thinking about the needs assessment. Many of these are frameworks that have been
developed to classify and organise data and indicators about health status, service delivery
and opportunities for quality improvement.10 Information on overall health performance
frameworks and reporting is provided in the publication by the Australian Institute of Health
Innovation, Performance indicators used internationally to report publicly on healthcare
organisations and local health systems.11
Consultation
Different approaches may be necessary for PHNs to tailor their consultation to specific
regional characteristics and community needs. Whatever the approach, PHNs should
ensure:
a systematic approach is in place for identifying target groups and stakeholders,
particularly those in the six key priority areas for targeted work, and determining
consultation methodologies;
9
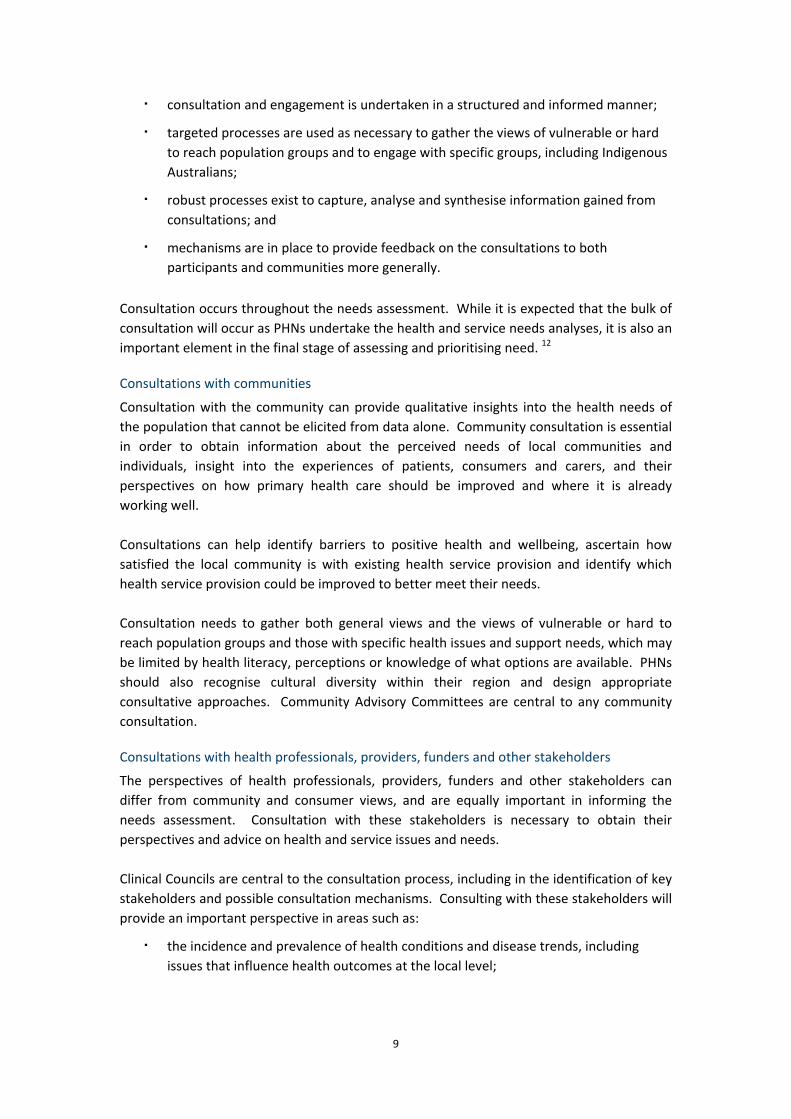
consultation and engagement is undertaken in a structured and informed manner;
targeted processes are used as necessary to gather the views of vulnerable or hard
to reach population groups and to engage with specific groups, including Indigenous
Australians;
robust processes exist to capture, analyse and synthesise information gained from
consultations; and
mechanisms are in place to provide feedback on the consultations to both
participants and communities more generally.
Consultation occurs throughout the needs assessment. While it is expected that the bulk of
consultation will occur as PHNs undertake the health and service needs analyses, it is also an
important element in the final stage of assessing and prioritising need. 12
Consultations with communities
Consultation with the community can provide qualitative insights into the health needs of
the population that cannot be elicited from data alone. Community consultation is essential
in order to obtain information about the perceived needs of local communities and
individuals, insight into the experiences of patients, consumers and carers, and their
perspectives on how primary health care should be improved and where it is already
working well.
Consultations can help identify barriers to positive health and wellbeing, ascertain how
satisfied the local community is with existing health service provision and identify which
health service provision could be improved to better meet their needs.
Consultation needs to gather both general views and the views of vulnerable or hard to
reach population groups and those with specific health issues and support needs, which may
be limited by health literacy, perceptions or knowledge of what options are available. PHNs
should also recognise cultural diversity within their region and design appropriate
consultative approaches. Community Advisory Committees are central to any community
consultation.
Consultations with health professionals, providers, funders and other stakeholders
The perspectives of health professionals, providers, funders and other stakeholders can
differ from community and consumer views, and are equally important in informing the
needs assessment. Consultation with these stakeholders is necessary to obtain their
perspectives and advice on health and service issues and needs.
Clinical Councils are central to the consultation process, including in the identification of key
stakeholders and possible consultation mechanisms. Consulting with these stakeholders will
provide an important perspective in areas such as:
the incidence and prevalence of health conditions and disease trends, including
issues that influence health outcomes at the local level;

10
workforce needs including capacity building and quality improvement, size,
distribution and discipline mix, including issues and barriers at the local level;
the efficiency and effectiveness of current service delivery models and opportunities
for improvement;
coordination and linkages between services and opportunities for improvement;
the spread of services across the spectrum of prevention, diagnosis, early
intervention, treatment, rehabilitation and continuing care; and
vulnerable groups and barriers to access.

11
3. ANALYSIS
Health needs analysis
Figure 4. Health needs analysis
The intention of the health needs analysis is to ensure the PHN has an understanding of the
health status and needs of individuals, populations and communities relevant to its role
within both the health system and the broader environment.
The health needs analysis will need to make use of a range of demographic and
epidemiological data, alongside structured consultations. It will also require some
consideration of the wider social and economic determinants of health.
Figure 4 illustrates how the PHN moves through the various steps that make up this stage.
The focus will progressively narrow towards an identification of people, populations or
conditions that are likely to be priorities for the PHN.
The elements required to undertake a health needs analysis are discussed below. This is so
that PHNs can ensure they cover all expected elements and in doing so progressively move
towards identifying key priorities. In practice, many of these elements are inter‐related or
overlapping and the overall process will be iterative.
Geography
The Australian Statistical Geography Standard (ASGS) should form the basis of sub‐regions
the PHN develops for the purposes of demographic analysis, using the SA 3 level as the
building block. Demographic data should be analysed at the SA 2 level where possible. The
ASGS also includes the Indigenous Urban Centres and Localities and the Remoteness Area
classifications. Depending on the data, there may be reasons for also using LHN sub‐
divisions or Local Government Areas. Use of classifications such as postcodes and
electorates is generally discouraged.
12
Demography
Key demographic data will also be derived from the ABS Census or Estimates of Resident
Population. Information on population trends can be significant, and the SEIFA is an
important tool.
Health determinants
The nature and importance of various health determinants will vary from PHN to PHN. It is
difficult to generalise about how each PHN will treat this area, but a guiding principle should
be that the various areas under consideration are analysed in terms of their impact on
health rather than issues in their own right. There are a number of frameworks and
reference points, particularly the work of Wilkinson, Marmot, and the WHO.13 Information
on levels of health literacy in the PHN is also an important consideration.14
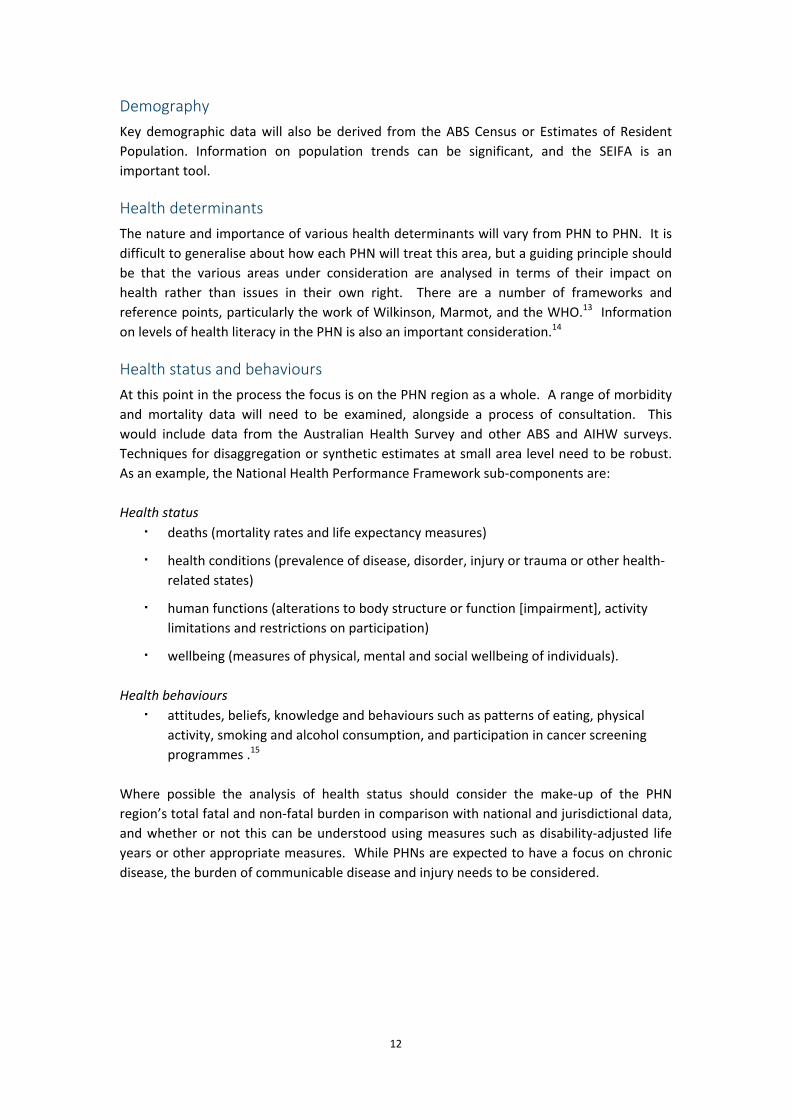
Health status and behaviours
At this point in the process the focus is on the PHN region as a whole. A range of morbidity
and mortality data will need to be examined, alongside a process of consultation. This
would include data from the Australian Health Survey and other ABS and AIHW surveys.
Techniques for disaggregation or synthetic estimates at small area level need to be robust.
As an example, the National Health Performance Framework sub‐components are:
Health status
deaths (mortality rates and life expectancy measures)
health conditions (prevalence of disease, disorder, injury or trauma or other health‐
related states)
human functions (alterations to body structure or function [impairment], activity
limitations and restrictions on participation)
wellbeing (measures of physical, mental and social wellbeing of individuals).
Health behaviours
attitudes, beliefs, knowledge and behaviours such as patterns of eating, physical
activity, smoking and alcohol consumption, and participation in cancer screening
programmes .15
Where possible the analysis of health status should consider the make‐up of the PHN
region’s total fatal and non‐fatal burden in comparison with national and jurisdictional data,
and whether or not this can be understood using measures such as disability‐adjusted life
years or other appropriate measures. While PHNs are expected to have a focus on chronic
disease, the burden of communicable disease and injury needs to be considered.
13
Populations with special needs
This step may well cover much of the same ground as the work on health status, behaviours
and determinants, but from a different starting point. In an influential article, the
epidemiologist George Rose argued that:
I find it increasingly helpful to distinguish between two kinds of aetiological question. The
first seeks the cause of cases, and the second seeks the cause of incidence. ‘Why do some
individuals have hypertension?’ is a quite different question from ‘Why do some populations
have much hypertension, whilst in others it is rare?’ The questions required different kinds
of study, and they have different answers.16
Many of the previous steps may have focused on the health conditions of individuals, albeit
aggregated into groupings of one kind or another based on a number of premises. The
needs assessment should involve an explicit consideration of populations with special needs
that does not necessarily start from a health‐related premise. This would involve
identification of populations based on characteristics such as ethnicity, location, gender, age,
socioeconomic status etc. and may identify issues or inequities specific to these (suicide in
youth, injury in farming communities, etc.) which were less evident in the preceding
analyses.
Individuals and groups at risk of poor health outcomes
This final step combines evidence from all of the above. Where possible, analysis may
involve looking at relative measures of need such as disease rates in comparison to
benchmarks or targets, national or jurisdictional averages, or to rates in other comparable
regions.17
14
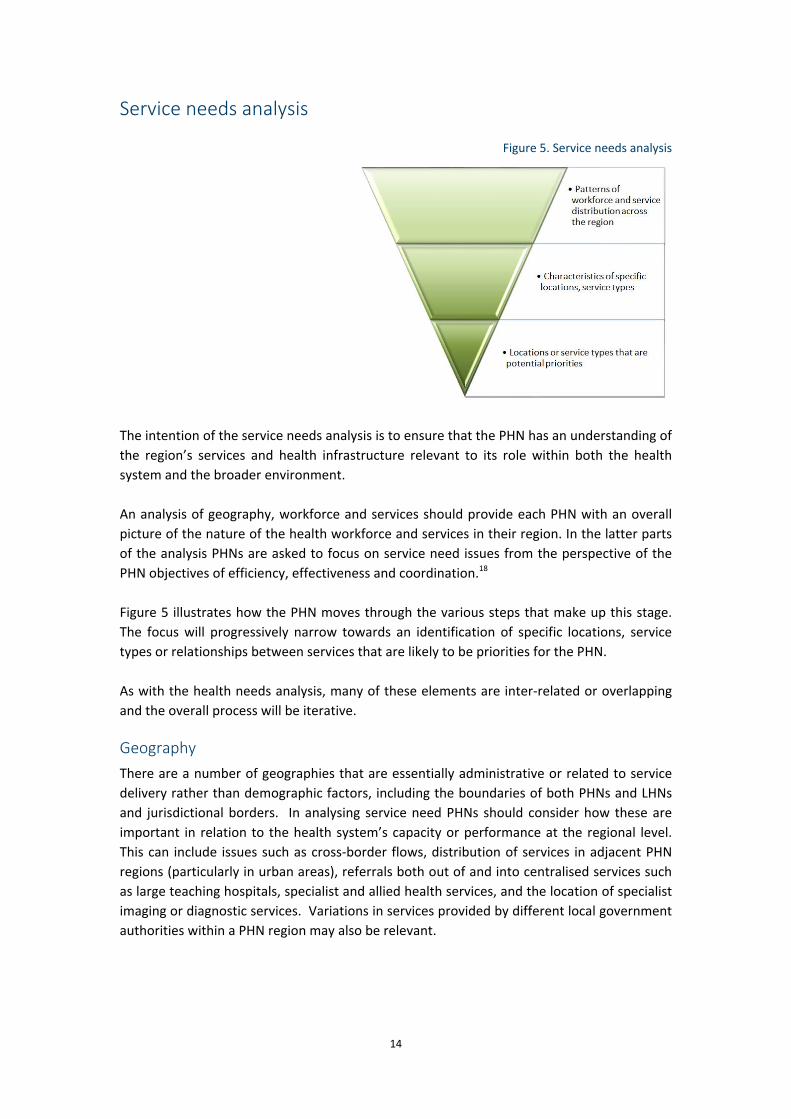
Service needs analysis
Figure 5. Service needs analysis
The intention of the service needs analysis is to ensure that the PHN has an understanding of
the region’s services and health infrastructure relevant to its role within both the health
system and the broader environment.
An analysis of geography, workforce and services should provide each PHN with an overall
picture of the nature of the health workforce and services in their region. In the latter parts
of the analysis PHNs are asked to focus on service need issues from the perspective of the
PHN objectives of efficiency, effectiveness and coordination.18
Figure 5 illustrates how the PHN moves through the various steps that make up this stage.
The focus will progressively narrow towards an identification of specific locations, service
types or relationships between services that are likely to be priorities for the PHN.
As with the health needs analysis, many of these elements are inter‐related or overlapping
and the overall process will be iterative.
Geography
There are a number of geographies that are essentially administrative or related to service
delivery rather than demographic factors, including the boundaries of both PHNs and LHNs
and jurisdictional borders. In analysing service need PHNs should consider how these are
important in relation to the health system’s capacity or performance at the regional level.
This can include issues such as cross‐border flows, distribution of services in adjacent PHN
regions (particularly in urban areas), referrals both out of and into centralised services such
as large teaching hospitals, specialist and allied health services, and the location of specialist
imaging or diagnostic services. Variations in services provided by different local government
authorities within a PHN region may also be relevant.
15
Workforce mapping
PHNs should look at information on the health workforce in the PHN region. If available, this
could include:
number and distribution by type, such as GPs, allied health, pharmacy, specialist
services such as psychiatry, community health services etc.;
characteristics such as full or part time, public versus private, qualified but not
working in health care etc.; and
relationships between professional groups.
Service mapping
Service mapping involves identifying and documenting the range of services available within
the PHN region, and the kinds of relationships that exist between services. The needs
assessment should consider aspects such as:
location – including but not limited to physical location, hours of opening, with
consideration of identifiable gaps. For rural areas this would also include outreach
services, for urban areas it may involve some consideration of services outside the
PHN borders but accessed by people from within the PHN;
utilisation – including MBS and PBS data, a range of hospital data, such as use of
Emergency Departments and Potentially Preventable Hospitalisations, other
measures of occasion of service, and with a consideration of under‐utilisation,
duplication and waste;
accessibility – including financial and cultural barriers and access to specialists and
secondary referred services, access to services after hours;
responsiveness – such as wait times;
capability – such as skills and competence;
acceptability – such as cultural sensitivity, patient experience of and satisfaction
with the quality of care; and
quality – such as practice accreditation and PIP enrolment.
Service mapping can also include consideration of the system’s ability to deal with public
health emergencies (such as an influenza pandemic) and issues around regional coordination
that may impact on emergency preparedness.
Market analysis
As part of its focus on the supply side, the PHN should be alert to evidence on how the
health market works in its area. This includes thinking about parts of the market not
currently active in health care, but where there are potential opportunities for engagement.
This is not necessarily limited to specific suppliers, but could involve services such as
informatics or business models from other sectors.

16
Efficiency and effectiveness of health services
In this step, the PHN should consider service provision in terms of different concepts of
efficiency:
technical efficiency – the cost at which services are produced;
allocative efficiency – how services reflect consumer preference, from a given set of resources; and
dynamic efficiency and sustainability – the capacity of the system to sustain workforce and infrastructure, to innovate and respond to emerging needs. 19
In terms of effectiveness, PHNs should consider accepted dimensions of effectiveness. The
AIHW defines effectiveness as how well the outputs of a service achieve the stated
objectives of that service. Indicators to measure this will cover characteristics such as
access, quality and appropriateness, including issues such as cultural competency of services
for Indigenous and CALD communities.20 21
An analysis in terms of equity is also important. A focus on programmes and the way they
are funded, rather than on what the patient needs, allocates resources inequitably as well as
inefficiently.22 Horizontal equity is exhibited when services are equally accessible to
everyone in the community with a similar level of need, and vertical equity is exhibited when
it accounts for the special needs of certain groups in the community and adjusts aspects of
service delivery to suit these needs.23 24 25
Coordination between and integration of, services
PHNs should analyse the level of coordination and integration of health care services in the
region, where opportunities may exist for improvement and the presence or absence of
services that seek to directly address coordination. Consideration could include evidence in
areas such as:
shared health records and other e‐health initiatives;
examples of integrated service delivery;
models such as the Patient Centred Medical Home;
transitions between acute care and primary care;
coordination between general practice and allied health;
linkages between health and social services (aged care, disability services, youth, child and family services, housing); and
referral patterns and health pathways.
Strengths and weaknesses
This final step combines evidence from all of the above. It is acknowledged that in some
areas the baseline 2015‐16 needs analysis will be preliminary. In the first iteration PHNs
may not have developed a comprehensive understanding of the overall health market, or
fully developed ways to assess service need from a perspective of efficiency, effectiveness
and coordination.

17
4. ASSESSMENT
Figure 6. Assessment, priorities and options
Assessment has the following purposes:
to synthesise and triangulate evidence from consultations and the analysis of the
health and service need components; and
on the basis of this, identify opportunities for further consideration; and
determine priorities and assess options for further development in the PHN Annual
Plan.
When considering options, it is expected that at this point the PHN would be seeking
information from a variety of sources (including literature and systematic reviews) on the
nature of interventions and approaches that have been implemented elsewhere, evidence
of their success and appropriateness for use in the PHN. Some of this evidence may have
emerged during the first two stages.
Figure 6 illustrates how the PHN moves through the various steps that make up this stage.
The focus will progressively narrow towards an identification of people, populations or
conditions that are likely to be priorities for the PHN and identify options to address these.
18
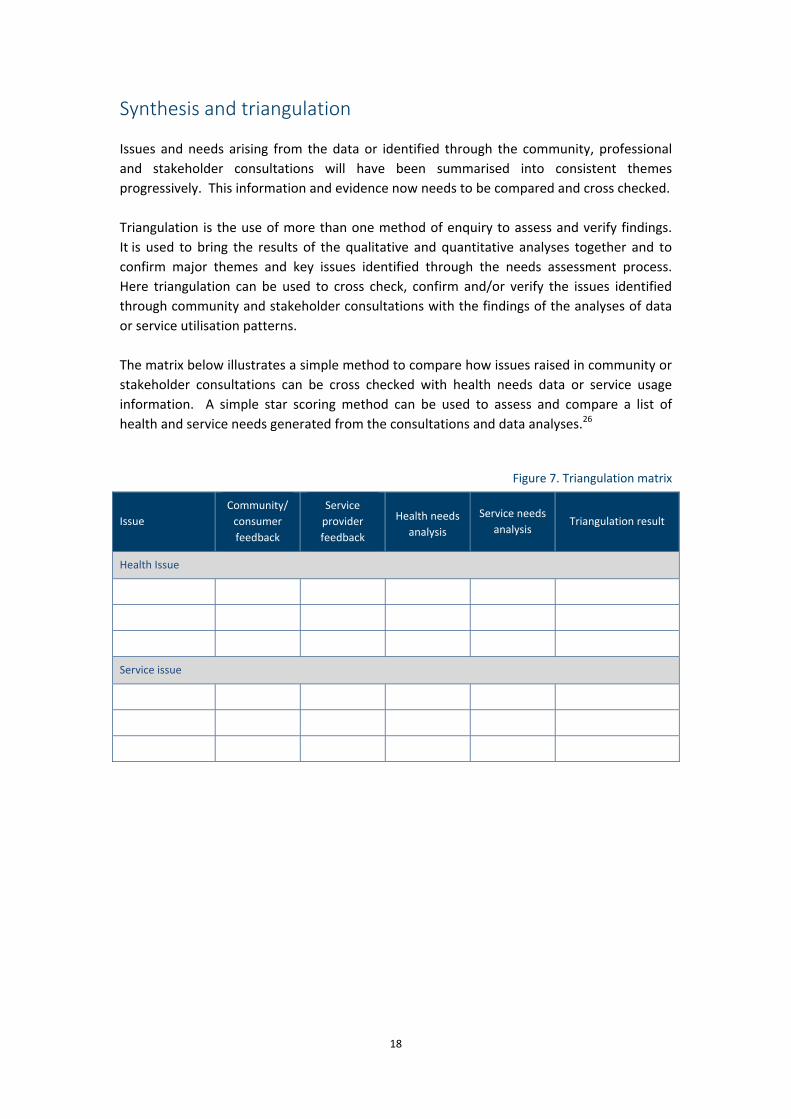
Synthesis and triangulation
Issues and needs arising from the data or identified through the community, professional
and stakeholder consultations will have been summarised into consistent themes
progressively. This information and evidence now needs to be compared and cross checked.
Triangulation is the use of more than one method of enquiry to assess and verify findings.
It is used to bring the results of the qualitative and quantitative analyses together and to
confirm major themes and key issues identified through the needs assessment process.
Here triangulation can be used to cross check, confirm and/or verify the issues identified
through community and stakeholder consultations with the findings of the analyses of data
or service utilisation patterns.
The matrix below illustrates a simple method to compare how issues raised in community or
stakeholder consultations can be cross checked with health needs data or service usage
information. A simple star scoring method can be used to assess and compare a list of
health and service needs generated from the consultations and data analyses.26
Figure 7. Triangulation matrix
Issue
Community/
consumer
feedback
Service
provider
feedback
Health needs
analysis
Service needs
analysis Triangulation result
Health Issue
Service issue

19
Priority setting and options
Prioritisation, or priority setting, applies to the full range of opportunities for PHN activities,
not just new or marginal ones. This involves an assessment of whether current service
arrangements are best suited to meeting identified need. Whatever processes are adopted
for prioritisation, PHNs need to ensure that:
they are evidence‐based;
are balanced and take account of the views of different groups and parties; and
decision‐making processes are transparent, fair and reasonable.27 28
It is expected that as the needs assessment progresses the PHN will be identifying the kinds
of interventions, programmes or policies that have been developed in the past to address a
number of the identified health and service needs. These should now be assessed as
possible options on the basis of their likely appropriateness (including funding available,
effectiveness, efficiency and value for money).
The existence or otherwise of evidence based models will inevitably impact on priority
setting. An issue may be identified as a priority, but with no obvious way forward the PHN
may need instead to invest in further development, which is consistent with its longer term
role in shaping the market.

20
5. SUMMARISING THE FINDINGS
Developing a summary of the findings of the health needs analysis, service needs analysis
and the priority setting process will help to inform PHN Annual Plans and facilitate reporting
and information sharing. In addition, the department may use this information to inform
programme and policy development.
The following tables illustrate how key information from the needs assessment can be
provided in a simple and common format. This does not prevent PHNs using the needs
assessment process to develop more detailed or different outputs (such as population
health profiles) as circumstances require.
PHNs will report to the Department of Health on their needs assessment activity.
Table 1. Outcomes of the health needs analysis
This table illustrates how findings of the health needs analysis can be summarised.
Identified Need
Key Issue Description of Evidence
e.g.
Health status
Poor self‐ assessed health status in
(specific locations)
NHPA analysis of ABS Patient Experience Survey
2013–14.Variation within PHN obtained through
consultations. Utilisation of hospitals and general
practices.
e.g.
Chronic disease
Lifestyle and risk factors impact on the
development of (identified) chronic
diseases
Variations between population groups and
locations. Evidence from community
consultations on diet, smoking, drug and alcohol
use, physical activity and health determinants.
Hospitalisations for chronic diseases.

21
Table 2. Outcomes of the service needs analysis
This table illustrates how findings of the service needs analysis can be summarised.
Identified Need Key Issue Description of Evidence
e.g.
Service
coordination
Lack of easily understood and accessible
referral pathways across settings and
providers
Proportion of GPs, community based medical
specialists and allied health providers with secure
messaging systems. Discharge information,
analysis of directory and eligibility criteria for
services, awareness of services from
consultations with consumers and health
professionals.
e.g.
Mental health
Lack of child and adolescent psychiatry
services in specific locations.
Identified through consultation with mental
health workers and school counsellors.
Data on available psychiatric sessions per capita,
waiting list for assessment and caseload
information.
Table 3. Opportunities, priorities and options
This table illustrates how PHNs can summarise the priorities arising from the Needs
Assessment and options for how they will be addressed. This could include options and
priorities that:
may be considered in the development of the PHN Annual Plan, and supported by
PHN flexible funding;
may be undertaken using programme‐specific funding; and
may be led or undertaken by another agency.
Priority
Possible options
Expected
outcome
Possible
performance
measurement
Potential lead
22
6. ANNUAL PLANNING
The Needs Assessment component has a definite endpoint with the identification of
opportunities, priorities and options. Decisions about which activities will be undertaken to
take these forward are the concern of the annual planning – the second component of the
strategic planning phase.
In their Annual Plans, PHNs may pursue a number of priorities through flexible funding. In
addition, some priorities may more appropriately be addressed through the use of separate
programme‐specific funding. While an annual plan has a particular focus on the upcoming
financial year it will also include medium and longer term perspective.
A number of areas may be identified where further investigation is required. There may also
be identified priorities where it will take longer to develop responses, or where it is more
appropriate that another agency such as Local Hospital Networks or equivalents would take
the lead role.
23
ENDNOTES
1 Australian Government Department of Health. Primary Health Networks Grant Programme
Guidelines 2014. p.7.
2 The commissioning cycle is most commonly presented in a diagram. This diagram is based largely on
that developed by the NHS Information Centre and used to support World Class Commissioning
between 2000 and 2010. See the NHS Information Centre archive and Commissioning Handbook for
Librarians. Another model that is used extensively, with variations, was developed by the Institute for
Public Care. First developed in 2003 and since adapted by a number of different agencies, the IPC
cycle shows the relationship between strategic commissioning (the outer circle) and procurement,
contracting and purchasing (the inner circle). This model follows the 4 step Plan‐Do‐Study‐Act cycle
first developed by Deming and used as the basis for many quality control and continuous
improvement programmes. See: Institute of Public Care. Commissioning for Health and Social Care.
Oxford Brookes University 2014, pp.11‐13. Bovaird T et al. Commissioning across government: review
of evidence. Third Sector Research Centre Research Report 86: for the UK National Audit Office.
August 2012, pp.48‐49.
3 Smith J, Curry N, Mays N, Dixon J. Where next for commissioning in the England NHS? The Nuffield
Trust and the King’s Fund 2010, p.12. Also see Øvretveit J. Purchasing for health: a multidisciplinary
introduction to the theory and practice of health purchasing. Open University Press 1995.
4 Australian Department of Health. Primary Health Networks Grant Programme Guidelines 2014.p.10.
Commissioning is characterised by a strategic approach to procurement that is informed by the
baseline needs assessment and associated market analysis undertaken in 2015‐16. Commissioning will
enable a more holistic approach in which PHNs can plan and contract medical and health care services
that are appropriate and relevant to the needs of their communities. Commissioning is further
characterised by ongoing assessment to monitor the quality of services and ensure that relevant
contractual standards are fulfilled. It is expected that PHN commissioning capabilities will continue to
develop over time.
5 Wright J, Williams R, Wilkinson JR. Development and importance of health needs assessment. BMJ
1998: 316: 1310‐1313. Also see Katterl R et al. Regionally‐based needs assessment in Australian
primary health care. PHCRIS 2011.
6 Smith B, Kwok Cho Tang, Nutbeam D. WHO Health Promotion Glossary: new terms. Oxford
University Press 2006.
7 ABS Data Quality Framework Cat No. 1520.0. 2009 and National Statistics Service: Data Quality
Online. The ABS DQF is comprised of seven dimensions of quality, reflecting a broad and inclusive
approach to quality definition and assessment. The seven dimensions of quality are Institutional
Environment, Relevance, Timeliness, Accuracy, Coherence, Interpretability and Accessibility. All seven
dimensions should be included for the purpose of quality assessment and reporting. However, the
seven dimensions are not necessarily equally weighted, as the importance of each dimension may
vary depending on the data source and context.

24
8 See the following.
ABS ABS website ‐ Census homepage
ABS website ‐ census ‐ SEIFA
ABS website ‐ Australian Health Survey
ABS website ‐ Profiles of Health, Australia 2011‐13
ABS website ‐ Australian Aboriginal and Torres Strait Islander Health
Survey: Physical activity, 2012‐13
AIHW AIHW website ‐ Homepage
AIHW website ‐ Metadata Online Registry homepage
NHPA NHPA website ‐ Homepage
Medicare Department of Health website ‐ MBS online
Department of Human Services website ‐ Medicare item statistics/reports
ACIR Department of Human Service website ‐ Australian Childhood
Immunisation Register for health professionals
Notifiable Diseases Department of Health website ‐ National Notifiable Diseases Surveillance
System
Department of Health website ‐ National Notifiable Diseases Surveillance
System Annual report
RACGP RACGP website ‐ Homepage
Indigenous health Department of Health website ‐ Aboriginal and Torres Strait Islander Health
Performance Framework
Australian Indigenous Health InfoNet website ‐ Homepage
DVA Department of Veterans Affairs website ‐ Data and Statistics ‐ Statistics
about the veteran population
Mental health Access to Allied Psychological Services website ‐ Minimum dataset
ABS website ‐ Mental Health Statistics
AIHW website ‐ Mental Health
Health workforce Health Workforce Australia website ‐ History
Health Workforce Australia website ‐ National Statistical Resource
AIHW website ‐ Workforce
AIHW website ‐ Workforce publications
BEACH University of Sydney website ‐ Medicine Research Centre ‐ Bettering the
Evaluation and Care of Health
PCHRIS Primary Health Care Research and Information Service website ‐ homepage
PHIDU University of Adelaide website ‐ Public Health Information Development
Unit
University of Adelaide website ‐ Public Health Information Development
Unit‐ Data
APHCRI Australian National University website ‐ National Centre for Geographic
and Resource Analysis in Primary Health Care
NHSD National Health Services Directory website ‐ Homepage
Healthfirst Health First Network website ‐ Homepage
9 PHN Performance Framework
10 See the following:
National Health Information Standards and Statistics Committee (NHISSC). The National Health
Performance Framework 2nd Edition 2009. the Australian Health Performance Framework consists
of three domains; health status, determinants of health and health system performance. Click
25
here to go to AIHW website ‐ Metadata Online Registry ‐ National Health Performance
Framework. This performance framework is used (in a slightly modified form) to monitor
progress in Indigenous Australian health outcomes, health system performance and broader
determinants of health. Australian Health Ministers’ Advisory Council. Aboriginal and Torres
Strait Islander Health Performance Framework 2014 Report. AHMAC 2015. This is the 5th in this
series which have been released every two years since 2006. Click here to go to the Department
of Health website ‐ Aboriginal and Torres Strait Islander Health Performance Framework
Productivity Commission. Report on Government Services 2014. Chapter 1: Approaches to
performance measurement. This framework groups indicators under three broad headings of
equity, effectiveness and efficiency, with access as a subset of both equity and effectiveness.
Note that this framework is specifically designed to report on government services. Click here to
go to the Australian Government Productivity Commission website ‐ Report on Government
Services
National Health Performance Authority. Performance and Accountability Framework 2011. The
Medicare Local component was based on the ROGS and proposed 31 initial indicators for
Medicare Locals. Click here to go to the National Health Performance Network website ‐
Performance Indicator Reporting
CIHI. A performance measurement framework for the Canadian health system. Canadian Institute
for Health Information 2012; IBM. Evaluation of the Health Information Roadmap Initiative:
Roadmap II and Roadmap II Plus. 2007. The Canadian Health Roadmap has four dimensions:
health status, non‐medical determinants of health, health system performance, and community
and health system characteristics.
The Triple Aim considers health care in terms of improving the health of populations, improving
the individual experience of care, and reducing the per capita costs of care for populations. This
model is a key element in performance measurement in many US health care organisations –
particularly since the Affordable Care Act – and is being adopted in a number of countries
including New Zealand, the UK and Canada. Click here to go to the Institute for Healthcare
Improvement website ‐ Homepage 11 Hibbert, P., Hannaford, N., Long, J., Plumb, J. and Braithwaite, J. Final Report: Performance
indicators used internationally to report publicly on healthcare organisations and local health systems.
Australian Institute of Health Innovation, University of New South Wales 2013.
12 The International Association for Public Participation’s core values, code of ethics, and public
participation spectrum are a useful foundation for informing stakeholder engagement. See: Click here
to go to the International Association for Public Participation Australasia website ‐ Homepage
13 See the following:
Wilkinson RG, Marmot M. The Solid Facts: the social determinants of health 2nd edition.
International Centre for Health and Society, WHO 2003. Wilkinson RG. Socioeconomic
determinants of health: Health inequalities: relative or absolute material standards? BMJ 1997:
314:591. Wilkinson RG, Pickett KE. Income inequality and population health: a review and
explanation of the evidence. Social Science and Medicine 2006: 62: 1768‐1784.
Marmot M. Social determinants of health. Oxford University Press 2005. Marmot M et al. Closing
the gap in a generation: health equity through action on the social determinants of health. The
Lancet 2008: 372: 1662‐1669. See the Institute of Health Equity for more information and links.
WHO. Closing the gap in a generation: Health equity through action on the social determinants of
health. WHO. Final Report of the Commission on Social Determinants of Health 2008. 2011 World
Conference on Social Determinants of Health.

26
14 ACSQHC. Health literacy: taking action to improve safety and quality. Australian Commission on
Safety and Quality in Healthcare 2015. p.2.
15 See endnote 11 above. The National Health Performance Framework locates ‘health behaviours’
within the Health Determinants rather than the Health Status domain. The Aboriginal and Torres
Strait Islander Health Performance Framework uses the sub components of ‘health conditions’,
‘human function’, ‘life expectancy and wellbeing’ and ‘deaths’.
16 Rose G. Sick individuals and sick populations. International Journal of Epidemiology 2001: 30: 427‐
432. First published International Epidemiological Association 1985. p.428. See also Merchant A et al.
Insights from cross‐population studies: Rose revisited. International Journal of Epidemiology 2005: 34:
344‐246 [commentary].
17 The National Health Performance Healthy Communities reports are an example of comparisons
between ‘peer groupings’ of Medicare Locals. A range of methodologies are found in Begg S, Vos T,
Barker B, Stevenson C, Stanley L, Lopez AD. The burden of disease and injury in Australia 2003. PHE
82. Canberra: AIHW 2007. The AIHW is currently undertaking the third Australian burden of Disease
Study using 2011 data with results expected in the first half of 2016. Click here to go to the AIHW
website ‐ Burden of Disease
18 The PHN may wish to consider the effectiveness, efficiency and coordination of services within the
scope of a broader description of quality. There are many examples of these and include the work of
Donabedian, the Australian Commission on Safety and Quality in Health Care, the WHO or the US
Institute of Medicine. See the following:
Donabedian A. The seven pillars of quality. Archives of Pathology and Laboratory Medicine 1990:
114: 11:1115‐1118, and Donabedian A. Evaluating the quality of medical care. Milbank Quarterly
1966: 44: 3 Pt 2. Reprinted 2005: 83: 4: 691‐729.
Australian Commission on Safety and Quality in Health Care. Australian Safety and Quality
Framework for Health Care. 2012
WHO. Quality of care: A process for making strategic choices in health systems. World Health
Organisation 2006. pp.9‐10.
Institute of Medicine. Crossing the Quality chasm: a new health system for the 21st century US
IOM 2001. See also ARHQ. National Quality Measures Clearinghouse ‐ Domain Framework. The
US Department of Health and Human Services Agency for Healthcare Research and Quality
(AHRQ) has a ‘domain framework’ which takes the definition of quality to another level.
19 AIHW website ‐ Metadata Online Registry ‐ Report on Government Services ‐ Effectiveness and
AIHW website ‐ Metadata Online Registry ‐ Report on Government Services ‐ Efficiency and
Sustainability
20 AIHW website ‐ Metadata Online Registry ‐ Report on Government Services ‐ Effectiveness
[summarised]
Access indicators measure how easily the community can obtain a service. Access has two main dimensions,
undue delay (timeliness) and undue cost (affordability). Timeliness indicators can include waiting times (for
example, in public hospitals and for aged care services). Affordability indicators relate to the proportion of
income spent on particular services (for example, out‐of‐pocket expenses in children's services).
Appropriateness indicators measure how well services meet client needs. Appropriateness indicators also
seek to identify the extent of any underservicing or overservicing. Data on differences in service levels can
indicate where further work could identify possible underservicing or overservicing.

27
Quality indicators reflect the extent to which a service is suited to its purpose and conforms to
specifications. There is usually more than one way in which to deliver a service, and each alternative has
different implications for both cost and quality. Information about quality is needed to ensure all relevant
aspects of performance are considered.
21 Australian Government. Aboriginal and Torres Strait Islander Health Performance Framework 2014
Report. p.142. Improving the cultural competency of health care services can increase Aboriginal and Torres
Strait Islander peoples’ access to health care, increase the effectiveness of care that is received,
and improve the disparities in health outcome. Cultural competency requires that organisations
have a defined set of values and principles, and demonstrate behaviours, attitudes, policies and
structures that enable them to work effectively cross‐culturally.
22 Australian Government. Reform of the Federation White Paper: roles and responsibilities in health.
Issues paper 3. Dec 2014. Click here to go to the Australian Government Reform of the Federation
White Paper website ‐ Roles and Responsibilities in Health Issues Paper Three ‐ Equity
23 AIHW website ‐ Metadata Online Registry ‐ Report on Government Services ‐ Effectiveness
24 Duckett S, Willcox S. The Australian Health Care System 4th edition. Oxford University Press 2011.
pp.304‐306. The areas used as overall headings for evaluating health care systems are equity, quality,
efficiency and acceptability. Duckett and Willcox see effectiveness as a component of allocative
efficiency, along with technical efficiency and priority setting. In this dynamic efficiency is
conceptualised a bit differently and concerns the extent to which the health care system as a whole,
and its constituent elements, adapt to change and innovation.
25 World Health Organisation. Health Systems Financing: the path to universal coverage 2010 p.61.
Efficiency… is a measure of the quality and/or quantity of output (i.e. health outcomes or services) for a
given level of input (i.e. cost). So efficiency gains could help to contain costs – an important objective in
many countries – by reducing the costs of service delivery. However, no one wants to contain costs by
reducing health outcomes, so seeking efficiency gains should also be seen as a means of extending
coverage for the same cost.
26 This is a shorter version adapted from the Medicare Local Comprehensive Needs Assessment Tools
and Resources, Appendix K. The star scoring system proposed was:
* rarely raised as an issue/not evident in data
** raised as an issue/somewhat evident in data
*** raised frequently as an important issue/concern evident in data
**** raised frequently as a high priority issue or concern needing action/significant concern
evident from data
27 Robinson S, Dickenson H, Williams I, Freeman T, Rumbold B, Spence K. Setting priorities in health: a
study of English primary care trusts. The Nuffield Trust 2011, p.13.
28 NHS Institute for Innovation and Improvement 2012. Prioritise Commissioning Opportunities
Also see the Qualitas Consortium and the Commissioning Handbook for Librarians