Embed Size (px)
Citation preview

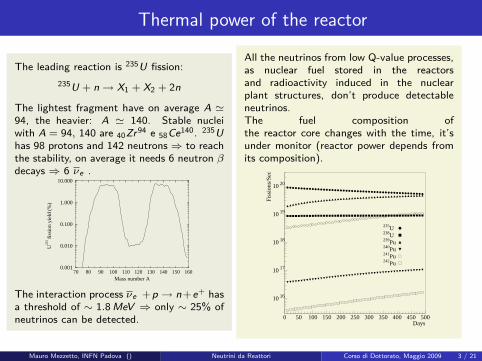
Neutrinos from nuclear reactors
Nuclear reactors are a very intense source of νe from β decays ofthe fission fragments.
Everyfission reaction emits about 200 MeV of energy and 6 νe .
⇓Flux ∼ 2 · 1020 νe s−1 GWatt−1, isotropic, ⟨E (νe )⟩ ≃ 0.5 MeV .
Latestoscillation experiments look for νe disappearance atdifferent baselines:
L = O(2km) ⇒ atmospheric regime: Chooz,Palo VerdeL = O(150km) ⇒ solar regime: Kamland
Mauro Mezzetto, INFN Padova () Neutrini da Reattori Corso di Dottorato, Maggio 2009 1 / 21

Neutrino flux
Detect absolute number ofneutrino interaction and distortions of theirspectrum
prompt positron signal, energy range.νe p → e+n
n + p −→τ≃186 µs
d + γ(2.2 MeV )
delayed correlated photon.
To determine neutrino flux:...1 Measure of the reactor thermal
power...2 Determination of the neutrino
spectrum...3 Definition of the experimental
observable: positron momentumspectrum.
Eν (MeV)(s
ee a
nnot
atio
ns)
(a)
(b)
(c)
a) ν_
e interactions in detector [1/(day MeV)]
b) ν_
e flux at detector [108/(s MeV cm2)]
c) σ(Eν) [10-43 cm2]
0
10
20
30
40
50
60
70
80
90
100
2 3 4 5 6 7 8 9 10
Mauro Mezzetto, INFN Padova () Neutrini da Reattori Corso di Dottorato, Maggio 2009 2 / 21
Thermal power of the reactor
The leading reaction is 235U fission:235U + n→ X1 + X2 + 2n
The lightest fragment have on average A ≃94, the heavier: A ≃ 140. Stable nucleiwith A = 94, 140 are 40Zr94 e 58Ce140. 235Uhas 98 protons and 142 neutrons ⇒ to reachthe stability, on average it needs 6 neutron βdecays ⇒ 6 νe .
70 80 90 100 110 120 130 140 150 160Mass number A
0.001
0.010
0.100
1.000
10.000
U23
5 fis
sion
yie
ld (
%)
The interaction process νe +p → n+e+ hasa threshold of ∼ 1.8 MeV ⇒ only ∼ 25% ofneutrinos can be detected.
All the neutrinos from low Q-value processes,as nuclear fuel stored in the reactorsand radioactivity induced in the nuclearplant structures, don’t produce detectableneutrinos.The fuel composition ofthe reactor core changes with the time, it’sunder monitor (reactor power depends fromits composition).
235U238U239Pu240Pu241Pu242Pu
Days
Fiss
ions
/Sec
10 16
10 17
10 18
10 19
10 20
0 50 100 150 200 250 300 350 400 450 500
Mauro Mezzetto, INFN Padova () Neutrini da Reattori Corso di Dottorato, Maggio 2009 3 / 21

From fission rate to the νe spectrumThe νe spectrum of three of the four principalfission nuclei: (235U, 239Pu, 241Pu), has beenderived by measuring the electron spectrum.The fourth: 238U, has been computed fromnuclear models, as well all the processes in thedecay chain. Systematic error: ∼ 1%.
From νe to positronsνe + p → n + e+ cross section:
σ(0)tot = σ0 (f 2 + 3g2) E (0)
e p(0)e
= 0.0952(
E (0)e p(0)
e
1 MeV2
)× 10−42 cm2 ,(1)
E (0)e = Eν − (Mn − Mp): positron energy
(neglecting neutron recoil, marginal effect) p(0)e
momentum,f = 1, g = 1.26 vector and axial couplingconstants
σ0 =G2
F cos2 θC
π(1 + ∆R
inner ) , (2)
radiative corrections: ∆Rinner ≃ 0.024.
0
2
4
6
8
10
σ tot
[10−
42 c
m2 ]
0 1 2 3 4 5 6 7 8 9 10Eν [MeV]
−0.04
−0.03
−0.02
−0.01
⟨ cos
θ e ⟩Solid lines: predictions atO(1/Mn), dashedO(1).
Mauro Mezzetto, INFN Padova () Neutrini da Reattori Corso di Dottorato, Maggio 2009 4 / 21

Data/prediction agreementExperiment Bugey 3 (years 80’,nowconsidered a non oscillationexperiment): expected andmeasured νe spectrum.Curve b) is the mostupdated prediction.
7
0 1 2 3 4 5 6 7
b)
Positron energy (MeV)
a)
1.0
0.9
0.8
1.1
0.9
0.8
1.0
1.1
1.2
1.2
0 1 2 3 4 5 6
Systematic errors summary(from hep-ph/0107277) Origin and magnitude ofsystematic errors in Palo Verde and Chooz. Notethat the two experiments offer different breakdowns oftheir systematics. For simplicity we do not show thesystematics for the Palo Verde ON-OFF analysis. ThePalo Verde results are from the analysis of the full dataset (Boehm et al. 2001).
Systematic Chooz (%) P.V. (%)σ(νe + p→ n + e+) 1.9 -Number of p in target 0.8 -Wth 0.7 -Energy abs. per fission 0.6 -Total rate prediction 2.3 2.1e+ trigger eff. - 2.0n trigger eff. - 2.1νe selection cuts - 2.1(1− ϵ1)Bpn estimate - 3.3Total νe efficiency 1.5 4.9Total 2.7 5.3
Mauro Mezzetto, INFN Padova () Neutrini da Reattori Corso di Dottorato, Maggio 2009 5 / 21

Experimentalbackgrounds
Veto
Water Buffer
Target
µ (n spallation)µ (capture)
nn
n
νe
8 MeV γ (n capture)511 keV γ
511 keV γne +
p
pp
n
Two main categories:Accidental backgrounds from therandom superposition of a“positron-like" and “neutron-like"signals. Directly estimated fromthe measured rates of the twoprocesses.Backgrounds from neutronsinduced by cosmic rays. They canbe measured only if the reactor isoff (impossible to pay to have areactor shutdown). Chooz counting rate as function of the
reactors power.Mauro Mezzetto, INFN Padova () Neutrini da Reattori Corso di Dottorato, Maggio 2009 6 / 21

CHOOZ experiment (France-Italy-Russia-USA)Took data in 1997-98
Mauro Mezzetto, INFN Padova () Neutrini da Reattori Corso di Dottorato, Maggio 2009 7 / 21

CHOOZ detector
5 ton liquid scintillator detector dopedwith gadolinium. Active liquidscintillator veto.νe detection:
νe +p→e++n E (νe ) = E (e+)+1.804 MeV
Two signals in delayed coincidence:...1 Prompt: e+ followed by
e+e−→γγ...2 Delayed: neutron capture in
gadolinium, after thermalization,releasing ∼ 8 MeV.
Mauro Mezzetto, INFN Padova () Neutrini da Reattori Corso di Dottorato, Maggio 2009 8 / 21

CHOOZ data
0
50
100
150
200
250
300
0 2 4 6 8 10
MC
ν signal
e+ energy
MeV
0
0.25
0.5
0.75
1
1.25
1.5
1.75
2
0 2 4 6 8
Positron spectrumMeasuredExpected( )E
vents
MeV
Mauro Mezzetto, INFN Padova () Neutrini da Reattori Corso di Dottorato, Maggio 2009 9 / 21

How to build the signal/exclusion plot
Grid in the sin2
2θ,∆ m2 plane
sin2(2θ)
∆m
2 1
0-3
eV
2
Fill the grid with the 2
Every sin22 , m2 cell defines P
µ µ
0
0.2
0.4
0.6
0.8
1
0 0.25 0.5 0.75 1 1.25 1.5 1.75 2
Eν (GeV)
P(ν
µ ν
µ)
That modulates the non-oscillated predicted spectrum
0
200
400
600
800
1000
1200
1400
0 0.25 0.5 0.75 1 1.25 1.5 1.75 2
Eν (GeV)
a.u
.
The prediction is compared to the data
0
100
200
300
400
500
600
700
800
900
0 0.25 0.5 0.75 1 1.25 1.5 1.75 2
Eν (GeV)
a.u
.
νθ ∆ ν
χ
Mauro Mezzetto, INFN Padova () Neutrini da Reattori Corso di Dottorato, Maggio 2009 10 / 21

How to build the signal/exclusion plot (II)
The minimum of the χ2
distribution is the best fitThe region at a given confidencelevel (CL) is defined by the contourat a given ∆χ2 from the minimum.The CL is computed from theprobability distribution of a χ2 attwo degrees of freedom(sin2 2θ,∆m2)
Question: Why ∆χ2 and not χ2?Hint: Why two degrees of freedom?
A more formalapproach in G.Feldman and R.Cousins,Phys.Rev.D57:3873-3889,1998
Χ2 map
sin2 (θ)
δm 2
-3-2.5
-2-1.5
-1-0.5
0
0
0.5
1
1.5
2
2.5
3
10
12
14
16
18
20
Mauro Mezzetto, INFN Padova () Neutrini da Reattori Corso di Dottorato, Maggio 2009 11 / 21

10-4
10-3
10-2
10-1
1
0 0.1 0.2 0.3 0.4 0.5 0.6 0.7 0.8 0.9 1sin2(2θ)
δm2 (
eV2 )
analysis A
90% CL Kamiokande (multi-GeV)
90% CL Kamiokande (sub+multi-GeV)
νe → νx
_ _
analysis B
analysis C
CHOOZ final results
Analysis A νe spectrum afterbackground subtraction. Both theabsolute rate and the spectrumare used.Analysis B Uses the differentbaseline(∆L = 117.7 m) of the tworeactors.Many systematic errors cancel,but statistical errors are biggerand the ∆m2 sensitivity is reducedby the shorter baseline.Analysis C Only spectruminformation is used.
Mauro Mezzetto, INFN Padova () Neutrini da Reattori Corso di Dottorato, Maggio 2009 12 / 21

2850 WMA P First Year Wilkinson Microwave observations: determi-
nation of cosmologicalparameters.
2003
2493 S. Perlmutter et al., Measurements of Omega and Lambda from 42 high red-
shift supernovae.
1999
2462 SuperKamiokande Evidence for oscillation of atmospheric neutrinos. 1999
2441 Adam G. Riess et al., Observational evidencefrom supernovae for an acceler-
ating universe and a cosmologicalconstant.
1998
2261 David J. Schlegel, Dou-
glas P. Finkbeiner, Marc
Davis,
Maps of dust I R emission for use in estimation of red-
dening and CMBR foregrounds.
1998
1523 WMA P First year Wilkinson Microwave observations: prelimi-
nary maps and basic results.
2003
1395 S. Tin g et al., Experimental observation of a heavy particle J. 1974
1307 B. Richter et al., Discovery of a narrow resonancein e+ e- annihilation. 1974
1275 J. Ashman et al., A measurement of the spin asymmetry in deepinelastic
muon - proton scattering.
1998
1211 COBE Structur e in the COBE dmr Þrst year maps. 1992
1186 CDF Observation of TOP quark production in anti- p p colli-
sions.
1995
1138 D0 Observation of the TOP quark. 1995
1109 SNO Measurement of t he rate of e + D p + p + e inter-
actions producedby B-8 solar neutrinos at t he Sudbury
Neutrino Observatory.
2001
1078 V.L. Fitch, J.W. Cronin et
al.
Evidence for t he 2 Pi decay of t he K(2)0 meson 1964
1053 SNO Direct evidencefor neutrino a flavor transform. from
neutral current interactions in the Sudbury Neutrino
Observatory.
2002
1052 CHOOZ Limits on neutrino oscillations from the Chooz experi-
ment .
1999
1026 S.W. Herb et al., Observation of a dimuon resonance at9.5-GEV in 400-
GEV proton - nucleuscollisions.
1977
1024 ARGUS Observation of B0 - anti-B0 mixing. 1987
1018 Homestake (R. Davis et
al.)
Measurement of the solar flux with the eHomestakhlorine detector .
1998
Top Cited 1000+ Sperimentali in QSPIRES (al 6/11/05)
ν −
ν
eν
c
Mauro Mezzetto, INFN Padova () Neutrini da Reattori Corso di Dottorato, Maggio 2009 13 / 21

Mauro Mezzetto, INFN Padova () Neutrini da Reattori Corso di Dottorato, Maggio 2009 14 / 21

Kamland and the far east reactors
Site
UlchinWolsongYonggwangKori
Japan
Korea
160.0179.5190.6214.0138.6 80.6145.4344.0344.0294.6414.0430.2561.2755.4824.1783.5
~700
~750~690~940
7444213641223422
4464
11.2 8.116.8 8.9
5.3
24.613.710.2
P(ther.)
(GW)
10.6 4.5 1.6 4.914.213.2 3.3 3.8
6.0 4.8
6.7 3.3
cores
# of
(km)
Distance flux
(ν cm s−2 −1)
Signal
4.25x101.88X101.24x101.03x101.03x101.08x101.03x10
5.3x10 4.9x10 1.7x10 9.9x10 9.8x10 8.4x10 5.3x10 3.5x10 2.4x10
OhiTakahamaHamaokaTsurugaShigaMihamaFukushima−1
Tokai−IIShimaneOnagawaIkataGenkaiSendaiTomari
Kashiwazaki
Fukushima−2
8.8x10 7.5x10
8.0x10 8.4x10
5
5
5
5
5
5
5
4
4
4
3
3
3
3
3
3
3
3
3
3
_ν
348.1
( /yr)
154.0101.8 84.1 84.7 88.8 84.5 43.5 40.3 13.7 8.1 8.1 6.9 4.3 2.8 2.0
7.2 5.2 6.9 6.6
Total 69 1.34x106175.7 1102
_
Mauro Mezzetto, INFN Padova () Neutrini da Reattori Corso di Dottorato, Maggio 2009 15 / 21

Kamland and systematic errors
Detector-related (%) Reactor-related (%)∆m2
21 Energy scale 1.9 νe-spectra 0.6
Event rate
Fiducial volume 1.8 νe-spectra 2.4Energy threshold 1.5 Reactor power 2.1Efficiency 0.6 Fuel composition 1.0Cross section 0.2 Long-lived nuclei 0.3
Mauro Mezzetto, INFN Padova () Neutrini da Reattori Corso di Dottorato, Maggio 2009 16 / 21

Kamland Results (I)
KL1 KL2 KL3
Exposure (ton•yr) 162 766 2881
Observed ev. 54 258 1609
(Eprompt : MeV) (>2.6) (>2.6) (>0.9)
Expected ev. 86.8 ± 5.6 365.2 ± 23.7 2179 ± 89
Background ev. 0.95 ± 0.99 17.5 ± 7.3 276.1± 23.5
accidental 0.0086 2.69 80.5
± 0.0005 ± 0.02 ± 0.19Li/8He (β, n) 0.94 ± 0.85 4.8± 0.9 13.6± 1.0
fast neutron 0 ± 0.5 < 0.89 < 9.013C(α, n)16Ogs, 1st, 2nd 10.3 ± 7.1 182.0 ± 17.7
# of Observed and Expected Events # of Observed and Expected Events # of Observed and Expected Events
0.611 0.658 0.593
(±stat ±syst) ±0.085±0.041 ±0.044±0.047 ±0.020±0.026
99.95 % CL 99.995 % CL 8.5 σMauro Mezzetto, INFN Padova () Neutrini da Reattori Corso di Dottorato, Maggio 2009 17 / 21

Kamland Results (II)
Fit to scaled no-oscillation spectrum
: exclude at 5.1 σtan2θ = 0.56
+ 0.14
- 0.09
∆m2 = 7.58 x 10⁻⁵eV2+ 0.21
- 0.20
-110 1
-410
KamLAND
95% C.L.
99% C.L.
99.73% C.L.
best !t
Solar
95% C.L.
99% C.L.
99.73% C.L.
best !t
10 20 30 40
σ1 σ2 σ3 σ4
σ5
σ6
5
10
15
20
σ1
σ2
σ3
σ4
12θ2tan 2χ∆
)2
(e
V2
1
2m
∆2
χ∆
Mauro Mezzetto, INFN Padova () Neutrini da Reattori Corso di Dottorato, Maggio 2009 18 / 21

Kamland Results (III)
L/<E>
(km/MeV)eν
/E0L
20 30 40 50 60 70 80 90 100
Su
rviv
al P
rob
ab
ilit
y
0
0.2
0.4
0.6
0.8
1
eνData - BG - Geo
Expectation based on osci. parametersdetermined by KamLAND
Mauro Mezzetto, INFN Padova () Neutrini da Reattori Corso di Dottorato, Maggio 2009 19 / 21

Kamland Geoneutrinos
28
• Natural nuclear reactorin the center of the Earth was proposed in 2001 as the energy source of geo-magnetic field.
• Not a mainstream theory, but not ruled out by any evidence.
• Explains mechanism for flips of the geo-magnetic field.
GeoGeo--ReactorReactor
Mauro Mezzetto, INFN Padova () Neutrini da Reattori Corso di Dottorato, Maggio 2009 20 / 21

Kamland Geoneutrinos: resultsSignature from GeoSignature from Geo--ReactorReactor
YY--intercept :intercept :GeoGeo--Reactor + BGReactor + BG
theoretical prediction : 3 TW theoretical prediction : 3 TW
2008 2009
big earthquake
Kashiwazaki power
station : 24.3 GW
Mauro Mezzetto, INFN Padova () Neutrini da Reattori Corso di Dottorato, Maggio 2009 21 / 21