Embed Size (px)
DESCRIPTION
2014_01_ 기술혁신세미나. Session 11. New Product Development 2. OM 박사과정 김수연 OM 석사과정 김인희 OM 석사과정 김경 순. Introduction. NPD 성과. 기업 내부 역량. 기업 외부와의 NW. Manufacturing capability Integrated Problem Solving Leadership(PM) & Organization Flexible Development Process : overlapping, Etc - PowerPoint PPT Presentation
Citation preview

New Product Development 2
OM 박사과정 김수연OM 석사과정 김인희OM 석사과정 김경순
Session 11
2014_01_ 기술혁신세미나
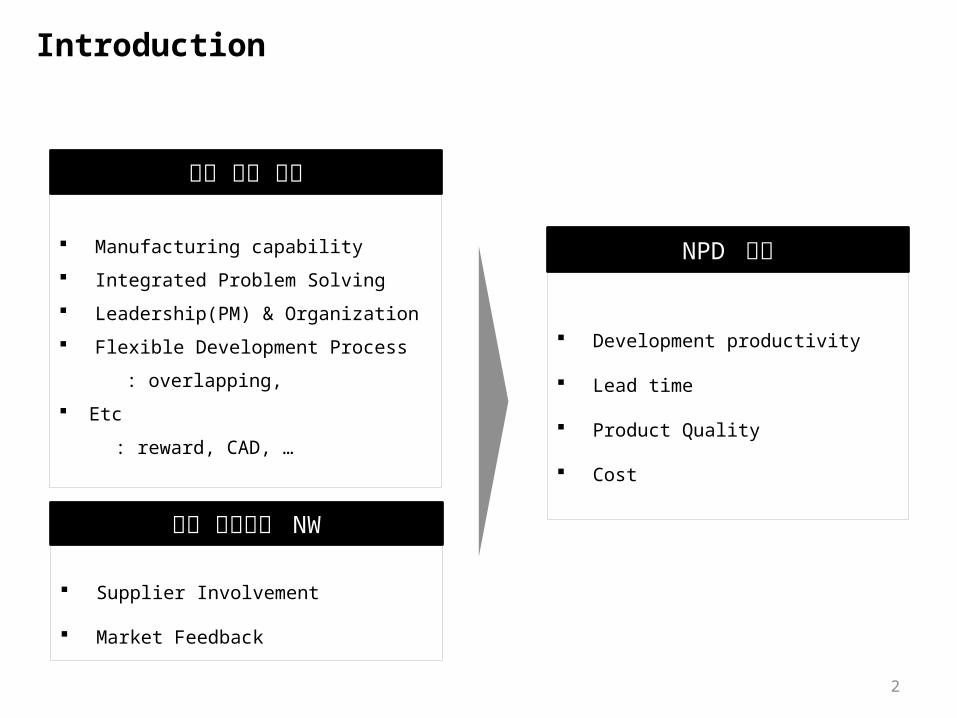
Introduction
2
기업 내부 역량 Manufacturing capability Integrated Problem Solving Leadership(PM) & Organization Flexible Development Process : overlapping, Etc : reward, CAD, …
기업 외부와의 NW
Supplier Involvement
Market Feedback
NPD 성과 Development productivity
Lead time
Product Quality
Cost
Product development performance : strategy, organization, and management in
the world auto industry
Clark, K. B. and T. Fujimoto (1991).
4
1. Manufacturing Capability
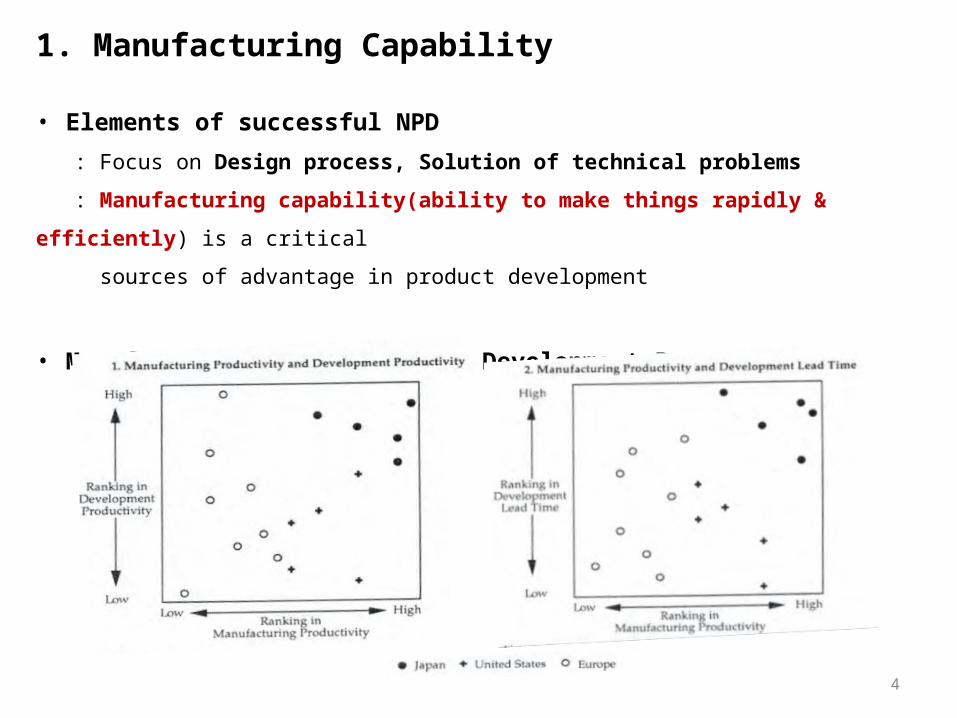
• Elements of successful NPD : Focus on Design process, Solution of technical problems : Manufacturing capability(ability to make things rapidly & efficiently) is a critical sources of advantage in product development
• Manufacturing Productivity & Development Productivity : positive correlation
5
1. Manufacturing Capability
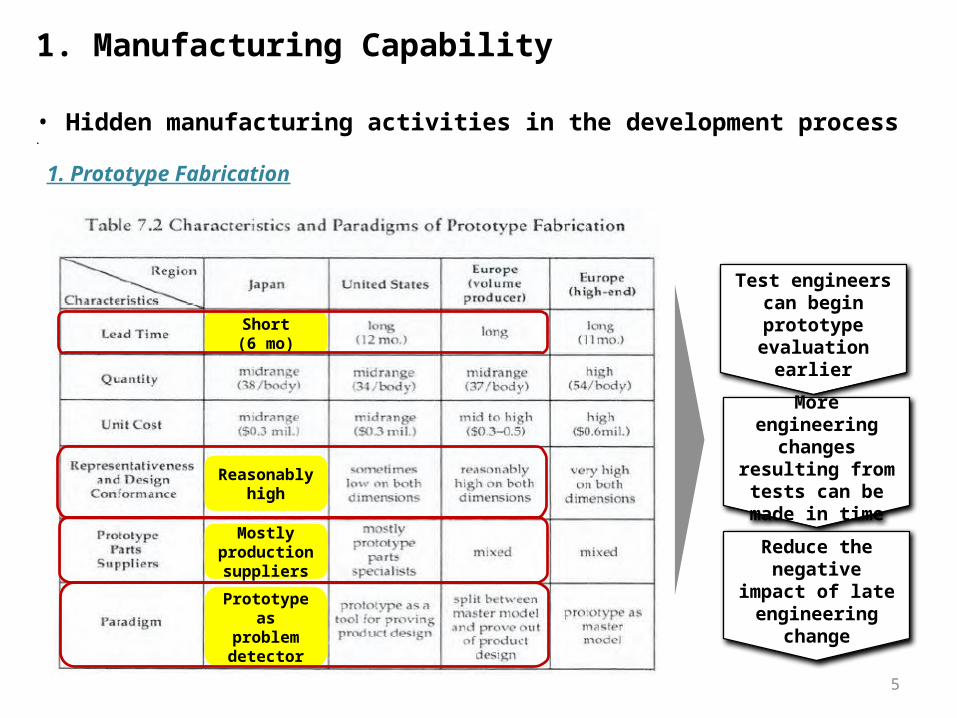
• Hidden manufacturing activities in the development process•
1. Prototype Fabrication
Short(6 mo)
Mostly production suppliersPrototypeas prob-lem de-tector
Reason-ably high
Test engineers can begin pro-totype evalua-
tion earlier
More engineer-ing changes re-
sulting from tests can be made in time
Reduce the negative im-
pact of late en-gineering change
6
1. Manufacturing Capability
• Hidden manufacturing activities in the development process•
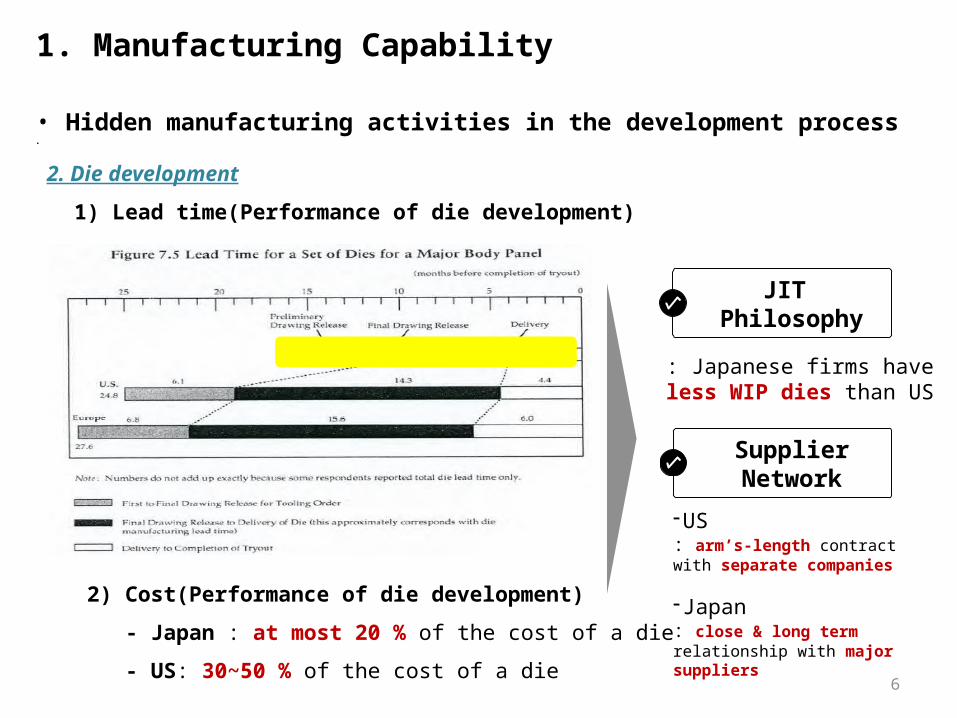
2. Die development 1) Lead time(Performance of die development)
2) Cost(Performance of die development) - Japan : at most 20 % of the cost of a die - US: 30~50 % of the cost of a die
JIT Philosophy
Supplier Network
: Japanese firms haveless WIP dies than US
-US: arm’s-length contract with separate companies
- Japan: close & long term relation-ship with major suppliers
7
1. Manufacturing Capability
• Hidden manufacturing activities in the development process•
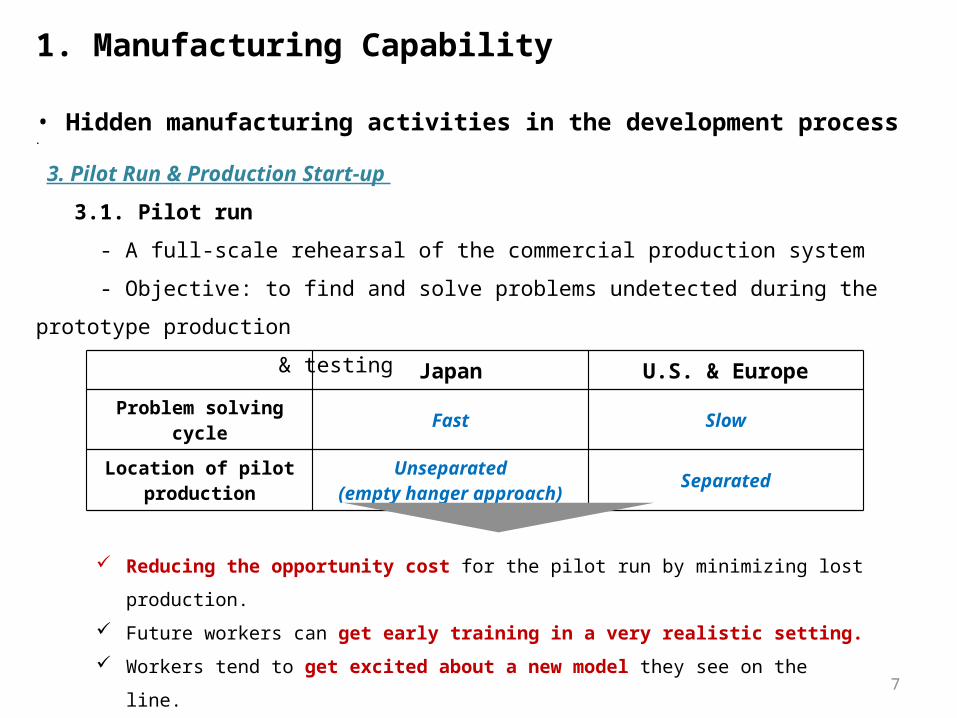
3. Pilot Run & Production Start-up 3.1. Pilot run - A full-scale rehearsal of the commercial production system - Objective: to find and solve problems undetected during the prototype pro-duction & testing Japan U.S. & Europe
Problem solving cycle Fast Slow
Location of pilot production
Unseparated(empty hanger ap-
proach)Separated
Reducing the opportunity cost for the pilot run by minimizing lost produc-tion.
Future workers can get early training in a very realistic setting. Workers tend to get excited about a new model they see on the line. Workers become motivated to learn more about a new model.
8
1. Manufacturing Capability
• Hidden manufacturing activities in the development process•
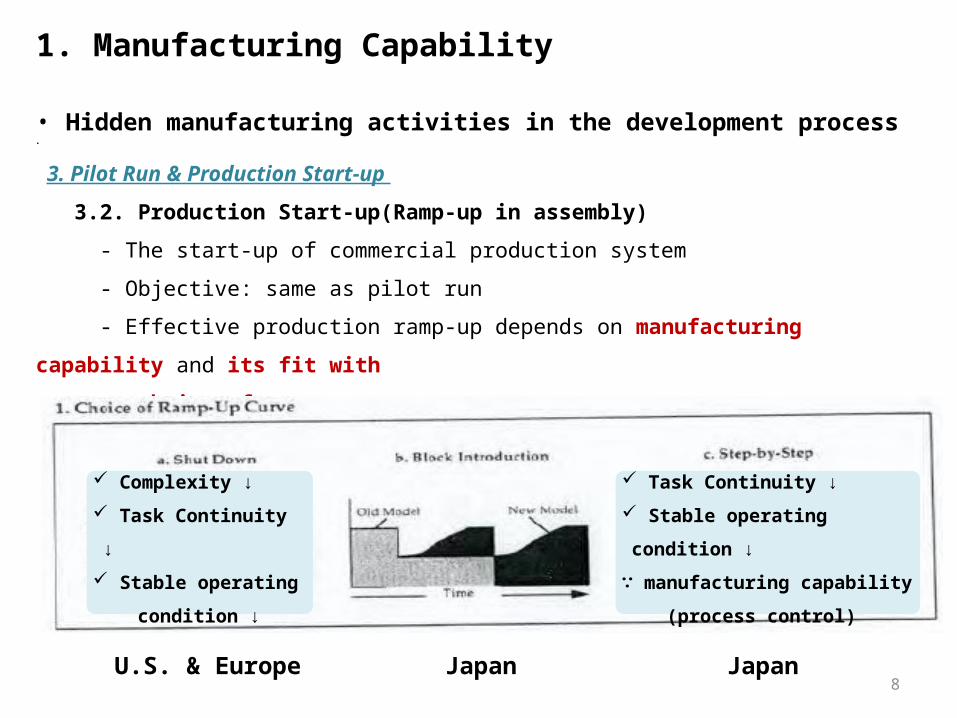
3. Pilot Run & Production Start-up 3.2. Production Start-up(Ramp-up in assembly) - The start-up of commercial production system - Objective: same as pilot run - Effective production ramp-up depends on manufacturing capability and its fit with choice of ramp-up curve
U.S. & Europe Japan Japan
Complexity ↓ Task Continuity ↓ Stable operating condition ↓
Task Continuity ↓ Stable operating condi-tion ↓
∵ manufacturing capability (process control)
9
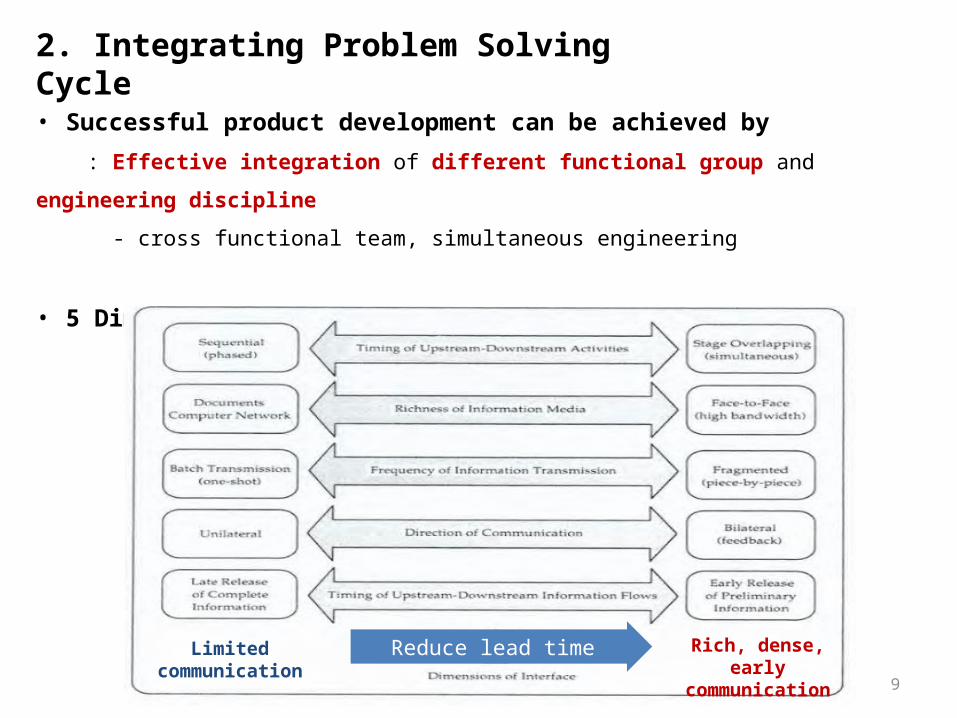
2. Integrating Problem Solving Cy-cle• Successful product development can be achieved by : Effective integration of different functional group and engineering dis-cipline - cross functional team, simultaneous engineering
• 5 Dimensions of Integrated Problem Solving
Rich, dense, early commu-
nication
Limitedcommunication
Reduce lead time
10
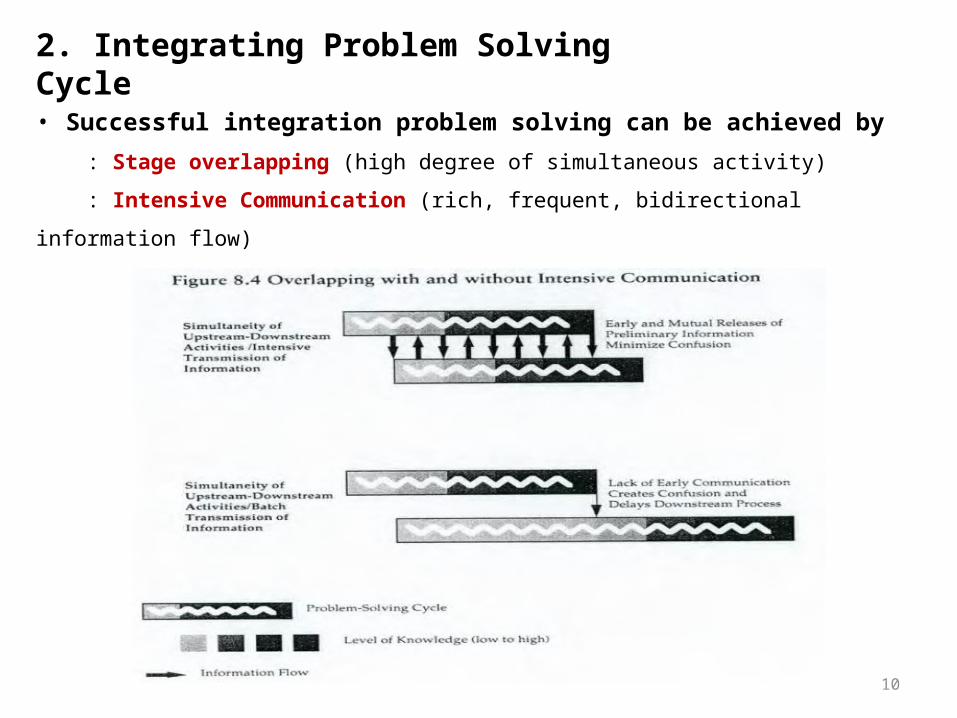
2. Integrating Problem Solving Cy-cle• Successful integration problem solving can be achieved by : Stage overlapping (high degree of simultaneous activity) : Intensive Communication (rich, frequent, bidirectional information flow)
11
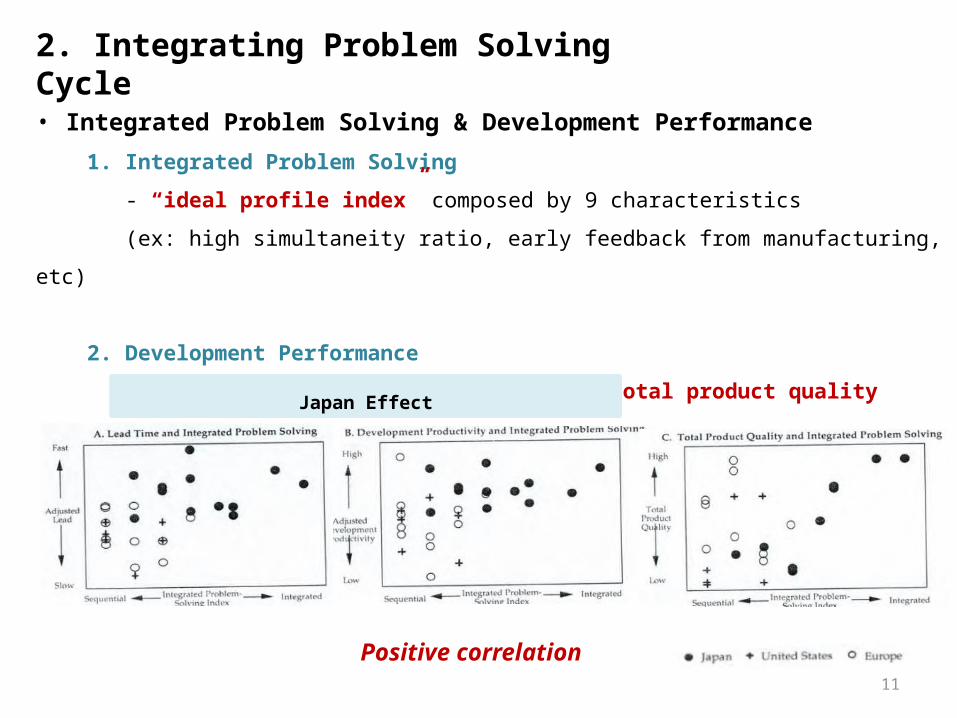
2. Integrating Problem Solving Cy-cle• Integrated Problem Solving & Development Performance 1. Integrated Problem Solving - “ideal profile index” composed by 9 characteristics (ex: high simultaneity ratio, early feedback from manufacturing, etc)
2. Development Performance - lead time, development productivity, total product quality
Positive correlation
Japan Effect
12
3. Leadership and Organization
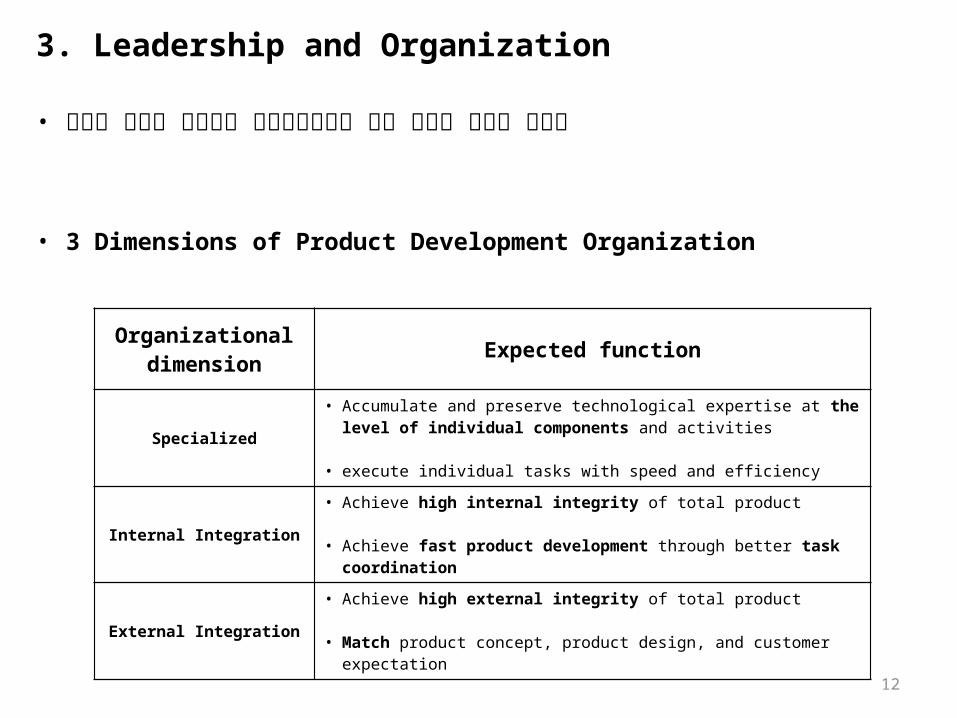
• 조직의 형태와 리더십은 제품개발성과에 영향 미치는 중요한 요소임
• 3 Dimensions of Product Development Organization
Organizational dimension Expected function
Specialized• Accumulate and preserve technological expertise at the level
of individual components and activities
• execute individual tasks with speed and efficiency
Internal Integration• Achieve high internal integrity of total product
• Achieve fast product development through better task co-ordination
External Integration• Achieve high external integrity of total product
• Match product concept, product design, and customer expecta-tion
13
3. Leadership and Organization
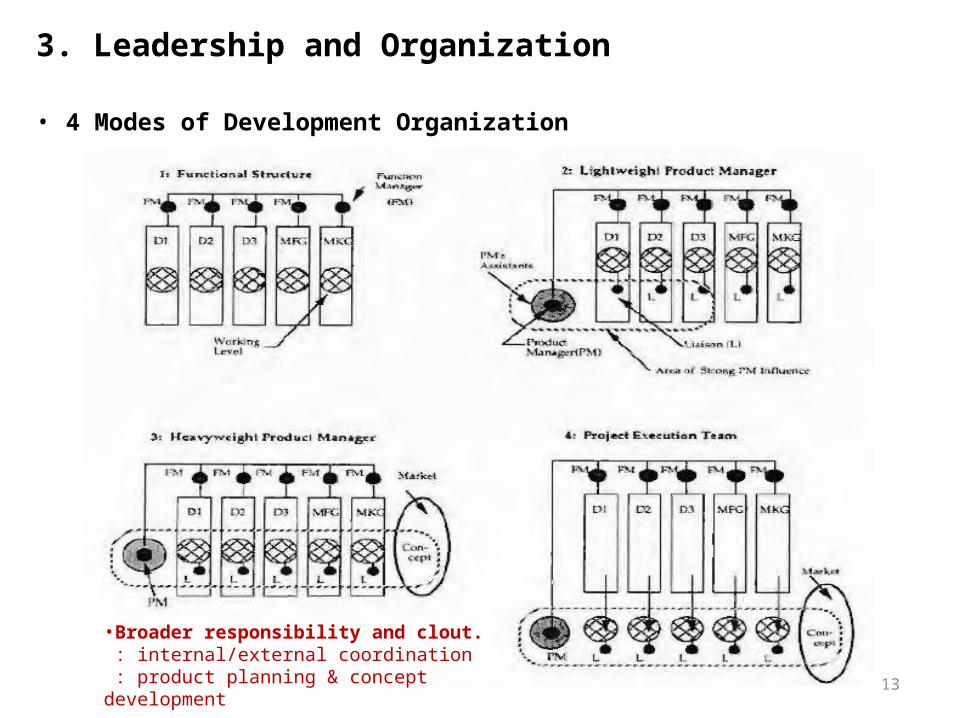
• 4 Modes of Development Organization
•Broader responsibility and clout. : internal/external coordination : product planning & concept develop-ment
14
3. Leadership and Organization
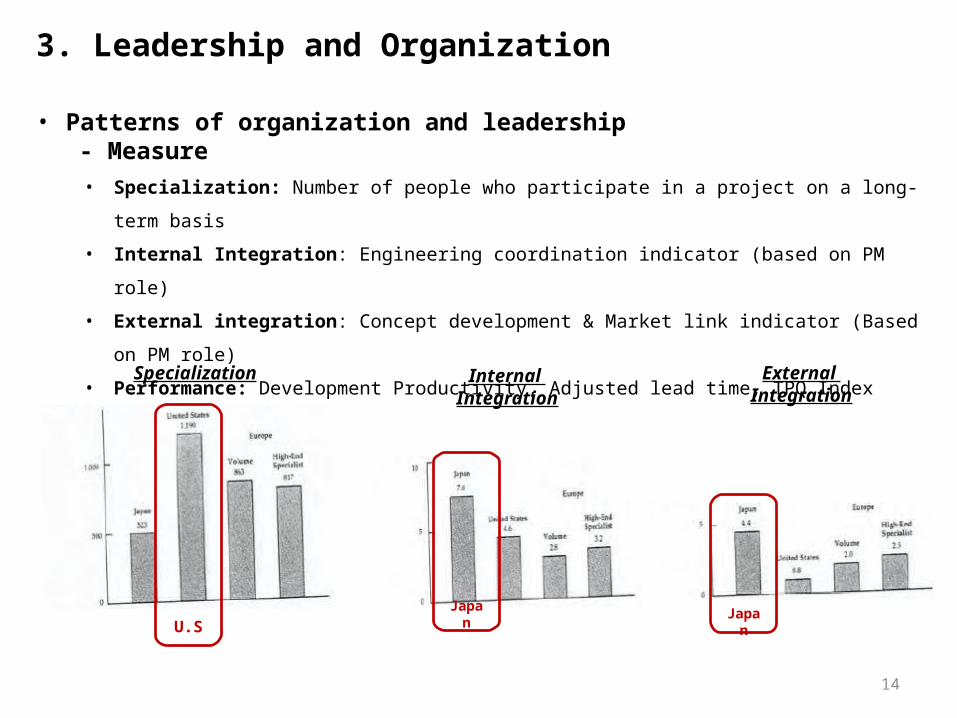
• Patterns of organization and leadership - Measure
• Specialization: Number of people who participate in a project on a long-term basis• Internal Integration: Engineering coordination indicator (based on PM role) • External integration: Concept development & Market link indicator (Based on PM
role)• Performance: Development Productivity, Adjusted lead time, TPQ Index
Internal Integration
Specialization External Integration
U.SJapa
n Japan
15
3. Leadership and Organization
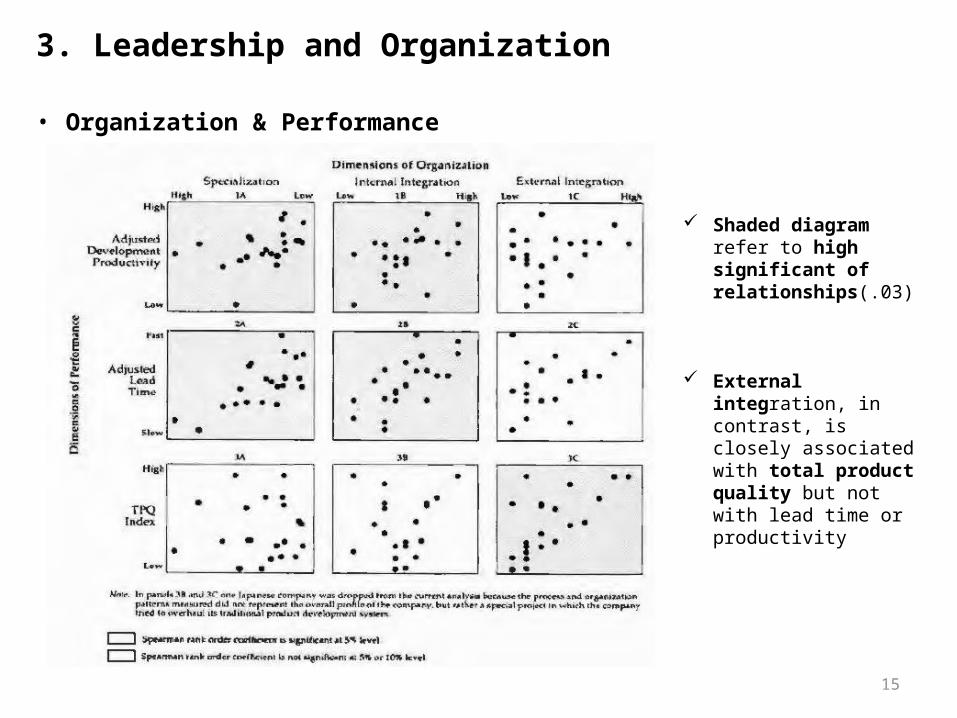
• Organization & Performance
Shaded diagram re-fer to high signifi-cant of relation-ships(.03)
External integra-tion, in contrast, is closely associated with total product quality but not with lead time or produc-tivity
16
3. Leadership and Organization
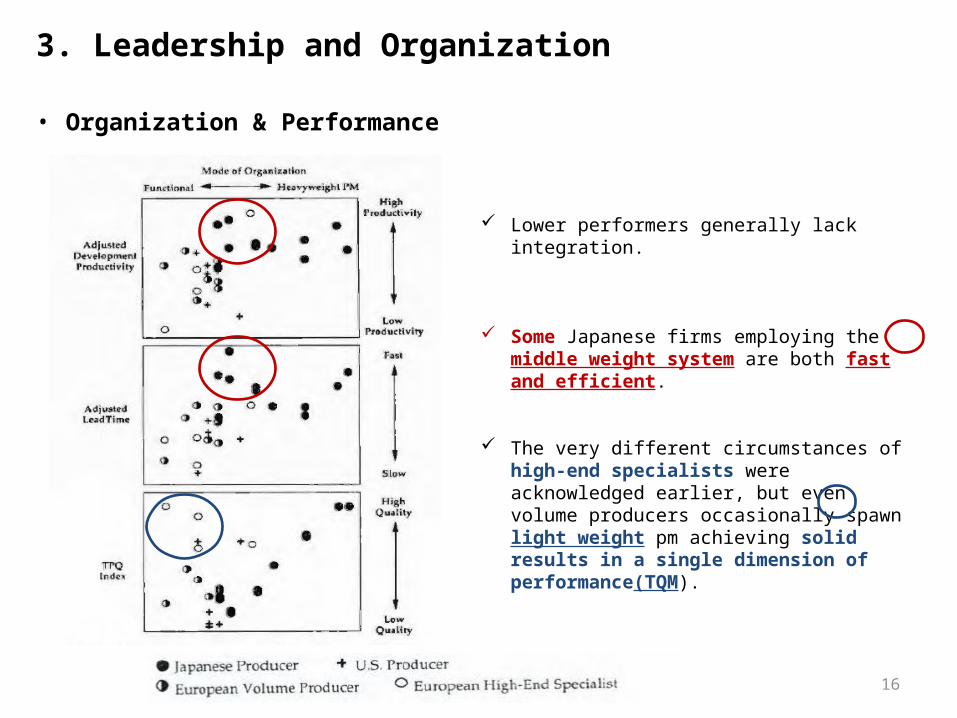
• Organization & Performance
Lower performers generally lack integra-tion.
Some Japanese firms employing the mid-dle weight system are both fast and ef -ficient.
The very different circumstances of high-end specialists were acknowledged ear-lier, but even volume producers occasion-ally spawn light weight pm achieving solid results in a single dimension of performance(TQM).
17
Discussion Questions
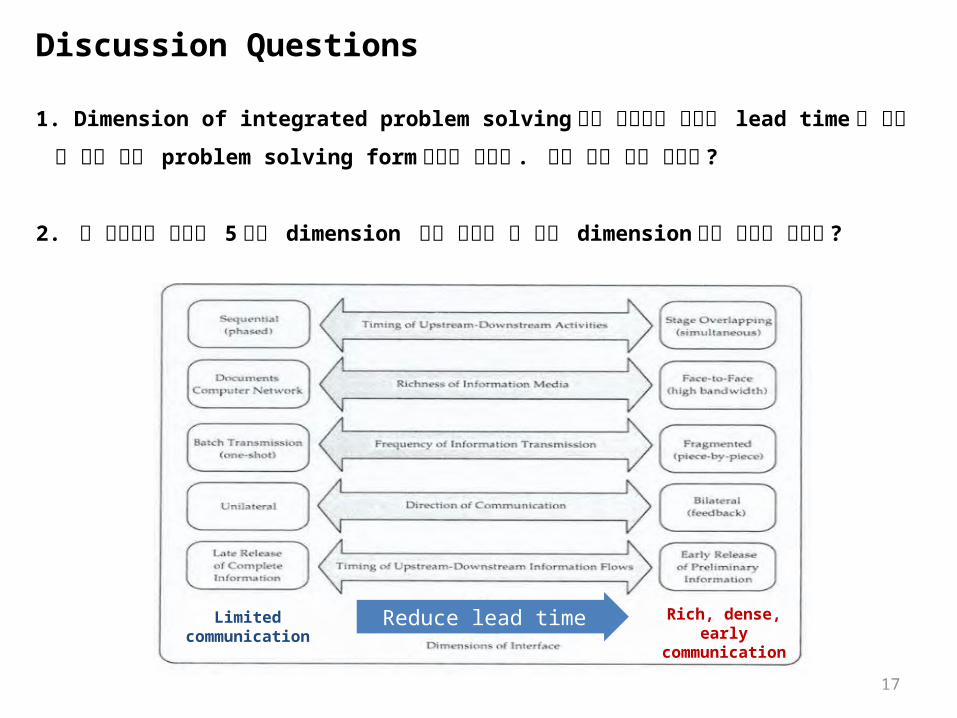
1. Dimension of integrated problem solving 에서 우측으로 갈수록 lead time 을 줄일 수 있는 좋은 problem solving form 이라고 하였다 . 이에 대한 반대 의견은 ?
2. 본 연구에서 제시한 5 가지 dimension 외에 추가할 수 있는 dimension 에는 무엇이 있을까 ?
Rich, dense, early communi-
cation
Limitedcommunication
Reduce lead time
18
Discussion Questions
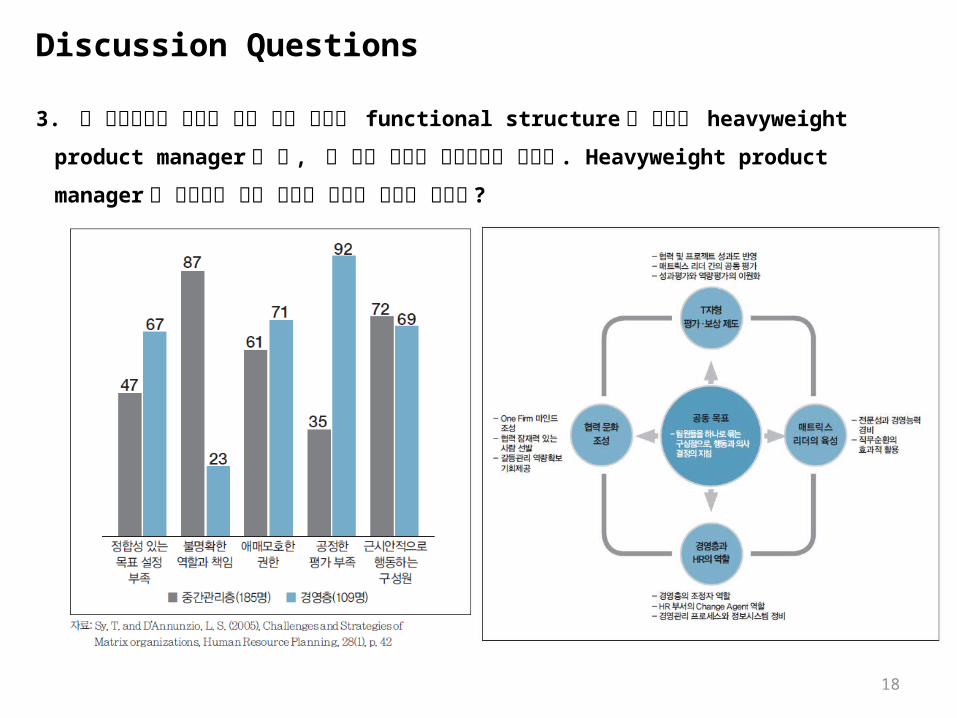
3. 본 연구에서는 신제품 개발 조직 구조가 functional structure 일 때보다 heavyweight product manager 일 때 , 더 좋은 성과를 가져온다고 하였다 . Heavyweight product manager 를 가져가는 조직 구조의 단점은 무엇이 있을까 ?
Developing product on “Internet Time”
: The Anatomy of a Flexible Development Process
Alan MacCormack Roberto Verganti
Marco Iansiti(2001)
20
1. Many literatures on the Effective Development process before this article
2. Previous authors have developed theoretical models which demon-strate the value of greater flexibility in a design process faced with uncertainty.
3. This study attempts to examine the underlying mechanisms through which firms directly influence the flexibility of their development processes
1. Research Objective
21
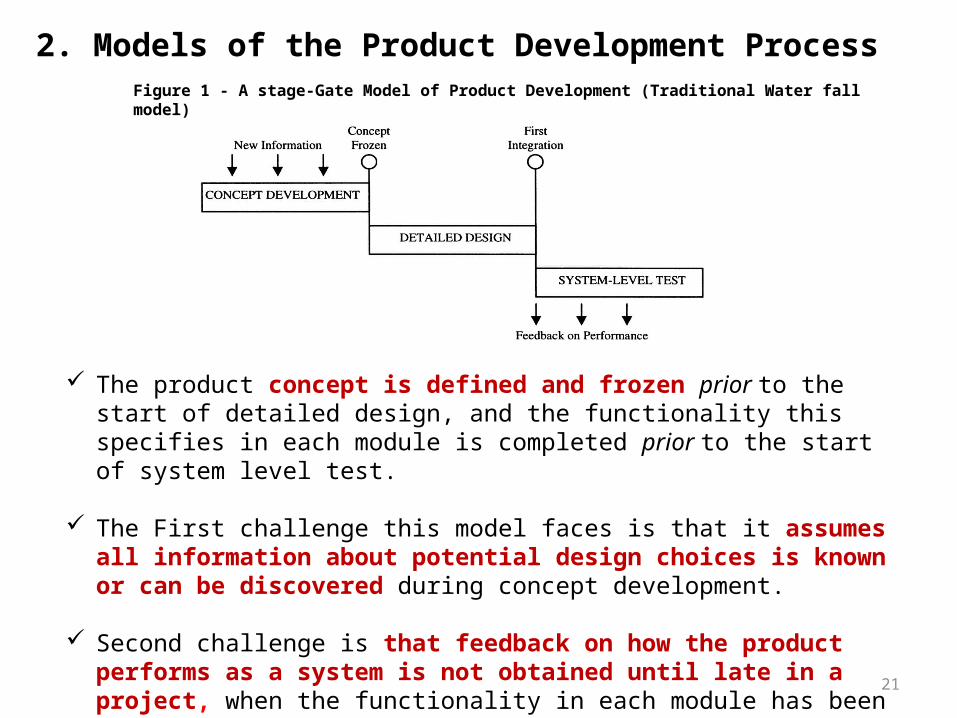
Figure 1 - A stage-Gate Model of Product Development (Traditional Water fall model)
The product concept is defined and frozen prior to the start of detailed design, and the functionality this specifies in each mod-ule is completed prior to the start of system level test.
The First challenge this model faces is that it assumes all in-formation about potential design choices is known or can be discovered during concept development.
Second challenge is that feedback on how the product per-forms as a system is not obtained until late in a project, when the functionality in each module has been fully developed
2. Models of the Product Development Process
22
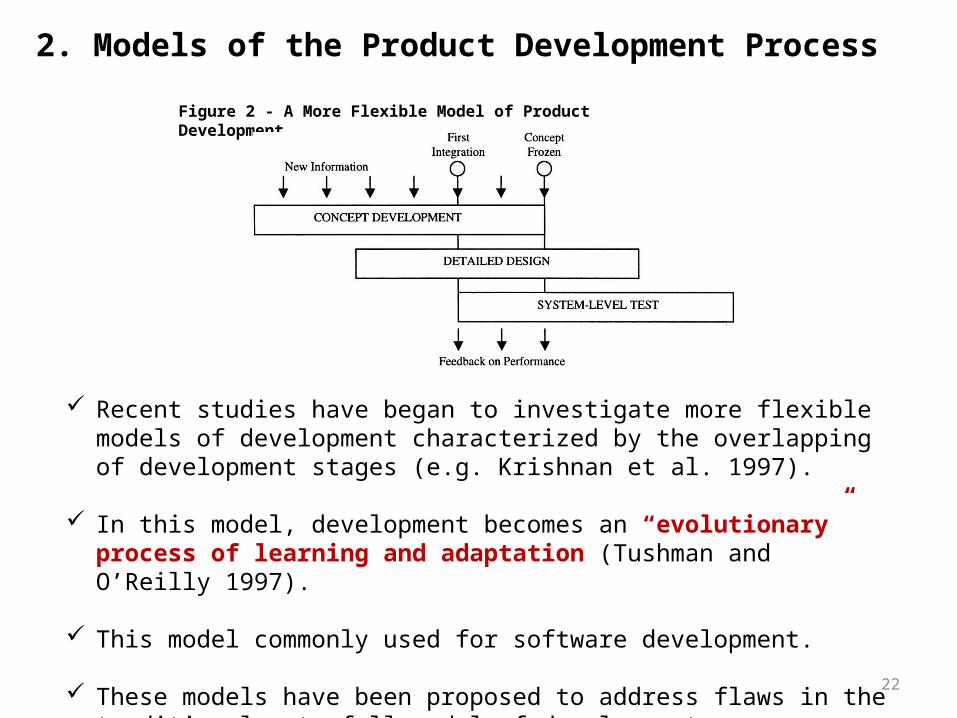
Recent studies have began to investigate more flexible models of development characterized by the overlapping of development stages (e.g. Krishnan et al. 1997).
In this model, development becomes an “evolutionary” process of learning and adaptation (Tushman and O’Reilly 1997).
This model commonly used for software development.
These models have been proposed to address flaws in the tradi-tional waterfall model of development.
Figure 2 - A More Flexible Model of Product Develop-ment
2. Models of the Product Development Process
23
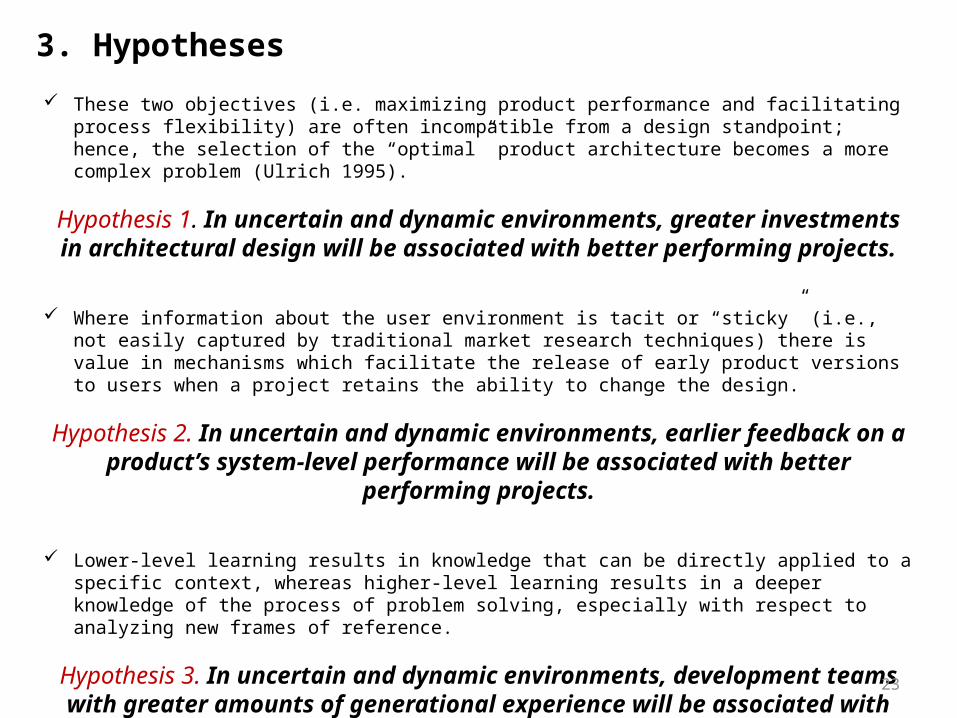
These two objectives (i.e. maximizing product performance and facilitating process flexi-bility) are often incompatible from a design standpoint; hence, the selection of the “op-timal” product architecture becomes a more complex problem (Ulrich 1995).
Hypothesis 1. In uncertain and dynamic environments, greater investments in architectural design will be associated with bet-
ter performing projects.
Where information about the user environment is tacit or “sticky” (i.e., not easily cap-tured by traditional market research techniques) there is value in mechanisms which fa-cilitate the release of early product versions to users when a project retains the ability to change the design.
Hypothesis 2. In uncertain and dynamic environments, earlier feedback on a product’s system-level performance will be asso-
ciated with better performing projects.
Lower-level learning results in knowledge that can be directly applied to a specific con-text, whereas higher-level learning results in a deeper knowledge of the process of prob-lem solving, especially with respect to analyzing new frames of reference.
Hypothesis 3. In uncertain and dynamic environments, develop-ment teams with greater amounts of generational experience
will be associated with better-performing projects.
3. Hypotheses
24
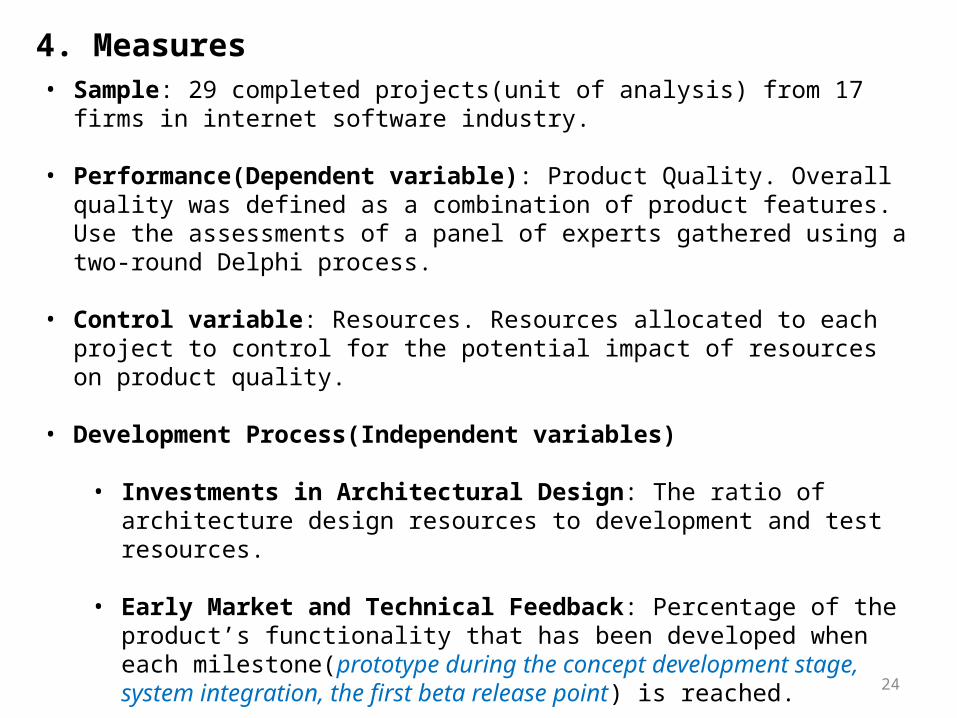
• Sample: 29 completed projects(unit of analysis) from 17 firms in in-ternet software industry.
• Performance(Dependent variable): Product Quality. Overall qual-ity was defined as a combination of product features. Use the as-sessments of a panel of experts gathered using a two-round Delphi process.
• Control variable: Resources. Resources allocated to each project to control for the potential impact of resources on product quality.
• Development Process(Independent variables)
• Investments in Architectural Design: The ratio of architec-ture design resources to development and test resources.
• Early Market and Technical Feedback: Percentage of the product’s functionality that has been developed when each mile-stone(prototype during the concept development stage, system integration, the first beta release point) is reached.
• Generational Experience: the proportion of team members with greater than two generations of experience.
4. Measures
25
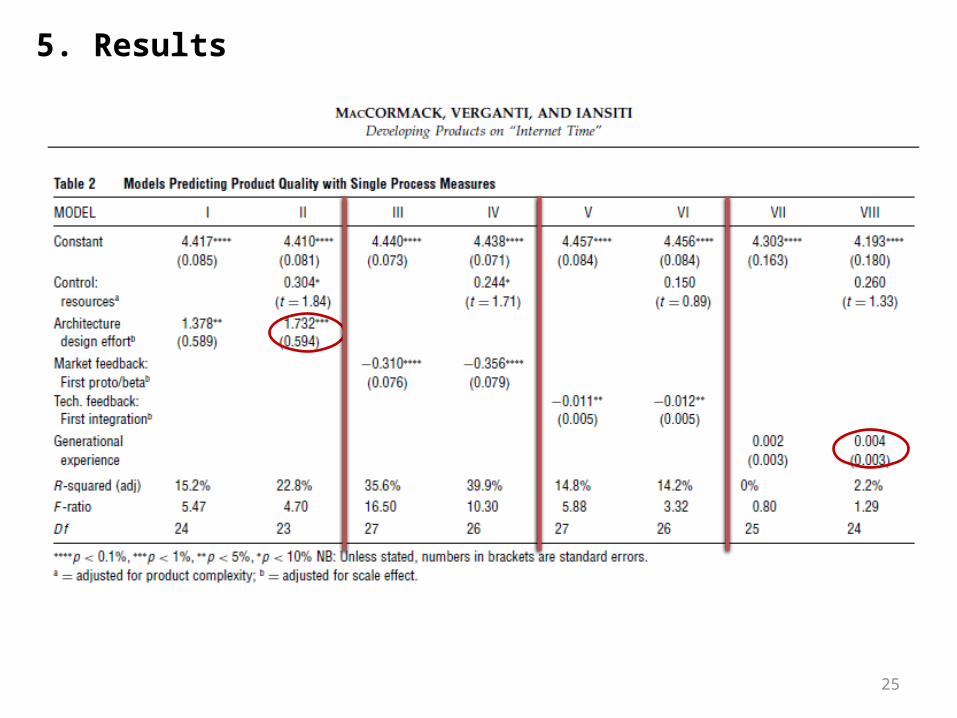
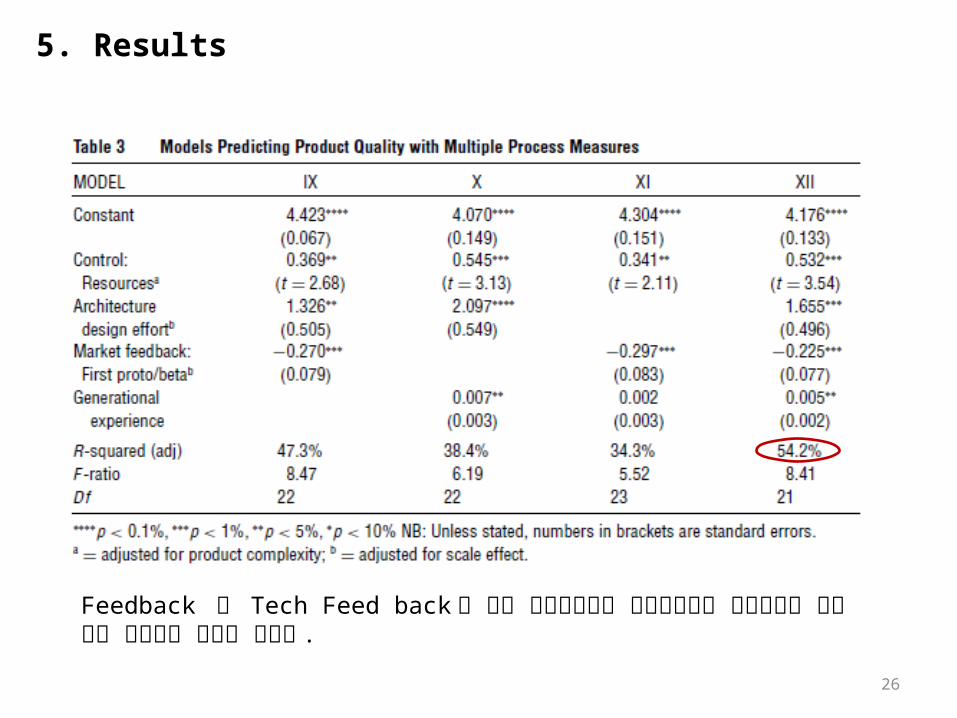
5. Results
26
Feedback 중 Tech Feed back 의 경우 프로토타입과 베타테스트와 상관관계가 높게 나와 제외하고 분석을 시행함 .
5. Results
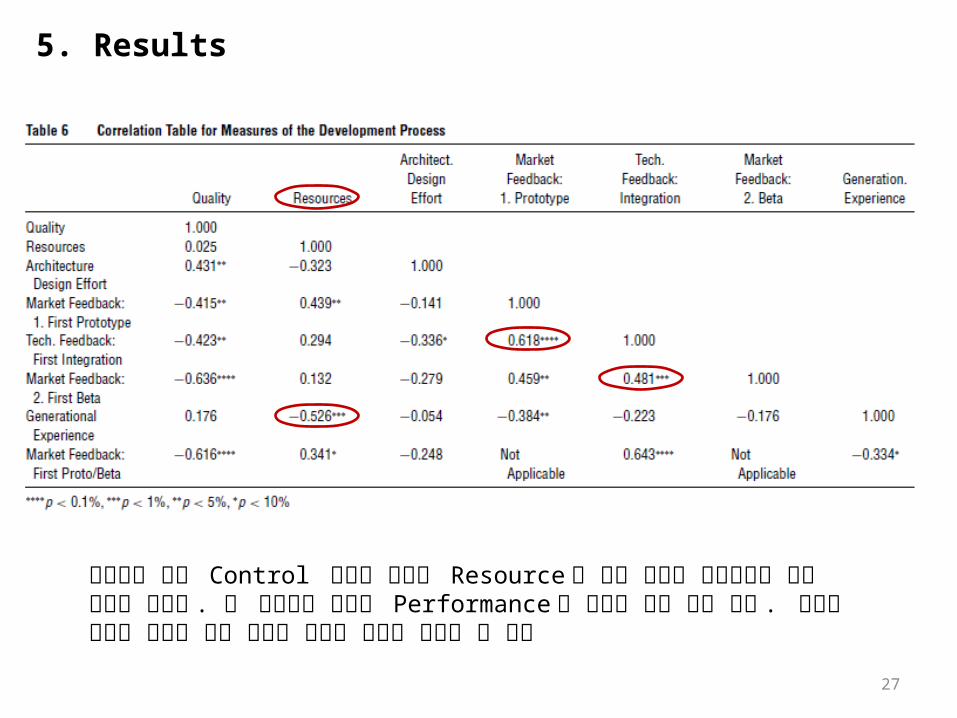
27
상관분석 결과 Control 변수로 사용한 Resource 와 경험 변수가 상관관계가 높은 것으로 나왔음 . 구성원의 경험이 Performance 에 영향이 없는 것이 아님 . 자원의 효율적 배분에 크게 영향을 끼치는 것으로 해석할 수 있음
5. Results
28
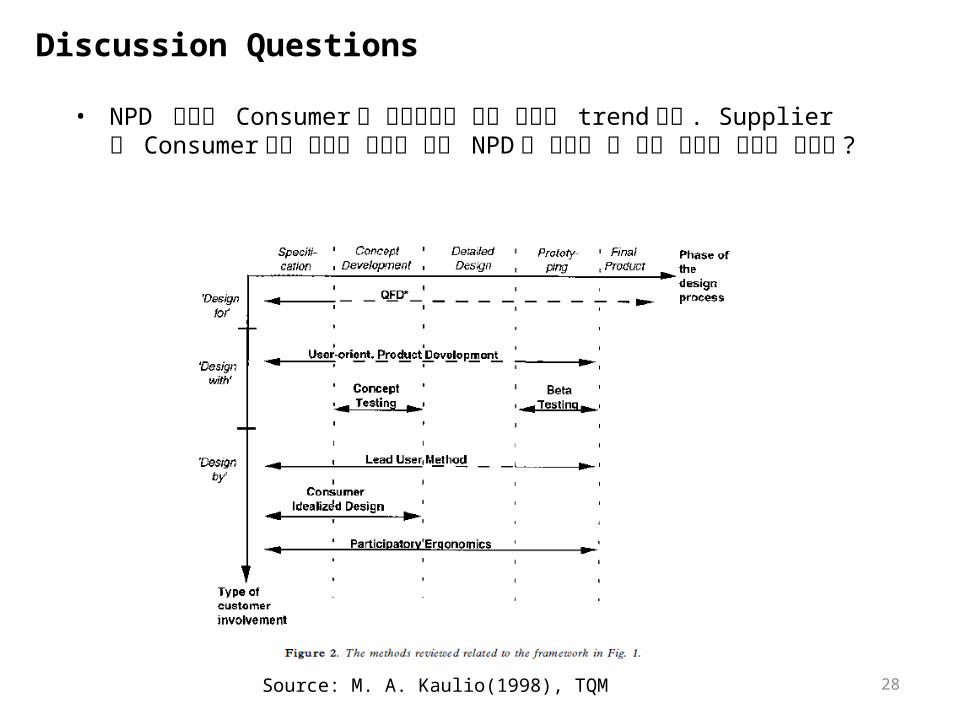
• NPD 과정에 Consumer 를 참여시키는 것이 오늘날 trend 이다 . Supplier 및 Consumer 와의 전략적 관계를 통한 NPD 가 가져올 수 있는 이득은 무엇이 있을까 ?
Source: M. A. Kaulio(1998), TQM
Discussion Questions
29
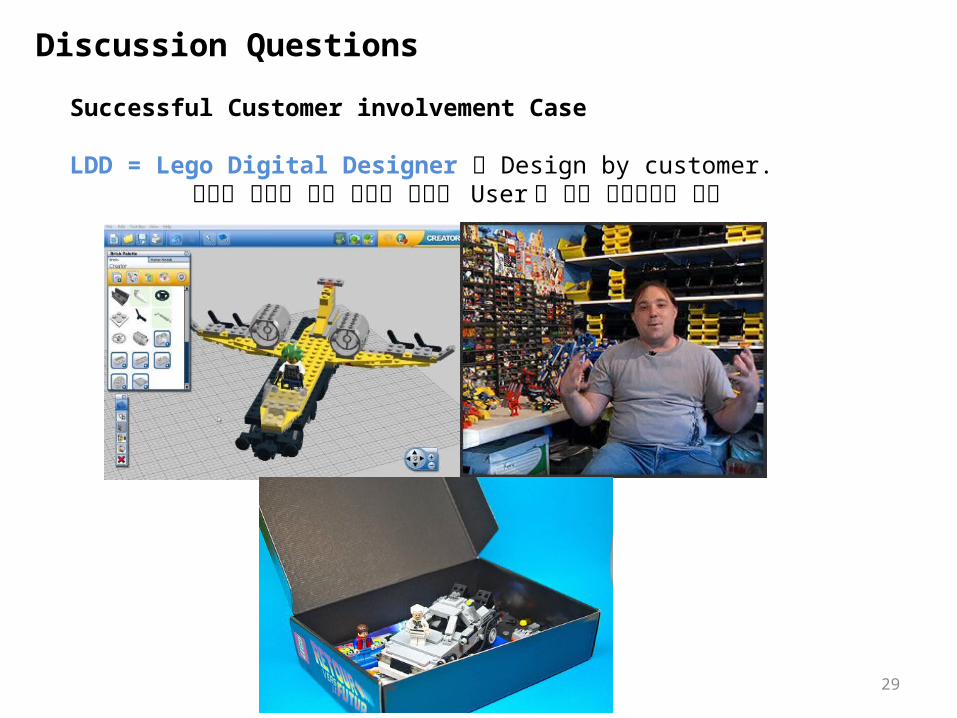
Successful Customer involvement Case
LDD = Lego Digital Designer Design by customer.신제품 개발의 혁신 동력을 다양한 User 로 부터 효율적으로 확보
Discussion Questions
Project Scope and Project Performance: The effect of parts strategy and supplier involve-
ment on product development
Kim B. Clark(1989)
31
– The importance of product development has motivated signifi-cant attention to the determinants of performance by both practitioners and academics.
– This study examines one aspect of project strategy, project scope and its effect on project performance(Lead time and project manhour).
1. Introduction
32
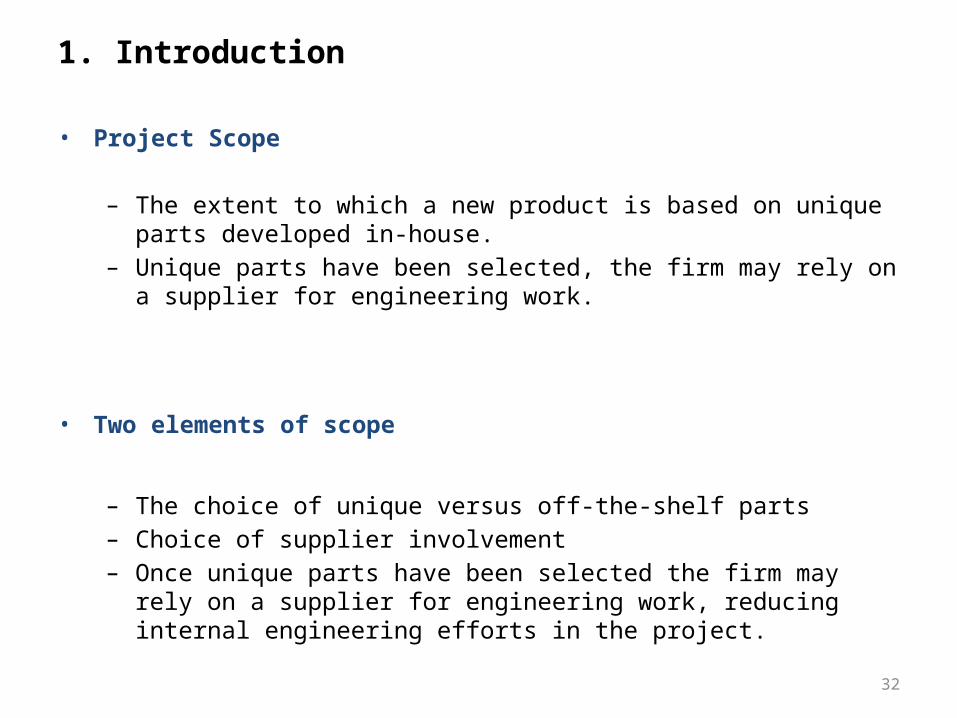
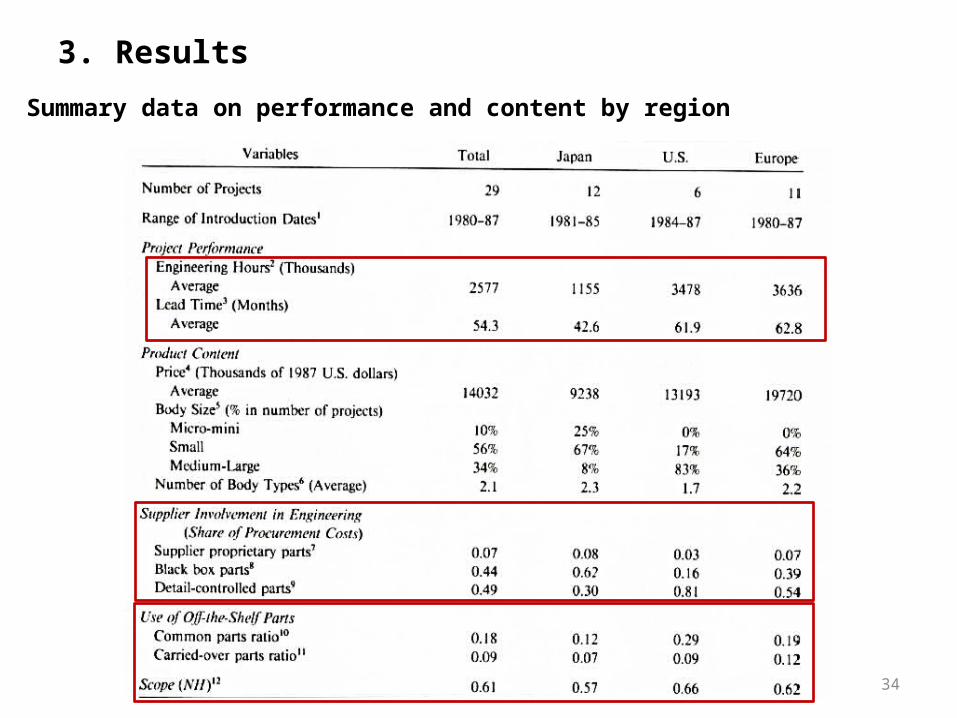
• Project Scope
– The extent to which a new product is based on unique parts developed in-house.
– Unique parts have been selected, the firm may rely on a sup-plier for engineering work.
• Two elements of scope
– The choice of unique versus off-the-shelf parts– Choice of supplier involvement– Once unique parts have been selected the firm may rely on a
supplier for engineering work, reducing internal engineering ef -forts in the project.
1. Introduction
33
2. Measure
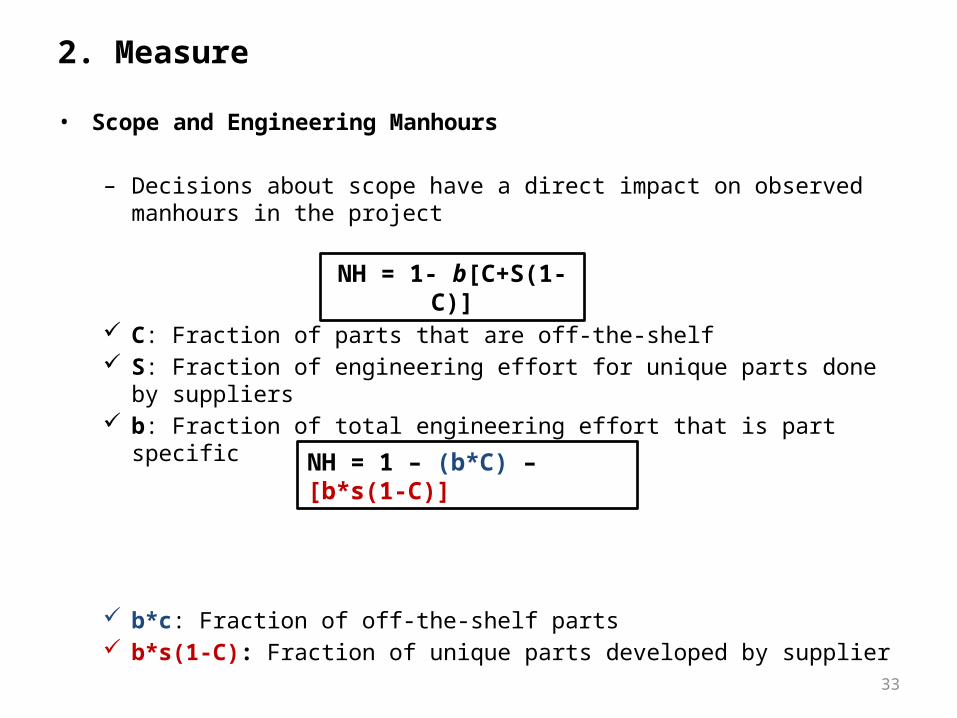
• Scope and Engineering Manhours
– Decisions about scope have a direct impact on observed man-hours in the project
C: Fraction of parts that are off-the-shelf S: Fraction of engineering effort for unique parts done by sup-
pliers b: Fraction of total engineering effort that is part specific
b*c: Fraction of off-the-shelf parts b*s(1-C): Fraction of unique parts developed by supplier
NH = 1- b[C+S(1-C)]
NH = 1 – (b*C) – [b*s(1-C)]
34
3. ResultsSummary data on performance and content by region
35
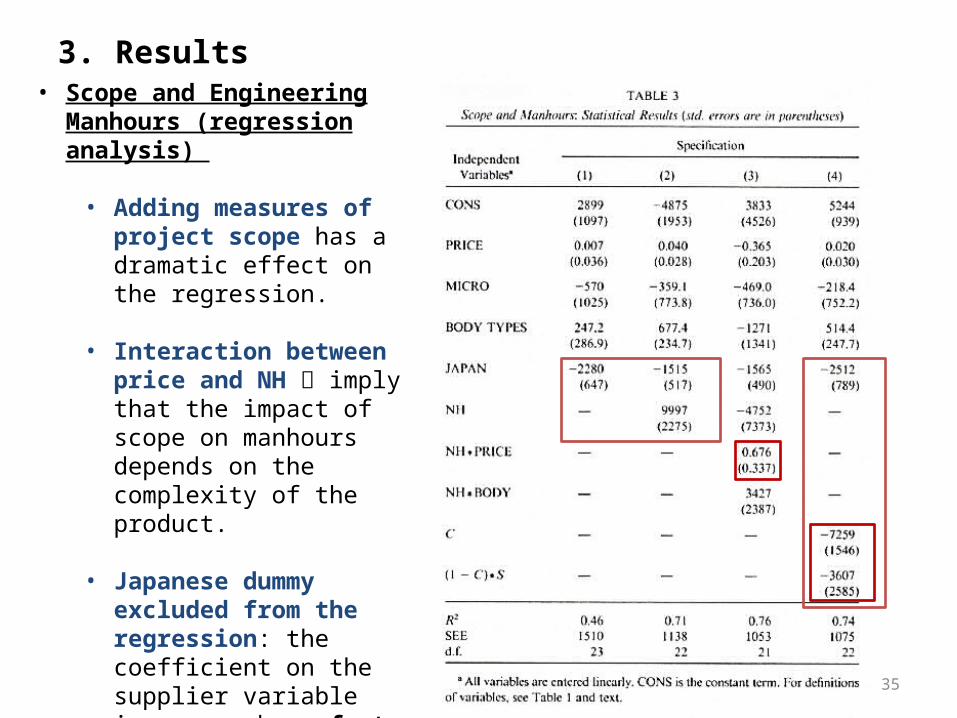
• Scope and Engineering Manhours (regression analysis)
• Adding measures of project scope has a dramatic effect on the regression.
• Interaction between price and NH imply that the impact of scope on manhours depends on the complexity of the product.
• Japanese dummy excluded from the regression: the coefficient on the supplier variable increases by a factor of 2.7 quality of the relationship and the way that it is managed is important.
3. Results
36
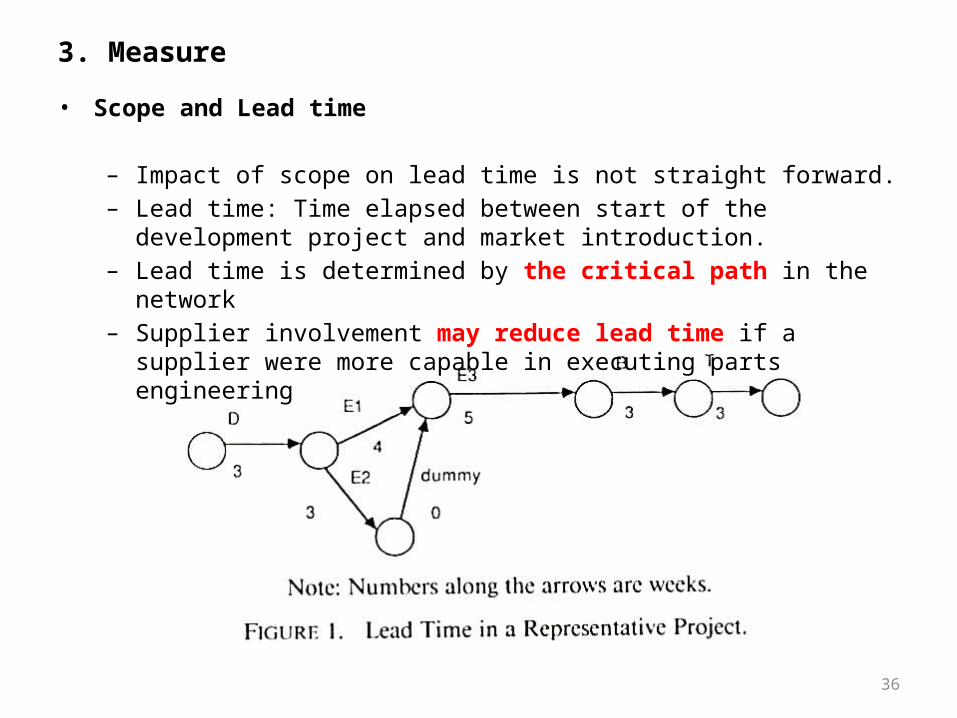
• Scope and Lead time
– Impact of scope on lead time is not straight forward.– Lead time: Time elapsed between start of the development
project and market introduction.– Lead time is determined by the critical path in the network– Supplier involvement may reduce lead time if a supplier
were more capable in executing parts engineering
3. Measure
37
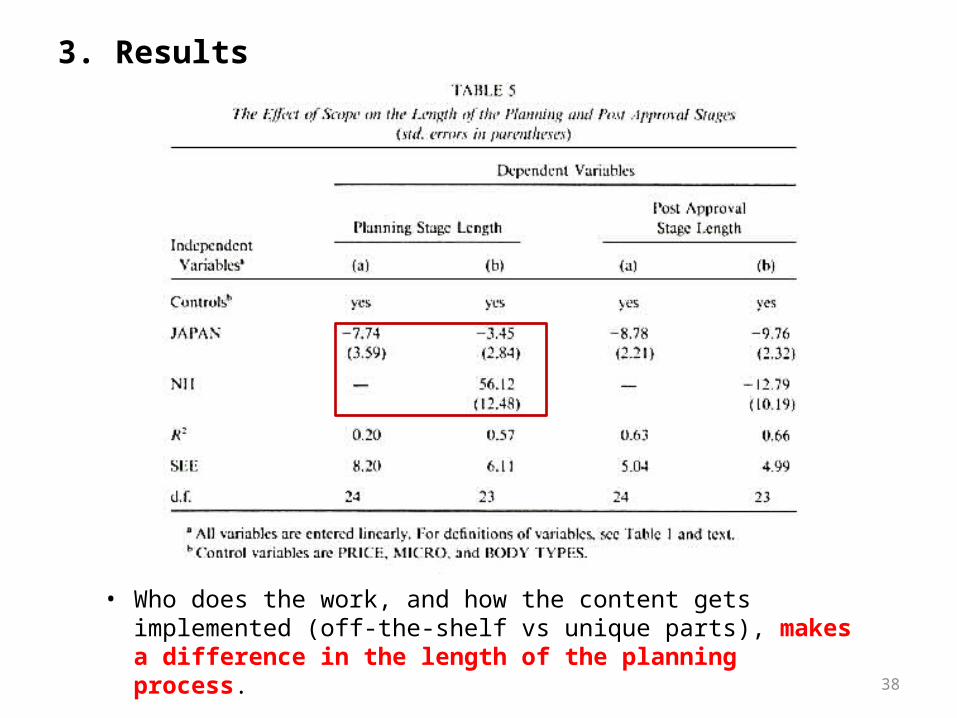
3. Results
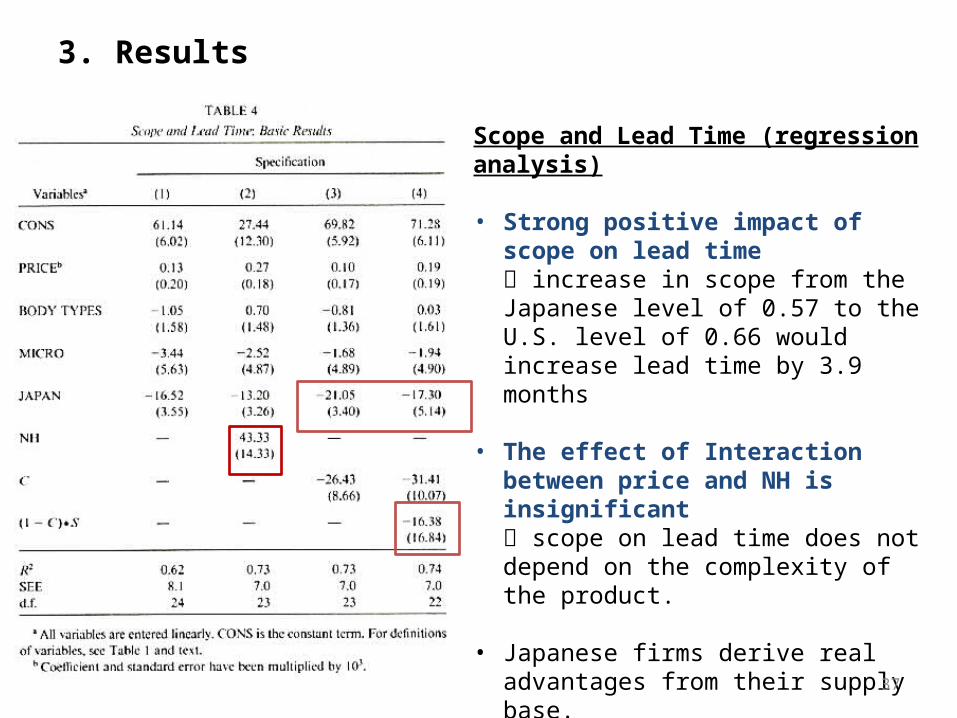
Scope and Lead Time (regression analysis)
• Strong positive impact of scope on lead time increase in scope from the Japanese level of 0.57 to the U.S. level of 0.66 would increase lead time by 3.9 months
• The effect of Interaction between price and NH is insignificant scope on lead time does not depend on the complexity of the product.
• Japanese firms derive real advantages from their supply base.
38
• Who does the work, and how the content gets implemented (off-the-shelf vs unique parts), makes a difference in the length of the planning process.
3. Results
39
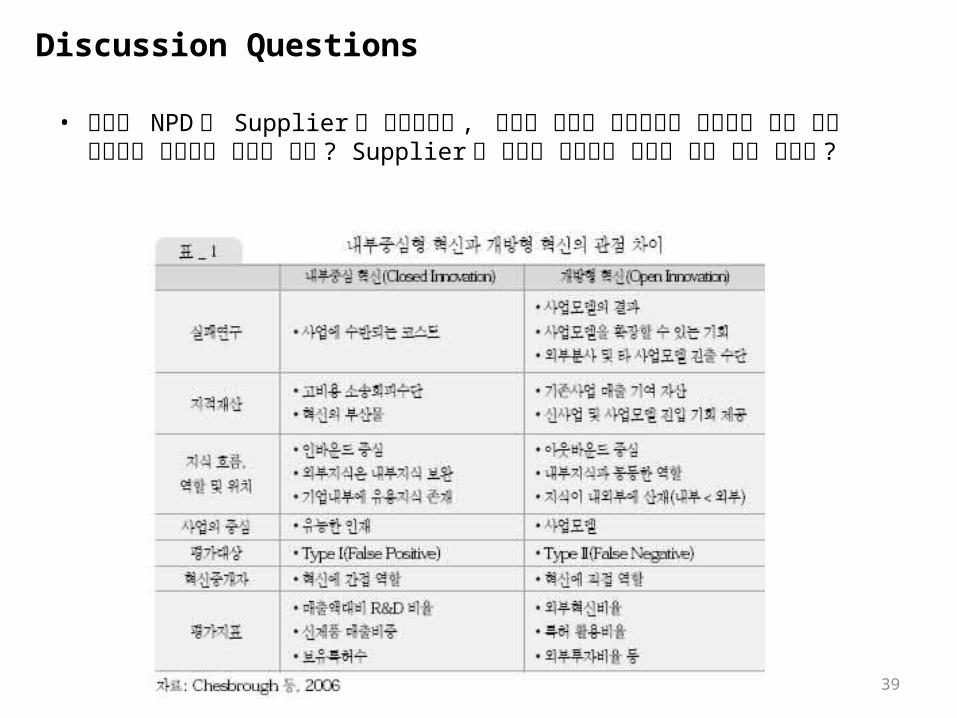
• 기업이 NPD 에 Supplier 를 참여시키고 , 이들의 역량을 적극적으로 활용하는 것이 항상 긍정적인 영향만을 가져다 줄까 ? Supplier 의 참여로 발생하는 문제는 어떤 것이 있을까 ?
Discussion Questions
40
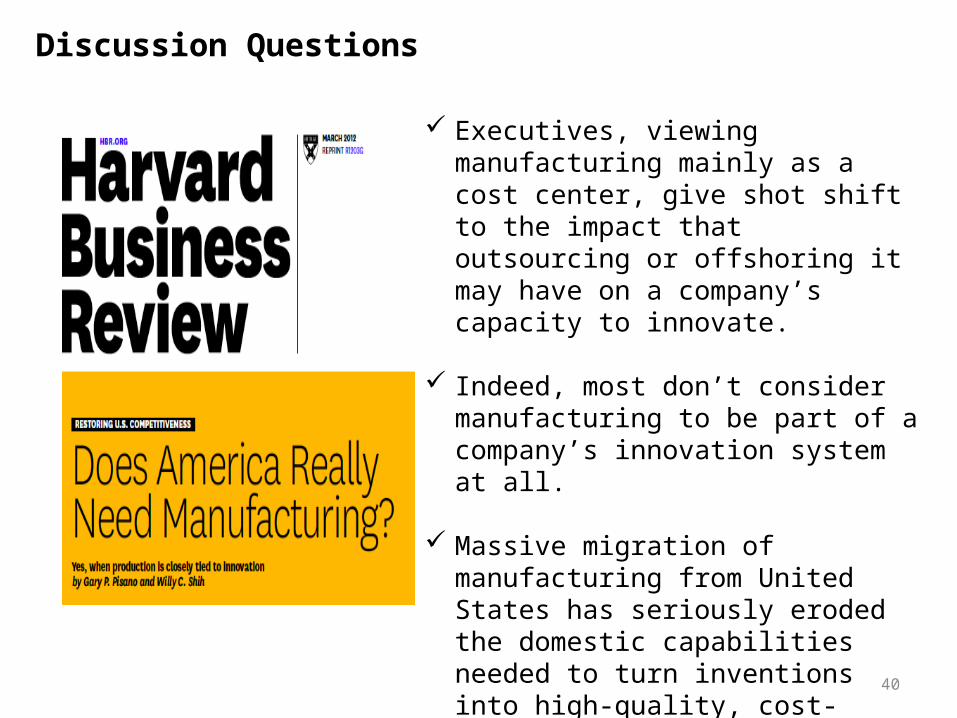
Executives, viewing manufacturing mainly as a cost center, give shot shift to the impact that outsourc-ing or offshoring it may have on a company’s capacity to innovate.
Indeed, most don’t consider manu-facturing to be part of a com-pany’s innovation system at all.
Massive migration of manufactur-ing from United States has seri-ously eroded the domestic capabil-ities needed to turn inventions into high-quality, cost-competitive products, damaging America’s ability to retain a lead in many sectors.
Discussion Questions
41
42
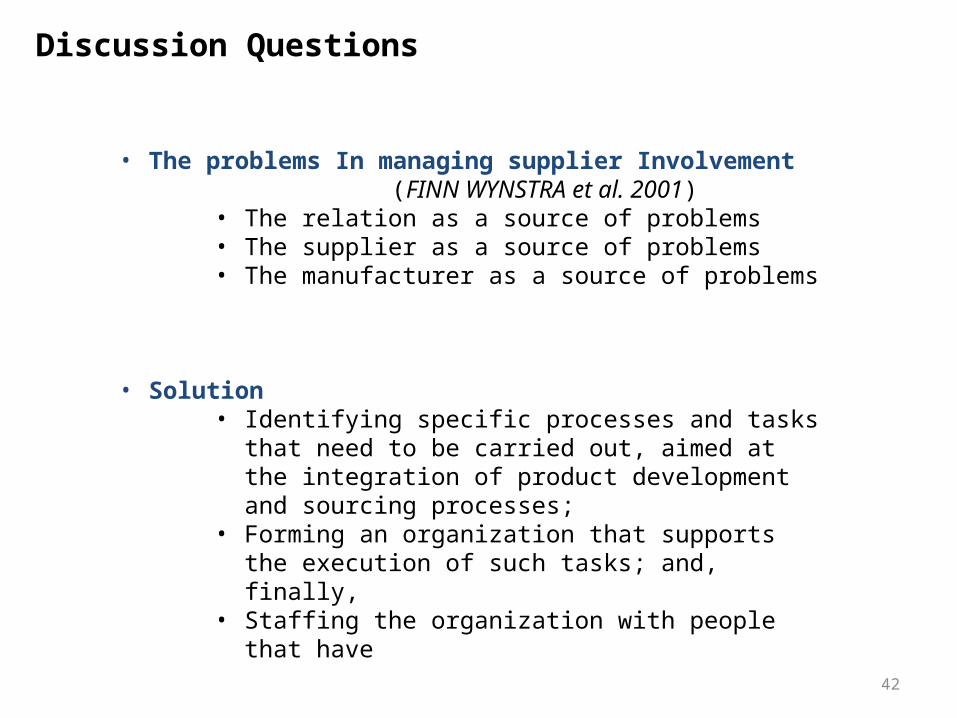
• The problems In managing supplier Involvement (FINN WYNSTRA et al. 2001)
• The relation as a source of problems• The supplier as a source of problems• The manufacturer as a source of problems
• Solution• Identifying specific processes and tasks that
need to be carried out, aimed at the integration of product development and sourcing processes;
• Forming an organization that supports the exe-cution of such tasks; and, finally,
• Staffing the organization with people that have
Discussion Questions
Accelerating Adaptive Processes: Product Innovation in the Global
Computer Industry
Kathleen M. Eisenhardt Behnam N. Tabrizi(1995)
44
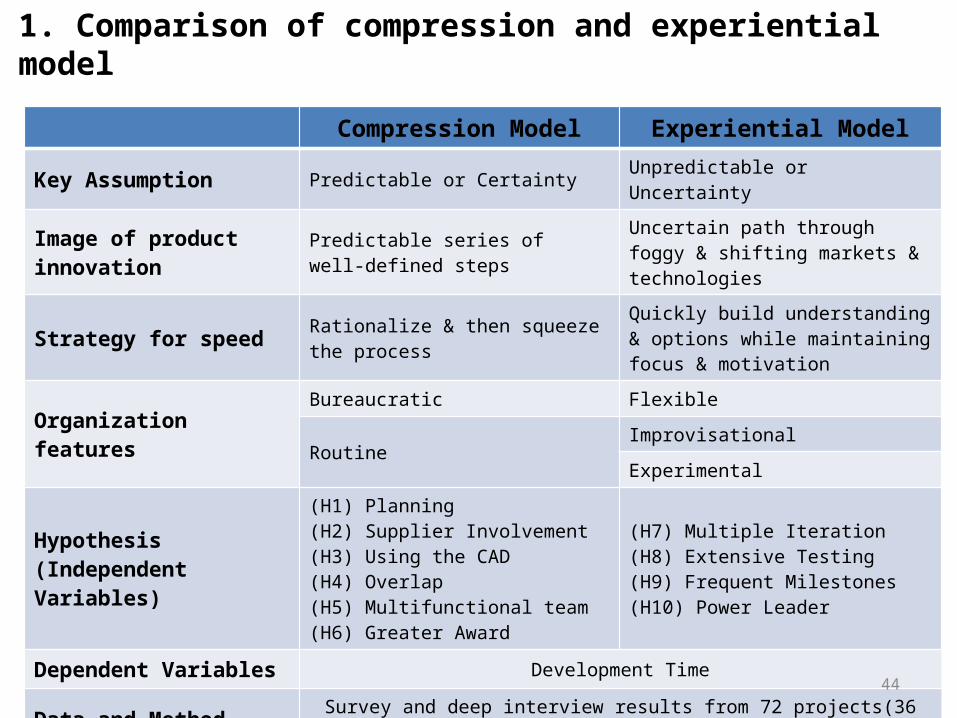
1. Comparison of compression and experiential model
Compression Model Experiential ModelKey Assumption Predictable or Certainty Unpredictable or UncertaintyImage of product innovation
Predictable series of well-defined steps
Uncertain path through foggy & shifting markets & technologies
Strategy for speed Rationalize & then squeeze the process
Quickly build understanding & options while maintaining focus & motivation
Organization features
Bureaucratic Flexible
RoutineImprovisationalExperimental
Hypothesis(Independent Variables)
(H1) Planning(H2) Supplier Involvement(H3) Using the CAD(H4) Overlap(H5) Multifunctional team(H6) Greater Award
(H7) Multiple Iteration(H8) Extensive Testing(H9) Frequent Milestones(H10) Power Leader
Dependent Variables Development Time
Data and Method Survey and deep interview results from 72 projects(36 Computer Companies)
45
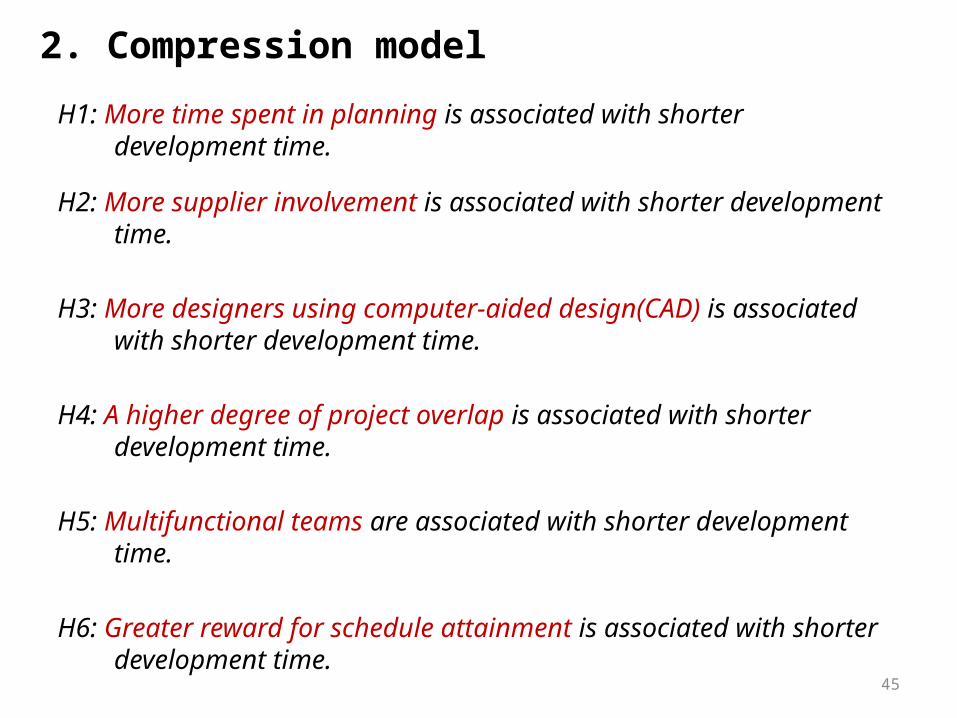
H1: More time spent in planning is associated with shorter development time.
H2: More supplier involvement is associated with shorter development time.
H3: More designers using computer-aided design(CAD) is associated with shorter development time.
H4: A higher degree of project overlap is associated with shorter development time.
H5: Multifunctional teams are associated with shorter development time.
H6: Greater reward for schedule attainment is associated with shorter development time.
2. Compression model
46
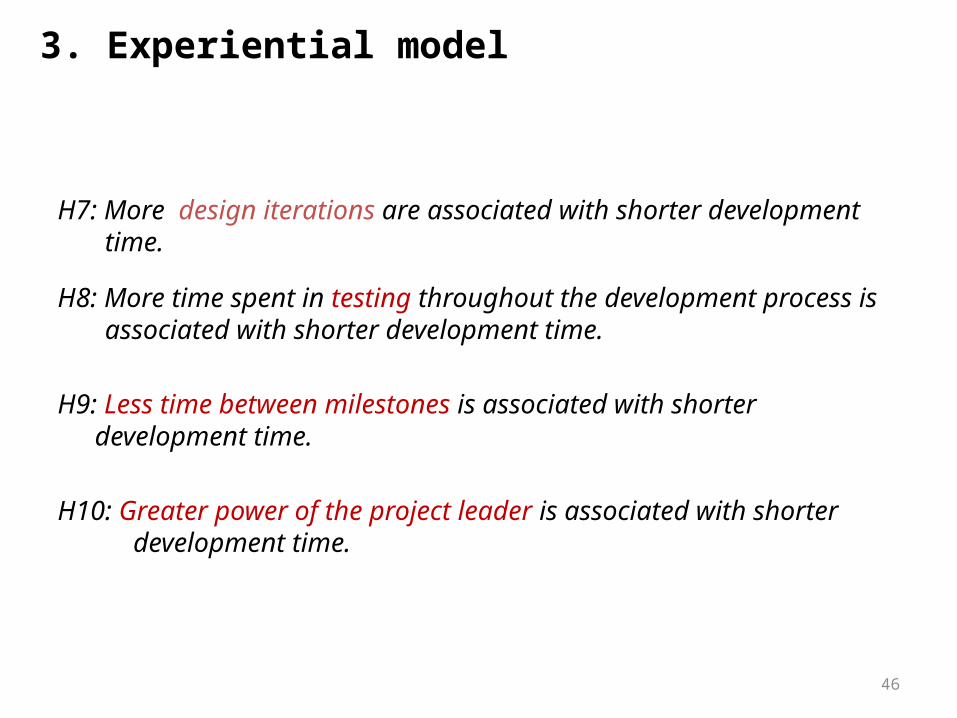
H7: More design iterations are associated with shorter development time.
H8: More time spent in testing throughout the development process is associated with shorter development time.
H9: Less time between milestones is associated with shorter development time.
H10: Greater power of the project leader is associated with shorter development time.
3. Experiential model
47
4. Methods
- Data from 72 product development projects drawn from European, Asian, and U.S. computer firms.
- Computer companies that compete in the personal computer(PC), minicomputer, mainframe, and peripherals segments of the industry.
- Unit of analysis: product development project
- Within each company, two product development projects within a single product group were used.
48
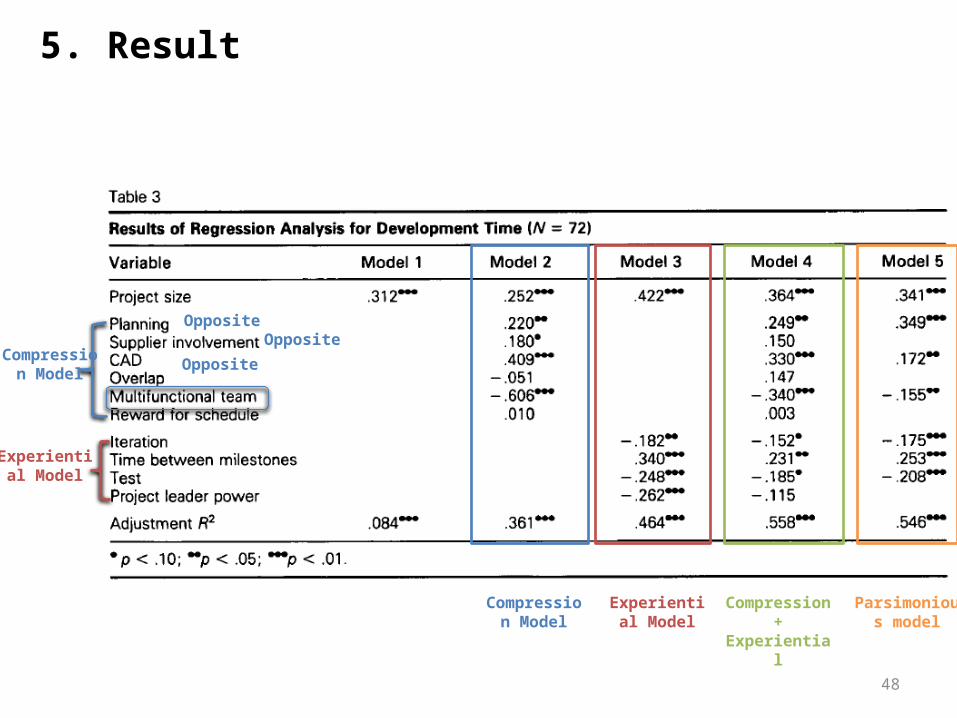
Experien-tial Model
Compres-sion Model
Compression Model
Experiential Model
Compression +
Experiential
Parsimonious model
Oppo-site Oppo-
siteOppo-site
5. Result
49
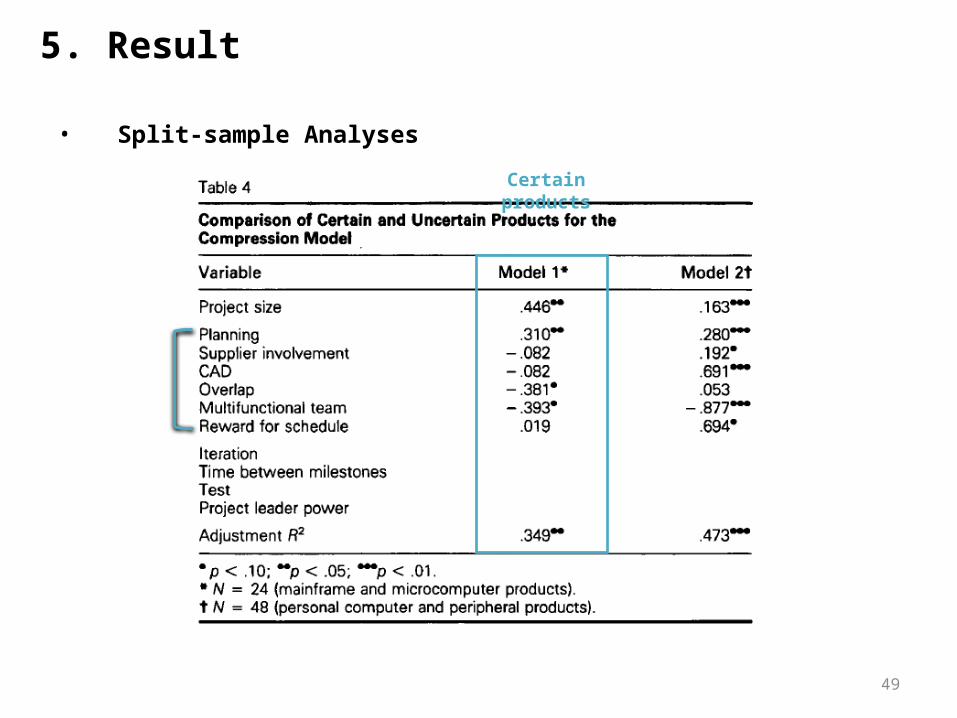
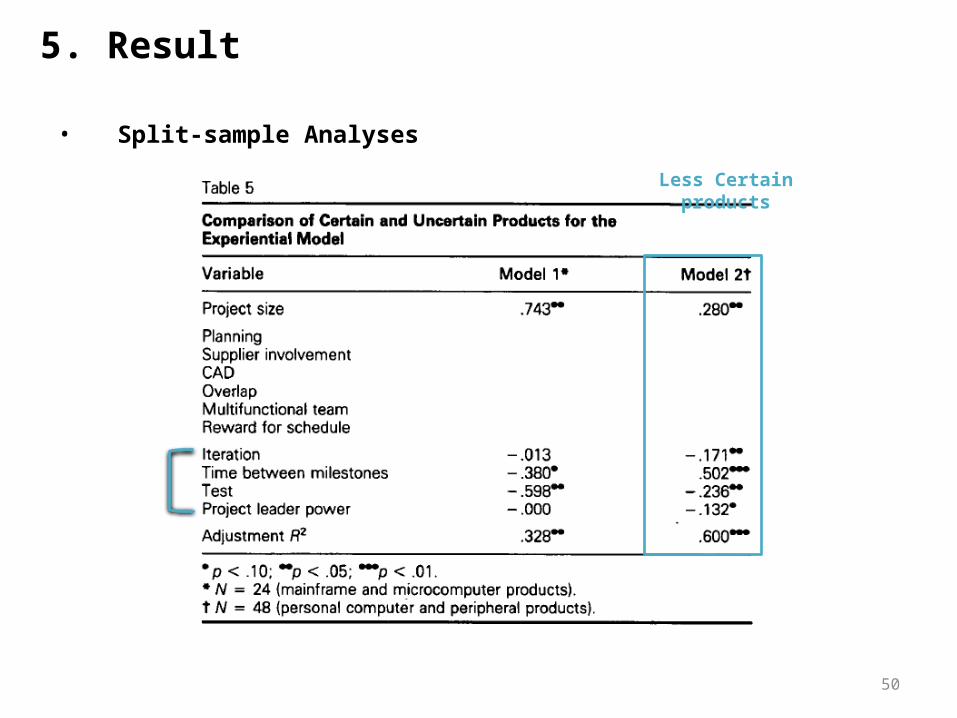
• Split-sample AnalysesCertain prod-
ucts
5. Result
50
Less Certain prod-ucts
5. Result
• Split-sample Analyses
51
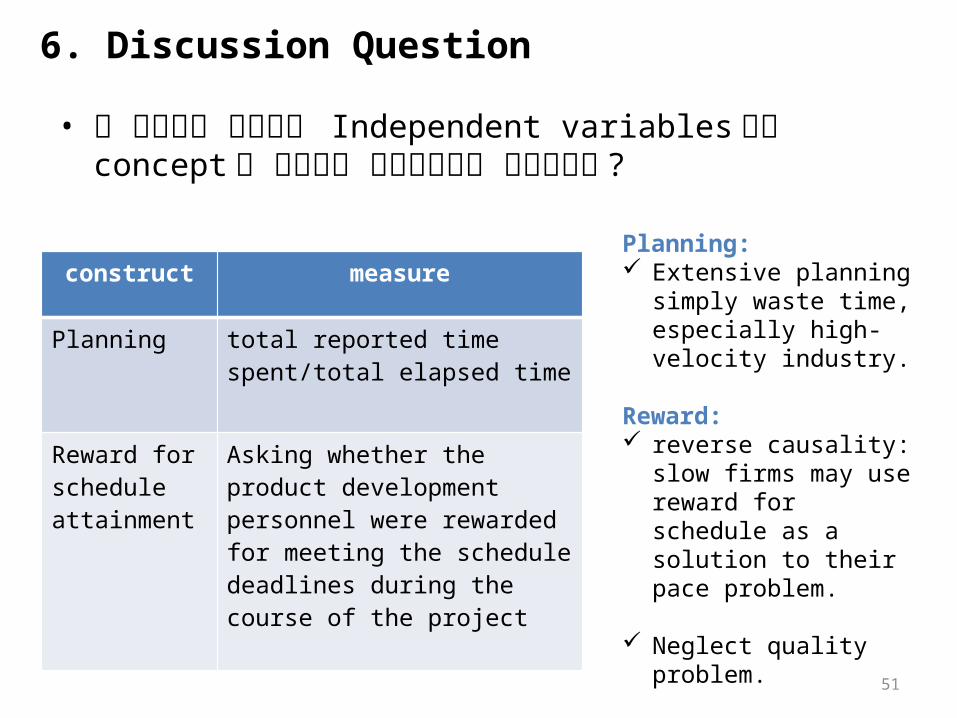
• 본 연구에서 제시되는 Independent variables 들의 concept 이 올바르게 측정되었다고 생각하는가 ?
construct measure
Planning total reported time spent/total elapsed time
Reward for schedule attainment
Asking whether the product development personnel were rewarded for meeting the schedule deadlines during the course of the project
Planning: Extensive planning
simply waste time, especially high-velocity industry.
Reward: reverse causality:
slow firms may use reward for schedule as a solution to their pace problem.
Neglect quality problem.
6. Discussion Question
52
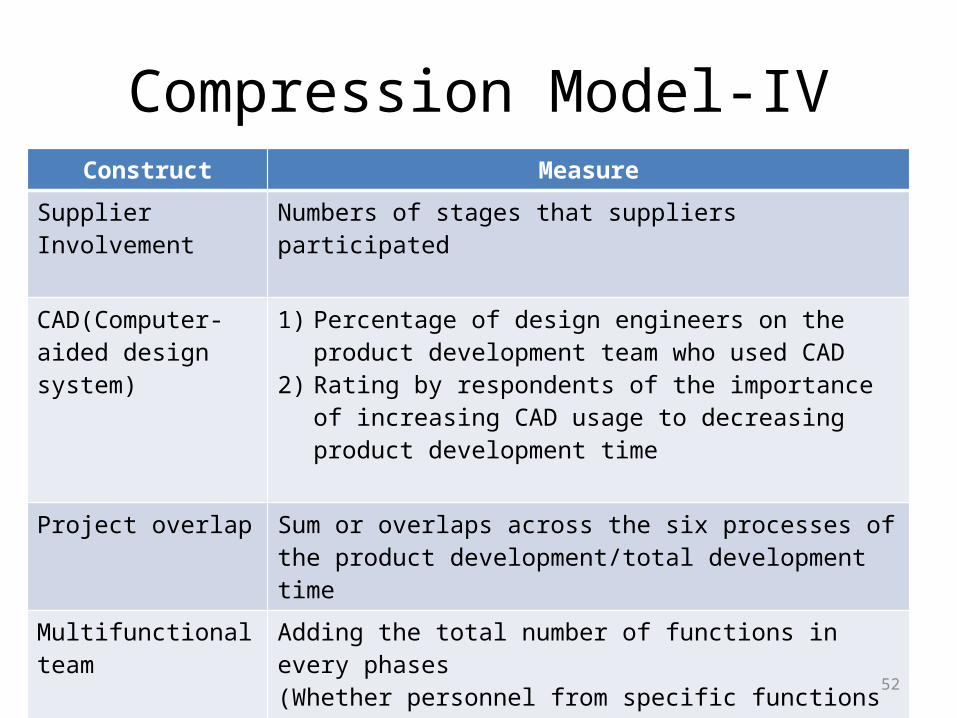
Compression Model-IVConstruct Measure
Supplier Involvement
Numbers of stages that suppliers participated
CAD(Computer-aided design system)
1) Percentage of design engineers on the product development team who used CAD
2) Rating by respondents of the importance of increasing CAD usage to decreasing product development time
Project overlap Sum or overlaps across the six processes of the product development/total development time
Multifunctional team
Adding the total number of functions in every phases(Whether personnel from specific functions were involved on the product development team during the various stages of product development)
53
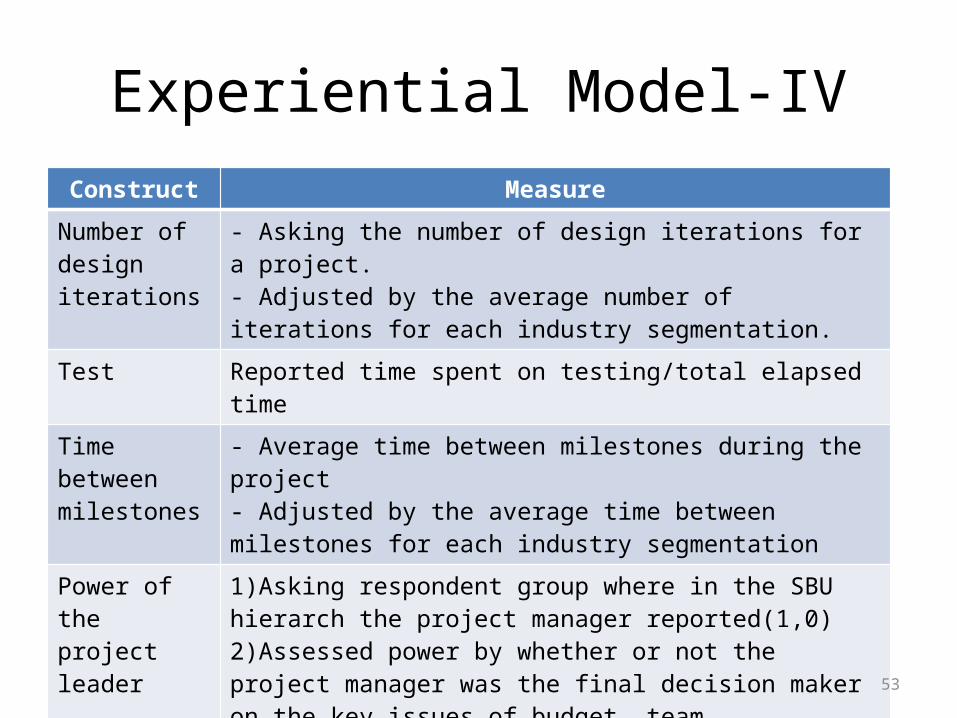
Experiential Model-IVConstruct Measure
Number of design iterations
- Asking the number of design iterations for a project.- Adjusted by the average number of iterations for each industry segmentation.
Test Reported time spent on testing/total elapsed timeTime between milestones
- Average time between milestones during the project- Adjusted by the average time between milestones for each industry segmentation
Power of the project leader
1)Asking respondent group where in the SBU hierarch the project manager reported(1,0)2)Assessed power by whether or not the project manager was the final decision maker on the key issues of budget, team composition, and project timetable.
54
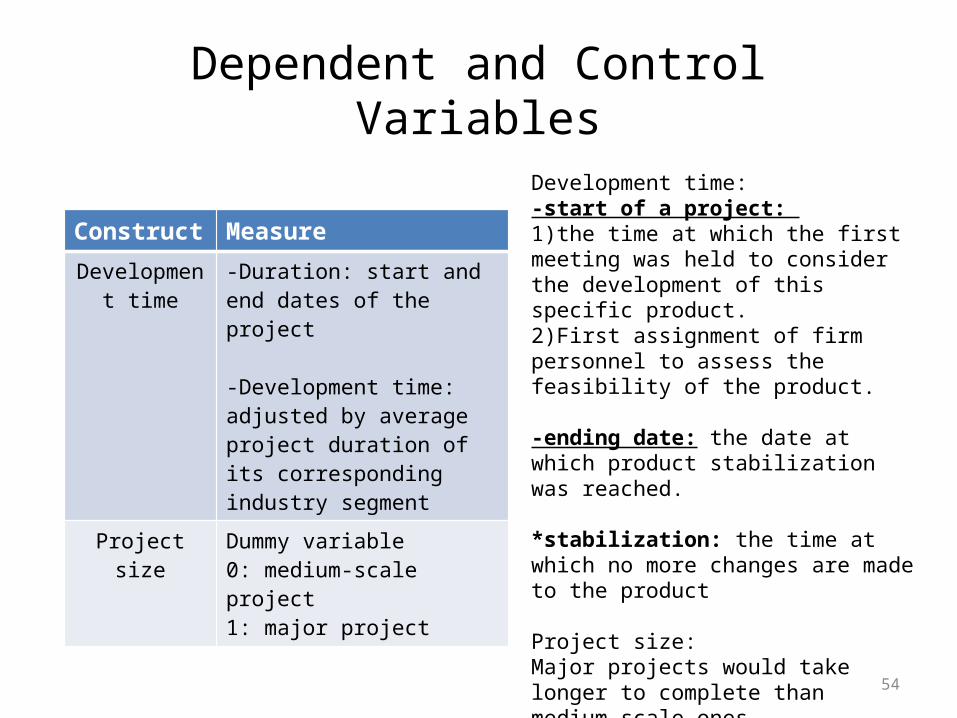
Dependent and Control Variables
Construct MeasureDevelop-
ment time-Duration: start and end dates of the project
-Development time: ad-justed by average project duration of its corre-sponding industry seg-ment
Project size Dummy variable0: medium-scale project1: major project
Development time: -start of a project: 1)the time at which the first meeting was held to consider the development of this specific product.2)First assignment of firm personnel to assess the feasibility of the product.
-ending date: the date at which product stabilization was reached.
*stabilization: the time at which no more changes are made to the product
Project size:Major projects would take longer to complete than medium-scale ones.
55
• 본 연구의 실증분석 방법에 대해 어떻게 생각하는가 ?
Compression/Experiential strategy’s assumption: industry, product characteristics, degree of maturity
6. Discussion Question

56
• 본 연구에서 밝혀낸 IV(multifunctional team, multiple iterations, extensive testing, frequent milestones, powerful leader) 들이 제품개발시간을 줄이는 것을 방해하는 요소에는 어떤 것들이 있을까 ?
6. Discussion Question
57
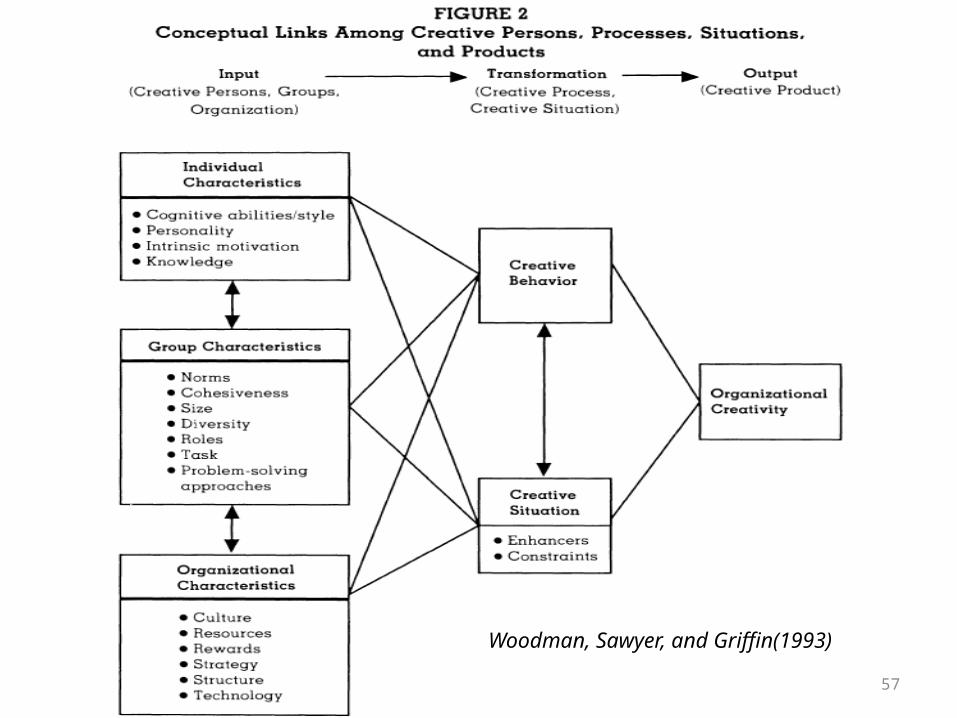
Woodman, Sawyer, and Griffin(1993)


![Innovation and New Product Development Management[1]](https://img.pdfslide.tips/doc/110x75/547ee2065906b5bf718b4719/innovation-and-new-product-development-management1.jpg)