Embed Size (px)
Citation preview
Noninvasive identification of epicardial ventriculartachycardia substrate by magnetic resonance–basedsignal intensity mappingÁngel Arenal, MD, PhD,* Esther Pérez-David, MD,* Pablo Ávila, MD,*
Javier Fernández-Portales, MD,† Verónica Crisóstomo, DVM, PhD,† Claudia Báez, DVM,†
Javier Jiménez-Candil, MD, PhD,† José L. Rubio-Guivernau, PhD,‡
María J. Ledesma-Carbayo, PhD,‡ Gerard Loughlin, MD,* Javier Bermejo, MD, PhD,*
Francisco M. Sánchez-Margallo, DVM, PhD,† Francisco Fernández-Avilés, MD, PhD*
From the *Hospital General Universitario Gregorio Marañón, Madrid, Spain, †Centro de Cirugía de MínimaInvasión Jesús Usón, Cáceres, Spain, and ‡Universidad Politécnica de Madrid and CIBER-BBN, Spain.
BACKGROUND Endo–epicardial substrate ablation reduces ven-tricular tachycardia (VT) recurrences; however, not all patients inwhom the epicardium is explored have a VT substrate. Contrast-enhanced magnetic resonance imaging (ceMRI) is used to charac-terize VT substrate after myocardial infarction.
OBJECTIVE The purpose of this study was to determine ifepicardial VT substrate can be identified noninvasively by ceMRI-based endo–epicardial signal intensity (SI) mapping.
METHODS Myocardial infarction was induced in 31 pigs. Four or 16weeks later, ceMRI was obtained, and the averaged subendocardialand subepicardial SIs were projected onto 3-dimensional endocar-dial and epicardial shells in which dense scar, heterogeneous tissue(HT), and normal tissue were differentiated. An HT channel wasdefined as a corridor of HT surrounded by dense scar and connectedto normal tissue. A “patchy” scar pattern was defined as thepresence of at least 3 dense scar islets surrounded by HT formingZ2 HT channels. Electrophysiologic study was performedafter ceMRI.
RESULTS Thirty-three different sustained monomorphic VTs (291� 49 ms) were induced in 25 pigs. Mid-diastolic electrograms wererecorded in the endocardium (endocardial VT) in 17 and in theepicardium (epicardial VT) in 13. Epicardial SI mapping showed that
This study was partially supported by the National Fund for HealthResearch (Fondo de Investigación Sanitaria) through Grants PI10/02771,TIN2007-68048-C02-01, TIN2007-68048-C02-02, and TEC2010-21619-C04-03 from the Spanish Ministry of Science and Innovation and theCooperative Cardiovascular Disease Research Network (RECAVA), Insti-tuto de Salud Carlos III, Ministry of Health. Dr. Arenal is a consultant forMedtronic and Boston Scientific, Spain Address reprint requests andcorrespondence: Dr. Ángel Arenal, Electrophysiology Unit, CardiologyDepartment, Hospital General Universitario Gregorio Marañón,46 Dr. Esquerdo St, 28007 Madrid, Spain. E-mail address: [email protected].
1547-5271/$-see front matter B 2014 Heart Rhythm Society. All rights reserved.
scar area was similar in animals with and without epicardial VT (24� 6 cm2 vs 25 � 12 cm2), but HT covered a higher surface of theepicardial scar in animals with VT (76� 6% vs 61� 10%, P¼ .03).A patchy scar pattern was observed in all animals with epicardial VTbut only in 3 animals without VT (P o .001).
CONCLUSION CeMRI-based SI mapping allows identification of theepicardial VT substrate.
KEYWORDS Epicardium; Magnetic resonance imaging; Ventriculartachycardia; Arrhythmogenic substrate
ABBREVIATIONS 3D ¼ 3-dimensional; CC ¼ conduction channels;ceMRI ¼ contrast-enhanced magnetic resonance imaging; CL ¼cycle length; EIC-LP¼ electrograms with isolated components/latepotentials; ENDO ¼ entire endocardium; ENDO-50% ¼ internalhalf of the endocardium; EPI ¼ entire epicardium; EPI-50% ¼external half of the epicardium; HT ¼ heterogeneous tissue;LV ¼ left ventricle; MRI ¼ magnetic resonance imaging; PES ¼programmed electrical stimulation; SI ¼ signal intensity; SMVT ¼sustained monomorphic ventricular tachycardia; VT ¼ ventriculartachycardia
(Heart Rhythm 2014;11:1456–1464) I 2014 Heart Rhythm Society.All rights reserved.
IntroductionThe substrate of most sustained monomorphic ventriculartachycardias (SMVTs) is located in the endocardium, butsome ventricular tachycardias (VTs) can only be ablatedfrom the epicardium.1–4 A combined endo–epicardial sub-strate ablation approach reduces VT recurrences; however,o30% of patients in whom the epicardium was explored hadan epicardial VT substrate.5 In addition, epicardial fat mayreduce voltage mapping accuracy to delimit epicardial scars.
Contrast-enhanced magnetic resonance imaging (ceMRI)reliably identifies scars and VT substrate: (1) infarct morphol-ogy, scar surface extension, and heterogeneous tissue (HT)
http://dx.doi.org/10.1016/j.hrthm.2014.04.022

1457Arenal et al Identification of Epicardial VT Substrate
mass are predictors of VT inducibility and mortality6–8; and(2) VT-related endocardial slow conduction channels (CC)9,10
correspond with HT channels that are detected by ceMRI-based signal intensity (SI) mapping, a method in which theaveraged subendocardial tissue SI is projected onto a 3-dimensional (3D) left ventricular (LV) endocardial shell.11,12
We hypothesized that epicardial SMVT substrate can beidentified by ceMRI-based endo–epicardial SI mapping. Thishypothesis was assessed in a swine model of postinfarction VT.The purposes of the studywere (1) to evaluate the capability of SImapping to identify epicardial VT substrate, (2) to compare thecharacteristics of epicardial and endocardial VT substrates, and(3) to determine the time to epicardial VT substrate appearance.
MethodsExperimental protocolThe study protocol was approved by the Institutional AnimalCare and Use Committee (Centro de Cirugía de MínimaInvasión Jesús Usón). Experimental details are available inthe Online Supplementary Material.
Thirty-one domestic pigs weighing 29 to 37 kg were usedfor this study. To induce closed chest myocardial infarction,the left anterior descending coronary artery was occludedtransiently by a balloon catheter placed just distal to the firstdiagonal branch for 150 minutes, followed by reperfusion.CeMRI and electrophysiologic study were performed either4 weeks (group 1) or 16 weeks (group 2) later in order toestablish the time to epicardial VT substrate appearance.
MRI acquisition and processing (OnlineSupplementary Material)The animals underwent ceMRI with a 1.5-T scanner (Intera,Philips Medical Systems, Best, The Netherlands). All imageswere obtained with ECG gating and breath-holding.
The MRI study consisted of cine steady-state free-precession imaging of LV function and late enhancementimaging of myocardial scar tissue. Late-enhanced imageswere obtained 15 minutes after a total injection of 0.2 mmol/kg of gadobutrol (Gadovist, Bayer Shering Pharma AG,Berlin, Germany) and were used for infarct characterization.Delayed enhancement data acquisition provided a pixelresolution of 1.29 � 1.29 mm in-plane and a slice thicknessof 2.5 mm, which corresponds to approximately 40 slicescovering the LV. We used previously defined SI thresholdsto quantify 2 different areas within the infarct zone: (1) thescar core defined by a SI 43 SD above the mean of theremote normal myocardium, and (2) HT (i.e., gray zone)defined by an SI between 2 and 3 SD.7,8
Magnetic resonance based endo–epicardial SImappingThe myocardial wall was divided into 2 equal parts:subendocardium and subepicardium. The averaged SI ofthe internal half of the subendocardium (ENDO-50%), theentire subendocardium (ENDO), the entire subepicardium(EPI), and the external half of subepicardium (EPI-50%)
were projected respectively onto 3D endocardial and epi-cardial shell reconstructions of the LV to identify theendocardial and epicardial VT substrate. LV endocardial/epicardial contours were manually defined on contiguousshort-axis slices using QMass MR 7.0 and imported into ourtool in which 3D endocardial/epicardial reconstructions werecomputed offline from a short-axis ceMRI image volumeusing custom software developed in the MATLAB environ-ment (Mathworks, Natick, MA). The 3D visualization inter-face was implemented in Java (Sun Microsystems, SantaClara, CA) using VTK (Kitware, Clifton Park, NY) visual-ization algorithms.11 These 4 surface maps were analyzed todetermine the structure of the scar (endo–epicardial SImapping; Figure 1, A–D). These surfaces were color codedto provide information on SI. The red area represented densescar and was defined by SI Z minimal SI in the core of thescar; the magenta area represented normal myocardium (SIr peak SI in normal myocardium); and the area betweenthese extremes represented HT. In all SI maps, the extensionof scar, dense scar, and HT were measured using custom-developed software. An HT channel was defined as acorridor of HT differentiated by a SI lower than thesurrounding scar tissue (Figure 1). A patchy scar patternwas defined by the presence of at least 3 dense scar isletssurrounded by HT; this implied the existence of at least 2 HTchannels. For side-to-side comparison with voltage mapping,the scar extension and the orientation referred to the mitralannulus and segment location of each HT channel weredetermined.13 Two independent investigators blind to theelectrophysiologic study analyzed the SI maps.
Electrophysiologic study and electroanatomicmappingThe animals underwent electrophysiologic study 2 daysafter ceMRI. A quadripolar catheter was placed at the rightventricular apex against the distal septum close to the infarctarea. A multipolar catheter was placed in the pericardial sacas previously described.14
Point-by-point sequential endocardial and epicardialmapping was performed during sinus rhythm or rightventricular pacing using the CARTO system (XP version,Biosense Inc, Diamond Bar, CA) with the NaviStar Ther-moCool catheter (Biosense Inc). Multiple sites wereexplored to obtain a minimal fill threshold of 10 mm in thelow-voltage area; 0.5 and 1.5 mV were the limits to definedense scar and scar areas, respectively. As the upper andlower limits of the color range were set at 1.51 and 1.5 andthen lowered in steps of 0.1 mV to 0.11 and 0.10 mV, 30voltage maps were analyzed for each animal: 15 maps fromthe endocardium and 15 from the epicardium.
Slow CC and the activation sequence within CC weredefined as referred9 and tagged in the scar. In those cases inwhich voltage mapping was performed during sinus rhythm,CC were reviewed during right ventricular pacing to uncoverelectrograms with isolated components/late potentials (EIC-LP).15 HT conduction velocity was estimated in CC in which

Heart Rhythm, Vol 11, No 8, August 20141458
activation sequence was established without any doubt fromthe entrance to the inner isthmus (see Online SupplementaryMaterial).
After endocardial and epicardial voltage maps wereobtained, the mapping catheter was advanced to the LVendocardium over the scar areas with EIC-LP, and the
Figure 1 Contrast-enhanced magnetic resonance ima-ging (ceMRI)-based endo–epicardial signal intensity (SI)mapping. A, B: Endocardial shells in which the average SIof ENDO-50% and ENDO of the ventricular wall areprojected. C, D: Epicardial shells in which the EPI andthe EPI-50% are projected. The color range providesinformation on SI: the red area represents SI 4 minimalSI in the core of the scar; magenta area represents normalmyocardium (SIo peak SI in normal myocardium), and thearea between these extremes represents heterogeneoustissue (HT). In this example in which only 1 epicardialventricular tachycardia was induced, the epicardial SI mapshows a patchy pattern with a large proportion of HT andmultiple channels, and the endocardial map shows acompact dense scar without HT channels. E: Epicardialvoltage map corresponding to the same animal. Note theconduction channel (white arrows) and the electrogramswith isolated components/late potentials (F) recorded duringsinus rhythm at the entrance of the channel (black arrow).ENDO ¼ entire endocardium; ENDO-50% ¼ internal halfof the endocardium; EPI ¼ entire epicardium; EPI-50% ¼external half of the epicardium.

Table 1 Comparison of endocardial and epicardial scar extensionobtained by contrast-enhanced magnetic resonance imaging
Endocardium Epicardium P value
Healthy tissue (cm2) 68 � 11 99 � 14 .001*Total scar (cm2) 25 � 9 24 � 8 NSDense scar (cm2) 9 � 5 7 � 5 .008*Heterogeneous tissue (cm2) 16 � 5 17 � 7 NS
*p o .05.
Table 2 Comparison between animals with and withoutepicardial VT
EpicardialVT (n ¼ 13)
No epicardialVT (n ¼ 14)
Pvalue
Electroanatomic mapsArea o1.5 mV (cm2) 66 � 37 58 � 37 NSArea o0.5 mV (cm2) 30 � 20 24 � 20 NSConduction channels† .009*
0 0 (0%) 4 (21%)1 3 (23%) 7 (50%)
Patchy pattern (Z2channels)
10 (77%) 3 (29%)
MRI measurementsLV ejection fraction (%) 39 � 6 34 � 7 .04*
LV ED volume (ml) 147 � 28 151 � 28 NSLV ES volume (ml) 89 � 20 100 � 22 NSLV mass (g) 72 � 17 72 � 10 NSLV mass 42 SD (g) 13 � 4 16 � 7 NSLV mass 43 SD (g) 11 � 4 12 � 6 NS
Signal intensity mapsDense scar EPI-50% (cm2) 5 � 2 10 � 6 .01*
HT EPI-50% (cm2) 19 � 5 14 � 6 .07Total scar EPI-50% (cm2) 24 � 6 25 � 12 NSHealthy tissue EPI-50%(cm2)
99 � 13 98 � 16 NS
Dense scar/total scarEPI-50% (%)
23 � 6 38 � 2 .003*
HT/total scar EPI-50% (%) 76 � 6 61 � 10 .03*
HT structure EPI-50%† .001*
No channel 0 (0%) 5 (36%)1 Channel 0 (0%) 4 (28%)Patchy pattern (Z2channels)
13 (100%) 5 (36%)
ED¼ end-diastolic; EPI¼ entire epicardium; EPI-50%¼ external half ofthe epicardium; ES ¼ end-systolic; HT ¼ heterogeneous tissue; LV ¼ leftventricle; MRI¼magnetic resonance imaging; VT¼ ventricular tachycardia.*P o .05.†χ2 test.
1459Arenal et al Identification of Epicardial VT Substrate
multipolar catheter was placed in the pericardium over thescar. Programmed electrical stimulation (PES) was performedusing a protocol that included 4 extrastimuli delivered after adrive cycle length (CL) at 600, 400, and 350 ms.16
When a VT was induced, endocardial and epicardialmapping were performed sequentially focusing on the scar.When mid-diastolic electrograms were recorded, entrain-ment mapping was attempted from these electrograms. AfterVT mapping of both scar surfaces, VT was terminated bypacing. Pacing from mid-diastolic electrogram sites wasperformed during sinus rhythm for further characterization ofVT isthmuses (see Online Supplementary Material). PESwas repeated from different locations, including the LV andepicardium, trying to induce a different tachycardia. If after 3sets of PES only 1 VT was induced, we concluded that noother VT was inducible. Presystolic and mid-diastolicelectrograms were tagged in voltage maps. Operators wereblinded to the ceMRI images.
Comparison of voltage and SI mappingSI and voltage maps were compared to establish the location ofVT substrate and mid-diastolic electrograms in SI maps (seeOnline Supplementary Material). Agreement between SI andvoltage maps was graded as high, intermediate, or low andconsidered separately for endocardial and epicardial surfaces.High concordance implied that all the HT had a correspondingCC and that scar in SI maps (SI 42 SD) and scar in voltage
Figure 2 Regression lines of the epicardial (A) and endocardial (B) scar extension in signal intensity (SI) maps and infarct mass. These regression lines showthe correlation between the scar areas (42 SD) in EPI-50% and ENDO-50% SI maps and infarct mass (42 SD). Abbreviations as in Figure 1.
Heart Rhythm, Vol 11, No 8, August 20141460
maps (o1.5 mV) spanned the same segments.13 Intermediateconcordance meant that all HT channels and CC coincided butsegment scar extension was different. In low concordance,only some HT channels and CC matched.
Statistical analysisValues are given as mean � SD. Comparisons were madeusing the t test, paired t test, and Fisher exact test. Linear
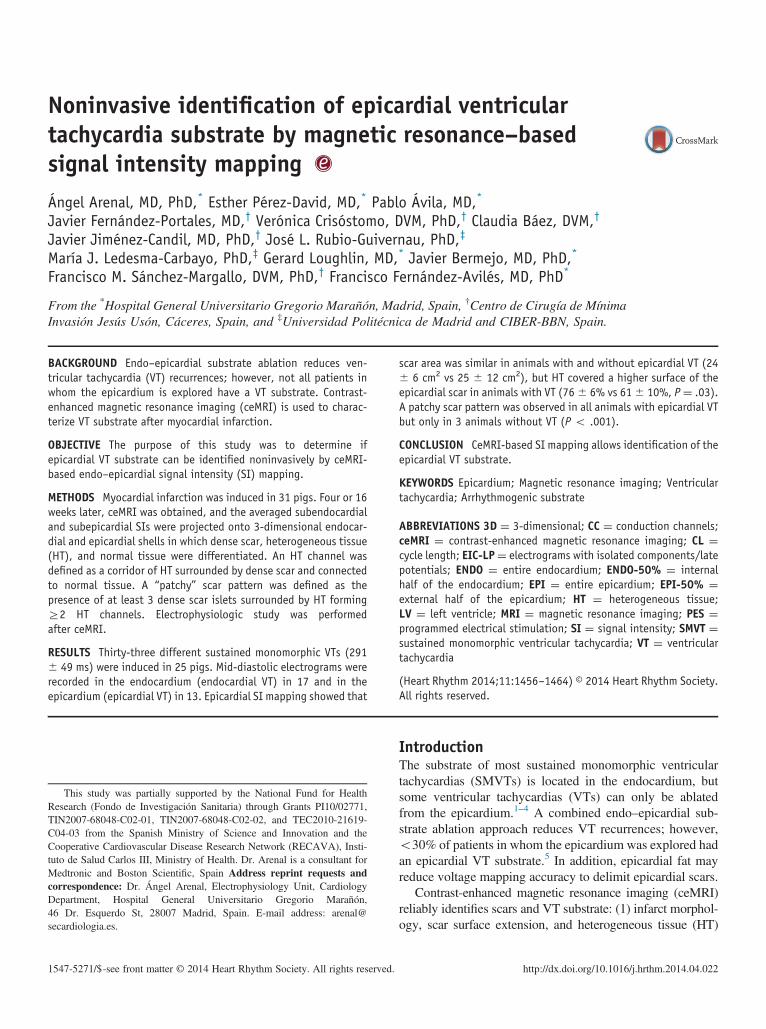
Figure 3 Upper panel: EPI-50% and voltage maps of an experiment with indu(A1) shows the scar and the patchy pattern with at least 3 dense scar islets surrouchannels is similar to the location of conduction channels (CC) in the voltage map (not cross the scar. Further anatomic evaluation of the explanted heart showed thadescending coronary artery so that voltage mapping could not detect the full leelectrograms were recorded. Lower panel: EPI-50% and voltage maps of experimewith minimal extension of HT in both the SI (B1) and voltage maps (B2). The ot(arrows) and minimal extension of HT in the SI map (B3). Other abbreviations as
regression was used to estimate the relation betweencontinuous variables. P o .05 was considered significant.
ResultsOf the 31 animals included in the study, 2 died duringcoronary occlusion and 1 during electrophysiologic studybefore electroanatomic mapping was performed. Therefore,ceMRI was performed in 29 animals and electrophysiologicstudy in 28, in which LV ejection fraction was 36% � 7%,
cible epicardial ventricular tachycardia (VT). The signal intensity (SI) mapnded by heterogeneous tissue (HT) channels. Although the location of HTA2). Note that the CC marked by black arrows is incomplete because it doest this channel was partially covered by the fat surrounding the left anteriorngth of the CC (see Figure 5). Dots indicate the site where mid-diastolicnts without inducible epicardial VT. One experiment shows a small scar coreher experiment shows a large scar core with a single isolated small channelin Figure 1.

Table 3 Comparison between animals with and withoutendocardial VT
Endocardial VT(n ¼ 17)
No endocardialVT (n ¼ 11)
Pvalue
Electroanatomic mapsArea o1.5 mV (cm2) 48 � 12 36 � 20 .1Area o0.5 mV (cm2) 13 � 8 11 � 10 NSConducting channels† .02*
0 0 (0%) 2 (18%)1 14 (82%) 4 (36%)
Patchy pattern (Z2channels)
3 (18%) 5 (45%)
MRI measurementsLV ejection fraction (%) 34 � 7 39 � 5 .06LV ED volume (ml) 183 � 28 143 � 31 NSLV ES volume (ml) 100 � 20 86 � 22 .1LV mass (g) 72 � 10 72 � 71 NSLV mass 42 SD (g) 16 � 5 12 � 5 0.09LV mass 43 SD (g) 12 � 5 10 � 6 NS
Signal intensity mapsDense scar ENDO-50%(cm2)
11 � 4 8 � 5 .1
HT ENDO-50% (cm2) 16 � 5 14 � 5 NSTotal scar ENDO-50%(cm2)
27 � 8 22 � 9 .1
Healthy tissue ENDO-50%(cm2)
67 � 10 68 � 18 NS
Dense scar/total scarENDO-50% (%)
37 � 10 32 � 10 .1
HT/total scar ENDO-50%(%)
62 � 10 67 � 10 .1
HT structure ENDO-50%† .02*
No channel 0 (0%) 3 (28%)1 Channel 14 (82%) 4 (36%)Patchy pattern (Z2channels)
3 (18%) 4 (36%)
ED ¼ end-diastolic; ENDO ¼ entire endocardium; ENDO-50% ¼ internalhalf of the endocardium; ES ¼ end-systolic; HT ¼ heterogeneous tissue;LV ¼ left ventricle; MRI ¼ magnetic resonance imaging; VT ¼ ventriculartachycardia.*P o .05.†Chi-square test.
1461Arenal et al Identification of Epicardial VT Substrate
LV mass 72� 13 g, LV mass with SI42 SD was 15� 6 g,and LV mass with SI 43 SD was 12 � 5 g. Fifteen animalsbelonged to group 1 and 13 to group 2.
Electrophysiologic studyThirty-three different SMVTs (291 � 49 ms) were inducedin 25 pigs, and presystolic or mid-diastolic electrogramswere recorded in 30 VT. Seventeen VTs were consideredendocardial VTs because mid-diastolic electrograms wererecorded in the endocardium; in 2 of these VTs mid-diastolicelectrograms were also recorded at the epicardium but for theanalysis were considered endocardial VT. Thirteen VTs wereclassified as epicardial because mid-diastolic electrogramswere only recorded at the epicardium. The epicardial VT CLwas significantly longer than endocardial VT CL (329 � 49vs 267 � 31 ms, P ¼ .003).
Electroanatomic mappingEndocardial voltage mapping was obtained in 28 experi-ments and epicardial voltage mapping in 27 (in 1 animalpericardial adherences precluded mapping). Epicardial andendocardial maps were created with 477 � 156 points and549� 198 points, respectively. Both the scar and dense scarwere larger at the epicardium (59� 35 cm2 vs 41� 15 cm2,P¼ .01; and 25� 19 cm2 vs 11� 8 cm2, Po .001). Thirty-six epicardial CC in 22 animals and 47 endocardial CC in 26animals were found. EIC-LP were recorded in all channelsduring sinus rhythm or ventricular pacing (Figure 1F). Theactivation time of the latest component of the electrogramslocated in the inner part of the channels was longer inepicardial than in endocardial CC (146� 37 ms vs 115� 34ms, Po .001). The estimated HT conduction velocity in CCwas slower in the epicardium (0.28 � 0.05 m/s vs 0.54 �0.21 m/s, P ¼ .02).
SI mappingTable 1 lists the endocardial and epicardial extension of thescar, scar core and HT. Endocardial and epicardial scar surfaceareas in SI mapping correlate significantly with scar tissuemass (Figure 2). In 21 animals, 44 and 26 epicardial HTchannels were identified in EPI-50% SI and EPI SI maps,respectively. Similarly, a patchy pattern was more frequentlyobserved in EPI-50% (17 vs 10 maps). Thirty-five endocardialHT channels in 25 animals were detected in ENDO-50% SImaps but only 27 HT channels in 20 animals in ENDO SImaps. Because the ventricular wall at the infarcted zone rangedfrom 8 to 12 mm, these data suggest that averaging 2 to 3 mmof the external epicardium or internal endocardium is moresensitive than averaging the entire epicardium or endocardium.
Characteristics of epicardial VT substrateAn epicardial VT was induced in 13 animals: 6 in group 1 and7 in group 2 (P ¼ NS). In all VTs, mid-diastolic electrogramswere recorded at or near (o10 mm) the CC. VT isthmusidentification was based on (1) concealed entrainment and apostpacing interval equal to the VT CL in 2 VTs, (2) pacing
from mid-diastolic sites during sinus rhythm reproducing VTQRS morphology and a similar stimulus-QRS interval toelectrogram-QRS interval during tachycardia in 8 VTs, and(3) mid-diastolic elctrograms in 3 VT (see OnlineSupplementaryMaterial). Table 2 lists the differences betweenanimals with and those without epicardial VT: (1) the densescar area was smaller, (2) the proportion of HT was higher,and (3) a “patchy” scar pattern was identified in all experi-ments with induced VT but in only 36% of the animalswithout inducible VT (Figures 1 and 3). It also seems that aminimal dense scar extension is needed to lodge a VT as only1 of 6 animals with a total scar o19 cm2 had inducible VT(Figure 3, bottom panel, and Online Supplementary Figure 1).
Characteristics of endocardial VT substrateTable 3 lists the differences between animals with andthose without endocardial VT. An endocardial VT wasinduced in 17 animals: 8 in group 1 and 9 in group 2

Heart Rhythm, Vol 11, No 8, August 20141462
(P ¼ NS). In all but 1 VT, presystolic or mid-diastolicelectrograms were recorded at the inner part or exit ofCC. VT isthmus identification was based on (1) con-cealed entrainment and a postpacing interval equal to theVT CL in 4 VTs, (2) pacing from mid-diastolic sitesduring sinus rhythm reproducing VT QRS morphologyand a similar stimulus-QRS interval to electrogram-QRSinterval during tachycardia in 8 VTs, and (3) mid-diastolic electrograms in 5 VT (see Online Suppl-ementary Material). All animals with inducible endocar-dial VT had at least 1 HT channel in ENDO-50% SImaps. In 3 of these animals with inducible endocardialVTs, no HT channels were observed in ENDO SI maps.
Figure 4 Upper panel: ENDO-50% of an experiment with inducible endocardiand the heterogeneous tissue (HT) channel in 1 experiment with endocardial VT ilarge scar cores suggesting the presence of a large circuit (arrows). This channel iexperiment without inducible endocardial VT. B1: The SI map shows minimal islecircuits, but the length of these circuits is shorter than those found in Figure 5. B2:Note the small patches of scar. Abbreviations as in Figure 1.
Endocardial VTs were more frequently induced inexperiments with a single CC or HT channel than witha patchy pattern (Figure 4).
Comparison of SI and voltage mappingWhen EPI-50% and ENDO-50% SI maps were comparedwith their corresponding voltage maps, high, intermediate, orlow concordance was found in 8, 17, and 3 endocardial mapsand in 8, 12, and 7 epicardial maps. The low concordance in425% of epicardial maps (Figure 3, A1 and A2) was mainlydue to the effect of epicardial fat on voltage mapping(Figure 5).
al ventricular tachycardia (VT). A1: Signal intensity (SI) maps show the scarnduction. The HT channel runs perpendicular to the mitral valve between 2s also observed in the voltage maps (A2). Lower panel: ENDO-50% of ants of dense scar from an experiment with no VT. There are several possibleThe voltage map shows the scar with voltage scar cutoffs set at 0.5/1.5 mV.

Figure 5 Explanted heart corresponding to animal in Figure 3, upperpanel. The black line encircles the infarcted area. The black arrows show thearea where epicardial fat seems to prevent channel identification withvoltage mapping (black arrows in Figure 3, A2). The red arrow shows theheterogeneous tissue surrounding the apex (white arrows in Figure 3, A2),which is better differentiated due to the absence of fat.
1463Arenal et al Identification of Epicardial VT Substrate
DiscussionThis study shows that (1) epicardial VT substrate can beidentified by ceMRI-based SI mapping, (2) a patchy scarpattern is associated with epicardial VT inducibility, (3)epicardial and endocardial VT substrates are different, (4) SIand voltage mapping concordance is affected by epicardialfat, and (5) epicardial VT substrate appears shortly aftermyocardial infarction.
Experimental modelThis experimental model is characterized by high epicardialVT inducibility. Prolonged coronary occlusion likely is thecause for the wide epicardial scar extension and VTinducibility. All induced VTs were monomorphic as opposedto data from previous studies in which many fast, focal VTswere induced.17 The PES protocol used in this study, whichis very sensitive and specific, could explain these differ-ences.16 Amiodarone, which was stopped 3 days after infarctinduction, could not have had any effect on the induced VT.In this model, VTs usually are related to CC, and, although arecent study has raised some concerns about the relation ofchannels and VT isthmuses,18 in the referred study VTs withisthmuses not located within channels were very slow (VTCL 440 � 40 ms), whereas fast VTs usually were related tochannels (VT CL 377 � 67 ms). In our study, VT CL was291 � 49 ms.
Epicardial VT substrate and SI mappingSeveral studies have demonstrated ceMRI is a reliablemethod for identifying endocardial VT substrate: infarct
surface extension was a better predictor of inducible VT thanLV ejection fraction,6 VT critical sites are always confined toareas of high SI,18,19 and there is correlation of VT-relatedCC and HT channels detected by SI mapping.11
Epicardial VT appears in scars characterized by a com-plex patchy geometry with a higher proportion of HT. Theprobability of inducing an epicardial VT when a “patchy”scar pattern is present is 470%. Averaging a layer of 2 to 3mm of the external half of the subepicardium SI is likely abetter cutoff for identifying the epicardial VT substrate thanaveraging the entire subepicardium.
Epicardial and endocardial VT substrate differencesThe longer activation time of late potential at the epicardiumcould be explained by (1) transmural delay during sinusrhythm as the activation goes from endocardium to epicar-dium and (2) the slower epicardial HT conduction velocitysecondary to the lack of Purkinje fibers and the differences inaction potentials.20 This slow conduction velocity couldfavor induction of slower VT even in the absence of largeobstacles as it happens in patchy scars. On the other hand,endocardial VT substrate is characterized by large densescars. Endocardial fast conduction probably requires largerobstacles to maintain stable reentries.
Study limitationsThe complete reentrant circuit was not mapped because theinduced VT were very fast (mean CL 291 ms) and usuallypoorly tolerated. Nevertheless, as mapping was focused onthe scar area, presystolic or mid-diastolic electrograms wereidentified in the majority of the experiments.
Although radiofrequency ablation was not performedbecause of the previously reported high risk of developingventricular fibrillation21 and information concerning VTtermination sites is not available, mapping and pacingmaneuvers including concealed entrainment reinforced theprecise location of the VT isthmus.
The endocardium of the distal septum of the rightventricle was not systematically mapped. As this area couldbe affected by coronary occlusion and could correspond withsome areas of the epicardial SI mapping, we must assumecertain limitations when comparing epicardial voltage and SImaps in this particular segment.
Most patients requiring VT ablation have an implantablecardioverter-defibrillator, which is still considered a contra-indication for MRI. Nevertheless, recent studies haveshown that ceMRI can be performed safely in selectedpatients.22
Clinical implicationsOur results suggest that ceMRI-based endo–epicardial SImapping could facilitate the ablation procedure by (1) identify-ing the patients in whom the VT substrate extends to theepicardium and (2) helping to interpret epicardial voltage mapswhen epicardial fat is supposed to have altered the scar

Heart Rhythm, Vol 11, No 8, August 20141464
delimitation. These observations support clinical studies todefine the role of ceMRI in postinfarction VT ablation.
AcknowledgmentsWe thank Antonio Moratalla and Alicia Barrio for technicalassistance, and Thomas O’Boyle for language revision.
AppendixSupplementary dataSupplementary data associated with this article can be foundin the online version at http://dx.doi.org/10.1016/j.hrthm.2014.04.022.
References1. Brugada J, Berruezo A, Cuesta A, Osca J, Chueca E, Fosch X, Wayar L, Mont L.
Nonsurgical transthoracic epicardial radiofrequency ablation: an alternative inincessant ventricular tachycardia. J Am Coll Cardiol 2003;41:2036–2043.
2. Della Bella P, Brugada J, Zeppenfeld K, Merino J, Neuzil P, Maury P, MaccabelliG, Vergara P, Baratto F, Berruezo A, Wijnmaalen AP. Epicardial ablation forventricular tachycardia: a European multicenter study. Circ Arrhythm Electro-physiol 2011;4:653–659.
3. Sacher F, Roberts-Thomson K, Maury P, et al. Epicardial ventricular tachycardiaablation a multicenter safety study. J Am Coll Cardiol 2010;55:2366–2372.
4. Sosa E, Scanavacca M, d’Avila A, Oliveira F, Ramires JAF. Nonsurgicaltransthoracic epicardial catheter ablation to treat recurrent ventricular tachycardiaoccurring late after myocardial infarction. J Am Coll Cardiol 2000;35:1442–1449.
5. Di Biase L, Santangeli P, Burkhardt DJ, et al. Endo–epicardial homogenization ofthe scar versus limited substrate ablation for the treatment of electrical storms inpatients with ischemic cardiomyopathy. J Am Coll Cardiol 2012;60:132–141.
6. Bello D, Fieno DS, Kim RJ, Pereles FS, Passman R, Song G, Kadish AH,Goldberger JJ. Infarct morphology identifies patients with substrate for sustainedventricular tachycardia. J Am Coll Cardiol 2005;45:1104–1108.
7. Yan AT, Shayne AJ, Brown KA, Gupta SN, Chan CW, Luu TM, Di Carli MF,Reynolds HG, Stevenson WG, Kwong RY. Characterization of the peri-infarctzone by contrast-enhanced cardiac magnetic resonance imaging is a powerfulpredictor of post-myocardial infarction mortality. Circulation 2006;114:32–39.
8. Schmidt A, Azevedo CF, Cheng A, Gupta SN, Bluemke DA, Foo TK,Gerstenblith G, Weiss RG, Marban E, Tomaselli GF, Lima JA, Wu KC. Infarcttissue heterogeneity by magnetic resonance imaging identifies enhanced cardiacarrhythmia susceptibility in patients with left ventricular dysfunction. Circulation2007;115:2006–2014.
9. Arenal A, del Castillo S, Gonzalez-Torrecilla E, Atienza F, Ortiz M, Jimenez J,Puchol A, Garcia J, Almendral J. Tachycardia-related channel in the scar tissue inpatients with sustained monomorphic ventricular tachycardias: influence of thevoltage scar definition. Circulation 2004;110:2568–2574.
10. Hsia HH, Lin D, Sauer WH, Callans DJ, Marchlinski FE. Anatomic character-ization of endocardial substrate for hemodynamically stable reentrant ventriculartachycardia: identification of endocardial conducting channels. Heart Rhythm2006;3:503–512.
11. Perez-David E, Arenal A, Rubio-Guivernau JL, et al. Noninvasive identificationof ventricular tachycardia-related conducting channels using contrast-enhancedmagnetic resonance imaging in patients with chronic myocardial infarction:comparison of signal intensity scar mapping and endocardial voltage mapping.J Am Coll Cardiol 2011;57:184–194.
12. Andreu D, Berruezo A, Ortiz-Perez JT, Silva E, Mont L, Borras R, de Caralt TM,Perea RJ, Fernandez-Armenta J, Zeljko H, Brugada J. Integration of 3Delectroanatomic maps and magnetic resonance scar characterization into thenavigation system to guide ventricular tachycardia ablation. Circ ArrhythmElectrophysiol 2011;4:674–683.
13. Josephson ME. Clinical Cardiac Electrophysiology. Third edition. Philadelphia:Lippincott Williams & Williams; 2002:457.
14. Sosa E, Scanavacca M, D'Avila A, Piccioni J, Sanchez O, Velarde JL, Silva M,Reolao B. Endocardial and epicardial ablation guided by nonsurgical trans-thoracic epicardial mapping to treat recurrent ventricular tachycardia. J Cardio-vasc Electrophysiol 1998;9:229–239.
15. Arenal A, Glez-Torrecilla E, Ortiz M, Villacastin J, Fdez-Portales J, Sousa E, delCastillo S, Perez de Isla L, Jimenez J, Almendral J. Ablation of electrograms withan isolated, delayed component as treatment of unmappable monomorphicventricular tachycardias in patients with structural heart disease. J Am CollCardiol 2003;41:81–92.
16. Hummel JD, Strickberger SA, Daoud E, Niebauer M, Bakr O, Man KC,Williamson BD, Morady F. Results and efficiency of programmed ventricularstimulation with four extrastimuli compared with one, two, and three extrastimuli.Circulation 1994;90:2827–2832.
17. Ashikaga H, Sasano T, Dong J, et al. Magnetic resonance-based anatomicalanalysis of scar-related ventricular tachycardia: implications for catheter ablation.Circ Res 2007;101:939–947.
18. Codreanu A, Odille F, Aliot E, Marie PY, Magnin-Poull I, Andronache M,Mandry D, Djaballah W, Regent D, Felblinger J, de Chillou C. Electroanatomiccharacterization of post-infarct scars comparison with 3-dimensional myocardialscar reconstruction based on magnetic resonance imaging. J Am Coll Cardiol2008;52:839–842.
19. Desjardins B, Crawford T, Good E, Oral H, Chugh A, Pelosi F, Morady F, BogunF. Infarct architecture and characteristics on delayed enhanced magneticresonance imaging and electroanatomic mapping in patients with postinfarctionventricular arrhythmia. Heart Rhythm 2009;6:644–651.
20. Akar FG, Spragg DD, Tunin RS, Kass DA, Tomaselli GF. Mechanismsunderlying conduction slowing and arrhythmogenesis in nonischemic dilatedcardiomyopathy. Circ Res 2004;95:717–725.
21. Hogh Petersen H, Chen X, Pietersen A, Svendsen JH, Haunso S. Lesiondimensions during temperature-controlled radiofrequency catheter ablation ofleft ventricular porcine myocardium: impact of ablation site, electrode size, andconvective cooling. Circulation 1999;99:319–325.
22. Dickfeld T, Tian J, Ahmad G, Jimenez A, Turgeman A, Kuk R, Peters M, SaliarisA, Saba M, Shorofsky S, Jeudy J. MRI-Guided ventricular tachycardia ablation:integration of late gadolinium-enhanced 3D scar in patients with implantablecardioverter-defibrillators. Circ Arrhythm Electrophysiol 2011;4:172–184.