Embed Size (px)
Citation preview
Noora Harju
IMPROVING A TOOL FOR MATERI-
ALS REPORTING OF CORPORATE RE-
SPONSIBILITY REPORT
School of Technology
2018
brought to you by COREView metadata, citation and similar papers at core.ac.uk
provided by Theseus
VAASAN AMMATTIKORKEAKOULU
Energia– ja ympäristötekniikka
TIIVISTELMÄ
Tekijä Noora Harju
Opinnäytetyön nimi Improving a Tool for Materials Reporting of Corporate Re-
sponsibility Report
Vuosi 2018
Kieli Englanti
Sivumäärä 60 + 3 liitettä
Ohjaaja Jukka Hautala
Tämä opinnäytetyö tehtiin toimeksiantona Wärtsilä Finland Oy:lle. Työn tarkoituk-
sena oli kehittää yrityksen työkalua, joka kokoaa tuotannossa käytettyjen materiaa-
lien tiedot. Työkalua tarvitaan Global Reporting Initiative (GRI) raportointiohjei-
den mukaisessa yritysvastuuraportoinnissa, jonka yhtenä osana on yrityksen mate-
riaalitehokkuuden raportointi. Kyseistä työkalua käytetään myös pakkausmateriaa-
lien raportoinnissa RINKI–organisaatiolle. Molempien raportointien suhteen rapor-
tointivaatimuksiin on tullut hiljattain muutoksia, joten raporttien laadun parantami-
nen oli ajankohtaista.
Työssä on perehdytty yritysvastuuseen, yritysvastuuraportointiin, toimeksiantajan
raportointikäytäntöihin sekä raportoitavien materiaalitietojen vaatimuksiin. Kehi-
tystyö suoritettiin selvittämällä moottorien olennaisimmat komponentit, niiden ma-
teriaalit ja painot sekä tehtaalla käytetyt kemikaalit ja pakkausmateriaalit.
Työn lopputuloksena saatiin tehtyjen selvitysten perusteella luotua uusi työkalu.
Uusi työkalu osoittautui paljon tarkemmaksi ja selkeämmäksi kuin vanha. Jatkossa
työkalua tulisi kehittää erityisesti tuotteisiin liittyvien materiaalitietojen osalta otta-
malla entistä paremmin huomioon komponenttien painoerot eri kokoisten mootto-
rien välillä.
Avainsanat yritysvastuu, yritysvastuuraportointi, Global Reporting Ini-
tiative, materiaalitehokkuus

VAASAN AMMATTIKORKEAKOULU
UNIVERSITY OF APPLIED SCIENCES
Energia– ja ympäristötekniikka
ABSTRACT
Author Noora Harju
Title Improving a Tool for Materials Reporting of Corporate Re-
sponsibility Report
Year 2018
Language English
Pages 60 + 3 Appendices
Name of Supervisor Jukka Hautala
This thesis work was ordered by Wärtsilä Finland Oy. The objective of the work
was to develop a tool that would gather information of materials used in the factory
of the company. The company conducts corporate responsibility (CR) reporting ac-
cording to the Global Reporting Initiative (GRI) Sustainability Reporting Guide-
lines. The tool is needed for reporting the material performance reliably in the CR
report. Moreover, the tool is used for reporting used packaging materials for the
RINKI–organization. The reporting requirements concerning both reports were
changed lately, so it was important to improve the quality of these reports.
First the focus of the thesis was on corporate responsibility, corporate responsibility
reporting, and later on reporting customs of the client company and the require-
ments of the reported material information. The development project was made by
examining the most relevant components of engines to be included in the tool, their
weights and the materials they were made of, as well as chemicals and packaging
materials used in the factory.
Based on the research made, a new tool was created for the client company. The
new tool was proved to provide more accurate information and to be easier to use
compared to the old tool. In the future, the tool should be developed further espe-
cially focusing on the material information related to products. That could be done
by considering more carefully the weight differences between components of dif-
ferent sized engines.
Keywords Corporate responsibility, corporate responsibility reporting,
Global Reporting Initiative and material performance

TABLE OF CONTENTS
TIIVISTELMÄ
ABSTRACT
1 INTRODUCTION ............................................................................................ 8
2 CORPORATE RESPONSIBILITY ............................................................... 10
2.1 Corporate Responsibility as a Concept ................................................... 10
2.2 The Development of Corporate Responsibility ...................................... 11
2.3 Dimensions of Corporate Responsibility ................................................ 13
2.4 The Role of Stakeholders ........................................................................ 16
3 CORPORATE RESPONSIBILITY REPORTING ........................................ 18
3.1 Evolution of Corporate Responsibility Reporting .................................. 19
3.1.1 Policy Development in Corporate Responsibility Reporting ...... 19
3.2 Motives for Corporate Responsibility Reporting .................................... 20
4 GLOBAL REPORTING INITIATIVE .......................................................... 23
4.1 Guiding Principles And Contracts .......................................................... 23
4.2 Contents of Global Reporting Initiative Standards ................................. 25
4.3 Performance Indicators ........................................................................... 26
4.4 Creating a Corporate Responsibility Report ........................................... 29
4.4.1 Application Scale ........................................................................ 30
4.4.2 Contents of the Report ................................................................ 30
4.4.3 Assurance of the Report .............................................................. 31
4.5 Materials Performance Indicator............................................................. 32
4.5.1 Product–related Materials ........................................................... 33
4.5.2 Process–related Materials............................................................ 33
4.5.3 Packaging Materials .................................................................... 33
5 RINKI ............................................................................................................. 34
5.1 Producer Responsibility .......................................................................... 34
5.2 RINKI–reporting ..................................................................................... 35
6 WÄRTSILÄ AND CORPORATE RESPONSIBILITY ................................ 37
6.1 Sustainability in Wärtsilä ........................................................................ 37
6.2 Corporate Responsibility Reporting in Wärtsilä ..................................... 40
7 EXAMINATION OF THE DEVELOPMENT PROJECT ............................ 42
7.1 Starting Point of the Tool ........................................................................ 43
7.2 Execution of the Project .......................................................................... 44
7.2.1 Components ................................................................................ 46
7.2.2 Chemicals .................................................................................... 49
7.2.3 Packaging Materials .................................................................... 50
7.2.4 Creating the Tool in Excel .......................................................... 50
7.3 Testing of the Tool .................................................................................. 52
7.3.1 The Section of Product–related Materials ................................... 53
7.3.2 The Section of Process–related Materials ................................... 53
8 CONCLUSIONS ............................................................................................ 55
9 REFERENCES ............................................................................................... 58
APPENDICES
6
LIST OF FIGURES AND TABLES
Figure 1. Dimensions of corporate responsibility and their relations. 14
Figure 2. Visualization of the content of GRI Standards. 26
Figure 3. Description of performance indicators according to
GRI G4 Guidelines. 27
Figure 4. Flowchart of the information inputs and outputs of the tool. 43
Table 1. Total material usage of Wärtsilä. 40
Table 2. Typical sizes of smaller and larger scale engines. 46

7
LIST OF APPENDICES
APPENDIX 1. Plan of the execution
APPENDIX 2. Weight differences of components between the old and new tool
APPENDIX 3. Outcome of the development project
8
1 INTRODUCTION
The role of corporate responsibility has increased significantly in last years. There-
fore, the European Union (EU) has changed the legislation concerning sustainabil-
ity reporting to consolidate the transparency and responsibility of the companies
operating in its member countries. Today it is compulsory for large corporations
with over 500 employees to report the impacts of their operations on economic,
social and environmental levels. /1/
The client organization of this thesis work is Wärtsilä Finland Oy, which is one of
the subsidiaries of Wärtsilä Oyj. The company provides complete life-cycle solu-
tions that are enabled with smart technologies, for marine and energy markets. Ac-
cording to Wärtsilä, in a large scale its role and commitment in supplying sustaina-
ble energy solutions to all over the world, is very important /2/. The company has
been investing in sustainability a lot, and in 2018 Wärtsilä was declared to be one
of the hundred most sustainable companies in the world. /3/
Wärtsilä has been conducting sustainability reporting for years already and there-
fore, they must have been aware of the amounts of used materials in their opera-
tions. Material performance indicator was added to reporting in 2009. The aim of
the thesis work was to develop a new tool for the client that would facilitate gath-
ering information of all the used materials and make the information more accurate.
The tool provides information only of operations of the factory located in Vaasa.
The previous tool the company used for this purpose was defective and contained
information that was based on estimations rather than on verified information.
In addition to improving Wärtsilä Finland Oy’s corporate responsibility reporting,
the aim of this thesis was to improve the company’s RINKI report. The same tool
is used when reporting packaging materials for RINKI. Producer responsibility
bounds companies by law to organize and pay the collection and recycling of their
packaging waste /4/. The RINKI–organization offers companies services to take
care of their implementation of producer responsibility. It charges its clients based
on the amount of used packaging materials, so it was necessary to ensure the real
amount of them used in the company. /5/
9
First, the focus of this thesis work is on corporate responsibility, after which sus-
tainable reporting according to Global Reporting Initiative Guidelines is explained
more closely. The introduction of RINKI -organization and its operations are also
presented. A closer look into the Materials questionnaire of the sustainability re-
porting in the client company is needed to understand the constraints of the practical
development work of the thesis. After the theory part, the client company is pre-
sented in more detail and the role of corporate responsibility in the company’s op-
erations, as well their practices of sustainable reporting are discussed. The practical
part of the thesis, the process and the outcome of the development work are pre-
sented last.
10
2 CORPORATE RESPONSIBILITY
Corporations have a massive impact on the societies around them. These influences
may be either positive or negative depending on the way companies conduct their
operations. Nowadays consumers are more aware of ethicalness, sustainable devel-
opment and the well-being of environment, which has increased requirements and
pressure for corporations. Because of this development, companies are demanded
to explain their impacts on the surrounding society and environment. Many organ-
izations already have long roots with corporate responsibility reporting, and in the
future the role of corporate responsibility (CR) reporting is only going to increase.
That is because in 2016 a new directive from the European Union concerning CR
reporting came into force. Previously CR reporting was voluntary for companies,
but the new directive changed the reporting to be mandatory for all large companies
in the EU member countries. /6/
Conducting CR reporting means an increase of the workload and effort for corpo-
rations since they might have to start reporting activities they have not measured
before. However, obligation for reporting brings forth also advantages for the com-
pany. It enhances the transparency of the company and help them to identify and
predict forthcoming business risks. /7/ Advantages of CR reporting are more closely
later in this report.
2.1 Corporate Responsibility as a Concept
Corporate responsibility is a term that aims at describing the relation between an
organization and society around it. The organization can have a huge effect on in-
habitants, other companies, overall economy and environment in the society. Im-
pacts the organization has can be positive, such as employing locals and bringing
money for the society in the form of paid taxes. On the other hand, the impact on
society may be negative, for example if the company’s operations contaminate wa-
ter resources in the region. Not only has the corporation impact on the society but
also society affects corporation’s operations. As an example of the relation, conser-
vation areas nearby might limit significantly how the company can conduct its busi-
ness. /8, 9/
11
The concept of corporate responsibility can create confusion since it can be dis-
cussed with different terms in different purposes. There are terms such as corporate
social responsibility, corporate social responsiveness, business ethics, corporate
sustainability and corporate citizenship. These terms are used besides corporate re-
sponsibility but in the recent years, the term “corporate responsibility” has regular-
ized its utilization. The use of different terms is related to the development of the
idea of corporate responsibility and the dimensions of it that were emphasized at
the time. For example, “corporate sustainability” was widely used when environ-
mental concerns were exposed, and companies were expected to show responsibil-
ity on that matter. In this thesis, the term corporate responsibility is used because
compared to other terms, it is the most established and it is current since the work
is related to corporate life. /10, 11/
2.2 The Development of Corporate Responsibility
The concept of CR is still quite new in the society even though it has already settled
its position as a part of companies’ business activities. The focus of CR has varied
during the years depending on the societal situations at the time. The earliest attrib-
utes of CR started to emerge during the Industrial Revolution. After the revolution,
social defects got a lot of attention whilst in late 1960s environmental aspects drew
focus in the corporate life. /10/
Along with industrialization, people started to move from countryside to cities be-
cause of better working opportunities. People lived tightly in poor conditions, which
led to numerous of social problems in cities. Therefore, some employers did volun-
tarily charity in order to prevent those challenges for their employees. Industrial
employers could improve the living conditions of their workers with measures, such
as building them accommodations and schools for their children as well as offering
health care. These actions were not just charity for the company owners but on the
background, there was a thought of maximizing the productivity of workers and
make them better committed to the work. /12/
After the First World War, an early form of United Nations (UN), League of Na-
tions, was founded in 1919 bringing together governments, corporations and labor
12
unions. As a part of it, International Labour Organization (ILO) was established
focusing mainly on improving working conditions, occupational safety and health
as well as preventing the use of child and forced labour. Also, after the Great De-
pression in the 1930s, a lot of changes were made in the legislations concerning the
social wellness of citizens. Companies were started to be considered more as insti-
tutions that had social obligations towards the citizens. /10/
After the Second World War, there was a thought of sharing the economic wealth
more fairly among the society, and so began the development of welfare societies.
Nations started to improve their labour and social legislations and the role of trade
unions increased. As a result, the number of social services grew rapidly and work-
ing conditions in factories were ameliorated. In addition, more attention was paid
on human rights and consequently the member nations of UN approved the Univer-
sal Declaration of Human Rights in 1948. /10, 12/
Rapid industrialization encumbered the environment badly causing for example
acid rains and smog. Those and other problems, such as contamination of water
systems and soil drew attention to the well–being of Earth. In 1960s and 1970s the
first environmental and human rights organizations were born, aspiring to empha-
size defects in societies and influence the direction of legislations concerning them.
Many new environmental standards were enacted, which meant that corporations
needed to start limiting their emissions and being more responsible from the envi-
ronmental point of view. /10, 12/
The development of information technology enhanced the spreading of globaliza-
tion, in other words the networking of humans between continents. The world mar-
ket was released after the Cold War and for example in Europe the common market
was introduced. That enabled companies to move their businesses between coun-
tries easily. Many companies also relocated their production factories to developing
countries where workforce was very cheap. This evolution pointed out a need for
global statutes and for supervising their proper conduct, so that corporations started
to respect human rights and other legislation also when operating in poorer circum-
stances. /12/
13
When going towards the 21st century, environmental awareness increased again,
and the concept of sustainable development became stronger. Many countries com-
mitted to mitigating environmental hazards. Also, social and economic responsibil-
ity were more closely under the spotlight as the role of corporations grew further,
and on the other hand, when violations concerning for instance corruption and child
labor appeared. /12/
To sum up, in the 19th century the idea of corporate responsibility was constrained
in the thought of what good the corporation could do for the society with the fortune
it had earned. Instead, today the most important matter in the corporate responsibil-
ity is how the corporation accumulated its fortune in first place. People want to
know if companies follow and conduct morally and ethically accepted policies in
their actions. /10, 13/
2.3 Dimensions of Corporate Responsibility
Traditionally the success of companies has been measured based on their economic
performance. However, along corporate responsibility the way how corporate suc-
cess was seen changed, and there was a need to describe the success in other ways
as well. In the mid–1990s, a British business author John Elkington came up with
a term “triple bottom line” which suggests that when measuring responsibility of a
company, besides economic performance also social and environmental perfor-
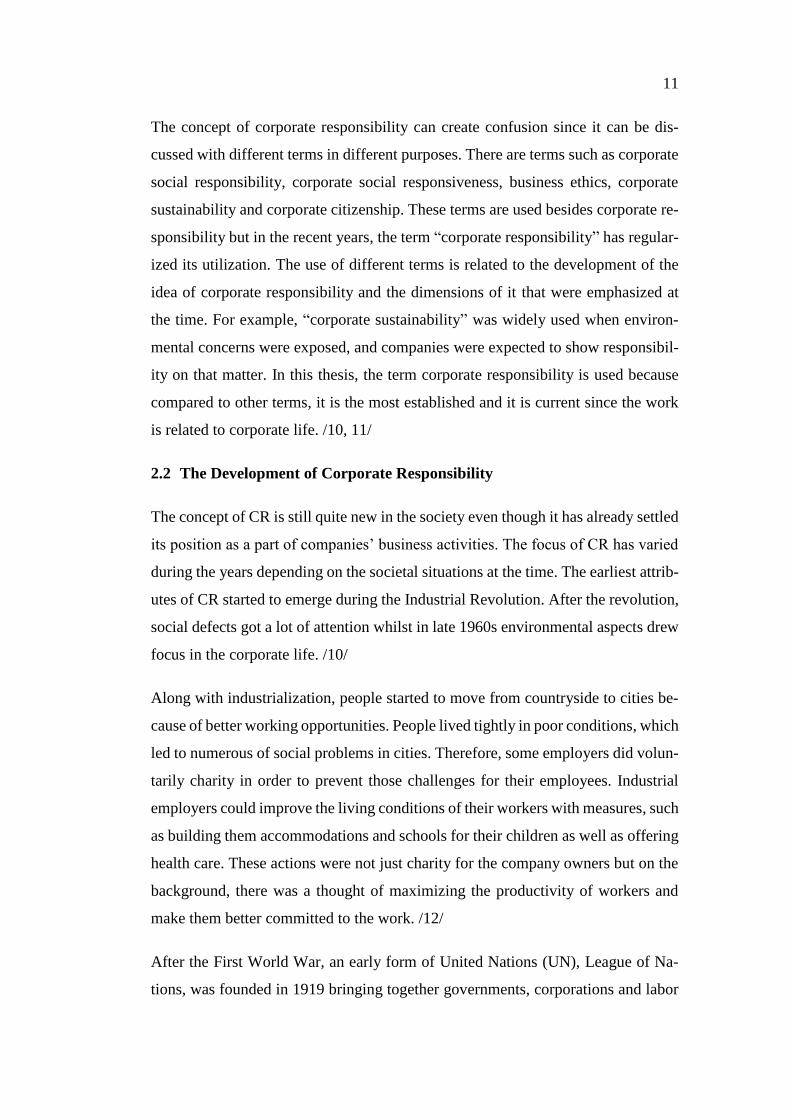
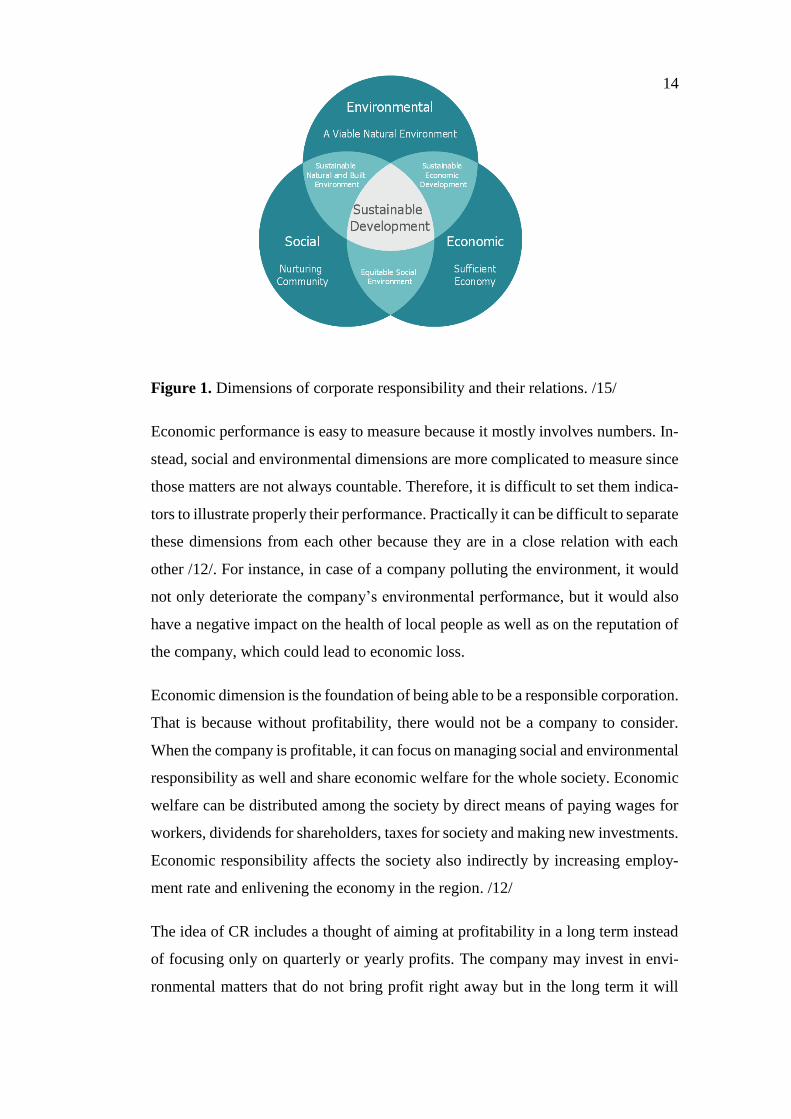
mance need to be taken into consideration. /14/ Conducting economic, social and
environmental dimensions responsibly leads the company towards more sustainable
operations. As seen in Figure 1, companies must be responsible in all the three di-
mensions to have balance in their operations and to be as responsible as possible.
14
Figure 1. Dimensions of corporate responsibility and their relations. /15/
Economic performance is easy to measure because it mostly involves numbers. In-
stead, social and environmental dimensions are more complicated to measure since
those matters are not always countable. Therefore, it is difficult to set them indica-
tors to illustrate properly their performance. Practically it can be difficult to separate
these dimensions from each other because they are in a close relation with each
other /12/. For instance, in case of a company polluting the environment, it would
not only deteriorate the company’s environmental performance, but it would also
have a negative impact on the health of local people as well as on the reputation of
the company, which could lead to economic loss.
Economic dimension is the foundation of being able to be a responsible corporation.
That is because without profitability, there would not be a company to consider.
When the company is profitable, it can focus on managing social and environmental
responsibility as well and share economic welfare for the whole society. Economic
welfare can be distributed among the society by direct means of paying wages for
workers, dividends for shareholders, taxes for society and making new investments.
Economic responsibility affects the society also indirectly by increasing employ-
ment rate and enlivening the economy in the region. /12/
The idea of CR includes a thought of aiming at profitability in a long term instead
of focusing only on quarterly or yearly profits. The company may invest in envi-
ronmental matters that do not bring profit right away but in the long term it will
15
lead to significant savings for the company and support similarly sustainable devel-
opment. In addition, the lowest considered level of CR is complying with laws.
Economic responsibility is largely fulfilled by only following local legislations. /12/
Social dimension includes basically all the people that are somehow in interaction
with the company. One of the most important groups in social responsibility are
employees and the concentration is especially on their working conditions, occupa-
tional health and safety as well as educating them more than required by law and
collective labor agreements. In the eyes of society, companies are seen as responsi-
ble for enhancing employment rate and minimizing the effects of reducing the
amount of work force, for example due to outsourcing. Moreover, companies have
responsibility for their customers. They have to make sure that consumer protection
is being implemented and that all the products and services they provide are safe to
use. /12/
Environmental dimension comprises the idea that companies are responsible for
protecting air, soil and water, reducing emissions, securing the biodiversity of na-
ture, reducing the amount of created waste as well as utilizing natural resources
efficiently and sparingly. The purpose of environmental responsibility is to make
companies change their operations for more environmentally friendly direction.
The goal is that companies would integrate environmental thinking in their actions
so that environmental impacts were considered already in the planning phase of a
new product or a production process. For some companies, green values are the
very base of their operations and they see an opportunity in environmental respon-
sibility. These kinds of companies can be for instance producers of renewable en-
ergy systems or companies that offer services for cleaning oceans from trash. These
kinds of businesses benefit both the company and the society, and it can be said that
companies create shared value for the society. /12/
Nowadays companies operate in multiple locations including developing countries.
Legislation in those countries is often poor compared to western countries, so op-
erating according to local legislation is not sufficient for the level of responsibility
that is expected from stakeholders. Therefore, in each dimension of sustainability
16
companies need to decide the applied scope of responsibility in the region. For in-
stance, companies can improve social conditions for locals by refusing to take part
in corruption and declining the use of child or forced labor in its operations and
requiring the same from its suppliers and partners. /12/
2.4 The Role of Stakeholders
A stakeholder denotes a person or a group, which interacts with a company at some
level. Meaning that the company’s operations affect stakeholders somehow while,
on the other hand, stakeholders may have an impact on how the company is oper-
ating. Some stakeholders have a closer relation to the company or their role from
the company’s operational point of view is bigger. Consequently, stakeholder
groups can be divided into primary and secondary stakeholders based on their im-
portance and role. /8/
Primary stakeholders can be classified as those groups that have a formal relation
with the company, for example through contracts. On top of that, the impact of the
company on stakeholders and vice versa is direct. These kinds of primary stake-
holders can be shareholders, employees, customers, suppliers and local society.
Secondary stakeholders, such as non-governmental organizations (NGO), compet-
itors, government and media, have indirect impacts on the company. /8/
Companies depend on their stakeholders because stakeholders enable the working
of the company and its success. Each stakeholder group has their expectations for
the company, for instance owners expect specific business results, customers qual-
ity products or services, employees safe working conditions while environmental
organizations expect companies to take care of the environment. It is important for
companies to be aware of the expectations of different stakeholders so that they can
lead their operations in directions that satisfy all or at least majority of the stake-
holders. /9/
For some stakeholders, such as owners, companies are accountable and need to
consider their opinions when making strategic decisions. However, communication
17
with stakeholders is often voluntary since it is beneficial for companies. If the as-
pects of different stakeholders are conflicted, companies have to choose which
stakeholders’ opinions contribute the company the most or, if possible, they should
try to compromise and keep everyone satisfied. /8, 9/
Communication between companies and their stakeholders is important for having
good stakeholder relations and being able to know their visions. Interaction with
different stakeholders varies from partnerships to simply informing important mat-
ters. Cooperation and partnerships are normally settled with stakeholders that have
great interests and possibilities to influence companies’ operations. Interaction with
stakeholders of medium level interest and possibilities to influence the company is
done by dialogue. This means that the parties meet intermittently and tell each other
about the most fundamental matters that are going on in their operations. For stake-
holders with little possibilities to influence companies, sufficient way of communi-
cation is informing. /9, 16/
Companies can utilize the views of their stakeholders when determining the con-
tents of the sustainability report and deciding management strategies. Materiality
analysis for stakeholders have increased in past years. The materiality analysis en-
ables stakeholders to communicate matters they value the most as well as issues
they see are the most important for the company to take into account. /8/ Other
benefits of stakeholder communication, such as identifying global megatrends and
creating added value, are regarded later together with other CR reporting benefits.
18
3 CORPORATE RESPONSIBILITY REPORTING
After the responsibilities of companies had extended from economic dimension to
cover also social and environmental dimensions, reporting of these matters has be-
come necessary besides reporting only economic performance. Corporate respon-
sibility reporting was created for that purpose and many stakeholders require CR
reporting from companies today. CR reporting was voluntary for a long time for
companies and since the beginning of 21st century it has increased steadily /9/. Nev-
ertheless, CR reporting is a relatively new thing and many companies do not have
yet settled practices for its implementation. Therefore, Global Reporting Initiative
(GRI) has created guidelines to help companies to determine essential issues that
should be reported. The aim of common guidelines is also to increase the compara-
bility of the results between corporations.
The economic part of the report gives stakeholders a view of the financial success
of the company in figures of profits and turnover. Additionally, it measures respon-
sibility for instance in figures of creating new jobs, investing in Research and De-
velopment (R&D) as well as paid taxes and wages. This way stakeholders can better
understand economic impacts of the company to surrounding people and society.
Social reporting tells the effects companies have on societies and how well they
carry out responsibility of those matters. These issues include matters, such as oc-
cupational health and safety, implementation of human rights and respecting con-
sumer protection. Environmental reporting contains information of all the environ-
mental impacts of the company, measures to mitigate the impacts as well as efforts
made for protecting the environment. There are several measurable issues, such as
carbon dioxide emissions as well as the amount of used materials and created waste
that help to define the environmental responsibility performance of the company.
/9/
CR reporting should include only the most relevant issues. Openness, transparency
and efficient communication are the leading principles of CR reporting but still not
everything about everything should be reported /9/. That is where the role of stake-
holder interaction stands out. Companies need the help of its stakeholders to decide
19
which are the values and issues that are the most important from their operational
point of view. In the best scenario both the creator and readers of the report benefit
from it.
3.1 Evolution of Corporate Responsibility Reporting
When awareness of the corporate responsibility spread in the world, in the 1990s
the first reports related to it appeared. However, the first reports mostly concen-
trated on environmental issues and were also otherwise rudimentary. The focus of
the CR reporting has changed between social and environmental issues over the
years but today it covers equally all three dimensions /10/.
The problem with early CR reports was that companies used different indicators
and proving the correct information was difficult. Accordingly, there was a need
for creating common reporting guidelines that could be applied to all organizations
regardless their size or the field of activity. GRI was established for that purpose
and it created guidelines as well as measurement and calculation principles for CR
reporting. /8/ GRI is presented more closely later in this thesis.
3.1.1 Policy Development in Corporate Responsibility Reporting
The EU and the UN have encouraged organizations to conduct CR reporting for a
long time to increase the transparency of their actions. While reporting was volun-
tary, many companies were committed to conduct it since they understood the ben-
efits of it. Today the role of CR is bigger than ever and consequently legislation
concerning the reporting has changed. In 2016 a new legislation took place in the
EU member countries that requires companies employing more than 500 persons to
conduct CR reporting. First mandatory reports cover the financial year 2017–2018
and the first reports are to be published in 2018. /6/ The renewal of the directive
affects corporations differently depending on their existing level of CR reporting.
New directives are not automatically binding in the member countries, but they
need to be added to the legislation separately. The obligation to report corporate
responsibility was added to the Finnish Accounting Act in 2016 so it has been ob-
ligatory for Finnish companies right from the beginning. /1/ The aim of the renewal
20
is to get a more reliable and transparent image of corporations’ actions while em-
phasizing that responsibility belongs to all organizations.
In practice, the new directive requires companies to report on topics of their envi-
ronmental, social and employee–related issues as well as about human rights, anti–
corruption and bribery. Companies must describe their business models, outcomes
and risks of their policies related to before mentioned topics, and their diversity
policies and how they are applied for management and supervisory bodies in com-
panies. However, assurance of the report is still voluntary for companies. /6/
Companies have the freedom to choose how they are going to implement the new
legislation in their businesses. Even though above–mentioned things are necessary
to report, it is up to companies how they want to report the required information.
The directive is flexible in order to be suitable for all the different fields of compa-
nies to apply. /1/ Nonetheless, companies are encouraged to follow recognized
frameworks, such as GRI’s Sustainability Reporting Guidelines, in their CR report-
ing.
3.2 Motives for Corporate Responsibility Reporting
Being a responsible corporate citizen and conducting CR reporting have multiple
benefits which contribute the financial value of the company either directly or indi-
rectly. In addition to legislation, the motive for responsible operation is normally
increasing the profitability. That can be best achieved by focusing on all the three
dimensions of responsibility simultaneously and considering stakeholders’ views.
As a result of CR, the company can make economic savings that save environment
at the same time, for instance, by increasing materiality efficiency, enhancing ma-
terial usage and cutting business trips. Savings can turn out to be enormous in a
long term, especially if future legislation is considered in the development. By pre-
dicting new legislations, the company can avoid letting laws to limit the operations
or having extra expenses because of repair investments. /12, 6/
Further, investing in social responsibility brings the company great benefits. Paying
carefully attention to occupational health and safety reduces the number of absences
21
which in return diminishes expenses and improves productivity. Additionally, in-
vesting in comfort and education as well as ensuring opportunities for proceeding
in careers increases the motivation of employees resulting in more efficient work-
ing. /12/
Legislators hold a great power in changes of CR by adjusting the wanted minimum
level of it for corporations. They aim at both encouraging and pressuring companies
to act a more responsible way by tightening laws. New legislation might have neg-
ative impacts on the company if it has not prepared for the changes. Therefore, new
legislation might add expenses, limit operations of the company or even forbid an
important sector of its functions. For instance, for a company producing pesticides,
a prohibition of certain chemical could lead to a shutdown of its operations if they
had not prepared and come up with a substitutive chemical in time. The fulfillment
of the law is supervised so ignoring the law causes punishments, either financial or
restrictions for operations. In addition, the increase in demand and having a com-
petitive advantage, preparing for changes in legislation helps the company to gain
valuable experience and resources while other corporations are still learning how
to integrate the changes as part of their functions. /6, 12, 17/
Stakeholders are an important part of the company’s operations and their expecta-
tions must be met to keep the business successful. CR reporting is a good way to
communicate with stakeholders. The company does not have to respond inquiries
separately from each stakeholder, but it can gather all the relevant information in
the CR report and the information is available for all the stakeholders which makes
the communication about responsibility issues more efficient. Moreover, CR re-
porting shows stakeholders the transparency of actions and contribute the good rep-
utation of the company. /8, 17/ Communication with stakeholders helps the com-
pany to enhance its management performance, facilitate identifying and managing
risks as well as perceiving opportunities /12/.
Close interaction with stakeholders offers other benefits as well. By listening to
stakeholders’ views, companies may notice changes in attitudes and habits very
sensibly and use those changes as opportunities /4/. Identifying these global mega-
22
trends in an early phase is important since it gives information of possible changes
in demand. One of the biggest megatrends of today is demand for more environ-
mental and ethical products. The sooner companies recognize the change in de-
mand, the sooner they can develop products to cover the new demand and thus
establish their market position. This way companies can create added value because
they increase their profits while contributing the environment and satisfying expec-
tations of their stakeholders. /12/
Altogether, improving and maintaining a good reputation is one of the main benefits
of CR reporting for the company. The good reputation increases the trust of con-
sumers which can be seen from the growth of sales. That in turn makes the company
more economically stable improving trust and satisfaction of investors. All in all,
by conducting CR reporting, the company can show its stakeholders their commit-
ment in different dimensions of responsibility and stakeholders can see that com-
pany’s functions are justified. /9/
23
4 GLOBAL REPORTING INITIATIVE
The Global Reporting Initiative is a non–governmental organization (NGO) which
was founded by the United Nations Environmental Program (UNEP) and the Coa-
lition for Environmentally Responsible Economies (CERES) in 1997 /6/. The or-
ganization is based in Amsterdam and it includes board of directors, stakeholder
council, technical specialist committee and secretariat. Prerequisites for the opera-
tions are organizational stakeholders that pay membership fees to GRI and in return
they get materials and services to facilitate their CR reporting. /10/
GRI has worked hard to create framework for reporting, and it has quickly estab-
lished its position as a guideline for reporting. Cooperation with the most important
stakeholders, such as investors, consumers, authorities, NGOs and trade unions,
made possible the successful creation of guidelines. /8/ That has enabled getting a
wide picture of all the necessary performance indicators and ways to measure them.
The goal is that all the companies could apply it regardless the location, size or
branch of activity of the company. The GRI Sustainability Reporting Guidelines
are not perfect yet for that purpose and, therefore, they are continuously updated
and specified. The fourth edition of the Guidelines, known also as G4 Guidelines,
were superseded by the GRI Standards in 2016. GRI includes Sector Supplements
because of the special and complicated nature of certain sectors. The Sector Sup-
plements have been created for fields, such as oil and gas industry, finance sector,
electricity companies as well as for mining and metal industries to facilitate their
reporting. /6, 12/
4.1 Guiding Principles And Contracts
One of the most important edicts that has influenced founding GRI is the Universal
Declaration of Human Rights by UN. The declaration emphasizes equality regard-
less of race, religion, nationality, sex, language, nationality, or any other reason.
Human rights guarantee the same rights for everyone over country borders and the
rights cannot be taken away from anyone regardless of the situation. /18/ The Uni-
versal Declaration of Human Rights has been the foundation for human right con-
tracts concerning certain groups, such as women and children. In firsthand states
24
are responsible for supervising that the rights are fully implemented, whereas com-
panies are responsible for ensuring the rights are respected in all their activities.
When thinking about CR, the company must consider the sphere of its influence, in
other words, whether it is sufficient to make sure human rights are applied in inter-
nal operations of the company or if it should ensure for instance that human rights
are fulfilled in the local society as well. /8/
In addition to human rights, there are several other edicts and contracts that influ-
ence companies and so they must be considered also in CR. These kinds of contracts
are related to, for instance, working life, environment and responsible business. In
Europe, the EU has made statements, frameworks and guidelines that guide com-
panies for more responsible behavior. /8/
The International Labour Organization (ILO) has enacted contracts focusing on the
fundamental rights of working life. According to them, one of the most relevant
rights in working life are freedom to organize as well as the ban of forced and child
labour. The organization has also made several contracts related to wages, working
hours, occupational health and safety as well as the end of an employment that are
important from the corporate responsibility point of view. /19/
The UN has improved the state of environment and sustainable development with
different contracts and conferences. The most significant of them have been a con-
ference on environment and development in Rio de Janeiro in 1992 and the follow-
up conferences in Johannesburg in 2002 and again in Rio de Janeiro in 2012. These
conferences covered issues, such as sustainable development, eradication of pov-
erty, advance protection of nature, changing consuming and production habits as
well as action plans for each issue. /20–22/ It was also denoted that companies have
to contribute for their part the creation of sustainable societies and act responsibly.
Based on the conference held in 1990s, the UN published the Millennium Devel-
opment Goals that were signed by every member country. These goals act as inter-
national rules giving clear and common targets for societies. /8/
Besides the UN and the ILO, the Organization for Economic Cooperation and De-
velopment (OECD) has been an important influence for the development of CR as
25
it is today. The OECD concentrates on improving economic growth of its member
countries, living standards, sustainability and international trade. The OECD has
created voluntary guidelines for multinational companies so that they can adjust
and guide their actions so that they fulfill the expectations of the society. In the
center of the guidelines are, for example, environmental protection, prevention of
corruption, relation in working life, responsible supply chain, consumer protection
and taxation. /23/
In addition, the EU has published multiple statements about CR where it encourages
the member countries to report about social and environmental responsibilities
along with economic reporting and to confirm reports by third party /8/. Also, the
decision to change CR reporting mandatory was originally based on reports and
statements of the European parliament. The EU is an important leader in the field
of corporation responsibility, and several countries and organizations follow their
voluntarily guidelines as well. /8/
4.2 Contents of Global Reporting Initiative Standards
The GRI Guidelines had four editions before the newest version, the GRI Standards,
was released. The base of the GRI Standards contains three universal standards that
are used by all the corporations that conduct CR reporting. First of the universal
standards is called the Foundation, which guides how to use and reference standards
while introducing the reporting principles and explaining how to create a report that
is in accordance with the GRI Standards. The other universal standards are General
Disclosures and Management Approach /6/
Moreover, there are three Topic Specific Standards that cover areas of economic,
social and environmental performance. From these standards the organization needs
to choose the most relevant standards. The General Disclosures and Management
Approach are applied when reporting about the Topic Specific Standards. They are
used together with the Topic Specific Standards to report contextual information
about the corporation and its reporting practices as well as explain why the topic is
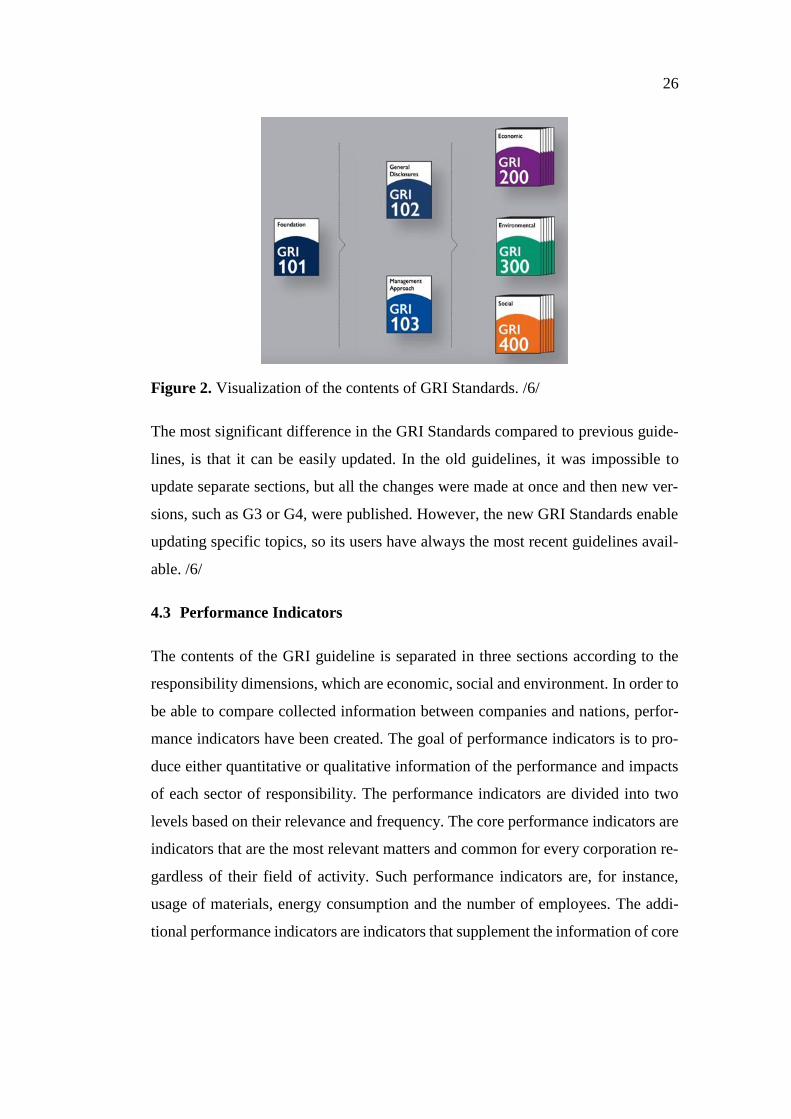
material, how it is managed and where the impacts occur. /6/ Figure 2 illustrates the
contents of standards and their hierarchy.
26
Figure 2. Visualization of the contents of GRI Standards. /6/
The most significant difference in the GRI Standards compared to previous guide-
lines, is that it can be easily updated. In the old guidelines, it was impossible to
update separate sections, but all the changes were made at once and then new ver-
sions, such as G3 or G4, were published. However, the new GRI Standards enable
updating specific topics, so its users have always the most recent guidelines avail-
able. /6/
4.3 Performance Indicators
The contents of the GRI guideline is separated in three sections according to the
responsibility dimensions, which are economic, social and environment. In order to
be able to compare collected information between companies and nations, perfor-
mance indicators have been created. The goal of performance indicators is to pro-
duce either quantitative or qualitative information of the performance and impacts
of each sector of responsibility. The performance indicators are divided into two
levels based on their relevance and frequency. The core performance indicators are
indicators that are the most relevant matters and common for every corporation re-
gardless of their field of activity. Such performance indicators are, for instance,
usage of materials, energy consumption and the number of employees. The addi-
tional performance indicators are indicators that supplement the information of core
27
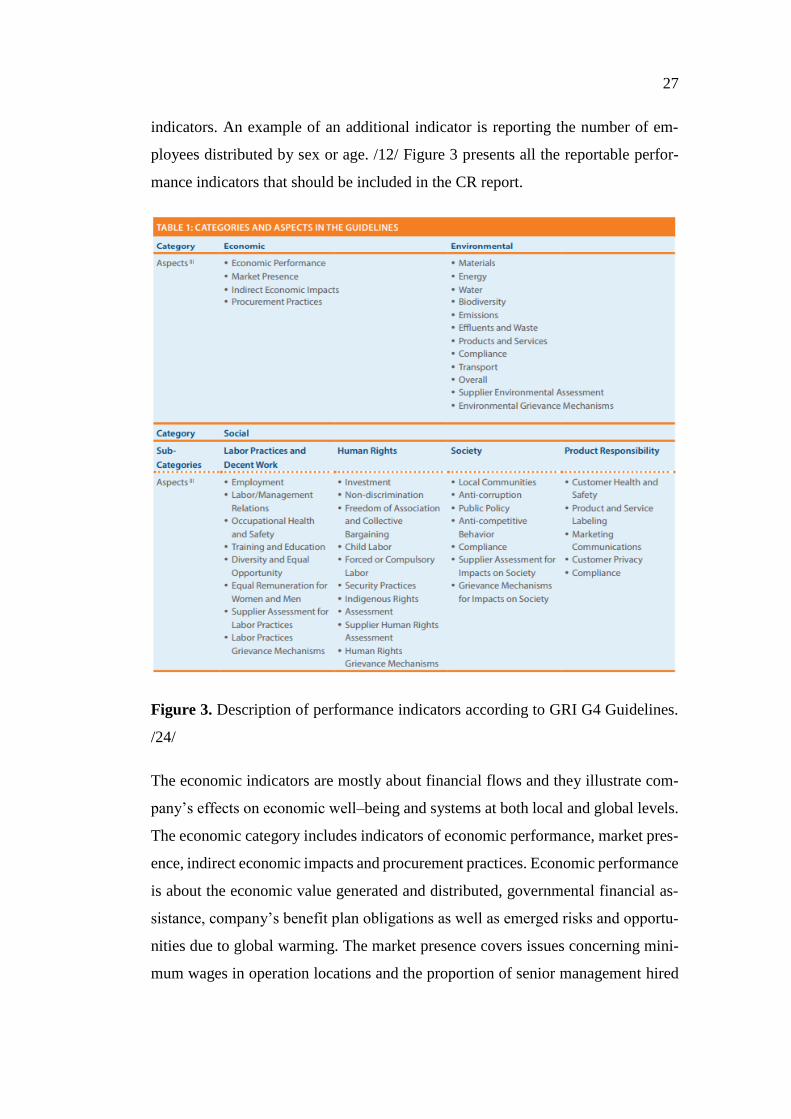
indicators. An example of an additional indicator is reporting the number of em-
ployees distributed by sex or age. /12/ Figure 3 presents all the reportable perfor-
mance indicators that should be included in the CR report.
Figure 3. Description of performance indicators according to GRI G4 Guidelines.
/24/
The economic indicators are mostly about financial flows and they illustrate com-
pany’s effects on economic well–being and systems at both local and global levels.
The economic category includes indicators of economic performance, market pres-
ence, indirect economic impacts and procurement practices. Economic performance
is about the economic value generated and distributed, governmental financial as-
sistance, company’s benefit plan obligations as well as emerged risks and opportu-
nities due to global warming. The market presence covers issues concerning mini-
mum wages in operation locations and the proportion of senior management hired

28
from the local community. In the category of indirect economic impacts, infrastruc-
ture investments and supported services are included, as well as significant indirect
economic impacts of the company. Procurement practices require explanation of
the proportion company spends on local suppliers. /24/
The base of environmental performance indicators is identifying material flows and
categorizing them into efforts and outcomes as well as into their environmental im-
pacts. Efforts represent indicators, such as use of materials, water and energy while
outcome indicators cover waste and effluent emissions and other pollutants. In ad-
dition, there are indicators related to compliance of environmental laws, biodiver-
sity, impacts of transportation and environmental assessment of suppliers. It is im-
portant that environmental indicators are reported both in absolute and relative fig-
ures. The absolute figures are reported to be able to better evaluate the scope of
impacts and actions to certain ecosystems and carrying capacities. Relatively re-
ported information is necessary to see better the efficiency of the company since
that facilitates comparisons between companies. /8, 12, 24/ The development pro-
ject of the thesis is related to material performance indicator, and it is explored later
more closely.
The performance indicators of social responsibility are both quantitative and quali-
tative, and they are separated into four categories. These groups are labour practices
and decent work, human rights, society and product responsibility. Most of these
indicators are based on international contracts and guidelines, such as declaration
of human rights by the UN, working life rights by the ILO and guidelines about
corruption and fair trade by the OECD. /12/
Indicators related to labour practices and decent work are, for instance, employ-
ment, occupational health and safety, training and education as well as equal remu-
neration for women and men. Human rights indicators cover issues, such as child
and forced labour, non-discrimination, supplier human rights and security practices.
Society indicators, in other words company’s impacts on surrounding societies, are
measure matters, such as anti-corruption, anti-competitive behavior, compliance of
laws and grievance mechanisms for impacts on society. The purpose of product
29
responsibility indicators is to measure customer health and safety, product and ser-
vice labelling, customer privacy, compliance of laws and marketing communica-
tions. /24/
4.4 Creating a Corporate Responsibility Report
The newest edition of the GRI guidelines, G4, forms a comprehensive tool together
with calculus guides and sector supplements for creating a CR report. Before creat-
ing the report itself, the company needs to decide which issues are the most im-
portant to be included in the report. Materiality analysis made by stakeholder play
a great role in defining the key issues. Based on these issues, the decision–making
can be controlled to benefit performance indicators and reporting customs. /8/
The process of defining the reporting contents consists of different phases. First,
internal and external economic, social and environmental issues that are significant
for the company’s operations, must be identified. The process proceeds by estimat-
ing the relevance of each issue for the company and its stakeholders. When priori-
tizing the issues, it is necessary to decide the sufficient number of indicators as well
as the wanted reporting accuracy. The next step is to validate the chosen reporting
principles, which help to make sure that the report gives a sufficiently balanced
picture of company’s functions and responsibility. The management of the com-
pany has to accept reporting principles, after which sufficient systems and processes
must be implemented or developed in order to collect all the necessary information.
The last thing is to re–evaluate the significance and relevance of the principles used
in the previous CR report. The evaluation includes ensuring the context of sustain-
ability, in other words, putting actions into wider perspective of sustainable devel-
opment. Additionally, the company must evaluate the importance of the principles
for stakeholders, as well as, consider how the expectations and needs of them have
been taken into account in the process. /8/
When reporting principles are chosen, principles for defining calculus entities
should be determined. That means defining the scope of reported performance in-
dicators. It can be juridical, operative or otherwise unambiguous function and it is
possible to collect and report economic, social and environmental information of

30
them. A calculus entity can be, for instance, all the business places of an industrial
company. Without defining these entities, collected information would not be usa-
ble and comparable. Practically, calculus entities should include entities that the
company has direct impacts on, whereas indirect impacts are not always necessary
to consider. /8, 24/
4.4.1 Application Scale
There are two levels from which the company can choose according to which one
they want to conduct their CR report. Despite the size, location or sector, any com-
pany can choose to apply either of the reporting levels. The focus in both options,
Core and Comprehensive, is to identify such material aspects that has significant
importance to the company and its impacts on economic, social and environmental
level. /24/
The Core option includes only the most important and relevant elements, so that the
information creates a background against which the company communicates the
impacts of social, economic and environmental performance. A comprehensive op-
tion is an extinction of the Core option and it requires more detailed information.
For the Core option only one disclosed indicator and the Generic Disclosure on
Management Approach (DMA) is required for each identified material Aspect. By
contrast, on top of the Generic DMA, in the Comprehensive option all material As-
pect–related indicators are required to report. /24/
4.4.2 Contents of the Report
The GRI guidelines include specifications both for contents and structure of the
report. The basic contents of the report is divided into two sections, General Stand-
ard Disclosures and Specific Standard Disclosures. The General Standard Disclo-
sures are meant for all the companies to apply regardless of the field of activity or
the size. It comprises strategy and analysis of the company, relevant performance
indicators with their calculus entities and descriptions of the organization, manage-
ment, stakeholder inclusiveness, report itself and ethicalness of the business. The
purpose of the General Standard Disclosures is to give a reader a comprehensive
31
picture of the factors that influenced the contents of the report, such as defining
relevant issues and expectations of stakeholders. /8, 24/
The Specific Standard Disclosures in turn aim at giving comparable information of
results and development of the issues belonging to CR reporting, as well as, illus-
trating management systems. It contains descriptions of the management’s practices
and social, economic and environmental performance indicators. Reporting princi-
ples that have been determined beforehand guide the accuracy and the scope of the
Specific Standard Disclosures. /8, 24/
When “in accordance” level has been decided and the needed General and Specific
Standard Closures are prepared, the creation of sustainability report can be started.
All the prepared information is to be presented in the report. The report can be pub-
lished as a web–based or a paper version, or as a combination of the two. The choice
can depend on, for example, plans for updating the contents and strategy for the
distribution of the report. Nonetheless, audience must have access to the complete
set of information via one medium, at least. /24/
4.4.3 Assurance of the Report
Since CR reporting is mandatory for large companies, the role of assuring the report
has grown bigger. The assurance of the report is not required in order to be in ac-
cordance with the GRI guidelines. However, the GRI recommends using an external
and independent party to assure the contents of the report. Creating a CR report is
company’s own responsibility so using an external assurance increases the reliabil-
ity of the report. Reliability is one of the most important qualities the report has,
since based on its information the management and stakeholders of the company
make decisions. Besides reliability, there are other benefits as well concerning the
external assurance. The company can ensure the functionality of their data collec-
tion, receive information of strengths and weaknesses in their CR reporting prac-
tices, as well as, the management gets information of how well policies and methods
are implemented in the organization. /9, 24/
32
The assurance of the report is not yet mandatory like reporting because organiza-
tions wanted to be provided with time to develop their reporting systems to corre-
spond the requirements of external reporting. CR reporting is a relatively new cus-
tom, so its practices are not yet internationally so established that assurance could
have been combined with it effortless. In addition, practices for the assurance are
still in a developing stage so there is not yet any common and settled way for doing
it. External assurances are normally conducted by accounting companies, certifica-
tion bodies and technical consultant organizations. /8/
4.5 Materials Performance Indicator
Material usage of the company is one of the most important matters to include in
the sustainability report. Material aspects are relevant because based on them it can
be indicated whether the company has a significant social, economic or environ-
mental impact on the society around it. /24/ This chapter presents the contents of
material performance indicator according to the GRI Guidelines conducted in the
client company.
Wärtsilä has an internal guide for CR reporting called Wärtsilä Manual which is
created based on the GRI G4 guidelines. It includes various questionnaires of dif-
ferent environmental aspects with specified questions to facilitate the data–collect-
ing process and reporting itself. Since the development work of the thesis is closely
related to the Materials questionnaire of the manual, it is on the spotlight in this
chapter. The tool that was improved in this thesis work is called Materials Used by
Weight and its purpose is to gather data based on the requirements of the Materials
questionnaire.
It is a part of the guidelines for environmental reporting for factory and instructs to
report the total weight of materials used in production and packaging of the primary
products and services of the company during the reporting period. The Materials
questionnaire is to be filled and reported quarterly and it consists of three sections
based on the usage purpose of the material. The groups are product– and process–
related materials as well as packaging materials. /25/
33
4.5.1 Product–related Materials
This section requires the reporting of all the materials consumed for the manufac-
turing of the products in each period. Included raw materials can be natural sources,
such as ores minerals and wood that are converted into product or services. Semi-
manufactured products or parts, including all forms of materials and components
other than raw materials that are part of the final products, are to be taken into ac-
count. Left–over materials, such as metal scrap that do not end up in the final prod-
uct itself are considered as well. All the used materials are categorized in the groups
of cast iron, steel, copper, aluminium, other metals, plastics and other. The total
amount of used mass in each category is reported in kilos or tons. /25/
4.5.2 Process–related Materials
Process-related materials consist of all the material consumption that does not end
up in the final product but is nevertheless used in the process. It includes also ma-
terials, such as sand, of which part will end up as waste. These materials are cate-
gorized into three groups; chemicals, sand and other. Chemicals include all the used
chemicals in the production, except diesel or kerosene that is used for cleaning com-
ponents since this information is reported in the Energy questionnaire. All the
chemicals are added up and reported in kilos or tons by the mass of their usage. /25/
4.5.3 Packaging Materials
The final section of the questionnaire comprises all the materials consumed in the
packaging processes. Materials are considered as packaging materials whether the
package is to be sent to a customer or components transported internally in the com-
pany. Material groups to report for packages are metals, plastics, fibre–based,
wooden and other. Each material category is reported by the weight of them in kilos.
/25/
34
5 RINKI
This chapter discusses the RINKI–organization briefly and the way it is related to
the development project. Finnish Packaging Recycling RINKI Ltd was founded in
1997 and is owned by Finnish industry and retail trade. It is a non–profit organiza-
tion and according to RINKI it offers an easy and efficient way for its customers to
implement producer responsibility. In addition, they provide consumers with wide
network of the collection of packaging and recycling of glass packaging waste. /5/
RINKI reporting was relevant to include in the thesis because the tool being develop
in the thesis is used also when gathering data of used packaging materials in the
company.
5.1 Producer Responsibility
Companies are bound by law to producer responsibility. Producer responsibility
concerns companies that pack their products in Finland and import packed products
to Finland, and companies whose turnover is at least one million euros. The purpose
of the producer responsibility is to prevent the creation of packaging waste and in-
crease the reuse and recycling of them so that harms for the environment are mini-
mized. /27/
Organizations have three options how to perform producer responsibility in their
business. They can either take care of it by themselves and join the producer register
of Pirkanmaa ELY Centre or they can establish their own producer organization
with other producers. When applying to the producer register, the company needs
to find out how it is going to arrange the waste management by its own expense and
make sure it complies with recycling requirements. /26, 27/
Alternatively, corporations can join an existing producer organization, which means
they transfer their producer responsibility to the organization. There are six pro-
ducer organizations for packages in Finland which all have a common service com-
pany, Finnish Packaging Recycling RINKI Ltd. Information about used packages
are reported to Pirkanmaa ELY Centre once a year by both producers that applied
to the producer register and producer organizations, which are doing the reporting
35
for their client companies. If the producer responsibility obligation is neglected,
there will be penalty fees for companies to pay /26/
5.2 RINKI–reporting
When companies buy services from RINKI, they make a contract with it to transfer
the producer responsibility to RINKI. In turn RINKI states it carries out the pack-
aging management for them cost-efficiently. This arrangement has led to an out-
come where almost all the packaging in Finland is recycled. RINKI has already
over 4000 companies as customers. /5/
The organization states that buying its services makes carrying out producer respon-
sibility easy and effortless for companies so that they can concentrate on the busi-
ness itself. It makes the collection of packaging waste and its recycling cheaper for
companies, compared to if they should arrange everything by themselves. Packag-
ing data is reported just once a year to authorities, so it is does not require too much
effort from companies. In addition, according to RINKI being part of it shows com-
panies’ stakeholders that they are responsible which contributes their reputations.
/5/
Organizations need to report to RINKI all the packaging materials they use in their
operations. Materials are categorized as plastic, metal, glass, wood, paper fibres and
others. For each category, there are sub–categories that specify the nature of the
material as well as whether it ended up to consumer or to companies. The amount
of used plastic bags or wooden euro pallets in tons are examples of sub–categories
that are to be reported. In addition, from each category it is necessary to report how
many tons was imported, exported, used in markets in Finland and reused as pack-
ages in Finland. /5/
The client organization of this thesis utilizes the information of the tool, Materials
Used by Weight, also as a part of RINKI–reporting, and therefore it was decided to
be improved in the same project. The accuracy of the RINKI–report needed to be
enhanced and ensured because charging customs of RINKI changed in the begin-
36
ning of 2018. Previously RINKI billed customers based on the size of their busi-
nesses, so the bigger the annual turnover the bigger the invoice was. In some cases,
successful companies may use relatively small amount of packaging, for instance
if they focus also on providing services. To offer more justified billing system,
RINKI decided to bill its customers based on the amount they use packaging mate-
rial in their operations. Therefore, it is important for the client company to make
sure they report the right amount of used packaging materials, and it was the area
of RINKI–reporting that needed improving. It would not be economic for the com-
pany if the actual amount was much less than what they report. /5/ In addition,
RINKI starts performing auditing in client companies, so it is important that re-
ported amounts are based on justified knowledge /27/.
37
6 WÄRTSILÄ AND CORPORATE RESPONSIBILITY
The thesis work was ordered by a client company, Wärtsilä Finland Oy, which is
one of the leading companies in the energy and marine markets providing its cus-
tomers with complete life-cycle solutions. Wärtsilä was established in 1834 and
today it operates in over 80 countries employing more than 18 000 employees. In
the previous year, 2017, their net sales were in total 4.9 billion euros. They want to
provide their customers with maximized value by means of improving the environ-
mental and economic performance of their products and services. /2/
The company’s business is divided into three different area which are Energy So-
lutions, Marine Solutions and Services. The purpose of Energy Solutions is to offer
combustion–based power plants, energy storage systems, utility-scale photovoltaic
(PV) power plants and liquefied natural gas (LNG) terminals that support flexibility
and stability. In Marine Solutions they want to increase their customer’s efficiency
in marina and oil and gas industry with safe and innovative technologies that are
customized to meet customer’s exact needs. As for Services, it offers customers
life-cycle services all over the world in order to ensure required performance and
maximized lifetime of engines. /2/
Wärtsilä defines its purpose as enabling sustainable societies with smart technol-
ogy. Sustainability is one of the key drivers when environmental, economic and
social impacts are carefully considered in everything they do. They are committed
to operate in a responsible way in communities they influence and to give back to
those communities. They build their excellence upon smart technology that aims at
creating innovative and energy efficient solutions with optimized lifecycles. /28/
6.1 Sustainability in Wärtsilä
Sustainability has been the focus of significant attention in Wärtsilä in recent years.
It has been divided into economic, environmental and social dimensions. Economic
dimension concentrates on being profitable and contributing the well-being of so-
ciety, and thus fulfilling its responsibility for stakeholders. Based on good economic
38
performance, the company is able to implement responsible behaviour to other sec-
tions as well. Environmental dimension covers Wärtsilä’s responsibility as provid-
ing environmental solutions for its customers and proper environmental manage-
ment concerning its operations. Responsible business conduct acts as the base of
social responsibility. /28/
There are several internal and external factors guiding for sustainable behavior in
the company. Wärtsilä Code of Conduct is the very base for their internal sustaina-
bility principles. Both employees and business partners are expected to follow these
principles and implement them in their actions. Implementation of the principles is
strengthened with supporting policies and e-learning material which is compulsory
for every employee. Additionally, Wärtsilä has created its own sustainability strat-
egy as well as Quality, Health, Safety and Environmental (QHSE) policy and man-
agement system that it is following. Furthermore, the company is committed to fol-
low the UN Global Compact and its responsibility principles. Wärtsilä Finland Oy
has certified management systems ISO 9001, ISO 14001 and OHSAS 18001 for
verifying the proper management of quality, environment and occupational health
and safety within the company. /28/
Like other companies, also Wärtsilä is bound to comply with external requirements
for sustainability. Legislation is the priority because otherwise the company could
lose its licence to operate. Requirements from investors and customers are im-
portant to take into account since based on them the organization can determine the
direction for its operations. In addition, non–governmental organizations and other
stakeholders such as media has impact on the way the company makes decisions.
Strong sustainability driven development has led to many clean innovations in
Wärtsilä. For example, their dual fuel engine improves energy efficiency while
Controllable Pitch Propeller reduces exhaust emissions. Their newest engine type
W31 is labelled as the most efficient 4-stroke engine in the world which offers the
best fuel economy of the engines in its class. Also, their system for zero flaring
enables recovery of gas and has cut CO2 and NOx emissions substantially around
39
the globe. /28/ Earlier this year, 2018, Wärtsilä received recognition for its invest-
ment in sustainability as it was listed among the hundred most sustainable large
corporations in the world /3/.
Implementing corporate responsibility in operations has been a strategic move for
Wärtsilä and has created them several advantages. Instead of seeing the dimensions
of sustainability as burdens and threats, they also saw opportunities in them. There-
fore, the company aims at improving the environmental performance of its products
and services constantly and maintain its technological leadership by using new tech-
nologies and collaborating with customers and stakeholders. This way the organi-
zation helps their customers to comply with environmental regulations and guide-
lines which are getting tighter all the time. /28/
Environmental aspect is taken into account both in products and operations itself.
In product performance the aim is to improve efficiency, operational lifetime and
material selection, reduce emissions and the amount of waste and to consider the
whole lifecycle of the product. This way it is possible to reduce the environmental
impact of the product and create value for customers while making more profit for
the company. Operational performance focuses on improving material and energy
efficiency as well as waste and chemical management in all its actions. On top of
that, complying with legislation, product certificates and environmental monitoring
are the very base of improving the environmental efficiency of the operations. This
kind of environmental management allows adjusting operations so that they are al-
ways a few steps ahead of tightening legislations, which is good for the reputation
and saves money. /28, 29/
Economic aspect is the traditional way of evaluating company’s performance, and
it is important especially for stakeholders, such as investors, creditors, employees
and shareholders. Sustainability strategy has strengthened Wärtsilä’s reputation as
a responsible corporate citizen, employee and partner, which attracts more custom-
ers and leads to savings, and therefore improves profitability. In addition, sustaina-
40
ble approach has created them a competitive edge over their rivals. Therefore, sus-
tainability strategy plays an important role in the company guiding the decision-
making process. /29/
6.2 Corporate Responsibility Reporting in Wärtsilä
Reporting practices are very established in Wärtsilä due to the long tradition of re-
porting. Their first report was published in 2000 and it was named as Environmental
report 2000. Since then reporting has settled in the customs of the organization,
even though the report changed its name first to Wärtsilä Sustainability Report and
in 2006 it was integrated with Wärtsilä Annual Report. The report includes the par-
ent company and all the 32 subsidiaries, as well as manufacturing, service and sales
units of each company. /29/
The report is based on the data collected in different methods throughout the year,
in every quarter. Each Wärtsilä company is required to fill detailed questionnaires
and based on the answers, data for the performance of the environmental and social
dimensions of sustainability are collected. The data of economic performance is
mostly collected from audited financial accounts. In addition, information is col-
lected from key stakeholders, such as investors, customers, personnel and local so-
cieties with questionnaires which help Wärtsilä to identify the importance of differ-
ent sustainability topics. Overall, material topics are considered to be the most crit-
ical ones in Wärtsilä from the sustainability aspect, since their products have impact
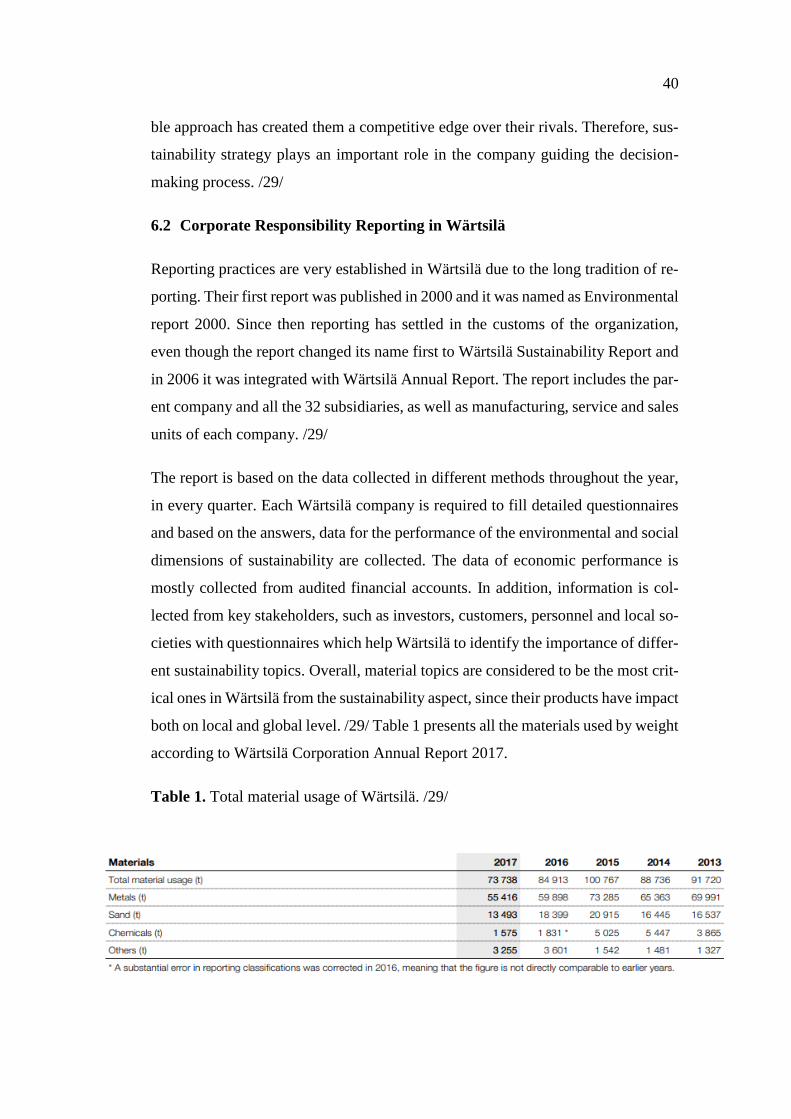
both on local and global level. /29/ Table 1 presents all the materials used by weight
according to Wärtsilä Corporation Annual Report 2017.
Table 1. Total material usage of Wärtsilä. /29/

41
The Sustainability Report includes a wide range of information. Therefore, every
Wärtsilä company has nominated an individual whose responsibility is to make sure
that the collection and consolidation of the data is of good quality and reliable.
Wärtsilä has specific guidelines for internal reporting and the Eurostat gives in-
structions for environmental expense and investment reporting, which help persons
in charge of the reporting. All the collected data is reported internally frequently
once a quarter, whereas the Corporate Sustainability report is published once a year.
The collected data has to be approved first by the management of each Wärtsilä
company, after which it is confirmed at the Group level. Last, Wärtsilä’s Board of
Management approves the contents of the Sustainability Report and it can be pub-
lished. /29/
The Sustainability Report is conducted according to the GRI Standards and the Re-
porting Principles for Defining report contents. The scope of GRI that Wärtsilä uses
in reporting is Comprehensive, which is the wider option of the two. That is why,
the report includes all the General Disclosures of the GRI Standards framework, as
well as the sustainability topics that have been identified based on the materiality
utilization in the company. /29/
As mentioned before, the sustainability report needs to be reliable so that it can
create value to the company and its stakeholders. Therefore, Wärtsilä uses a third-
party, PricewaterhouseCoopers Oy, to independently assess if the contents and
quality correspond the GRI principles. In practice PricewaterhouseCoopers Oy con-
ducts the assurance by assessing the data management and process on a local level
together with an assessment of collected data being relevant and reliable. For esti-
mating how well the reporting guidelines are understood and applied in the organi-
zation, site visits and videoconferences have been executed. /29/
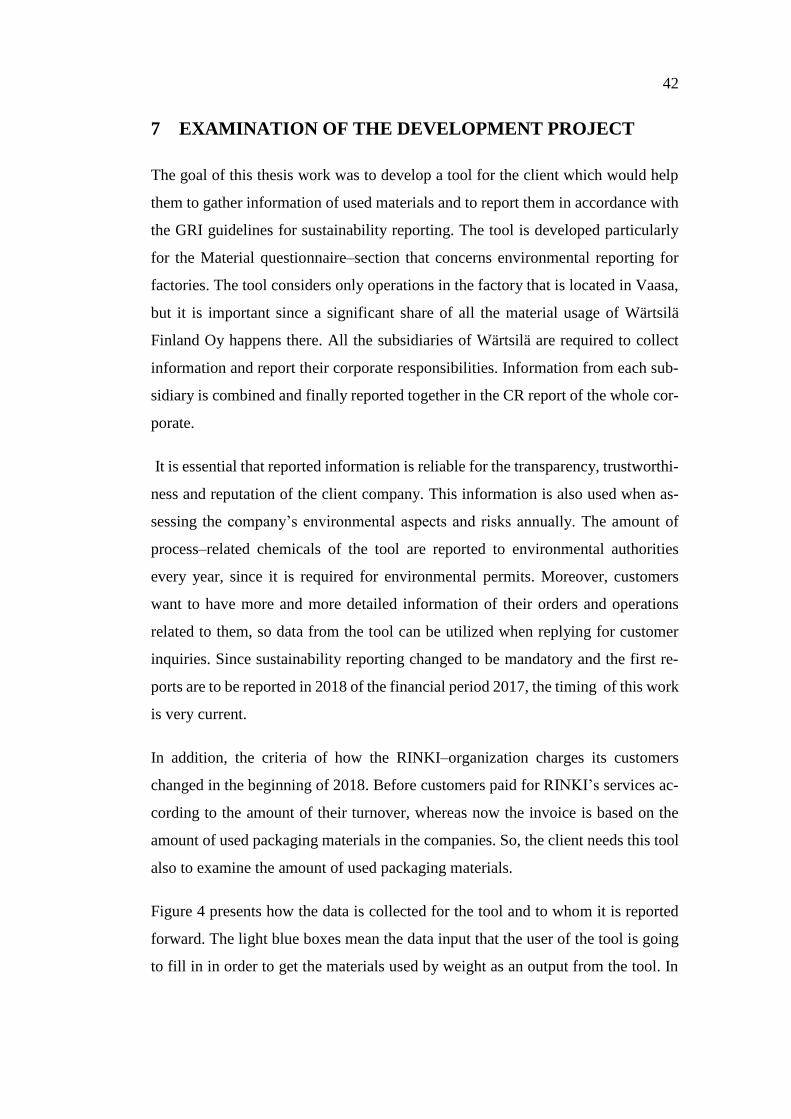
42
7 EXAMINATION OF THE DEVELOPMENT PROJECT
The goal of this thesis work was to develop a tool for the client which would help
them to gather information of used materials and to report them in accordance with
the GRI guidelines for sustainability reporting. The tool is developed particularly
for the Material questionnaire–section that concerns environmental reporting for
factories. The tool considers only operations in the factory that is located in Vaasa,
but it is important since a significant share of all the material usage of Wärtsilä
Finland Oy happens there. All the subsidiaries of Wärtsilä are required to collect
information and report their corporate responsibilities. Information from each sub-
sidiary is combined and finally reported together in the CR report of the whole cor-
porate.
It is essential that reported information is reliable for the transparency, trustworthi-
ness and reputation of the client company. This information is also used when as-
sessing the company’s environmental aspects and risks annually. The amount of
process–related chemicals of the tool are reported to environmental authorities
every year, since it is required for environmental permits. Moreover, customers
want to have more and more detailed information of their orders and operations
related to them, so data from the tool can be utilized when replying for customer
inquiries. Since sustainability reporting changed to be mandatory and the first re-
ports are to be reported in 2018 of the financial period 2017, the timing of this work
is very current.
In addition, the criteria of how the RINKI–organization charges its customers
changed in the beginning of 2018. Before customers paid for RINKI’s services ac-
cording to the amount of their turnover, whereas now the invoice is based on the
amount of used packaging materials in the companies. So, the client needs this tool
also to examine the amount of used packaging materials.
Figure 4 presents how the data is collected for the tool and to whom it is reported
forward. The light blue boxes mean the data input that the user of the tool is going
to fill in in order to get the materials used by weight as an output from the tool. In
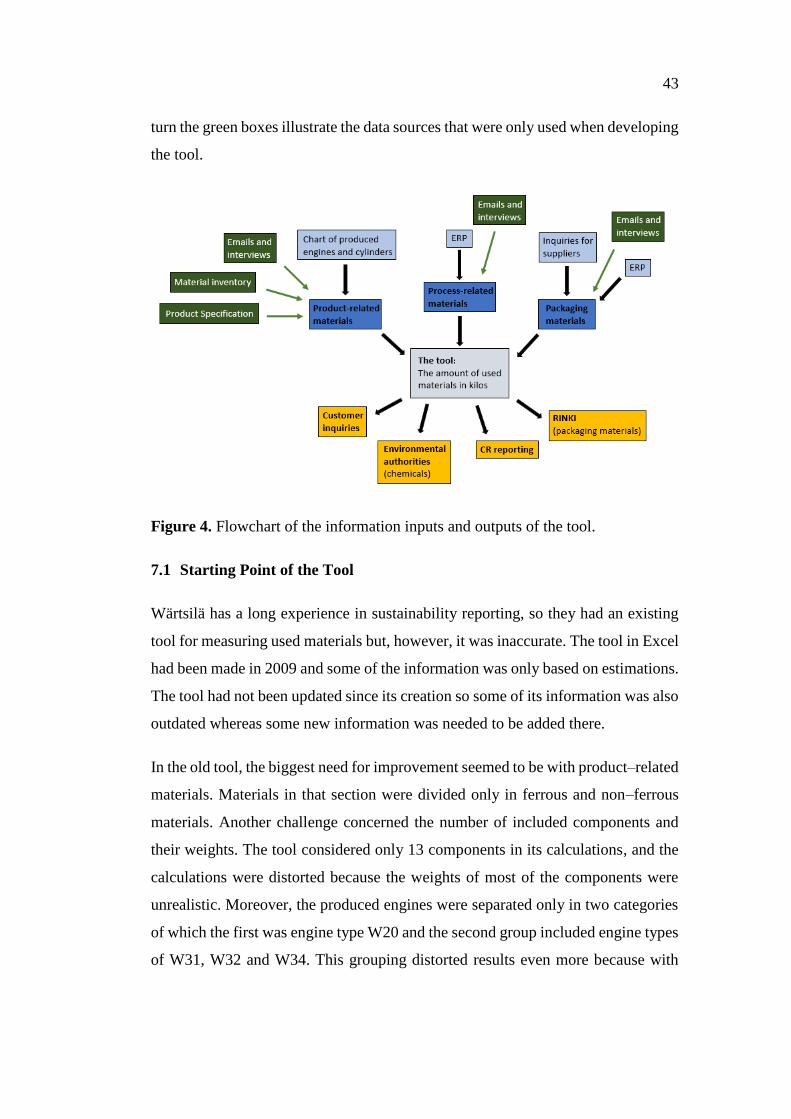
43
turn the green boxes illustrate the data sources that were only used when developing
the tool.
Figure 4. Flowchart of the information inputs and outputs of the tool.
7.1 Starting Point of the Tool
Wärtsilä has a long experience in sustainability reporting, so they had an existing
tool for measuring used materials but, however, it was inaccurate. The tool in Excel
had been made in 2009 and some of the information was only based on estimations.
The tool had not been updated since its creation so some of its information was also
outdated whereas some new information was needed to be added there.
In the old tool, the biggest need for improvement seemed to be with product–related
materials. Materials in that section were divided only in ferrous and non–ferrous
materials. Another challenge concerned the number of included components and
their weights. The tool considered only 13 components in its calculations, and the
calculations were distorted because the weights of most of the components were
unrealistic. Moreover, the produced engines were separated only in two categories
of which the first was engine type W20 and the second group included engine types
of W31, W32 and W34. This grouping distorted results even more because with
44
some components there is a substantial difference in the weights of W31 engines
compared to W32 and W34 engines.
Process-related materials consisted of chemicals utilized in the production of en-
gines. The old tool included VOC (volatile organic compounds) chemicals and two
other chemicals that were only mentioned by their vendor number. In the production
there are more chemicals in use than just those, so the tool missed for example fuels,
detergents and cutting fluids. Also, the chemical–section of the old tool was very
confusing since chemicals were not mentioned by their exact name and therefore
this section needed more clarification.
Packaging-related materials was the part of the Materials questionnaire that needed
the least correction. However, it was important to ensure if used materials were still
the same and coming from the same suppliers as before since that information had
not been updated in a while. The old tool did not report used metals in packages so
there was need for investigating if metals were used and if the amount was consid-
erable.
7.2 Execution of the Project
The project included several issues that needed to be taken into account. To make
it easier to start working on it, an execution plan was created, as seen in the Appen-
dix 1. The plan helped to identify separate phases of the work and acted as a guide-
line throughout the project. However, the plan did not include deadlines by which
a certain phase should be completed. That was because there was no tight schedule
for the work and some phases depended on other people in the company, for in-
stance answers for inquiries. The plan proved to be useful since it offered a way to
keep track of the progress and too see if all necessary steps had been taken.
Before starting the development project itself, a lot of information concerning sus-
tainability reporting and GRI reporting was gathered in order to fully understand
the concept in which the project was related to. The Wärtsilä Manual for GRI re-
porting includes instructions for the content that needs to be reported, so it was
45
examined carefully in order to have knowledge of the matters required in the devel-
opment project. Next, the old tool was handed over to the thesis worker and so its
evaluation started. Based on the evaluation, its defects and development areas were
charted and an execution plan was carried out. In addition, before beginning the
work itself, it was necessary to make sure that the thesis worker had all the needed
equipment and rights to the internal systems, in order to be able to implement the
plan without external disturbances.
The project started by focusing first on product–related materials, in other words
the components of engines. First of all, it is good to be aware of the expressions
W20, W31, W32 and W34 when talking about engines. This expresses the cylinder
bore of the engine in question, for instance the cylinder bore of the W20 engine is
200mm whereas it is 340mm in W34 engine. In addition, each engine type has sev-
eral models because the number of cylinders and fuel type varies in engines. In
normal cases, engines in the client company has 6–20 cylinders. The more cylinders
the engine has, the bigger it is and the more power it can produce. Engine types
based on used fuel are diesel and gas as well as gas diesel and dual fuel that can use
both gas and liquid as fuel. Different fuel types might cause deviations in the struc-
ture of engines and therefore the same components might be of various weights.
Therefore, depending on the type and size of engines, the weight of components
may vary significantly. Usually W20 engines are substantially lighter than the oth-
ers.
The limits of the development project needed to be marked before beginning to
examine the components. Wärtsilä produces a wide range of engine types, so going
through all of them was not possible in the timeline of this thesis work. It was agreed
with the client company that from each type of engine based on its cylinder bore,
the biggest and the smallest engines were to be chosen for the work. Then, the av-
erage weights of the components were to be calculated from these two chosen en-
gines. The engines that were chosen to be used in the work can be seen in the Table
2 below.
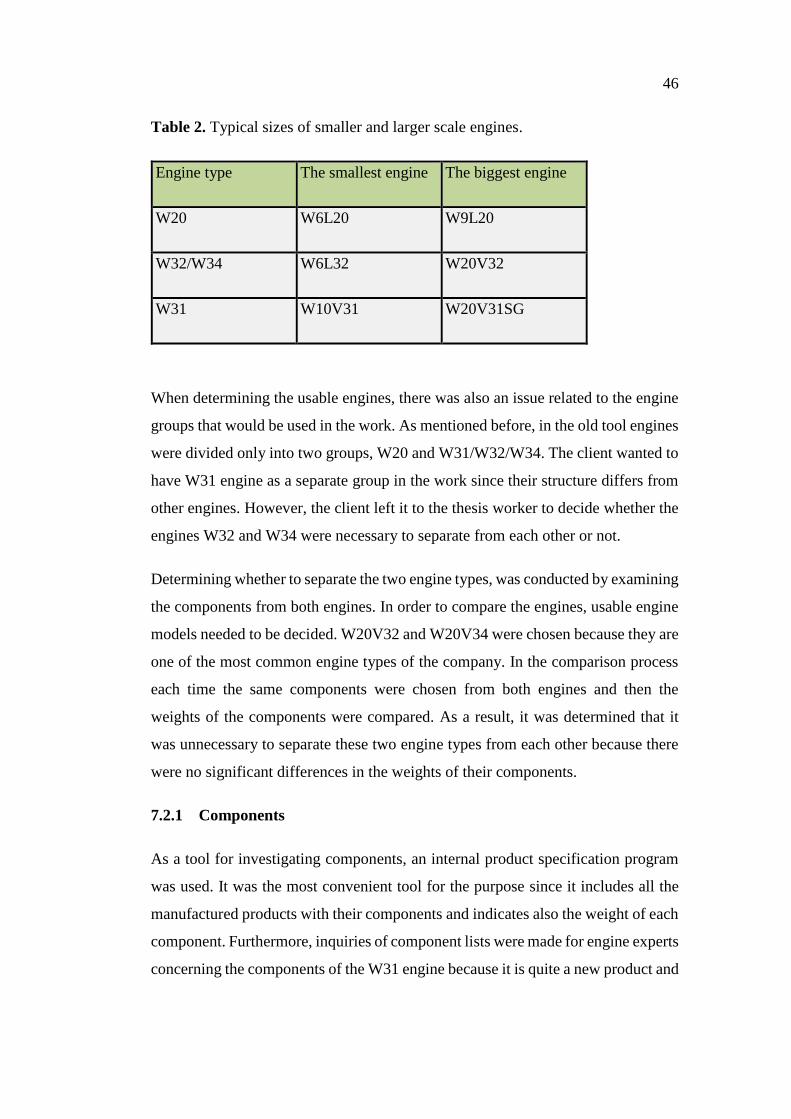
46
Table 2. Typical sizes of smaller and larger scale engines.
Engine type The smallest engine The biggest engine
W20 W6L20 W9L20
W32/W34 W6L32 W20V32
W31 W10V31 W20V31SG
When determining the usable engines, there was also an issue related to the engine
groups that would be used in the work. As mentioned before, in the old tool engines
were divided only into two groups, W20 and W31/W32/W34. The client wanted to
have W31 engine as a separate group in the work since their structure differs from
other engines. However, the client left it to the thesis worker to decide whether the
engines W32 and W34 were necessary to separate from each other or not.
Determining whether to separate the two engine types, was conducted by examining
the components from both engines. In order to compare the engines, usable engine
models needed to be decided. W20V32 and W20V34 were chosen because they are
one of the most common engine types of the company. In the comparison process
each time the same components were chosen from both engines and then the
weights of the components were compared. As a result, it was determined that it
was unnecessary to separate these two engine types from each other because there
were no significant differences in the weights of their components.
7.2.1 Components
As a tool for investigating components, an internal product specification program
was used. It was the most convenient tool for the purpose since it includes all the
manufactured products with their components and indicates also the weight of each
component. Furthermore, inquiries of component lists were made for engine experts
concerning the components of the W31 engine because it is quite a new product and
47
not many of them have been yet manufactured. Occasionally more detailed infor-
mation was needed of the components, in which cases meetings or Skype-calls took
place with engine experts.
The client’s requirement was to increase the accuracy so that the number of com-
ponents included in the calculations of the tool would be at least 20 instead of the
previous 13 components that were used. Determining the components for the tool
was started by going through all the components that were used in the old tool and
checked if they were relevant and if their weights were the same or needed correc-
tion. The components in the old tool were so called basic components, so they were
necessary to keep in the tool and use for the calculations. However, one component,
the controller, was removed from it because it was very light and therefore it did
not have a significant role in the reporting of weight of the materials.
When examining the weights of the remaining components, it turned out that there
were huge differences between the weights recorded in the old tool and the results
of investigation. For the W32/W34 engine type none of the weights were exactly
same as recorded previously and the smallest variation was 19 kg while the biggest
was 2336 kg. All in all, in 46 % of the old components the difference compared to
new ones was more than 200 kg. Half of the new weights were lighter than previ-
ously while the other half was heavier. Appendix 2 shows the difference in weights
of the components for the engine type W32/34.
For the W20 engine two components had the right weight in the old tool but, on the
other hand, the biggest variation between the weights was 4529 kg. In total 30% of
the components had a variation of at least 200 kg for the lighter or heavier direction.
The variation of the weights is illustrated in Appendix 2.
The next step was to start studying the product specification program and received
component lists in order to see which components were essential to add to the tool.
The W32/W34 engine group was first examined because it is one of the most com-
mon engine types and its components are substantially heavier than in the W20
engine, while the W31 engine has a partly different structure and requires special
attention. All the components of the previously determined lightest and heaviest
48
W32 engines were gone through one by one to see how heavy they are. For this
engine type the weight limit of a component was set to 200 kg while for the com-
ponents having one piece per cylinder the limit was set to 20 kg.
By these criteria, 13 components more were found for the tool and they were added
for each engine group. Actually, the number of included components is even higher
but for some components weights of two components were united to keep the tool
clearer, as well as if the other component was a supporting or connecting compo-
nent for the main component. Furthermore, structural differences caused some dif-
ficulties because not all the components are included in all the engines similarly.
Therefore, in the updated tool there is no weight for certain components. For in-
stance, the W32/W34 and W31 groups included charge air systems and a charge air
cooler separately while in the W20 engine the charge air cooler itself includes the
charge air system. In these kinds of situations, the help of specialists in the company
was needed. Then, all the new components were examined first for the W20 engine
and later for the W31 engine and their weights were added to the records. The com-
ponents were also divided into two groups, one group included components per
engine while the other one consisted components per cylinder.
When all the 25 components were defined and their weights were on the record, it
was time to find out the material of which each component was made. With most
of the components that was easy since the information was visible in the product
specification and they were made of only one material. Some components inquiries
to experts had to be made to have reliable information. Components such as gener-
ator, turbocharger and charge air system were more complicated because they con-
sist of several materials.
For solving this problem, the component list of W31 was used because it included
materials used for most of the components. The percentage value of each material
in a component was calculated and the same value was used for each engine group.
However, with the components that had no information of material distribution
available, estimations had to be made based on the component drawings and the
knowledge of the materials of different parts.
49
In addition to components, product–related materials include materials that do not
end up in the final products but are left–over. The company produces yearly a sig-
nificant amount of metal scrap as a by–product from its manufacturing. Therefore,
it was necessary to add created metal scrap in the tool to the total amount of cast
iron used. Information concerning the amount of metal scrap is filled in the tool
manually and it can be found in the waste reports of the factory.
7.2.2 Chemicals
Only chemicals are considered in the process-related materials since sand and other
materials are not used in the engine manufacturing process. The chemical section
of the Materials questionnaire needed to be updated and all the used chemicals had
to be added there. As the old tool had only two chemicals and VOC-chemicals in-
cluded it was necessary to increase the accuracy and reliability of the reported in-
formation. In the production process there are several other chemicals, such as fuels,
oils and detergents in use. Therefore, the most critical issue in this section was to
find out which the chemicals were used in the production.
An inquiry of the matter was sent to a person specialized in the chemicals used in
processes. It turned out that it was very easy to get all the needed information of
this issue. The answer for the inquiry was comprehensive and included all the nec-
essary information of the chemicals used.
The factory uses four different types of detergents for washing machines and four
types of cutting fluids. In addition, two lubricants are in use, one for gas engines
and one for diesel engines. Three types of corrosion inhibitors and four types of
defoaming agents were also used though their usage is not as frequent as the use of
other chemicals.
Fuels are also used in the production process, especially in the test run. Information
of the fuels used in Wärtsilä was drawn from an internal chart. The used fuels are
heavy fuel oil (HFO), light fuel oil (LFO) and liquefied natural gas (LNG). VOC–
chemicals remained as one element in the section like they were in the original tool.
50
7.2.3 Packaging Materials
Wärtsilä uses a lot of packaging materials for different purposes. The most common
packaging material is wood, which is used as boxes or pallets for transportation.
Cardboard is used in packages, for instance inside wooden boxes, to ensure that the
product inside will not get damaged during the transportation. Plastic packages are
mostly used for components that need a protection against corrosion. A small por-
tion of packaging materials include steel straps that can be used for holding com-
ponents of the package together.
The section of packaging material required the least attention of the three sections.
Basically, it needed to ensure that the old information was correct and see if there
were any changes in the materials used or in suppliers. For this purpose, a meeting
with a few employees from logistics was arranged.
The outcome of the meeting was that the same packages are still in use and they
come from the same suppliers as before. The packages are made of varied materials
such as plastic, fibre-based and wooden packages. Additionally, it was discovered
that metal is used as well for some packages, it needed to be reported and was added
to the tool.
Another observation, concerning RINKI–reporting, was that wooden pallets are
used much more in the company than it was estimated. Previously the company had
reported to RINKI that most of the pallets are exported with products to abroad, but
in the meeting, it was discovered that most of the pallets are reused in Finland and
products exported to abroad are packed in wooden boxes. This result gave a better
accuracy for the reporting of exported and reused packaging materials for RINKI.
7.2.4 Creating the Tool in Excel
When all the necessary information was gathered and modified in the proper form,
it was time to start building the tool in an Excel table. The old tool was rather inco-
herent so one of the most important requirements for the new tool was to make it
clear. In addition, the tool needed to be easy to use and have intelligible instructions.
51
Material–related information is reported once a quarter so four similar sheets were
created, one for each quarter. The fifth sheet is a summary sheet where all the in-
formation by each material from each quarter was summed up. This facilitates the
comparison of different quarters and distinguishes the periods when some materials
were used more than normally.
The product-related section in the Excel table included a lot of information and it
took the most time to make. As seen in Appendix 3, first all the components and
their materials were listed. Then the mass of that component was mentioned for
each engine group and next to them were left columns for the total mass of all the
produced engines. For components containing several materials, particular material
masses were calculated in the total mass column.
In the header of the table empty spaces were placed where the user is to fill the
number of manufactured engines and cylinders in the period. Based on that infor-
mation the table is programmed so that it will calculate the materials used in one
engine group as well as the total amount of material used for all the engines. Mate-
rials were categorized based on the GRI guidelines as follows ; cast iron, steel, cop-
per, aluminium, other metals, plastics and other.
The table for process–related materials, in other words for chemicals, was simple
to create. All the used chemicals were listed there and an empty space was left next
to each chemical which is to be filled with the information how much of it has been
used. First, there was a thought of creating a table that would search the information
automatically about the usage amounts. That information is found from the Enter-
prise Resource Planning (ERP) system and the information of different chemicals
is behind different authorization rights. Therefore, it turned out to be rather compli-
cated to have an automatized system for the chemicals table, so it was agreed that
the user would feed in the information there manually. The material numbers of
each chemical were added to the table to facilitate the user to find specific chemical
information from the ERP.
Packaging materials were as well gathered in a table in the Excel sheet. They were
categorized by the packages that are received from suppliers. In other words,
52
wooden boxes were one group, other wooden packages one, plastic goods had their
own group, plywood boxes and plywood board both had their own group and so on.
Packages come from two suppliers, so they were listed under the name of supplier
they come from to make it clearer. The information about used packaging materials
is fed manually to the tool because the information is available only by asking each
supplier separately to send the list of used materials by e–mail. When information
is fed to the table, it calculates how much metal, plastic, wooden and fibre–based
packages are used in the given period.
After the base of the tool was ready, it was given finishing touches by focusing on
the layout, appearance and functionality. Colours in headers make the table easier
to read. Also, to clarify the cells that are needed to be filled by oneself, are marked
by orange colour. In order the tool to be as easy and smooth as possible to use, it
needed instructions. The instructions guide the user to fill the right cells and to find
the information for the cells from right places to save time and energy. A few com-
ments were also added in the Excel concerning the component table. There were
empty cells left in the table since some engines did not have all the components.
The comments explain the reason they are empty in order to add transparency as
well as making it easier in the future to develop the tool when there is information
about each component.
7.3 Testing of the Tool
From the beginning it was estimated that the development project would have a
great impact on the quality of the information reported, especially about the prod-
uct–related materials. When the project proceeded, the difference could be seen
clearly since the information in the old tool was inadequate compared to updated
information. Information related to chemicals was evaluated to be improved also
relevantly because the scope of used chemicals was widened for the new tool. The
smallest difference was expected to be in the section concerning packaging materi-
als.
53
The end of the first quarter was met during the final stage of the thesis work, which
gave an idea of testing the tool in practise. That gave an opportunity to see differ-
ences and improvement of the tool in case correction and adjustments were needed
in the new tool. For the test, the same information input was fed in both tools from
the time frame between January and March.
7.3.1 The Section of Product–related Materials
The testing was started by feeding the tool product–related information of the pro-
duced engines and cylinders in the given time. The difference was significant since
the old tool contained only ferrous and non–ferrous materials while the new one
included also, aluminium, copper, other metals, plastics and others. The result
showed that the new tool was overall 37% more accurate when calculating the total
mass of used materials for the products. For the materials that were not included in
the old tool, the improvement of accuracy was 100%. For ferrous materials (cast
iron in the new tool) the change was 7% but unlike other materials, for this material
the amount of usage declined. Non–ferrous materials (steel in the new tool) in-
creased promptly by 94%.
The reason for the slight decrease in ferrous materials and the increase in non–fer-
rous materials can be easily explained when looking at the old tool. There the ma-
terials of all the components were marked as ferrous, and from that amount 3.85%
was decided to be reported as non–ferrous materials. There was no proof of that
amount being based on facts rather than on rough estimations. In reality the com-
pany has several components that are fully or partly made of steel and therefore the
weight difference between the tools was so huge.
7.3.2 The Section of Process–related Materials
The old tool in Excel included only VOC chemicals and two other chemicals that
were not mentioned by their product name. After adding the tool all the other fre-
quently used chemicals, the difference in the amounts of used chemicals increased
steeply. All in all, the amount of used chemicals became 250 times bigger than it
was in the original tool.
54
The matter that influenced the change in the amount of chemicals was the addition
of fuels to the tool. The use of fuels is outstanding and altogether it comprises
98.98% of all the chemicals used in the first quarter. The second most used chemi-
cals were VOC chemicals but compared to the use of fuels, the amount of them
were very small, only 0.45%. Lubricants formed 0.30% of all the chemicals, while
detergents were 0.12%. The most minimal categories were cutting fluids by 0.06%,
corrosion inhibitors by 0.06% and defoaming agents by 0.03% share. The section
of packaging materials was tested as well but there was no difference to the old tool.
That is because the steel strap was the only added category and its consumption is
so little that it is not ordered from suppliers every quarter.
55
8 CONCLUSIONS
The concepts of corporate responsibility and corporate responsibility reporting were
introduced in the beginning of the thesis so that the reader would get a wide under-
standing of them and their relation to GRI. Only then the importance of the devel-
opment project of the material performance tool could really be comprehended.
RINKI–reporting does not concern directly GRI, but it is a part of companies’ cor-
porate responsibility since the legislation obligates them to implement producer re-
sponsibility.
The world is in a critical period right now with ecological crisis, so more focus is
set on the companies and the way they conduct their businesses. It is not enough to
be successful company by making big profits, but today saving the environment
and natural resources as well as respecting human rights are factors that are part of
companies’ success. The transparency of the company is important for its stake-
holders, so CR reporting has become a must for companies in order to keep their
stakeholders content. Reporting according to the GRI Guidelines has facilitated
companies’ burden in the reporting process by helping them determining all the
relevant information that should be reported.
The original tool in Wärtsilä, which was used for material performance reporting,
was also created according to the reporting requirements set by GRI. The change in
legislation concerning CR reporting speeded up the need for updating the tool and
making sure the collected data was realistic. Also, the change in reporting require-
ments of RINKI–organization made it necessary to improve the tool.
There were a few limitations related to the development project of the thesis. The
biggest focus in the project was on product–related materials which required a lot
of research and consulting with employees. From the beginning it was clear that it
was impossible in the given time frame to make the tool 100% accurate, so the
wanted accuracy needed to be decided before starting. In the research phase diffi-
culties arose because different types of engines had different components or differ-
ent names were used for same components. When creating the chemicals–part of
56
the tool in Excel, authorization problems in the ERP caused a change in plans,
which limited the user friendliness of the tool a bit.
Despite the limitations, the improved tool turned out to be much better than the old
one. The biggest improvement was made in the product–related materials section,
since the accuracy of that section was increased by over one–third. Moreover, the
scope of used materials is wider and more realistic now, being based on carefully
examined information unlike it was before. Another significantly improved section
of the tool is process–related materials, in other words chemicals. It was surprising
how substantially the amount of chemicals grew after adding other chemicals be-
sides VOC chemicals, especially fuels. The smallest improvement could be seen in
the packaging materials section of the tool due to its good original information.
The improvement concerning the RINKI reporting was not significant since re-
ported packaging materials were the same as before, apart from steel straps that
were added to the tool. The most important matter to be done for the RINKI report-
ing was ensuring if the same packaging materials were used. However, a surprising
discovery was the use of wooden pallets. Most pallets are actually reused in Finland
rather than exported abroad, and that issue can be clarified in the next RINKI report
making it more precise.
It should be remarked that in the next CR reports the amount of all materials used,
and especially used metals and chemicals, are much higher than in the previous
reports. At first it might make stakeholders, including authorities, wonder why the
change is so great and if there were changes made in the production processes.
Nonetheless, no significant changes happened in the production processes, but now
the report simply tells the amount of used materials more realistically.
The Used materials by weight–tool does certainly not tell the amount of used ma-
terials with 100% accuracy yet. It might be impossible to get the accuracy up till
one hundred per cent ever but that should be the goal when developing the tool in
the future. When improving the tool further in the future, the main focus should be
on the product–related materials.
57
There are a few ways to improve the accuracy. One is that all the missing compo-
nents could be added to the tool, even though most of them do not weigh much and
therefore they are not crucial. Another way is that the types and sizes of engines
could be better taken into account. Each engine type has several sizes of the engine,
which means a different amount of materials used for them. The tool could be made
very accurate by adding material data separately of each engine type and size. How-
ever, it would take a lot of time and resources, so it needs to be considered carefully
if it is increasing the accuracy enough to be worth it.
For the chemicals, the accuracy could be increased by considering also chemicals
that are used only occasionally. Currently the tool takes into account all the most
used chemicals but still there are some chemicals that are left outside. Nevertheless,
the improvement in the tool would be only minimal because most likely the use of
those additional chemicals would be very little compared to the chemicals that were
added to the current tool.
Packaging materials in the tool comprise at the moment all the packaging materials
that are used, so it would be very difficult to improve that part. What comes to the
RINKI report, it would be possible to improve its accuracy by focusing on reusing
and recycling parts of the report. It could be better monitored that how big part of
different packages are reused and recycled.
In addition to CR and RINKI reporting, gathering more precise material infor-
mation will help the client organization to carry out the yearly evaluation of envi-
ronmental aspects. It includes, for instance, evaluating impacts of the materials used
in the products. More accurate chemical information in turn facilitates performing
a report for environmental authorities once a year. That is because the data is col-
lected more precisely each quarter, so there is no need for doing a huge research
separately each year before the reporting deadline.
Altogether, the outcome of the development project was very good and makes a
great difference in the future CR reports. The project required a lot of research but
with right tools and mindset it could be done successfully. Both parties, the thesis
worker and the client company, were satisfied with the final outcome of the project.
58
9 REFERENCES
/1/ Työ– ja elinkeinoministeriö. Vastuullisuusraportointi. Accessed 23.3.2018
http://tem.fi/vastuullisuusraportointi
/2/ Wärtsilä. Accessed 21.3.2018 https://www.wartsila.com/fin
/3/ Corporate Knights. 2018 Global 100: Most Sustainable Corporations outper-
form and outlive. Accessed 26.3.2018 http://www.corporateknights.com/wp-con-
tent/uploads/2014/07/Media-Release_2018_G100_Final.pdf
/4/ Ympäristö. 2015. Tuottajavastuu. Pakkausten tuottajavastuu. Accessed
23.3.2018 http://www.ymparisto.fi/fi-FI/Kulutus_ja_tuotanto/Jatteet_ja_jate-
huolto/Tuottajavastuu/Pakkaukset
/5/ Rinki. Yrityksille. Accessed 28.2.2018 https://rinkiin.fi/yrityksille/
/6/ Global Reporting Initiative. Information. About GRI. Accessed 27.1.2018
https://www.globalreporting.org/information/about-gri/Pages/default.aspx
/7/ Kauppalehti. 2014. Yhteiskuntavastuuraportit pakollisiksi suuryhtiöille. Acces-
sed 27.1.2018.
https://www.kauppalehti.fi/uutiset/yhteiskuntavastuuraportit-pakollisiksi-suuryhti-
oille/hv2wJFEd
/8/ Niskala, M., Pajunen, T., Tarna-Mani, K. 2013. Yritysvastuu. Raportointi- ja
laskentaperiaatteet. Porvoo. KHT-Media Oy
/9/ Juutinen, S., Steiner, M.-L., 2010. Strateginen yritysvastuu. Helsinki. WSOY-
pro Oy
/10/ Blowfield, M., Murray, A. 2014. Corporate Responsibility. Third Edition.
New York. Oxford University Press
/11/ FIBS. Yritysvastuu. Määritelmä ja historia. Accessed 27.1.2018
http://www.fibsry.fi/fi/yritysvastuu/maaritelma-ja-historia
/12/ Harmaala, M.-M., Jallinoja, N. 2012. Yritysvastuu ja menestyvä liiketoi-
minta. Helsinki. Sanoma Pro Oy.
/13/ Carroll, AB. 2008. A History of Corporate Social Responsibility: Concepts
and Practices. Accessed 6.1.2018.
https://www.researchgate.net/publication/282746355_A_History_of_Corpo-
rate_Social_Responsibility_Concepts_and_Practices
/14/ Elkington, J. 2004. Enter the Triple Bottom Line. Accessed 27.1.2018
http://www.johnelkington.com/archive/TBL-elkington-chapter.pdf
59
/15/Concept Draw. Sustainable development. Accessed 25.3.2018 https://concept-
draw.com/a99c3/preview--Venn%20diagram%20-%20Path%20to%20sustaina-
ble%20development
/16/ Kujala, J., Kuvaja S. 2002. Sidosryhmät eettisen liiketoiminnan kirittäjänä.
Jyväskylä. Gummerruksen kirjapaino Oy.
/17/ Ernst and Young. 2013. Value of sustainability reporting. A study by EY and
Boston College Center for Coporate Citizenship. Accessed 23.3.2018
http://www.ey.com/Publication/vwLUAssets/EY_-_Value_of_sustainability_re-
porting/$FILE/EY-Value-of-Sustainability-Reporting.pdf
/18/ United Nations. Human Rights. Accessed 8.3.2018 http://www.un.org/en/sec-
tions/issues-depth/human-rights/
/19/ International Labour Organization. Accessed 8.3.2018
http://www.ilo.org/global/lang--en/index.htm
/20/ Sustainable Development. Knowledge Platform. United Nations Conference
on Environment and Development (UNCED), Earth Summit. Accessed 8.3.2018
https://sustainabledevelopment.un.org/milestones/unced
/21/ United Nations. World Summit on Sustainable Development. Accessed
8.3.2018 http://www.un.org/events/wssd/summaries/envdevj1.htm
/22/ Sustainable Development. Knowledge Platform. United Nations Conference
on Sustainable Developments, Rio+20. Accessed 8.3.2018 https://sustainablede-
velopment.un.org/rio20
/23/ Orgnization for Economic Cooperation and Development. Accessed 8.3.2018
http://www.oecd.org/
/24/ Global Reporting Initiative. 2015. G4 Sustainability Reporting Guidelines.
Reporting Principles and Standard Disclosures. Accessed 15.2.2018
.https://www.globalreporting.org/resourcelibrary/GRIG4-Part1-Reporting-Princi-
ples-and-Standard-Disclosures.pdf
/25/ Mäkelä, H. Wärtsilä Sofi Manual. GRI reporting 2017. Wärtsilä internal ma-
terial.
/26/ L 962/1997. Valtioneuvoston päätös pakkauksista ja pakkausjätteistä. Acces-
sed 26.3.2018 http://www.finlex.fi/fi/laki/alkup/1997/19970962
/27/ RINKI. 26.9.2017. Pakkausten tuottajavastuun siirto tuottajayhteisölle – uu-
det sopimusehdot voimaan 1.1.2018. Wärtsilä internal material.
/28/ Wärtsilä Corporation. Sustainability 2015. Wärtsilä internal material.

60
/29/ Wärtsilä Corporation Annual report 2017. Accessed 21.3.2018.
https://cdn.wartsila.com/docs/default-source/investors/financial-materials/annual-
reports/wartsila_annual_report_2017.pdf?sfvrsn=7e4d7044_2

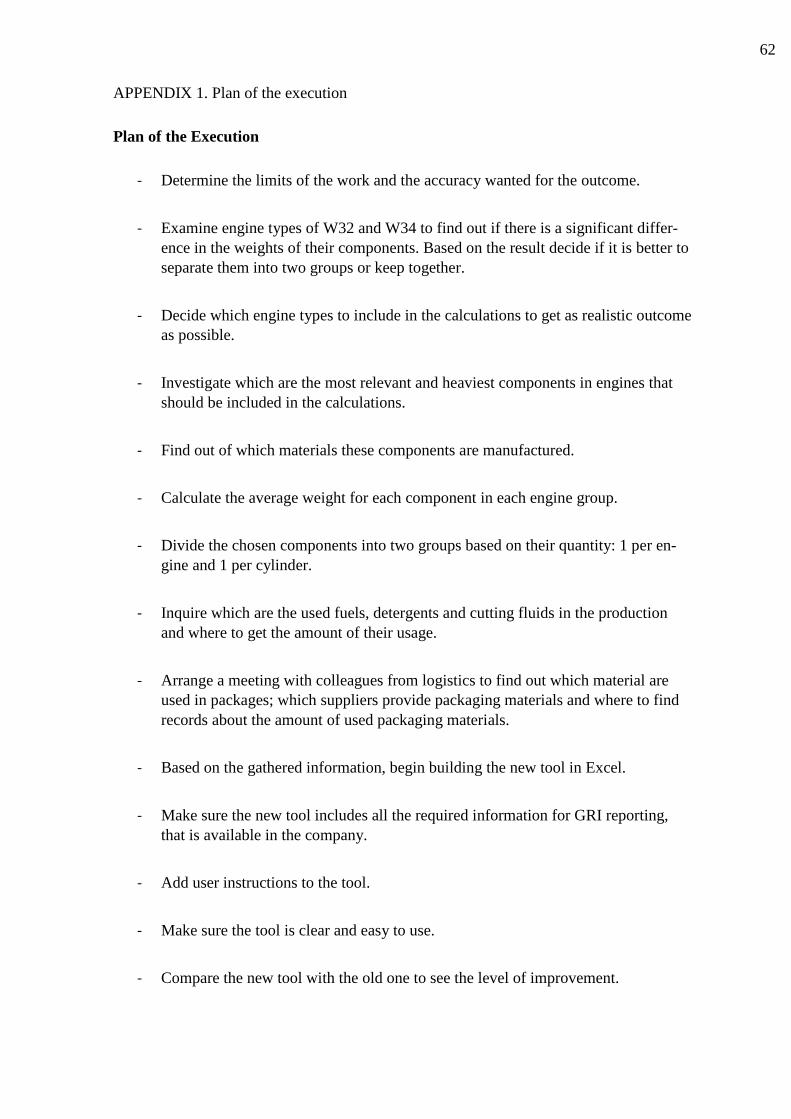
62
APPENDIX 1. Plan of the execution
Plan of the Execution
- Determine the limits of the work and the accuracy wanted for the outcome.
- Examine engine types of W32 and W34 to find out if there is a significant differ-
ence in the weights of their components. Based on the result decide if it is better to
separate them into two groups or keep together.
- Decide which engine types to include in the calculations to get as realistic outcome
as possible.
- Investigate which are the most relevant and heaviest components in engines that
should be included in the calculations.
- Find out of which materials these components are manufactured.
- Calculate the average weight for each component in each engine group.
- Divide the chosen components into two groups based on their quantity: 1 per en-
gine and 1 per cylinder.
- Inquire which are the used fuels, detergents and cutting fluids in the production
and where to get the amount of their usage.
- Arrange a meeting with colleagues from logistics to find out which material are
used in packages; which suppliers provide packaging materials and where to find
records about the amount of used packaging materials.
- Based on the gathered information, begin building the new tool in Excel.
- Make sure the new tool includes all the required information for GRI reporting,
that is available in the company.
- Add user instructions to the tool.
- Make sure the tool is clear and easy to use.
- Compare the new tool with the old one to see the level of improvement.

63
APPENDIX 2. Weight differences of components between the old and new tool

64
APPENDIX 2. Outcome of the development project