Embed Size (px)
Citation preview
BUDGET 2014-15NORTHERN TERRITORY GOVERNMENT
Northern Territory Economy
2014-15 Budget
Darwin
Canberra
Sydney
Adelaide
Hobart
Melbourne
Perth
Brisbane
PortMoresby
Jakarta
Singapore
Kuala Lumpur
Bangkok
Tokyo
Taipei
HongKong
Beijing
Seoul
Hanoi
2650
km
2850 km
3150km
3150km3150
km
3750km
2600km
2700 km
3350 km
3650 km
4450 km
3200km
4300km
4250km
5450km
6000km
5550km
4650km
1800 km
2700km
Brunei
Alice Springs
1500 km
700 km
Dili
Manila
2650
km
1
Contents Overview 3
Chapter 1 Structure of the Economy 9
Chapter 2 Economic Growth 15
Chapter 3 External Economic Environment 27
Chapter 4 Population 37
Chapter 5 Labour Market 47
Chapter 6 Prices and Wages 53
Chapter 7 Industry Analysis 61
Mining 63
Construction 71
Agriculture, Forestry and Fishing 77
Tourism 85
Defence 91
Retail and Wholesale Trade 97
Manufacturing 101
Government and Community Services 103
Other Services 105
Abbreviations and Acronyms 107
Glossary 108

2
2014-15 Budget
Overview 3
Northern Territory Economy
Overview
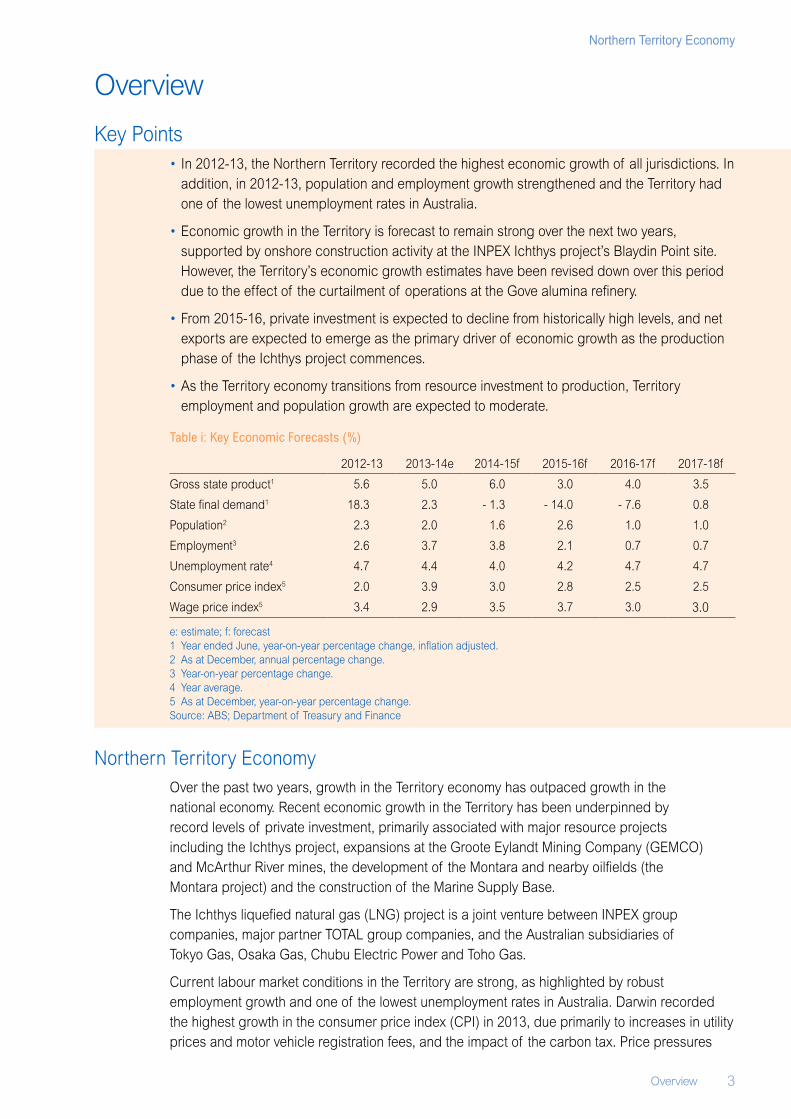
Key Points• In 2012‑13, the Northern Territory recorded the highest economic growth of all jurisdictions. In
addition, in 2012‑13, population and employment growth strengthened and the Territory had one of the lowest unemployment rates in Australia.
• Economic growth in the Territory is forecast to remain strong over the next two years, supported by onshore construction activity at the INPEX Ichthys project’s Blaydin Point site. However, the Territory’s economic growth estimates have been revised down over this period due to the effect of the curtailment of operations at the Gove alumina refinery.
• From 2015‑16, private investment is expected to decline from historically high levels, and net exports are expected to emerge as the primary driver of economic growth as the production phase of the Ichthys project commences.
• As the Territory economy transitions from resource investment to production, Territory employment and population growth are expected to moderate.
Table i: Key Economic Forecasts (%)
2012‑13 2013‑14e 2014‑15f 2015‑16f 2016‑17f 2017‑18f
Gross state product1 5.6 5.0 6.0 3.0 4.0 3.5
State final demand1 18.3 2.3 ‑ 1.3 ‑ 14.0 ‑ 7.6 0.8
Population2 2.3 2.0 1.6 2.6 1.0 1.0
Employment3 2.6 3.7 3.8 2.1 0.7 0.7
Unemployment rate4 4.7 4.4 4.0 4.2 4.7 4.7
Consumer price index5 2.0 3.9 3.0 2.8 2.5 2.5
Wage price index5 3.4 2.9 3.5 3.7 3.0 3.0
e: estimate; f: forecast1 Year ended June, year‑on‑year percentage change, inflation adjusted.2 As at December, annual percentage change.3 Year‑on‑year percentage change.4 Year average.5 As at December, year‑on‑year percentage change.Source: ABS; Department of Treasury and Finance
Northern Territory EconomyOver the past two years, growth in the Territory economy has outpaced growth in the national economy. Recent economic growth in the Territory has been underpinned by record levels of private investment, primarily associated with major resource projects including the Ichthys project, expansions at the Groote Eylandt Mining Company (GEMCO) and McArthur River mines, the development of the Montara and nearby oilfields (the Montara project) and the construction of the Marine Supply Base.
The Ichthys liquefied natural gas (LNG) project is a joint venture between INPEX group companies, major partner TOTAL group companies, and the Australian subsidiaries of Tokyo Gas, Osaka Gas, Chubu Electric Power and Toho Gas.
Current labour market conditions in the Territory are strong, as highlighted by robust employment growth and one of the lowest unemployment rates in Australia. Darwin recorded the highest growth in the consumer price index (CPI) in 2013, due primarily to increases in utility prices and motor vehicle registration fees, and the impact of the carbon tax. Price pressures
4 Overview
2014-15 Budget
are expected to ease over the forward estimates as the impact of the 2013 price increases to utilities and motor vehicle registration are incorporated in the base.
Continued elevated levels of private investment related to the Ichthys project should continue to support economic growth in the Territory over the next two years. The impact of low interest rates and improving global economic conditions should also provide a tailwind for economic growth in the Territory over this period.
In the outer years, the Territory economy is expected to transition from resource investment‑driven to production and exports‑driven economic growth. While economic growth is expected to remain solid, it will be based on increased production and export activity, which is less labour intensive than resource‑related development. As such, demand for labour in the Territory and population growth is expected to moderate in the outer years.
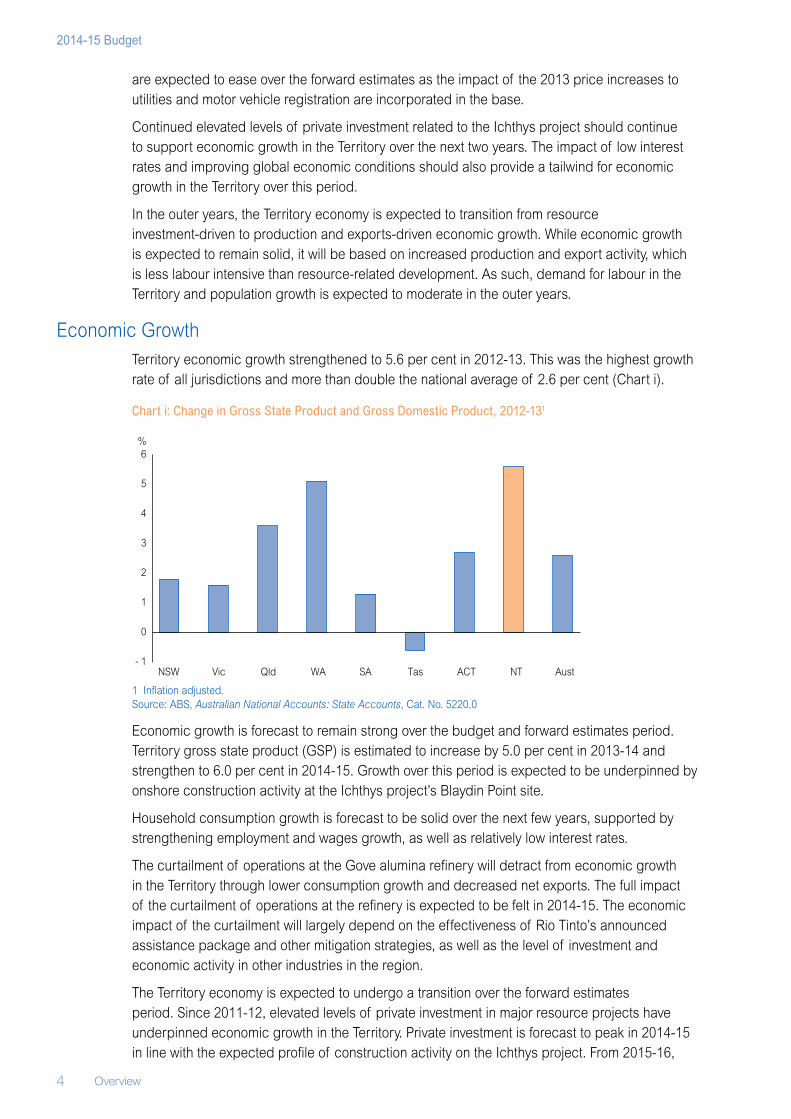
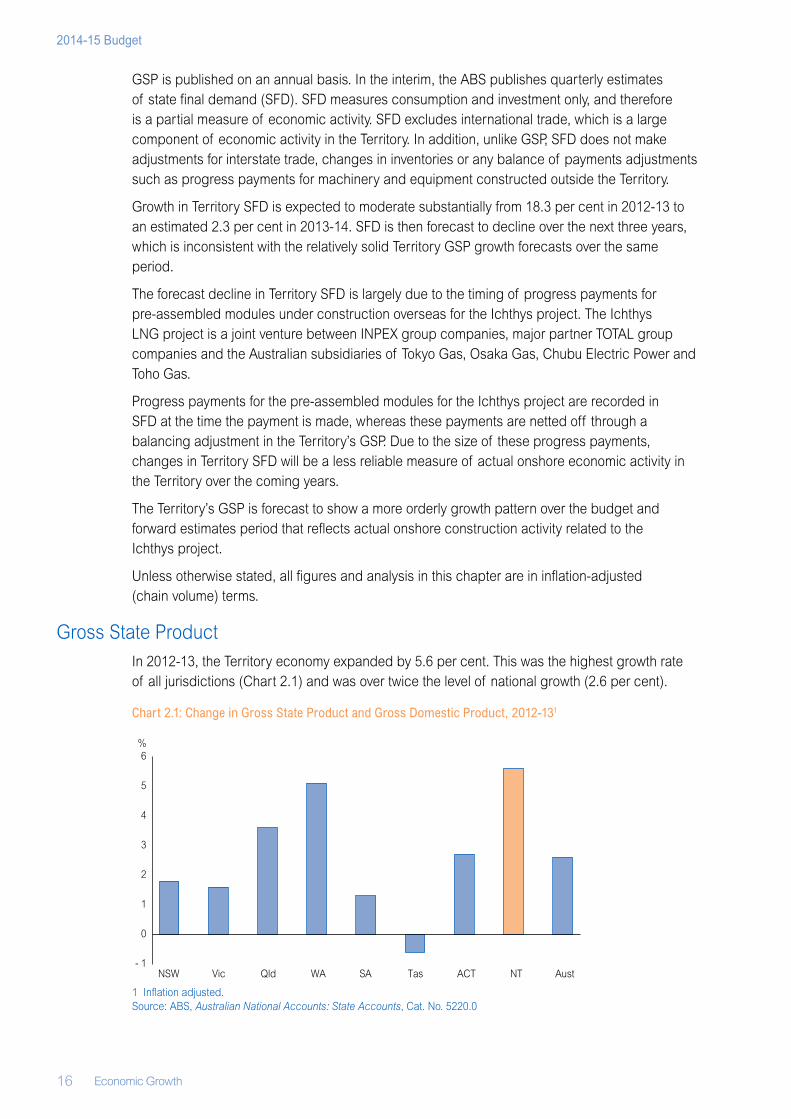
Economic GrowthTerritory economic growth strengthened to 5.6 per cent in 2012‑13. This was the highest growth rate of all jurisdictions and more than double the national average of 2.6 per cent (Chart i).
Chart i: Change in Gross State Product and Gross Domestic Product, 2012‑131
1 Inflation adjusted.Source: ABS, Australian National Accounts: State Accounts, Cat. No. 5220.0
Economic growth is forecast to remain strong over the budget and forward estimates period. Territory gross state product (GSP) is estimated to increase by 5.0 per cent in 2013‑14 and strengthen to 6.0 per cent in 2014‑15. Growth over this period is expected to be underpinned by onshore construction activity at the Ichthys project’s Blaydin Point site.
Household consumption growth is forecast to be solid over the next few years, supported by strengthening employment and wages growth, as well as relatively low interest rates.
The curtailment of operations at the Gove alumina refinery will detract from economic growth in the Territory through lower consumption growth and decreased net exports. The full impact of the curtailment of operations at the refinery is expected to be felt in 2014‑15. The economic impact of the curtailment will largely depend on the effectiveness of Rio Tinto’s announced assistance package and other mitigation strategies, as well as the level of investment and economic activity in other industries in the region.
The Territory economy is expected to undergo a transition over the forward estimates period. Since 2011‑12, elevated levels of private investment in major resource projects have underpinned economic growth in the Territory. Private investment is forecast to peak in 2014‑15 in line with the expected profile of construction activity on the Ichthys project. From 2015‑16,
- 1
0
1
2
3
4
5
6
NSW Vic Qld WA SA Tas ACT NT Aust
%
Overview 5
Northern Territory Economy
private investment is expected to decline and net exports are expected to emerge as the primary driver of economic growth as the production phase of the Ichthys project commences.
There is a risk that the transition from the investment to the production phase may not be smooth. The production phase is not as labour intensive and, as a result, growth in non‑resource industries will be required to support employment and population growth in the Territory over this period.
External Economic EnvironmentThe Australian economy is currently transitioning to non‑resource drivers of growth as investment in the mining industry passes its peak. Current economic conditions support a pick up in the non‑resource sector including improvement in global economic outlook, an increase in household wealth, relatively low interest rates, improving business sentiment and the depreciation of the Australian dollar to levels that are still high in historical terms. Despite the conducive conditions, the recovery in the non‑resource sector has been slower than anticipated.
In its World Economic Outlook April 2014, the International Monetary Fund (IMF) revised down Australia’s economic growth forecast by 0.2 percentage points to 2.6 per cent in 2014 and by 0.3 percentage points to 2.7 per cent in 2015. The lower economic growth forecasts are likely to reflect a sharper decline in resource investment over the next few years than previously anticipated. Despite the downward revision to economic growth forecasts, IMF expects Australia’s economy to outperform most other advanced economies over the forward estimates period.
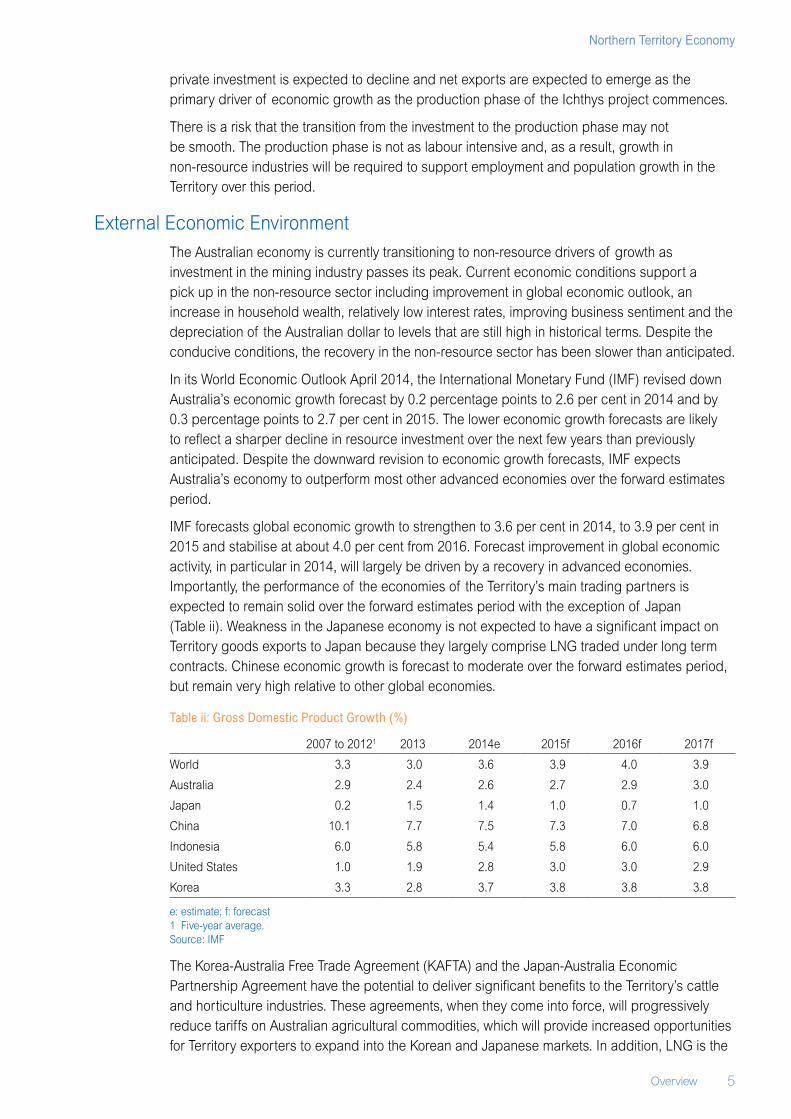
IMF forecasts global economic growth to strengthen to 3.6 per cent in 2014, to 3.9 per cent in 2015 and stabilise at about 4.0 per cent from 2016. Forecast improvement in global economic activity, in particular in 2014, will largely be driven by a recovery in advanced economies. Importantly, the performance of the economies of the Territory’s main trading partners is expected to remain solid over the forward estimates period with the exception of Japan (Table ii). Weakness in the Japanese economy is not expected to have a significant impact on Territory goods exports to Japan because they largely comprise LNG traded under long term contracts. Chinese economic growth is forecast to moderate over the forward estimates period, but remain very high relative to other global economies.
Table ii: Gross Domestic Product Growth (%)
2007 to 20121 2013 2014e 2015f 2016f 2017f
World 3.3 3.0 3.6 3.9 4.0 3.9
Australia 2.9 2.4 2.6 2.7 2.9 3.0
Japan 0.2 1.5 1.4 1.0 0.7 1.0
China 10.1 7.7 7.5 7.3 7.0 6.8
Indonesia 6.0 5.8 5.4 5.8 6.0 6.0
United States 1.0 1.9 2.8 3.0 3.0 2.9
Korea 3.3 2.8 3.7 3.8 3.8 3.8
e: estimate; f: forecast1 Five‑year average.Source: IMF
The Korea‑Australia Free Trade Agreement (KAFTA) and the Japan‑Australia Economic Partnership Agreement have the potential to deliver significant benefits to the Territory’s cattle and horticulture industries. These agreements, when they come into force, will progressively reduce tariffs on Australian agricultural commodities, which will provide increased opportunities for Territory exporters to expand into the Korean and Japanese markets. In addition, LNG is the
6 Overview
2014-15 Budget
Territory’s largest export commodity. The elimination of the 3 per cent tariff on LNG exports from Australia to Korea, effective immediately when the KAFTA comes into force, presents increased opportunities for Territory LNG exports to Korea.
The favourable outlook for the national and global economy should continue to support demand for Territory goods and services.
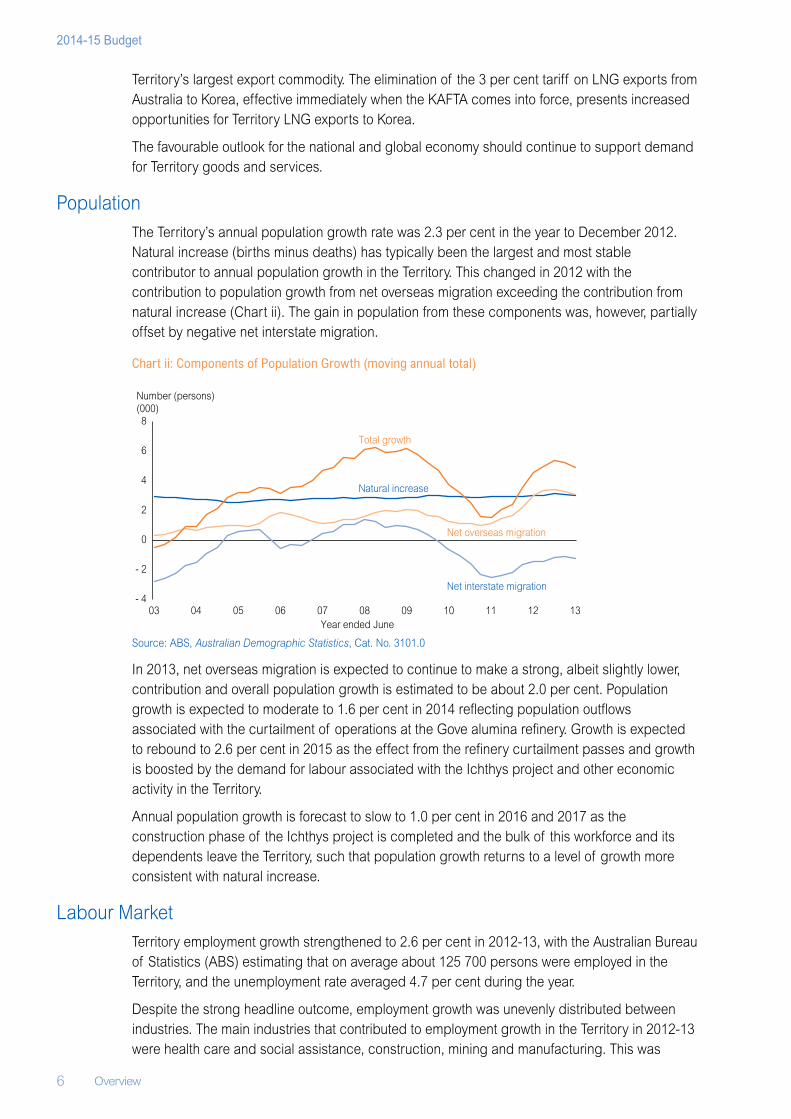
PopulationThe Territory’s annual population growth rate was 2.3 per cent in the year to December 2012. Natural increase (births minus deaths) has typically been the largest and most stable contributor to annual population growth in the Territory. This changed in 2012 with the contribution to population growth from net overseas migration exceeding the contribution from natural increase (Chart ii). The gain in population from these components was, however, partially offset by negative net interstate migration.
Chart ii: Components of Population Growth (moving annual total)
Source: ABS, Australian Demographic Statistics, Cat. No. 3101.0
In 2013, net overseas migration is expected to continue to make a strong, albeit slightly lower, contribution and overall population growth is estimated to be about 2.0 per cent. Population growth is expected to moderate to 1.6 per cent in 2014 reflecting population outflows associated with the curtailment of operations at the Gove alumina refinery. Growth is expected to rebound to 2.6 per cent in 2015 as the effect from the refinery curtailment passes and growth is boosted by the demand for labour associated with the Ichthys project and other economic activity in the Territory.
Annual population growth is forecast to slow to 1.0 per cent in 2016 and 2017 as the construction phase of the Ichthys project is completed and the bulk of this workforce and its dependents leave the Territory, such that population growth returns to a level of growth more consistent with natural increase.
Labour MarketTerritory employment growth strengthened to 2.6 per cent in 2012‑13, with the Australian Bureau of Statistics (ABS) estimating that on average about 125 700 persons were employed in the Territory, and the unemployment rate averaged 4.7 per cent during the year.
Despite the strong headline outcome, employment growth was unevenly distributed between industries. The main industries that contributed to employment growth in the Territory in 2012‑13 were health care and social assistance, construction, mining and manufacturing. This was
- 4
- 2
0
2
4
6
8
03 04 05 06 07 08 09 10 11 12 13
Total growth
Natural increase
Net overseas migration
Net interstate migration
Year ended June
Number (persons) (000)
Overview 7
Northern Territory Economy
partly offset by a decline in the number of persons employed in the agriculture, forestry and fishing, financial and insurance services and retail trade industries over the same period.
Strong labour market conditions are expected to continue over the next two years, underpinned by acceleration in construction activity associated with the Ichthys project, which is expected to flow through to other sectors of the economy. As employment growth strengthens, the Territory’s unemployment rate is expected to decline to 4.0 per cent in 2014‑15. Growth in employment in the Territory is expected to be partly offset by job losses associated with the curtailment of operations at the Gove alumina refinery, the full impact of which should occur in 2014‑15.
From 2015‑16 onwards, labour market conditions are forecast to soften as the Ichthys project transitions to the less labour‑intensive production phase and economic activity returns to long‑term trend levels.
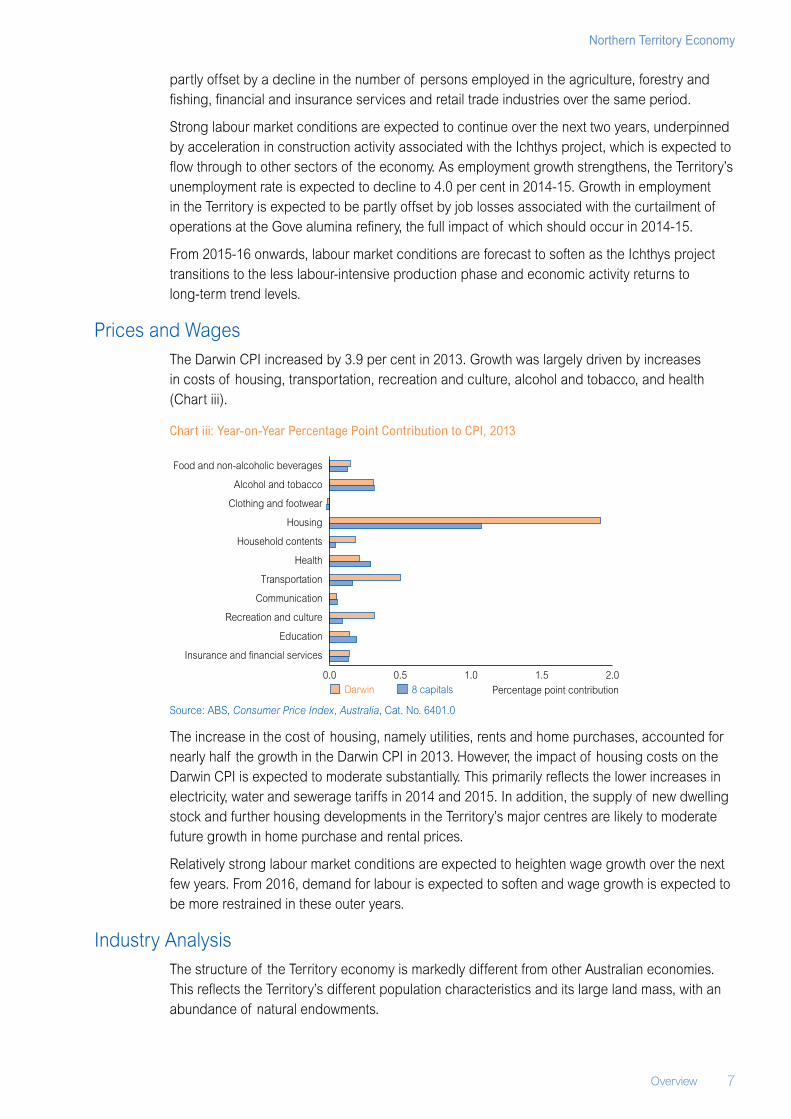
Prices and WagesThe Darwin CPI increased by 3.9 per cent in 2013. Growth was largely driven by increases in costs of housing, transportation, recreation and culture, alcohol and tobacco, and health (Chart iii).
Chart iii: Year‑on‑Year Percentage Point Contribution to CPI, 2013
Source: ABS, Consumer Price Index, Australia, Cat. No. 6401.0
The increase in the cost of housing, namely utilities, rents and home purchases, accounted for nearly half the growth in the Darwin CPI in 2013. However, the impact of housing costs on the Darwin CPI is expected to moderate substantially. This primarily reflects the lower increases in electricity, water and sewerage tariffs in 2014 and 2015. In addition, the supply of new dwelling stock and further housing developments in the Territory’s major centres are likely to moderate future growth in home purchase and rental prices.
Relatively strong labour market conditions are expected to heighten wage growth over the next few years. From 2016, demand for labour is expected to soften and wage growth is expected to be more restrained in these outer years.
Industry AnalysisThe structure of the Territory economy is markedly different from other Australian economies. This reflects the Territory’s different population characteristics and its large land mass, with an abundance of natural endowments.
0.0 0.5 1.0 1.5 2.0
Insurance and financial services
Education
Recreation and culture
Communication
Transportation
Health
Household contents
Housing
Clothing and footwear
Alcohol and tobacco
Food and non-alcoholic beverages
Darwin 8 capitals Percentage point contribution
8 Overview
2014-15 Budget
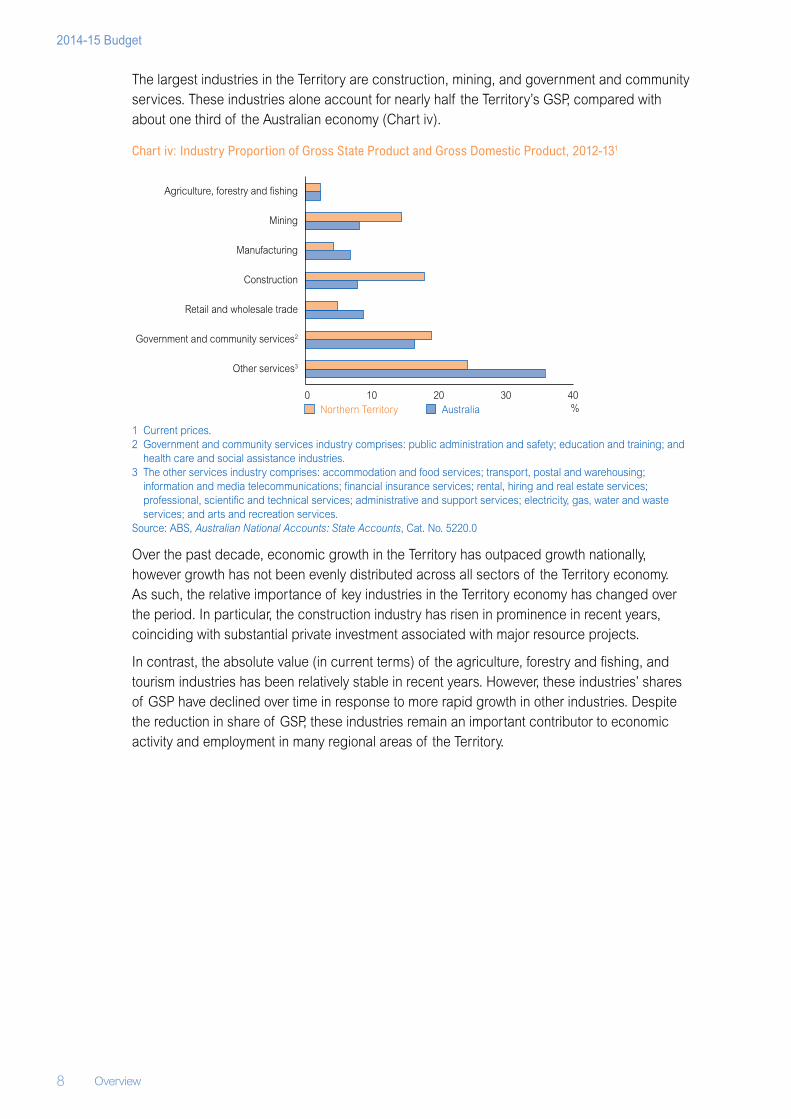
The largest industries in the Territory are construction, mining, and government and community services. These industries alone account for nearly half the Territory’s GSP, compared with about one third of the Australian economy (Chart iv).
Chart iv: Industry Proportion of Gross State Product and Gross Domestic Product, 2012‑131
1 Current prices.2 Government and community services industry comprises: public administration and safety; education and training; and
health care and social assistance industries.3 The other services industry comprises: accommodation and food services; transport, postal and warehousing;
information and media telecommunications; financial insurance services; rental, hiring and real estate services; professional, scientific and technical services; administrative and support services; electricity, gas, water and waste services; and arts and recreation services.
Source: ABS, Australian National Accounts: State Accounts, Cat. No. 5220.0
Over the past decade, economic growth in the Territory has outpaced growth nationally, however growth has not been evenly distributed across all sectors of the Territory economy. As such, the relative importance of key industries in the Territory economy has changed over the period. In particular, the construction industry has risen in prominence in recent years, coinciding with substantial private investment associated with major resource projects.
In contrast, the absolute value (in current terms) of the agriculture, forestry and fishing, and tourism industries has been relatively stable in recent years. However, these industries’ shares of GSP have declined over time in response to more rapid growth in other industries. Despite the reduction in share of GSP, these industries remain an important contributor to economic activity and employment in many regional areas of the Territory.
0 10 20 30 40
Other services3
Government and community services2
Retail and wholesale trade
Construction
Manufacturing
Mining
Agriculture, forestry and fishing
Northern Territory Australia %
Structure of the Economy 9
Northern Territory Economy
Chapter 1
Structure of the Economy
Key Points• The structure of the Northern Territory economy is markedly different to other Australian
economies, reflecting its abundance of natural resources, relatively large public sector and significant defence presence.
• Each industry’s contribution to the Territory’s gross state product (GSP) can vary over time and be highly volatile due to the Territory’s relatively small economy, the influence of major projects and changes in global and national demand for Territory goods and services.
• Key industries in the Territory, in terms of contribution to GSP, are construction, mining, government and community services (which comprises industries with outputs predominantly supplied by the public sector, including defence), and manufacturing.
• The agriculture, forestry and fishing, tourism and retail industries make relatively small contributions to the Territory’s GSP, however these are vital industries in terms of generating economic activity and employment in regional areas.
• An industry’s contribution to Territory employment can differ greatly from its contribution to GSP. The key employment industries in the Territory are government and community services, construction, retail trade, and accommodation and food services.
Industry StructureThe structure of the Territory’s economy is markedly different to other Australian economies. This reflects the Territory’s different population characteristics and its large land mass with an abundance of natural endowments. In addition, the Territory has a small and less developed economy that is heavily influenced by international trade and major projects.
The following uses GSP production data in current prices to allow for analysis of change in industry shares of the Territory economy over time.
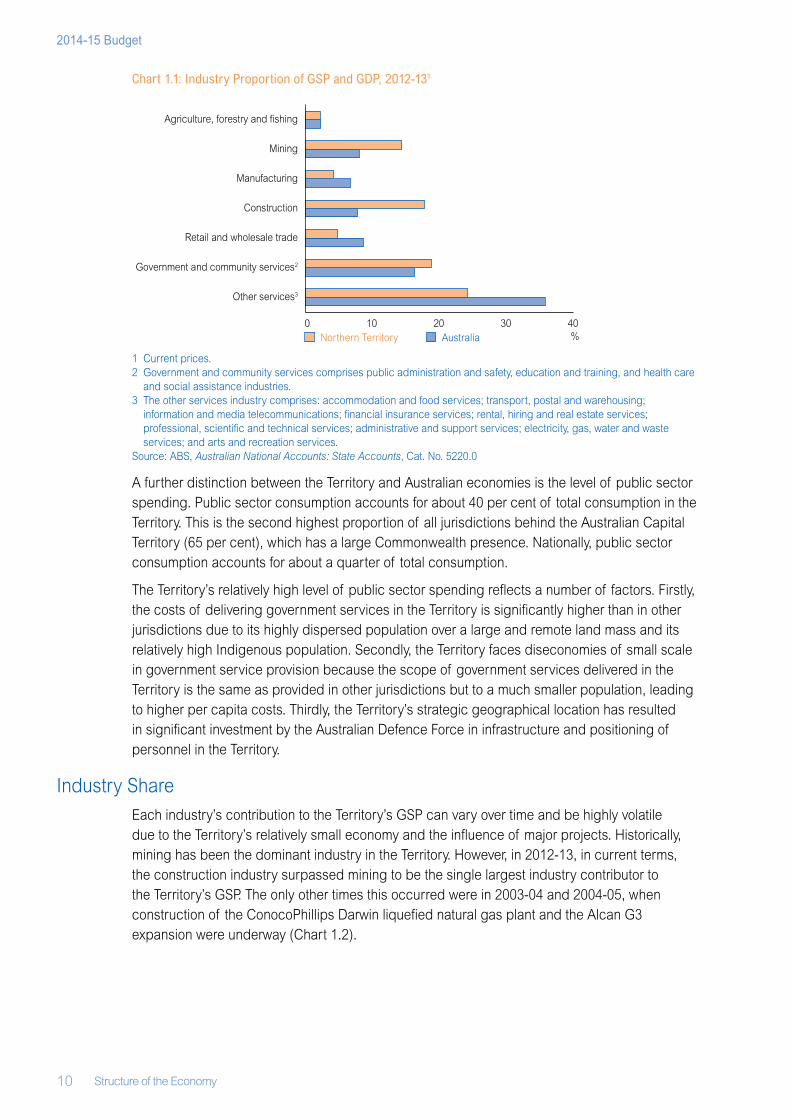
Notable differences between the Territory and Australian economies include a greater contribution from mining, construction and the public sector in the Territory, and a comparatively small contribution from manufacturing, retail and wholesale trade, and professional service industries. Chart 1.1 shows that the mining, construction, and government and community services industries comprise about half the Territory’s GSP compared with about one third of Australia’s gross domestic product (GDP.)
10 Structure of the Economy
2014-15 Budget
Chart 1.1: Industry Proportion of GSP and GDP, 2012‑131
1 Current prices.2 Government and community services comprises public administration and safety, education and training, and health care
and social assistance industries.3 The other services industry comprises: accommodation and food services; transport, postal and warehousing;
information and media telecommunications; financial insurance services; rental, hiring and real estate services; professional, scientific and technical services; administrative and support services; electricity, gas, water and waste services; and arts and recreation services.
Source: ABS, Australian National Accounts: State Accounts, Cat. No. 5220.0
A further distinction between the Territory and Australian economies is the level of public sector spending. Public sector consumption accounts for about 40 per cent of total consumption in the Territory. This is the second highest proportion of all jurisdictions behind the Australian Capital Territory (65 per cent), which has a large Commonwealth presence. Nationally, public sector consumption accounts for about a quarter of total consumption.
The Territory’s relatively high level of public sector spending reflects a number of factors. Firstly, the costs of delivering government services in the Territory is significantly higher than in other jurisdictions due to its highly dispersed population over a large and remote land mass and its relatively high Indigenous population. Secondly, the Territory faces diseconomies of small scale in government service provision because the scope of government services delivered in the Territory is the same as provided in other jurisdictions but to a much smaller population, leading to higher per capita costs. Thirdly, the Territory’s strategic geographical location has resulted in significant investment by the Australian Defence Force in infrastructure and positioning of personnel in the Territory.
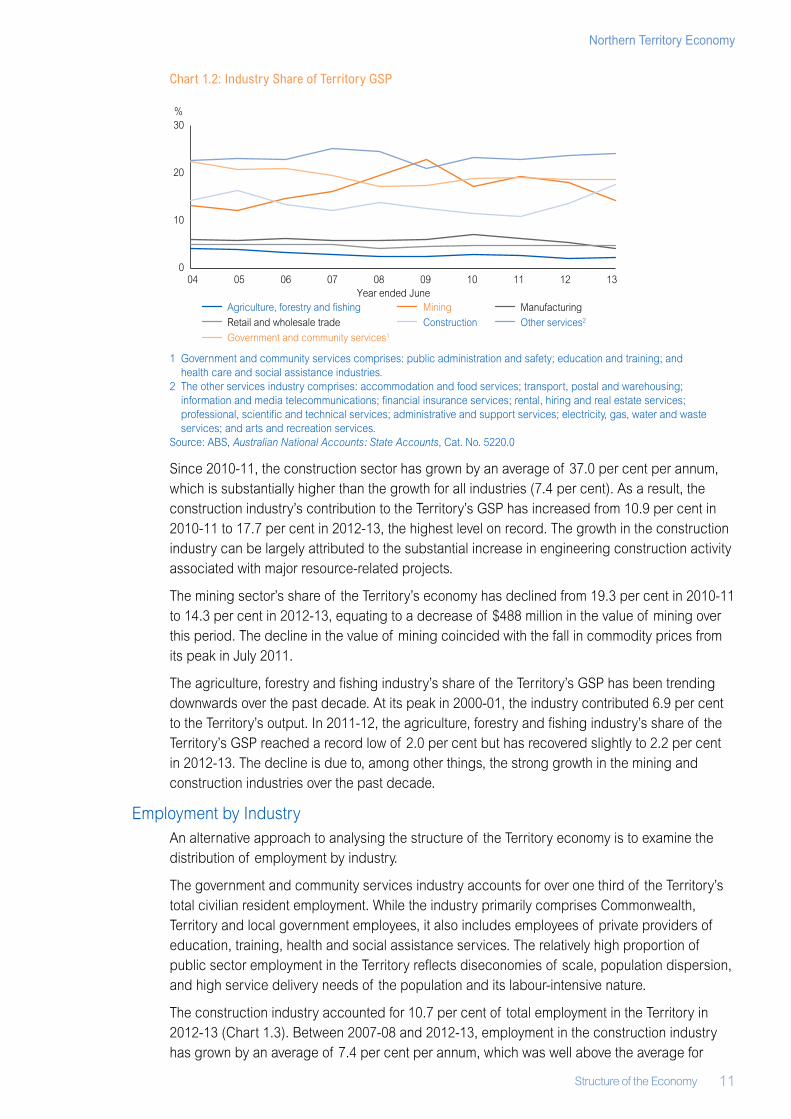
Industry ShareEach industry’s contribution to the Territory’s GSP can vary over time and be highly volatile due to the Territory’s relatively small economy and the influence of major projects. Historically, mining has been the dominant industry in the Territory. However, in 2012‑13, in current terms, the construction industry surpassed mining to be the single largest industry contributor to the Territory’s GSP. The only other times this occurred were in 2003‑04 and 2004‑05, when construction of the ConocoPhillips Darwin liquefied natural gas plant and the Alcan G3 expansion were underway (Chart 1.2).
0 10 20 30 40
Other services3
Government and community services2
Retail and wholesale trade
Construction
Manufacturing
Mining
Agriculture, forestry and fishing
Northern Territory Australia %
Structure of the Economy 11
Northern Territory Economy
Chart 1.2: Industry Share of Territory GSP
1 Government and community services comprises: public administration and safety; education and training; and health care and social assistance industries.
2 The other services industry comprises: accommodation and food services; transport, postal and warehousing; information and media telecommunications; financial insurance services; rental, hiring and real estate services; professional, scientific and technical services; administrative and support services; electricity, gas, water and waste services; and arts and recreation services.
Source: ABS, Australian National Accounts: State Accounts, Cat. No. 5220.0
Since 2010‑11, the construction sector has grown by an average of 37.0 per cent per annum, which is substantially higher than the growth for all industries (7.4 per cent). As a result, the construction industry’s contribution to the Territory’s GSP has increased from 10.9 per cent in 2010‑11 to 17.7 per cent in 2012‑13, the highest level on record. The growth in the construction industry can be largely attributed to the substantial increase in engineering construction activity associated with major resource‑related projects.
The mining sector’s share of the Territory’s economy has declined from 19.3 per cent in 2010‑11 to 14.3 per cent in 2012‑13, equating to a decrease of $488 million in the value of mining over this period. The decline in the value of mining coincided with the fall in commodity prices from its peak in July 2011.
The agriculture, forestry and fishing industry’s share of the Territory’s GSP has been trending downwards over the past decade. At its peak in 2000‑01, the industry contributed 6.9 per cent to the Territory’s output. In 2011‑12, the agriculture, forestry and fishing industry’s share of the Territory’s GSP reached a record low of 2.0 per cent but has recovered slightly to 2.2 per cent in 2012‑13. The decline is due to, among other things, the strong growth in the mining and construction industries over the past decade.
Employment by IndustryAn alternative approach to analysing the structure of the Territory economy is to examine the distribution of employment by industry.
The government and community services industry accounts for over one third of the Territory’s total civilian resident employment. While the industry primarily comprises Commonwealth, Territory and local government employees, it also includes employees of private providers of education, training, health and social assistance services. The relatively high proportion of public sector employment in the Territory reflects diseconomies of scale, population dispersion, and high service delivery needs of the population and its labour‑intensive nature.
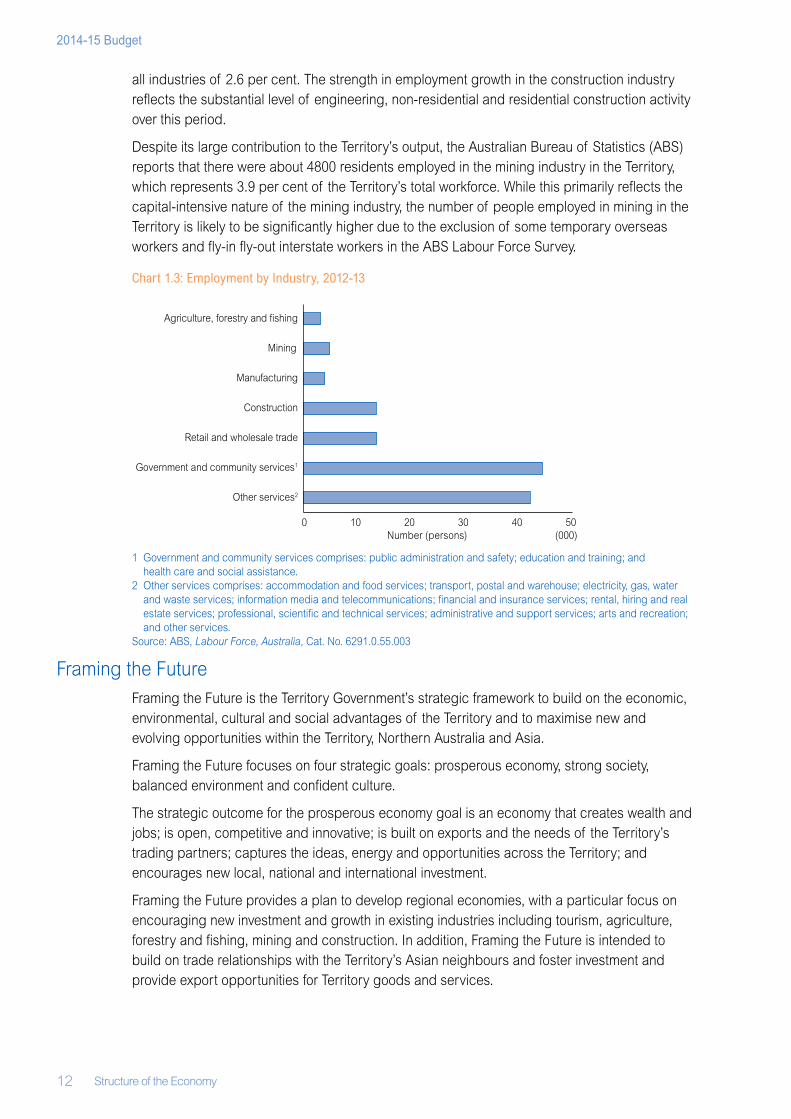
The construction industry accounted for 10.7 per cent of total employment in the Territory in 2012‑13 (Chart 1.3). Between 2007‑08 and 2012‑13, employment in the construction industry has grown by an average of 7.4 per cent per annum, which was well above the average for
0
10
20
30
04 05 06 07 08 09 10 11 12 13
Agriculture, forestry and fishing Mining Manufacturing
ConstructionRetail and wholesale trade
Government and community services1
Other services2
%
Year ended June
12 Structure of the Economy
2014-15 Budget
all industries of 2.6 per cent. The strength in employment growth in the construction industry reflects the substantial level of engineering, non‑residential and residential construction activity over this period.
Despite its large contribution to the Territory’s output, the Australian Bureau of Statistics (ABS) reports that there were about 4800 residents employed in the mining industry in the Territory, which represents 3.9 per cent of the Territory’s total workforce. While this primarily reflects the capital‑intensive nature of the mining industry, the number of people employed in mining in the Territory is likely to be significantly higher due to the exclusion of some temporary overseas workers and fly‑in fly‑out interstate workers in the ABS Labour Force Survey.
Chart 1.3: Employment by Industry, 2012‑13
1 Government and community services comprises: public administration and safety; education and training; and health care and social assistance.
2 Other services comprises: accommodation and food services; transport, postal and warehouse; electricity, gas, water and waste services; information media and telecommunications; financial and insurance services; rental, hiring and real estate services; professional, scientific and technical services; administrative and support services; arts and recreation; and other services.
Source: ABS, Labour Force, Australia, Cat. No. 6291.0.55.003
Framing the FutureFraming the Future is the Territory Government’s strategic framework to build on the economic, environmental, cultural and social advantages of the Territory and to maximise new and evolving opportunities within the Territory, Northern Australia and Asia.
Framing the Future focuses on four strategic goals: prosperous economy, strong society, balanced environment and confident culture.
The strategic outcome for the prosperous economy goal is an economy that creates wealth and jobs; is open, competitive and innovative; is built on exports and the needs of the Territory’s trading partners; captures the ideas, energy and opportunities across the Territory; and encourages new local, national and international investment.
Framing the Future provides a plan to develop regional economies, with a particular focus on encouraging new investment and growth in existing industries including tourism, agriculture, forestry and fishing, mining and construction. In addition, Framing the Future is intended to build on trade relationships with the Territory’s Asian neighbours and foster investment and provide export opportunities for Territory goods and services.
0 10 20 30 40 50
Other services2
Government and community services1
Retail and wholesale trade
Construction
Manufacturing
Mining
Agriculture, forestry and fishing
(000)Number (persons)
Structure of the Economy 13
Northern Territory Economy
Developing the NorthDeveloping the North is the Territory Government’s agenda to achieve long‑term sustainable growth in Northern Australia through collaboration with the Commonwealth, Queensland and Western Australian governments. Under the Developing the North agenda, the key enablers identified for accelerating development in Northern Australia are infrastructure, human capital, population growth and lifestyle, and land and water resources.
Key aims of the Developing the North agenda include:
• increased infrastructure investment across the Territory to strengthen transport and freight corridor connections to integrate supply chains across Northern Australia;
• increased investment in services to remote and Indigenous communities in the Territory to support job creation, economic participation and reduce welfare reliance;
• accelerating investigation and research into the development potential of the Territory’s soil, vegetation, water and marine resources; and
• developing and implementing relocation incentives to stimulate population growth and economic development in the Territory.

14
2014-15 Budget
Economic Growth 15
Northern Territory Economy
Chapter 2
Economic Growth
Key Points• The Northern Territory economy is relatively small, accounting for about 1.3 per cent of
Australian gross domestic product (GDP).
• Due to the small size of the Territory economy, economic growth can be heavily influenced by major projects and be more volatile from year to year than other states.
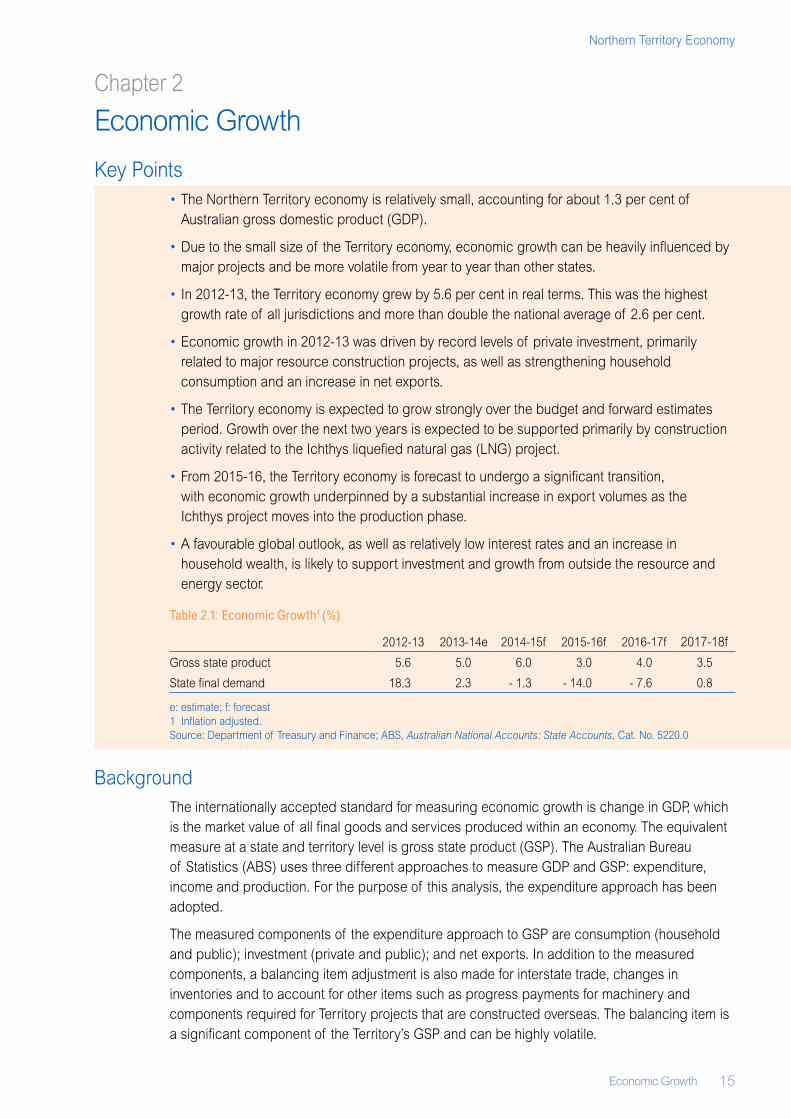
• In 2012‑13, the Territory economy grew by 5.6 per cent in real terms. This was the highest growth rate of all jurisdictions and more than double the national average of 2.6 per cent.
• Economic growth in 2012‑13 was driven by record levels of private investment, primarily related to major resource construction projects, as well as strengthening household consumption and an increase in net exports.
• The Territory economy is expected to grow strongly over the budget and forward estimates period. Growth over the next two years is expected to be supported primarily by construction activity related to the Ichthys liquefied natural gas (LNG) project.
• From 2015‑16, the Territory economy is forecast to undergo a significant transition, with economic growth underpinned by a substantial increase in export volumes as the Ichthys project moves into the production phase.
• A favourable global outlook, as well as relatively low interest rates and an increase in household wealth, is likely to support investment and growth from outside the resource and energy sector.
Table 2.1: Economic Growth1 (%)
2012‑13 2013‑14e 2014‑15f 2015‑16f 2016‑17f 2017‑18f
Gross state product 5.6 5.0 6.0 3.0 4.0 3.5
State final demand 18.3 2.3 ‑ 1.3 ‑ 14.0 ‑ 7.6 0.8
e: estimate; f: forecast1 Inflation adjusted.Source: Department of Treasury and Finance; ABS, Australian National Accounts: State Accounts, Cat. No. 5220.0
BackgroundThe internationally accepted standard for measuring economic growth is change in GDP, which is the market value of all final goods and services produced within an economy. The equivalent measure at a state and territory level is gross state product (GSP). The Australian Bureau of Statistics (ABS) uses three different approaches to measure GDP and GSP: expenditure, income and production. For the purpose of this analysis, the expenditure approach has been adopted.
The measured components of the expenditure approach to GSP are consumption (household and public); investment (private and public); and net exports. In addition to the measured components, a balancing item adjustment is also made for interstate trade, changes in inventories and to account for other items such as progress payments for machinery and components required for Territory projects that are constructed overseas. The balancing item is a significant component of the Territory’s GSP and can be highly volatile.
16 Economic Growth
2014-15 Budget
GSP is published on an annual basis. In the interim, the ABS publishes quarterly estimates of state final demand (SFD). SFD measures consumption and investment only, and therefore is a partial measure of economic activity. SFD excludes international trade, which is a large component of economic activity in the Territory. In addition, unlike GSP, SFD does not make adjustments for interstate trade, changes in inventories or any balance of payments adjustments such as progress payments for machinery and equipment constructed outside the Territory.
Growth in Territory SFD is expected to moderate substantially from 18.3 per cent in 2012‑13 to an estimated 2.3 per cent in 2013‑14. SFD is then forecast to decline over the next three years, which is inconsistent with the relatively solid Territory GSP growth forecasts over the same period.
The forecast decline in Territory SFD is largely due to the timing of progress payments for pre‑assembled modules under construction overseas for the Ichthys project. The Ichthys LNG project is a joint venture between INPEX group companies, major partner TOTAL group companies and the Australian subsidiaries of Tokyo Gas, Osaka Gas, Chubu Electric Power and Toho Gas.
Progress payments for the pre‑assembled modules for the Ichthys project are recorded in SFD at the time the payment is made, whereas these payments are netted off through a balancing adjustment in the Territory’s GSP. Due to the size of these progress payments, changes in Territory SFD will be a less reliable measure of actual onshore economic activity in the Territory over the coming years.
The Territory’s GSP is forecast to show a more orderly growth pattern over the budget and forward estimates period that reflects actual onshore construction activity related to the Ichthys project.
Unless otherwise stated, all figures and analysis in this chapter are in inflation‑adjusted (chain volume) terms.
Gross State ProductIn 2012‑13, the Territory economy expanded by 5.6 per cent. This was the highest growth rate of all jurisdictions (Chart 2.1) and was over twice the level of national growth (2.6 per cent).
Chart 2.1: Change in Gross State Product and Gross Domestic Product, 2012‑131
1 Inflation adjusted.Source: ABS, Australian National Accounts: State Accounts, Cat. No. 5220.0
- 1
0
1
2
3
4
5
6
NSW Vic Qld WA SA Tas ACT NT Aust
%
Economic Growth 17
Northern Territory Economy
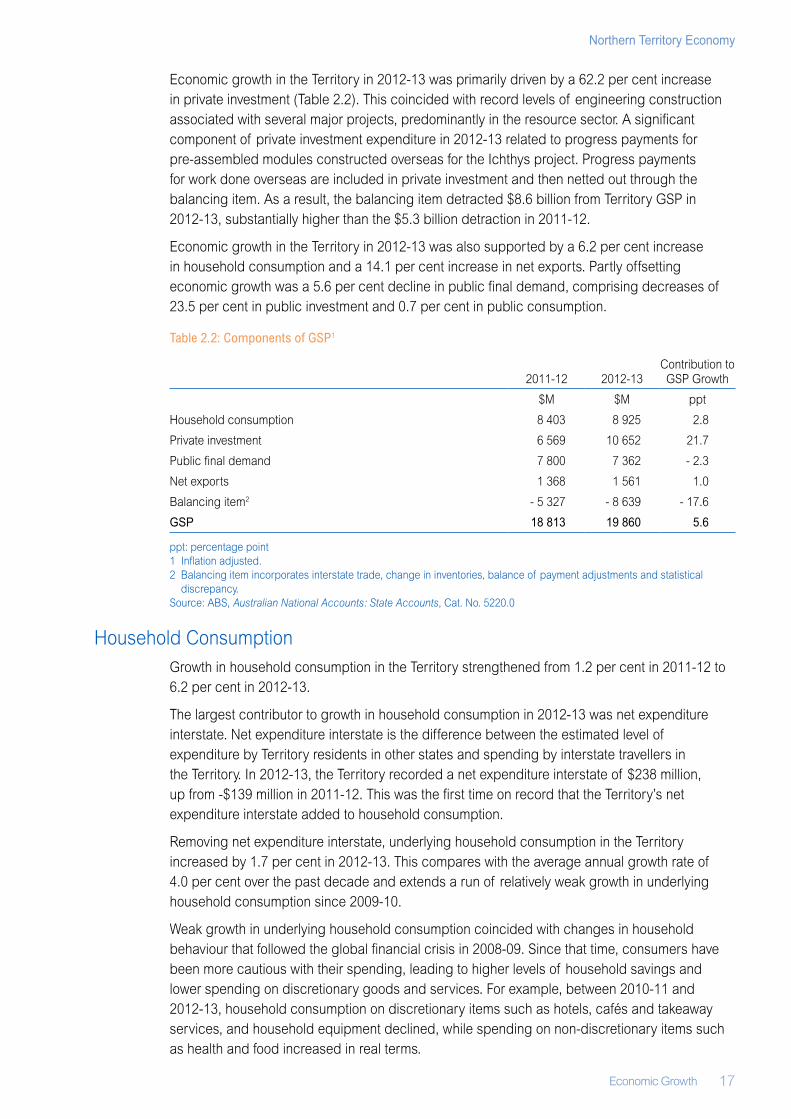
Economic growth in the Territory in 2012‑13 was primarily driven by a 62.2 per cent increase in private investment (Table 2.2). This coincided with record levels of engineering construction associated with several major projects, predominantly in the resource sector. A significant component of private investment expenditure in 2012‑13 related to progress payments for pre‑assembled modules constructed overseas for the Ichthys project. Progress payments for work done overseas are included in private investment and then netted out through the balancing item. As a result, the balancing item detracted $8.6 billion from Territory GSP in 2012‑13, substantially higher than the $5.3 billion detraction in 2011‑12.
Economic growth in the Territory in 2012‑13 was also supported by a 6.2 per cent increase in household consumption and a 14.1 per cent increase in net exports. Partly offsetting economic growth was a 5.6 per cent decline in public final demand, comprising decreases of 23.5 per cent in public investment and 0.7 per cent in public consumption.
Table 2.2: Components of GSP1
2011‑12 2012‑13Contribution to GSP Growth
$M $M ppt
Household consumption 8 403 8 925 2.8
Private investment 6 569 10 652 21.7
Public final demand 7 800 7 362 ‑ 2.3
Net exports 1 368 1 561 1.0
Balancing item2 ‑ 5 327 ‑ 8 639 ‑ 17.6
GSP 18 813 19 860 5.6
ppt: percentage point 1 Inflation adjusted.2 Balancing item incorporates interstate trade, change in inventories, balance of payment adjustments and statistical
discrepancy.Source: ABS, Australian National Accounts: State Accounts, Cat. No. 5220.0
Household ConsumptionGrowth in household consumption in the Territory strengthened from 1.2 per cent in 2011‑12 to 6.2 per cent in 2012‑13.
The largest contributor to growth in household consumption in 2012‑13 was net expenditure interstate. Net expenditure interstate is the difference between the estimated level of expenditure by Territory residents in other states and spending by interstate travellers in the Territory. In 2012‑13, the Territory recorded a net expenditure interstate of $238 million, up from ‑$139 million in 2011‑12. This was the first time on record that the Territory’s net expenditure interstate added to household consumption.
Removing net expenditure interstate, underlying household consumption in the Territory increased by 1.7 per cent in 2012‑13. This compares with the average annual growth rate of 4.0 per cent over the past decade and extends a run of relatively weak growth in underlying household consumption since 2009‑10.
Weak growth in underlying household consumption coincided with changes in household behaviour that followed the global financial crisis in 2008‑09. Since that time, consumers have been more cautious with their spending, leading to higher levels of household savings and lower spending on discretionary goods and services. For example, between 2010‑11 and 2012‑13, household consumption on discretionary items such as hotels, cafés and takeaway services, and household equipment declined, while spending on non‑discretionary items such as health and food increased in real terms.
18 Economic Growth
2014-15 Budget
Favourable economic conditions are expected to encourage a pick up in household consumption over the medium term. Household consumption growth is expected to be supported by strengthening employment and wages growth, as well as relatively low interest rates. Recent SFD and retail trade data suggests a recovery is underway in household consumption. Retail trade sales have grown at a reasonable rate for the first nine months of 2013‑14, following subdued growth for most of 2012‑13.
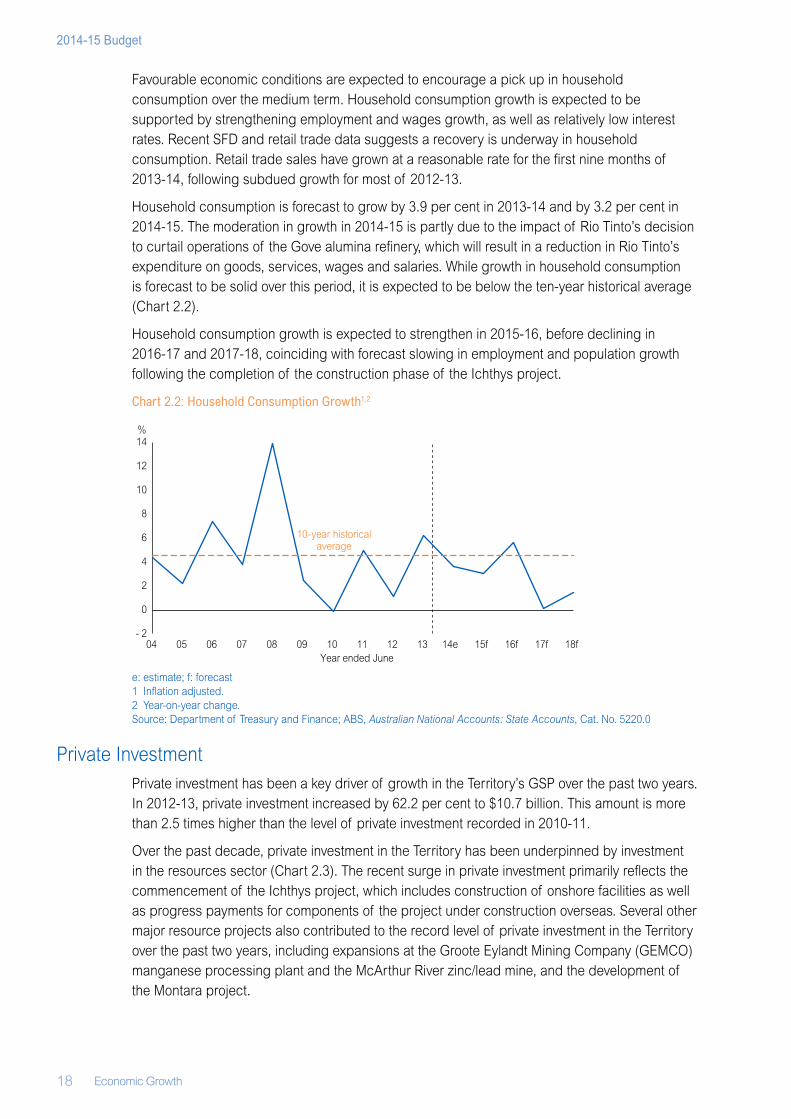
Household consumption is forecast to grow by 3.9 per cent in 2013‑14 and by 3.2 per cent in 2014‑15. The moderation in growth in 2014‑15 is partly due to the impact of Rio Tinto’s decision to curtail operations of the Gove alumina refinery, which will result in a reduction in Rio Tinto’s expenditure on goods, services, wages and salaries. While growth in household consumption is forecast to be solid over this period, it is expected to be below the ten‑year historical average (Chart 2.2).
Household consumption growth is expected to strengthen in 2015‑16, before declining in 2016‑17 and 2017‑18, coinciding with forecast slowing in employment and population growth following the completion of the construction phase of the Ichthys project.
Chart 2.2: Household Consumption Growth1,2
e: estimate; f: forecast1 Inflation adjusted.2 Year‑on‑year change.Source: Department of Treasury and Finance; ABS, Australian National Accounts: State Accounts, Cat. No. 5220.0
Private InvestmentPrivate investment has been a key driver of growth in the Territory’s GSP over the past two years. In 2012‑13, private investment increased by 62.2 per cent to $10.7 billion. This amount is more than 2.5 times higher than the level of private investment recorded in 2010‑11.
Over the past decade, private investment in the Territory has been underpinned by investment in the resources sector (Chart 2.3). The recent surge in private investment primarily reflects the commencement of the Ichthys project, which includes construction of onshore facilities as well as progress payments for components of the project under construction overseas. Several other major resource projects also contributed to the record level of private investment in the Territory over the past two years, including expansions at the Groote Eylandt Mining Company (GEMCO) manganese processing plant and the McArthur River zinc/lead mine, and the development of the Montara project.
04 05 06 07 08 09 10 11 12 13 14e 15f 16f 17f 18f
%
Year ended June
10-year historical average
- 2
0
2
4
6
8
10
12
14
Economic Growth 19
Northern Territory Economy
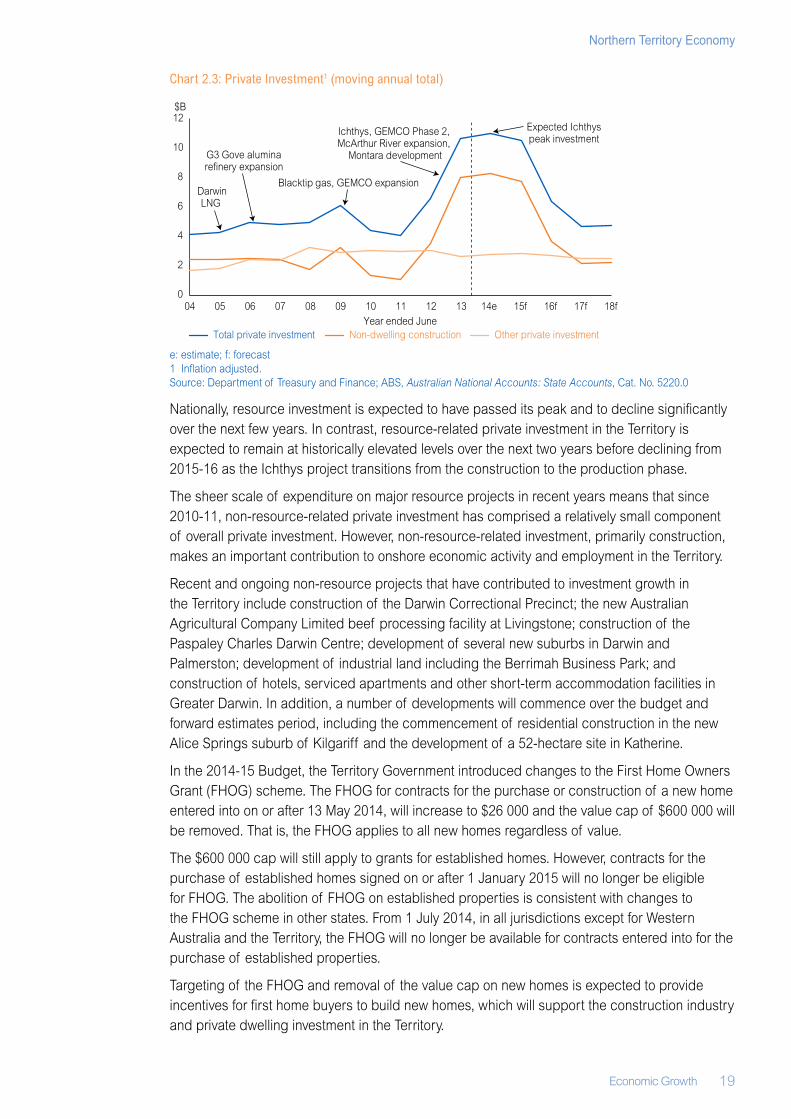
Chart 2.3: Private Investment1 (moving annual total)
e: estimate; f: forecast1 Inflation adjusted.Source: Department of Treasury and Finance; ABS, Australian National Accounts: State Accounts, Cat. No. 5220.0
Nationally, resource investment is expected to have passed its peak and to decline significantly over the next few years. In contrast, resource‑related private investment in the Territory is expected to remain at historically elevated levels over the next two years before declining from 2015‑16 as the Ichthys project transitions from the construction to the production phase.
The sheer scale of expenditure on major resource projects in recent years means that since 2010‑11, non‑resource‑related private investment has comprised a relatively small component of overall private investment. However, non‑resource‑related investment, primarily construction, makes an important contribution to onshore economic activity and employment in the Territory.
Recent and ongoing non‑resource projects that have contributed to investment growth in the Territory include construction of the Darwin Correctional Precinct; the new Australian Agricultural Company Limited beef processing facility at Livingstone; construction of the Paspaley Charles Darwin Centre; development of several new suburbs in Darwin and Palmerston; development of industrial land including the Berrimah Business Park; and construction of hotels, serviced apartments and other short‑term accommodation facilities in Greater Darwin. In addition, a number of developments will commence over the budget and forward estimates period, including the commencement of residential construction in the new Alice Springs suburb of Kilgariff and the development of a 52‑hectare site in Katherine.
In the 2014‑15 Budget, the Territory Government introduced changes to the First Home Owners Grant (FHOG) scheme. The FHOG for contracts for the purchase or construction of a new home entered into on or after 13 May 2014, will increase to $26 000 and the value cap of $600 000 will be removed. That is, the FHOG applies to all new homes regardless of value.
The $600 000 cap will still apply to grants for established homes. However, contracts for the purchase of established homes signed on or after 1 January 2015 will no longer be eligible for FHOG. The abolition of FHOG on established properties is consistent with changes to the FHOG scheme in other states. From 1 July 2014, in all jurisdictions except for Western Australia and the Territory, the FHOG will no longer be available for contracts entered into for the purchase of established properties.
Targeting of the FHOG and removal of the value cap on new homes is expected to provide incentives for first home buyers to build new homes, which will support the construction industry and private dwelling investment in the Territory.
0
2
4
6
8
10
12
04 05 06 07 08 09 10 11 12 13 14e 15f 16f 17f 18f
Total private investment Non-dwelling construction Other private investment
Ichthys, GEMCO Phase 2, McArthur River expansion,
Montara development
Expected Ichthys peak investment
$B
G3 Gove alumina refinery expansion
DarwinLNG
Blacktip gas, GEMCO expansion
Year ended June
20 Economic Growth
2014-15 Budget
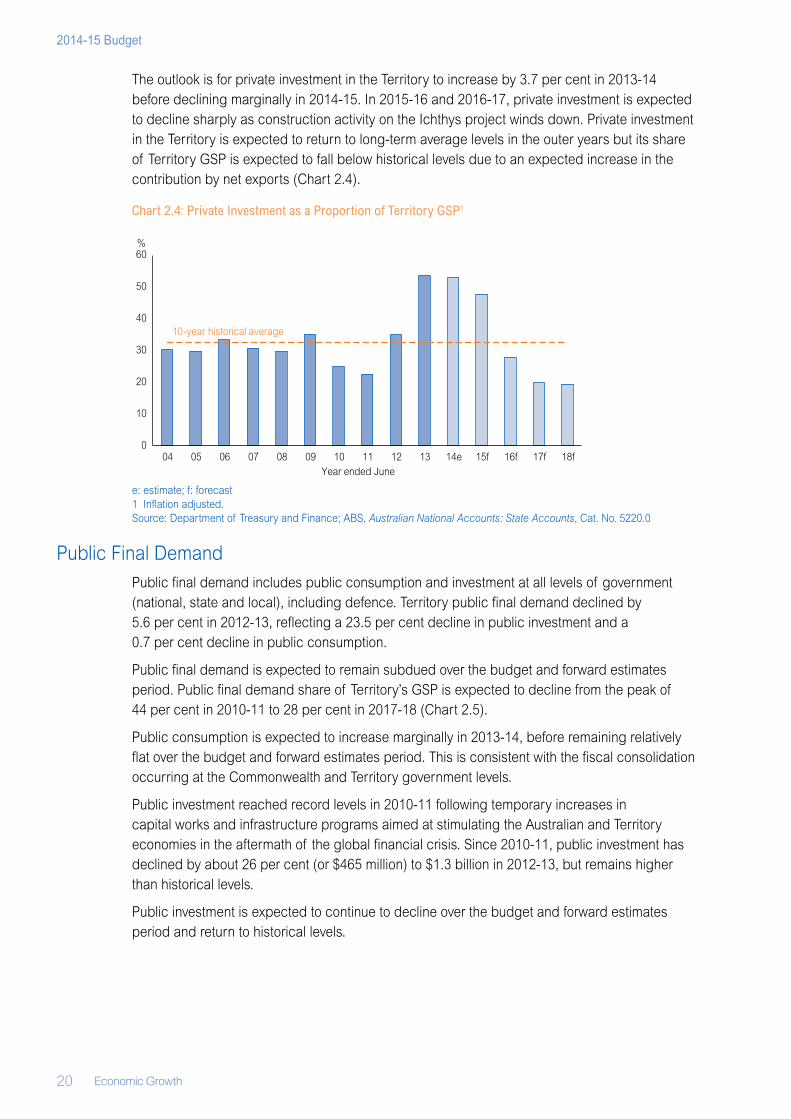
The outlook is for private investment in the Territory to increase by 3.7 per cent in 2013‑14 before declining marginally in 2014‑15. In 2015‑16 and 2016‑17, private investment is expected to decline sharply as construction activity on the Ichthys project winds down. Private investment in the Territory is expected to return to long‑term average levels in the outer years but its share of Territory GSP is expected to fall below historical levels due to an expected increase in the contribution by net exports (Chart 2.4).
Chart 2.4: Private Investment as a Proportion of Territory GSP1
e: estimate; f: forecast1 Inflation adjusted.Source: Department of Treasury and Finance; ABS, Australian National Accounts: State Accounts, Cat. No. 5220.0
Public Final DemandPublic final demand includes public consumption and investment at all levels of government (national, state and local), including defence. Territory public final demand declined by 5.6 per cent in 2012‑13, reflecting a 23.5 per cent decline in public investment and a 0.7 per cent decline in public consumption.
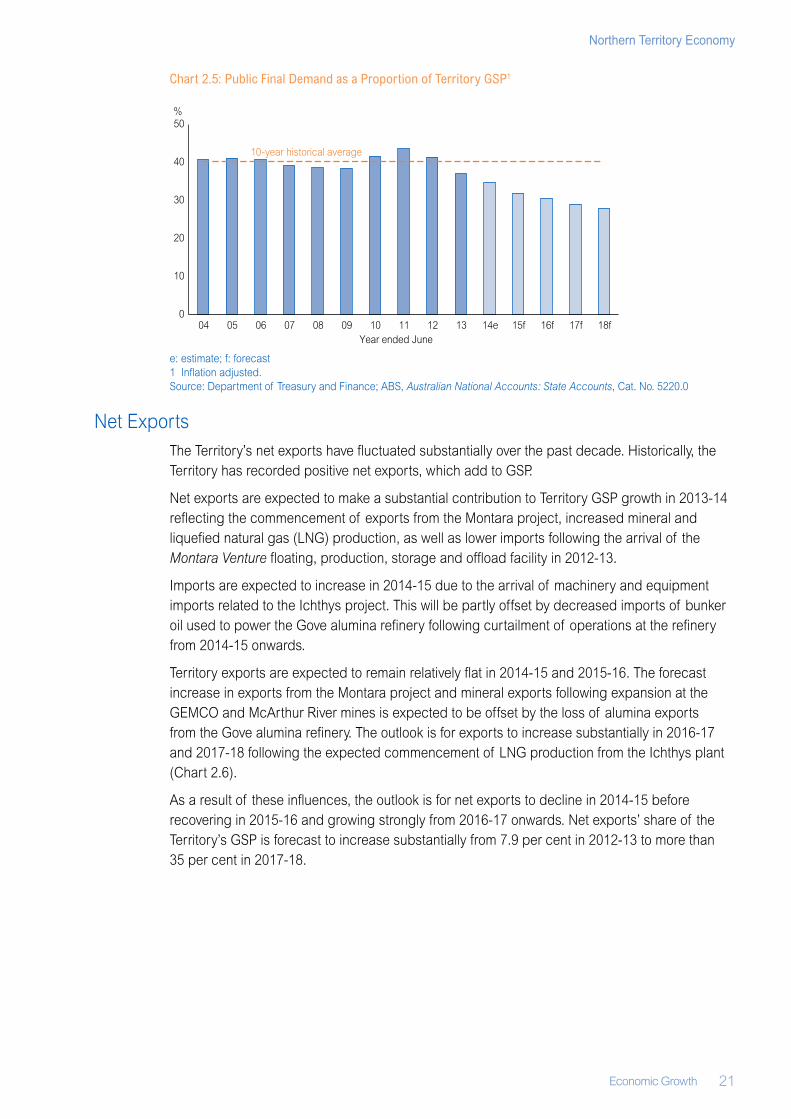
Public final demand is expected to remain subdued over the budget and forward estimates period. Public final demand share of Territory’s GSP is expected to decline from the peak of 44 per cent in 2010‑11 to 28 per cent in 2017‑18 (Chart 2.5).
Public consumption is expected to increase marginally in 2013‑14, before remaining relatively flat over the budget and forward estimates period. This is consistent with the fiscal consolidation occurring at the Commonwealth and Territory government levels.
Public investment reached record levels in 2010‑11 following temporary increases in capital works and infrastructure programs aimed at stimulating the Australian and Territory economies in the aftermath of the global financial crisis. Since 2010‑11, public investment has declined by about 26 per cent (or $465 million) to $1.3 billion in 2012‑13, but remains higher than historical levels.
Public investment is expected to continue to decline over the budget and forward estimates period and return to historical levels.
0
10
20
30
40
50
60
04 05 06 07 08 09 10 11 12 13 14e 15f 16f 17f 18f
%
Year ended June
10-year historical average
Economic Growth 21
Northern Territory Economy
Chart 2.5: Public Final Demand as a Proportion of Territory GSP1
e: estimate; f: forecast1 Inflation adjusted.Source: Department of Treasury and Finance; ABS, Australian National Accounts: State Accounts, Cat. No. 5220.0
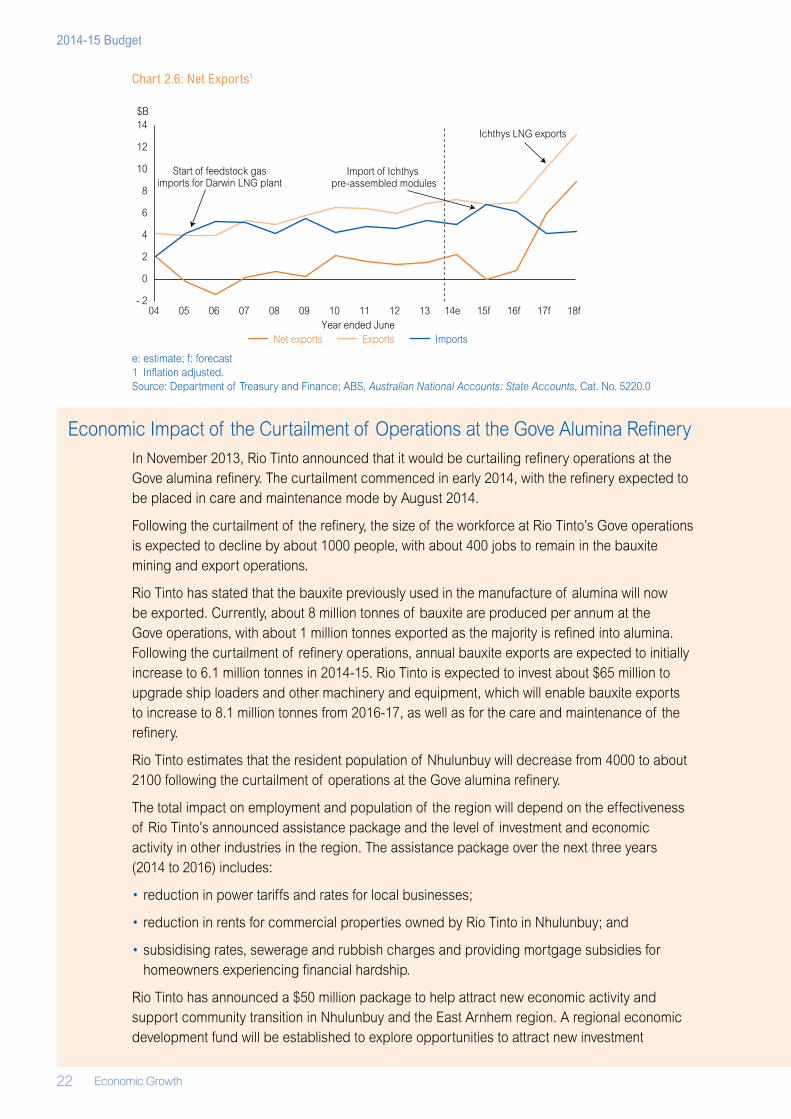
Net ExportsThe Territory’s net exports have fluctuated substantially over the past decade. Historically, the Territory has recorded positive net exports, which add to GSP.
Net exports are expected to make a substantial contribution to Territory GSP growth in 2013‑14 reflecting the commencement of exports from the Montara project, increased mineral and liquefied natural gas (LNG) production, as well as lower imports following the arrival of the Montara Venture floating, production, storage and offload facility in 2012‑13.
Imports are expected to increase in 2014‑15 due to the arrival of machinery and equipment imports related to the Ichthys project. This will be partly offset by decreased imports of bunker oil used to power the Gove alumina refinery following curtailment of operations at the refinery from 2014‑15 onwards.
Territory exports are expected to remain relatively flat in 2014‑15 and 2015‑16. The forecast increase in exports from the Montara project and mineral exports following expansion at the GEMCO and McArthur River mines is expected to be offset by the loss of alumina exports from the Gove alumina refinery. The outlook is for exports to increase substantially in 2016‑17 and 2017‑18 following the expected commencement of LNG production from the Ichthys plant (Chart 2.6).
As a result of these influences, the outlook is for net exports to decline in 2014‑15 before recovering in 2015‑16 and growing strongly from 2016‑17 onwards. Net exports’ share of the Territory’s GSP is forecast to increase substantially from 7.9 per cent in 2012‑13 to more than 35 per cent in 2017‑18.
0
10
20
30
40
50
04 05 06 07 08 09 10 11 12 13 14e 15f 16f 17f 18f
%
Year ended June
10-year historical average
22 Economic Growth
2014-15 Budget
Chart 2.6: Net Exports1
e: estimate; f: forecast1 Inflation adjusted.Source: Department of Treasury and Finance; ABS, Australian National Accounts: State Accounts, Cat. No. 5220.0
Economic Impact of the Curtailment of Operations at the Gove Alumina RefineryIn November 2013, Rio Tinto announced that it would be curtailing refinery operations at the Gove alumina refinery. The curtailment commenced in early 2014, with the refinery expected to be placed in care and maintenance mode by August 2014.
Following the curtailment of the refinery, the size of the workforce at Rio Tinto’s Gove operations is expected to decline by about 1000 people, with about 400 jobs to remain in the bauxite mining and export operations.
Rio Tinto has stated that the bauxite previously used in the manufacture of alumina will now be exported. Currently, about 8 million tonnes of bauxite are produced per annum at the Gove operations, with about 1 million tonnes exported as the majority is refined into alumina. Following the curtailment of refinery operations, annual bauxite exports are expected to initially increase to 6.1 million tonnes in 2014‑15. Rio Tinto is expected to invest about $65 million to upgrade ship loaders and other machinery and equipment, which will enable bauxite exports to increase to 8.1 million tonnes from 2016‑17, as well as for the care and maintenance of the refinery.
Rio Tinto estimates that the resident population of Nhulunbuy will decrease from 4000 to about 2100 following the curtailment of operations at the Gove alumina refinery.
The total impact on employment and population of the region will depend on the effectiveness of Rio Tinto’s announced assistance package and the level of investment and economic activity in other industries in the region. The assistance package over the next three years (2014 to 2016) includes:
• reduction in power tariffs and rates for local businesses;
• reduction in rents for commercial properties owned by Rio Tinto in Nhulunbuy; and
• subsidising rates, sewerage and rubbish charges and providing mortgage subsidies for homeowners experiencing financial hardship.
Rio Tinto has announced a $50 million package to help attract new economic activity and support community transition in Nhulunbuy and the East Arnhem region. A regional economic development fund will be established to explore opportunities to attract new investment
- 2
0
2
4
6
8
10
12
14
04 05 06 07 08 09 10 11 12 13 14e 15f 16f 17f 18f
Net exports Exports Imports
$B
Year ended June
Start of feedstock gasimports for Darwin LNG plant
Import of Ichthys pre-assembled modules
Ichthys LNG exports
Economic Growth 23
Northern Territory Economy
and industries to the region. The regional economic development fund will be jointly funded by Rio Tinto and the Territory Government. In addition, Rio Tinto will establish a community investment fund to support local arts, recreation, sporting groups and community organisations; provide additional funding and training to assist building capacity in Indigenous businesses; and offer professional advisors and financial assistance for community members and local businesses.
The curtailment of operations at the Gove alumina refinery will detract from Territory economic output from 2013‑14 onwards through lower consumption growth and decreased net exports, however the full impact will not be felt until 2014‑15.
Territory consumption growth will be directly affected by a reduction in Rio Tinto’s expenditure on goods and services, which are estimated to decline by about $140 million, and through a reduction in salaries and wages that Rio Tinto estimate will decline by about $100 million.
Net exports are expected to be impacted from 2013‑14 onwards, with the Territory’s alumina exports (currently valued at about $800 million per year) significantly reduced in 2014‑15 and ceased by 2015‑16. This is expected to be partly offset by a decrease in the imports of goods required for the refining process, including caustic soda and fuel oil. Following the curtailment of operations at the Gove alumina refinery, the value of these imports is expected to decline from about $600 million per annum to about $50 million of fuel imports per annum from 2014‑15 onwards.
OutlookThe Territory economy is expected to perform strongly over the budget and forward estimates period and continue to outperform most other jurisdictions, with economic growth forecast to average 4.3 per cent per annum over this period.
Over the next three years (to 2015‑16), Territory economic growth will be underpinned by construction activity related to the Ichthys project. Following 2015‑16, the Territory economy is expected to transition away from the investment phase to the production phase, with a substantial increase in net exports emerging as the primary driver of economic growth.
The Territory economy is forecast to grow by 5.0 per cent in 2013‑14, driven primarily by an increase in net exports reflecting the commencement of oil exports from the Montara project in late 2013. Higher levels of private investment and household consumption are expected to support growth, with private investment forecast to increase by 3.7 per cent and household consumption forecast to increase by 3.9 per cent.
This is supported by the latest data on SFD, which showed that in the first two quarters of 2013‑14, private investment continued to increase from already historically high levels, albeit at a slower pace than in 2012‑13, and household consumption continued to grow relatively strongly.
A continued reduction in government capital works spending from the relatively high levels observed between 2009‑10 and 2011‑12 is projected to partly offset growth in 2013‑14, with public investment forecast to fall by 10.2 per cent.
Territory GSP growth is forecast to strengthen to 6.0 per cent in 2014‑15, in line with the expected peak in onshore construction activity at the Ichthys project’s Blaydin Point site.
Household consumption is expected to support GSP growth in 2014‑15. However, the rate of household consumption growth is forecast to moderate to 3.2 per cent, reflecting the impact on
24 Economic Growth
2014-15 Budget
population and employment growth resulting from Rio Tinto’s decision to curtail operations at the Gove alumina refinery.
The Territory’s net exports are forecast to decline in 2014‑15 and are expected to be the most significant detractor from GSP growth. The forecast decline in the Territory’s net exports is due to a large increase in project cargo related to the Ichthys project, including a number of high value pre‑assembled modules. Territory exports are also forecast to decline in 2014‑15, with increased production of manganese and zinc/lead concentrate more than offset by a reduction in alumina exports.
GSP growth is expected to moderate to 3.0 per cent in 2015‑16, as the construction phase of the Ichthys project moves past its peak levels. Private investment is forecast to fall substantially, albeit from very high levels, and public sector investment is forecast to continue to decline.
Consumption growth is forecast to strengthen with strong growth in private consumption partly offset by relatively flat public sector consumption as measures aimed at restoring the Territory budget to a fiscal balance are implemented. A reduction in the imports of project cargo related to the Ichthys project is also forecast to result in a recovery in the Territory’s net exports and support economic growth in 2015‑16.
Territory economic growth is forecast to strengthen to 4.0 per cent in 2016‑17 due to the projected commencement of LNG exports from the Ichthys plant in late 2016. A partial year of LNG exports is forecast to increase Territory exports substantially, however this will be partly offset by an increase in the import of feedstock gas from the Ichthys field.
Private investment is forecast to continue to decline, as it returns towards long‑term average levels following the completion of the construction phase of the Ichthys project in late 2016. A decline in consumption is also forecast to detract from growth, reflecting a reduction in the Territory’s population and employment growth as the Ichthys construction workforce winds down.
A further increase in Territory net exports, resulting from a full year of LNG at the Ichthys plant, is forecast to underpin GSP growth of 3.5 per cent in 2017‑18. A stabilisation of private investment at around long‑term trend levels and modest private consumption growth will also support GSP.
Due to the unprecedented level of private investment in the Territory expected to occur over the next few years, there is a risk that the transition from the construction to the production phase may not be smooth. While net exports are expected to underpin economic growth in the Territory in the outer years, this is not as labour‑intensive as the construction phase. As a result, growth in non‑resource activity will be required to support employment and population growth in the Territory during this period.
While growth in resources‑related investment has been the primary driver of the recent surge in economic activity in the Territory, conditions are present for a pick up in non‑resource industries. The targeting of the FHOG scheme to the purchase or construction of new homes and the removal of the value cap for new homes from 13 May 2014, is expected to support private dwelling investment. In addition, relatively low interest rates and the freeing up of labour and capital capacity constraints as the Ichthys project transitions away from the construction phase should support economic growth outside the resource sector. The Territory is well positioned to take advantage of the recovery in global activity and the shift in global growth towards Asia.
Economic Growth 25
Northern Territory Economy
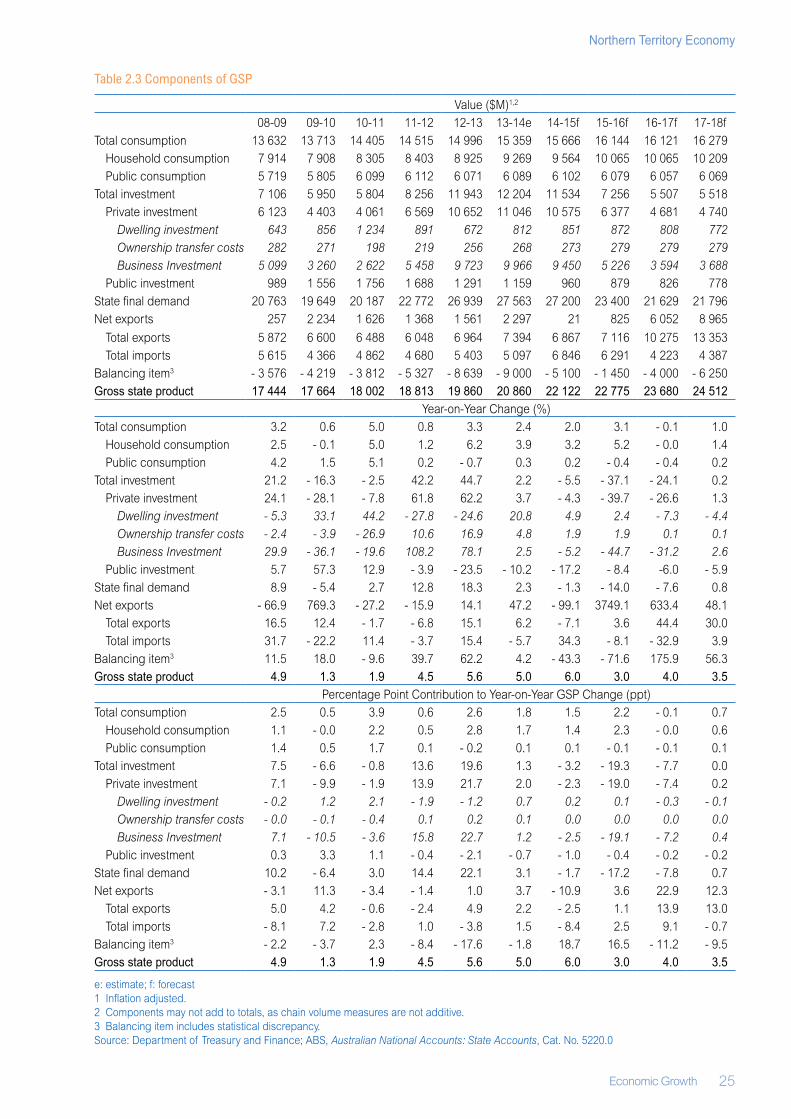
Table 2.3 Components of GSP
Value ($M)1,2
08‑09 09‑10 10‑11 11‑12 12‑13 13‑14e 14‑15f 15‑16f 16‑17f 17‑18fTotal consumption 13 632 13 713 14 405 14 515 14 996 15 359 15 666 16 144 16 121 16 279
Household consumption 7 914 7 908 8 305 8 403 8 925 9 269 9 564 10 065 10 065 10 209Public consumption 5 719 5 805 6 099 6 112 6 071 6 089 6 102 6 079 6 057 6 069
Total investment 7 106 5 950 5 804 8 256 11 943 12 204 11 534 7 256 5 507 5 518Private investment 6 123 4 403 4 061 6 569 10 652 11 046 10 575 6 377 4 681 4 740
Dwelling investment 643 856 1 234 891 672 812 851 872 808 772Ownership transfer costs 282 271 198 219 256 268 273 279 279 279Business Investment 5 099 3 260 2 622 5 458 9 723 9 966 9 450 5 226 3 594 3 688
Public investment 989 1 556 1 756 1 688 1 291 1 159 960 879 826 778State final demand 20 763 19 649 20 187 22 772 26 939 27 563 27 200 23 400 21 629 21 796Net exports 257 2 234 1 626 1 368 1 561 2 297 21 825 6 052 8 965
Total exports 5 872 6 600 6 488 6 048 6 964 7 394 6 867 7 116 10 275 13 353Total imports 5 615 4 366 4 862 4 680 5 403 5 097 6 846 6 291 4 223 4 387
Balancing item3 ‑ 3 576 ‑ 4 219 ‑ 3 812 ‑ 5 327 ‑ 8 639 ‑ 9 000 ‑ 5 100 ‑ 1 450 ‑ 4 000 ‑ 6 250Gross state product 17 444 17 664 18 002 18 813 19 860 20 860 22 122 22 775 23 680 24 512
Year‑on‑Year Change (%)Total consumption 3.2 0.6 5.0 0.8 3.3 2.4 2.0 3.1 ‑ 0.1 1.0
Household consumption 2.5 ‑ 0.1 5.0 1.2 6.2 3.9 3.2 5.2 ‑ 0.0 1.4Public consumption 4.2 1.5 5.1 0.2 ‑ 0.7 0.3 0.2 ‑ 0.4 ‑ 0.4 0.2
Total investment 21.2 ‑ 16.3 ‑ 2.5 42.2 44.7 2.2 ‑ 5.5 ‑ 37.1 ‑ 24.1 0.2Private investment 24.1 ‑ 28.1 ‑ 7.8 61.8 62.2 3.7 ‑ 4.3 ‑ 39.7 ‑ 26.6 1.3
Dwelling investment - 5.3 33.1 44.2 - 27.8 - 24.6 20.8 4.9 2.4 - 7.3 - 4.4Ownership transfer costs - 2.4 - 3.9 - 26.9 10.6 16.9 4.8 1.9 1.9 0.1 0.1Business Investment 29.9 - 36.1 - 19.6 108.2 78.1 2.5 - 5.2 - 44.7 - 31.2 2.6
Public investment 5.7 57.3 12.9 ‑ 3.9 ‑ 23.5 ‑ 10.2 ‑ 17.2 ‑ 8.4 ‑6.0 ‑ 5.9State final demand 8.9 ‑ 5.4 2.7 12.8 18.3 2.3 ‑ 1.3 ‑ 14.0 ‑ 7.6 0.8Net exports ‑ 66.9 769.3 ‑ 27.2 ‑ 15.9 14.1 47.2 ‑ 99.1 3749.1 633.4 48.1
Total exports 16.5 12.4 ‑ 1.7 ‑ 6.8 15.1 6.2 ‑ 7.1 3.6 44.4 30.0Total imports 31.7 ‑ 22.2 11.4 ‑ 3.7 15.4 ‑ 5.7 34.3 ‑ 8.1 ‑ 32.9 3.9
Balancing item3 11.5 18.0 ‑ 9.6 39.7 62.2 4.2 ‑ 43.3 ‑ 71.6 175.9 56.3Gross state product 4.9 1.3 1.9 4.5 5.6 5.0 6.0 3.0 4.0 3.5
Percentage Point Contribution to Year‑on‑Year GSP Change (ppt)Total consumption 2.5 0.5 3.9 0.6 2.6 1.8 1.5 2.2 ‑ 0.1 0.7
Household consumption 1.1 ‑ 0.0 2.2 0.5 2.8 1.7 1.4 2.3 ‑ 0.0 0.6Public consumption 1.4 0.5 1.7 0.1 ‑ 0.2 0.1 0.1 ‑ 0.1 ‑ 0.1 0.1
Total investment 7.5 ‑ 6.6 ‑ 0.8 13.6 19.6 1.3 ‑ 3.2 ‑ 19.3 ‑ 7.7 0.0Private investment 7.1 ‑ 9.9 ‑ 1.9 13.9 21.7 2.0 ‑ 2.3 ‑ 19.0 ‑ 7.4 0.2
Dwelling investment - 0.2 1.2 2.1 - 1.9 - 1.2 0.7 0.2 0.1 - 0.3 - 0.1Ownership transfer costs - 0.0 - 0.1 - 0.4 0.1 0.2 0.1 0.0 0.0 0.0 0.0Business Investment 7.1 - 10.5 - 3.6 15.8 22.7 1.2 - 2.5 - 19.1 - 7.2 0.4
Public investment 0.3 3.3 1.1 ‑ 0.4 ‑ 2.1 ‑ 0.7 ‑ 1.0 ‑ 0.4 ‑ 0.2 ‑ 0.2State final demand 10.2 ‑ 6.4 3.0 14.4 22.1 3.1 ‑ 1.7 ‑ 17.2 ‑ 7.8 0.7Net exports ‑ 3.1 11.3 ‑ 3.4 ‑ 1.4 1.0 3.7 ‑ 10.9 3.6 22.9 12.3
Total exports 5.0 4.2 ‑ 0.6 ‑ 2.4 4.9 2.2 ‑ 2.5 1.1 13.9 13.0Total imports ‑ 8.1 7.2 ‑ 2.8 1.0 ‑ 3.8 1.5 ‑ 8.4 2.5 9.1 ‑ 0.7
Balancing item3 ‑ 2.2 ‑ 3.7 2.3 ‑ 8.4 ‑ 17.6 ‑ 1.8 18.7 16.5 ‑ 11.2 ‑ 9.5Gross state product 4.9 1.3 1.9 4.5 5.6 5.0 6.0 3.0 4.0 3.5
e: estimate; f: forecast1 Inflation adjusted.2 Components may not add to totals, as chain volume measures are not additive.3 Balancing item includes statistical discrepancy.Source: Department of Treasury and Finance; ABS, Australian National Accounts: State Accounts, Cat. No. 5220.0

26
2014-15 Budget
External Economic Environment 27
Northern Territory Economy
Chapter 3
External Economic Environment
Key Points• The Northern Territory has a relatively small, open economy that is influenced by
international trade, overseas investment, tourism and population movements from within Australia and overseas.
• The Territory’s international trade surplus (that is, exports less imports) decreased from $1.2 billion in 2011‑12 to $0.9 billion in 2012‑13.
• The main markets for Territory exports are Japan, China, Indonesia, the United States and Korea. Economic conditions in these countries are expected to remain favourable over the medium term, supporting demand for Territory exports.
• National economic activity is also expected to support demand for Territory goods and services.
• Risks to a generally positive outlook include a greater than expected slowdown in the Chinese economy and continued historically low numbers of visitors to the Territory.
BackgroundThe Territory has a small and open economy that can be influenced by changes to economic conditions beyond its borders. The performance of the Australian economy impacts on the level of interstate trade and population migration between the Territory and other jurisdictions, as well as the amount of Commonwealth revenue received by the Territory. Global economic conditions influence the level of private investment, demand for Territory‑produced goods and services and migration to the Territory.
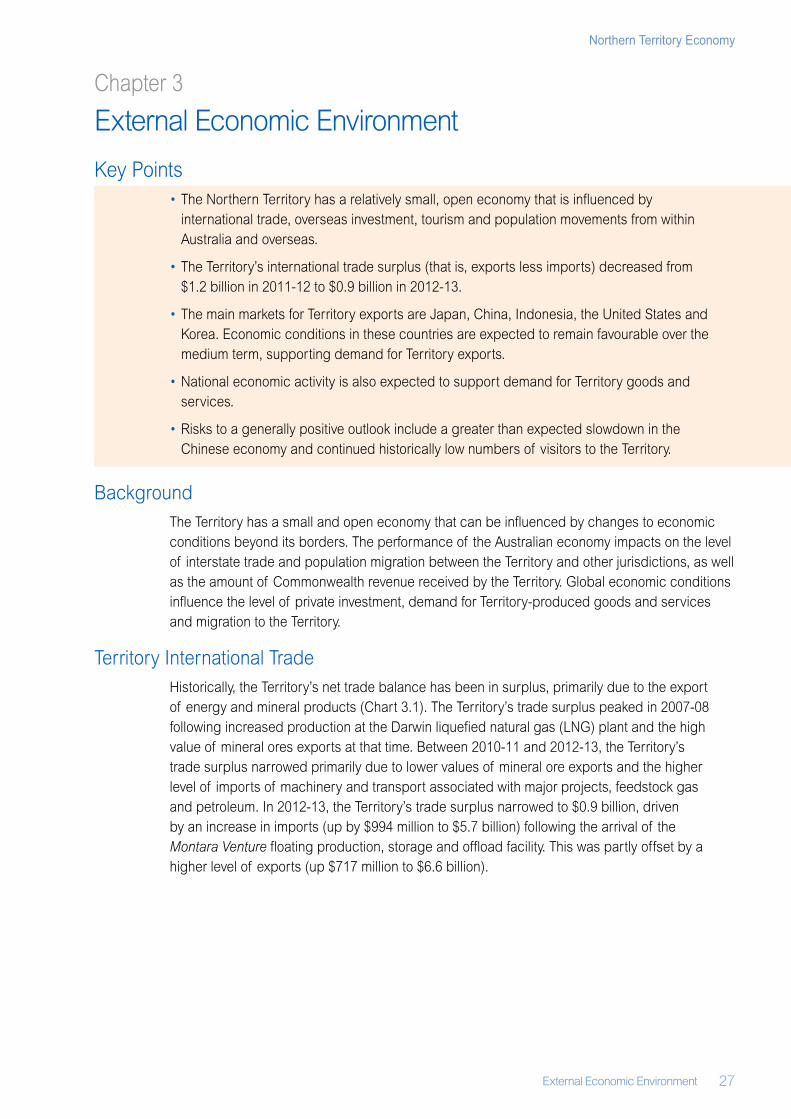
Territory International TradeHistorically, the Territory’s net trade balance has been in surplus, primarily due to the export of energy and mineral products (Chart 3.1). The Territory’s trade surplus peaked in 2007‑08 following increased production at the Darwin liquefied natural gas (LNG) plant and the high value of mineral ores exports at that time. Between 2010‑11 and 2012‑13, the Territory’s trade surplus narrowed primarily due to lower values of mineral ore exports and the higher level of imports of machinery and transport associated with major projects, feedstock gas and petroleum. In 2012‑13, the Territory’s trade surplus narrowed to $0.9 billion, driven by an increase in imports (up by $994 million to $5.7 billion) following the arrival of the Montara Venture floating production, storage and offload facility. This was partly offset by a higher level of exports (up $717 million to $6.6 billion).
28 External Economic Environment
2014-15 Budget
Chart 3.1: International Trade Balance1
e: estimate1 Current prices.Source: Department of Treasury and Finance; ABS, International Trade in Goods and Services, Cat. No. 5368.0
The largest components of the Territory’s international trade balance are goods exports and goods imports. Service exports and service imports, primarily consisting of travel, transport and government services, account for a small proportion of the Territory’s international trade.
Australian Bureau of Statistics (ABS) international goods trade data for the Territory includes a significant proportion of confidentialised commodities. The ABS classifies items as confidential where the producer’s privacy may be risked by publication. For example, where there is only one producer of a particular commodity in a jurisdiction, reporting trade statistics for this good or service would unfairly identify the sole operator in a way that does not occur when there are multiple producers.
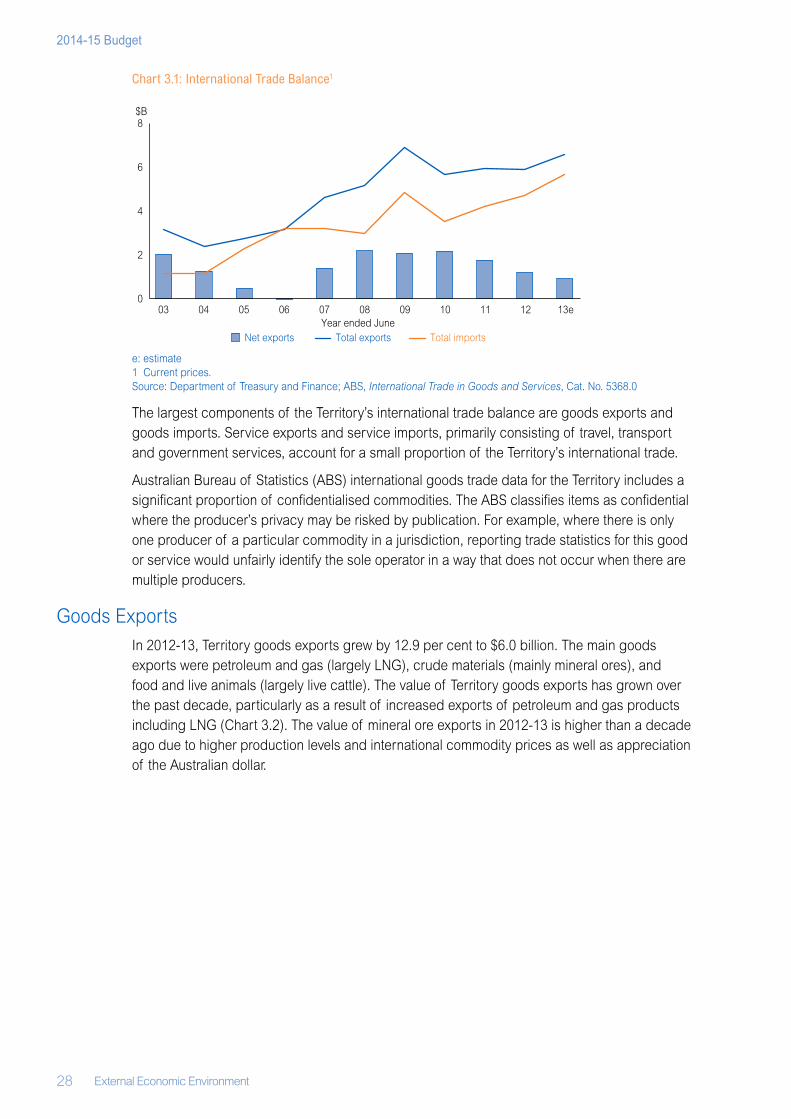
Goods ExportsIn 2012‑13, Territory goods exports grew by 12.9 per cent to $6.0 billion. The main goods exports were petroleum and gas (largely LNG), crude materials (mainly mineral ores), and food and live animals (largely live cattle). The value of Territory goods exports has grown over the past decade, particularly as a result of increased exports of petroleum and gas products including LNG (Chart 3.2). The value of mineral ore exports in 2012‑13 is higher than a decade ago due to higher production levels and international commodity prices as well as appreciation of the Australian dollar.
0
2
4
6
8
03 04 05 06 07 08 09 10 11 12 13e
Net exports Total exports Total imports
$B
Year ended June
External Economic Environment 29
Northern Territory Economy
Chart 3.2: International Goods Exports1
1 Current prices.2 Primarily alumina.Source: Department of Treasury and Finance; ABS, International Trade in Goods and Services, Cat. No. 5368.0
The level of goods exports for the first eight months of 2013‑14 is higher than at the same time the previous year, which suggests that goods exports will grow in 2013‑14. Over the budget and forward estimates period, the level of goods exports is expected to grow substantially, coinciding with an expected increase in LNG exports once production commences at the Ichthys plant.
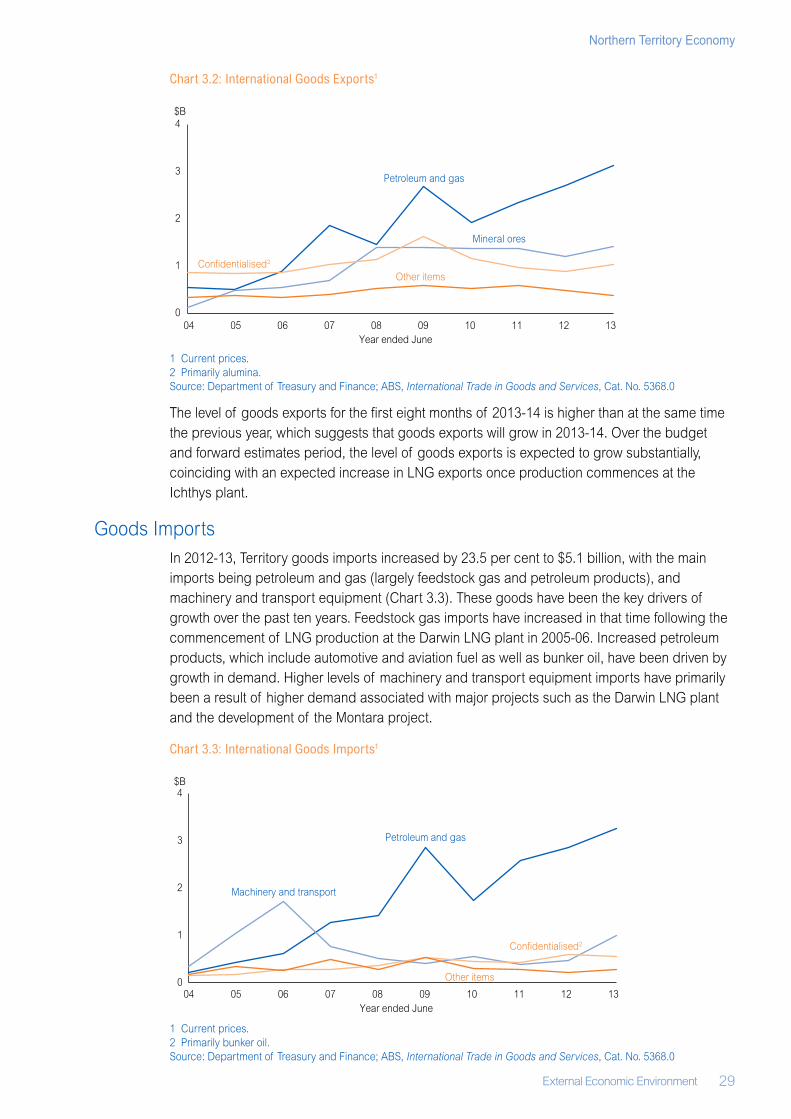
Goods ImportsIn 2012‑13, Territory goods imports increased by 23.5 per cent to $5.1 billion, with the main imports being petroleum and gas (largely feedstock gas and petroleum products), and machinery and transport equipment (Chart 3.3). These goods have been the key drivers of growth over the past ten years. Feedstock gas imports have increased in that time following the commencement of LNG production at the Darwin LNG plant in 2005‑06. Increased petroleum products, which include automotive and aviation fuel as well as bunker oil, have been driven by growth in demand. Higher levels of machinery and transport equipment imports have primarily been a result of higher demand associated with major projects such as the Darwin LNG plant and the development of the Montara project.
Chart 3.3: International Goods Imports1
1 Current prices.2 Primarily bunker oil.Source: Department of Treasury and Finance; ABS, International Trade in Goods and Services, Cat. No. 5368.0
0
1
2
3
4
04 05 06 07 08 09 10 11 12 13Year ended June
$B
Mineral ores
Other items
Petroleum and gas
Confidentialised2
0
1
2
3
4
04 05 06 07 08 09 10 11 12 13
Petroleum and gas
Confidentialised2
Machinery and transport
Other items
$B
Year ended June
30 External Economic Environment
2014-15 Budget
In the eight months to February 2014, goods imports have declined substantially compared with the same period last year. However, the final value of imports to the Territory in 2013‑14 will largely depend on the timing of arrival of the pre‑assembled modules for the Ichthys project, which can considerably add to the value of imports.
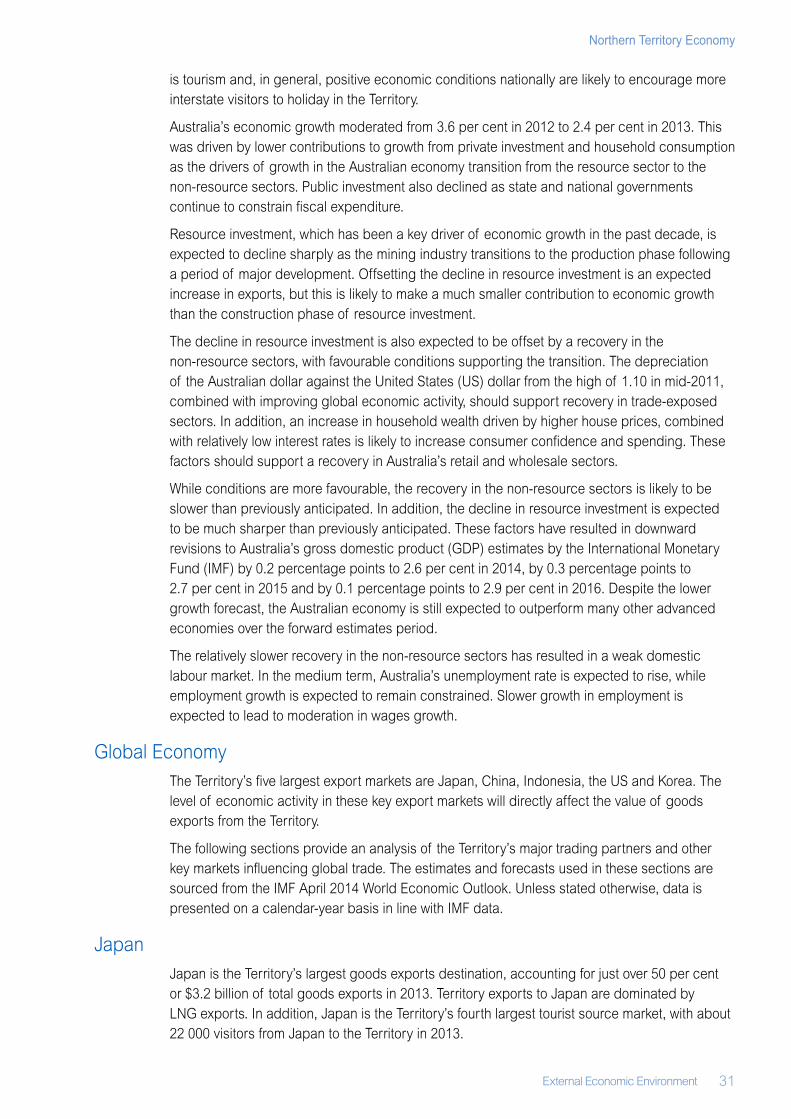
Service Exports and ImportsIn 2012‑13 the net trade balance for services increased from $64 million in 2011‑12 to $82 million. This was driven by a 6.0 per cent increase in service exports to $634 million, partly offset by a 3.4 per cent increase in service imports to $552 million (Chart 3.4).
Chart 3.4: International Services Exports and Imports1
1 Current prices.Source: Department of Treasury and Finance; ABS, International Trade in Goods and Services, Cat. No. 5368.0
International service exports represent income received by local businesses from overseas travellers, foreign businesses and foreign government personnel (mostly defence), for services provided including meals, accommodation, entertainment and tourism activities. The majority of Territory service exports are ‘travel services’ (65.5 per cent) followed by ‘government services’ (18.1 per cent). The largest proportion of ‘travel services’ exports were personal travel for reasons other than education. This accounted for almost 40 per cent of all service exports in the Territory and covered spending by visitors to the Territory for health reasons as well as for recreation and culture (including holidays, and visiting friends and family). Service exports increased in 2012‑13 mainly due to higher levels of business travel services and technical, trade‑related and other business services.
Service imports in the Territory are primarily driven by demand for overseas travel by Territorians (54.9 per cent) and transportation services (42.2 per cent) such as shipment and freight services provided by foreign operators and passenger fares. In 2012‑13, growth in import services was primarily due to increased freight services reflecting increased international goods imports, which require international freight services.
National EconomyThe national economy is important to the Territory primarily through interstate trade and Commonwealth revenue. Goods and services tax (GST) revenue accounts for around 50 per cent of the Territory Government revenue, while a further 20 per cent is provided in the form of tied Commonwealth grants and subsidies. The Territory’s GST revenue is directly impacted by the economic performance of the national economy with growth in economic activity generally increasing national GST collections. A key interstate trade item for the Territory
0
200
400
600
800
04 05 06 07 08 09 10 11 12 13Year ended June
Net exports Exports Imports
$M
External Economic Environment 31
Northern Territory Economy
is tourism and, in general, positive economic conditions nationally are likely to encourage more interstate visitors to holiday in the Territory.
Australia’s economic growth moderated from 3.6 per cent in 2012 to 2.4 per cent in 2013. This was driven by lower contributions to growth from private investment and household consumption as the drivers of growth in the Australian economy transition from the resource sector to the non‑resource sectors. Public investment also declined as state and national governments continue to constrain fiscal expenditure.
Resource investment, which has been a key driver of economic growth in the past decade, is expected to decline sharply as the mining industry transitions to the production phase following a period of major development. Offsetting the decline in resource investment is an expected increase in exports, but this is likely to make a much smaller contribution to economic growth than the construction phase of resource investment.
The decline in resource investment is also expected to be offset by a recovery in the non‑resource sectors, with favourable conditions supporting the transition. The depreciation of the Australian dollar against the United States (US) dollar from the high of 1.10 in mid‑2011, combined with improving global economic activity, should support recovery in trade‑exposed sectors. In addition, an increase in household wealth driven by higher house prices, combined with relatively low interest rates is likely to increase consumer confidence and spending. These factors should support a recovery in Australia’s retail and wholesale sectors.
While conditions are more favourable, the recovery in the non‑resource sectors is likely to be slower than previously anticipated. In addition, the decline in resource investment is expected to be much sharper than previously anticipated. These factors have resulted in downward revisions to Australia’s gross domestic product (GDP) estimates by the International Monetary Fund (IMF) by 0.2 percentage points to 2.6 per cent in 2014, by 0.3 percentage points to 2.7 per cent in 2015 and by 0.1 percentage points to 2.9 per cent in 2016. Despite the lower growth forecast, the Australian economy is still expected to outperform many other advanced economies over the forward estimates period.
The relatively slower recovery in the non‑resource sectors has resulted in a weak domestic labour market. In the medium term, Australia’s unemployment rate is expected to rise, while employment growth is expected to remain constrained. Slower growth in employment is expected to lead to moderation in wages growth.
Global EconomyThe Territory’s five largest export markets are Japan, China, Indonesia, the US and Korea. The level of economic activity in these key export markets will directly affect the value of goods exports from the Territory.
The following sections provide an analysis of the Territory’s major trading partners and other key markets influencing global trade. The estimates and forecasts used in these sections are sourced from the IMF April 2014 World Economic Outlook. Unless stated otherwise, data is presented on a calendar‑year basis in line with IMF data.
JapanJapan is the Territory’s largest goods exports destination, accounting for just over 50 per cent or $3.2 billion of total goods exports in 2013. Territory exports to Japan are dominated by LNG exports. In addition, Japan is the Territory’s fourth largest tourist source market, with about 22 000 visitors from Japan to the Territory in 2013.
32 External Economic Environment
2014-15 Budget
Japan’s economy is expected to have strengthened in 2013, following substantial stimulus policies that supported private consumption and investment. The IMF forecasts Japan’s economic growth to moderate from 2014 onwards and average about 1.0 per cent between 2014 and 2017. The IMF states that the consumption tax hike in 2014 and the decline in reconstruction expenditure will more than offset the impact of the government’s stimulus policies.
The forecast of relatively weak economic growth in Japan over the forward years may affect the number of Japanese tourists coming to the Territory, but it is not expected to have a significant impact on Territory goods exports to Japan. LNG exports are sold on long‑term contracts, and therefore are less influenced by economic conditions in Japan. Rather, operational matters are likely to influence exports with a decline in LNG exports expected in 2014 following a scheduled maintenance shutdown at the Darwin LNG plant. From 2015 onwards, goods exports to Japan are expected to return to normal levels of production and grow substantially once production at the Ichthys LNG plant commences (scheduled for 2016‑17).
On 7 April 2014, the Prime Minister of Australia announced the conclusion of negotiations for an economic partnership agreement with Japan. Australia is the first major agriculture exporting nation to conclude an agreement with Japan. The Japan‑Australia Economic Partnership Agreement (JAEPA) has the potential to deliver significant benefits to the agricultural industry in Australia and the Territory. Once in force, JAEPA has the potential to deliver Australian exporters a significant competitive advantage, with Australian exporters of beef and horticulture to benefit through preferential access to the Japanese markets and the progressive reduction in tariffs on Australian beef and horticultural exports over time.
ChinaChina is the Territory’s second largest export destination, accounting for one quarter or $1.6 billion of the Territory’s total goods exports. The main goods exports to China are metal ores such as manganese and iron ore, as well as concentrates such as zinc and lead. In addition, China is one of the Territory’s fastest growing tourist source markets. The number of visitors from China to the Territory has increased from about 1900 in 2004 to an estimated 5000 in 2013.
In January 2014, the IMF revised upwards its short‑term forecast of economic growth in China, reflecting an investment surge in the second half of 2013, although this is expected to be temporary. The forecasts were unchanged in the April 2014 publication. China’s economic growth is expected to moderate in the medium term, but still remain relatively high, due to policy measures aimed at moving the economy to sustainable levels of growth. The Chinese Government has set a target economic growth rate of 7.5 per cent for 2014, which is lower than the ten‑year average of 10 per cent.
A moderation in China’s economic growth over the medium term would pose a risk to Territory exports to China. Weaker demand for mineral ores could affect both the volume and price of these exports. Furthermore, slowing economic growth in China may dampen the rate of increase in the number of Chinese visitors to the Territory. Imports from China are expected to grow significantly in the short term, reflecting the arrival of pre‑assembled modules and equipment required for the Ichthys project that are currently under construction in China.
IndonesiaIndonesia was the Territory’s third largest export destination and the Territory’s largest export market for live cattle in 2013. Goods exports to Indonesia accounted for 4.4 per cent or
External Economic Environment 33
Northern Territory Economy
$270 million of total exports in 2013. Of this amount, about $200 million related to live cattle exports.
Between 2010 and 2012, live cattle exports to Indonesia declined substantially. This was due to a number of factors including the reduction of quotas, the introduction of weight restrictions by the Indonesian Government and the live cattle trade ban implemented by the Commonwealth Government in 2011. While the live cattle trade ban was temporary, lasting just over a month, it was followed by the introduction of the Exporter Supply Chain Assurance System, which slowed live cattle exports, as agents involved adjusted to the new regulations.
In 2013, the previous downward trend in Territory exports to Indonesia was reversed, with the value of exports nearly doubling primarily reflecting an increase in live cattle export quotas. Live cattle exports to Indonesia are forecast to increase in the forward years as Indonesia changes from the quota system to a price‑based system, which is based on whether the beef prices are above or below an affordable level as determined by the Indonesian Government.
The IMF estimates Indonesia’s economy to grow by 5.4 per cent in 2014, down from 5.8 per cent in 2013. Indonesia’s economy is forecast to grow by an average of 5.9 per cent from 2015 onwards. The increased prosperity associated with strong economic growth should benefit the Territory with a growing middle class in Indonesia consuming more beef and increasing demand for live cattle exports.
United States The US was the fourth largest merchandise export destination for the Territory, accounting for 2.6 per cent or $160 million of total goods exports in 2013. In addition, the US is a key source market for international visitors to the Territory, accounting for about 14 per cent of total international visitors to the Territory in 2013.
Economic growth in the US was weak in 2013, reflecting stronger than expected fiscal consolidation. The IMF forecasts economic activity to recover in forward years driven by an increase in private demand and an easing of fiscal constraints. Strengthening economic growth in the US is expected to have a positive impact on Territory exports, primarily through the trade relationships the US has with the Territory’s major trading partners such as China, through growing demand for those countries’ export products.
KoreaIn 2013, Territory goods exports to Korea totalled $160 million, dominated by metal ores exports. Korea was the Territory’s fifth largest goods export destination in 2013.
The IMF estimated economic growth in Korea to strengthen to 2.8 per cent in 2013 due to a recovery in exports as well as higher private consumption and investment, but domestic demand would remain relatively weak. To support the economy, the Korean Government authorised borrowings to finance increased public spending in its supplementary budget released in May 2013 and delayed the deadline for restoring balance between revenue and expenditure.
As a result, the Korean economy is expected to strengthen from 2014 onwards largely due to stronger recovery in domestic consumption as well as a recovery in investment due to increased exports. Stronger growth in the Korean economy should continue to support Territory exports to Korea. Pre‑assembled modules and equipment required for the Ichthys project are currently being built in Korea. Once completed and imported to the Territory, these will detract from the Territory’s net exports.
34 External Economic Environment
2014-15 Budget
The Korea‑Australia Free Trade Agreement (KAFTA) will assist Australian and Territory exporters to expand into the Korean market. KAFTA was signed by the Korean and Australian governments on 8 April 2014 and is expected to be in force by the end of 2014. Key features for Territory exporters under KAFTA include the agreement by Korea to:
• progressively eliminate the 40 per cent tariff on beef from Australia over the next 15 years, which would allow Australian beef exporters to compete on an equal footing against US beef exporters for market share in Korea;
• progressively eliminate the 30 per cent tariff on mangoes from Australia over the next ten years; and
• immediately eliminate (when the agreement comes into force) the 3 per cent tariff on natural gas imports from Australia.
EuropeEurope is important to the Territory through direct and indirect trade links. European countries that directly receive merchandise goods from the Territory include Belgium, France, Germany, Spain and the Netherlands. These countries accounted for 1.4 per cent of total Territory merchandise exports. Although Europe does not receive a significant proportion of the Territory’s goods exports, it has significant trade ties with China, the Territory’s second largest goods export destination, meaning that European demand for Chinese exports can indirectly influence Territory exports.
Europe is also a large source market of international tourists. The main source economies are the United Kingdom, Germany, France, Switzerland, the Netherlands and Scandinavia. European visitors accounted for about 54 per cent of total international visitors to the Territory in 2013, with the largest proportion of international tourists from the United Kingdom (about 14 per cent of the total number of international visitors). The number of international visitors from Europe has trended downwards over the past decade, with a significant decline recorded since 2007, coinciding with the increased uncertainty and weak economic and employment conditions in the European region during this period.
The IMF expects that economic growth in the European Union was 0.2 in 2013, but growth is expected to recover over the medium term driven by increasing external demand. High debt and fiscal consolidation is, however, expected to continue to constrain growth and in these conditions, numbers of European tourists to the Territory may remain subdued over coming years.
Emerging Export Markets In the past decade, the Territory has experienced substantial growth in exports to emerging markets in Asia, coinciding with the robust economic growth and the expanding middle class population in the region. These markets include Thailand, Vietnam, Malaysia and India.
ThailandTerritory goods exports to Thailand increased from $8 million in 2012 to $134 million in 2013, predominantly due to the commencement of exports in 2013 from the Montara project, located 690 kilometres west of Darwin. Thailand was ranked as the sixth largest Territory goods export destination in 2013.
The recent political unrest in Thailand weighed heavily on the economy and the IMF estimates Thailand’s economy to have only grown by 2.9 per cent in 2013, down from 6.5 per cent in
External Economic Environment 35
Northern Territory Economy
2012. The IMF expects economic growth in Thailand to average about 3.9 per cent per annum between 2014 and 2017. Despite the lower growth forecast, this is not expected to diminish Thailand’s need for Territory exports of oil, with oil production expected to increase as additional wells come into production at the Montara project. Imports from Thailand are expected to increase following arrival of pre‑assembled modules and equipment required for the Ichthys project, which are currently being built in Thailand.
VietnamVietnam is emerging as a key export destination for the Territory’s agriculture industry. Historically, Vietnam accounted for a very small proportion of the Territory’s international exports, however, since late 2012, Vietnam has grown in prominence, with the value of exports increasing from $4 million in 2012 to $35 million in 2013. The increase is due to the commencement of regular live cattle exports in October 2012. Vietnam has become the Territory’s second largest live cattle export market after Indonesia. Vietnam is also projected to become an important buffalo export market for the Territory, with the first buffalo shipment sent in February 2014.
The IMF expects economic growth in Vietnam to strengthen from 5.4 per cent in 2013 to an average of 5.8 per cent per annum between 2014 and 2017. Strong economic growth and an expanding middle class are expected to support continued growth in exports of Territory livestock to Vietnam.
IndiaIn India, economic output increased by an average of 7.5 per cent per annum between 2004 and 2013. The substantial growth in the economy coincided with an increase in the value of Territory goods exports to India, which comprised mainly mineral ores. The proportion of Territory goods exports to India has grown from 0.6 per cent in 2004 to 2.0 per cent in 2013.
India’s economic performance has weakened substantially in 2012 and 2013, following periods of robust growth. The IMF estimates that India’s economy expanded by 4.4 per cent in 2013, well below the ten‑year average. The slowdown in growth was mainly due to global economic weakness and domestic supply limits, which resulted in declines in infrastructure and corporate investment. In addition, the persistently high inflation remains a key concern for the economy. The IMF forecasts India’s economy to recover from 2014 onwards, with growth projected to average 6.2 per cent per annum to 2017. Accordingly, there may be only modest growth in Territory exports to India in the short term, but prospects for growth in the longer term appear more positive.
MalaysiaMalaysia was one of the Territory’s fastest growing emerging export markets in 2013. Territory exports to Malaysia increased from $15 million in 2012 to $54 million in 2013.
Economic growth in Malaysia moderated in 2013, but remained relatively high at 4.7 per cent, largely due to strong investment, consumption and external demand. The IMF estimates Malaysia’s growth to strengthen to 5.2 per cent in 2014 and moderate to 5.0 per cent from 2015 onwards. Growth is expected to be supported by investment projects, household consumption (supported by a strong labour market) and external demand. Robust economic growth in Malaysia over the budget and forward estimates period should see Malaysia continue to grow in importance as an export destination.
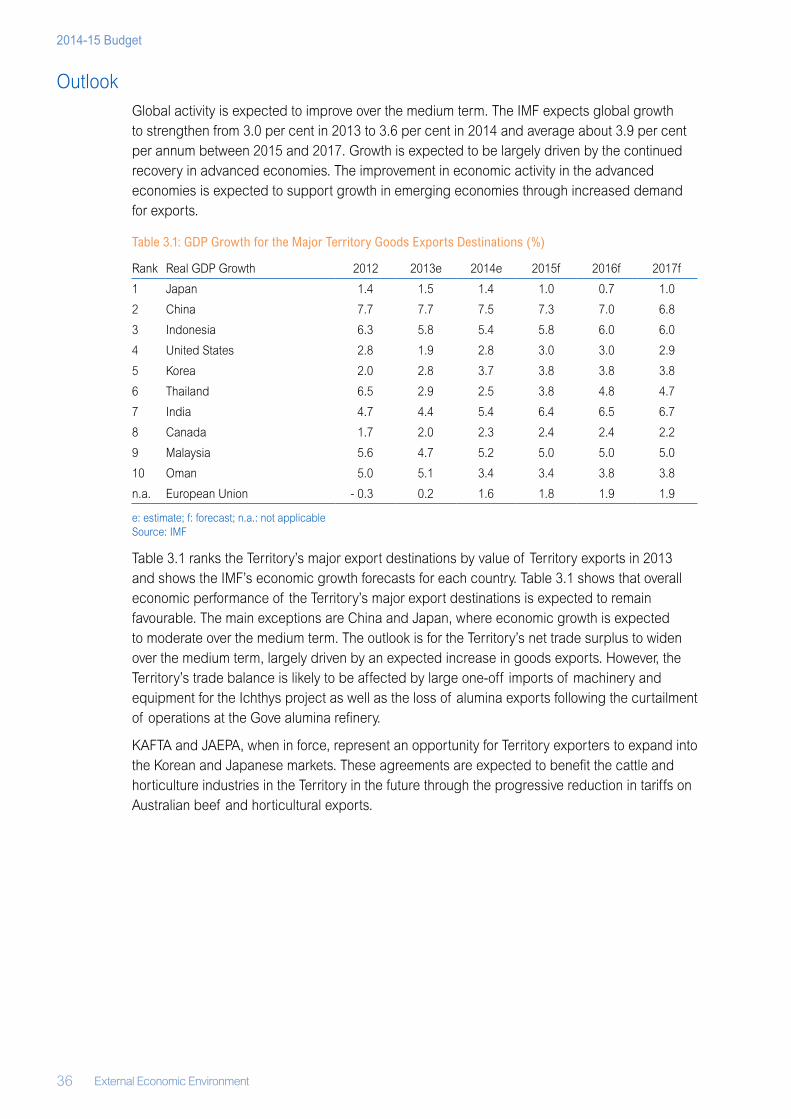
36 External Economic Environment
2014-15 Budget
OutlookGlobal activity is expected to improve over the medium term. The IMF expects global growth to strengthen from 3.0 per cent in 2013 to 3.6 per cent in 2014 and average about 3.9 per cent per annum between 2015 and 2017. Growth is expected to be largely driven by the continued recovery in advanced economies. The improvement in economic activity in the advanced economies is expected to support growth in emerging economies through increased demand for exports.
Table 3.1: GDP Growth for the Major Territory Goods Exports Destinations (%)
Rank Real GDP Growth 2012 2013e 2014e 2015f 2016f 2017f
1 Japan 1.4 1.5 1.4 1.0 0.7 1.0
2 China 7.7 7.7 7.5 7.3 7.0 6.8
3 Indonesia 6.3 5.8 5.4 5.8 6.0 6.0
4 United States 2.8 1.9 2.8 3.0 3.0 2.9
5 Korea 2.0 2.8 3.7 3.8 3.8 3.8
6 Thailand 6.5 2.9 2.5 3.8 4.8 4.7
7 India 4.7 4.4 5.4 6.4 6.5 6.7
8 Canada 1.7 2.0 2.3 2.4 2.4 2.2
9 Malaysia 5.6 4.7 5.2 5.0 5.0 5.0
10 Oman 5.0 5.1 3.4 3.4 3.8 3.8
n.a. European Union ‑ 0.3 0.2 1.6 1.8 1.9 1.9
e: estimate; f: forecast; n.a.: not applicableSource: IMF
Table 3.1 ranks the Territory’s major export destinations by value of Territory exports in 2013 and shows the IMF’s economic growth forecasts for each country. Table 3.1 shows that overall economic performance of the Territory’s major export destinations is expected to remain favourable. The main exceptions are China and Japan, where economic growth is expected to moderate over the medium term. The outlook is for the Territory’s net trade surplus to widen over the medium term, largely driven by an expected increase in goods exports. However, the Territory’s trade balance is likely to be affected by large one‑off imports of machinery and equipment for the Ichthys project as well as the loss of alumina exports following the curtailment of operations at the Gove alumina refinery.
KAFTA and JAEPA, when in force, represent an opportunity for Territory exporters to expand into the Korean and Japanese markets. These agreements are expected to benefit the cattle and horticulture industries in the Territory in the future through the progressive reduction in tariffs on Australian beef and horticultural exports.
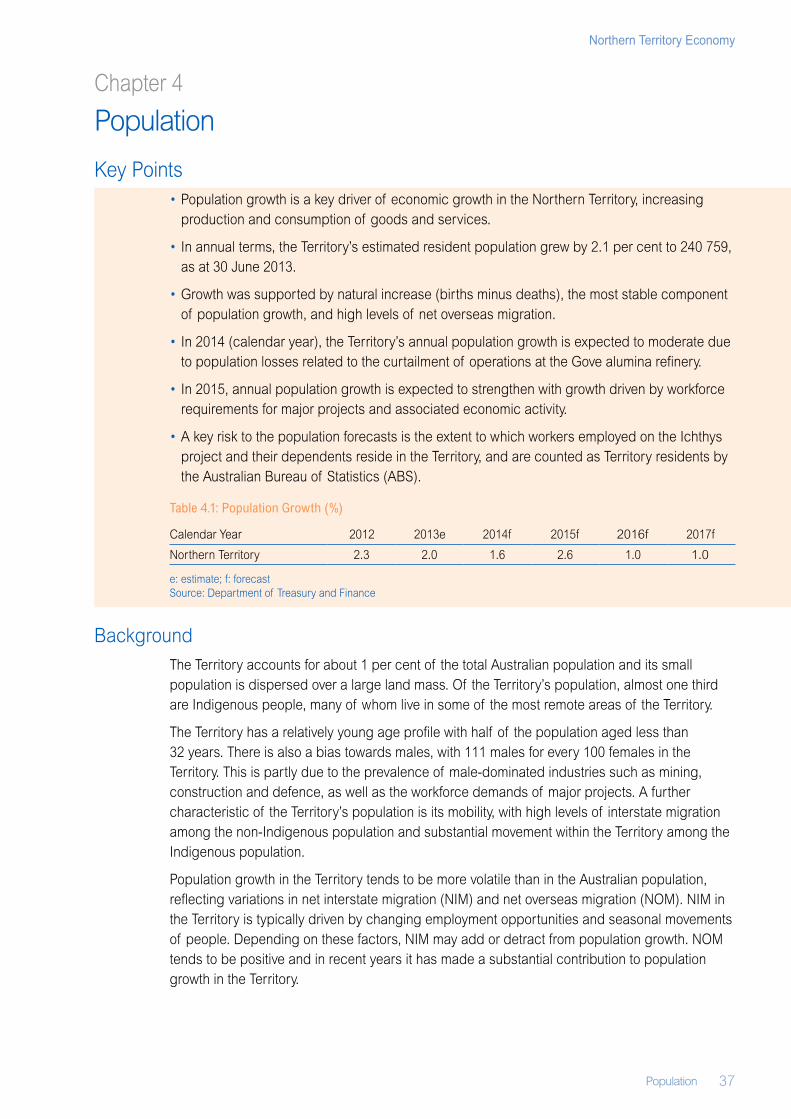
Population 37
Northern Territory Economy
Chapter 4
Population
Key Points• Population growth is a key driver of economic growth in the Northern Territory, increasing
production and consumption of goods and services.
• In annual terms, the Territory’s estimated resident population grew by 2.1 per cent to 240 759, as at 30 June 2013.
• Growth was supported by natural increase (births minus deaths), the most stable component of population growth, and high levels of net overseas migration.
• In 2014 (calendar year), the Territory’s annual population growth is expected to moderate due to population losses related to the curtailment of operations at the Gove alumina refinery.
• In 2015, annual population growth is expected to strengthen with growth driven by workforce requirements for major projects and associated economic activity.
• A key risk to the population forecasts is the extent to which workers employed on the Ichthys project and their dependents reside in the Territory, and are counted as Territory residents by the Australian Bureau of Statistics (ABS).
Table 4.1: Population Growth (%)
Calendar Year 2012 2013e 2014f 2015f 2016f 2017f
Northern Territory 2.3 2.0 1.6 2.6 1.0 1.0
e: estimate; f: forecast Source: Department of Treasury and Finance
BackgroundThe Territory accounts for about 1 per cent of the total Australian population and its small population is dispersed over a large land mass. Of the Territory’s population, almost one third are Indigenous people, many of whom live in some of the most remote areas of the Territory.
The Territory has a relatively young age profile with half of the population aged less than 32 years. There is also a bias towards males, with 111 males for every 100 females in the Territory. This is partly due to the prevalence of male‑dominated industries such as mining, construction and defence, as well as the workforce demands of major projects. A further characteristic of the Territory’s population is its mobility, with high levels of interstate migration among the non‑Indigenous population and substantial movement within the Territory among the Indigenous population.
Population growth in the Territory tends to be more volatile than in the Australian population, reflecting variations in net interstate migration (NIM) and net overseas migration (NOM). NIM in the Territory is typically driven by changing employment opportunities and seasonal movements of people. Depending on these factors, NIM may add or detract from population growth. NOM tends to be positive and in recent years it has made a substantial contribution to population growth in the Territory.
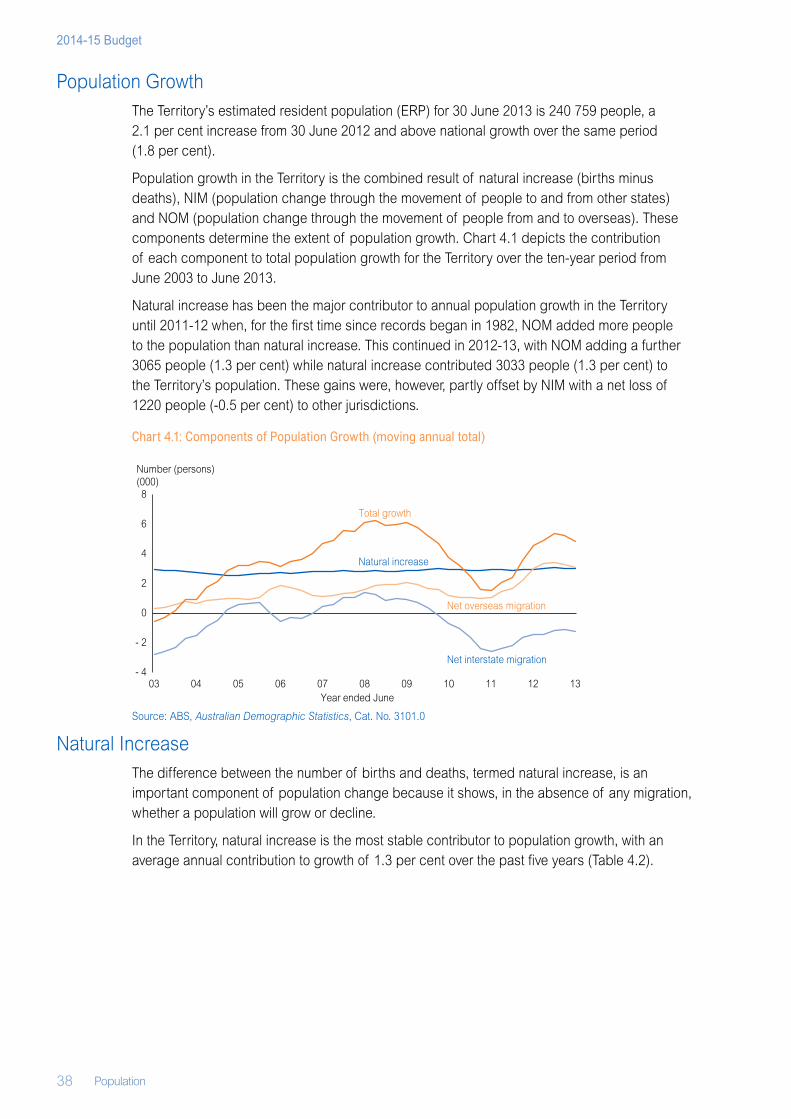
38 Population
2014-15 Budget
Population GrowthThe Territory’s estimated resident population (ERP) for 30 June 2013 is 240 759 people, a 2.1 per cent increase from 30 June 2012 and above national growth over the same period (1.8 per cent).
Population growth in the Territory is the combined result of natural increase (births minus deaths), NIM (population change through the movement of people to and from other states) and NOM (population change through the movement of people from and to overseas). These components determine the extent of population growth. Chart 4.1 depicts the contribution of each component to total population growth for the Territory over the ten‑year period from June 2003 to June 2013.
Natural increase has been the major contributor to annual population growth in the Territory until 2011‑12 when, for the first time since records began in 1982, NOM added more people to the population than natural increase. This continued in 2012‑13, with NOM adding a further 3065 people (1.3 per cent) while natural increase contributed 3033 people (1.3 per cent) to the Territory’s population. These gains were, however, partly offset by NIM with a net loss of 1220 people (‑0.5 per cent) to other jurisdictions.
Chart 4.1: Components of Population Growth (moving annual total)
Source: ABS, Australian Demographic Statistics, Cat. No. 3101.0
Natural IncreaseThe difference between the number of births and deaths, termed natural increase, is an important component of population change because it shows, in the absence of any migration, whether a population will grow or decline.
In the Territory, natural increase is the most stable contributor to population growth, with an average annual contribution to growth of 1.3 per cent over the past five years (Table 4.2).
- 4
- 2
0
2
4
6
8
03 04 05 06 07 08 09 10 11 12 13
Total growth
Natural increase
Net overseas migration
Net interstate migration
Year ended June
Number (persons) (000)
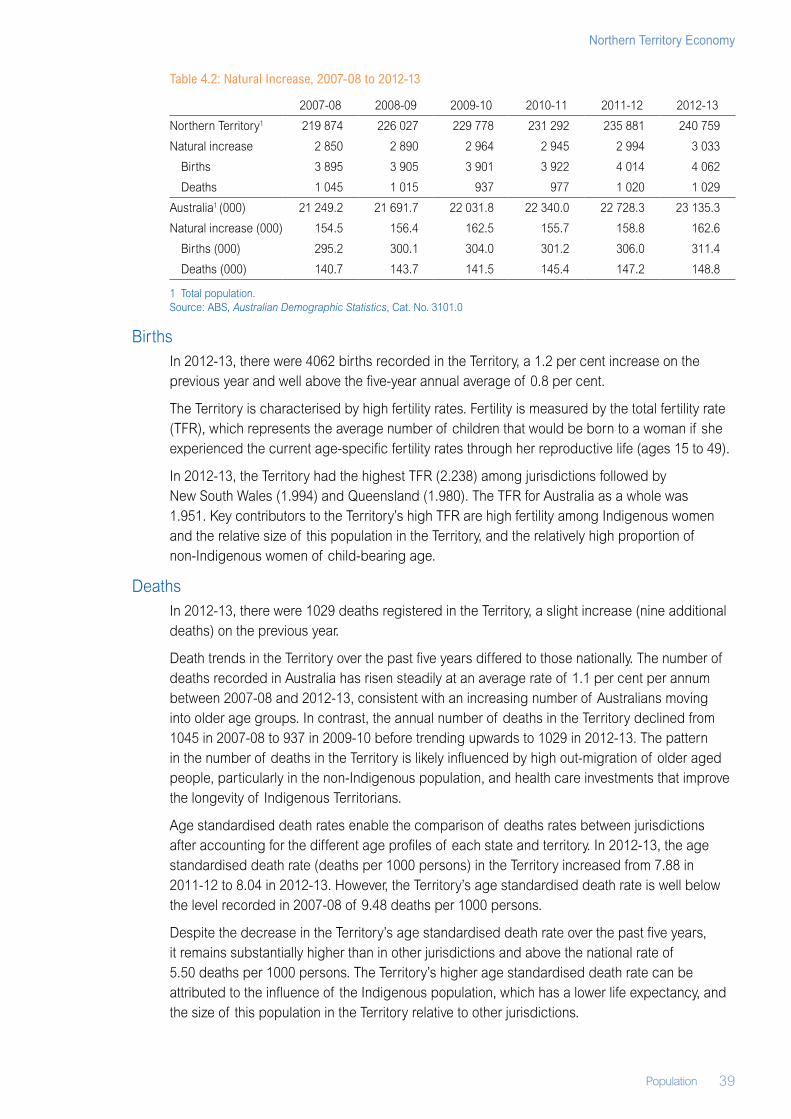
Population 39
Northern Territory Economy
Table 4.2: Natural Increase, 2007‑08 to 2012‑13
2007‑08 2008‑09 2009‑10 2010‑11 2011‑12 2012‑13
Northern Territory1 219 874 226 027 229 778 231 292 235 881 240 759
Natural increase 2 850 2 890 2 964 2 945 2 994 3 033
Births 3 895 3 905 3 901 3 922 4 014 4 062
Deaths 1 045 1 015 937 977 1 020 1 029
Australia1 (000) 21 249.2 21 691.7 22 031.8 22 340.0 22 728.3 23 135.3
Natural increase (000) 154.5 156.4 162.5 155.7 158.8 162.6
Births (000) 295.2 300.1 304.0 301.2 306.0 311.4
Deaths (000) 140.7 143.7 141.5 145.4 147.2 148.8
1 Total population.Source: ABS, Australian Demographic Statistics, Cat. No. 3101.0
BirthsIn 2012‑13, there were 4062 births recorded in the Territory, a 1.2 per cent increase on the previous year and well above the five‑year annual average of 0.8 per cent.
The Territory is characterised by high fertility rates. Fertility is measured by the total fertility rate (TFR), which represents the average number of children that would be born to a woman if she experienced the current age‑specific fertility rates through her reproductive life (ages 15 to 49).
In 2012‑13, the Territory had the highest TFR (2.238) among jurisdictions followed by New South Wales (1.994) and Queensland (1.980). The TFR for Australia as a whole was 1.951. Key contributors to the Territory’s high TFR are high fertility among Indigenous women and the relative size of this population in the Territory, and the relatively high proportion of non‑Indigenous women of child‑bearing age.
DeathsIn 2012‑13, there were 1029 deaths registered in the Territory, a slight increase (nine additional deaths) on the previous year.
Death trends in the Territory over the past five years differed to those nationally. The number of deaths recorded in Australia has risen steadily at an average rate of 1.1 per cent per annum between 2007‑08 and 2012‑13, consistent with an increasing number of Australians moving into older age groups. In contrast, the annual number of deaths in the Territory declined from 1045 in 2007‑08 to 937 in 2009‑10 before trending upwards to 1029 in 2012‑13. The pattern in the number of deaths in the Territory is likely influenced by high out‑migration of older aged people, particularly in the non‑Indigenous population, and health care investments that improve the longevity of Indigenous Territorians.
Age standardised death rates enable the comparison of deaths rates between jurisdictions after accounting for the different age profiles of each state and territory. In 2012‑13, the age standardised death rate (deaths per 1000 persons) in the Territory increased from 7.88 in 2011‑12 to 8.04 in 2012‑13. However, the Territory’s age standardised death rate is well below the level recorded in 2007‑08 of 9.48 deaths per 1000 persons.
Despite the decrease in the Territory’s age standardised death rate over the past five years, it remains substantially higher than in other jurisdictions and above the national rate of 5.50 deaths per 1000 persons. The Territory’s higher age standardised death rate can be attributed to the influence of the Indigenous population, which has a lower life expectancy, and the size of this population in the Territory relative to other jurisdictions.
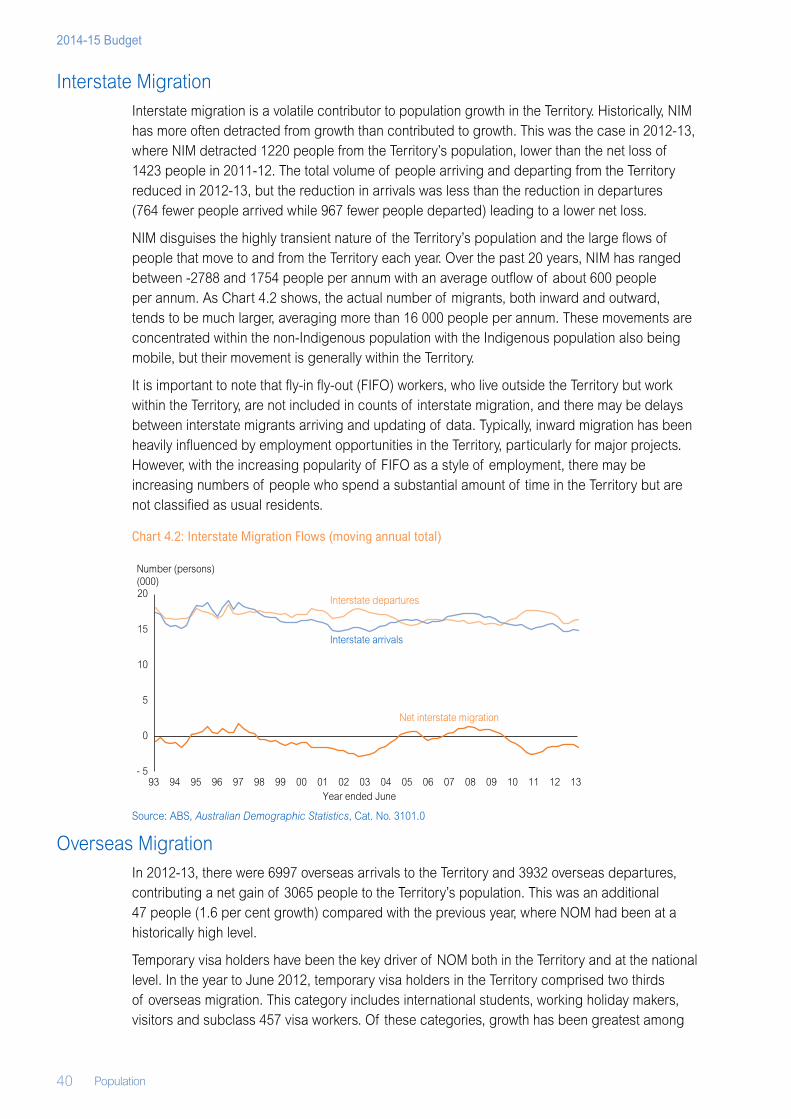
40 Population
2014-15 Budget
Interstate MigrationInterstate migration is a volatile contributor to population growth in the Territory. Historically, NIM has more often detracted from growth than contributed to growth. This was the case in 2012‑13, where NIM detracted 1220 people from the Territory’s population, lower than the net loss of 1423 people in 2011‑12. The total volume of people arriving and departing from the Territory reduced in 2012‑13, but the reduction in arrivals was less than the reduction in departures (764 fewer people arrived while 967 fewer people departed) leading to a lower net loss.
NIM disguises the highly transient nature of the Territory’s population and the large flows of people that move to and from the Territory each year. Over the past 20 years, NIM has ranged between ‑2788 and 1754 people per annum with an average outflow of about 600 people per annum. As Chart 4.2 shows, the actual number of migrants, both inward and outward, tends to be much larger, averaging more than 16 000 people per annum. These movements are concentrated within the non‑Indigenous population with the Indigenous population also being mobile, but their movement is generally within the Territory.
It is important to note that fly‑in fly‑out (FIFO) workers, who live outside the Territory but work within the Territory, are not included in counts of interstate migration, and there may be delays between interstate migrants arriving and updating of data. Typically, inward migration has been heavily influenced by employment opportunities in the Territory, particularly for major projects. However, with the increasing popularity of FIFO as a style of employment, there may be increasing numbers of people who spend a substantial amount of time in the Territory but are not classified as usual residents.
Chart 4.2: Interstate Migration Flows (moving annual total)
Source: ABS, Australian Demographic Statistics, Cat. No. 3101.0
Overseas MigrationIn 2012‑13, there were 6997 overseas arrivals to the Territory and 3932 overseas departures, contributing a net gain of 3065 people to the Territory’s population. This was an additional 47 people (1.6 per cent growth) compared with the previous year, where NOM had been at a historically high level.
Temporary visa holders have been the key driver of NOM both in the Territory and at the national level. In the year to June 2012, temporary visa holders in the Territory comprised two thirds of overseas migration. This category includes international students, working holiday makers, visitors and subclass 457 visa workers. Of these categories, growth has been greatest among
- 5
0
5
10
15
20
93 94 95 96 97 98 99 00 01 02 03 04 05 06 07 08 09 10 11 12 13
Interstate departures
Interstate arrivals
Net interstate migration
Year ended June
Number (persons) (000)
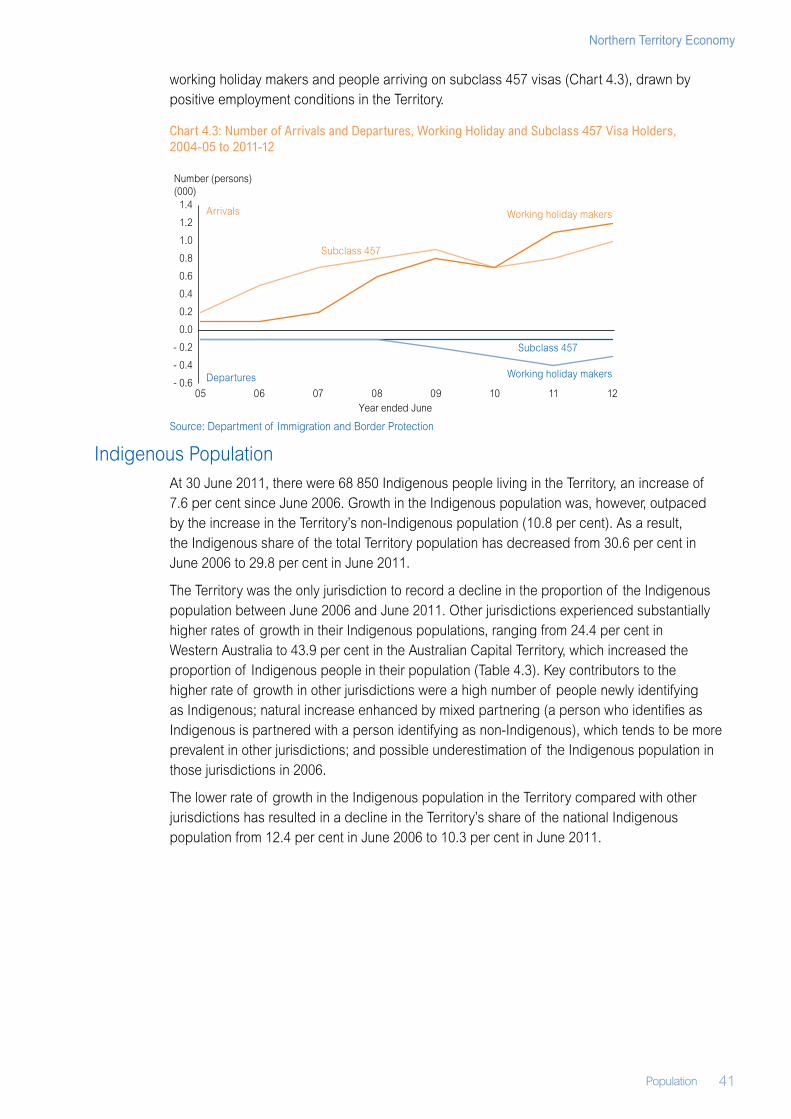
Population 41
Northern Territory Economy
working holiday makers and people arriving on subclass 457 visas (Chart 4.3), drawn by positive employment conditions in the Territory.
Chart 4.3: Number of Arrivals and Departures, Working Holiday and Subclass 457 Visa Holders, 2004‑05 to 2011‑12
Source: Department of Immigration and Border Protection
Indigenous PopulationAt 30 June 2011, there were 68 850 Indigenous people living in the Territory, an increase of 7.6 per cent since June 2006. Growth in the Indigenous population was, however, outpaced by the increase in the Territory’s non‑Indigenous population (10.8 per cent). As a result, the Indigenous share of the total Territory population has decreased from 30.6 per cent in June 2006 to 29.8 per cent in June 2011.
The Territory was the only jurisdiction to record a decline in the proportion of the Indigenous population between June 2006 and June 2011. Other jurisdictions experienced substantially higher rates of growth in their Indigenous populations, ranging from 24.4 per cent in Western Australia to 43.9 per cent in the Australian Capital Territory, which increased the proportion of Indigenous people in their population (Table 4.3). Key contributors to the higher rate of growth in other jurisdictions were a high number of people newly identifying as Indigenous; natural increase enhanced by mixed partnering (a person who identifies as Indigenous is partnered with a person identifying as non‑Indigenous), which tends to be more prevalent in other jurisdictions; and possible underestimation of the Indigenous population in those jurisdictions in 2006.
The lower rate of growth in the Indigenous population in the Territory compared with other jurisdictions has resulted in a decline in the Territory’s share of the national Indigenous population from 12.4 per cent in June 2006 to 10.3 per cent in June 2011.
- 0.6
- 0.4
- 0.2
0.0
0.2
0.4
0.6
0.8
1.0
1.2
1.4
05 06 07 08 09 10 11 12
Subclass 457
Working holiday makers
Subclass 457
Working holiday makers
Year ended June
Arrivals
Departures
Number (persons) (000)
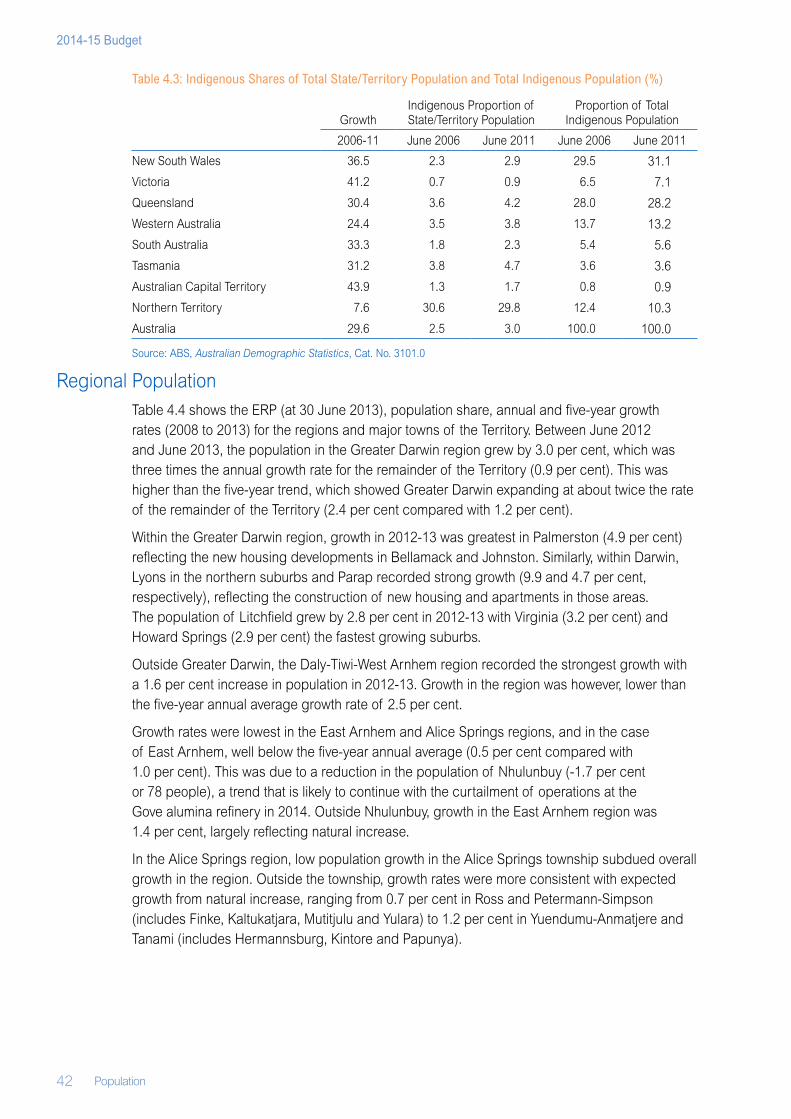
42 Population
2014-15 Budget
Table 4.3: Indigenous Shares of Total State/Territory Population and Total Indigenous Population (%)
GrowthIndigenous Proportion of State/Territory Population
Proportion of Total Indigenous Population
2006‑11 June 2006 June 2011 June 2006 June 2011
New South Wales 36.5 2.3 2.9 29.5 31.1
Victoria 41.2 0.7 0.9 6.5 7.1
Queensland 30.4 3.6 4.2 28.0 28.2
Western Australia 24.4 3.5 3.8 13.7 13.2
South Australia 33.3 1.8 2.3 5.4 5.6
Tasmania 31.2 3.8 4.7 3.6 3.6
Australian Capital Territory 43.9 1.3 1.7 0.8 0.9
Northern Territory 7.6 30.6 29.8 12.4 10.3
Australia 29.6 2.5 3.0 100.0 100.0
Source: ABS, Australian Demographic Statistics, Cat. No. 3101.0
Regional PopulationTable 4.4 shows the ERP (at 30 June 2013), population share, annual and five‑year growth rates (2008 to 2013) for the regions and major towns of the Territory. Between June 2012 and June 2013, the population in the Greater Darwin region grew by 3.0 per cent, which was three times the annual growth rate for the remainder of the Territory (0.9 per cent). This was higher than the five‑year trend, which showed Greater Darwin expanding at about twice the rate of the remainder of the Territory (2.4 per cent compared with 1.2 per cent).
Within the Greater Darwin region, growth in 2012‑13 was greatest in Palmerston (4.9 per cent) reflecting the new housing developments in Bellamack and Johnston. Similarly, within Darwin, Lyons in the northern suburbs and Parap recorded strong growth (9.9 and 4.7 per cent, respectively), reflecting the construction of new housing and apartments in those areas. The population of Litchfield grew by 2.8 per cent in 2012‑13 with Virginia (3.2 per cent) and Howard Springs (2.9 per cent) the fastest growing suburbs.
Outside Greater Darwin, the Daly‑Tiwi‑West Arnhem region recorded the strongest growth with a 1.6 per cent increase in population in 2012‑13. Growth in the region was however, lower than the five‑year annual average growth rate of 2.5 per cent.
Growth rates were lowest in the East Arnhem and Alice Springs regions, and in the case of East Arnhem, well below the five‑year annual average (0.5 per cent compared with 1.0 per cent). This was due to a reduction in the population of Nhulunbuy (‑1.7 per cent or 78 people), a trend that is likely to continue with the curtailment of operations at the Gove alumina refinery in 2014. Outside Nhulunbuy, growth in the East Arnhem region was 1.4 per cent, largely reflecting natural increase.
In the Alice Springs region, low population growth in the Alice Springs township subdued overall growth in the region. Outside the township, growth rates were more consistent with expected growth from natural increase, ranging from 0.7 per cent in Ross and Petermann‑Simpson (includes Finke, Kaltukatjara, Mutitjulu and Yulara) to 1.2 per cent in Yuendumu‑Anmatjere and Tanami (includes Hermannsburg, Kintore and Papunya).
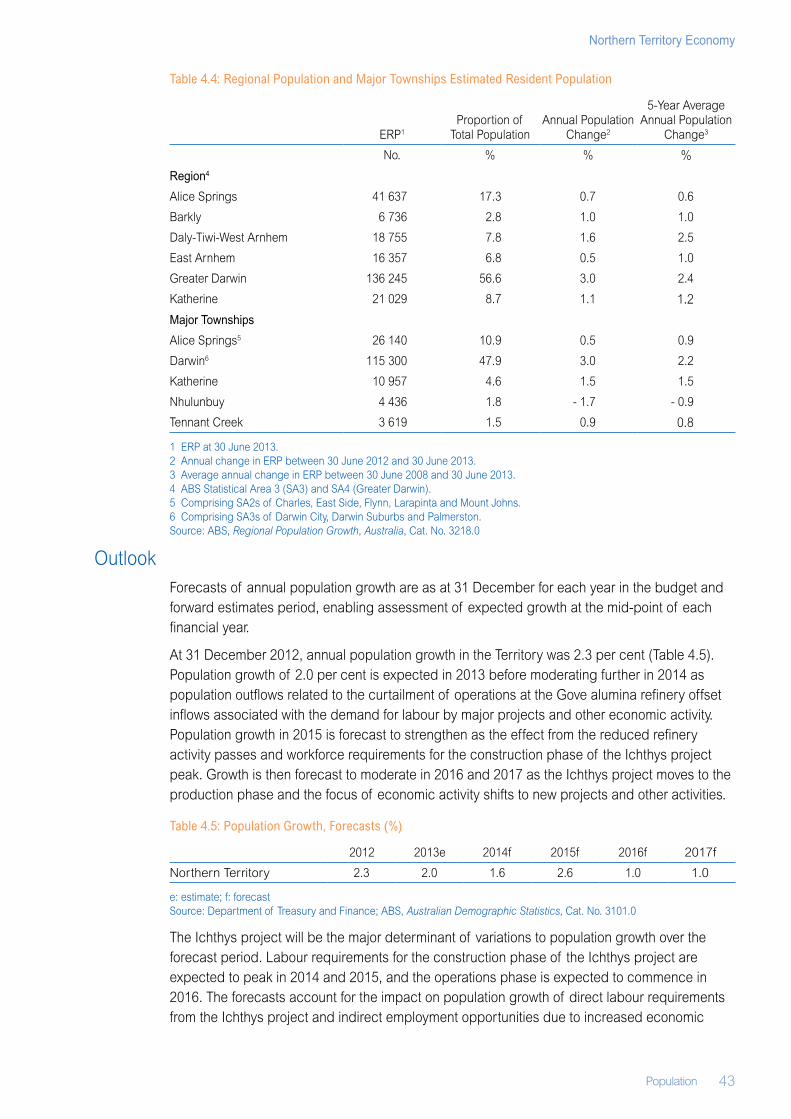
Population 43
Northern Territory Economy
Table 4.4: Regional Population and Major Townships Estimated Resident Population
ERP1Proportion of
Total PopulationAnnual Population
Change2
5‑Year Average Annual Population
Change3
No. % % %
Region4
Alice Springs 41 637 17.3 0.7 0.6
Barkly 6 736 2.8 1.0 1.0
Daly‑Tiwi‑West Arnhem 18 755 7.8 1.6 2.5
East Arnhem 16 357 6.8 0.5 1.0
Greater Darwin 136 245 56.6 3.0 2.4
Katherine 21 029 8.7 1.1 1.2
Major Townships
Alice Springs5 26 140 10.9 0.5 0.9
Darwin6 115 300 47.9 3.0 2.2
Katherine 10 957 4.6 1.5 1.5
Nhulunbuy 4 436 1.8 ‑ 1.7 ‑ 0.9
Tennant Creek 3 619 1.5 0.9 0.8
1 ERP at 30 June 2013.2 Annual change in ERP between 30 June 2012 and 30 June 2013.3 Average annual change in ERP between 30 June 2008 and 30 June 2013.4 ABS Statistical Area 3 (SA3) and SA4 (Greater Darwin).5 Comprising SA2s of Charles, East Side, Flynn, Larapinta and Mount Johns.6 Comprising SA3s of Darwin City, Darwin Suburbs and Palmerston.Source: ABS, Regional Population Growth, Australia, Cat. No. 3218.0
OutlookForecasts of annual population growth are as at 31 December for each year in the budget and forward estimates period, enabling assessment of expected growth at the mid‑point of each financial year.
At 31 December 2012, annual population growth in the Territory was 2.3 per cent (Table 4.5). Population growth of 2.0 per cent is expected in 2013 before moderating further in 2014 as population outflows related to the curtailment of operations at the Gove alumina refinery offset inflows associated with the demand for labour by major projects and other economic activity. Population growth in 2015 is forecast to strengthen as the effect from the reduced refinery activity passes and workforce requirements for the construction phase of the Ichthys project peak. Growth is then forecast to moderate in 2016 and 2017 as the Ichthys project moves to the production phase and the focus of economic activity shifts to new projects and other activities.
Table 4.5: Population Growth, Forecasts (%)
2012 2013e 2014f 2015f 2016f 2017f
Northern Territory 2.3 2.0 1.6 2.6 1.0 1.0
e: estimate; f: forecast Source: Department of Treasury and Finance; ABS, Australian Demographic Statistics, Cat. No. 3101.0
The Ichthys project will be the major determinant of variations to population growth over the forecast period. Labour requirements for the construction phase of the Ichthys project are expected to peak in 2014 and 2015, and the operations phase is expected to commence in 2016. The forecasts account for the impact on population growth of direct labour requirements from the Ichthys project and indirect employment opportunities due to increased economic
44 Population
2014-15 Budget
activity, particularly in the service sectors. In addition to this multiplier effect, some employees will come with dependents (spouses and children) who also contribute to population growth.
Population impacts associated with the curtailment of operations at the Gove alumina refinery have drawn on internal estimates by Rio Tinto and reflect people who are expected to relocate from Nhulunbuy to locations outside the Territory (interstate or overseas). It has been assumed that mitigation strategies proposed by Rio Tinto will partially ameliorate the short‑term population impact associated with the reduction in operations at Gove.
Comparison to Previous Forecasts The ABS revised its estimate of population growth in the Territory in 2012 upward from 1.8 per cent to 2.3 per cent following revisions to NOM and NIM.
The Department of Treasury and Finance’s estimate of annual population growth for 2013 of 2.0 per cent remains the same as the 2013‑14 Budget, with growth constrained by the anticipated population impact of the Territory Government’s fiscal consolidation measures.
The estimate for 2014 has been revised down from 2.5 per cent in the 2013‑14 Budget to 1.6 per cent, reflecting anticipated population losses from Nhulunbuy. Population growth of 1.0 per cent in 2016 is unchanged and reflects a return to a level of growth more consistent with natural increase.
Risks to the ForecastsChanges in population growth in the Territory are driven primarily by migration, with overseas migration historically a relatively stable contributor to growth and interstate migration being far more volatile. Accordingly, the greatest risk to the forecasts is likely to be higher or lower levels of net migration than implied by the assumptions underpinning the forecasts. This risk primarily relates to the Territory’s non‑Indigenous population, with historical evidence suggesting that migration has not been a substantial driver of Indigenous population growth in the Territory.
A further risk to the forecasts is the accuracy of migration estimates. The measurement of interstate migration is largely measured by change in Medicare data, however, the unprecedented nature of current project development may mean movements are not fully captured in a timely manner by the current systems. This could lead to substantial differences between the true and measured population and measured population estimates may underestimate true population growth.
Substantial differences in the build up and winding down of the construction workforce of the Ichthys project would also impact the forecasts. Furthermore, should the actual composition of the workforce, primarily the proportion of migrants who would become residents and are counted in the population and FIFO workers who tend not to be counted in the population, differ from that anticipated, it will affect the accuracy of the forecasts. The forecasts would also be at risk if the Ichthys project has a substantially different impact on the broader population (such as population growth relating to the service sectors) than anticipated. Such differences could be caused by different economic, business or regulatory circumstances at different points in time.
Finally, future projects that have not specifically been taken into account in the forecasts, provide potential upside risk to the forecasts.
Population 45
Northern Territory Economy
Appendix 1: Population ProjectionsThe population forecasts for the 2014‑15 Budget are intended to provide a short‑term estimate of population growth including the expected impact of known changes in government policy and major construction and resource projects.
The Territory Government also publishes population projections to provide insights into the future growth of populations and as a tool for long‑term planning and resource allocation. The projections are produced using a projections model (NTPOP) developed by the Territory Government in partnership with Charles Darwin University. The model uses historical patterns in the components of population change (natural increase, overseas and interstate migration) to formulate estimates that illustrate what the Territory population would look like if those trends were to persist into the future.
By varying the input assumptions in NTPOP, the projections can be used in a number of ways, for example, to demonstrate the consequences of increased migration driven by large projects or the consequences of closing the gap between Indigenous and non‑Indigenous populations on the size, age and gender structure of the overall population.
The projections are updated regularly as new ABS data becomes available. The most recent update is based on final ABS ERPs and other data derived from the 2011 Census of Population and Housing and provides annual projections of the Territory’s Indigenous and non‑Indigenous population over the 30‑year period from 2011 to 2041. Population projections at a broad regional level are also on a five‑yearly basis covering the period 2011 to 2026.
The projections and further information on the projections model are available at: http://www.treasury.nt.gov.au/Economy/populationprojections/Pages/default.aspx

46
2014-15 Budget
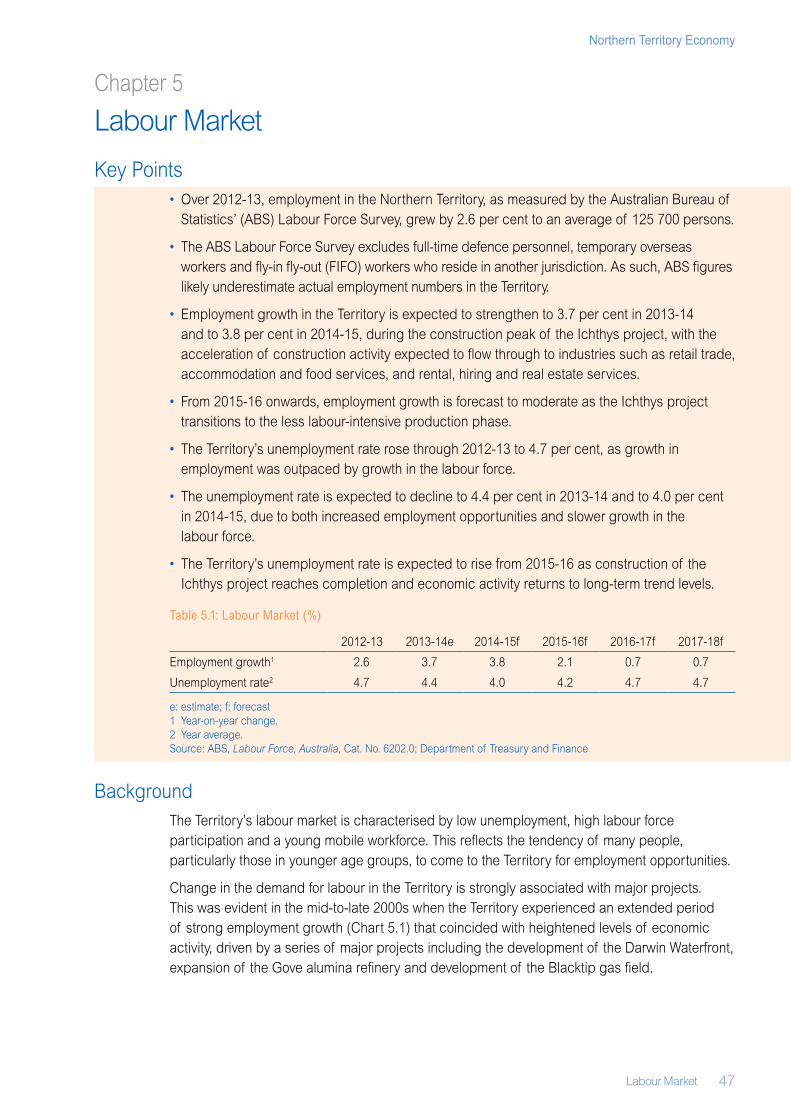
Labour Market 47
Northern Territory Economy
Chapter 5
Labour Market
Key Points• Over 2012‑13, employment in the Northern Territory, as measured by the Australian Bureau of
Statistics’ (ABS) Labour Force Survey, grew by 2.6 per cent to an average of 125 700 persons.
• The ABS Labour Force Survey excludes full‑time defence personnel, temporary overseas workers and fly‑in fly‑out (FIFO) workers who reside in another jurisdiction. As such, ABS figures likely underestimate actual employment numbers in the Territory.
• Employment growth in the Territory is expected to strengthen to 3.7 per cent in 2013‑14 and to 3.8 per cent in 2014‑15, during the construction peak of the Ichthys project, with the acceleration of construction activity expected to flow through to industries such as retail trade, accommodation and food services, and rental, hiring and real estate services.
• From 2015‑16 onwards, employment growth is forecast to moderate as the Ichthys project transitions to the less labour‑intensive production phase.
• The Territory’s unemployment rate rose through 2012‑13 to 4.7 per cent, as growth in employment was outpaced by growth in the labour force.
• The unemployment rate is expected to decline to 4.4 per cent in 2013‑14 and to 4.0 per cent in 2014‑15, due to both increased employment opportunities and slower growth in the labour force.
• The Territory’s unemployment rate is expected to rise from 2015‑16 as construction of the Ichthys project reaches completion and economic activity returns to long‑term trend levels.
Table 5.1: Labour Market (%)
2012‑13 2013‑14e 2014‑15f 2015‑16f 2016‑17f 2017‑18f
Employment growth1 2.6 3.7 3.8 2.1 0.7 0.7
Unemployment rate2 4.7 4.4 4.0 4.2 4.7 4.7
e: estimate; f: forecast1 Year‑on‑year change.2 Year average.Source: ABS, Labour Force, Australia, Cat. No. 6202.0; Department of Treasury and Finance
BackgroundThe Territory’s labour market is characterised by low unemployment, high labour force participation and a young mobile workforce. This reflects the tendency of many people, particularly those in younger age groups, to come to the Territory for employment opportunities.
Change in the demand for labour in the Territory is strongly associated with major projects. This was evident in the mid‑to‑late 2000s when the Territory experienced an extended period of strong employment growth (Chart 5.1) that coincided with heightened levels of economic activity, driven by a series of major projects including the development of the Darwin Waterfront, expansion of the Gove alumina refinery and development of the Blacktip gas field.
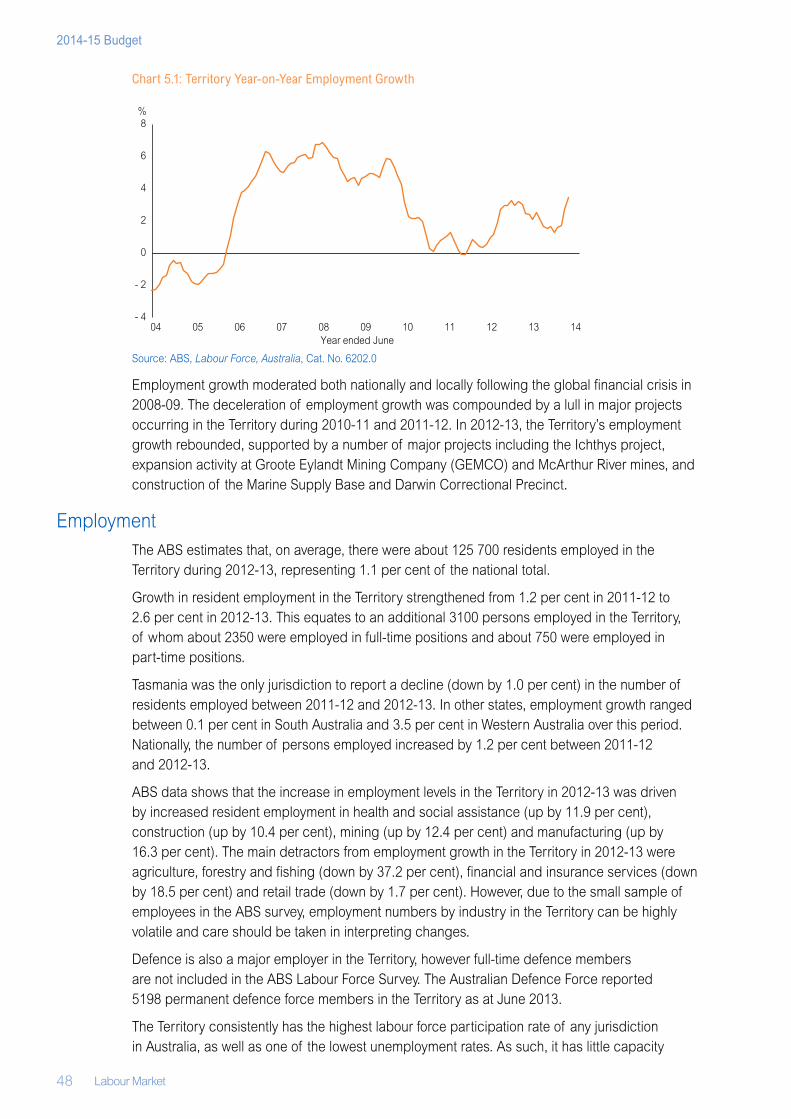
48 Labour Market
2014-15 Budget
Chart 5.1: Territory Year‑on‑Year Employment Growth
Source: ABS, Labour Force, Australia, Cat. No. 6202.0
Employment growth moderated both nationally and locally following the global financial crisis in 2008‑09. The deceleration of employment growth was compounded by a lull in major projects occurring in the Territory during 2010‑11 and 2011‑12. In 2012‑13, the Territory’s employment growth rebounded, supported by a number of major projects including the Ichthys project, expansion activity at Groote Eylandt Mining Company (GEMCO) and McArthur River mines, and construction of the Marine Supply Base and Darwin Correctional Precinct.
EmploymentThe ABS estimates that, on average, there were about 125 700 residents employed in the Territory during 2012‑13, representing 1.1 per cent of the national total.
Growth in resident employment in the Territory strengthened from 1.2 per cent in 2011‑12 to 2.6 per cent in 2012‑13. This equates to an additional 3100 persons employed in the Territory, of whom about 2350 were employed in full ‑time positions and about 750 were employed in part‑time positions.
Tasmania was the only jurisdiction to report a decline (down by 1.0 per cent) in the number of residents employed between 2011‑12 and 2012‑13. In other states, employment growth ranged between 0.1 per cent in South Australia and 3.5 per cent in Western Australia over this period. Nationally, the number of persons employed increased by 1.2 per cent between 2011‑12 and 2012‑13.
ABS data shows that the increase in employment levels in the Territory in 2012‑13 was driven by increased resident employment in health and social assistance (up by 11.9 per cent), construction (up by 10.4 per cent), mining (up by 12.4 per cent) and manufacturing (up by 16.3 per cent). The main detractors from employment growth in the Territory in 2012‑13 were agriculture, forestry and fishing (down by 37.2 per cent), financial and insurance services (down by 18.5 per cent) and retail trade (down by 1.7 per cent). However, due to the small sample of employees in the ABS survey, employment numbers by industry in the Territory can be highly volatile and care should be taken in interpreting changes.
Defence is also a major employer in the Territory, however full‑time defence members are not included in the ABS Labour Force Survey. The Australian Defence Force reported 5198 permanent defence force members in the Territory as at June 2013.
The Territory consistently has the highest labour force participation rate of any jurisdiction in Australia, as well as one of the lowest unemployment rates. As such, it has little capacity
- 4
- 2
0
2
4
6
8
04 05 06 07 08 09 10 11 12 13 14Year ended June
%
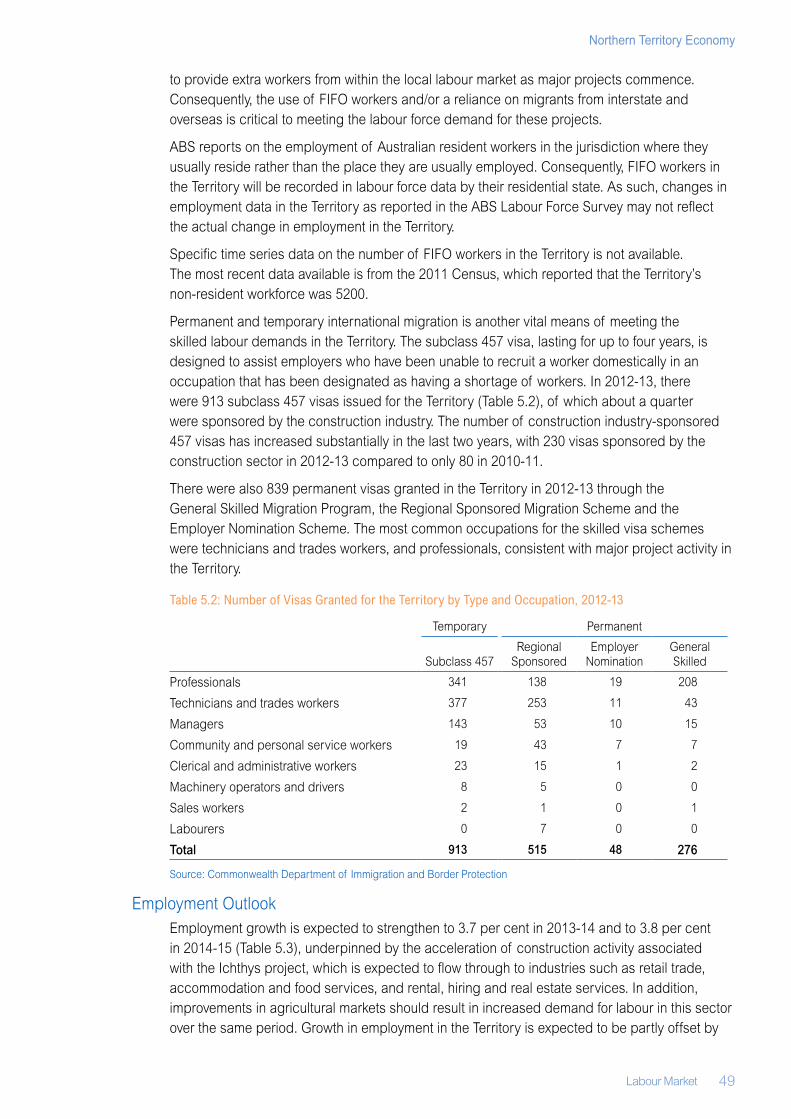
Labour Market 49
Northern Territory Economy
to provide extra workers from within the local labour market as major projects commence. Consequently, the use of FIFO workers and/or a reliance on migrants from interstate and overseas is critical to meeting the labour force demand for these projects.
ABS reports on the employment of Australian resident workers in the jurisdiction where they usually reside rather than the place they are usually employed. Consequently, FIFO workers in the Territory will be recorded in labour force data by their residential state. As such, changes in employment data in the Territory as reported in the ABS Labour Force Survey may not reflect the actual change in employment in the Territory.
Specific time series data on the number of FIFO workers in the Territory is not available. The most recent data available is from the 2011 Census, which reported that the Territory’s non‑resident workforce was 5200.
Permanent and temporary international migration is another vital means of meeting the skilled labour demands in the Territory. The subclass 457 visa, lasting for up to four years, is designed to assist employers who have been unable to recruit a worker domestically in an occupation that has been designated as having a shortage of workers. In 2012‑13, there were 913 subclass 457 visas issued for the Territory (Table 5.2), of which about a quarter were sponsored by the construction industry. The number of construction industry‑sponsored 457 visas has increased substantially in the last two years, with 230 visas sponsored by the construction sector in 2012‑13 compared to only 80 in 2010‑11.
There were also 839 permanent visas granted in the Territory in 2012‑13 through the General Skilled Migration Program, the Regional Sponsored Migration Scheme and the Employer Nomination Scheme. The most common occupations for the skilled visa schemes were technicians and trades workers, and professionals, consistent with major project activity in the Territory.
Table 5.2: Number of Visas Granted for the Territory by Type and Occupation, 2012‑13
Temporary Permanent
Subclass 457Regional
SponsoredEmployer
NominationGeneral Skilled
Professionals 341 138 19 208
Technicians and trades workers 377 253 11 43
Managers 143 53 10 15
Community and personal service workers 19 43 7 7
Clerical and administrative workers 23 15 1 2
Machinery operators and drivers 8 5 0 0
Sales workers 2 1 0 1
Labourers 0 7 0 0
Total 913 515 48 276
Source: Commonwealth Department of Immigration and Border Protection
Employment OutlookEmployment growth is expected to strengthen to 3.7 per cent in 2013‑14 and to 3.8 per cent in 2014‑15 (Table 5.3), underpinned by the acceleration of construction activity associated with the Ichthys project, which is expected to flow through to industries such as retail trade, accommodation and food services, and rental, hiring and real estate services. In addition, improvements in agricultural markets should result in increased demand for labour in this sector over the same period. Growth in employment in the Territory is expected to be partly offset by
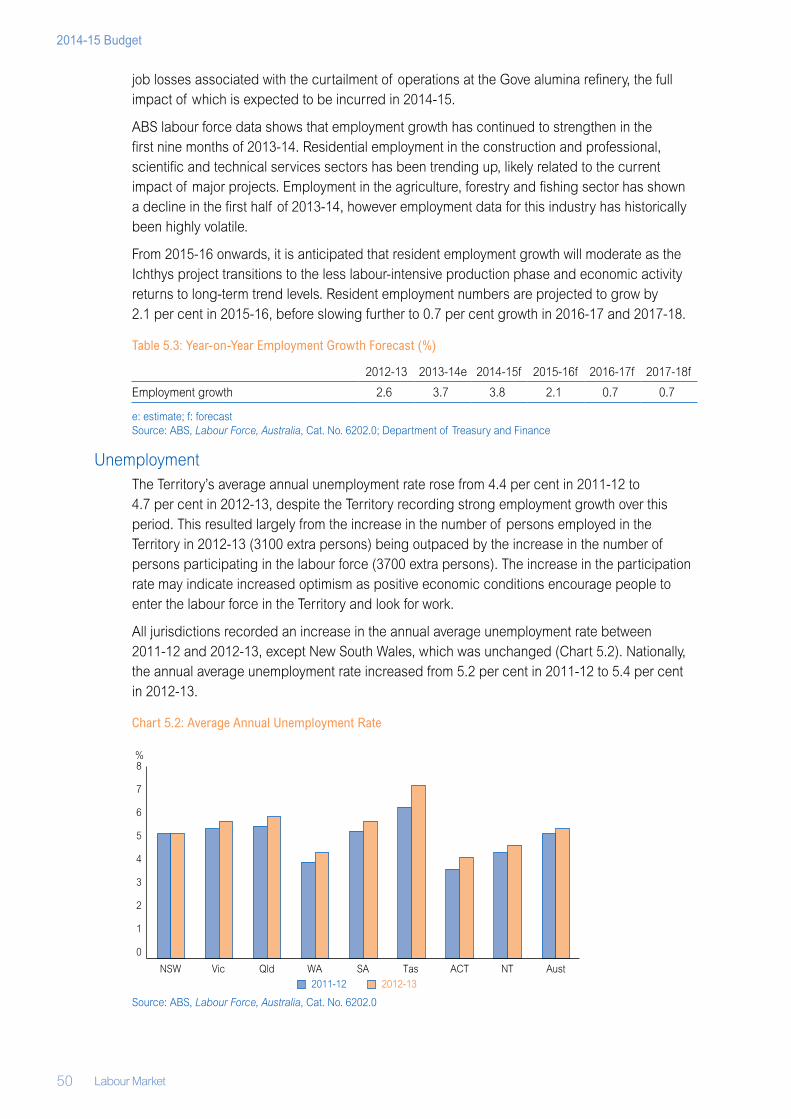
50 Labour Market
2014-15 Budget
job losses associated with the curtailment of operations at the Gove alumina refinery, the full impact of which is expected to be incurred in 2014‑15.
ABS labour force data shows that employment growth has continued to strengthen in the first nine months of 2013‑14. Residential employment in the construction and professional, scientific and technical services sectors has been trending up, likely related to the current impact of major projects. Employment in the agriculture, forestry and fishing sector has shown a decline in the first half of 2013‑14, however employment data for this industry has historically been highly volatile.
From 2015‑16 onwards, it is anticipated that resident employment growth will moderate as the Ichthys project transitions to the less labour‑intensive production phase and economic activity returns to long‑term trend levels. Resident employment numbers are projected to grow by 2.1 per cent in 2015‑16, before slowing further to 0.7 per cent growth in 2016‑17 and 2017‑18.
Table 5.3: Year‑on‑Year Employment Growth Forecast (%)
2012‑13 2013‑14e 2014‑15f 2015‑16f 2016‑17f 2017‑18f
Employment growth 2.6 3.7 3.8 2.1 0.7 0.7
e: estimate; f: forecastSource: ABS, Labour Force, Australia, Cat. No. 6202.0; Department of Treasury and Finance
UnemploymentThe Territory’s average annual unemployment rate rose from 4.4 per cent in 2011‑12 to 4.7 per cent in 2012‑13, despite the Territory recording strong employment growth over this period. This resulted largely from the increase in the number of persons employed in the Territory in 2012‑13 (3100 extra persons) being outpaced by the increase in the number of persons participating in the labour force (3700 extra persons). The increase in the participation rate may indicate increased optimism as positive economic conditions encourage people to enter the labour force in the Territory and look for work.
All jurisdictions recorded an increase in the annual average unemployment rate between 2011‑12 and 2012‑13, except New South Wales, which was unchanged (Chart 5.2). Nationally, the annual average unemployment rate increased from 5.2 per cent in 2011‑12 to 5.4 per cent in 2012‑13.
Chart 5.2: Average Annual Unemployment Rate
Source: ABS, Labour Force, Australia, Cat. No. 6202.0
0
1
2
3
4
5
6
7
8
NSW Vic Qld WA SA Tas ACT NT Aust
2011-12 2012-13
%
Labour Market 51
Northern Territory Economy
Unemployment by RegionThe Commonwealth Department of Employment publishes estimates of the unemployment rate for small regions. The data shows that there are disparities in the unemployment rates between regions in the Territory, reflecting the challenges to employment in remote areas that have small private employment markets. According to the Commonwealth Department of Employment, Greater Darwin recorded an unemployment rate of 2.2 per cent as at June 2013, the lowest rate of all Territory regions (Table 5.4). This is consistent with the concentration of employment opportunities and population in the area. Outside the Darwin region, as at June 2013, the unemployment rate varied from 6.5 per cent in the Alice Springs region to 14.0 per cent in the Daly‑Tiwi‑West Arnhem region.
Table 5.4: Regional Unemployment Rates (%)
As at June 2012 As at June 2013
Greater Darwin region1 2.1 2.2
Alice Springs region 6.3 6.5
Katherine region 7.7 8.1
Barkly region 8.3 8.3
East Arnhem region 6.4 7.0
Daly‑Tiwi‑West Arnhem region 12.4 14.0
1 Includes Darwin, Palmerston and Litchfield.Source: Commonwealth Department of Employment
Unemployment OutlookDue to strong employment growth, the number of unemployed Territory residents has been trending down over the first nine months of 2013‑14. However, as a result of the elevated number of residents participating in the labour force, the unemployment rate remains higher than might be expected considering the increase in employment. It is expected that the Territory’s unemployment rate will decrease to an average of 4.4 per cent over 2013‑14 (Table 5.5).
The Territory’s unemployment rate is expected to further decline to 4.0 per cent in 2014‑15, due to both increased employment opportunities and more moderate labour force growth. As the number of new jobs being created slows due to the completion of the construction phase of the Ichthys project, the unemployment rate is expected to rise to 4.2 per cent in 2015‑16 and to 4.7 per cent in 2016‑17 and 2017‑18 as economic activity returns to long‑term trend levels.
Table 5.5: Year Average Unemployment Rate Forecast (%)
2012‑13 2013‑14e 2014‑15f 2015‑16f 2016‑17f 2017‑18f
Unemployment rate 4.7 4.4 4.0 4.2 4.7 4.7
e: estimate; f: forecastSource: ABS, Labour Force, Australia, Cat. No. 6202.0; Department of Treasury and Finance
Labour Force ParticipationThe labour force participation rate measures the proportion of the civilian population that is either employed or actively looking for work.
The Territory has recorded the highest participation rate of all jurisdictions in each month since July 2012, with the exception of February and March 2013. Participation rates for females, in particular, are significantly higher in the Territory than the national average. This may be attributed to the comparatively young population in the Territory and the tendency for people to
52 Labour Market
2014-15 Budget
move to and from the Territory dependent on the relative strength of employment opportunities compared to other jurisdictions.
The Territory’s labour force participation rate increased from an average of 73.6 per cent in 2011‑12 to 74.0 per cent in 2012‑13. This equates to an additional 3700 people entering the Territory workforce over this period, of which 2300 were males and 1400 were females. The disproportionate growth in the number of males in the labour force is likely due to the perceived job opportunities within the male‑dominated industries associated with current major projects in the Territory.
The participation rate in the Territory is expected to remain at elevated levels throughout the major project period, with the Territory’s strong economic and employment growth generating optimism regarding employment opportunities. As the Ichthys project transitions out of the labour‑intensive construction phase and employment growth slows, it is anticipated that the participation rate will moderate slightly, although remaining well above the national average.
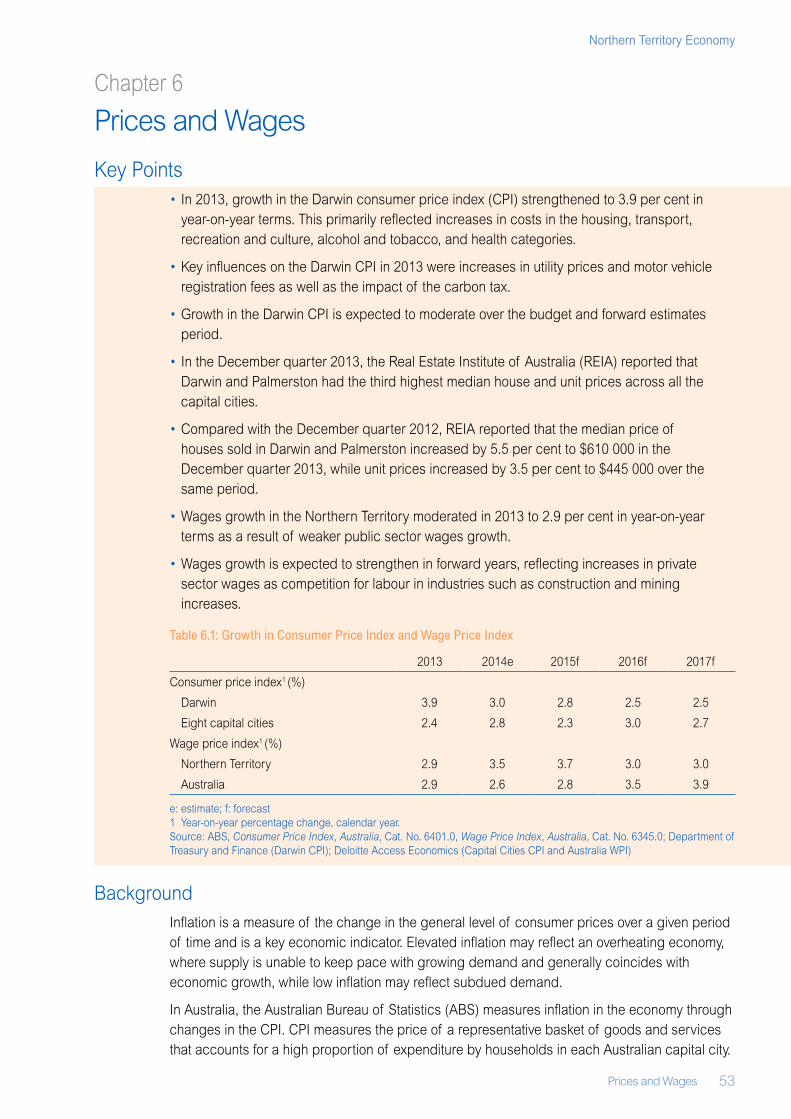
Prices and Wages 53
Northern Territory Economy
Chapter 6
Prices and Wages
Key Points• In 2013, growth in the Darwin consumer price index (CPI) strengthened to 3.9 per cent in
year‑on‑year terms. This primarily reflected increases in costs in the housing, transport, recreation and culture, alcohol and tobacco, and health categories.
• Key influences on the Darwin CPI in 2013 were increases in utility prices and motor vehicle registration fees as well as the impact of the carbon tax.
• Growth in the Darwin CPI is expected to moderate over the budget and forward estimates period.
• In the December quarter 2013, the Real Estate Institute of Australia (REIA) reported that Darwin and Palmerston had the third highest median house and unit prices across all the capital cities.
• Compared with the December quarter 2012, REIA reported that the median price of houses sold in Darwin and Palmerston increased by 5.5 per cent to $610 000 in the December quarter 2013, while unit prices increased by 3.5 per cent to $445 000 over the same period.
• Wages growth in the Northern Territory moderated in 2013 to 2.9 per cent in year‑on‑year terms as a result of weaker public sector wages growth.
• Wages growth is expected to strengthen in forward years, reflecting increases in private sector wages as competition for labour in industries such as construction and mining increases.
Table 6.1: Growth in Consumer Price Index and Wage Price Index
2013 2014e 2015f 2016f 2017f
Consumer price index1 (%)
Darwin 3.9 3.0 2.8 2.5 2.5
Eight capital cities 2.4 2.8 2.3 3.0 2.7
Wage price index1 (%)
Northern Territory 2.9 3.5 3.7 3.0 3.0
Australia 2.9 2.6 2.8 3.5 3.9
e: estimate; f: forecast1 Year‑on‑year percentage change, calendar year.Source: ABS, Consumer Price Index, Australia, Cat. No. 6401.0, Wage Price Index, Australia, Cat. No. 6345.0; Department of Treasury and Finance (Darwin CPI); Deloitte Access Economics (Capital Cities CPI and Australia WPI)
BackgroundInflation is a measure of the change in the general level of consumer prices over a given period of time and is a key economic indicator. Elevated inflation may reflect an overheating economy, where supply is unable to keep pace with growing demand and generally coincides with economic growth, while low inflation may reflect subdued demand.
In Australia, the Australian Bureau of Statistics (ABS) measures inflation in the economy through changes in the CPI. CPI measures the price of a representative basket of goods and services that accounts for a high proportion of expenditure by households in each Australian capital city.
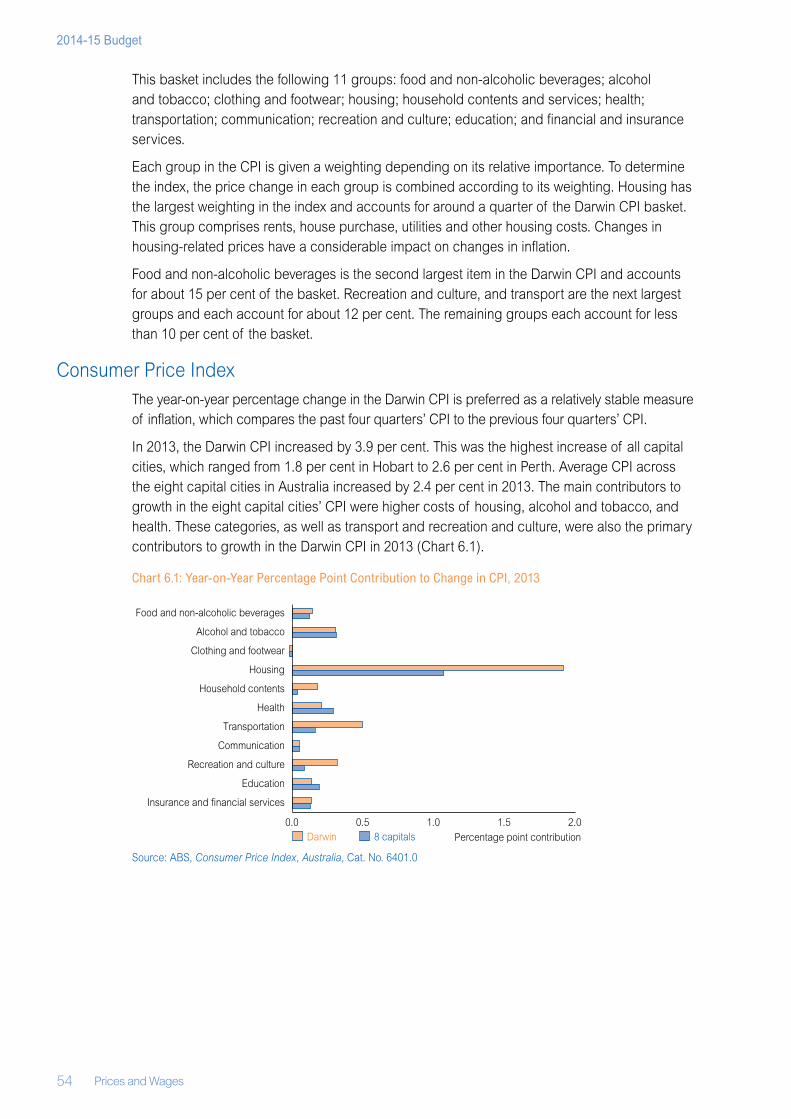
54 Prices and Wages
2014-15 Budget
This basket includes the following 11 groups: food and non‑alcoholic beverages; alcohol and tobacco; clothing and footwear; housing; household contents and services; health; transportation; communication; recreation and culture; education; and financial and insurance services.
Each group in the CPI is given a weighting depending on its relative importance. To determine the index, the price change in each group is combined according to its weighting. Housing has the largest weighting in the index and accounts for around a quarter of the Darwin CPI basket. This group comprises rents, house purchase, utilities and other housing costs. Changes in housing‑related prices have a considerable impact on changes in inflation.
Food and non‑alcoholic beverages is the second largest item in the Darwin CPI and accounts for about 15 per cent of the basket. Recreation and culture, and transport are the next largest groups and each account for about 12 per cent. The remaining groups each account for less than 10 per cent of the basket.
Consumer Price IndexThe year‑on‑year percentage change in the Darwin CPI is preferred as a relatively stable measure of inflation, which compares the past four quarters’ CPI to the previous four quarters’ CPI.
In 2013, the Darwin CPI increased by 3.9 per cent. This was the highest increase of all capital cities, which ranged from 1.8 per cent in Hobart to 2.6 per cent in Perth. Average CPI across the eight capital cities in Australia increased by 2.4 per cent in 2013. The main contributors to growth in the eight capital cities’ CPI were higher costs of housing, alcohol and tobacco, and health. These categories, as well as transport and recreation and culture, were also the primary contributors to growth in the Darwin CPI in 2013 (Chart 6.1).
Chart 6.1: Year‑on‑Year Percentage Point Contribution to Change in CPI, 2013
Source: ABS, Consumer Price Index, Australia, Cat. No. 6401.0
0.0 0.5 1.0 1.5 2.0
Insurance and financial services
Education
Recreation and culture
Communication
Transportation
Health
Household contents
Housing
Clothing and footwear
Alcohol and tobacco
Food and non-alcoholic beverages
Darwin 8 capitals Percentage point contribution
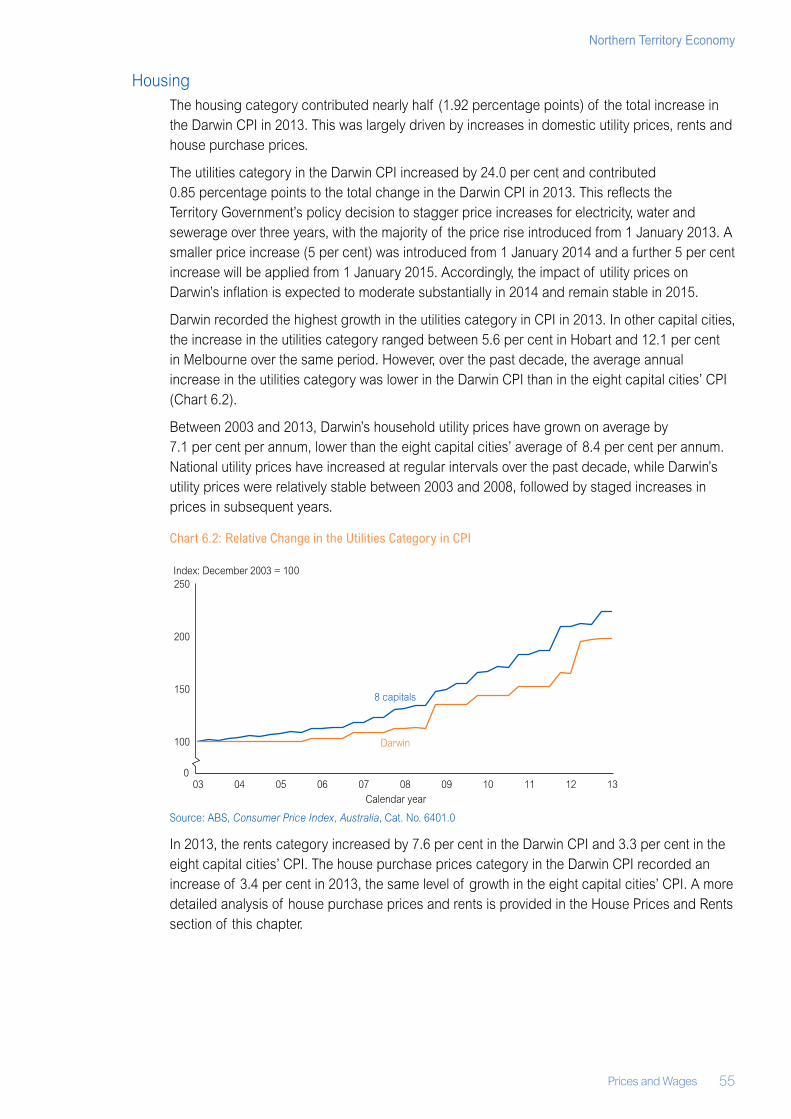
Prices and Wages 55
Northern Territory Economy
HousingThe housing category contributed nearly half (1.92 percentage points) of the total increase in the Darwin CPI in 2013. This was largely driven by increases in domestic utility prices, rents and house purchase prices.
The utilities category in the Darwin CPI increased by 24.0 per cent and contributed 0.85 percentage points to the total change in the Darwin CPI in 2013. This reflects the Territory Government’s policy decision to stagger price increases for electricity, water and sewerage over three years, with the majority of the price rise introduced from 1 January 2013. A smaller price increase (5 per cent) was introduced from 1 January 2014 and a further 5 per cent increase will be applied from 1 January 2015. Accordingly, the impact of utility prices on Darwin’s inflation is expected to moderate substantially in 2014 and remain stable in 2015.
Darwin recorded the highest growth in the utilities category in CPI in 2013. In other capital cities, the increase in the utilities category ranged between 5.6 per cent in Hobart and 12.1 per cent in Melbourne over the same period. However, over the past decade, the average annual increase in the utilities category was lower in the Darwin CPI than in the eight capital cities’ CPI (Chart 6.2).
Between 2003 and 2013, Darwin’s household utility prices have grown on average by 7.1 per cent per annum, lower than the eight capital cities’ average of 8.4 per cent per annum. National utility prices have increased at regular intervals over the past decade, while Darwin’s utility prices were relatively stable between 2003 and 2008, followed by staged increases in prices in subsequent years.
Chart 6.2: Relative Change in the Utilities Category in CPI
Source: ABS, Consumer Price Index, Australia, Cat. No. 6401.0
In 2013, the rents category increased by 7.6 per cent in the Darwin CPI and 3.3 per cent in the eight capital cities’ CPI. The house purchase prices category in the Darwin CPI recorded an increase of 3.4 per cent in 2013, the same level of growth in the eight capital cities’ CPI. A more detailed analysis of house purchase prices and rents is provided in the House Prices and Rents section of this chapter.
0
100
150
200
250
03 04 05 06 07 08 09 10 11 12 13
Index: December 2003 = 100
8 capitals
Darwin
Calendar year
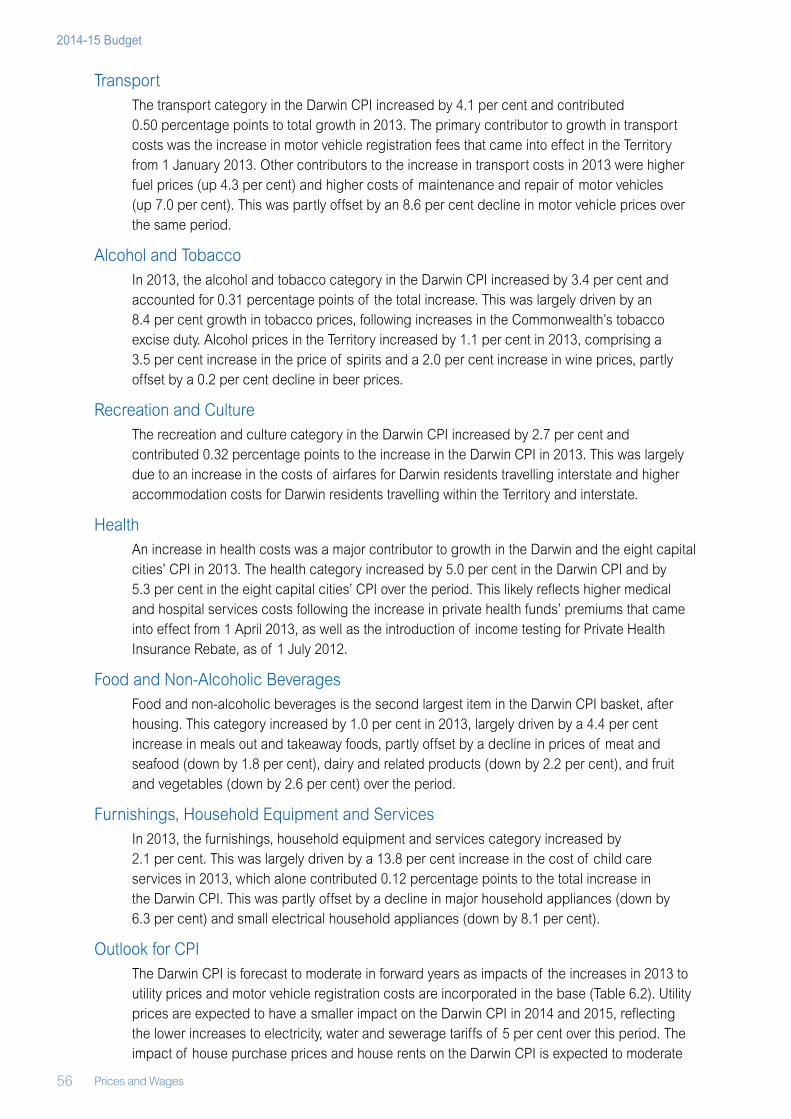
56 Prices and Wages
2014-15 Budget
TransportThe transport category in the Darwin CPI increased by 4.1 per cent and contributed 0.50 percentage points to total growth in 2013. The primary contributor to growth in transport costs was the increase in motor vehicle registration fees that came into effect in the Territory from 1 January 2013. Other contributors to the increase in transport costs in 2013 were higher fuel prices (up 4.3 per cent) and higher costs of maintenance and repair of motor vehicles (up 7.0 per cent). This was partly offset by an 8.6 per cent decline in motor vehicle prices over the same period.
Alcohol and TobaccoIn 2013, the alcohol and tobacco category in the Darwin CPI increased by 3.4 per cent and accounted for 0.31 percentage points of the total increase. This was largely driven by an 8.4 per cent growth in tobacco prices, following increases in the Commonwealth’s tobacco excise duty. Alcohol prices in the Territory increased by 1.1 per cent in 2013, comprising a 3.5 per cent increase in the price of spirits and a 2.0 per cent increase in wine prices, partly offset by a 0.2 per cent decline in beer prices.
Recreation and CultureThe recreation and culture category in the Darwin CPI increased by 2.7 per cent and contributed 0.32 percentage points to the increase in the Darwin CPI in 2013. This was largely due to an increase in the costs of airfares for Darwin residents travelling interstate and higher accommodation costs for Darwin residents travelling within the Territory and interstate.
HealthAn increase in health costs was a major contributor to growth in the Darwin and the eight capital cities’ CPI in 2013. The health category increased by 5.0 per cent in the Darwin CPI and by 5.3 per cent in the eight capital cities’ CPI over the period. This likely reflects higher medical and hospital services costs following the increase in private health funds’ premiums that came into effect from 1 April 2013, as well as the introduction of income testing for Private Health Insurance Rebate, as of 1 July 2012.
Food and Non‑Alcoholic BeveragesFood and non‑alcoholic beverages is the second largest item in the Darwin CPI basket, after housing. This category increased by 1.0 per cent in 2013, largely driven by a 4.4 per cent increase in meals out and takeaway foods, partly offset by a decline in prices of meat and seafood (down by 1.8 per cent), dairy and related products (down by 2.2 per cent), and fruit and vegetables (down by 2.6 per cent) over the period.
Furnishings, Household Equipment and ServicesIn 2013, the furnishings, household equipment and services category increased by 2.1 per cent. This was largely driven by a 13.8 per cent increase in the cost of child care services in 2013, which alone contributed 0.12 percentage points to the total increase in the Darwin CPI. This was partly offset by a decline in major household appliances (down by 6.3 per cent) and small electrical household appliances (down by 8.1 per cent).
Outlook for CPIThe Darwin CPI is forecast to moderate in forward years as impacts of the increases in 2013 to utility prices and motor vehicle registration costs are incorporated in the base (Table 6.2). Utility prices are expected to have a smaller impact on the Darwin CPI in 2014 and 2015, reflecting the lower increases to electricity, water and sewerage tariffs of 5 per cent over this period. The impact of house purchase prices and house rents on the Darwin CPI is expected to moderate
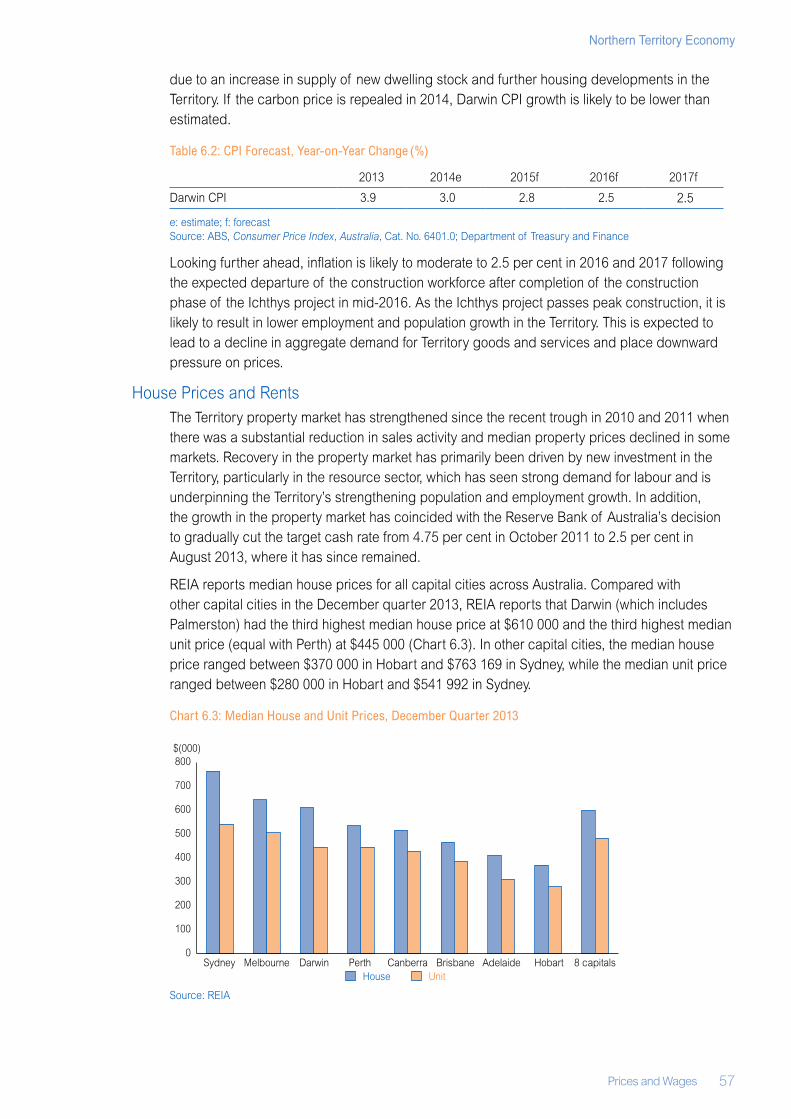
Prices and Wages 57
Northern Territory Economy
due to an increase in supply of new dwelling stock and further housing developments in the Territory. If the carbon price is repealed in 2014, Darwin CPI growth is likely to be lower than estimated.
Table 6.2: CPI Forecast, Year‑on‑Year Change (%)
2013 2014e 2015f 2016f 2017f
Darwin CPI 3.9 3.0 2.8 2.5 2.5
e: estimate; f: forecastSource: ABS, Consumer Price Index, Australia, Cat. No. 6401.0; Department of Treasury and Finance
Looking further ahead, inflation is likely to moderate to 2.5 per cent in 2016 and 2017 following the expected departure of the construction workforce after completion of the construction phase of the Ichthys project in mid‑2016. As the Ichthys project passes peak construction, it is likely to result in lower employment and population growth in the Territory. This is expected to lead to a decline in aggregate demand for Territory goods and services and place downward pressure on prices.
House Prices and RentsThe Territory property market has strengthened since the recent trough in 2010 and 2011 when there was a substantial reduction in sales activity and median property prices declined in some markets. Recovery in the property market has primarily been driven by new investment in the Territory, particularly in the resource sector, which has seen strong demand for labour and is underpinning the Territory’s strengthening population and employment growth. In addition, the growth in the property market has coincided with the Reserve Bank of Australia’s decision to gradually cut the target cash rate from 4.75 per cent in October 2011 to 2.5 per cent in August 2013, where it has since remained.
REIA reports median house prices for all capital cities across Australia. Compared with other capital cities in the December quarter 2013, REIA reports that Darwin (which includes Palmerston) had the third highest median house price at $610 000 and the third highest median unit price (equal with Perth) at $445 000 (Chart 6.3). In other capital cities, the median house price ranged between $370 000 in Hobart and $763 169 in Sydney, while the median unit price ranged between $280 000 in Hobart and $541 992 in Sydney.
Chart 6.3: Median House and Unit Prices, December Quarter 2013
Source: REIA
0
100
200
300
400
500
600
700
800
Sydney Melbourne Darwin Perth Canberra Brisbane Adelaide Hobart 8 capitalsHouse Unit
$(000)
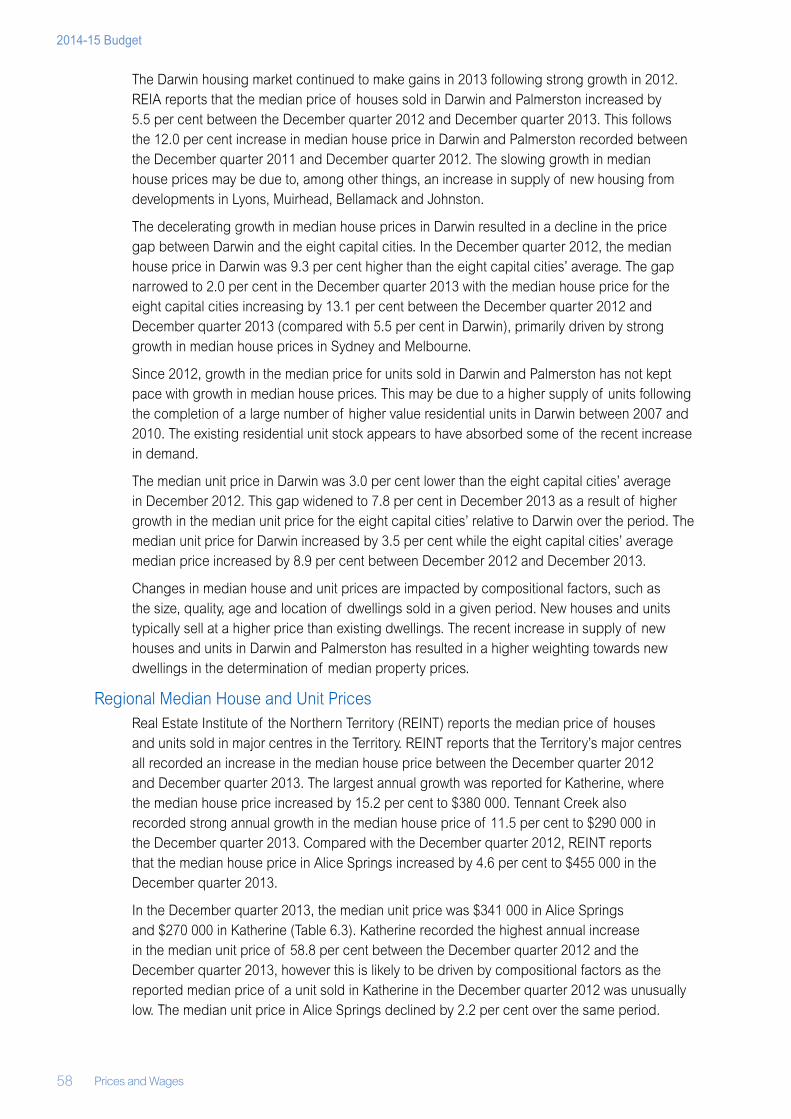
58 Prices and Wages
2014-15 Budget
The Darwin housing market continued to make gains in 2013 following strong growth in 2012. REIA reports that the median price of houses sold in Darwin and Palmerston increased by 5.5 per cent between the December quarter 2012 and December quarter 2013. This follows the 12.0 per cent increase in median house price in Darwin and Palmerston recorded between the December quarter 2011 and December quarter 2012. The slowing growth in median house prices may be due to, among other things, an increase in supply of new housing from developments in Lyons, Muirhead, Bellamack and Johnston.
The decelerating growth in median house prices in Darwin resulted in a decline in the price gap between Darwin and the eight capital cities. In the December quarter 2012, the median house price in Darwin was 9.3 per cent higher than the eight capital cities’ average. The gap narrowed to 2.0 per cent in the December quarter 2013 with the median house price for the eight capital cities increasing by 13.1 per cent between the December quarter 2012 and December quarter 2013 (compared with 5.5 per cent in Darwin), primarily driven by strong growth in median house prices in Sydney and Melbourne.
Since 2012, growth in the median price for units sold in Darwin and Palmerston has not kept pace with growth in median house prices. This may be due to a higher supply of units following the completion of a large number of higher value residential units in Darwin between 2007 and 2010. The existing residential unit stock appears to have absorbed some of the recent increase in demand.
The median unit price in Darwin was 3.0 per cent lower than the eight capital cities’ average in December 2012. This gap widened to 7.8 per cent in December 2013 as a result of higher growth in the median unit price for the eight capital cities’ relative to Darwin over the period. The median unit price for Darwin increased by 3.5 per cent while the eight capital cities’ average median price increased by 8.9 per cent between December 2012 and December 2013.
Changes in median house and unit prices are impacted by compositional factors, such as the size, quality, age and location of dwellings sold in a given period. New houses and units typically sell at a higher price than existing dwellings. The recent increase in supply of new houses and units in Darwin and Palmerston has resulted in a higher weighting towards new dwellings in the determination of median property prices.
Regional Median House and Unit PricesReal Estate Institute of the Northern Territory (REINT) reports the median price of houses and units sold in major centres in the Territory. REINT reports that the Territory’s major centres all recorded an increase in the median house price between the December quarter 2012 and December quarter 2013. The largest annual growth was reported for Katherine, where the median house price increased by 15.2 per cent to $380 000. Tennant Creek also recorded strong annual growth in the median house price of 11.5 per cent to $290 000 in the December quarter 2013. Compared with the December quarter 2012, REINT reports that the median house price in Alice Springs increased by 4.6 per cent to $455 000 in the December quarter 2013.
In the December quarter 2013, the median unit price was $341 000 in Alice Springs and $270 000 in Katherine (Table 6.3). Katherine recorded the highest annual increase in the median unit price of 58.8 per cent between the December quarter 2012 and the December quarter 2013, however this is likely to be driven by compositional factors as the reported median price of a unit sold in Katherine in the December quarter 2012 was unusually low. The median unit price in Alice Springs declined by 2.2 per cent over the same period.
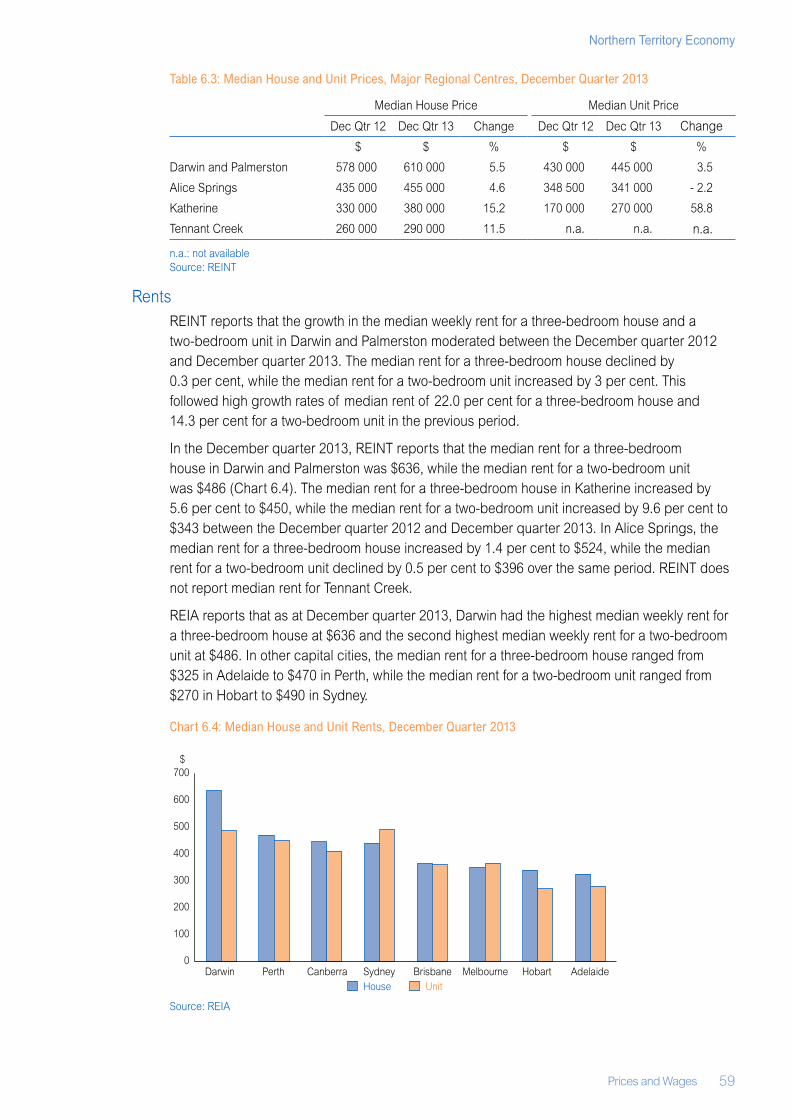
Prices and Wages 59
Northern Territory Economy
Table 6.3: Median House and Unit Prices, Major Regional Centres, December Quarter 2013
Median House Price Median Unit Price
Dec Qtr 12 Dec Qtr 13 Change Dec Qtr 12 Dec Qtr 13 Change
$ $ % $ $ %
Darwin and Palmerston 578 000 610 000 5.5 430 000 445 000 3.5
Alice Springs 435 000 455 000 4.6 348 500 341 000 ‑ 2.2
Katherine 330 000 380 000 15.2 170 000 270 000 58.8
Tennant Creek 260 000 290 000 11.5 n.a. n.a. n.a.
n.a.: not availableSource: REINT
RentsREINT reports that the growth in the median weekly rent for a three‑bedroom house and a two‑bedroom unit in Darwin and Palmerston moderated between the December quarter 2012 and December quarter 2013. The median rent for a three‑bedroom house declined by 0.3 per cent, while the median rent for a two‑bedroom unit increased by 3 per cent. This followed high growth rates of median rent of 22.0 per cent for a three‑bedroom house and 14.3 per cent for a two‑bedroom unit in the previous period.
In the December quarter 2013, REINT reports that the median rent for a three‑bedroom house in Darwin and Palmerston was $636, while the median rent for a two‑bedroom unit was $486 (Chart 6.4). The median rent for a three‑bedroom house in Katherine increased by 5.6 per cent to $450, while the median rent for a two‑bedroom unit increased by 9.6 per cent to $343 between the December quarter 2012 and December quarter 2013. In Alice Springs, the median rent for a three‑bedroom house increased by 1.4 per cent to $524, while the median rent for a two‑bedroom unit declined by 0.5 per cent to $396 over the same period. REINT does not report median rent for Tennant Creek.
REIA reports that as at December quarter 2013, Darwin had the highest median weekly rent for a three‑bedroom house at $636 and the second highest median weekly rent for a two‑bedroom unit at $486. In other capital cities, the median rent for a three‑bedroom house ranged from $325 in Adelaide to $470 in Perth, while the median rent for a two‑bedroom unit ranged from $270 in Hobart to $490 in Sydney.
Chart 6.4: Median House and Unit Rents, December Quarter 2013
Source: REIA
0
100
200
300
400
500
600
700
Darwin Perth Canberra Sydney Brisbane Melbourne Hobart AdelaideHouse Unit
$
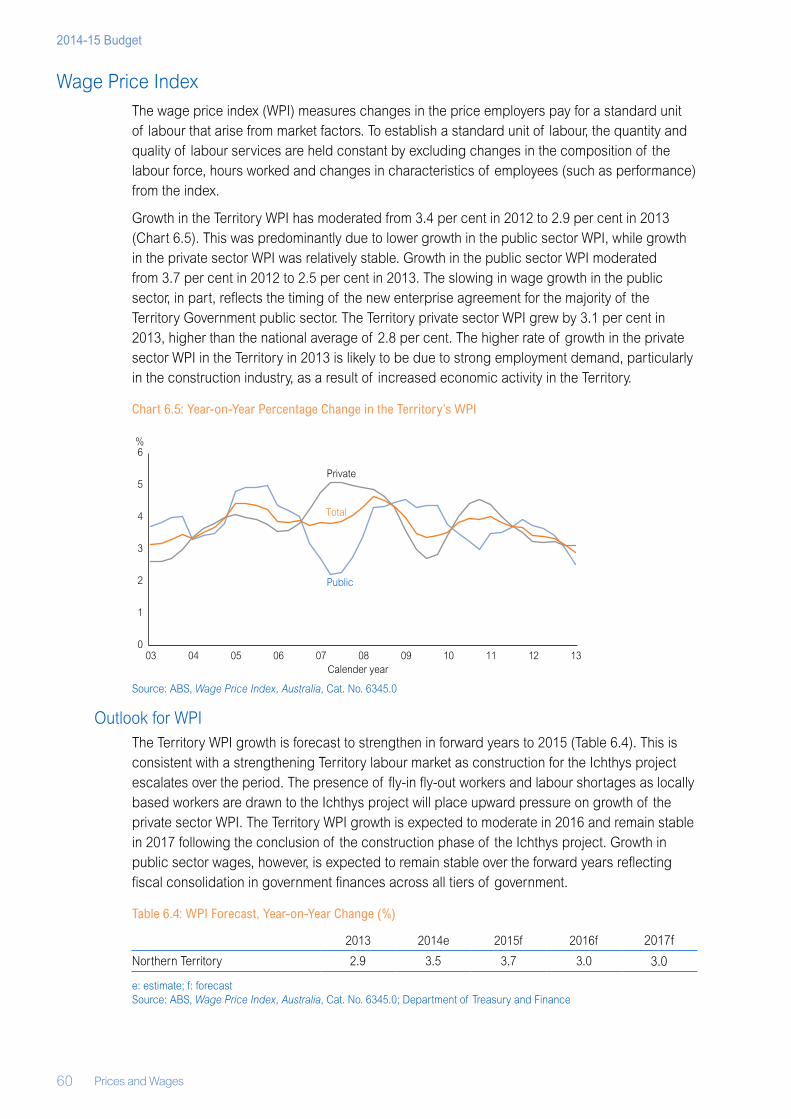
60 Prices and Wages
2014-15 Budget
Wage Price IndexThe wage price index (WPI) measures changes in the price employers pay for a standard unit of labour that arise from market factors. To establish a standard unit of labour, the quantity and quality of labour services are held constant by excluding changes in the composition of the labour force, hours worked and changes in characteristics of employees (such as performance) from the index.
Growth in the Territory WPI has moderated from 3.4 per cent in 2012 to 2.9 per cent in 2013 (Chart 6.5). This was predominantly due to lower growth in the public sector WPI, while growth in the private sector WPI was relatively stable. Growth in the public sector WPI moderated from 3.7 per cent in 2012 to 2.5 per cent in 2013. The slowing in wage growth in the public sector, in part, reflects the timing of the new enterprise agreement for the majority of the Territory Government public sector. The Territory private sector WPI grew by 3.1 per cent in 2013, higher than the national average of 2.8 per cent. The higher rate of growth in the private sector WPI in the Territory in 2013 is likely to be due to strong employment demand, particularly in the construction industry, as a result of increased economic activity in the Territory.
Chart 6.5: Year‑on‑Year Percentage Change in the Territory’s WPI
Source: ABS, Wage Price Index, Australia, Cat. No. 6345.0
Outlook for WPIThe Territory WPI growth is forecast to strengthen in forward years to 2015 (Table 6.4). This is consistent with a strengthening Territory labour market as construction for the Ichthys project escalates over the period. The presence of fly‑in fly‑out workers and labour shortages as locally based workers are drawn to the Ichthys project will place upward pressure on growth of the private sector WPI. The Territory WPI growth is expected to moderate in 2016 and remain stable in 2017 following the conclusion of the construction phase of the Ichthys project. Growth in public sector wages, however, is expected to remain stable over the forward years reflecting fiscal consolidation in government finances across all tiers of government.
Table 6.4: WPI Forecast, Year‑on‑Year Change (%)
2013 2014e 2015f 2016f 2017f
Northern Territory 2.9 3.5 3.7 3.0 3.0
e: estimate; f: forecastSource: ABS, Wage Price Index, Australia, Cat. No. 6345.0; Department of Treasury and Finance
0
1
2
3
4
5
6
03 04 06 08 10 1205 07 09 11 13
Public
Private
Total
%
Calender year
Industry Analysis 61
Northern Territory Economy
Chapter 7
Industry Analysis
Key Points• The largest industries in the Northern Territory are construction, mining, public administration
and safety, and health care and social assistance. Combined, these industries account for nearly half of the Territory’s gross state product (GSP).
• The largest employment industries in the Territory are public administration and safety, health care and social assistance, construction, and education and training.
• In 2012‑13, in current terms, the construction industry surpassed mining as the single largest industry in the Territory.
• The construction industry is likely to remain the largest contributor to Territory GSP over the short term as construction activity remains at historically elevated levels due to the Ichthys project.
BackgroundOver the past decade, economic growth in the Territory has outpaced growth nationally. However, growth has not been evenly distributed across all sectors of the Territory economy. As a result, the structure of the Territory economy has changed over the period. In recent years, the construction industry has risen in prominence coinciding with substantial private investment associated with major resource projects. On the other hand, growth in the tourism and agriculture, forestry and fishing industries has not kept pace with other industries, and consequently the contributions of these industries to total economic output have trended down over time (Table 7.1).
Table 7.1: Industry Share of GSP (%)1
2003‑04 2006‑07 2009‑10 2012‑13
Mining 13.3 16.1 17.2 14.3
Construction 14.2 12.1 11.4 17.7
Agriculture, forestry and fishing 4.1 3.0 2.9 2.2
Tourism2 n.a. 7.1 5.8 4.5
Defence3 9.7 8.6 8.2 7.0
Retail and wholesale trade 5.0 5.0 4.8 4.8
Manufacturing 6.1 5.9 7.1 4.2
Government and community services 22.4 19.4 18.9 18.8
Other services 22.8 25.3 23.4 24.1
GSP: gross state product; n.a.: not available1 Current prices.2 The tourism industry’s contribution to GSP is captured in other industries including accommodation and food services,
arts and recreation, retail trade, education and transport. 3 The defence industry’s contribution to GSP is captured in public administration and safety.Source: ABS, Australian National Accounts: State Accounts, Cat. No. 5220.0; TRA, State Tourism Satellite Accounts
This chapter examines the contributions made by key industries to the Territory’s economy, including the key features of each industry and the outlook.
The public administration and safety, education and training, and health care and social assistance industries have been grouped together and are referred to as government and

62 Industry Analysis
2014-15 Budget
community services. These industries are grouped to recognise that the services are largely provided by the public sector.
The other services industry comprises: accommodation and food services; transport, postal and warehousing; information and media telecommunications; financial insurance services; rental, hiring and real estate services; professional, scientific and technical services; administrative and support services; electricity, gas, water and waste services; and arts and recreation services. Although disparate, these industries have been grouped because individually they make a relatively small contribution to the Territory economy.
Tourism and defence are not separate industries for the purpose of reporting by the Australian Bureau of Statistics (ABS) in national accounts. Rather, the contributions made by these industries are captured in other industries. These industries are, however, discussed individually due to their relative importance in the Territory.
Industry Analysis 63
Northern Territory Economy
MiningTable 7.2: Mining Sector Share of GSP, GDP and Employment
2011‑12 2012‑1310‑Year Average
Northern Territory
Share of GSP1 (%) 18.0 14.3 16.7
Industry resident employment2 4 300 4 800 3 300
Share of total resident employment (%) 3.5 3.9 2.9
Australia
Share of GDP1 (%) 9.0 8.0 7.3
Industry resident employment2 246 800 265 600 166 000
Share of total resident employment (%) 2.2 2.3 1.6
GSP: gross state product; GDP: gross domestic product1 Current price.2 Year average.Source: ABS, Australian National Accounts: State Accounts, Cat. No. 5220.0, Labour Force, Australia, Cat. No. 6291.0.55.003
The mining industry impacts on the Territory economy through trade, investment and employment. In 2012‑13, mining’s contribution to gross state product (GSP) in the Territory was 14.3 per cent, much greater than the contribution nationally (8.0 per cent). Mining was the largest industry contributor to Territory GSP from 2005‑06 to 2011‑12, however it was overtaken by construction in 2012‑13. The contribution of the mining sector to Territory GSP dropped below the ten‑year average in 2012‑13, with the value of the industry’s contribution decreasing in current terms, led by declines in commodity prices. Strong growth in the construction industry has also contributed to the decline in relative importance of the mining sector. However this is likely to be a temporary occurrence with mining expected to resume primacy once the Ichthys project moves from the construction to production phase.
Despite mining being one of the largest contributors to the Territory economy, the capital‑intensive nature and non‑resident status of a significant proportion of the labour force means the industry comprised only 3.9 per cent (about 4800 persons) of Territory resident employment in 2012‑13. This number includes fly‑in fly‑out (FIFO) workers who are residents of the Territory but excludes FIFO workers who are residents in other jurisdictions and can comprise a substantial proportion of the workforce at Territory mine sites. While the number of people employed directly by the industry is relatively low, the industry is responsible for generating employment in a number of other industries such as trade and technical services, transportation and manufacturing.
The nominal value of mining production is influenced by commodity prices, which are subject to cyclical movements determined by supply and demand, exchange rate movements and inventories. To reflect the underlying level of output and activity, this analysis focuses on the value of real production, derived by holding the effects of price constant over time.
In real terms, mineral and energy production in the Territory increased in value from $5.5 billion in 2011‑12 to an estimated $5.9 billion in 2012‑13. The increase was driven by higher manganese production due to increased production capacity, as well as increased uranium and offshore gas production. Combined, gas and liquids, manganese and uranium comprised about 65 per cent of the total value of mineral and energy production in the Territory in 2012‑13 (Chart 7.1).
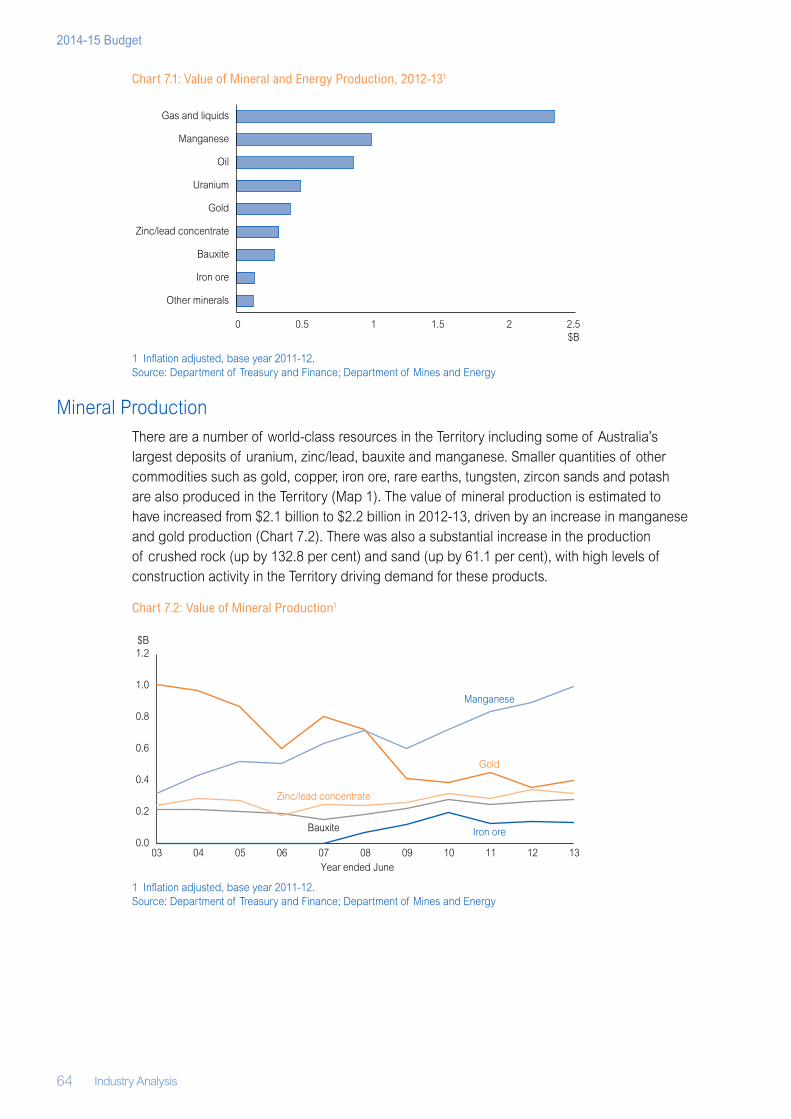
64 Industry Analysis
2014-15 Budget
Chart 7.1: Value of Mineral and Energy Production, 2012‑131
1 Inflation adjusted, base year 2011‑12.Source: Department of Treasury and Finance; Department of Mines and Energy
Mineral ProductionThere are a number of world‑class resources in the Territory including some of Australia’s largest deposits of uranium, zinc/lead, bauxite and manganese. Smaller quantities of other commodities such as gold, copper, iron ore, rare earths, tungsten, zircon sands and potash are also produced in the Territory (Map 1). The value of mineral production is estimated to have increased from $2.1 billion to $2.2 billion in 2012‑13, driven by an increase in manganese and gold production (Chart 7.2). There was also a substantial increase in the production of crushed rock (up by 132.8 per cent) and sand (up by 61.1 per cent), with high levels of construction activity in the Territory driving demand for these products.
Chart 7.2: Value of Mineral Production1
1 Inflation adjusted, base year 2011‑12.Source: Department of Treasury and Finance; Department of Mines and Energy
Other minerals
Iron ore
Bauxite
Zinc/lead concentrate
Gold
Uranium
Oil
Manganese
Gas and liquids
0 0.5 1 1.5 2 2.5$B
0.0
0.2
0.4
0.6
0.8
1.0
1.2
03 04 05 06 07 08 09 10 11 12 13
$B
Gold
Bauxite
Zinc/lead concentrate
Iron ore
Year ended June
Manganese
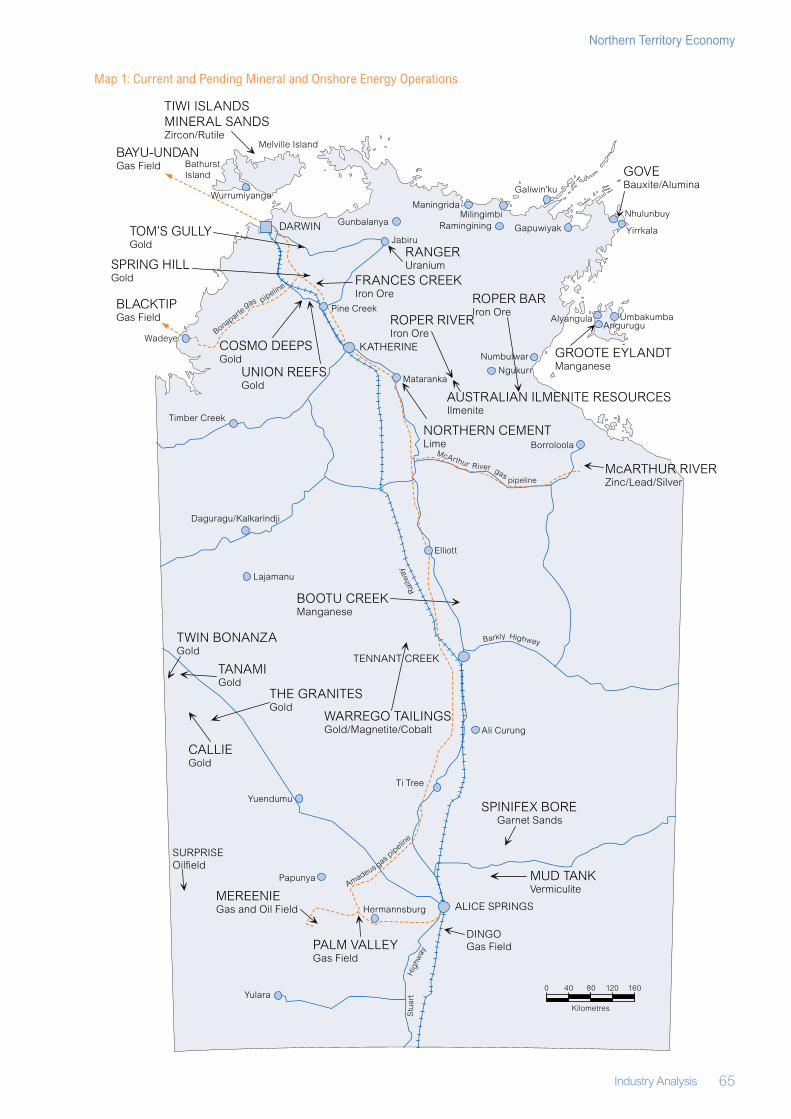
Industry Analysis 65
Northern Territory Economy
Map 1: Current and Pending Mineral and Onshore Energy Operations
TIWI ISLANDSMINERAL SANDS Zircon/Rutile
GOVEBauxite/Alumina
FRANCES CREEKIron Ore
RANGERUranium
GROOTE EYLANDTManganese
McARTHUR RIVERZinc/Lead/Silver
NORTHERN CEMENT Lime
BOOTU CREEKManganese
SPINIFEX BOREGarnet Sands
MEREENIE Gas and Oil Field
PALM VALLEY Gas Field
THE GRANITESGold
gas pip
eline
Stu
art
Hig
hway
Barkly Highway
Rai
lway
Pine Creek
Mataranka
Borroloola
Elliott
Ti Tree
Ngukurr
Daguragu/Kalkarindji
Timber Creek
Jabiru
Melville Island
Yuendumu
Yulara
Nhulunbuy
TENNANT CREEK
DARWIN
ALICE SPRINGS
ManingridaMilingimbi
Ramingining
Galiwin’ku
Gapuwiyak Yirrkala
Lajamanu
Numbulwar
Umbakumba
Ali Curung
Papunya
Hermannsburg
Gunbalanya
CALLIEGold
Wadeye
UNION REEFSGold
pipeline
Bonapartegas
McArthur River gaspipeline
Amadeus
AlyangulaROPER RIVERIron Ore
Kilometres
0 40 80 120 160
ROPER BARIron Ore
KATHERINE
BAYU-UNDANGas Field Bathurst
Island
COSMO DEEPSGold
BLACKTIPGas Field
MUD TANK Vermiculite
AUSTRALIAN ILMENITE RESOURCESIlmenite
Wurrumiyanga
Angurugu
DINGOGas Field
SURPRISE Oilfield
TOM’S GULLYGold
SPRING HILLGold
WARREGO TAILINGSGold/Magnetite/Cobalt
TANAMIGold
TWIN BONANZAGold
66 Industry Analysis
2014-15 Budget
ManganeseManganese is produced at the Groote Eylandt Mining Company (GEMCO) mine on Groote Eylandt and at Bootu Creek, 110 kilometres north of Tennant Creek. In 2012‑13, manganese accounted for about half of the total value of mineral production in the Territory. The value of manganese production in the Territory increased from $895 million in 2011‑12 to an estimated $996 million in 2012‑13, due to increased capacity at the GEMCO mine.
The second stage of the Groote Eylandt expansion project was completed in the first half of 2013‑14, increasing the capacity of production from 4.2 million tonnes per annum (mtpa) to 4.8 mtpa, as well as developing road and port facilities to handle production of up to 5.9 mtpa. The expansion should mean that production levels continue to grow in the forward years.
Production at the manganese mine at Bootu Creek decreased in 2012‑13 during the implementation of a new mining model, however the first half of 2013‑14 has seen production return to higher levels. Further increases should occur in the forward years, with the mine moving closer to maximum production capacity.
Zinc/Lead ConcentrateThe McArthur River Mine, located 65 kilometres southwest of Borroloola, is the Territory’s only operating zinc/lead mine. In 2012‑13, the value of zinc/lead concentrate production decreased to $315 million from $345 million in 2011‑12, following lower than planned production levels.
The McArthur River Mine has expanded operations twice since commencing in 1995. In June 2013, project approval was received for the Phase 3 development project, which is expected to be completed in the second half of 2014. The project will increase capacity from around 2.5 million tonnes to 5.5 million tonnes of high grade bulk zinc/lead concentrate per annum, as well as increasing the number of jobs at the mine.
Gold The largest producing gold mine in the Territory is the Granites mine owned by Newmont Mining Corporation in the Tanami Desert. Gold is also produced by Crocodile Gold near Pine Creek. The value of gold production in the Territory increased from $353 million in 2011‑12 to $397 million in 2012‑13, reflecting development at Crocodile Gold’s Cosmo mine throughout the year.
The Cosmo mine reached commercial production in March 2013 and its full production rate in the second half of 2013. It is estimated the mine will produce an average of 75 000 to 90 000 ounces per annum. In future years, further growth in gold production is expected, with a number of proposals for the development of new mines over the next four years (refer to pending developments listed at the end of this section).
Bauxite Bauxite is mined at the Gove peninsula in the Territory and used primarily as feedstock to manufacture alumina at the nearby Pacific Aluminium refinery with the remaining product exported in raw form to Asia. The value of bauxite production in the Territory increased from $268 million in 2011‑12 to $281 million in 2012‑13.
In November 2013, Rio Tinto announced the suspension of production at the Gove alumina refinery. The curtailment of operations at the refinery commenced in the first half of 2014, and initially the value of bauxite production is expected to decrease. However, Rio Tinto has stated that the bauxite used in the manufacture of alumina will now be exported. Increased bauxite exports will not occur immediately as capital investment is required on ship loaders and other machinery and equipment to facilitate the increased level of exports. Refer to
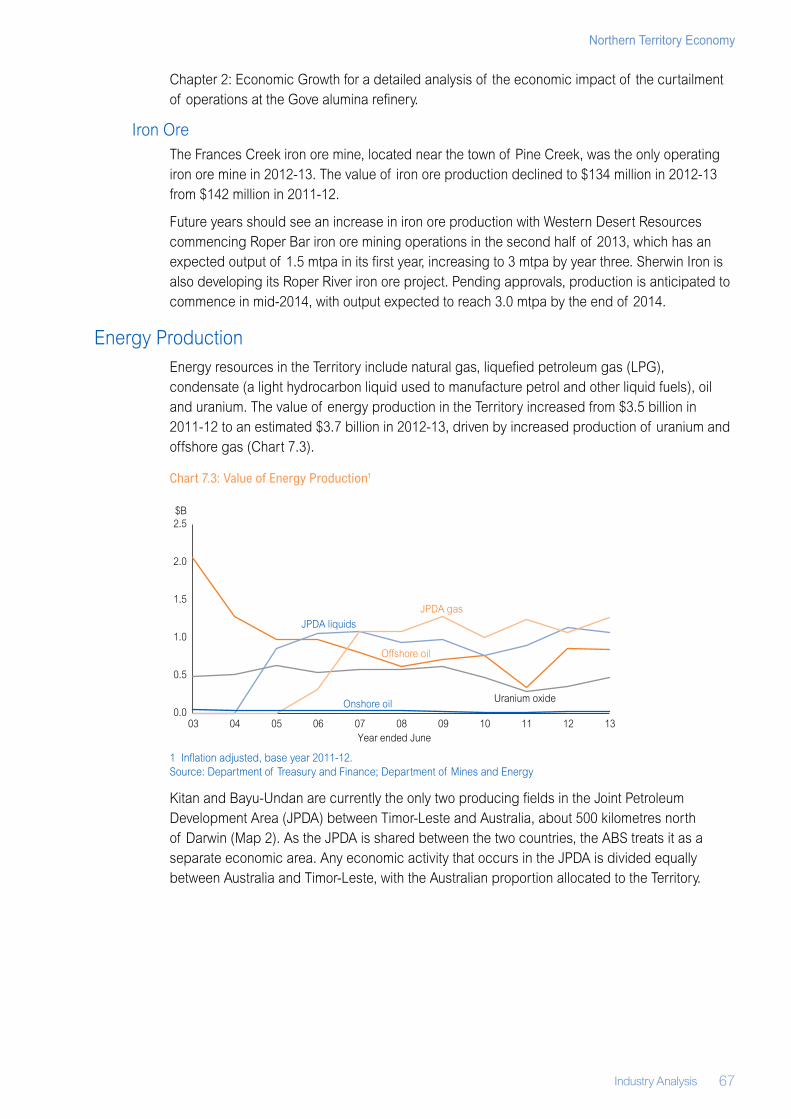
Industry Analysis 67
Northern Territory Economy
Chapter 2: Economic Growth for a detailed analysis of the economic impact of the curtailment of operations at the Gove alumina refinery.
Iron OreThe Frances Creek iron ore mine, located near the town of Pine Creek, was the only operating iron ore mine in 2012‑13. The value of iron ore production declined to $134 million in 2012‑13 from $142 million in 2011‑12.
Future years should see an increase in iron ore production with Western Desert Resources commencing Roper Bar iron ore mining operations in the second half of 2013, which has an expected output of 1.5 mtpa in its first year, increasing to 3 mtpa by year three. Sherwin Iron is also developing its Roper River iron ore project. Pending approvals, production is anticipated to commence in mid‑2014, with output expected to reach 3.0 mtpa by the end of 2014.
Energy ProductionEnergy resources in the Territory include natural gas, liquefied petroleum gas (LPG), condensate (a light hydrocarbon liquid used to manufacture petrol and other liquid fuels), oil and uranium. The value of energy production in the Territory increased from $3.5 billion in 2011‑12 to an estimated $3.7 billion in 2012‑13, driven by increased production of uranium and offshore gas (Chart 7.3).
Chart 7.3: Value of Energy Production1
1 Inflation adjusted, base year 2011‑12.Source: Department of Treasury and Finance; Department of Mines and Energy
Kitan and Bayu‑Undan are currently the only two producing fields in the Joint Petroleum Development Area (JPDA) between Timor‑Leste and Australia, about 500 kilometres north of Darwin (Map 2). As the JPDA is shared between the two countries, the ABS treats it as a separate economic area. Any economic activity that occurs in the JPDA is divided equally between Australia and Timor‑Leste, with the Australian proportion allocated to the Territory.
0.0
0.5
1.0
1.5
2.0
2.5
03 04 05 06 07 08 09 10 11 12 13
$B
Year ended June
Onshore oil
Offshore oil
Uranium oxide
JPDA liquids
JPDA gas
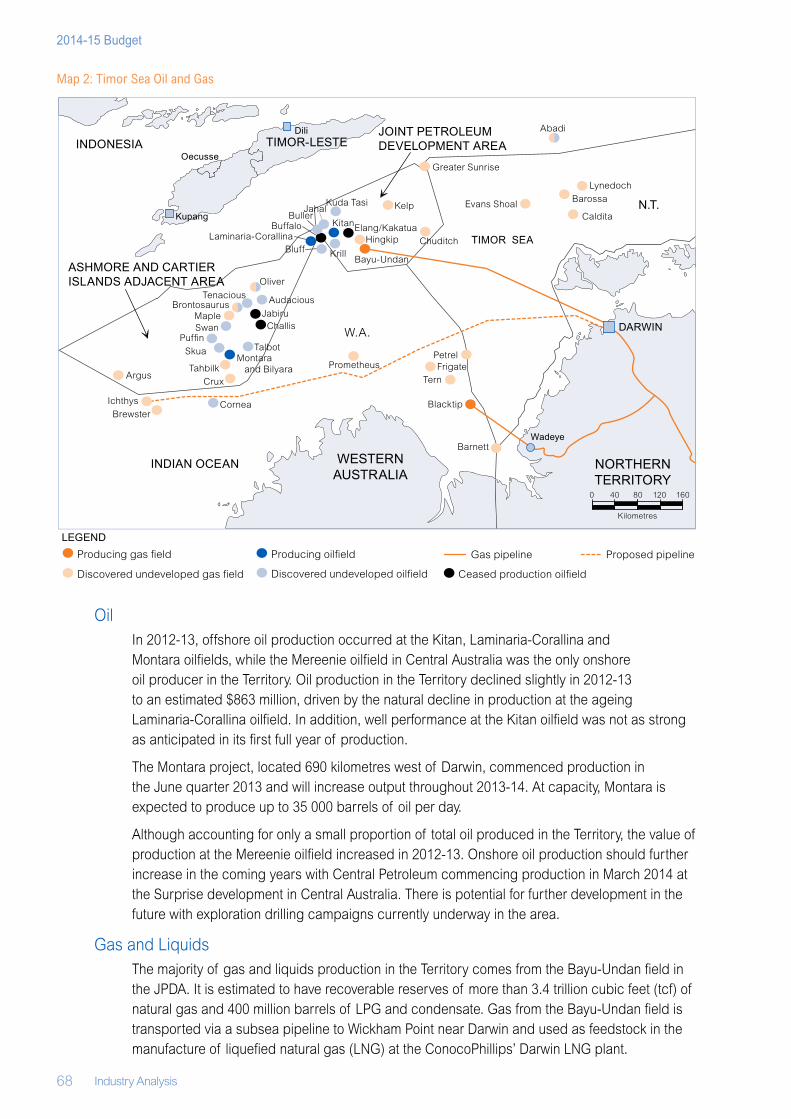
68 Industry Analysis
2014-15 Budget
Map 2: Timor Sea Oil and Gas
OilIn 2012‑13, offshore oil production occurred at the Kitan, Laminaria‑Corallina and Montara oilfields, while the Mereenie oilfield in Central Australia was the only onshore oil producer in the Territory. Oil production in the Territory declined slightly in 2012‑13 to an estimated $863 million, driven by the natural decline in production at the ageing Laminaria‑Corallina oilfield. In addition, well performance at the Kitan oilfield was not as strong as anticipated in its first full year of production.
The Montara project, located 690 kilometres west of Darwin, commenced production in the June quarter 2013 and will increase output throughout 2013‑14. At capacity, Montara is expected to produce up to 35 000 barrels of oil per day.
Although accounting for only a small proportion of total oil produced in the Territory, the value of production at the Mereenie oilfield increased in 2012‑13. Onshore oil production should further increase in the coming years with Central Petroleum commencing production in March 2014 at the Surprise development in Central Australia. There is potential for further development in the future with exploration drilling campaigns currently underway in the area.
Gas and LiquidsThe majority of gas and liquids production in the Territory comes from the Bayu‑Undan field in the JPDA. It is estimated to have recoverable reserves of more than 3.4 trillion cubic feet (tcf) of natural gas and 400 million barrels of LPG and condensate. Gas from the Bayu‑Undan field is transported via a subsea pipeline to Wickham Point near Darwin and used as feedstock in the manufacture of liquefied natural gas (LNG) at the ConocoPhillips’ Darwin LNG plant.
WESTERN AUSTRALIA
NORTHERN TERRITORY
Kilometres
0 40 80 120 160
TIMOR SEA
DARWIN
Discovered undeveloped oilfieldDiscovered undeveloped gas field
Producing oilfieldProducing gas field Gas pipeline Proposed pipeline
Ceased production oilfield
LEGEND
INDONESIAJOINT PETROLEUMDEVELOPMENT AREA
Jahal
Hingkip
Bayu-UndanKrillBluff
BullerBuffalo
Oliver
Audacious
JabiruChallis
Talbot
PrometheusMontara and Bilyara
Crux
Tahbilk
Skua
SwanPuffin
Maple
TenaciousBrontosaurus
BrewsterCornea
Kelp
ChuditchLaminaria-Corallina
Oecusse
Evans Shoal
Abadi
Lynedoch
Barossa
Caldita
Greater Sunrise
Petrel
Tern
Blacktip
Barnett
Elang/Kakatua
Kuda Tasi
ASHMORE AND CARTIER ISLANDS ADJACENT AREA
Dili
Kupang
W.A.
N.T.
TIMOR-LESTE
INDIAN OCEAN
Wadeye
ArgusFrigate
Kitan
Ichthys
Industry Analysis 69
Northern Territory Economy
In 2012‑13, the value of gas and liquids production (including condensate and LPG) increased from $2.22 billion in 2011‑12 to $2.34 billion, reflecting a step up in production following the scheduled maintenance shutdown at the Darwin LNG plant in May and June 2012, as well as efficiency gains and upgrades made during the shutdown.
Uranium The Ranger uranium mine, located within the boundaries of the Kakadu National Park, accounted for about 13 per cent of the Territory’s energy production in 2012‑13. Open‑cut mining at Ranger was ceased in late 2012 due to the depletion of resources available for the open‑cut mining process.
Despite the cessation of open‑cut mining at Ranger, the value of uranium oxide production in the Territory increased from $360 million in 2011‑12 to $473 million in 2012‑13 due to production from existing stockpiles of high‑grade ore. Production value will decrease in 2013‑14 as a result of lower grade ore as well as the suspension of processing following a leach tank failure in December 2013. Current stockpiles are estimated to allow for a further two years’ production once approval is received to recommence operations. A substantial exploration program is currently underway to extend the mine life through the underground Ranger 3 Deeps project.
OutlookThe International Monetary Fund (IMF) is forecasting global economic growth to strengthen in 2014 and remain at about 4 per cent from 2015 onwards (refer to Chapter 3: External Economic Environment). This is expected to underpin demand for mineral and energy resources, which will support mining production throughout the Territory over the forward estimates period.
However, China’s economic growth is expected to moderate in the medium term, but still remain relatively high (about 7 per cent annual growth). As one of the Territory’s key mineral ore export markets, weaker Chinese demand for minerals is a risk that could affect the volume and price of exports. Conversely, the Korean economy, another key market for Territory mineral exports, is expected to strengthen from 2014 onwards and increase demand for Territory mineral ores.
Recent capital investments at GEMCO and McArthur River Mine will enable higher production over coming years, contributing to growth of the mineral sector in the Territory. Increased iron ore production resulting from the new mine in the Roper region will also contribute to growth. While output may rise, the actual value of production may be tempered by movements in iron ore prices, which could decline as a result of expanding global supply.
Despite new onshore oil production and exploration activity, oil production is forecast to peak in 2014‑15 as the Montara project operates at capacity for a full year, before reducing over time as a result of natural declines in output at the Kitan and Montara oilfields. Uranium production is also expected to decline as existing stockpiles are depleted unless a decision is made to commence underground mining at Ranger uranium mine.
In addition to current mining production, there are a number of pending developments expected in the upcoming year, including:
• Sherwin Iron’s $170 million Roper River iron ore project located 475 kilometres south‑east of Darwin along the Roper Highway. The mine is expected to produce around 3 mtpa of iron ore;
• Australian Abrasive Minerals’ garnet sands deposit, 170 kilometres north‑east of Alice Springs at Spinifex Bore. The mine is estimated to have a 25‑year supply of high quality mineral sands;
• Aard Metals’ reprocessing of five tailings dams, located 48 kilometres west of Tennant Creek, in order to extract magnetite, gold and copper; and
70 Industry Analysis
2014-15 Budget
• new gold mines by ABM Resources (Twin Bonanza in the Tanami), Thor Mining (Spring Hill near Pine Creek) and Primary Gold (re‑opening Tom’s Gully gold mine).
There are also a number of proposed energy developments in the Territory for the medium term, including:
• the Evans Shoal gas field by Eni, 300 kilometres north‑west of Darwin, estimated to contain up to 8 tcf of gas;
• an appraisal drilling program led by ConocoPhillips, undertaken at Caldita‑Barossa, 270 kilometres north‑west of Darwin; and
• Central Petroleum’s development of the Dingo gas field, 65 kilometres south of Alice Springs. The gas field is under contract to supply 31 petajoules of gas over 20 years, with production expected in early 2015.
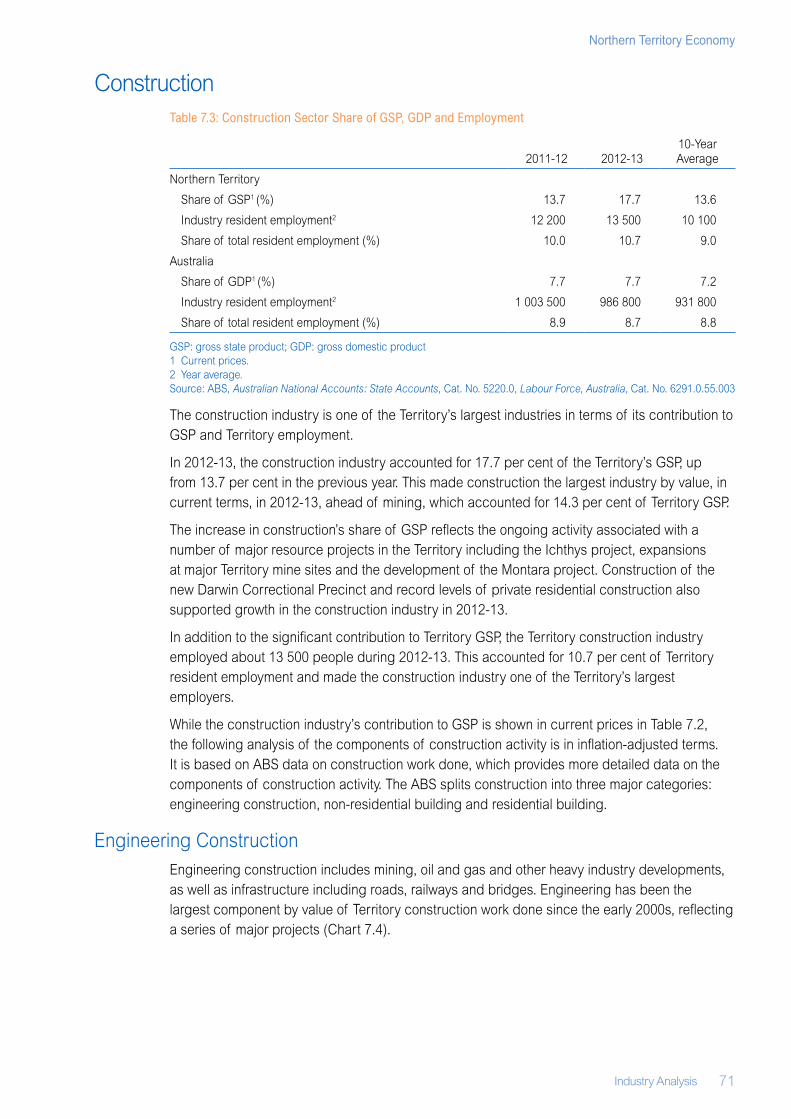
Industry Analysis 71
Northern Territory Economy
ConstructionTable 7.3: Construction Sector Share of GSP, GDP and Employment
2011‑12 2012‑1310‑Year Average
Northern Territory
Share of GSP1 (%) 13.7 17.7 13.6
Industry resident employment2 12 200 13 500 10 100
Share of total resident employment (%) 10.0 10.7 9.0
Australia
Share of GDP1 (%) 7.7 7.7 7.2
Industry resident employment2 1 003 500 986 800 931 800
Share of total resident employment (%) 8.9 8.7 8.8
GSP: gross state product; GDP: gross domestic product1 Current prices. 2 Year average.Source: ABS, Australian National Accounts: State Accounts, Cat. No. 5220.0, Labour Force, Australia, Cat. No. 6291.0.55.003
The construction industry is one of the Territory’s largest industries in terms of its contribution to GSP and Territory employment.
In 2012‑13, the construction industry accounted for 17.7 per cent of the Territory’s GSP, up from 13.7 per cent in the previous year. This made construction the largest industry by value, in current terms, in 2012‑13, ahead of mining, which accounted for 14.3 per cent of Territory GSP.
The increase in construction’s share of GSP reflects the ongoing activity associated with a number of major resource projects in the Territory including the Ichthys project, expansions at major Territory mine sites and the development of the Montara project. Construction of the new Darwin Correctional Precinct and record levels of private residential construction also supported growth in the construction industry in 2012‑13.
In addition to the significant contribution to Territory GSP, the Territory construction industry employed about 13 500 people during 2012‑13. This accounted for 10.7 per cent of Territory resident employment and made the construction industry one of the Territory’s largest employers.
While the construction industry’s contribution to GSP is shown in current prices in Table 7.2, the following analysis of the components of construction activity is in inflation‑adjusted terms. It is based on ABS data on construction work done, which provides more detailed data on the components of construction activity. The ABS splits construction into three major categories: engineering construction, non‑residential building and residential building.
Engineering ConstructionEngineering construction includes mining, oil and gas and other heavy industry developments, as well as infrastructure including roads, railways and bridges. Engineering has been the largest component by value of Territory construction work done since the early 2000s, reflecting a series of major projects (Chart 7.4).
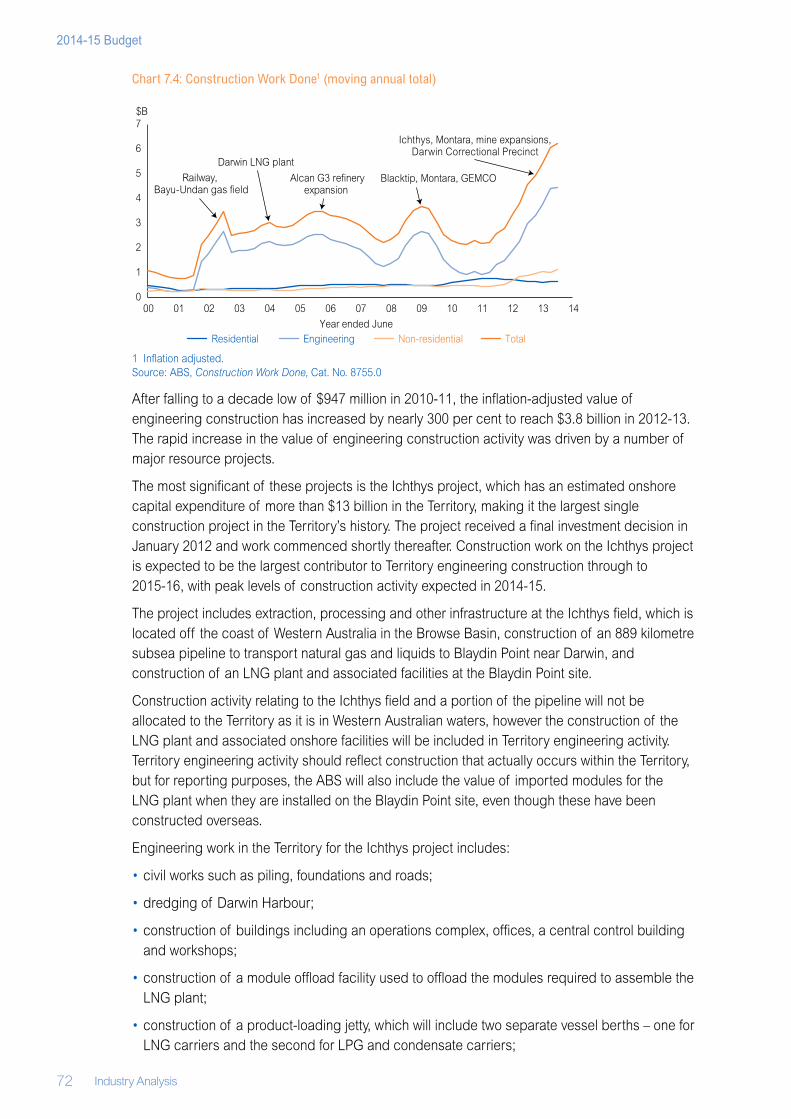
72 Industry Analysis
2014-15 Budget
Chart 7.4: Construction Work Done1 (moving annual total)
1 Inflation adjusted.Source: ABS, Construction Work Done, Cat. No. 8755.0
After falling to a decade low of $947 million in 2010‑11, the inflation‑adjusted value of engineering construction has increased by nearly 300 per cent to reach $3.8 billion in 2012‑13. The rapid increase in the value of engineering construction activity was driven by a number of major resource projects.
The most significant of these projects is the Ichthys project, which has an estimated onshore capital expenditure of more than $13 billion in the Territory, making it the largest single construction project in the Territory’s history. The project received a final investment decision in January 2012 and work commenced shortly thereafter. Construction work on the Ichthys project is expected to be the largest contributor to Territory engineering construction through to 2015‑16, with peak levels of construction activity expected in 2014‑15.
The project includes extraction, processing and other infrastructure at the Ichthys field, which is located off the coast of Western Australia in the Browse Basin, construction of an 889 kilometre subsea pipeline to transport natural gas and liquids to Blaydin Point near Darwin, and construction of an LNG plant and associated facilities at the Blaydin Point site.
Construction activity relating to the Ichthys field and a portion of the pipeline will not be allocated to the Territory as it is in Western Australian waters, however the construction of the LNG plant and associated onshore facilities will be included in Territory engineering activity. Territory engineering activity should reflect construction that actually occurs within the Territory, but for reporting purposes, the ABS will also include the value of imported modules for the LNG plant when they are installed on the Blaydin Point site, even though these have been constructed overseas.
Engineering work in the Territory for the Ichthys project includes:
• civil works such as piling, foundations and roads;
• dredging of Darwin Harbour;
• construction of buildings including an operations complex, offices, a central control building and workshops;
• construction of a module offload facility used to offload the modules required to assemble the LNG plant;
• construction of a product‑loading jetty, which will include two separate vessel berths – one for LNG carriers and the second for LPG and condensate carriers;
0
1
2
3
4
5
6
7
00 01 02 03 04 05 06 07 08 09 10 11 12 13 14
Residential Engineering Non-residential TotalYear ended June
$B
Blacktip, Montara, GEMCORailway, Bayu-Undan gas field
Darwin LNG plant
Alcan G3 refinery expansion
Ichthys, Montara, mine expansions,Darwin Correctional Precinct
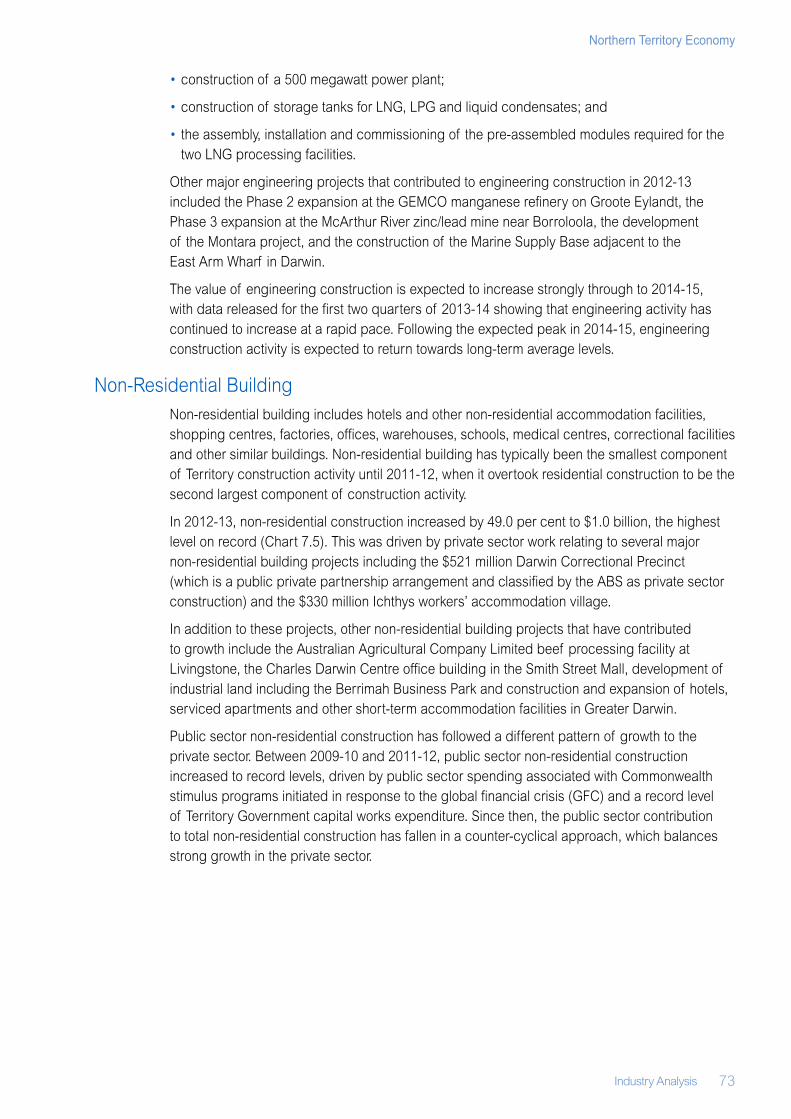
Industry Analysis 73
Northern Territory Economy
• construction of a 500 megawatt power plant;
• construction of storage tanks for LNG, LPG and liquid condensates; and
• the assembly, installation and commissioning of the pre‑assembled modules required for the two LNG processing facilities.
Other major engineering projects that contributed to engineering construction in 2012‑13 included the Phase 2 expansion at the GEMCO manganese refinery on Groote Eylandt, the Phase 3 expansion at the McArthur River zinc/lead mine near Borroloola, the development of the Montara project, and the construction of the Marine Supply Base adjacent to the East Arm Wharf in Darwin.
The value of engineering construction is expected to increase strongly through to 2014‑15, with data released for the first two quarters of 2013‑14 showing that engineering activity has continued to increase at a rapid pace. Following the expected peak in 2014‑15, engineering construction activity is expected to return towards long‑term average levels.
Non‑Residential BuildingNon‑residential building includes hotels and other non‑residential accommodation facilities, shopping centres, factories, offices, warehouses, schools, medical centres, correctional facilities and other similar buildings. Non‑residential building has typically been the smallest component of Territory construction activity until 2011‑12, when it overtook residential construction to be the second largest component of construction activity.
In 2012‑13, non‑residential construction increased by 49.0 per cent to $1.0 billion, the highest level on record (Chart 7.5). This was driven by private sector work relating to several major non‑residential building projects including the $521 million Darwin Correctional Precinct (which is a public private partnership arrangement and classified by the ABS as private sector construction) and the $330 million Ichthys workers’ accommodation village.
In addition to these projects, other non‑residential building projects that have contributed to growth include the Australian Agricultural Company Limited beef processing facility at Livingstone, the Charles Darwin Centre office building in the Smith Street Mall, development of industrial land including the Berrimah Business Park and construction and expansion of hotels, serviced apartments and other short‑term accommodation facilities in Greater Darwin.
Public sector non‑residential construction has followed a different pattern of growth to the private sector. Between 2009‑10 and 2011‑12, public sector non‑residential construction increased to record levels, driven by public sector spending associated with Commonwealth stimulus programs initiated in response to the global financial crisis (GFC) and a record level of Territory Government capital works expenditure. Since then, the public sector contribution to total non‑residential construction has fallen in a counter‑cyclical approach, which balances strong growth in the private sector.
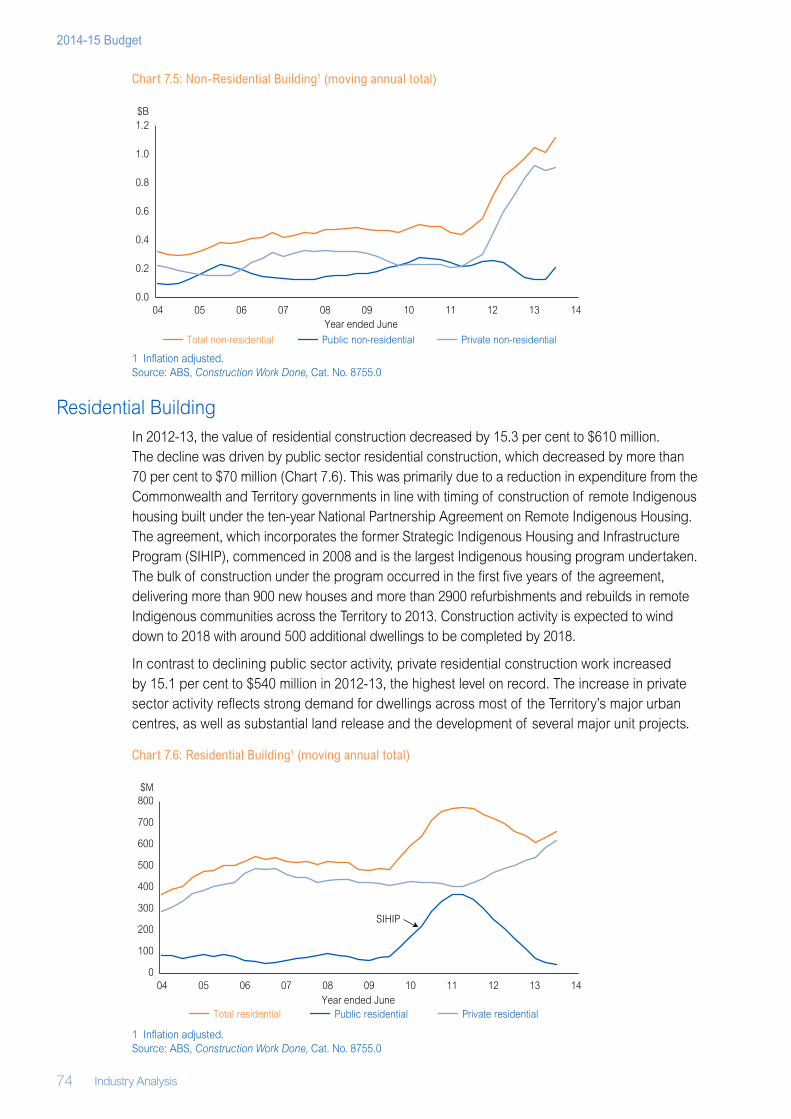
74 Industry Analysis
2014-15 Budget
Chart 7.5: Non‑Residential Building1 (moving annual total)
1 Inflation adjusted.Source: ABS, Construction Work Done, Cat. No. 8755.0
Residential BuildingIn 2012‑13, the value of residential construction decreased by 15.3 per cent to $610 million. The decline was driven by public sector residential construction, which decreased by more than 70 per cent to $70 million (Chart 7.6). This was primarily due to a reduction in expenditure from the Commonwealth and Territory governments in line with timing of construction of remote Indigenous housing built under the ten‑year National Partnership Agreement on Remote Indigenous Housing. The agreement, which incorporates the former Strategic Indigenous Housing and Infrastructure Program (SIHIP), commenced in 2008 and is the largest Indigenous housing program undertaken. The bulk of construction under the program occurred in the first five years of the agreement, delivering more than 900 new houses and more than 2900 refurbishments and rebuilds in remote Indigenous communities across the Territory to 2013. Construction activity is expected to wind down to 2018 with around 500 additional dwellings to be completed by 2018.
In contrast to declining public sector activity, private residential construction work increased by 15.1 per cent to $540 million in 2012‑13, the highest level on record. The increase in private sector activity reflects strong demand for dwellings across most of the Territory’s major urban centres, as well as substantial land release and the development of several major unit projects.
Chart 7.6: Residential Building1 (moving annual total)
1 Inflation adjusted.Source: ABS, Construction Work Done, Cat. No. 8755.0
0.0
0.2
0.4
0.6
0.8
1.0
1.2
04 05 06 07 08 09 10 11 12 13 14
Total non-residential Public non-residential Private non-residential
$B
Year ended June
0
100
200
300
400
500
600
700
800
04 05 06 07 08 09 10 11 12 13 14
Total residential Private residentialPublic residential
$M
SIHIP
Year ended June
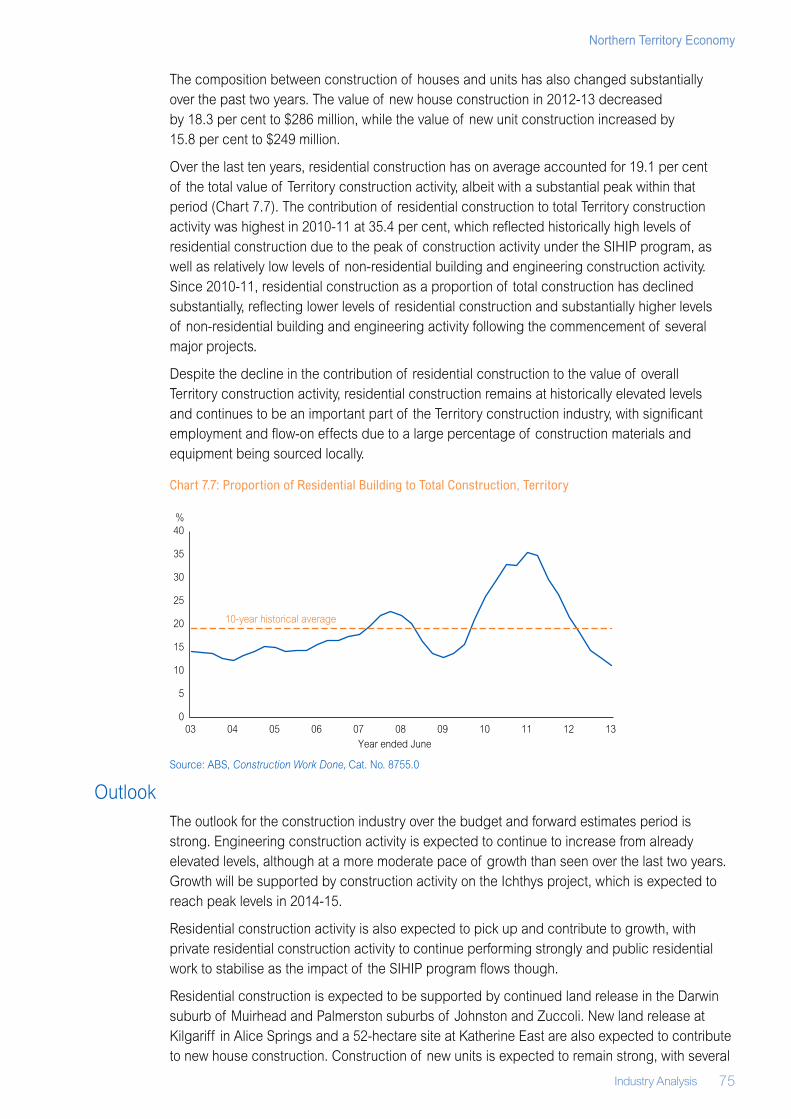
Industry Analysis 75
Northern Territory Economy
The composition between construction of houses and units has also changed substantially over the past two years. The value of new house construction in 2012‑13 decreased by 18.3 per cent to $286 million, while the value of new unit construction increased by 15.8 per cent to $249 million.
Over the last ten years, residential construction has on average accounted for 19.1 per cent of the total value of Territory construction activity, albeit with a substantial peak within that period (Chart 7.7). The contribution of residential construction to total Territory construction activity was highest in 2010‑11 at 35.4 per cent, which reflected historically high levels of residential construction due to the peak of construction activity under the SIHIP program, as well as relatively low levels of non‑residential building and engineering construction activity. Since 2010‑11, residential construction as a proportion of total construction has declined substantially, reflecting lower levels of residential construction and substantially higher levels of non‑residential building and engineering activity following the commencement of several major projects.
Despite the decline in the contribution of residential construction to the value of overall Territory construction activity, residential construction remains at historically elevated levels and continues to be an important part of the Territory construction industry, with significant employment and flow‑on effects due to a large percentage of construction materials and equipment being sourced locally.
Chart 7.7: Proportion of Residential Building to Total Construction, Territory
Source: ABS, Construction Work Done, Cat. No. 8755.0
OutlookThe outlook for the construction industry over the budget and forward estimates period is strong. Engineering construction activity is expected to continue to increase from already elevated levels, although at a more moderate pace of growth than seen over the last two years. Growth will be supported by construction activity on the Ichthys project, which is expected to reach peak levels in 2014‑15.
Residential construction activity is also expected to pick up and contribute to growth, with private residential construction activity to continue performing strongly and public residential work to stabilise as the impact of the SIHIP program flows though.
Residential construction is expected to be supported by continued land release in the Darwin suburb of Muirhead and Palmerston suburbs of Johnston and Zuccoli. New land release at Kilgariff in Alice Springs and a 52‑hectare site at Katherine East are also expected to contribute to new house construction. Construction of new units is expected to remain strong, with several
0
5
10
15
20
25
30
35
40
03 04 05 06 07 08 09 10 11 12 13
%
Year ended June
10-year historical average
76 Industry Analysis
2014-15 Budget
developments recently commencing or in the pipeline. Growth may, however, begin to moderate following the completion of a number of large developments in 2013‑14 including The Avenue and SOHO.
The Territory Government’s Real Housing for Growth Plan is expected to contribute substantially to residential construction over the budget and forward estimates period. The program aims to increase housing supply and has a target of 2000 new homes to be constructed across the Territory by 2016‑17. To date, more than 250 new dwellings have already been delivered through Real Housing for Growth initiatives, with a further 650 scheduled for completion during 2014‑15. The Department of Housing has also entered into agreements with private developers to head lease more than 150 properties at ten sites across Darwin, Palmerston, Alice Springs and Tennant Creek for the purpose of delivering affordable rentals to key service industry workers.
The changes to the First Home Owners Grant (FHOG) scheme announced in the 2014‑15 Budget are also expected to contribute to residential construction activity. For contracts to purchase or build a new home entered into on or after 13 May 2014, the FHOG will increase to $26 000 and the value cap will be removed. The changes to the FHOG scheme are expected to encourage first home buyers to buy or build new housing and support private new residential construction.
Non‑residential construction is likely to decline over the coming years, albeit from record high levels, as major projects such as the Darwin Correctional Precinct and Ichthys workers’ accommodation village are completed. Despite this, non‑residential building is expected to remain relatively high by historical standards, supported by projects such as the Charles Darwin Centre office development and the Palmerston Regional Hospital. There are also a number of potential projects that could provide a substantial boost to non‑residential construction such as expansion and redevelopment at the Casuarina Square shopping centre, the proposed Gateway shopping centre in Palmerston and a new four‑star hotel in Palmerston.
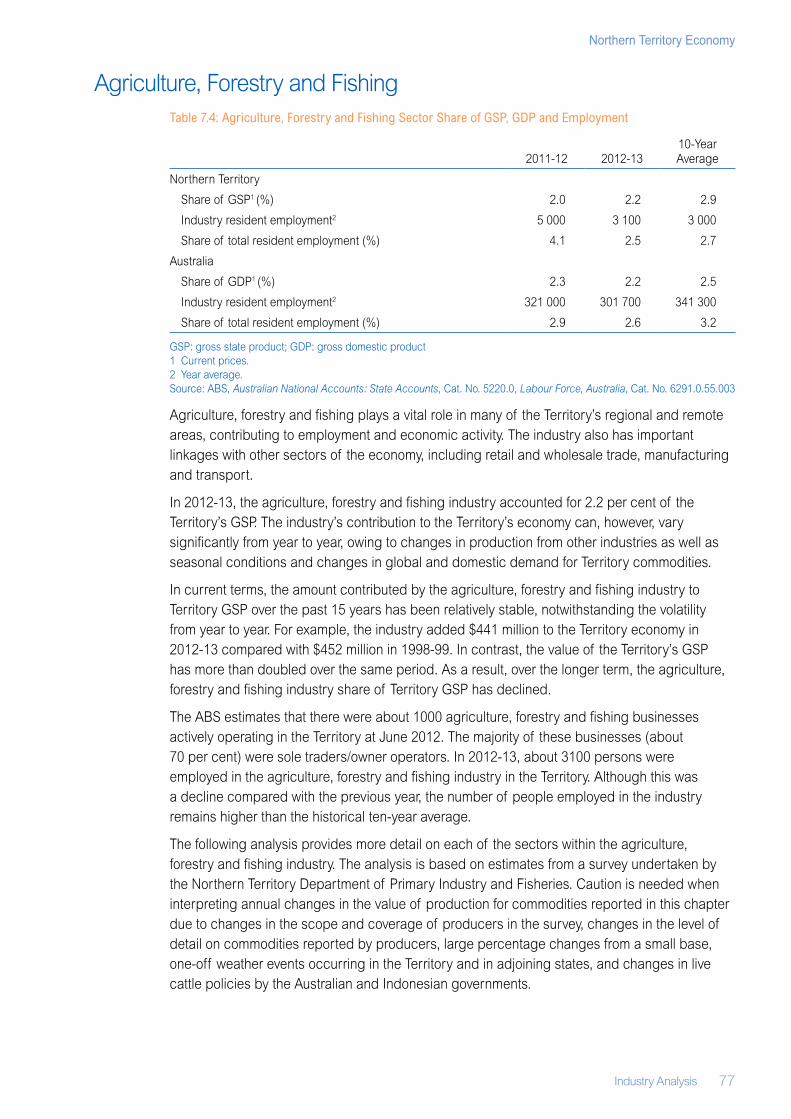
Industry Analysis 77
Northern Territory Economy
Agriculture, Forestry and FishingTable 7.4: Agriculture, Forestry and Fishing Sector Share of GSP, GDP and Employment
2011‑12 2012‑1310‑Year Average
Northern Territory
Share of GSP1 (%) 2.0 2.2 2.9
Industry resident employment2 5 000 3 100 3 000
Share of total resident employment (%) 4.1 2.5 2.7
Australia
Share of GDP1 (%) 2.3 2.2 2.5
Industry resident employment2 321 000 301 700 341 300
Share of total resident employment (%) 2.9 2.6 3.2
GSP: gross state product; GDP: gross domestic product1 Current prices.2 Year average.Source: ABS, Australian National Accounts: State Accounts, Cat. No. 5220.0, Labour Force, Australia, Cat. No. 6291.0.55.003
Agriculture, forestry and fishing plays a vital role in many of the Territory’s regional and remote areas, contributing to employment and economic activity. The industry also has important linkages with other sectors of the economy, including retail and wholesale trade, manufacturing and transport.
In 2012‑13, the agriculture, forestry and fishing industry accounted for 2.2 per cent of the Territory’s GSP. The industry’s contribution to the Territory’s economy can, however, vary significantly from year to year, owing to changes in production from other industries as well as seasonal conditions and changes in global and domestic demand for Territory commodities.
In current terms, the amount contributed by the agriculture, forestry and fishing industry to Territory GSP over the past 15 years has been relatively stable, notwithstanding the volatility from year to year. For example, the industry added $441 million to the Territory economy in 2012‑13 compared with $452 million in 1998‑99. In contrast, the value of the Territory’s GSP has more than doubled over the same period. As a result, over the longer term, the agriculture, forestry and fishing industry share of Territory GSP has declined.
The ABS estimates that there were about 1000 agriculture, forestry and fishing businesses actively operating in the Territory at June 2012. The majority of these businesses (about 70 per cent) were sole traders/owner operators. In 2012‑13, about 3100 persons were employed in the agriculture, forestry and fishing industry in the Territory. Although this was a decline compared with the previous year, the number of people employed in the industry remains higher than the historical ten‑year average.
The following analysis provides more detail on each of the sectors within the agriculture, forestry and fishing industry. The analysis is based on estimates from a survey undertaken by the Northern Territory Department of Primary Industry and Fisheries. Caution is needed when interpreting annual changes in the value of production for commodities reported in this chapter due to changes in the scope and coverage of producers in the survey, changes in the level of detail on commodities reported by producers, large percentage changes from a small base, one‑off weather events occurring in the Territory and in adjoining states, and changes in live cattle policies by the Australian and Indonesian governments.
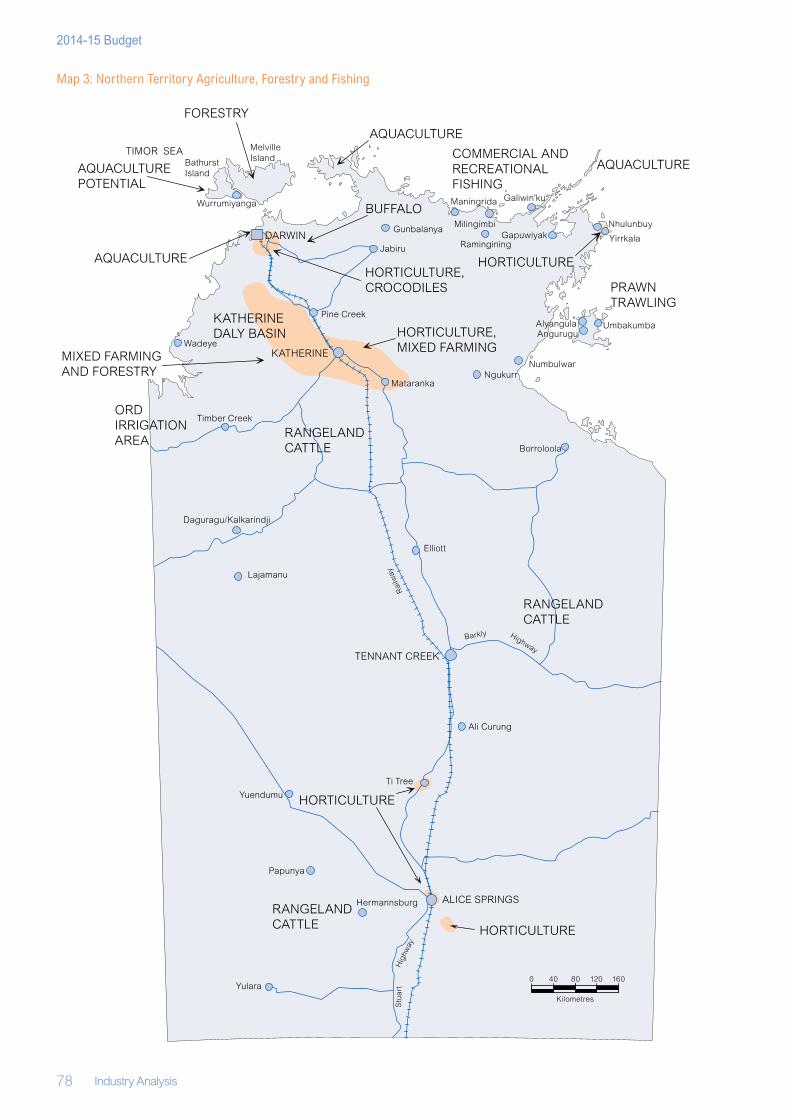
78 Industry Analysis
2014-15 Budget
Map 3: Northern Territory Agriculture, Forestry and Fishing
PRAWN TRAWLING
AQUACULTURECOMMERCIAL AND RECREATIONAL FISHING
AQUACULTURE
AQUACULTURE
BUFFALO
HORTICULTURE,CROCODILES
KATHERINEDALY BASIN
ORDIRRIGATION AREA
MIXED FARMINGAND FORESTRY
FORESTRY
AQUACULTUREPOTENTIAL
HORTICULTURE,MIXED FARMING
RANGELAND CATTLE
RANGELAND CATTLE
RANGELAND CATTLE
HORTICULTURE
Kilometres
0 40 80 120 160
Stu
art
Hig
hway
Barkly Highway
Rai
lway
TIMOR SEA
Pine Creek
Mataranka
Borroloola
Elliott
Ti Tree
Ngukurr
Daguragu/Kalkarindji
Timber Creek
Jabiru
Melville IslandBathurst
Island
Yuendumu
Yulara
Nhulunbuy
TENNANT CREEK
KATHERINE
DARWIN
ALICE SPRINGS
Lajamanu
Wurrumiyanga
Gunbalanya
Maningrida
Milingimbi
Ramingining
Wadeye
Numbulwar
YirrkalaGapuwiyak
Hermannsburg
Papunya
Ali Curung
Galiwin’ku
UmbakumbaAlyangula
HORTICULTURE
HORTICULTURE
Angurugu
Industry Analysis 79
Northern Territory Economy
AgricultureThe agriculture sector dominates the agriculture, forestry and fishing industry, accounting for about 90 per cent of the total value of production in the industry.
In 2012‑13, the largest contributor to agricultural production in the Territory was live cattle (about 55 per cent), followed by horticulture (about 40 per cent) and other livestock (about 5 per cent).
Live CattleThe cattle industry has a large economic impact on the Territory through its linkage with expenditure on cattle transport, stock feed, wages, port charges and demand for services such as quarantine inspection and veterinary requirements. In turn, this provides significant employment opportunities, particularly in regional parts of the Territory, and substantial export income, which supports regional economic growth.
The ABS estimates that there were 2.2 million head of cattle across 250 businesses in the Territory in 2011‑12. Virtually all Territory livestock cattle are raised for the purpose of meat production, with a small proportion raised as dairy cattle. Nationally, in 2011‑12, there were about 28.5 million head of cattle, of which about 90 per cent were meat cattle.
The live cattle industry in the Territory comprises live cattle exported overseas and interstate. Chart 7.8 shows the number of live cattle movements from the Territory to these markets. It should be noted that the international live cattle trade figures do not include live Territory cattle that are exported overseas through ports outside the Territory.
Chart 7.8: Annual Number of Live Territory Cattle Movements
Source: Department of Primary Industry and Fisheries
International Live Cattle Exports
Indonesia is the Territory’s major overseas destination for live cattle, accounting for about 78 per cent of total live Territory overseas exports in 2012‑13. Other major overseas export destinations for live Territory cattle in 2012‑13 were the Philippines (10 per cent), Vietnam (6 per cent), Malaysia (4 per cent) and Brunei (2 per cent). The Territory exported live cattle to Egypt in 2011‑12 (Chart 7.9).
0
100
200
300
400
500
600
700
04 05 06 07 08 09 10 11 12 13
Overseas Interstate
Year ended June
Number (000)
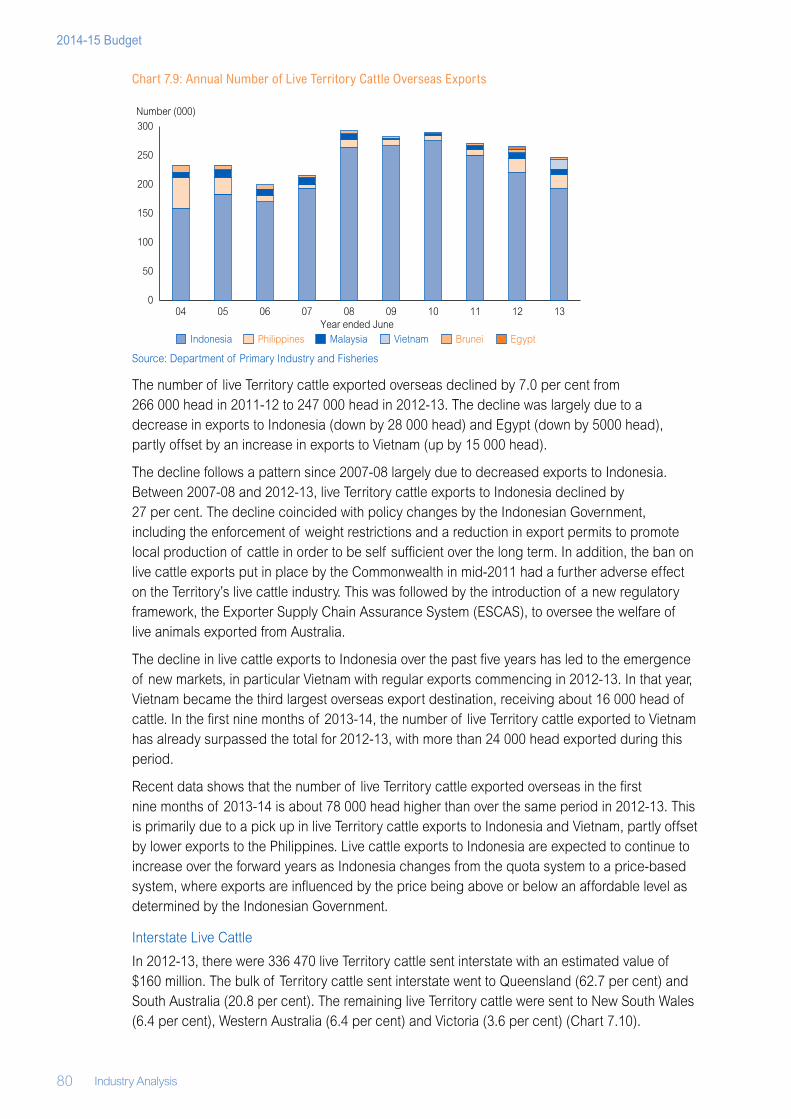
80 Industry Analysis
2014-15 Budget
Chart 7.9: Annual Number of Live Territory Cattle Overseas Exports
Source: Department of Primary Industry and Fisheries
The number of live Territory cattle exported overseas declined by 7.0 per cent from 266 000 head in 2011‑12 to 247 000 head in 2012‑13. The decline was largely due to a decrease in exports to Indonesia (down by 28 000 head) and Egypt (down by 5000 head), partly offset by an increase in exports to Vietnam (up by 15 000 head).
The decline follows a pattern since 2007‑08 largely due to decreased exports to Indonesia. Between 2007‑08 and 2012‑13, live Territory cattle exports to Indonesia declined by 27 per cent. The decline coincided with policy changes by the Indonesian Government, including the enforcement of weight restrictions and a reduction in export permits to promote local production of cattle in order to be self sufficient over the long term. In addition, the ban on live cattle exports put in place by the Commonwealth in mid‑2011 had a further adverse effect on the Territory’s live cattle industry. This was followed by the introduction of a new regulatory framework, the Exporter Supply Chain Assurance System (ESCAS), to oversee the welfare of live animals exported from Australia.
The decline in live cattle exports to Indonesia over the past five years has led to the emergence of new markets, in particular Vietnam with regular exports commencing in 2012‑13. In that year, Vietnam became the third largest overseas export destination, receiving about 16 000 head of cattle. In the first nine months of 2013‑14, the number of live Territory cattle exported to Vietnam has already surpassed the total for 2012‑13, with more than 24 000 head exported during this period.
Recent data shows that the number of live Territory cattle exported overseas in the first nine months of 2013‑14 is about 78 000 head higher than over the same period in 2012‑13. This is primarily due to a pick up in live Territory cattle exports to Indonesia and Vietnam, partly offset by lower exports to the Philippines. Live cattle exports to Indonesia are expected to continue to increase over the forward years as Indonesia changes from the quota system to a price‑based system, where exports are influenced by the price being above or below an affordable level as determined by the Indonesian Government.
Interstate Live Cattle
In 2012‑13, there were 336 470 live Territory cattle sent interstate with an estimated value of $160 million. The bulk of Territory cattle sent interstate went to Queensland (62.7 per cent) and South Australia (20.8 per cent). The remaining live Territory cattle were sent to New South Wales (6.4 per cent), Western Australia (6.4 per cent) and Victoria (3.6 per cent) (Chart 7.10).
0
50
100
150
200
250
300
04 05 06 07 08 09 10 11 12 13
Indonesia Philippines Malaysia Vietnam Brunei Egypt
Number (000)
Year ended June
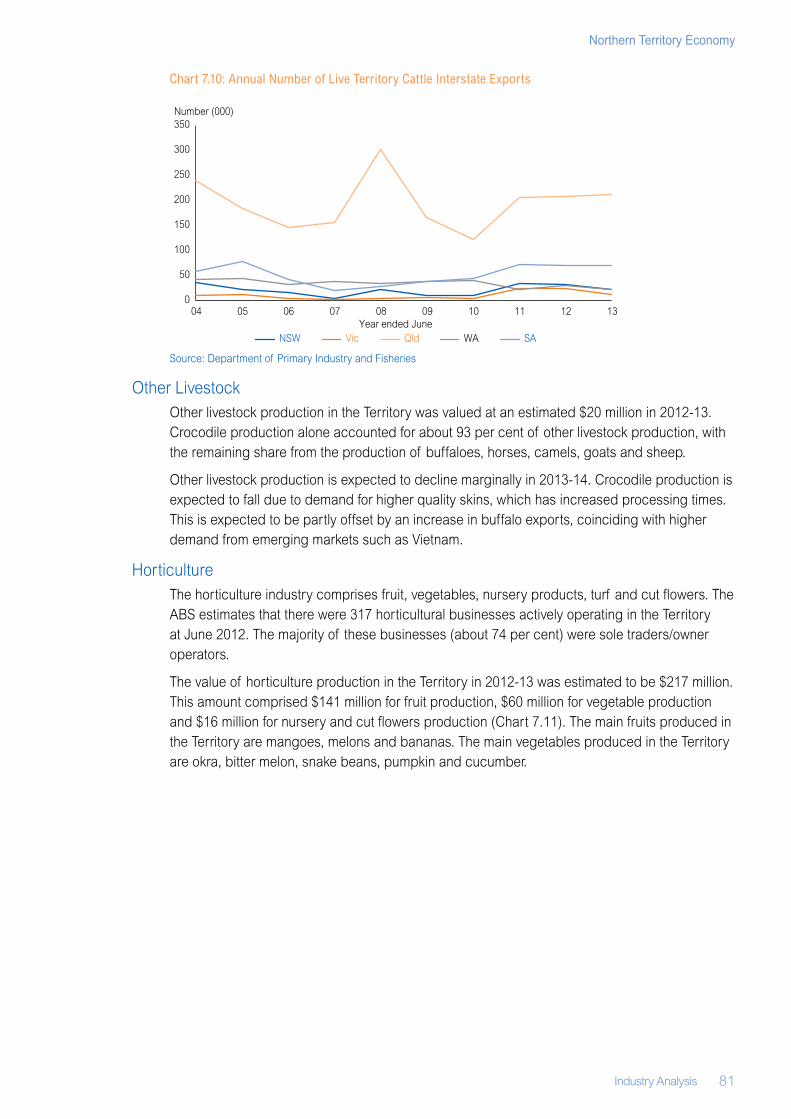
Industry Analysis 81
Northern Territory Economy
Chart 7.10: Annual Number of Live Territory Cattle Interstate Exports
Source: Department of Primary Industry and Fisheries
Other LivestockOther livestock production in the Territory was valued at an estimated $20 million in 2012‑13. Crocodile production alone accounted for about 93 per cent of other livestock production, with the remaining share from the production of buffaloes, horses, camels, goats and sheep.
Other livestock production is expected to decline marginally in 2013‑14. Crocodile production is expected to fall due to demand for higher quality skins, which has increased processing times. This is expected to be partly offset by an increase in buffalo exports, coinciding with higher demand from emerging markets such as Vietnam.
HorticultureThe horticulture industry comprises fruit, vegetables, nursery products, turf and cut flowers. The ABS estimates that there were 317 horticultural businesses actively operating in the Territory at June 2012. The majority of these businesses (about 74 per cent) were sole traders/owner operators.
The value of horticulture production in the Territory in 2012‑13 was estimated to be $217 million. This amount comprised $141 million for fruit production, $60 million for vegetable production and $16 million for nursery and cut flowers production (Chart 7.11). The main fruits produced in the Territory are mangoes, melons and bananas. The main vegetables produced in the Territory are okra, bitter melon, snake beans, pumpkin and cucumber.
0
50
100
150
200
250
300
350
04 05 06 07 08 09 10 11 12 13
NSW Vic Qld WA SA
Number (000)
Year ended June
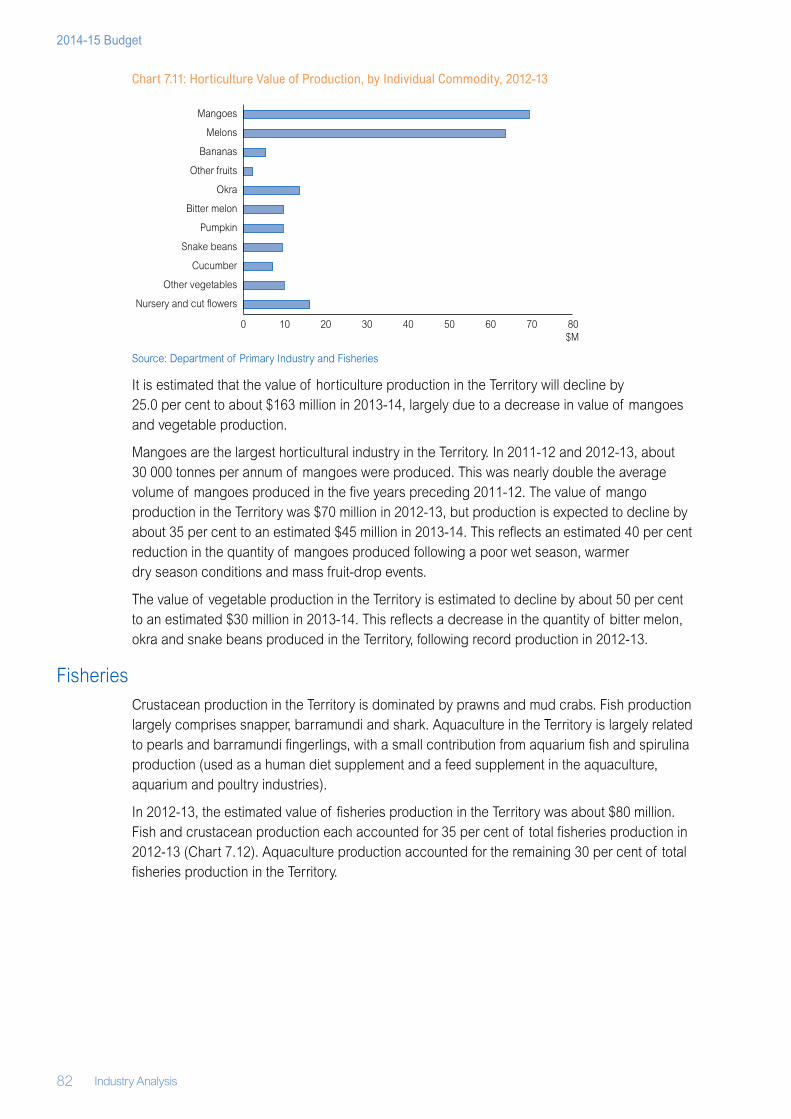
82 Industry Analysis
2014-15 Budget
Chart 7.11: Horticulture Value of Production, by Individual Commodity, 2012‑13
Source: Department of Primary Industry and Fisheries
It is estimated that the value of horticulture production in the Territory will decline by 25.0 per cent to about $163 million in 2013‑14, largely due to a decrease in value of mangoes and vegetable production.
Mangoes are the largest horticultural industry in the Territory. In 2011‑12 and 2012‑13, about 30 000 tonnes per annum of mangoes were produced. This was nearly double the average volume of mangoes produced in the five years preceding 2011‑12. The value of mango production in the Territory was $70 million in 2012‑13, but production is expected to decline by about 35 per cent to an estimated $45 million in 2013‑14. This reflects an estimated 40 per cent reduction in the quantity of mangoes produced following a poor wet season, warmer dry season conditions and mass fruit‑drop events.
The value of vegetable production in the Territory is estimated to decline by about 50 per cent to an estimated $30 million in 2013‑14. This reflects a decrease in the quantity of bitter melon, okra and snake beans produced in the Territory, following record production in 2012‑13.
FisheriesCrustacean production in the Territory is dominated by prawns and mud crabs. Fish production largely comprises snapper, barramundi and shark. Aquaculture in the Territory is largely related to pearls and barramundi fingerlings, with a small contribution from aquarium fish and spirulina production (used as a human diet supplement and a feed supplement in the aquaculture, aquarium and poultry industries).
In 2012‑13, the estimated value of fisheries production in the Territory was about $80 million. Fish and crustacean production each accounted for 35 per cent of total fisheries production in 2012‑13 (Chart 7.12). Aquaculture production accounted for the remaining 30 per cent of total fisheries production in the Territory.
0 10 20 30 40 50 60 70 80
Nursery and cut flowers
Other vegetables
Cucumber
Snake beans
Pumpkin
Bitter melon
Okra
Other fruits
Bananas
Melons
Mangoes
$M
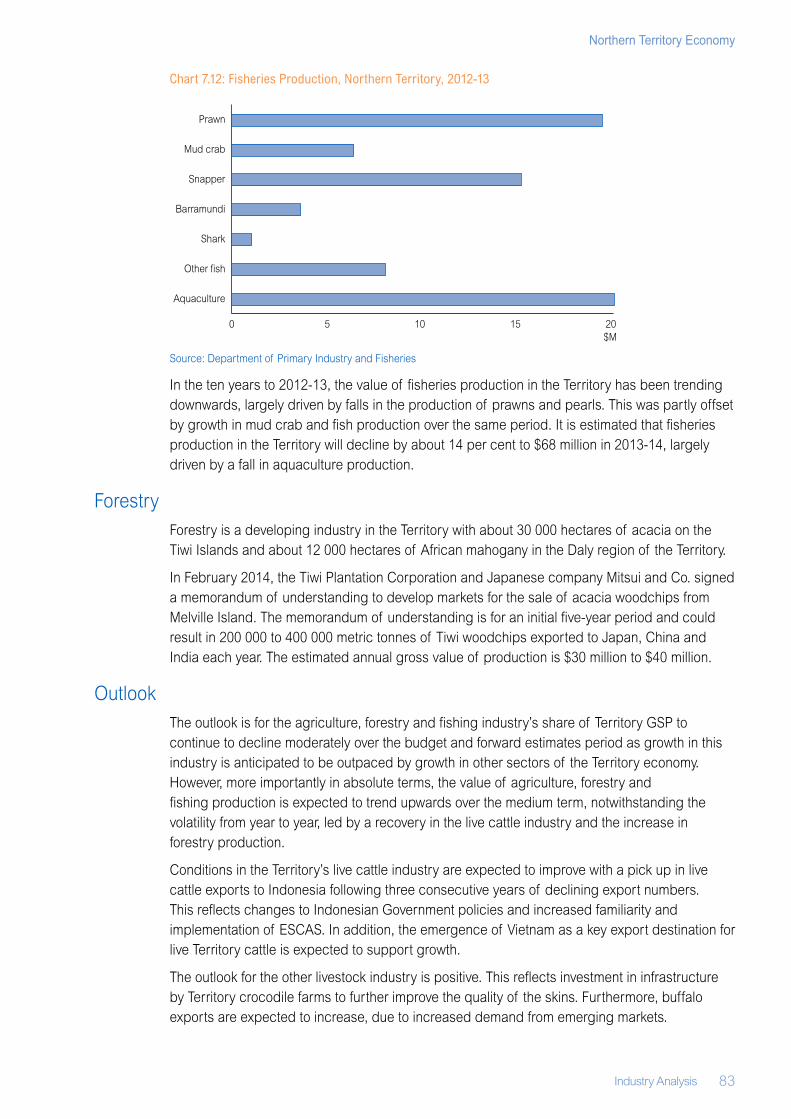
Industry Analysis 83
Northern Territory Economy
Chart 7.12: Fisheries Production, Northern Territory, 2012‑13
Source: Department of Primary Industry and Fisheries
In the ten years to 2012‑13, the value of fisheries production in the Territory has been trending downwards, largely driven by falls in the production of prawns and pearls. This was partly offset by growth in mud crab and fish production over the same period. It is estimated that fisheries production in the Territory will decline by about 14 per cent to $68 million in 2013‑14, largely driven by a fall in aquaculture production.
ForestryForestry is a developing industry in the Territory with about 30 000 hectares of acacia on the Tiwi Islands and about 12 000 hectares of African mahogany in the Daly region of the Territory.
In February 2014, the Tiwi Plantation Corporation and Japanese company Mitsui and Co. signed a memorandum of understanding to develop markets for the sale of acacia woodchips from Melville Island. The memorandum of understanding is for an initial five‑year period and could result in 200 000 to 400 000 metric tonnes of Tiwi woodchips exported to Japan, China and India each year. The estimated annual gross value of production is $30 million to $40 million.
OutlookThe outlook is for the agriculture, forestry and fishing industry’s share of Territory GSP to continue to decline moderately over the budget and forward estimates period as growth in this industry is anticipated to be outpaced by growth in other sectors of the Territory economy. However, more importantly in absolute terms, the value of agriculture, forestry and fishing production is expected to trend upwards over the medium term, notwithstanding the volatility from year to year, led by a recovery in the live cattle industry and the increase in forestry production.
Conditions in the Territory’s live cattle industry are expected to improve with a pick up in live cattle exports to Indonesia following three consecutive years of declining export numbers. This reflects changes to Indonesian Government policies and increased familiarity and implementation of ESCAS. In addition, the emergence of Vietnam as a key export destination for live Territory cattle is expected to support growth.
The outlook for the other livestock industry is positive. This reflects investment in infrastructure by Territory crocodile farms to further improve the quality of the skins. Furthermore, buffalo exports are expected to increase, due to increased demand from emerging markets.
0 5 10 15 20$M
Aquaculture
Other fish
Shark
Barramundi
Snapper
Mud crab
Prawn
84 Industry Analysis
2014-15 Budget
The outlook for the Territory’s forestry industry is positive following the signing of a memorandum of understanding between the Tiwi Land Council and Mitsui and Co. to export Tiwi woodchips to overseas markets. This will support economic growth and increase employment opportunities in the region as well as increase Territory exports.
Horticulture production is highly influenced by climatic conditions. Mango and vegetable production is expected to recover in 2014‑15 following a good wet season in 2014. In the medium term, overall horticulture production is expected to remain stable.
Fisheries production in the Territory has declined over the past decade, primarily due to lower prawn production and, more recently, lower pearl production. Fisheries production is expected to decline in 2013‑14 largely driven by a decrease in aquaculture production. The value of fisheries production over the forward estimates period will be highly dependent on climatic conditions and its influence on fish and crustacean stocks.
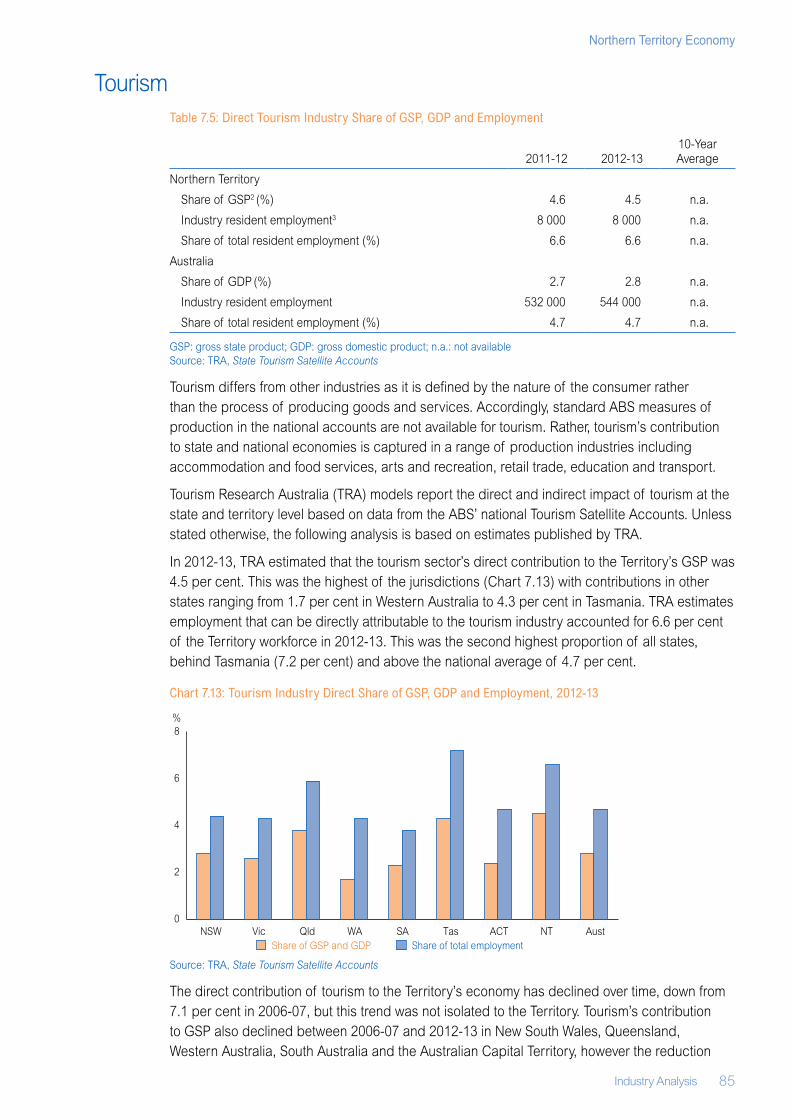
Industry Analysis 85
Northern Territory Economy
TourismTable 7.5: Direct Tourism Industry Share of GSP, GDP and Employment
2011‑12 2012‑1310‑Year Average
Northern Territory
Share of GSP2 (%) 4.6 4.5 n.a.
Industry resident employment3 8 000 8 000 n.a.
Share of total resident employment (%) 6.6 6.6 n.a.
Australia
Share of GDP (%) 2.7 2.8 n.a.
Industry resident employment 532 000 544 000 n.a.
Share of total resident employment (%) 4.7 4.7 n.a.
GSP: gross state product; GDP: gross domestic product; n.a.: not availableSource: TRA, State Tourism Satellite Accounts
Tourism differs from other industries as it is defined by the nature of the consumer rather than the process of producing goods and services. Accordingly, standard ABS measures of production in the national accounts are not available for tourism. Rather, tourism’s contribution to state and national economies is captured in a range of production industries including accommodation and food services, arts and recreation, retail trade, education and transport.
Tourism Research Australia (TRA) models report the direct and indirect impact of tourism at the state and territory level based on data from the ABS’ national Tourism Satellite Accounts. Unless stated otherwise, the following analysis is based on estimates published by TRA.
In 2012‑13, TRA estimated that the tourism sector’s direct contribution to the Territory’s GSP was 4.5 per cent. This was the highest of the jurisdictions (Chart 7.13) with contributions in other states ranging from 1.7 per cent in Western Australia to 4.3 per cent in Tasmania. TRA estimates employment that can be directly attributable to the tourism industry accounted for 6.6 per cent of the Territory workforce in 2012‑13. This was the second highest proportion of all states, behind Tasmania (7.2 per cent) and above the national average of 4.7 per cent.
Chart 7.13: Tourism Industry Direct Share of GSP, GDP and Employment, 2012‑13
Source: TRA, State Tourism Satellite Accounts
The direct contribution of tourism to the Territory’s economy has declined over time, down from 7.1 per cent in 2006‑07, but this trend was not isolated to the Territory. Tourism’s contribution to GSP also declined between 2006‑07 and 2012‑13 in New South Wales, Queensland, Western Australia, South Australia and the Australian Capital Territory, however the reduction
NSW Vic Qld WA SA Tas ACT NT AustShare of GSP and GDP Share of total employment
%
0
2
4
6
8
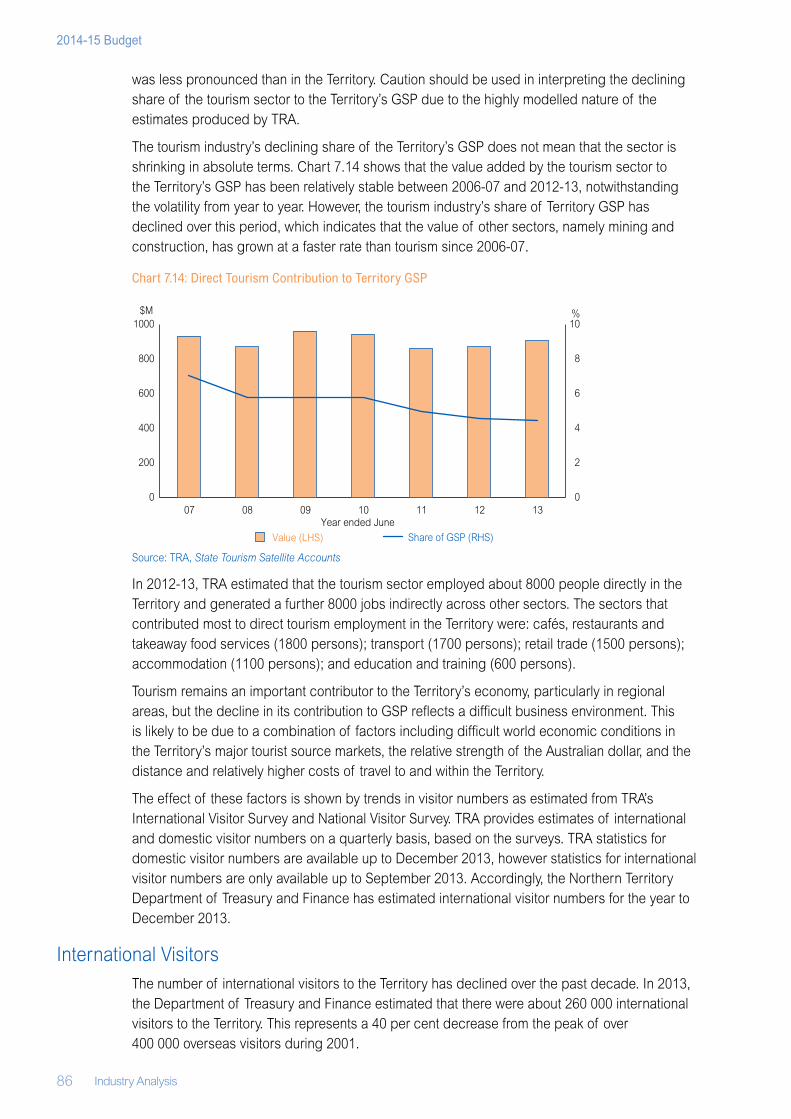
86 Industry Analysis
2014-15 Budget
was less pronounced than in the Territory. Caution should be used in interpreting the declining share of the tourism sector to the Territory’s GSP due to the highly modelled nature of the estimates produced by TRA.
The tourism industry’s declining share of the Territory’s GSP does not mean that the sector is shrinking in absolute terms. Chart 7.14 shows that the value added by the tourism sector to the Territory’s GSP has been relatively stable between 2006‑07 and 2012‑13, notwithstanding the volatility from year to year. However, the tourism industry’s share of Territory GSP has declined over this period, which indicates that the value of other sectors, namely mining and construction, has grown at a faster rate than tourism since 2006‑07.
Chart 7.14: Direct Tourism Contribution to Territory GSP
Source: TRA, State Tourism Satellite Accounts
In 2012‑13, TRA estimated that the tourism sector employed about 8000 people directly in the Territory and generated a further 8000 jobs indirectly across other sectors. The sectors that contributed most to direct tourism employment in the Territory were: cafés, restaurants and takeaway food services (1800 persons); transport (1700 persons); retail trade (1500 persons); accommodation (1100 persons); and education and training (600 persons).
Tourism remains an important contributor to the Territory’s economy, particularly in regional areas, but the decline in its contribution to GSP reflects a difficult business environment. This is likely to be due to a combination of factors including difficult world economic conditions in the Territory’s major tourist source markets, the relative strength of the Australian dollar, and the distance and relatively higher costs of travel to and within the Territory.
The effect of these factors is shown by trends in visitor numbers as estimated from TRA’s International Visitor Survey and National Visitor Survey. TRA provides estimates of international and domestic visitor numbers on a quarterly basis, based on the surveys. TRA statistics for domestic visitor numbers are available up to December 2013, however statistics for international visitor numbers are only available up to September 2013. Accordingly, the Northern Territory Department of Treasury and Finance has estimated international visitor numbers for the year to December 2013.
International VisitorsThe number of international visitors to the Territory has declined over the past decade. In 2013, the Department of Treasury and Finance estimated that there were about 260 000 international visitors to the Territory. This represents a 40 per cent decrease from the peak of over 400 000 overseas visitors during 2001.
0
2
4
6
8
10
0
200
400
600
800
1000
07 08 09 10 11 12 13
Share of GSP (RHS)Value (LHS)
$M %
Year ended June
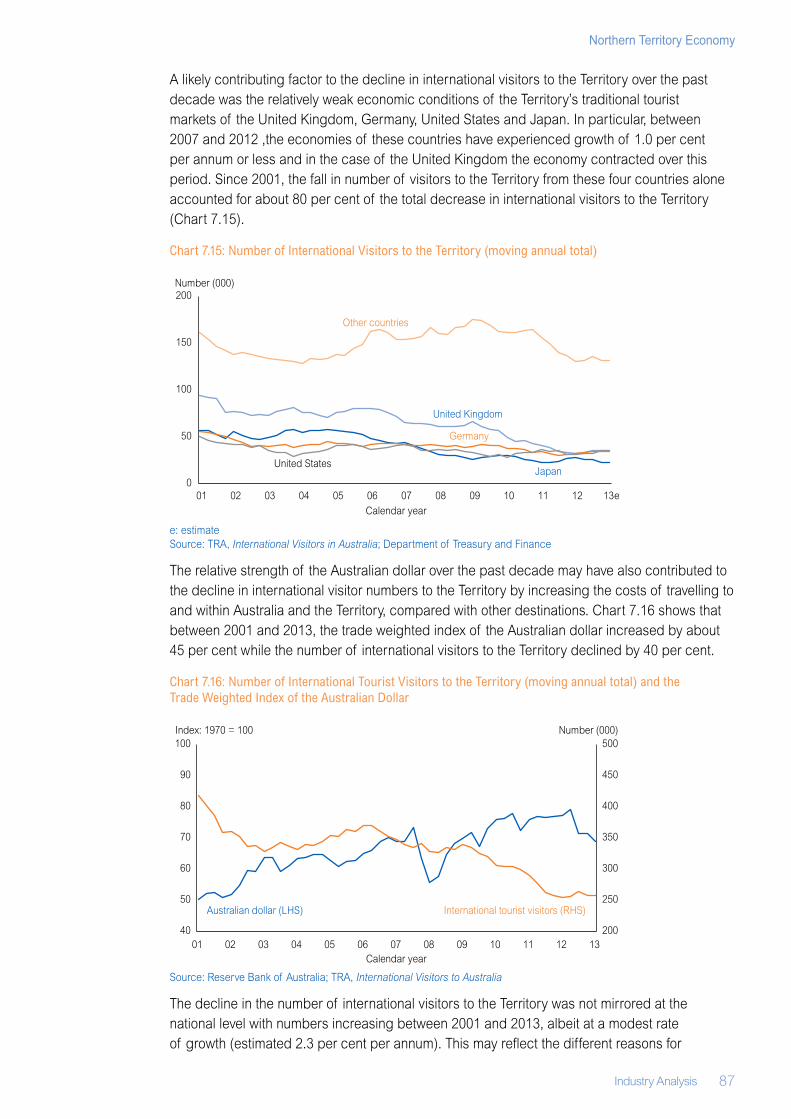
Industry Analysis 87
Northern Territory Economy
A likely contributing factor to the decline in international visitors to the Territory over the past decade was the relatively weak economic conditions of the Territory’s traditional tourist markets of the United Kingdom, Germany, United States and Japan. In particular, between 2007 and 2012 ,the economies of these countries have experienced growth of 1.0 per cent per annum or less and in the case of the United Kingdom the economy contracted over this period. Since 2001, the fall in number of visitors to the Territory from these four countries alone accounted for about 80 per cent of the total decrease in international visitors to the Territory (Chart 7.15).
Chart 7.15: Number of International Visitors to the Territory (moving annual total)
e: estimateSource: TRA, International Visitors in Australia; Department of Treasury and Finance
The relative strength of the Australian dollar over the past decade may have also contributed to the decline in international visitor numbers to the Territory by increasing the costs of travelling to and within Australia and the Territory, compared with other destinations. Chart 7.16 shows that between 2001 and 2013, the trade weighted index of the Australian dollar increased by about 45 per cent while the number of international visitors to the Territory declined by 40 per cent.
Chart 7.16: Number of International Tourist Visitors to the Territory (moving annual total) and the Trade Weighted Index of the Australian Dollar
Source: Reserve Bank of Australia; TRA, International Visitors to Australia
The decline in the number of international visitors to the Territory was not mirrored at the national level with numbers increasing between 2001 and 2013, albeit at a modest rate of growth (estimated 2.3 per cent per annum). This may reflect the different reasons for
0
50
100
150
200
01 02 03 04 05 06 07 08 09 10 11 12 13e
United Kingdom
United StatesJapan
Germany
Number (000)
Calendar year
Other countries
200
250
300
350
400
450
500
40
50
60
70
80
90
100
01 02 03 04 05 06 07 08 09 10 11 12 13
Index: 1970 = 100 Number (000)
Calendar year
Australian dollar (LHS) International tourist visitors (RHS)
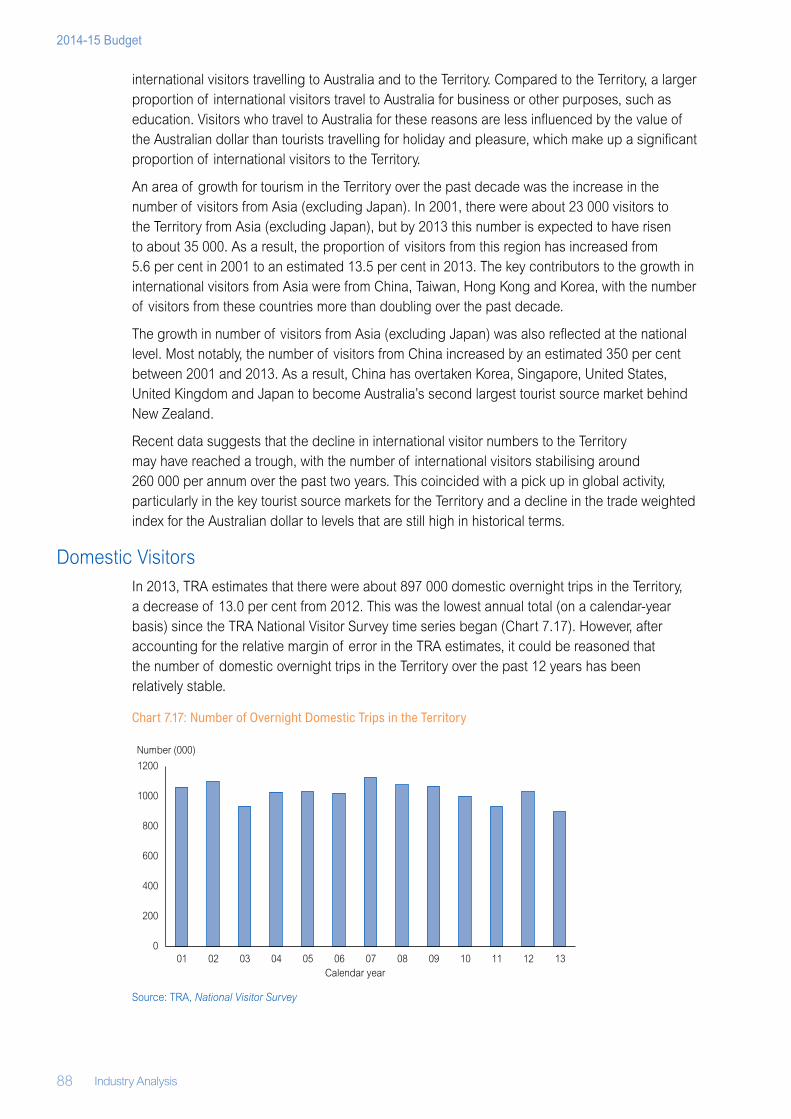
88 Industry Analysis
2014-15 Budget
international visitors travelling to Australia and to the Territory. Compared to the Territory, a larger proportion of international visitors travel to Australia for business or other purposes, such as education. Visitors who travel to Australia for these reasons are less influenced by the value of the Australian dollar than tourists travelling for holiday and pleasure, which make up a significant proportion of international visitors to the Territory.
An area of growth for tourism in the Territory over the past decade was the increase in the number of visitors from Asia (excluding Japan). In 2001, there were about 23 000 visitors to the Territory from Asia (excluding Japan), but by 2013 this number is expected to have risen to about 35 000. As a result, the proportion of visitors from this region has increased from 5.6 per cent in 2001 to an estimated 13.5 per cent in 2013. The key contributors to the growth in international visitors from Asia were from China, Taiwan, Hong Kong and Korea, with the number of visitors from these countries more than doubling over the past decade.
The growth in number of visitors from Asia (excluding Japan) was also reflected at the national level. Most notably, the number of visitors from China increased by an estimated 350 per cent between 2001 and 2013. As a result, China has overtaken Korea, Singapore, United States, United Kingdom and Japan to become Australia’s second largest tourist source market behind New Zealand.
Recent data suggests that the decline in international visitor numbers to the Territory may have reached a trough, with the number of international visitors stabilising around 260 000 per annum over the past two years. This coincided with a pick up in global activity, particularly in the key tourist source markets for the Territory and a decline in the trade weighted index for the Australian dollar to levels that are still high in historical terms.
Domestic Visitors In 2013, TRA estimates that there were about 897 000 domestic overnight trips in the Territory, a decrease of 13.0 per cent from 2012. This was the lowest annual total (on a calendar‑year basis) since the TRA National Visitor Survey time series began (Chart 7.17). However, after accounting for the relative margin of error in the TRA estimates, it could be reasoned that the number of domestic overnight trips in the Territory over the past 12 years has been relatively stable.
Chart 7.17: Number of Overnight Domestic Trips in the Territory
Source: TRA, National Visitor Survey
0
200
400
600
800
1000
1200
01 02 03 04 05 06 07 08 09 10 11 12 13
Number (000)
Calendar year
Industry Analysis 89
Northern Territory Economy
Across the three main purposes for overnight trips to the Territory, the numbers for 2013 are estimated to be well below the ten‑year average. The estimated number of domestic visitors travelling to the Territory in 2013 for:
• holiday or leisure was 401 000, compared to ten‑year average of 470 000;
• business was 316 000, compared to the ten‑year average of 335 000; and
• visiting friends and relatives was 143 000, compared to the ten‑year average of 167 000.
The strength of the Australian dollar is likely to have impacted domestic visitor numbers to the Territory, encouraging Australians to travel overseas rather than locally. However, the impact was lessened by the large proportion of business travellers who are more influenced by economic activity and employment opportunities in the Territory. Although the number of business travellers has declined compared to the ten‑year average, the impact has not been as great as in the holiday and leisure markets.
Tourism InfrastructureThe Territory’s tourism industry relies heavily on aviation due to the remoteness of Darwin and Alice Springs from major metropolitan areas in other jurisdictions and the large distances between the Territory’s major tourist attractions. Over the past year, there have been significant changes to flight routes and frequencies to and from the Territory.
International airline capacity for the Territory has significantly expanded following the entry of Philippine Airlines and the recommencement of flights by Malaysia Airlines to and from Darwin. These airlines join existing international carriers Jetstar, Air Asia, SilkAir and Airnorth operating out of Darwin International Airport.
On the domestic front, Tiger Airways commenced daily flights between Darwin and Brisbane from April 2014 and Jetstar will commence flights between Melbourne and Uluru from June 2014. Qantas has increased domestic seat capacity to Darwin and Jetstar has increased the number of flights between Darwin and Cairns. Combined with Virgin Airlines and Airnorth, interstate domestic airline capacity to and from the Territory is currently at high levels.
The Darwin International Airport is currently undergoing a significant upgrade, including a $42.5 million terminal expansion project. Once the project is complete, the terminal will nearly double in size and feature additional departure lounge areas, improved baggage systems and security screening areas, an expanded check‑in area and upgraded facilities for international travellers. The upgrades to Darwin International Airport are expected to significantly increase passenger handling capacity at the airport.
Despite the positive developments in tourism infrastructure over the past 12 months, Jetstar recently made a decision to change its operations in Darwin. As part of the decision, Jetstar has relocated three A320 aircraft previously based in Darwin to Adelaide, which resulted in a loss of 90 flight attendant and pilot jobs from Darwin. In addition, Jetstar has reduced the overall number of flights operating out of Darwin from 54 to 49, including the suspension of flights from Darwin to Tokyo via Manila from March 2014.
Tourism accommodation capacity can be an important influence on the number of international and domestic visitor numbers to the Territory. Tourism accommodation data covers all hotels, motels, guest houses and service apartments with 15 or more rooms available to the public.
The ABS reports that the average occupancy rate for Territory tourist accommodation was about 65 per cent in 2012‑13. In Darwin, the average occupancy rate for tourist accommodation
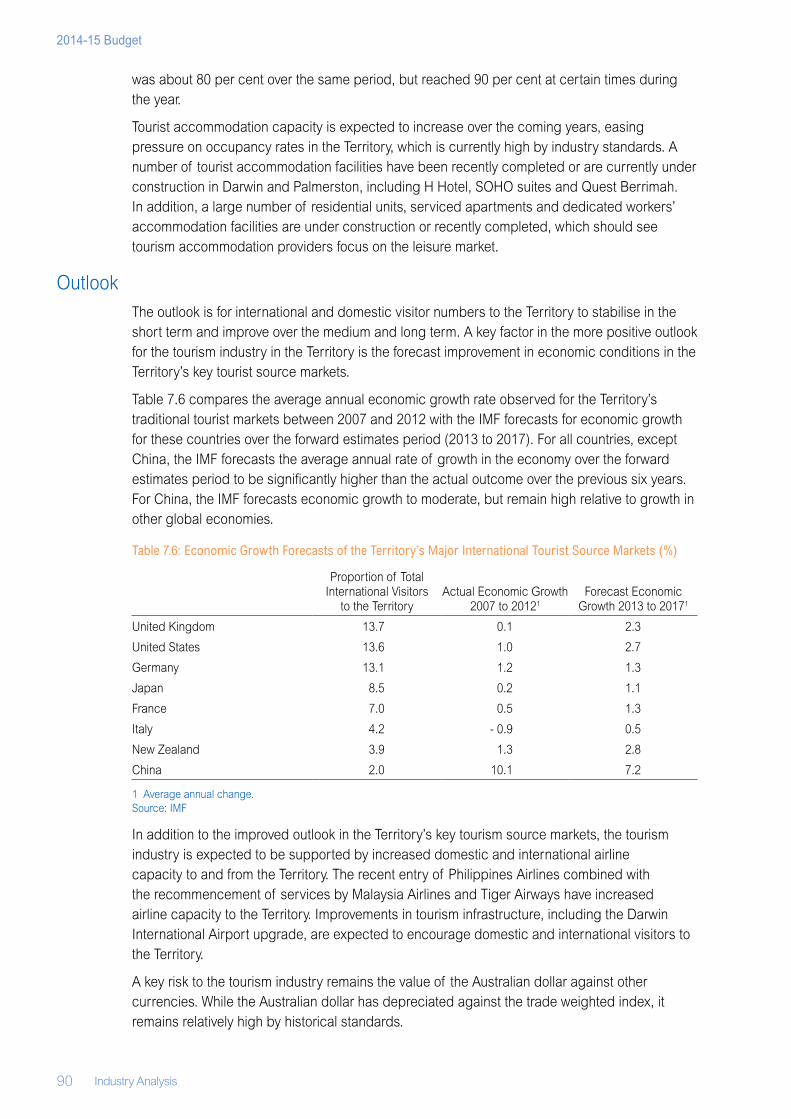
90 Industry Analysis
2014-15 Budget
was about 80 per cent over the same period, but reached 90 per cent at certain times during the year.
Tourist accommodation capacity is expected to increase over the coming years, easing pressure on occupancy rates in the Territory, which is currently high by industry standards. A number of tourist accommodation facilities have been recently completed or are currently under construction in Darwin and Palmerston, including H Hotel, SOHO suites and Quest Berrimah. In addition, a large number of residential units, serviced apartments and dedicated workers’ accommodation facilities are under construction or recently completed, which should see tourism accommodation providers focus on the leisure market.
OutlookThe outlook is for international and domestic visitor numbers to the Territory to stabilise in the short term and improve over the medium and long term. A key factor in the more positive outlook for the tourism industry in the Territory is the forecast improvement in economic conditions in the Territory’s key tourist source markets.
Table 7.6 compares the average annual economic growth rate observed for the Territory’s traditional tourist markets between 2007 and 2012 with the IMF forecasts for economic growth for these countries over the forward estimates period (2013 to 2017). For all countries, except China, the IMF forecasts the average annual rate of growth in the economy over the forward estimates period to be significantly higher than the actual outcome over the previous six years. For China, the IMF forecasts economic growth to moderate, but remain high relative to growth in other global economies.
Table 7.6: Economic Growth Forecasts of the Territory’s Major International Tourist Source Markets (%)
Proportion of Total International Visitors
to the TerritoryActual Economic Growth
2007 to 20121 Forecast Economic
Growth 2013 to 20171
United Kingdom 13.7 0.1 2.3
United States 13.6 1.0 2.7
Germany 13.1 1.2 1.3
Japan 8.5 0.2 1.1
France 7.0 0.5 1.3
Italy 4.2 ‑ 0.9 0.5
New Zealand 3.9 1.3 2.8
China 2.0 10.1 7.2
1 Average annual change.Source: IMF
In addition to the improved outlook in the Territory’s key tourism source markets, the tourism industry is expected to be supported by increased domestic and international airline capacity to and from the Territory. The recent entry of Philippines Airlines combined with the recommencement of services by Malaysia Airlines and Tiger Airways have increased airline capacity to the Territory. Improvements in tourism infrastructure, including the Darwin International Airport upgrade, are expected to encourage domestic and international visitors to the Territory.
A key risk to the tourism industry remains the value of the Australian dollar against other currencies. While the Australian dollar has depreciated against the trade weighted index, it remains relatively high by historical standards.
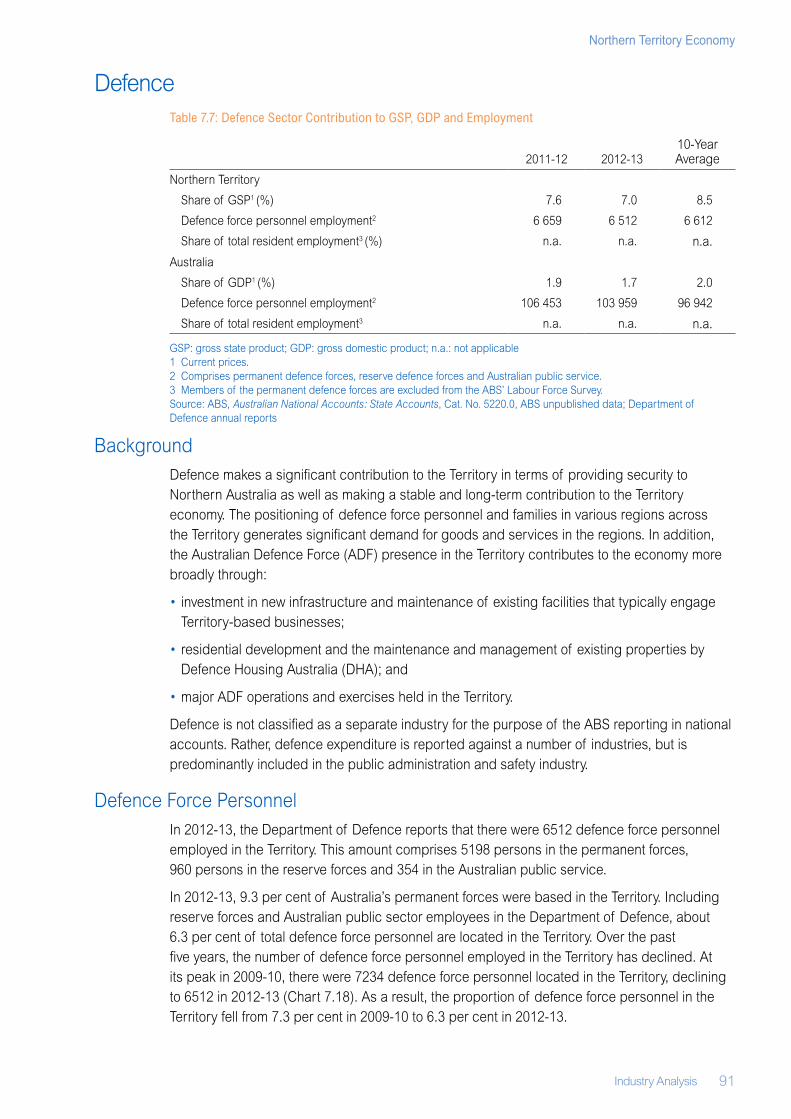
Industry Analysis 91
Northern Territory Economy
DefenceTable 7.7: Defence Sector Contribution to GSP, GDP and Employment
2011‑12 2012‑1310‑Year Average
Northern Territory
Share of GSP1 (%) 7.6 7.0 8.5
Defence force personnel employment2 6 659 6 512 6 612
Share of total resident employment3 (%) n.a. n.a. n.a.
Australia
Share of GDP1 (%) 1.9 1.7 2.0
Defence force personnel employment2 106 453 103 959 96 942
Share of total resident employment3 n.a. n.a. n.a.
GSP: gross state product; GDP: gross domestic product; n.a.: not applicable1 Current prices. 2 Comprises permanent defence forces, reserve defence forces and Australian public service.3 Members of the permanent defence forces are excluded from the ABS’ Labour Force Survey. Source: ABS, Australian National Accounts: State Accounts, Cat. No. 5220.0, ABS unpublished data; Department of Defence annual reports
BackgroundDefence makes a significant contribution to the Territory in terms of providing security to Northern Australia as well as making a stable and long‑term contribution to the Territory economy. The positioning of defence force personnel and families in various regions across the Territory generates significant demand for goods and services in the regions. In addition, the Australian Defence Force (ADF) presence in the Territory contributes to the economy more broadly through:
• investment in new infrastructure and maintenance of existing facilities that typically engage Territory‑based businesses;
• residential development and the maintenance and management of existing properties by Defence Housing Australia (DHA); and
• major ADF operations and exercises held in the Territory.
Defence is not classified as a separate industry for the purpose of the ABS reporting in national accounts. Rather, defence expenditure is reported against a number of industries, but is predominantly included in the public administration and safety industry.
Defence Force PersonnelIn 2012‑13, the Department of Defence reports that there were 6512 defence force personnel employed in the Territory. This amount comprises 5198 persons in the permanent forces, 960 persons in the reserve forces and 354 in the Australian public service.
In 2012‑13, 9.3 per cent of Australia’s permanent forces were based in the Territory. Including reserve forces and Australian public sector employees in the Department of Defence, about 6.3 per cent of total defence force personnel are located in the Territory. Over the past five years, the number of defence force personnel employed in the Territory has declined. At its peak in 2009‑10, there were 7234 defence force personnel located in the Territory, declining to 6512 in 2012‑13 (Chart 7.18). As a result, the proportion of defence force personnel in the Territory fell from 7.3 per cent in 2009‑10 to 6.3 per cent in 2012‑13.
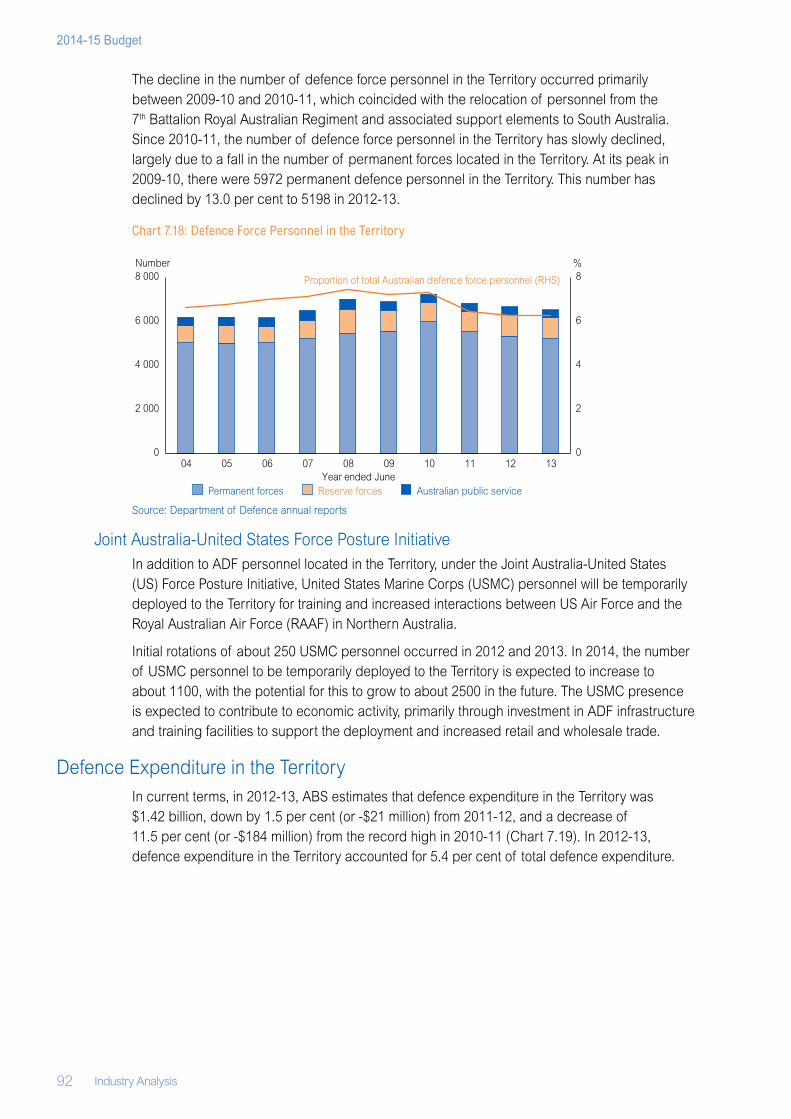
92 Industry Analysis
2014-15 Budget
The decline in the number of defence force personnel in the Territory occurred primarily between 2009‑10 and 2010‑11, which coincided with the relocation of personnel from the 7th Battalion Royal Australian Regiment and associated support elements to South Australia. Since 2010‑11, the number of defence force personnel in the Territory has slowly declined, largely due to a fall in the number of permanent forces located in the Territory. At its peak in 2009‑10, there were 5972 permanent defence personnel in the Territory. This number has declined by 13.0 per cent to 5198 in 2012‑13.
Chart 7.18: Defence Force Personnel in the Territory
Source: Department of Defence annual reports
Joint Australia‑United States Force Posture InitiativeIn addition to ADF personnel located in the Territory, under the Joint Australia‑United States (US) Force Posture Initiative, United States Marine Corps (USMC) personnel will be temporarily deployed to the Territory for training and increased interactions between US Air Force and the Royal Australian Air Force (RAAF) in Northern Australia.
Initial rotations of about 250 USMC personnel occurred in 2012 and 2013. In 2014, the number of USMC personnel to be temporarily deployed to the Territory is expected to increase to about 1100, with the potential for this to grow to about 2500 in the future. The USMC presence is expected to contribute to economic activity, primarily through investment in ADF infrastructure and training facilities to support the deployment and increased retail and wholesale trade.
Defence Expenditure in the Territory In current terms, in 2012‑13, ABS estimates that defence expenditure in the Territory was $1.42 billion, down by 1.5 per cent (or ‑$21 million) from 2011‑12, and a decrease of 11.5 per cent (or ‑$184 million) from the record high in 2010‑11 (Chart 7.19). In 2012‑13, defence expenditure in the Territory accounted for 5.4 per cent of total defence expenditure.
0
2
4
6
8
0
2 000
4 000
6 000
8 000
04 05 06 07 08 09 10 11 12 13
Permanent forces Reserve forces Australian public service
Number %
Proportion of total Australian defence force personnel (RHS)
Year ended June
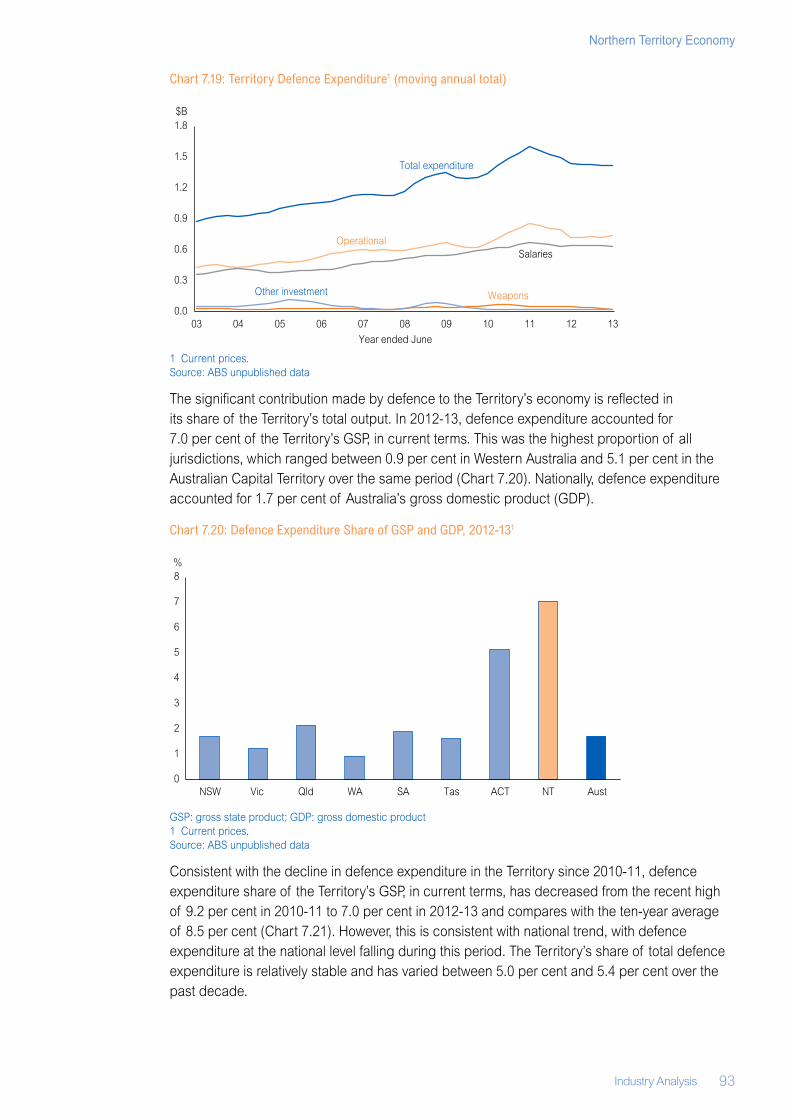
Industry Analysis 93
Northern Territory Economy
Chart 7.19: Territory Defence Expenditure1 (moving annual total)
1 Current prices.Source: ABS unpublished data
The significant contribution made by defence to the Territory’s economy is reflected in its share of the Territory’s total output. In 2012‑13, defence expenditure accounted for 7.0 per cent of the Territory’s GSP, in current terms. This was the highest proportion of all jurisdictions, which ranged between 0.9 per cent in Western Australia and 5.1 per cent in the Australian Capital Territory over the same period (Chart 7.20). Nationally, defence expenditure accounted for 1.7 per cent of Australia’s gross domestic product (GDP).
Chart 7.20: Defence Expenditure Share of GSP and GDP, 2012‑131
GSP: gross state product; GDP: gross domestic product1 Current prices.Source: ABS unpublished data
Consistent with the decline in defence expenditure in the Territory since 2010‑11, defence expenditure share of the Territory’s GSP, in current terms, has decreased from the recent high of 9.2 per cent in 2010‑11 to 7.0 per cent in 2012‑13 and compares with the ten‑year average of 8.5 per cent (Chart 7.21). However, this is consistent with national trend, with defence expenditure at the national level falling during this period. The Territory’s share of total defence expenditure is relatively stable and has varied between 5.0 per cent and 5.4 per cent over the past decade.
0.0
0.3
0.6
0.9
1.2
1.5
1.8
03 04 05 06 07 08 09 10 11 12 13
Total expenditure
OperationalSalaries
Other investment Weapons
$B
Year ended June
0
1
2
3
4
5
6
7
8
NSW Vic Qld WA SA Tas ACT NT Aust
%
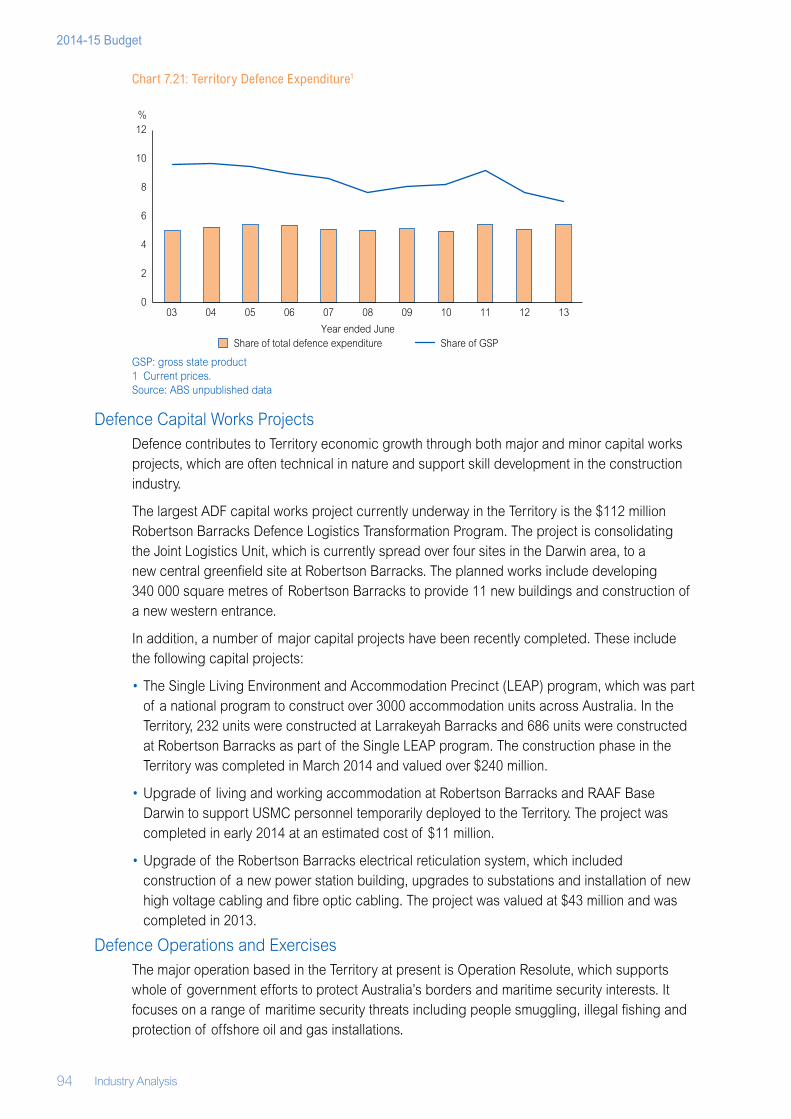
94 Industry Analysis
2014-15 Budget
Chart 7.21: Territory Defence Expenditure1
GSP: gross state product1 Current prices.Source: ABS unpublished data
Defence Capital Works ProjectsDefence contributes to Territory economic growth through both major and minor capital works projects, which are often technical in nature and support skill development in the construction industry.
The largest ADF capital works project currently underway in the Territory is the $112 million Robertson Barracks Defence Logistics Transformation Program. The project is consolidating the Joint Logistics Unit, which is currently spread over four sites in the Darwin area, to a new central greenfield site at Robertson Barracks. The planned works include developing 340 000 square metres of Robertson Barracks to provide 11 new buildings and construction of a new western entrance.
In addition, a number of major capital projects have been recently completed. These include the following capital projects:
• The Single Living Environment and Accommodation Precinct (LEAP) program, which was part of a national program to construct over 3000 accommodation units across Australia. In the Territory, 232 units were constructed at Larrakeyah Barracks and 686 units were constructed at Robertson Barracks as part of the Single LEAP program. The construction phase in the Territory was completed in March 2014 and valued over $240 million.
• Upgrade of living and working accommodation at Robertson Barracks and RAAF Base Darwin to support USMC personnel temporarily deployed to the Territory. The project was completed in early 2014 at an estimated cost of $11 million.
• Upgrade of the Robertson Barracks electrical reticulation system, which included construction of a new power station building, upgrades to substations and installation of new high voltage cabling and fibre optic cabling. The project was valued at $43 million and was completed in 2013.
Defence Operations and ExercisesThe major operation based in the Territory at present is Operation Resolute, which supports whole of government efforts to protect Australia’s borders and maritime security interests. It focuses on a range of maritime security threats including people smuggling, illegal fishing and protection of offshore oil and gas installations.
0
2
4
6
8
10
12
03 04 05 06 07 08 09 10 11 12 13
Share of total defence expenditure Share of GSP
%
Year ended June
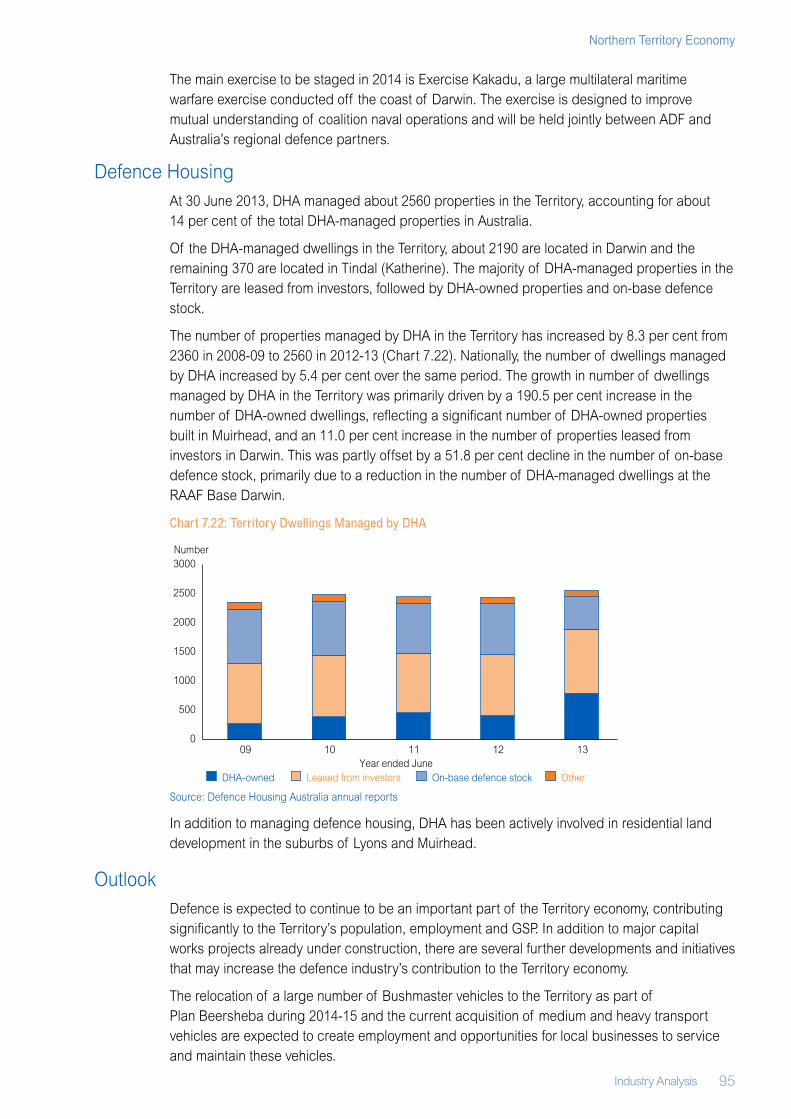
Industry Analysis 95
Northern Territory Economy
The main exercise to be staged in 2014 is Exercise Kakadu, a large multilateral maritime warfare exercise conducted off the coast of Darwin. The exercise is designed to improve mutual understanding of coalition naval operations and will be held jointly between ADF and Australia’s regional defence partners.
Defence Housing At 30 June 2013, DHA managed about 2560 properties in the Territory, accounting for about 14 per cent of the total DHA‑managed properties in Australia.
Of the DHA‑managed dwellings in the Territory, about 2190 are located in Darwin and the remaining 370 are located in Tindal (Katherine). The majority of DHA‑managed properties in the Territory are leased from investors, followed by DHA‑owned properties and on‑base defence stock.
The number of properties managed by DHA in the Territory has increased by 8.3 per cent from 2360 in 2008‑09 to 2560 in 2012‑13 (Chart 7.22). Nationally, the number of dwellings managed by DHA increased by 5.4 per cent over the same period. The growth in number of dwellings managed by DHA in the Territory was primarily driven by a 190.5 per cent increase in the number of DHA‑owned dwellings, reflecting a significant number of DHA‑owned properties built in Muirhead, and an 11.0 per cent increase in the number of properties leased from investors in Darwin. This was partly offset by a 51.8 per cent decline in the number of on‑base defence stock, primarily due to a reduction in the number of DHA‑managed dwellings at the RAAF Base Darwin.
Chart 7.22: Territory Dwellings Managed by DHA
Source: Defence Housing Australia annual reports
In addition to managing defence housing, DHA has been actively involved in residential land development in the suburbs of Lyons and Muirhead.
OutlookDefence is expected to continue to be an important part of the Territory economy, contributing significantly to the Territory’s population, employment and GSP. In addition to major capital works projects already under construction, there are several further developments and initiatives that may increase the defence industry’s contribution to the Territory economy.
The relocation of a large number of Bushmaster vehicles to the Territory as part of Plan Beersheba during 2014‑15 and the current acquisition of medium and heavy transport vehicles are expected to create employment and opportunities for local businesses to service and maintain these vehicles.
0
500
1000
1500
2000
2500
3000
09 10 11 12 13
DHA-owned Leased from investors On-base defence stock Other
Number
Year ended June

96 Industry Analysis
2014-15 Budget
The planned acquisition of the new Join Strike Fighter and new surveillance aircraft is likely to provide the opportunity for infrastructure upgrades and associated works at the RAAF Base Tindal and RAAF Base Darwin, out of which these aircraft will operate.
Following the successful development of Lyons and the first stages of Muirhead, DHA is expected to continue with residential development of defence‑owned land in the Lee Point area. In February 2014, DHA announced plans for future housing development to the north of Lyons, which is expected to commence in 2017 and deliver 400 homes.
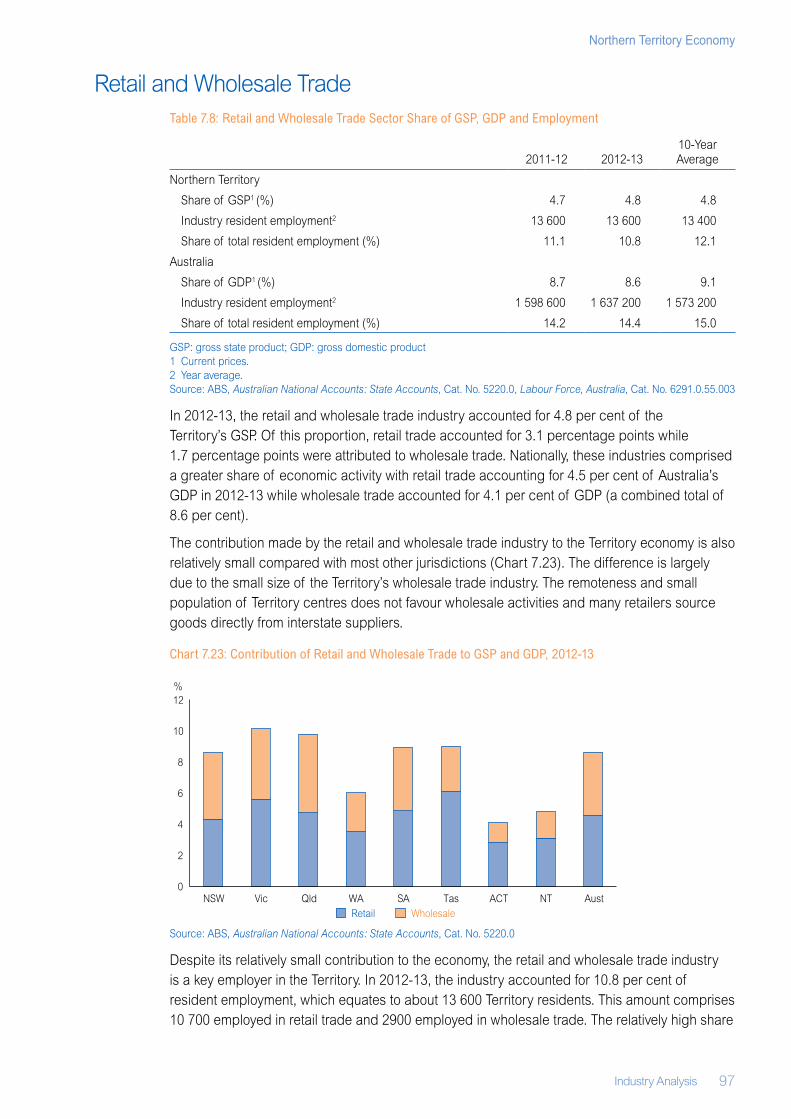
Industry Analysis 97
Northern Territory Economy
Retail and Wholesale TradeTable 7.8: Retail and Wholesale Trade Sector Share of GSP, GDP and Employment
2011‑12 2012‑1310‑Year Average
Northern Territory
Share of GSP1 (%) 4.7 4.8 4.8
Industry resident employment2 13 600 13 600 13 400
Share of total resident employment (%) 11.1 10.8 12.1
Australia
Share of GDP1 (%) 8.7 8.6 9.1
Industry resident employment2 1 598 600 1 637 200 1 573 200
Share of total resident employment (%) 14.2 14.4 15.0
GSP: gross state product; GDP: gross domestic product1 Current prices.2 Year average.Source: ABS, Australian National Accounts: State Accounts, Cat. No. 5220.0, Labour Force, Australia, Cat. No. 6291.0.55.003
In 2012‑13, the retail and wholesale trade industry accounted for 4.8 per cent of the Territory’s GSP. Of this proportion, retail trade accounted for 3.1 percentage points while 1.7 percentage points were attributed to wholesale trade. Nationally, these industries comprised a greater share of economic activity with retail trade accounting for 4.5 per cent of Australia’s GDP in 2012‑13 while wholesale trade accounted for 4.1 per cent of GDP (a combined total of 8.6 per cent).
The contribution made by the retail and wholesale trade industry to the Territory economy is also relatively small compared with most other jurisdictions (Chart 7.23). The difference is largely due to the small size of the Territory’s wholesale trade industry. The remoteness and small population of Territory centres does not favour wholesale activities and many retailers source goods directly from interstate suppliers.
Chart 7.23: Contribution of Retail and Wholesale Trade to GSP and GDP, 2012‑13
Source: ABS, Australian National Accounts: State Accounts, Cat. No. 5220.0
Despite its relatively small contribution to the economy, the retail and wholesale trade industry is a key employer in the Territory. In 2012‑13, the industry accounted for 10.8 per cent of resident employment, which equates to about 13 600 Territory residents. This amount comprises 10 700 employed in retail trade and 2900 employed in wholesale trade. The relatively high share
0
2
4
6
8
10
12
NSW Vic Qld WA SA Tas ACT NT AustRetail Wholesale
%
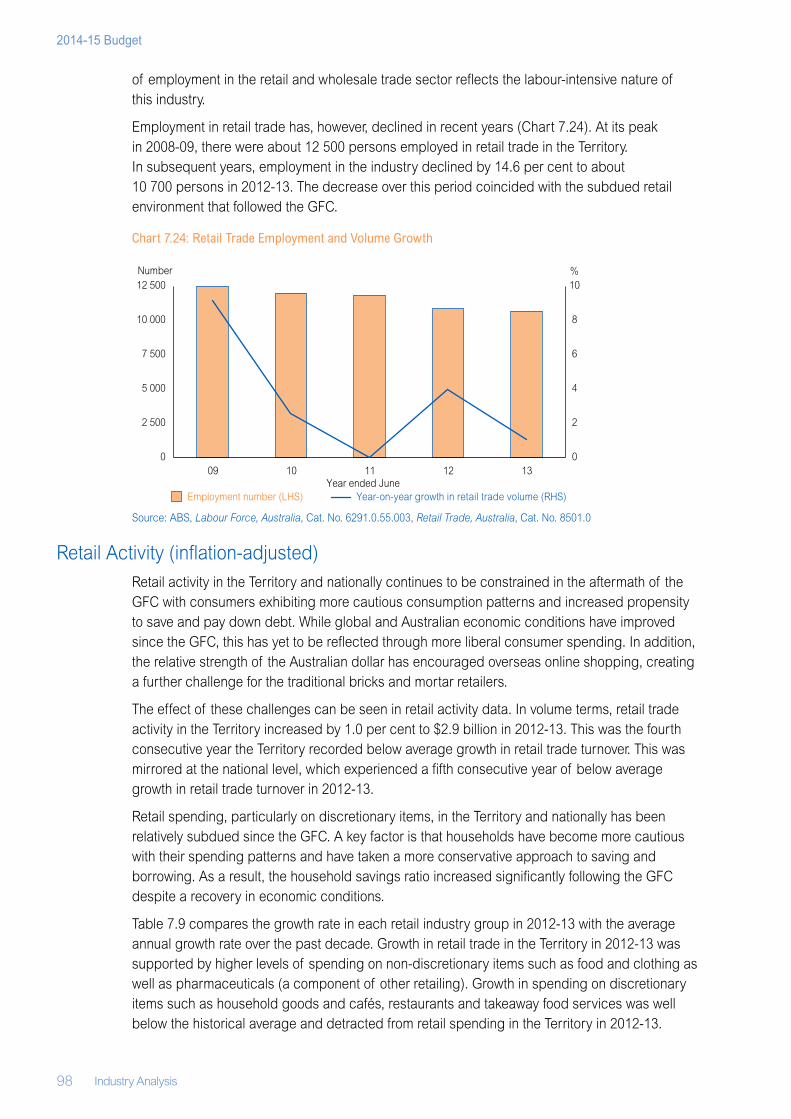
98 Industry Analysis
2014-15 Budget
of employment in the retail and wholesale trade sector reflects the labour‑intensive nature of this industry.
Employment in retail trade has, however, declined in recent years (Chart 7.24). At its peak in 2008‑09, there were about 12 500 persons employed in retail trade in the Territory. In subsequent years, employment in the industry declined by 14.6 per cent to about 10 700 persons in 2012‑13. The decrease over this period coincided with the subdued retail environment that followed the GFC.
Chart 7.24: Retail Trade Employment and Volume Growth
Source: ABS, Labour Force, Australia, Cat. No. 6291.0.55.003, Retail Trade, Australia, Cat. No. 8501.0
Retail Activity (inflation‑adjusted)Retail activity in the Territory and nationally continues to be constrained in the aftermath of the GFC with consumers exhibiting more cautious consumption patterns and increased propensity to save and pay down debt. While global and Australian economic conditions have improved since the GFC, this has yet to be reflected through more liberal consumer spending. In addition, the relative strength of the Australian dollar has encouraged overseas online shopping, creating a further challenge for the traditional bricks and mortar retailers.
The effect of these challenges can be seen in retail activity data. In volume terms, retail trade activity in the Territory increased by 1.0 per cent to $2.9 billion in 2012‑13. This was the fourth consecutive year the Territory recorded below average growth in retail trade turnover. This was mirrored at the national level, which experienced a fifth consecutive year of below average growth in retail trade turnover in 2012‑13.
Retail spending, particularly on discretionary items, in the Territory and nationally has been relatively subdued since the GFC. A key factor is that households have become more cautious with their spending patterns and have taken a more conservative approach to saving and borrowing. As a result, the household savings ratio increased significantly following the GFC despite a recovery in economic conditions.
Table 7.9 compares the growth rate in each retail industry group in 2012‑13 with the average annual growth rate over the past decade. Growth in retail trade in the Territory in 2012‑13 was supported by higher levels of spending on non‑discretionary items such as food and clothing as well as pharmaceuticals (a component of other retailing). Growth in spending on discretionary items such as household goods and cafés, restaurants and takeaway food services was well below the historical average and detracted from retail spending in the Territory in 2012‑13.
0
2
4
6
8
10
0
2 500
5 000
7 500
10 000
12 500
09 10 11 12 13
Employment number (LHS) Year-on-year growth in retail trade volume (RHS)
Number %
Year ended June
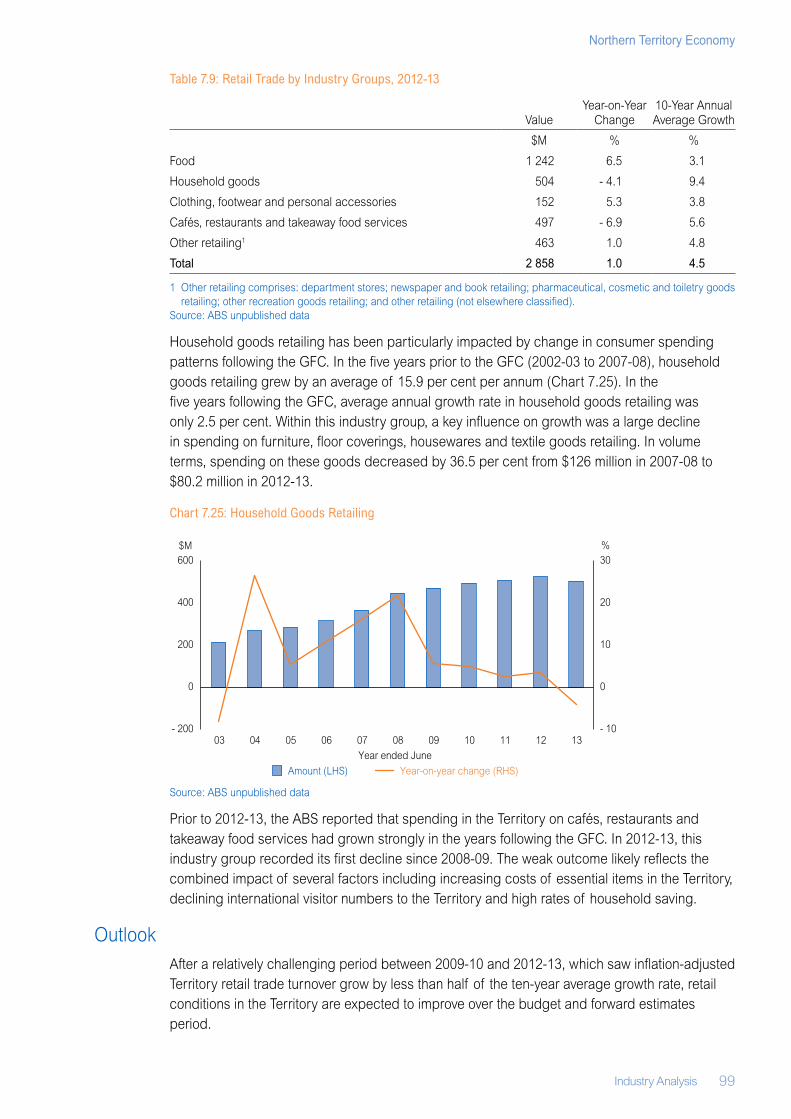
Industry Analysis 99
Northern Territory Economy
Table 7.9: Retail Trade by Industry Groups, 2012‑13
ValueYear‑on‑Year
Change10‑Year Annual Average Growth
$M % %
Food 1 242 6.5 3.1
Household goods 504 ‑ 4.1 9.4
Clothing, footwear and personal accessories 152 5.3 3.8
Cafés, restaurants and takeaway food services 497 ‑ 6.9 5.6
Other retailing1 463 1.0 4.8
Total 2 858 1.0 4.5
1 Other retailing comprises: department stores; newspaper and book retailing; pharmaceutical, cosmetic and toiletry goods retailing; other recreation goods retailing; and other retailing (not elsewhere classified).
Source: ABS unpublished data
Household goods retailing has been particularly impacted by change in consumer spending patterns following the GFC. In the five years prior to the GFC (2002‑03 to 2007‑08), household goods retailing grew by an average of 15.9 per cent per annum (Chart 7.25). In the five years following the GFC, average annual growth rate in household goods retailing was only 2.5 per cent. Within this industry group, a key influence on growth was a large decline in spending on furniture, floor coverings, housewares and textile goods retailing. In volume terms, spending on these goods decreased by 36.5 per cent from $126 million in 2007‑08 to $80.2 million in 2012‑13.
Chart 7.25: Household Goods Retailing
Source: ABS unpublished data
Prior to 2012‑13, the ABS reported that spending in the Territory on cafés, restaurants and takeaway food services had grown strongly in the years following the GFC. In 2012‑13, this industry group recorded its first decline since 2008‑09. The weak outcome likely reflects the combined impact of several factors including increasing costs of essential items in the Territory, declining international visitor numbers to the Territory and high rates of household saving.
OutlookAfter a relatively challenging period between 2009‑10 and 2012‑13, which saw inflation‑adjusted Territory retail trade turnover grow by less than half of the ten‑year average growth rate, retail conditions in the Territory are expected to improve over the budget and forward estimates period.
- 10
0
10
20
30
- 200
0
200
400
600
03 04 05 06 07 08 09 10 11 12 13
Amount (LHS) Year-on-year change (RHS)
$M %
Year ended June
100 Industry Analysis
2014-15 Budget
The positive outlook for retail growth is supported by generally favourable macro‑economic conditions including historically low interest rates and solid population and employment growth forecasts for the Territory. Wages growth in the Territory is expected to strengthen over the budget and forward estimates period, which should support an increase in consumer sentiment and household spending.
Construction activity is forecast to remain at elevated levels over the next three years, which is expected to support growth in retail trade. In particular, the high number of new dwelling completions expected in 2013‑14 and 2014‑15 should support growth in categories such as household goods, furniture and outdoor equipment as these new dwellings are furnished and fitted out.
In addition to a favourable economic environment, a number of new developments are expected to add to Territory retail trade turnover and employment opportunities. Major developments expected to have a positive impact on the retail trade sector over the next few years include works at the Casuarina Square shopping centre, the ongoing development of retail outlets at the new Coolalinga subdivision and the potential development of a new large‑scale shopping centre in Palmerston.
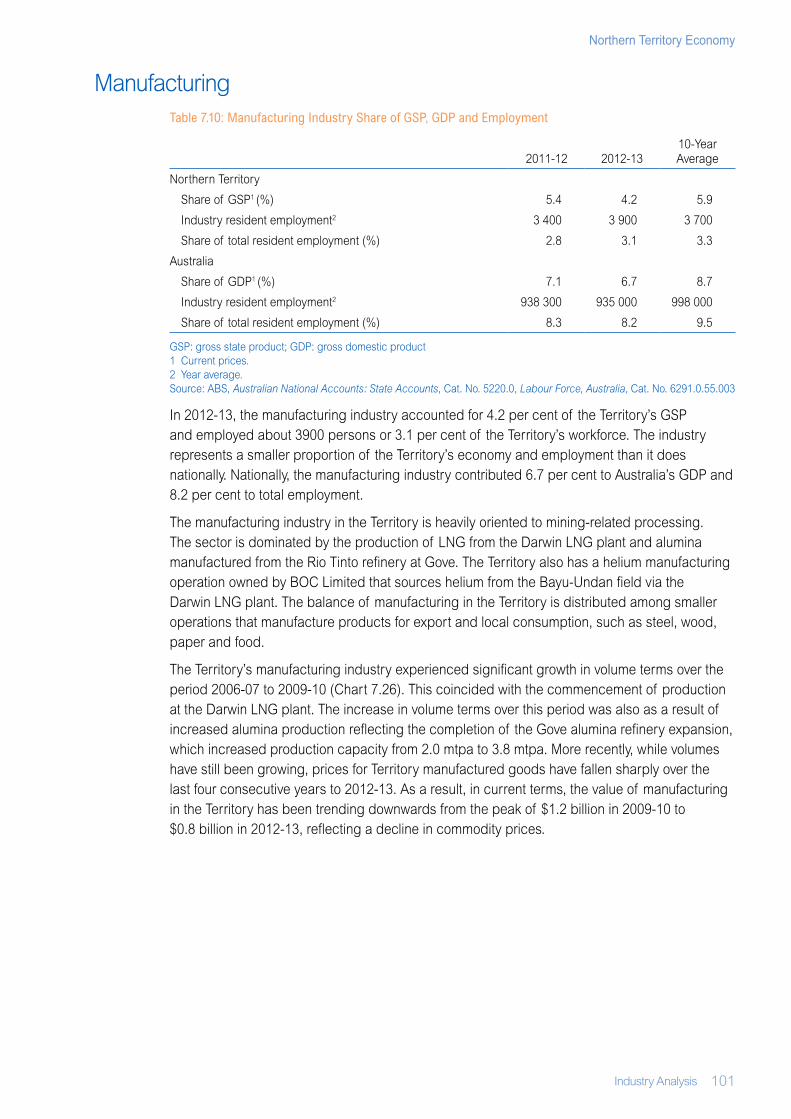
Industry Analysis 101
Northern Territory Economy
ManufacturingTable 7.10: Manufacturing Industry Share of GSP, GDP and Employment
2011‑12 2012‑1310‑Year Average
Northern Territory
Share of GSP1 (%) 5.4 4.2 5.9
Industry resident employment2 3 400 3 900 3 700
Share of total resident employment (%) 2.8 3.1 3.3
Australia
Share of GDP1 (%) 7.1 6.7 8.7
Industry resident employment2 938 300 935 000 998 000
Share of total resident employment (%) 8.3 8.2 9.5
GSP: gross state product; GDP: gross domestic product1 Current prices. 2 Year average. Source: ABS, Australian National Accounts: State Accounts, Cat. No. 5220.0, Labour Force, Australia, Cat. No. 6291.0.55.003
In 2012‑13, the manufacturing industry accounted for 4.2 per cent of the Territory’s GSP and employed about 3900 persons or 3.1 per cent of the Territory’s workforce. The industry represents a smaller proportion of the Territory’s economy and employment than it does nationally. Nationally, the manufacturing industry contributed 6.7 per cent to Australia’s GDP and 8.2 per cent to total employment.
The manufacturing industry in the Territory is heavily oriented to mining‑related processing. The sector is dominated by the production of LNG from the Darwin LNG plant and alumina manufactured from the Rio Tinto refinery at Gove. The Territory also has a helium manufacturing operation owned by BOC Limited that sources helium from the Bayu‑Undan field via the Darwin LNG plant. The balance of manufacturing in the Territory is distributed among smaller operations that manufacture products for export and local consumption, such as steel, wood, paper and food.
The Territory’s manufacturing industry experienced significant growth in volume terms over the period 2006‑07 to 2009‑10 (Chart 7.26). This coincided with the commencement of production at the Darwin LNG plant. The increase in volume terms over this period was also as a result of increased alumina production reflecting the completion of the Gove alumina refinery expansion, which increased production capacity from 2.0 mtpa to 3.8 mtpa. More recently, while volumes have still been growing, prices for Territory manufactured goods have fallen sharply over the last four consecutive years to 2012‑13. As a result, in current terms, the value of manufacturing in the Territory has been trending downwards from the peak of $1.2 billion in 2009‑10 to $0.8 billion in 2012‑13, reflecting a decline in commodity prices.
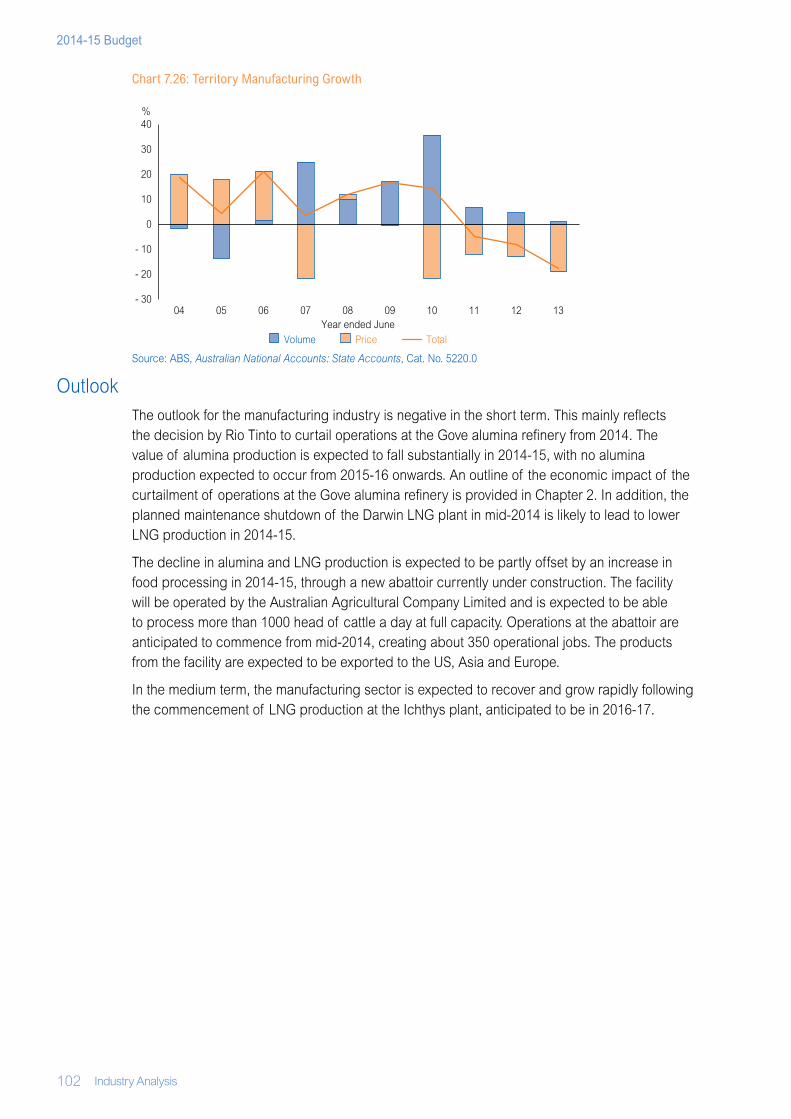
102 Industry Analysis
2014-15 Budget
Chart 7.26: Territory Manufacturing Growth
Source: ABS, Australian National Accounts: State Accounts, Cat. No. 5220.0
Outlook The outlook for the manufacturing industry is negative in the short term. This mainly reflects the decision by Rio Tinto to curtail operations at the Gove alumina refinery from 2014. The value of alumina production is expected to fall substantially in 2014‑15, with no alumina production expected to occur from 2015‑16 onwards. An outline of the economic impact of the curtailment of operations at the Gove alumina refinery is provided in Chapter 2. In addition, the planned maintenance shutdown of the Darwin LNG plant in mid‑2014 is likely to lead to lower LNG production in 2014‑15.
The decline in alumina and LNG production is expected to be partly offset by an increase in food processing in 2014‑15, through a new abattoir currently under construction. The facility will be operated by the Australian Agricultural Company Limited and is expected to be able to process more than 1000 head of cattle a day at full capacity. Operations at the abattoir are anticipated to commence from mid‑2014, creating about 350 operational jobs. The products from the facility are expected to be exported to the US, Asia and Europe.
In the medium term, the manufacturing sector is expected to recover and grow rapidly following the commencement of LNG production at the Ichthys plant, anticipated to be in 2016‑17.
- 30
- 20
- 10
0
10
20
30
40
04 05 06 07 08 09 10 11 12 13
Volume Price Total
Year ended June
%
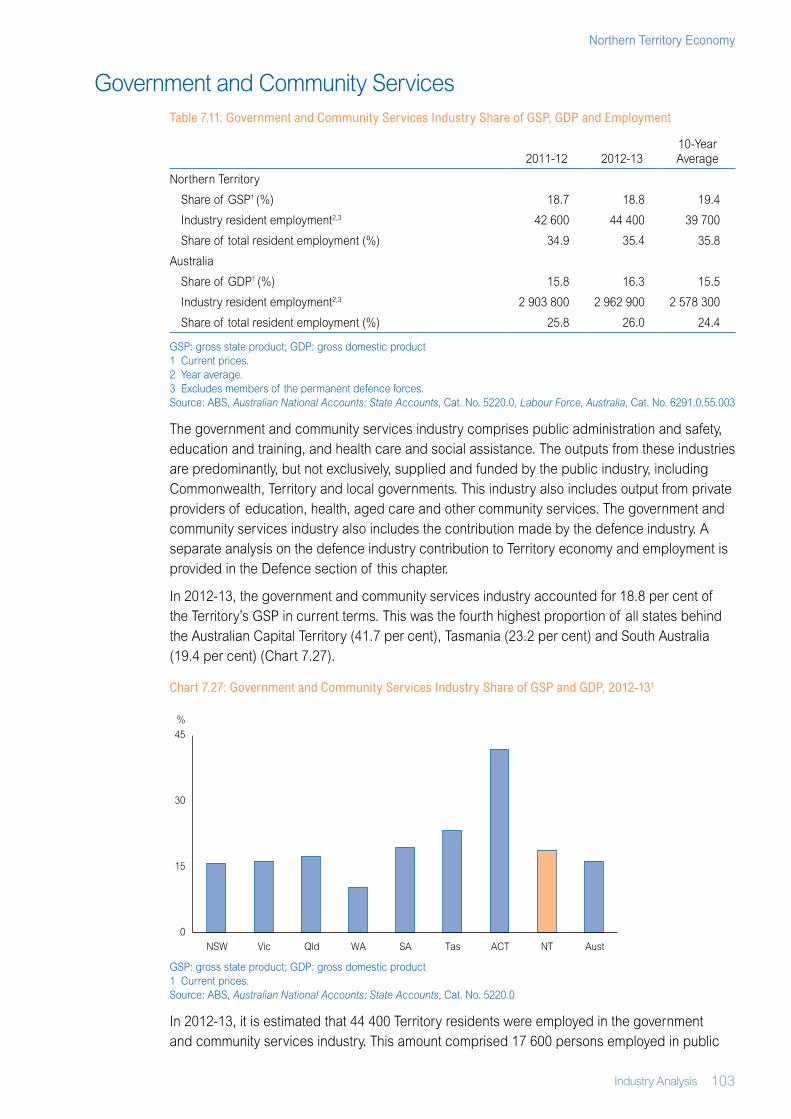
Industry Analysis 103
Northern Territory Economy
Government and Community ServicesTable 7.11: Government and Community Services Industry Share of GSP, GDP and Employment
2011‑12 2012‑1310‑Year Average
Northern Territory
Share of GSP1 (%) 18.7 18.8 19.4
Industry resident employment2,3 42 600 44 400 39 700
Share of total resident employment (%) 34.9 35.4 35.8
Australia
Share of GDP1 (%) 15.8 16.3 15.5
Industry resident employment2,3 2 903 800 2 962 900 2 578 300
Share of total resident employment (%) 25.8 26.0 24.4
GSP: gross state product; GDP: gross domestic product1 Current prices. 2 Year average.3 Excludes members of the permanent defence forces. Source: ABS, Australian National Accounts: State Accounts, Cat. No. 5220.0, Labour Force, Australia, Cat. No. 6291.0.55.003
The government and community services industry comprises public administration and safety, education and training, and health care and social assistance. The outputs from these industries are predominantly, but not exclusively, supplied and funded by the public industry, including Commonwealth, Territory and local governments. This industry also includes output from private providers of education, health, aged care and other community services. The government and community services industry also includes the contribution made by the defence industry. A separate analysis on the defence industry contribution to Territory economy and employment is provided in the Defence section of this chapter.
In 2012‑13, the government and community services industry accounted for 18.8 per cent of the Territory’s GSP in current terms. This was the fourth highest proportion of all states behind the Australian Capital Territory (41.7 per cent), Tasmania (23.2 per cent) and South Australia (19.4 per cent) (Chart 7.27).
Chart 7.27: Government and Community Services Industry Share of GSP and GDP, 2012‑131
GSP: gross state product; GDP: gross domestic product1 Current prices.Source: ABS, Australian National Accounts: State Accounts, Cat. No. 5220.0
In 2012‑13, it is estimated that 44 400 Territory residents were employed in the government and community services industry. This amount comprised 17 600 persons employed in public
0
15
30
45
NSW Vic Qld WA SA Tas ACT NT Aust
%
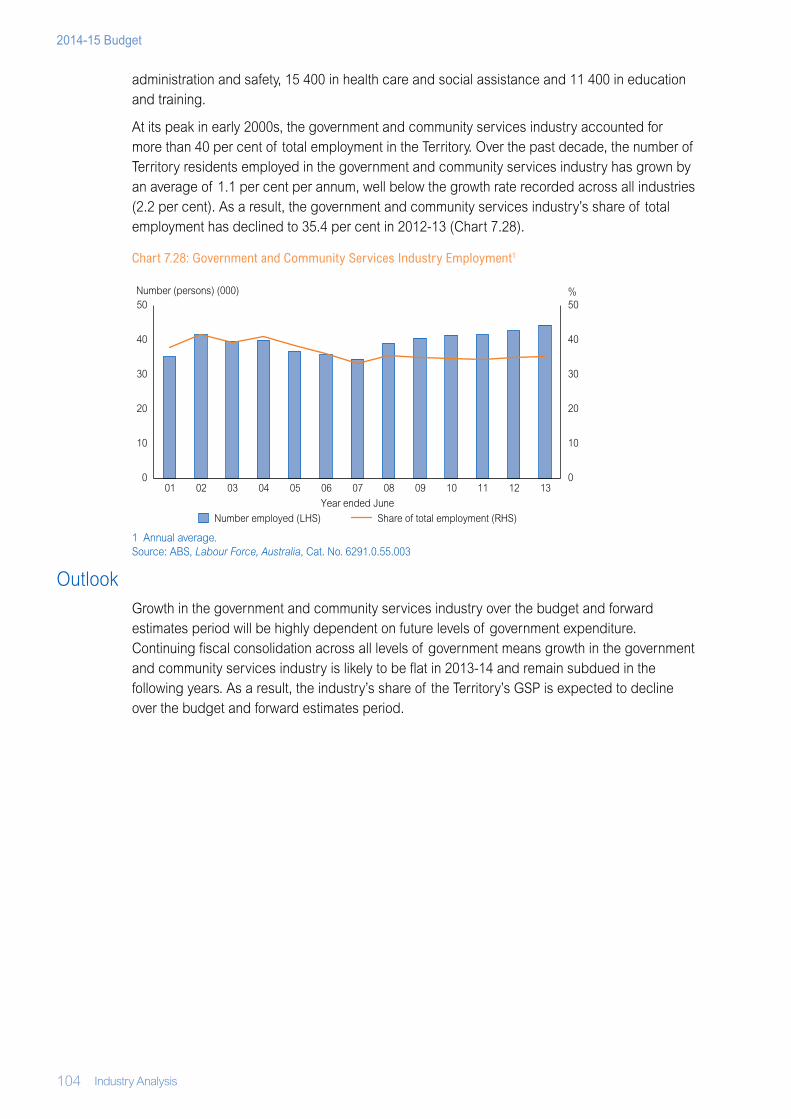
104 Industry Analysis
2014-15 Budget
administration and safety, 15 400 in health care and social assistance and 11 400 in education and training.
At its peak in early 2000s, the government and community services industry accounted for more than 40 per cent of total employment in the Territory. Over the past decade, the number of Territory residents employed in the government and community services industry has grown by an average of 1.1 per cent per annum, well below the growth rate recorded across all industries (2.2 per cent). As a result, the government and community services industry’s share of total employment has declined to 35.4 per cent in 2012‑13 (Chart 7.28).
Chart 7.28: Government and Community Services Industry Employment1
1 Annual average.Source: ABS, Labour Force, Australia, Cat. No. 6291.0.55.003
OutlookGrowth in the government and community services industry over the budget and forward estimates period will be highly dependent on future levels of government expenditure. Continuing fiscal consolidation across all levels of government means growth in the government and community services industry is likely to be flat in 2013‑14 and remain subdued in the following years. As a result, the industry’s share of the Territory’s GSP is expected to decline over the budget and forward estimates period.
0
10
20
30
40
50
0
10
20
30
40
50
01 02 03 04 05 06 07 08 09 10 11 12 13
Number employed (LHS) Share of total employment (RHS)
Year ended June
Number (persons) (000) %
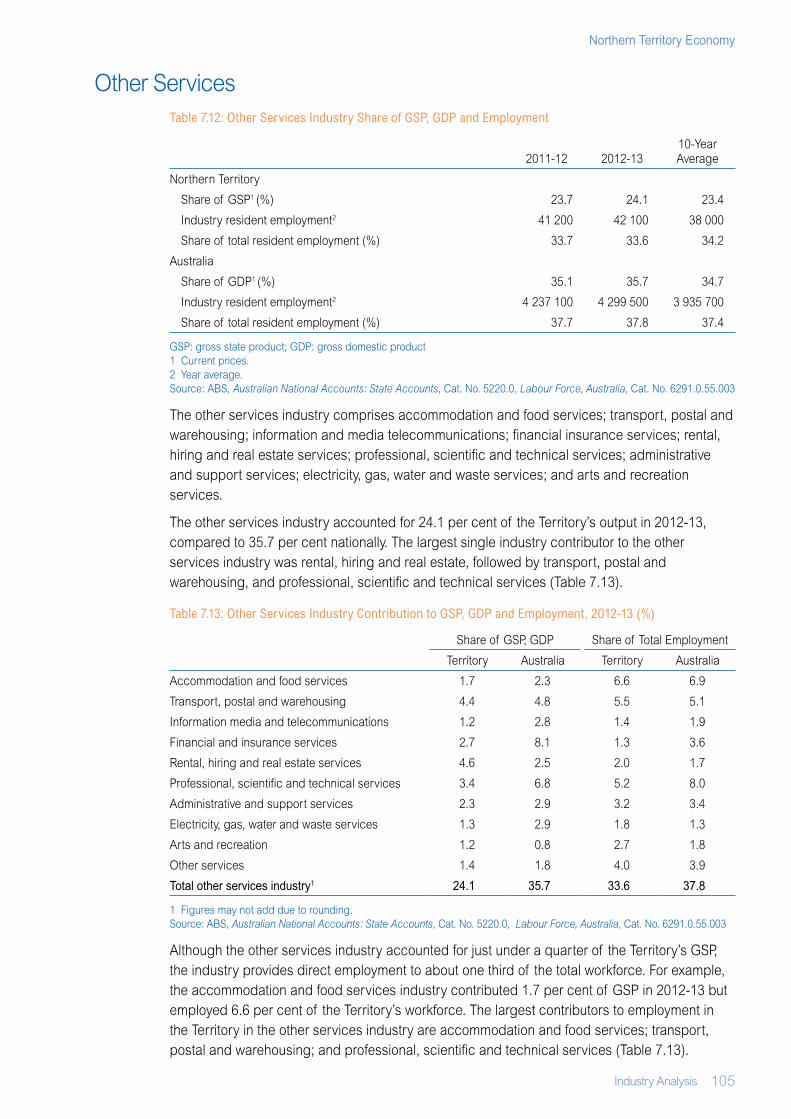
Industry Analysis 105
Northern Territory Economy
Other ServicesTable 7.12: Other Services Industry Share of GSP, GDP and Employment
2011‑12 2012‑1310‑Year Average
Northern Territory
Share of GSP1 (%) 23.7 24.1 23.4
Industry resident employment2 41 200 42 100 38 000
Share of total resident employment (%) 33.7 33.6 34.2
Australia
Share of GDP1 (%) 35.1 35.7 34.7
Industry resident employment2 4 237 100 4 299 500 3 935 700
Share of total resident employment (%) 37.7 37.8 37.4
GSP: gross state product; GDP: gross domestic product1 Current prices. 2 Year average.Source: ABS, Australian National Accounts: State Accounts, Cat. No. 5220.0, Labour Force, Australia, Cat. No. 6291.0.55.003
The other services industry comprises accommodation and food services; transport, postal and warehousing; information and media telecommunications; financial insurance services; rental, hiring and real estate services; professional, scientific and technical services; administrative and support services; electricity, gas, water and waste services; and arts and recreation services.
The other services industry accounted for 24.1 per cent of the Territory’s output in 2012‑13, compared to 35.7 per cent nationally. The largest single industry contributor to the other services industry was rental, hiring and real estate, followed by transport, postal and warehousing, and professional, scientific and technical services (Table 7.13).
Table 7.13: Other Services Industry Contribution to GSP, GDP and Employment, 2012‑13 (%)
Share of GSP, GDP Share of Total Employment
Territory Australia Territory Australia
Accommodation and food services 1.7 2.3 6.6 6.9
Transport, postal and warehousing 4.4 4.8 5.5 5.1
Information media and telecommunications 1.2 2.8 1.4 1.9
Financial and insurance services 2.7 8.1 1.3 3.6
Rental, hiring and real estate services 4.6 2.5 2.0 1.7
Professional, scientific and technical services 3.4 6.8 5.2 8.0
Administrative and support services 2.3 2.9 3.2 3.4
Electricity, gas, water and waste services 1.3 2.9 1.8 1.3
Arts and recreation 1.2 0.8 2.7 1.8
Other services 1.4 1.8 4.0 3.9
Total other services industry1 24.1 35.7 33.6 37.8
1 Figures may not add due to rounding.Source: ABS, Australian National Accounts: State Accounts, Cat. No. 5220.0, Labour Force, Australia, Cat. No. 6291.0.55.003
Although the other services industry accounted for just under a quarter of the Territory’s GSP, the industry provides direct employment to about one third of the total workforce. For example, the accommodation and food services industry contributed 1.7 per cent of GSP in 2012‑13 but employed 6.6 per cent of the Territory’s workforce. The largest contributors to employment in the Territory in the other services industry are accommodation and food services; transport, postal and warehousing; and professional, scientific and technical services (Table 7.13).
106 Industry Analysis
2014-15 Budget
Employment in the other services industry has also grown at a faster rate than the average for all industries over the past decade. Between 2002‑03 and 2012‑13, employment in the other services industry has grown at an average rate of 2.5 per cent per annum compared with 2.2 per cent per annum for all industries. As a result, the industry’s share of total employment has risen from 32.5 per cent in 2002‑03 to 33.6 per cent in 2012‑13. A contributor to the growth was the increase in the number of Territory residents employed in the rental, hiring and real estate industry, reflecting the strength of the real estate market in the Territory over this period. In addition, the number of people employed in the professional, scientific and technical services has increased over the past decade reflecting the major resource projects in the Territory.
OutlookThe outlook for other services industry over the budget and forward estimates period is positive, with forecasts for robust employment and population growth in the Territory over the next few years expected to support demand for a wide range of services.
While strengthening population and employment growth is expected to support services industries in general, some industries are likely to benefit more than others. The construction of the Ichthys project and the associated large number of non‑resident workers relocating to the Territory is expected to underpin strong growth in certain industries including transport and warehousing; accommodation and food services; and scientific, professional and technical services. Continued demand for rental accommodation and strength in Territory property markets is also expected to support growth in the rental, hiring and real estate services industry.
107
Northern Territory Economy
Abbreviations and Acronyms
Abbreviations and AcronymsABS Australian Bureau of StatisticsACT Australian Capital TerritoryADF Australian Defence ForceB billionCat. No. catalogue numberCPI consumer price indexDHA Defence Housing Australiae estimateERP estimated resident populationESCAS Exporter Supply Chain Assurance Systemf forecastFHOG First Home Owner’s GrantFIFO fly‑in fly‑outGDP gross domestic productGEMCO Groote Eylandt Mining CompanyGFC global financial crisisGSP gross state productGST goods and services taxIMF International Monetary FundJAEPA Japan‑Australia Economic Partnership AgreementJPDA Joint Petroleum Development AreaKAFTA Korea‑Australia Free Trade AgreementLEAP Living Environment and Accommodation PrecinctLHS left‑hand sideLNG liquefied natural gasLPG liquefied petroleum gasM millionmtpa million tonnes per annumn.a. not applicable; not availableNIM net interstate migrationNOM net overseas migrationNSW New South WalesNT Northern TerritoryNTPOP Northern Territory Population Projections Modelppt percentage pointQld QueenslandRAAF Royal Australian Air ForceREIA Real Estate Institute of AustraliaREINT Real Estate Institute of the Northern TerritoryRHS right‑hand sideSA South AustraliaSA3 Statistical Area 3SFD state final demandSIHIP Strategic Indigenous Housing and Infrastructure ProgramTas Tasmaniatcf trillion cubic feetTFR total fertility rateTRA Tourism Research AustraliaUS United States (of America)USMC United States Marine CorpsVic VictoriaWA Western AustraliaWPI wage price index
108
2014-15 Budget
Glossary
GlossaryConsumer Price Index
A general indicator of the prices paid by household consumers for a specific basket of goods and services in one period, relative to the cost of the same basket in a base period.
Current PricesThe value in nominal terms, not adjusted for inflation or changes in the purchasing power of money. This is in contrast to inflation adjusted measures, which factor in changes in prices from year to year.
EmployedPersons 15 years and older who worked for one hour or more in the week as measured by the Labour Force Survey.
Estimated Resident PopulationThe official Australian Bureau of Statistics population measure that represents the proportion that resides in a defined locality for more than six months of the year and for a period of at least 12 out of 16 consecutive months.
European Union An economic and political union of 27 member states that are located primarily in Europe.
Goods and Services TaxIn July 2000, the Commonwealth introduced a 10 per cent tax on goods and services (GST), replacing the previous wholesale sales tax regime. Some items such as basic food, health, education and exports are GST‑free.
Gross Domestic ProductThe total value of goods and services produced in Australia over the period for final consumption. Intermediate goods, or those used in the production of other goods, are excluded. Gross domestic product can be calculated by summing total output, total income or total expenditure.
Gross State ProductSimilar to gross domestic product, except it measures the total value of goods and services produced in a state or territory. It is the sum of all income, namely, wages, salaries and profits, plus indirect taxes less subsidies. It can also be calculated by measuring expenditure, where it is the sum of state final demand and international and interstate trade, changes in the level of stocks, and a balancing item.
Inflation AdjustedInflation adjusted measures provide estimates of real change by factoring in changing price relativities from year to year.
Labour ForceAll persons 15 years and over who are available for work, that is, employed plus unemployed persons actively seeking work. Excludes Australian Defence Force personnel and non‑residents.
109
Northern Territory Economy
Glossary
Moving Annual TotalA method used to smooth data. These smoothing methods iron out the short‑term fluctuations in the data by averaging observations collected over a 12‑month period.
Participation RateThe proportion of the population over 15 years of age who are working or looking for work.
Progress PaymentsPeriodic payments made for the construction of plant, equipment, machinery and modules in locations outside the Territory.
State Final Demand State final demand is a major component of gross state product and is a measure of the demand for goods and services in an economy. While state final demand includes consumption and investment expenditure, it does not include the contribution of trade or changes in inventories to economic growth and as such is not a comprehensive measure of economic growth.
Trade Weighted IndexAn index of the average value of the Australian dollar compared with currencies of Australia’s major trading partners. The weight given to each currency reflects the volume of trade between Australia and that particular country.
UnemployedPersons 15 years and older who were not employed during the week of the labour force survey and were actively looking for work in the last four weeks.
Unemployment RateThe number of unemployed persons expressed as a percentage of the labour force.
VisitorTourism Research Australia defines a visitor as someone who has stayed in a place at least 40 kilometres from their usual place of residence for at least one night, but who is away from home for less than 12 months. An international visitor is defined as an overseas arrival who stayed in Australia for less than 12 months.
Wage Price IndexA measure of the change in the price of wage costs over time, unaffected by the change in the quality or quantity of work performed. It excludes non‑wage costs such as superannuation, payroll tax and workers’ compensation.