Embed Size (px)
Citation preview

:
:2006/2007
:
: :
:......................... ......................... ..........................................................................


......................................................................................................................................................................
...................................................................................................................................................................
:
............................................................................................1:........................................................2:.....................................................................2
:.............................................................2 :.....................................3:.......................................................3:.............................................4
:.....................................................................4:..................................................4:........................................................5
:.........................................................6:................................6
:....................................................................7:.........................................................................8:.......................................................................8
:............................................................81 . )...............................................(82 ......................................................................10
1.2 .L.M.Koyck.....................................................101.2 .S.Almon.............................................13

:...................................................15:)D.W.Jorgenson(....................17
:............................................................21:...........................................................21:.................................................................22
:...............................................22:.................................................................23
:.......................................................23:....................................................24
:.................................................................26:.......................................................26
1 ...................................................................262 ..................................................................27
:.....................................................271.......................272 .........27
:.........................................28..........................................................................................29
:
..........................................................................................31:............................33:.......................................................................33
:...................................................33:.............................................34
:............................................34: )............................................(34

:..........................................................35:...........................................35:...........................................................36
:................................37: ).......................................(39
:...................................................39:.....................................................40
:......................................................40:...................................44
)( :......................................44
:.............44 :
.....................................................45 :............................................45 :............46
1 .LevinLin...........................................................472 .Pesaran, ImShin)IPS............................................(523 .MaddalaWu)MW.............................(..................544 ..............................................................55:....................................................56
:MCG..................................56:MCQG.............................58
:........................................................611.MCO..............................................612.Between......................................................623.Within......................................................63
:.........................................................641 ................................................641.1 .............................................................641 .2 .)BreuschPagan......(...................651.3 .Honda..............................................................652.....................................................662 .1 ...............................................662 .2 .(poolability test).............................663 .Hausman.........................67
:.......................68...........................................................................................69
:
.........................................................................................71:.....................................................72:.....................................................72
:..........................................................72:........................................................73
1.............................................................................732.............................................................................75
:...............................77:..................................................78
:....................................................80:....................................................81
:................................81:.........................................84
1........................................................................84

..............................................................84
.1 ................................................................84.2 ....................................................85.3 .......................................................................87
............................................................88.1 ......................................................................88.2 .................................................89
2 ...................................................................91:................93:..............................................................93
:.....................................................93:.........................................................93
:.........................................................95:...................................................................95
:..........................................95:IPS)2003.....................................(................95
:MaddalaWu)1999 (Choi)2001....................(96:............................................................97
:.............................................971.Within......................................................972. Between...................................................1003.OLS...........................................1024.EGLS....................................1045................................................................1055 .1 ...........................................105...............................................................105
. )BreuschPagan...........................(1065 .2 .................................................106

...................................................106 .(poolability test)...............................106
:...................................................1071.Within......................................................1072.Between...................................................1103.OLS............................................1124.EGLS.....................................1145................................................................1165 .1 ..........................................116 .......................................................................116
. )(Pagan , Breusch...........................1165 .2................................................116 ..................................................116
.(poolability test)..............................117.........................................................................117
:..............................................118........................................................................................122
................................................................................124.............................................................................127

)01 :(.33
)02 :(.46
)03 :(64
)04 :(68
)05:(1995-2010.72
)06 :(73
)07:(1995-2005.75
)08:( .77
)09 :(78
)10:(.80
)11:(.81
)12:(.83
)13:(.85
)14 :(86
)15 :(2002.87
)16 :()(87
)17:(1996.88
)18 :(.89
)19 :( .90
)20 :(.90
)21 :(2006.91
)22 :(93
)23:(IPS)2003(96
)24:(WuMaddala)1999 (Choi)2001(96
)25:(Within109
)26:(Between111
)27 :()OLS (113
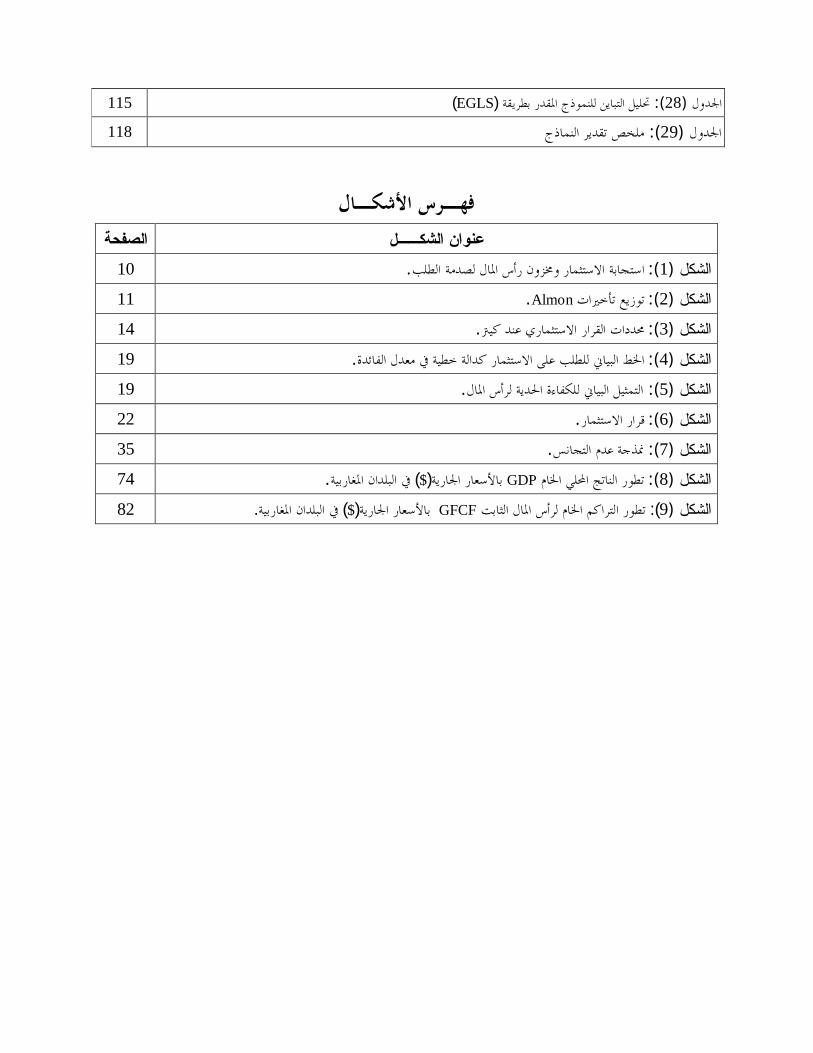
)1:(.10
)2:(Almon.11
)3:(.14
)4:(.19
)5 :(.19
)6:(.22
)7 :(.35
)8:(GDP)$ (.74
)9:(GFCF)$ (.82
)28 :()EGLS(115
)29 :(118

.


]Albert AFTALION, 1909[]John Maurice CLARCK,
1917[]KOYCK, 1954[)1(
"Les
données de Panel "
1975]1995,NerloveBalestra[]1997,
MazodierTrognon[)2(
) (
)(
)3(
(1) Patrick VILLIEU, Macroéconomie: l'investissement, (France: La découverte, 2000), P16, 17et19.(2) Patrick SEVESTRE, Econonmétrie des données de panel, (France : Dunod, 2002), P1.(3) Ibid, P1.

.
::
1-.2-
.
::
1- .
2- 4.
:
]1995Islam,[]1996,LefortEsquivel,Caselli[]1996,Oh[ ]1999,Nerlove[.
4
2000

:) (
:1-
2-
::
.:
1-.2-
.
:
.:
1-.2-.3- :SPSSEViewsMATLABSAS.
:
.

:
SAS
.
:
::
.:
.
:
.


:
.
:
: .
:
.

:
.
::
:
:-
Capital Goods
....)5(
- .)6(
- " "
.)7(
) (.
GFCF
)5 ( ) :2000(168 .)6 (Microsoft Encarta2005 .)7 ( ) :41992(36 .

8 ..
.)9(
.
:
:1-:
.2-:
.3-)(:
.
:)GFCF (
:)10(
-:) (.
-).(-)(
)4( Janine BREMOND, Mieux comprendre l'économie, (France:Edition Liris, 1993, 2ème Ed),p 189..2004-2003 (5)
)10 ( ) :2(173 .

:....
:
....
:
.
::)11(
1-:Autonomous Investment
:.2-Induced Investment:
) (
.
)11 ( ) :12002(105.

::
1-:
tRI)d (t
Kt-1= d Kt-1tRI
2-:
tGIt tG RI I>
)t tG RI I− (
tNI ) (
:= Kt – Kt-1 tNI
:Kt :t.Kt-1 :t.
:
t t tG N RI I I= +
tGI = ( Kt – Kt-1) + d kt-1
= Kt - (1-d) Kt-1 tGI

:
:1- :
.2-:
.3-:
.
::12
1-:
.2-:
.3-:
:
(14)199215.

-. -. - .
::
1-) ( .
2-.
3-.
4-) (.)13(
(13)):1994 (7.

:
)14(
..
.
::
:)
(
) ( :
.1-) :(
Albert AFTALION John Maurice CLARCK
)15(
(14) Pierre DUHARCOURT, La fonction d'investissement, (France: Serey, 19701),P1.)15 (206.

) ()Kt (Yt)*(
:
1>=t
t
YKV
:= ∆K= Kt – Kt-1 tNIV:
1tNt
t t
IK VY Y
∆= = >
∆ ∆
KtYtV
:( )tN tI V Y= ∆
1( )tN t tI V Y Y −= − [1-1]
[1-1]
.)
tRI(Kt-1:d Kt-1 =
tRI
:)()( 11 −− +−= tttG VYdYYVI
t)*(
1)1( −−−= ttG YdVVYIt[1-2]
.c .)16(
*1( )
tN t tI c K K −= − , (0 < c < 1)
tK *. :tt VYK =*
:
1)1()1( 1 −
−+−−= − tt GttG IcYdcVcVYI[1-3]
)*(.
)*(Vnt
nt
t
t
t
t
YK
YK
YKV
−
−
−
− ==== ...1
1
:11 −− = tt VYK(16) BRIDGE, 1971, Applied econometrics, P 124.

[1-3]
.]31-[[1-2])*(.
:1-
.2-.3-
.4-
.
2-:
:)17(
1-1−tK
tK * :*1tN t tI K K −= −
2-)Yt(tt VYK =*
Koyck1954
18.
2-1-Koyck
Koyck ( )sµ
:nt
nttt YVYVYVK −− −++−+−= λλλλλ )1(...)1()1( 1
)...)(1( 1 ntn
ttt YYYVK −− +++−= λλλ [1-4]
)*( :BRIDGE, op.cité, P 122-124(17) Patrick VILLIEU, op.cité, P18
)14 (213 .

λ(0 < λ < 1)
V.
tNI
:1−−= ttN KKIt
1−tK:)...)(1( 1
211 ntn
ttt YYYVK −−
−−− +++−= λλλ [1-5][1-5]λ:
)...)(1( 22
11 ntn
ttt YYYVK −−−− +++−= λλλλλ
[1-5][1-4]:11 )1()1( −− +−=⇒−=− tttttt KYVKYVKK λλλλ
:1−−= ttN KKI
t
11)1( −− −+−= tttN KKYVIt
λλ
1)1()1( −−+−= ttN KYVIt
λλ
))(1( 1−−−= ttN KVYIt
λ [1-6]
Koyck.:
ttt RNG III +=
11))(1( −− +−−= tttG dKKVYIt
λ
1)1()1( −−−−−= ttG KdVYIt
λλ [1-7]
) (.
.

)1 :(AS :AF :
:Patrick VILLIEU, op.cité, P19
.Koyck
)19(
.
(19) Pierre DUHARCOURT, op.cité, P17.

-6
-4
-2
0
2
4
6
8
10
12
0 1 2 3 4 5 6 7 8 9 10K
P = 0
P = 1
P = 2
P = 3
P = 4
2-2-Almon: µ(s)
KoyckAlmon)1965()20(P : R :
4)*( Almon
)2 :(Almon
PK..
Almon::
∑=
−=K
jjtjG YbI
t0
(20) Jack Johnston, Méthodes économétriques, Trad, Bernard GUERRIEN, (France: Economica, 2ème
tome, 1988), P 419.)*( :
33
2210 iii)i(f3p α+α+α+α=⇒=

jb:p
pj jajajaab ++++= ...2210
P:00 ab =
paaaab ++++= ...2101
pp
K
pp
aKaKKaab
aaaab
++++=
++++=
......
2...22
22
10
22
102
∑=
=p
ii
iK aKb
0
[1-8]
aiYt-j:
∑=
−=k
jjt
ii YjW
0
Wii:
∑
∑
∑
∑
=−
=−
=−
=−
=
=
=
=
K
jjt
pp
K
jjt
K
jjt
K
jjt
YjW
YjW
jYW
YW
0
0
22
01
00
.
.
.
:tppG uWaWaWaWaI
t+++++= ...221100 [1-9]
ut
[1-9]OLSaibj [1-8].

:.)21(
.:
)()( rfMECMECfI =→=)()( MfiifI =→=
MEC :.r :.i :.
M :.
)22(
.ye:
I = f(i, ye)
.:
(21)157.(22)) :2004(194.

)3(:
:Ed),ème, (Algérie: OPU, 2Les grands courants de la pensée économiquesAlain SAMUELSON,p437.
.
It
RhT(h = t+1, …+t+T))VAN ( :
∑+
+= ++−=
Tt
1thh
h
)r1(
RI)r(VAN [1-10]
r :.
VAN.

:)23(
)24(.Jorgenson:
Jorgenson :
1-
LKyt = f(kt, Lt):It = Kt+1 - (1-d) Kt
2-.
)ptyt (pt )wtLt (wtxt
t
:
ttttttt IxLwypR −−= [1-11])*( :
tttttttt KcLwLKFp −−=Π ),( [1-12]ct:
t1ttt x)d1(x)i1(c −−+= − [1-13]
(23) Pierre DUHARCOURT, op.cité, P31.(24) Ibid, P32.
)*(:Patrick VILLIEU, op.cité, P 25-26

[1-13]t xt-1t(1+it)xt-1
itit
i)*(
.ct < (1+it)xt-1(1-d)xt
xt(1-d)xt
t
xt.
Jorgenson:t
t
t
t
px
pc
=
))d1(x/xi1
(px
pc
1tt
t
t
t
t
t −−+
==−
[1-14]
pt = xt:
dr))d1(1
i1(
pc
tt
t
t
t +≡−−Π+
+=
tt
t rdpc
≡− [1-15]
:rt.∏t :.
.Jorgenson
:1--)*(:
( , )t t t t tY F K L AK Lα β= =
:α + β < 1.
)*( .)*( -:
) :1997(783 -793.

:t t
t t
Y cK p
∂=
∂
:t t
t t
y YK K
α∂
=∂
:* 1 ( )tt t
t
cK Yp
α −= [1-16]
t[1-16]1-)
pc
(vt
tα=1
t
t )pc
( −
1−−= ttN KKIt
:
1( , ( ) )t
tNt
cI f Y
p
−+
−= ∆ ∆
2-µ(s):
s
s)s(ωγ
=µ
γsωs(s).:
1 1
1
( ) [ ]( )t
t t t tN
t t
p Y p YsIs c c
γα α
ω− −
−
= − [1-17]
JorgensonKoyckpt.:
1 11
1
( ) [ ]( )
t t t tGt t
t t
pY p YsI dKs c c
γα α
ω− −
−−
= − +
:
( ) 1 11
1
[ ] ( )[ ]t
t t t tG t
t t
pY p Yw s I dK sc c
γ α α − −−
−
− = − [1-18]
Jorgenson .

Jorgenson:1-
:
=
=
⇒
=∂∂
=∂∂
),(
),(
*
*
t
t
t
tt
t
t
t
tt
t
t
t
t
t
t
t
t
pc
pwKk
pc
pwLL
pc
Ky
pw
Ly
.
))p/t(),p/t((fI ttt wc −−∆∆=
2-]Eisner []Nadiri[)25( .
3- ]Hall []Jorgenson [
)26(.
(25) Pierre DUHARCOURT, op.cité, P44.(26) Patrick VILLIEU, op.cité, P27.

::
:
. )SM ()DM ) (
(
.It(i)
It = f(i):
0iI
<∂∂
:)4 :(
ii1i0
I1
I0
I

:(05)
02468
1012141618202224
0 5 10 15 20 25 30 35 40 45
% (p
) MEC
:
27
.
:
) (
.
:107.
(MEC) .
27Janine BREMOND, op,cite, p194.

:1-.2-.3-.4-.
.
:)28(
.)*(
:t
Jorgenson:
t1tt x)d1(x)i1(c −−+= −(**)
)28 () :12002(126 .)*(4.
)**(D. W. Jorgenson.

:
.
:1-.2-.3-.4-.5-.6-)(
:

)6 :(
:Patrick VILLIEU, op.cité, P 14.

:
.)29(
Richard Ferdinand KOHN1931)30(
.
:
CI G
(X-M)Y
:Y = C + I + G + (x - M) [1-19]
1-::
00 IkIb1
1y ∆=∆−
=∆ [1-20]
0 < b < 11b1
1>
− :
0Iy ∆>∆
b11k−
=)b(
))2--1 (133(.
(29) Alain SAMUELSON, op.cité, P449.(30) Ibid, op.cité, P450.

2-::
00 IkI1
1y ∆′=∆
β−=∆ [1-21]
β−=′
11k ))2--2 (
134(.
:
) ( .
ROBERTSON LAG
)(31
:1-:
:
[1-22]b1
b1kT
−−
=′′
0 < b < 1bTT:
∞→
→
T
0bT
b11k−
=
))2--1 (135( (.
31104.

2-:
k*=bT-1) )2--2 (136(T=1:
bT-1 = b0 = 1
:)( 1−−= ttN YYVI
t
V
:
1tt byac −+=
.:
ttttttt MXGyyVbyay −++−++= −− )( 11 [1-23]ytyt = yt-1:
][1
1tttt MXGa
by −++
−=
b11−
.
[1-23]
yt
.

:
:1-
.2-
.3-.4-.


(Econometric Model)
)()32 ( )33(
)34(
)(
) (...
]1959Kuh,[ ]1961,Mundlak[]1962Hoch,[]1966,BalestraNerlove[)35(
) ( )Hétérogénéité (
:
)1( G.S. Maddala, Introduction to econometrics, (USA : Macmillan Publishing Company, 2nd Ed,1992), p3.
)33 () :1998(3.(34) William GREENE, trad. Dedier SCHLACTHER et autres, Econométrie, (France : PearsonEducation, 5ème Ed, 2005), P 271.(35) Patrick SEVESTRE, op.cité, P 02.

:
.:
.

:.
:.
:.
-:.
-:
1-.2-.3-.
:1975-2005xit i t)*(
.)01 :(.
i=1i=2i=3i=4i=51975t=1x1,1x1,2......x1,5
1976t=2x2,1x2,2......x2,5
.
.
.
.
.
.
.
.
.2005t=30X30,1X30,2......x30,5
:
)* (.

:36
1-.-.-.
2-.3-.
:.
)37(:1-
.2-
.3-.4-.
)38(.
:(Hétérogénéité)
) (
.
(5) Formation permanente à l’économétrie des données de Panel, Ecole Doctorale en SciencesEconomiques, Gestion et Démographie, (France: Université Montesquieu-Bordeaux, 2005),p 06.(37) William GREENE, op.cité, P 272.(38) Patrick SEVESTRE, op.cité, 04.

)7 :(
:.
:
[ ] 2-1Y X β µ= +
:
:
1-1 1 2 2 ... k kY x x x uβ β β= + + + +
x11.2-0)( =uE :( )E Y X β=
3-IuuEu 2)()var( σ=′=
1 11
2 22
1 2
k n
. . .
. . .. .
, , ,. . . .. .
. . . .. .
. . .
k
n
uY
uY
Y X ux x x
Yu
ββ
β
β
= = = =
: Marc LE VAILLANT, Model à erreurs composées et model mixte
Atelier SAS/MATISSE, (France : CNRS-UMR 8052,Jeudi 07 Avril 2005), P04.

)39(:-u.
-.4-kX =)(ρ.5-x.6-un.
236:
:
)OLS (:
Y X uβ= +
:1-0)( =uE.2-( ) Iu 2var σ=).(3-E(uiuj) = 0i j.4-E(xiui) = 0.5-
b*k:e* =Y – Xb*
(OLS)b*ee:
***
****
xbxbyxb2yy)xby()xby(ee′+′′−′=
−′−=′
b*:
]32-[* **
*
2 2e e X Y X Xbb′∂ ′ ′= +
∂
b]2-3[:
(39) Jack JOHNSTON, op.cité, P 201.
2 (0, ) [2-2]u N Iσ
),0( 2INu σ

( )X X b X Y′ ′=
.)4 ()XX ′ (:
( ) ( ) [ ]1 2-4b X X X Y−′ ′=
)OLS(e.
)OLS(( ) β=bE
:
:
N
t=1,2 ;3,…..T:itY
i = 1,2,3,……….N)(t = 1,2,3,……….T)(
it.:
( ) ( ) ( ) [ ]2 2
2.. . .. .
1 1 1 1 1 2 6
N T N N T
it i it ii t i i t
Y Y T Y Y Y Y= = = = =
− = − + − −∑∑ ∑ ∑∑
:
.iY :itYi .
..Y :itY.]2-6[)(
i.
Intra-individuelleInter-individuelle
( ) ( ) 12 −′= XXbVar σ
[ ] 2-5e Y Xb= −

:
]NT[>]NT(K+1)[
:
itY :) (it.
,k itX :itkβ
it,0β :.
it,kβ :.
itw ::
)()40(
: -. -).( -. -.
(40) Patrick SEVESTRE, op.cité, P 10.
( )( ) ,var
,02wit
it
wwE
σ=
= ( )t,i∀( )t,i∀
[ ]0, , ,1
2-7K
it it k it k it itk
Y X wβ β=
= + +∑

:).(
...)41(
.
)42(
.
::
, 0 ,1
[2-8]K
k k it it k k it itk
Y Xβ β β β ε=
= ⇒ = + +∑
tε:
ittit wu ++= νε
iu :.
tν :.
itw :(Perturbation idiosyncratique).
iutν:1-.
(41) Ibid, P 53.)11 (169.

2-3-4-.5-itw.6-,k itX.
:) (
]2-8 [:
0 ,1
[2-9]K
it k k it itk
Y Xβ β ε=
= + +∑i = 1, 2, …, N.t = 1, 2, …, T.
:[ ] 2-10it i itu wε = +
:)*(
iu:1-.2-.3-iuit,kx.
iuitw:1, 2, ,
1, 2, ,
( / , ,..., ) 0 (i,t) [2-11]
( / , ,..., ) 0 (i,t )i it it k it
it it it k it
E u x x xE w x x x′
= ∀ ′= ∀
:2
1, 1, 1,
21, 1, 1,
1, 1, 1,
( / , ,..., ) (i,i )
( / , ,..., ) (i,i ,t,t ) [2-12]( / , ,..., ) 0 (i,i ,t)
i i it it it ii u
it i t it it it ii tt w
i i t it it it
E u u x x x
E w w x x xE u w x x x
δ σ
δ δ σ′
′ ′ ′ ′
′
′ ′= ∀ ′ ′= ∀ ′= ∀
)* ()]08 ([.
==
==⇔
2i
2t
i
2t
2
) var()var(
0)E(0)(
)N(0,)N(0,
u
t
v
ui
u
uEuσσν
ν
σν
σ
ν

:
:
1, 2, , 0 ,1
( / , ,..., ) [2-13]K
it it it k it k k itk
E Y x x x Xβ β=
= + ∑:
1, 2, , 1, ,cov( , / , ,..., ) cov( , / ,..., )it i t it it k it it i t it k itY Y x x x x xε ε′ ′ ′ ′=
"") (
2uσ
43.i:
[ ]iY X . 2-15( ,1) (T,K 1) (K 1,1) (T,1)
i i
Tβ ε= +
+ +
:
1 2( , ,..., )i i i iTY y y y ′=)i.(
iX.
iε:
iA,),...,,/var(
i,0),...,,/(
21
21
∀=
∀=
−−−−
−−−−
kiiii
kiiii
xxx
xxxE
ε
ε
A:
43 Ibid, p55.
2 2
2
si i i t t
si i i t t [2-14]0 si non
u w
u
σ σ
σ
′ ′ + = =
′ ′= ≠

2 2 2 2
2 2 2 2
2 2 2 2( . )
2 2
. . .
. . .. . . .. . . .. . . .
. . .
[2-16]
u w u u
u u w u
u u u w T T
w T u T
A
I J
σ σ σ σσ σ σ σ
σ σ σ σ
σ σ
+
+
=
+
= +
IT :T.JT(T ×T))1.(
A
.N:
Y X [2-17](NT,1) (NT,K 1) (K 1,1) (NT,1)
β ε= ++ +
:
[2-18]Ω=
=2
21
21
),...,,/var(0),...,,/(
ωσε
ε
k
k
xxxxxxE
:Ω2ωσ:
)*(
2 2 2 2var( ) [ (( ) / ) ] [2-19]w N w u w NW T Bε σ σ σ σ= + +
:WN(opérateur inter-individuel)(Within):
[ ( / )] [2-20]N N T TW I I J T= ⊗ −
)* (⊗)Le produit de Kronecker ()3(137.
( )
)])(/([
I
...00............0...00...0
...............
...
...
222
*N
21
22212
12111
2
TNwuNTw
NNNN
N
N
JII
A
A
AA
EEE
EEE
EEE
⊗+=
⊗=
=
′′′
′′′
′′′
=Ω
−−−−−−
−−−−−−
−−−−−−
σσσ
εεεεεε
εεεεεε
εεεεεε
σ ω

.BN(opérateur inter-individuel)(Between):
[ / ] [2-21]N N TB I J T= ⊗
.WNBN:
1-BWIBIW +=⇒−=I
2-0=BW
3-WWWBBB ′==′== 22 ,
var(ε)NWNB221 uw Tσσλ +=
22 wσλ =Ω
.) (
OLS)(β
OLS2wσ
]2-17 [GLS.

:)(
)44(:1-).(2-.
:.)45(
]1992Levin,Lin[)46(
....
:.
)47( .)*(
) (
(44) Michel LUBRANO, cours des séries temporelles, chapitre IV : tests de racine unitaire, Universitéde Paris, Septembre 2005, P 02.(45) Christophe HURLIN et Valerie MIGNON, Synthèse de tests de racine unitaire sur données depanel, Université d’Orléans, Janvier 2005, P 02.(46) Ibid, P 02.(47) Salanie.B, Guide pratique des series temporelles, Economie et Prévision, 1999, P 137.
)* ( :.

BaltagiKao
:)48(.
:
.
:)49(
:
:
)(
.:) (
.
:.
)inter-individuelle ( .
:
(48) Christophe HURLIN et Valerie MIGNON, op.cité, P 02.(18) Ibid, pp 2-3.

)2 :(.:.
1.H1
(1993-1992) LevinLin(2002) LevinLinChu
(1999) HarrisTzavalis
2..(20032002,1997) Im, PasaranShin
(1999) MadallaWu(2001,1999) Choi
(2000) Hadri3.
(2001) Hénin , Jolivaldt, Nguyen:.
1..(2001) BaiNg(2004) MoonPeroon
(2003) PhillipsSul(2003) Pesaran
(2002) Choi2.
(1998) O’connell(2004,2002) Chang
:Ibid, P4
:
)50(
(19) Ibid, p 4.

:
1-LevinLin:
Andrew LevinChien-Fu Lin)51(
)199219932002(DeckeyFuller)1979 (
:1 :]222-[1it it itY Yρ ε−∆ = +
2 :]2-23[1it i it itY Yα ρ ε−∆ = + +
3 :]2-24[1it i i it itY t Yα β ρ ε−∆ = + + +
:i = 1,2,………..Nt = 1,2,…..……T
itε) (iARMA
( )∞ AR:
]2-25[∑∞
=− +=
1kitkitikit uεθε
:( )2,0 uiσ i.i.dtuε :i = 1,2,………,N
:1-LevinLin
.2-
LevinLin
( )j,i,ji ∀ρ=ρ=ρy
.LevinLin:
1 :0H0H
1
0
<ρ==ρ=
(51) Ibid, P 05.

2:Nii ,.......2,1,0 =∀=α 00 == ρH
Nii ,.......2,1, =∀ℜ∈α01 <= ρH
3 :Nii ,.......2,1,0 =∀=β00 == ρH
Nii ,.......2,1, =∀ℜ∈β01 <= ρH
LevinLin23
( )0== ρρ i
( )0i =α
)2 (( )0i =β.
( )0ik ≠θLevinLin
Deckey-Fuller(ADF)t:
1 :
]2-26 [11
ip
it it is it s its
Y Y Y uρ γ− −=
∆ = + ∆ +∑2:
]2-27 [11
ip
it i it is it s its
Y Y Y uα ρ γ− −=
∆ = + + ∆ +∑3:
]2-28 [11
ip
it i i it is it s its
Y t Y Y uα β ρ γ− −=
∆ = + + + ∆ +∑ ::( )2
ui,0 σ i.i.dtuε
pi .LevinLin
.

:.
ρ
pii
pii = 1,2,3,….Nρ
LevinLinADF
.)2 ()2-27 (i
OLS.)1:(
Tpt i ,.....,2+=∀1
ip
it i is it s its
Y a b Y e−=
∆ = + ∆ +∑]2-29[
)2:(
Tpt i ,.....,2+=∀11
ip
it i is it s its
Y c d Y ϑ− −=
∆ = + ∆ +∑]2-30[
)1 ()3(]2-29 []2-30 [
N ittite 1= it
tit 1=ϑ:1−−= ii pTt(i) .
ρ∑=
N
iiT
1ite∑
=
N
1iiTitϑ
.
]2-31 [ui
itit σ
ϑϑ~
=ui
itit
eeσ
~ =
Tpt i ..,.........2+=∀,Ni ,........,1=∀2uiσADF)262-
272-282-.(iADF
:
]2-32 [( )∑+=
−−−
=T
ptitiit
iui
i
epT 2
22
11
ϑρσ
Tpt i ,........,2+=∀

iρOLSiρ :it1itiite ζ+ϑρ= −i.
∑=
N
1iiT it
tite 1= it1tit =ϑρ
ρOLS
]2-33 [ititit~e~ ε+ϑρ=
Tpt i ...,,.........2+=∀N.....,.........2,1i =∀
:.
Nsi Ωi2
2uiσi = 1,2, …, N.
^^ ^
^1 1
1 1 [2-34]N N
iN i
i i ui
S sN N σ= =
Ω= =∑ ∑
t-student.
:LevinLin)LL(
ρOLS:
0:0 =ρH
t-student:
^
^
^
^0 [2-35]t
ρ
ρ
ρ
σ==
:2^^ρσρ:
1
1 1
22~
2 ~−
= +=
= ∑ ∑
N T
ptit
iεε ϑσσ
ρ
2~εσitε:
( )1
22
1 1 2 [2-36]
i
N N T
i it iti i t p
T eε
σ ρϑ−
= = = +
= −
∑ ∑ ∑%
%%
LevinLin∑=
N
iiT
1
( )1PTNT~N −−=

:∑=
=N
iiP
NP
1
1
)1) ( (levinlin)52(0=ρt
(Normale centrés réduite)00 == ρH.23)composante déterministe(
( )∞−0H
0H.LLt-student:
]2-37[
×××−= ==
*2~
0*~
*0
~1: TmN
Tm
sTNttLL µρσσσ ε
ρρ
3,2,1=∀m
(m=1,2,3)T~ :1PTT~ −−=*
Tmµ*Tmσ)4 -
-138(iP
.t-student
:
:
t 0=ρt*
0=ρ)A:Asymptotiquement(
t-student0=ρt23 .Lin
Levin*0=ρt
.
(52) Ibid, P 12.
∞→T~p
1*T~1σ
∞→T~p
0*~1Tµ)P(
N(0,1) [2-38]L*
0=ρt : 0T/N →T,N →∝
A

:
:
.2-ImPesaranShin:
)53(LevinLin
H1iρ
ImPesaranShin)199720022003 (
)ji ρρ ≠()54(i ≠ j.)∗(IPSADF)2
LevinLin(.IPS:
11
[2-39]ip
it i i it ij it j itj
Y Y Yα ρ β ε− −=
∆ = + + ∆ +∑
:i = 1, 2, …, N
αi:
Riii ∈−= i, γγρα
IPSLevinLin
)0=ρ ()αi = 0(.IPS:
N...,,2N,1Ni,0N...,2,1,,0:HN...,2,1,i,0:
11i
11
0
++=∀==∀<=∀=
ρρρ
iH
i
i
i = 1, 2, …, N1Yit.
(53) Ibid, P 15.(54) Ibid, P 15.
(*) Im Pesaran Shin IPS.
itε ∼ ),0(d.i.N 2iσ
64.1: *0 −<=ρtLL

i = N1+1, …, NYit.0 < N1 < NN1 / N:
10,/N1 <<=∞→
δδNLimN
IPS
IPSN→ ∝T.IPSADF:
( )ii 1
1_ p , [2-40]N
NT it it bar tN
β=
= ∑),( iiiT pt βt-studentH0 : 0=iρ]2-39[
piADF),...,(iip1ii ββ=βN
ADF),p(t iiiT β),( βpZ tbar
ηADF:[ _ ( )]( , ) [2-41]
var( )NT
tbarN t bar EZ p η
βη
−=
E(η)var(η)ADF
)0=ρ ()T → ∝(IPSZtbar(p,β)
N→ ∝T
TIPS)2003 (Wtbar(p,β)
Ztbar(p,β) .Wtbar(p,β)ADF
βiADF:]0/)0,(var[ =iiiT pt ρ]0/)0,([ =iiiT ptE ρ
wtbar(p,β):1
1
1
1
[ _ [ ( ,0) / 0]]( , ) [2-42]
var[ ( ,0) / 0]
N
NT iT i ii
tbar N
iT i ii
N t bar N E t pW p
N t p
ρβ
ρ
−
=
−
=
− ==
=
∑
∑
(0,1) N( )βp,tbarW
L
T,N ∝

( )[ ]0/0, =ρiiT ptE( )[ ]0/0,var =ρiiT pt)4--
138 (IPSpiT.
IPSZtbar
(T = 10)ZtbarDF
IPSWtbar(p,β)NT
.Ztbar(p,β)ADF
E(η)var(η)DF (pi)
Wtbar(p,β).
:5%:
<-1.64Ztbar(p,β)Wtbar(p,β) <-1.64
.
3-MaddalaWu:
Fisher)1932 (MaddalaWu
)1999()p– values (N
)G(Fp iTii =)p– value (Gi
(i)FTi(.)
GiTi.Gi
t-studentADF ]1988,PhillipsPerron [.
MaddalaWu:
[43])pln(2PN
1iiMW ∑
=−=

MWΖ )( 1,0N
p-value
[0,1]ln(pi)( )12χ∀i = 1, 2, …, N
:( )N22χ∼MWP
N.
3-1-:
:( )N22χPMW >.
MaddalaWuIPS
)i jρ ρ≠ (i ≠ j.]2001Choi, [N
:( )[ ]
( )[ ]i
iMWMW pLnVar
pLnEPNN2
21
−−−
=Ζ−
[2-44]( )[ ]∑=
−−=ΖN
iiMW PLn
N 122
21
)2-44 (ChoiMW1PN−
P-valuesi-i-d
:∼
H0∞→N.:
64.1MWΖH0.
.
4-:
ImLevinLin(LL)( )tbarΖIPS)55( :
(55) Ibid, P 23.

1-( )tbarΖ(LL)NT
( )tbarΖ(LL).2-ADF
( )tbarΖ(LL).
MaddalaWuLevin(LL)( )tbarΖ
MaddalaWu)1999 (
(MW)(LL)( )tbarΖ
( )tbarΖ(MW)ADF)56(:
1-iρ)1 (( )tbarΖ(MW)iρ)1(
( )tbarΖ(MW)(LL).
2-(MW)( )tbarΖ
(LL).
:.)OLS(
)GLS ()2-17 (.
:(GLS).
1-:Ω(GLS))17 (:
( ) 11 1GLS X X X Yβ
−− −′ ′= Ω Ω
(56) Ibid, PP 23, 24.

Ω))5 (139 (GLS
:]2-45[( ) ( )1
GLS N N N NX W X X B X XW Y X B Yβ θ θ−′ ′ ′= + +
WNBNθ:
22
2
uw
w
Tσσσ
θ+
=
GLS
.λθ:
θσσ
σλ =
+= 22
2
uw
w
T
:
( ) ( ) ( )1N N N NX W X X B X X W Y X B Yβ λ λ λ
−′′ ′ ′ ′= + +
GLSOLS:
:
( ) ( ) ( ). .1 1 1it i it i it iY Y X Xθ θ β ε θ ε + − = + − + + −
:.iYitYi
.iεitεi2-GLS)∗(:1-( ) ββ =Ε GLSGLS.2-:
( ) ( ) 12 1GLS wVar X Xβ σ
−−′= Ω1
22
22
−
′
++′= XBX
TXWX N
uw
wNw σσ
σσ
GLS
:
)∗ (GLS:Jack JOHNSTON, op.cité, PP 345-346.
1 1 12 2 2Y X β ε
− − −Ω = Ω + Ω

∼GLS∞→TN∞→NT.
:
NxxN B
NXBX
→ ∞→
NxxN W
NWXX
→′
∞→
iuiw
GLS∞→N.
∼ :∞→NTGLS
:
∼ :
NTWXXLimW
TN
NTxx
′=
∞→,
:∞→θ∞→T
GLS
.GLS
2uσ2
wσθ
θθ
EGLS.
GLSβ12
22 2, w
w N Nw u
N X W X X B XT
σβ σ
σ σ
− ′ ′+ +
( )( )12,0 −+ N
xxN
xxw BWN θσ( )GLSN β β−
( )( )12,0 −NTxxw WN σ( )GLSNT β β−

:)EGLS(.
1-:
EGLSGLSΩ
:
( ) ( )11 1EGLS X X X Yβ
−− −′ ′= Ω Ω
( ) ( )1 [2-46]n N n NX W X X B X X W Y X B Yθ θ
−′ ′ ′ ′= + +
:
2uσ2
wσ.
2-:2uσ2
wσSawmy
Arora)1972()57(
.)Intra-indivudielle (OLS
.
:
:
(57) Patrick SEVESTRE, op.cité P 61.
( ) NwN WW 2var σε =
22
2
uw
u
Tσσσ
θ+
=
N N NW Y W XB W ε= +
( ) [ ]. . i.- 2-47it i it i itY Y X X β ε ε− = − +

Kruskal)*(
OLSβ
)BLEU (2wσ:
w
ww
wx
www kTNMrang −−
′=
′=
)1()(2 εεεε
σ))))
:wk]2-47[
wε):
y
XWyW
w
wNNw
wx
xN
N1-
NNN
M)yP-(W
)yWXX)WXX(W-(W
==
′′=
−= βε))
wε))*(.
:
OLS
)NT-kw()N(T-1)-kw(.
2wσ)N →∝TT→∝N.
)inter-individuelle (OLS:
[2-48]N N NB Y B X Bβ ε= +
)2 2( / )u w Tσ σ+(:
b N N b bxB Y X M Yε β β= − =))
:
])(
[)( 2
b
bbb kNT
EE−
′=
εεσ
)))
)* ()6 -139.()* (:
Patrick SEVESTRE, op.cité, P 61.
2
2 ])1(
[)(
w
w
www kTN
EE
σ
εεσ
=
−−′
=))
)

2 2 2( ) ( ( / ))b u wE Tσ σ σ= +)
kb[2-48].θ:
^22
2
2
2
uw
w
b
w
TT σσ
σσ
σθ
+==
)
)
))
GLSθ)
θ.
3-EGLS:EGLS:
1 1 1
-1 -1 -1
( ) [( ) ]
E[(X X) X ]EGLSE E X X X Yβ
β εβ
− − −′= Ω Ω
′ ′= + Ω Ω≠
) ) )
) )
)βEGLS (Ω)
ε.]1980Taylor,[)58(
EGLSβ)
2uσ2
wσ
N ≥ k+5T ≥ 2.
:.GLSEGLS
:
1-)OLS:(
1-1-:
OLS
OLS:
(58) Ibid, P 63.
1( ) [49]OLS X X X yβ −′ ′=)

1-2-OLS:
OLSOLS
:2 1 1var( ) ( ) ( )OLS w X X X X X Xβ σ − −′ ′ ′= Ω
)
→ ∝NTui
witOLS)N → ∝.(
( )OLSN β β−) ∼ )))(()(,0( 112 −− +++ N
xxNxx
Nxx
Nxx
Nxx
Nxxw WBBWWBN θσ
2-)Inter-individuel ()Between:(
2-1-:
OLS:
. , . .1
[2-50]K
i k k i ik
Y Xβ ε=
= +∑:.iYitYi
, .k iX,k itXk
.iεitεi
.iε:
.. iii wu +=ε
i = 1, 2, …, N]2-50 [BN.
51]-[2)1,(,1)(k),()1,( b NT
NkNT
NNT
N BXByBb
εβ +=
]512- [:
( ) YBXXBX NNB ′′= −1β
BN:
]/[ TJIB TNN ⊗=
k=kb.2-2-:
1-:1( ) [( ) ]B N NE E X B X X Yβ β
β
−′ ′=
=
)

2-:
1-N
22
112
X)X)(T(
)()()var(
BXBXXBBXXX
uw
NNNNwB
′+=
′Ω′′= −−
σσ
βσβ)
→ ∝NT→ ∝NT .N → ∝.( )BN β β−)∼ ))(,0( 12 −N
xxu BN σ
3-)Intra-individuel ()Within(
3-1-:
OLS
OLS:
. . .( ) [2-52]it i it i it iY Y X X w wβ− = − + −
:.
.
.
i
i
i
YXw
i
:
(k ,1)( ,1) ( , ) ( ,1) [2-53]
ww
N N NNT NT k NT
W y W X Wβ ε= +
]2-53 [:1( )w N NX W X XW Yβ −′=
)
:WN:
)]T/JI(I[W TTNN −⊗=
k > kw)(.3-2-:1-:
2-:
1-2
11
X)X(
)()()var(
W
WXXWXXWXX
w
W
′=
′Ω′′= −−
σ
β)
ββ =)( WE)

→ ∝NT→ ∝NT.
→ ∝NTN,T → ∝:
T,N → ∝GLS
.
:
"λ ":
( ) ( ) ( )1N N N NX W X XB X X W y B Yβ λ λ λ−′ ′= + +
( ) ( )( )1N N N NX W B X X W B Yλ λ
−′ ′ = + +
λ
)3 :(
0=λwβ
θλ =GLSβGLS
θ=λEGLSβEGLS
1=λOLSβOLS
∞=λBβ
:Marc LEVAILLANT, op.cité, P15
:.
1-:
3:
1-1-:2uσ:
( )ββ −wN ( )( )12,0 −Nxxw WN σ∼
( )ββ −wNT ∼ ( )( )12,0 −NTxxw WN σ

20 : 0uH σ =
21 : 0uH σ ≠
.:
∼:
:∼2
0 : 0uH σ =:
∼H0:
α :)5%1%.(
1-2-:
]1979,Breusch
Pagan[)59( .OLS:
( )
2
1 1
2
1 1
2 12 1
it
N T
iti t
N T
i t
NTLMN
ε
ε
= =
= =
= − −
∑ ∑
∑∑
:
( )212LM χ→
84.3LM5%
.
(59)Patrick SEVESTRE, op.cité, p 70.
( )( )2
1 wkTN −−χ( )( ) 2
2
1w
wwkTN
σσ
−−
( )( )2
1 wkTN −−χ( ) ( ) 22
2
22
2
wu
bb
wu
bb T
TkNkNσσ
σσσ
σ+
−=+
−
222
2
.w
b
wu
w TT σ
σσσ
σ+
( )( )wb kTNkNF −−− 1,
( )( )wb kTNkNF −−− 1,2w
bTσσ
( )( )α
wb kTNkNcal FF −−− 1,
∼

1-3-Honda:
.]1985,Honda [
BreuschPagan)60(Honda
:
:
1 1.64LM
H0BreuschPagan:96.184.364.1 =
2-:
0iβkiβ
F.2-1-:
:
0 01 02 0 0: ... NH β β β β= = = =
:1H
F:61
( )
1
1
mco mco w w
olsww w
w
e e e eNF e e
N T k
′ ′−−= ′
− −
(N-1)(N(T-1)-kw)
(29) Ibid, p 71.(25) P.Blanchard, Séminaire des données de panels, (France : ERUDITE ,2000), 53.
( )( )2
1 1
21 1
1 12 1
N Titi t
N Titi t
NTLMN
ε
ε
= =
= =
′ = − −
∑ ∑∑ ∑

:mcoe)OLS(
we)within(H0 :
( ) ( )( )( )1% , 5%
1 , 1 wolsw N N T k
F F− − −
<
2-2-(poolability test)::
0 1 2: ...k k kN kH β β β β= = = =
:1H
F:62
( )
( 1)mco mco i i
pooli i
e e e eK NF e e
N T K
′ ′−−= ′
−
K(N-1)N(T-K)
:ie.H0 :
( )( ) ( )( )( )1% , 5%
1 ,pool K N N T KF F
− −<
3-Hausman:
]1978Hausman, [)63(.
3-1-Hausman:
.
3-2-Hausman:
:( ) ti,0:0 ∀=Ε← iti xuH
( ) ti,0:1 ∀≠Ε← iti xuHMundlak
(26) Ibid, p53.(63) Williame GREENE, op.cité, P 289.

Mundlak)64(
GLS
H0H1(Within).:
:wk
1−= kkwHausman:
∼:
1-( )2
1kQ χ −0H⇐.
2-( )2
1kQ χ −1H⇐Mundlak.
:.
)65(.)04:(
-. -. -
. -. -. -. - .
-.
-.
-.
(64) Marc LE VAILLANT, op.cité, P 15.(65) Formation permanente à l’économétrie des données de Panel, op.cite, PP 7-8.
( ) ( )[ ]qVarVarqQ GLSw ββ −′= ( )2
1−kχ
GLSwq ββ −=

:
) (
) (
.:
1-).(...
2-.
3-
.4-
∞→TN∞→NTEGLS.5-
.


17/02/1989 :10/06/1988
:
:
.:
.

:
.
:
.
:
200582.1
1.8%
)5 :(1995 -2010
)()%(
)%(199520002005201095 -
20002000 -2005
2005 -2010
1995 -2005
2000 -2010
28,630,3832,9535,641,51,61,63,3 -
4,755,235,796,35221,92,1 -
2,32,652,953,272,72,22,12,9 -
26,3828,7031,0833,271,61,61,42,5 -
8,959,5610,1310,821,21,21,32,4 -
70,9876,5282,189,81,81,721,662,643,4
:)2004(
)1,81,721,66 ( .

:
.1- :
)GDP ()95-2005 (
GDP)1995.()6 : (
GDP)$()910(GDP)%(
199520002003200592 -0219952003200541,76453,45568,018102,252,73,875,3
25,54133,96223,23138,756 - -93.5
1,0680,9391,3401,8784.45.1365.4
32,98633,33443,81351,7443.06.57 -61.6
17,98719,46824,99228,6823.22.3164.2 :- World Development indicator 2004
-:www.worldbank.org
GDP
3,8%19957%2003
:)8:()GDP()$(.

0.0E+00
2.0E+10
4.0E+10
6.0E+10
8.0E+10
1.0E+11
1.2E+11
95 96 97 98 99 00 01 02 03 04 05
GDP_DZAGDP_LBYGDP_MAR
GDP_MRTGDP_TUN
:
:DZA
LBY
MAR
MRT
TUN
2-:

.
)7 : (1995-2005
GDP)%(
1995
10,5832,414,611,4
50,4 -25,232,929
39,1 -37,452,559,6
2004
9,8 -25,615,912,6
56,6 -28,13,427,8
33,6 -46,353,859,6
2005
8,3 -23,713,312,6
62,3 -29,331,228,2
29,4 -4755,559,21
GDP(%)
1995
..55,158,876,868,662,4
..16,822,310,717,316,9
2922,444,93448,7
2004
..38,8 -81,260,262,7
..14,5 -21,92115,9
25,7 -8039,348
2005
..38,5 -92,462,863,6
..7,2 -22,520,414,4
24,1 -95,043,151
)%(
1995-2005
4,3 -4,2 -3,43,8
3,7 -33,54,34,1 -7,53,75,4
..2,9 -5,52,25,1
..3 -4,84,24,6
4,5 -7,74,24,7
76

2004
2,1 -7,6 -1,99,0
4,4 -12,34,94,0
6,7 -4,74,56,4
..5,9 -15,28,15,2
..4,5 -229 -1,54,6
13,3 -42,58,83,7
2005
5,0 -7,915,2 -3,5
5,5 -2,2 -3,94,2
8,6 -6,85,04,4
..8,6 -27,21,8 -3,6
..6,0 -1513,56,0
10,8 -45,364,7
:World Development Indicators 2004
.. :
.. : :
)GDP (50%GDP
GDP
59%
.
75%199581%
200492,4%200560%GDP
55,1%199538%2004
2005

95%200535%50%
200524,1%
.
:
.
.
)8 : (
GDP($)GDP(%)
19951998200295 -2005
200420052005 -2009
1448,41565,616642,43,63,73,5
- - -2,72,61,5 -
464,4472,04503,20,22,12,4 -
1250,114031454,72,20,70,42,6
2007,92279,62574,53,75,13,34,3
:(2004) World Development Indicators
GDP

)Le deflateur (.
:
3%66
%7067..
)9 :(
)$(910)%(
19952000200595 -052004200505 -09
.
10,4210,12
2960,
20,3799,5910,41
45,83020,41625,414
4,64,53,4134,5114,2 -
.
8,4834,9203,563
12,674,1258,562
10,95,355,55
- - - - - - - -
.
0,5770,653-0.078
0,4820,635-0,15
0,6041,177-0,573
2 -7,79,1436,245 - -
.
4,0729,5025,430
8,20912,40-4,19
10,28820,88210,594
5,04,24,78,83,46,05,4 -
: CNRS Edition, 1996), p 5, (FranceEconomie du MaghrebAbdelkader SIDAHMED,-66
67- Ibid , p47

)$(910)%(
19952000200595 -052004200505 -09
.
5,7858,032-2,2
6,0248,5932,569
10,7214,316
35,9 -4,34,75,23,73,44,75,3-
:-)2004 (World development indicators
-
(www.sesrtcic.org) : :
. :
199426,4 ×71068
) (
90%69
.
68 -505-Abdelkader SIDAHMED op. cité, p43
79

:
)GDS ()GDP()10 :(
GDS($)910GDSGDP
199520002005199520002005
11,7
4,83
0,952
4,64
3,72
23,6
11,4
0,134
5,81
4,62
55,54
4,48
2830,
8,68
6,4
28,1
18,9
8,91
14,1
20,7
44,1
33,4
15,2
17,4
23,8
54,3
11,45
14,9
16,8
22,3
:-)2004 (World Development Indicators
- :www.worldbank.org
28,1%
1995200554,3%33,4%2000
14%23%
2005) -15% (15%GDP
30%GDP70
.
70- Ibid, p42

:
-
.
:)GFCF (
)GFCF (
)11 :(GFCF)$(910GFCFGDP)$(GFCF
19951998200220051995199820022005199519982002200512.2
2.98
0.206
7.07
4.36
12.6
2.99
0.19
7.89
4.93
13.8
2.65
0.305
8.27
5.30
13.6
3.28
0.362
8.84
5.93
29.1
11.7
19.3
21.4
24.2
26.6
11
19
22
24.9
24.7
13.8
31.5
22.9
25.2
13.2
8.46
19.1
17
20.6
3
36
2.85
1.91
6.5-
3.3
18-
5.25
2.79
5.79
7.6
25.7-
7.44-
4.62
2.65-
1.51
0.4-
7.35
2.32
2.94
:)2004 (World Development Indicators

GDP
1995 -200524%11%19%21
%GFCF
.
)9:(GFCF)$ (.
0.0E+00
2.0E+09
4.0E+09
6.0E+09
8.0E+09
1.0E+10
1.2E+10
1.4E+10
95 96 97 98 99 00 01 02 03 04 05
GFCF_DZAGFCF_LBYGFCF_MAR
GFCF_MRTGFCF_TUN
:

)FDI(
) (71
FDIGFCFFDIGDP.
)12( :FDI
GFCFFDI
GDP200220032004199020002004
7
5.5
35.9
5.8
15.3
4
4.8
43.7
22.5
10
4.5
3.9
62.6
7.5
9.9
2.5
2.4
5.8
13.9
62
6.7
1.4
15.6
26.5
60
9.1
2.6
64.2
36.1
61.7
:World Investment Report 2005, op.cité, p 314
FDIGFCF
3,5%22,5%2002-2004
) () ...(
72
71 - World Investment Report 2005, United Nations, New York and Geneva, 200572 - Abdelkader Sid Ahmed, op.cité, p7.

)(73.
:" "
François BOURGUIGNON74
2005""
.
1-:
2728199575
.
-
:
-1-:
73 -Ibid, p20,2174-2005)www.worldbank.org(75-Communication sur le projet de rapport : Les investissements en infrastructures et le rôle des
milieux socio économiques dans l’édification de l’espace euro méditerranéen 4ème sommet des CESLISBONNE, 11éme Session plénière CNES Septembre 1998, p3

)13 :(
)(1994999708000075406051921900199610400024484766060669231001999104000832007605760018997
)(20003793 - -190702260
)(20002830 - -100360
:)2004 (World Development Indicators
1216
.-2-:
2006)UIT ()*(
200576
.
* - .
76 - Rapport de développement des télécommunications dans le monde, Union International desTélécommunications, Genève, 2006, p 3.
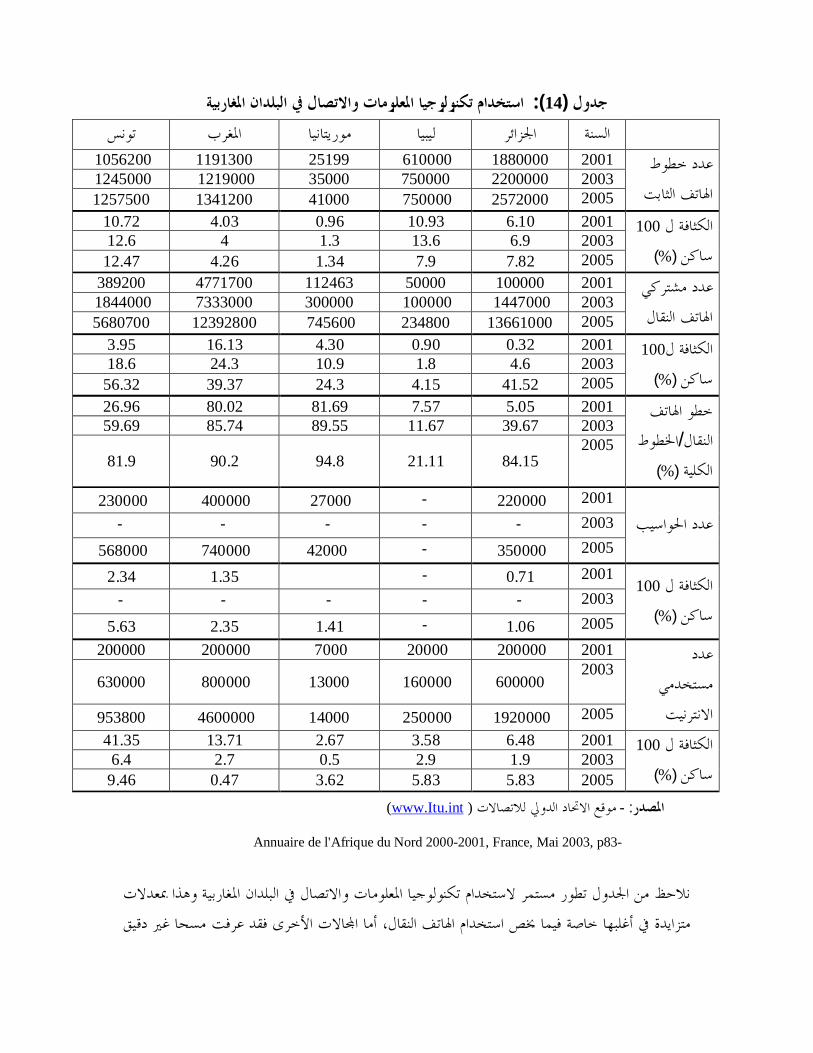
)14 :(
200118800006100002519911913001056200200322000007500003500012190001245000200525720007500004100013412001257500
100
)%(
20016.1010.930.964.0310.7220036.913.61.3412.620057.827.91.344.2612.4720011000005000011246347717003892002003144700010000030000073330001844000200513661000234800745600123928005680700
100
)%(
20010.320.904.3016.133.9520034.61.810.924.318.6200541.524.1524.339.3756.32
/)%(
20015.057.5781.6980.0226.96200339.6711.6789.5585.7459.692005
84.1521.1194.890.281.9
2001220000 -270004000002300002003 - - - - -2005350000 -42000740000568000
100
)%(
20010.71 -1.352.342003 - - - - -20051.06 -1.412.355.6320012000002000070002000002000002003
60000016000013000800000630000
20051920000250000140004600000953800
100
)%(
20016.483.582.6713.7141.3520031.92.90.52.76.420055.835.833.620.479.46
:- )www.Itu.int(
Annuaire de l'Afrique du Nord 2000-2001, France, Mai 2003, p83-

.
:10
)15 : (2002
0.370.420.140.330.41
:2003 :
200322
-3-:
)16 : (:910$
1993199820042005
2.3 -
0.5620.4
2.31.37 - -
0.6270.03 --
: :www.worldbank.org

.
)17 ( :1996
)/(91018.4170.211.57.5
)(310
453693511659011031775
)(13913001
)(22000006510000
)(577297158418778
)(2.912.13.61.92.9
:)2004(
)(90%77.
-:
77- Communication sur le projet de rapport : Les investissements en infrastructures et le rôle desmilieux socio-économiques dans l’édification de l’espace euro méditerranéen, op.cité, p63.

-1 -:
:
)18 : (
GDP19984.13.72.74.45.520003.53.22.54.75.620034.14.14.25.15.419989.759.24.37.12000966.54.26.92003105.914.367.2
)$(
1999991192150169200011528626641962003150206467218719954752401486898568
:- :www.who.int
World development indicators (2004) -
GDP
5,6%2000
2,5%2000GDP
.
-2 -:
:

)19 : (
GDP)%(19955,67,154,96,82004 - -3,46,38,1
)%(
199517,619,816,122,617,42004 - -16,627,818,2
:-( www.uis.unesco.org)
-)2004(
.
)20 : (19952001
0.359 -0.1030.251
0.379
-0.347 -0.0980.2220.445
-
:world investment report, op,cité, p291
:01.

2-:Heritage
10 10
: .
151
)(5
)(78
2006 .
)21 : (2006
43.6423434343.46
53.6414455544.16
42.8232324443.08
54.12.51243433.53.21
53.92.524423333.24 :Heritage
www.heritage.org/research/features/index/
3.08
4.1420062.984.401995
4.164.951995-2006 .
78 -14152005] :[ 276.

.

:
.
:
.
:1-5:
)22 :(
DZALBYMARMRTTUN
12345
:
2-19952005
1995 ) (Heritage1995.
:
:

: :)GFCF ()
()LGFCF(:
)GDP( :) ()LGDP(
)EF:(15
1
)LEF()EOPEN( :
GDPit10079
)LEOPEN.()GDS:()LGDS (
.
80
)81(
.
79 - 275.80-:
1- Pierre BLANCHARD, Etude de la consommation (en volume) d’essence, séminaire d’économétrie
des panels, janvier 2000.
2- Mourad AYOUZ, Estimation économétrique des fonctions d’importation de produits agricoles de
l’Afrique de l’Ouest, 2001.
3- Stéphanie JAMET, Allégements généraux de cautisations sociales et emploi peu qualifier, 2005.
Ed, 2004), p 421.thHill Companies, 4-: The GLSraw, (USAasic econometricsB(16) Damodar GUJARATI,

::
itit4it3it2it10it LgdsLeopenLefLgdpLgfcf ε+β+β+β+β+β=
:i(i=1 , ….,5)
t(t=1995,….2005)
:.
:
.Eviews 4.0
ADF) ((i)Shwarz82
4T.
(i))7--140 (IPS
)7--142 (MW.
:]2003,IPS[IPSZ
WtbarZtbarZ5%
82 -:(France:Analyse des séries temporelles en économieRégis BOURBONNAIS et Michel TERRAZA,
PUF, 1er ED, 1998), p229

MATLAB 6.5*)7--140 (:)23 :(]2003IPS,[
WtbarZtbar5%
LGFCF1.381.58- 1.64H0
LGDP6.246.83- 1.64H0ß)(
LEF- 3.32- 3.93- 1.64H0
LEFIPS
LEOPEN2.142.36- 1.64H0ß
LGFCFLGDP)(LGDS- 1.11- 1.24- 1.64H0ß)(
:
:]1999,WuMaddala []2001Choi,[
PMW2χ
df=2N )df=10 (WuMaddalaChoi ZZMWZ
5%6.5Matlab)7- -142 (
)24 :(]1999,WuMaddala[]2001Choi,[
MWPZMW
LGFCF11.9918.300.441.64H0
LGDP6.3918.30- 0.801.64H0ß
LEF6.3418.30- 0.811.64H0ß
LEOPEN11.3418.300.301.64H0ß
LGDS11.3718.301.201.64H0ß
:
* -)8 (144.

.:
1-)ρ (
i jρ ρ≠i j.2-LevinLin(LL)*
,m Tµ %
*
,m Tσ %)31,2 =m (T~
LevinLin25 =T~1p1TT~ −−=T~T⟩
T = 11.
: SAS
6.12(*).
:(LGDP)
(LEF)(LGDS)
)Between((N – kb)
N = kb = 5Between.
1-)Within:(OLS
NT
)GFCF.(
* -)9 (145.

( ) ( ) ( )2 2 2
w
0.18 0.87 0.14
1.86 3.18 2.58
0.47 , 0.44 , 15.61 , 0.0135 , 11 , 55 , df 47
twlgfcf wlgdp wlef wlgds
t stat
R R FN T NT
σ
ε= − + +
− −
= = = =
= = = =
( ) ( )2 2 2
w
0.32 0.76
3.51 2.65
0.40 , 0.37 , 17.60 , 0.0155 , 11 , 55 , df 48 , DW=1.13
twlgfcf wlgdp wlef
t stat
R R FN T NT
σ
ε= − +
− −
= = = == = = =
83:
:-:
t)LGDP (2
10%t
)LEF()LGDS (t5%
R2
47%
53%F
F5%t
LGDPt
r
GDPGDSr =0.98
.GDS84 :
18)10 (147.19-)10 (147.

( ) ( )2 2
_ 0.42 _ 0.48 _
4.70 1.55
0.40 , 0.38 , 17.77 , 5 , 1154 , df 48 , DW=1.66
twlgfcf s wlgdp s wlef s
t stat
R R F N TNT
ε= − +
− −
= = = = == =
:-:
LGDSt
t5%
LGDPLEF
)GFCF(R240%
)GDP ()EF(60%
FF5%
)DW(Within)BLUE(
.OLSρ
OLS85.(BLUE)
OLS:86
:-:
t
SAS)IML (
85 - Damodar GUJARATI, op.cité, p478.86-)10 (147.

Wn)55.55 ()54.1 ()54.2(
.t
)WLGDP (t5%t )WLEF()GDP (
40%
)EF (F
5%)DW ()Within ()BLUE .(
-:
87
88(GDP)
1%)GFCF (0.42%
)r =0.97(
.
2- )Between: (
) ((OLS)NN
.
87 - Mourad AYOUZ, estimation économétrique des fonctions d’importation de produits agricoles del’Afrique de l’Ouest (France : CNRS, 2004), p12
23 - Damodar GUJARATI, op.cité, p421.

( ) ( ) ( )2 2 2
b
1.30 0.94 1.32
0.98 18.85 3.29
0.99 , R 0.99 , 190.48 , 0.0245 , 11 , 55 , df 2 , DW=1.71
tmlgfcf mlgdp mlef
t stat
R FN T NT
σ
ε= + − +
− −
= = = =
= = = =
89:
:-:
tt5%
t
)MLGDP ()MLEF (t
)GFCF (99%
R2FF5%
)DW ()DW ()n=5<15(2
. -:
--
(GDP)1%
(GFCF)
0.94%
)EF (
24-)10 (147.

( ) ( ) ( )2 2
1.40 0.93 1.17
2.61 45.93 7.61
0.97 , R 0.97 , 1132.78 , 511 , 55 , 52 , DW=0.60
tlgfcf lgdp lef
t stat
R F NT NT df
ε= + − +
− −
= = = == = =
)∗()GFCF((EF)1%
)GFCF(1.32%
)* (.
3-)OLS:(OLS
90:
:-:
t
t5%
)GDP ()EF ()GFCF (97%R2
FF5%
∗ :92.* - :1 -.
2- Ayoub Hassen et Kamel Abdelhak, IDE, Croissance et Gouvernance dans les pays Sud de laméditerranée : une estimation sur donné de panel,2005.
25-)10 (147.

( ) ( ) ( )2 2
_ 1.77 0.91 _ 1.17 _
2.27 32.45 5.51
0.99 , R 0.99 , 52730.71 , 511 , 54 , 51 , DW=1.87
tlgfcf s lgdp s lef s
t stat
R F NT NT df
ε= + − +
− −
= = = == = =
-)DW ()OLS(.
(OLS)
:91
:-:
t
5%
R299%
)GDP()EF(FF
-)DW (2)DW (
)BLUE (OLS
. -:
)GDP(1%
)GFCF (0.91%
91--)10 (147.

( ) ( ) ( )2 2 2
g
3.85 0.79 0.55
3.40 18.12 2.45
0.99 , 0.99 , 18672.88 , 0.027
0.75 , 5 , 11 , 55 , df 52
tlgfcf lgdp lef
t stat
R R F
N T NT
σ
θ
ε= + − +
− −
= = = =
= = = = =
)EF (1%
)GFCF (1.17%
.
4-)EGLS(:92:
:-:
t5%
)GDP ()EF ()GFCF (
R299%
F
EGLS
. -:
)GDP (1%
92-)10 (147.

)GFCF(0.5%)EF (1%
0.55%
.
BetweenWithin
93:2
2b
w
σσ
2
20.024 1.60.015
b
w
σσ
= =
.5-:5-1 -:
-:2
0: 0uH σ =
2
1 : 0uH σ ≠2
2b
w
T σσ
Fcal
( )11 0.02417.6
0.015==
2
2b
w
T σσ
=Fcal
:( )
( )
5%2 , 48
1%2 , 48
3.19
5.10
FF
=
=
:( )
( )
5%2 , 48
1%2 , 48
cal
cal
F FF F
>
>
H0.
93- Mourad AYOUZ, op.cite, p26.

- )(Pagan , Breusch:LM2(Breusch et Pagan)SAS
SASDATAPROC
SAS94.
:LM2 = 8.85
LM2 > 3,845%Ho
.LM2 > 6,631%Ho.
:Ho
) (.
5-2-:-:
0 01 02 05 0: ...H β β β β= = = =
:1H
:25.66olswF =
:( )
( )
5%
4 , 48
1%4 , 48
2.61
3.83
FF
=
=
:( )
( )
5%4 , 48
1%4 , 48
olsw
olsw
F FF F
>
>
H0. -(poolability test):
0 1 2 5: ...k k k kH β β β β= = = =
:1H
94 P.Blanchard, op.cite, 26.

( ) ( ) ( )2 2 2
w
0.31 0.75 0.013
3.31 2.55 0.12
0.40 , 0.36 , 11.51 , 0.0155 , 11 , 55 , df 47 , DW=1.13
twlgfcf wlgdp wlef wleopen
t stat
R R FN T NT
σ
ε= − + +
− −
= = = == = = =
:12.56poolF =
:( )
( )
5%12 , 40
1%12 , 40
2.00
2.66
FF
=
=
:( )
( )
5%12 , 40
1%12 , 40
pool
pool
F FF F
>
>
H0.
:H0
.
:)LEOPEN(
1-Within:(OLS):95
95-)11 (156.

( ) ( )2 2
_ 0.41 _ 0.48 _ 0.035 _
4.28 1.50 (0.27)
0.40 , 0.37 , 11.69 , 5 , 1154 , df 47 , DW=1.66
twlgfcf s wlgdp s wlef s wleopen s
t stat
R R F N TNT
ε= − + +
− −
= = = = == =
:-:
tt
)WLGDP ()WLEF (5%
t)LEOPEN (
)GDP ()EF ()GFCF (40%60%
)EOPEN (F5% -)DW(
.)OLS (:96
:-:
t.t
)WLGDP (t5%t)WLEF (
)wLEOPEN ()GDP (
96--)10 (156.

40%
60%)EF ()EOPEN ()GFCF (
F5%)DW (Within
.)LEOPEN ()Within :(
)25 :(Within
F
LGDP, LEF0.39520.197
Fcal=0.083
LGDP,LEF,LEOPEN0.39630.132
LEOPEN0.00110.001
0.576470.012
0.97250 :
5%(1,47) 4.08calF F< =LEOPEN
)Within(.
-:
)GDP (1%
)GFCF(0.31%
r=0.97
)*( .
* -103.

( ) ( ) ( )2 2 2
b
0.28 0.98 1.30 0.16
0.03 4.94 2.30 (0.19)
0.99 , R 0.99 , 367.18 , 0.0465 , 11 , 55 , df 1 , DW=1.81
tmlgfcf mlgdp mlef mleopen
t stat
R FN T NT
σ
ε= − + − + +
− − −
= = = =
= = = =
2- )Between: (97:
:-:
tt5%
df=N-kb=1)N=5(98
)LGDP ()LEF(t2
)LEOPEN (t2
)GFCF (99%
R2FF
5%
)DW (2
)DW ()n=5<15( .)LEOPEN (
)Between .(
32-)11 (156.98- William GREENE, trad. Dedier SCHLACTHER et autres, op.cite, p 271.

)26 :(Between
F
LGDP, LEF9.23524.617Fcal=0.054 LGDP,LEF,LEOPEN9.27533.091
LEOPEN0.04010.040
0.73810.738
10.0134 :
5%(1,1) 161calF F< =LEOPEN
)Between(.
-:
(GDP)1%
(GFCF)0.98%
)GFCF((EF)1%
)GFCF(1.30%
)r =-0.26 .(
.

( ) ( ) ( ) ( )2 2
3.63 0.88 1.22 0.23
2.82 27.01 8.01 1.90
0.97 , 0.97 , 794.09 , 5 , 11 55 , 51 , DW=0.61
tlgfcf lgdp lef leopen
t stat
R R F N TNT df
ε= + − − +
− −
= = = = == =
( ) ( )2 2
_ 3.15 0.89 _ 1.15 _ 0.18 _
2.76 (27.54) 5.52 (-1.63)
0.99 , 0.99 , 40833.78 , 5 , 1154 , df 50 , DW=1.89
tlgfcf s lgdp s lef s leopen s
t stat
R R F N TNT
ε= + − + +
− −
= = = = == =
3-)OLS:(99:
:-:
tt5% 10%
)GDP ()EF ()GFCF (
)EOPEN (98%
R2FF
5%
)DW ()OLS (
:100
99-)11 (156.100-)10 (156.

:-:
tt
5%
)LEOPEN_S (t
)GDP ()EF ()GFCF (99%
FF
5%
)DW ()OLS ()BLUE .(
)LEOPEN()OLS.(
)27 :()OLS(
F
LGDP, LEF3381.17231127.057Fcal=2.75 LGDP,LEF,LEOPEN3381.2274845.306
LEOPEN0.05510.0551.035500.020
3382.26254 :
5%(1,50) 4.03calF F< =
)LEOPEN()OLS(.
-:
)GDP(1%

( ) ( ) ( ) ( )2 2 2
6.98 0.70 0.65 0.20
4.51 12.65 2.53 2.16
=0.99 , =0.99 , 65588.83 , =0.023 , =0.82
5 , 11 , 55 , df=51
t
g
lgfcf lgdp lef leopen
t stat
R R FN T NT
σ θ
ε= + − − +
− − −
=
= = =
)GFCF (0.89%
)EF (1%
1.15%
.
4-)EGLS:(101:
:- :
tt5%
)GFCF (99%F
5%
)LEOPEN (.
101-)11 (156.

)28 :()EGLS(
F
LGDP, LEF1534.1083511.369Fcal=175137.529 LGDP,LEF,LEOPEN4511.44641127.861
LEOPEN2977.33812977.338
0.876510.017
4512.32255 :
5%(1,51) 4.02calF F> =)LEOPEN (
)EGLS(.
-:
)GDP(1%
)GFCF(0.70%
)EF (
)EOPEN(1%
0.65%0.20%
.
BetweenWithin
:2
20.046 3.060.015
b
w
σσ
= =
.

5-:5-1 -:
-:2
2b
w
T σσ
Fcal
( )11 0.04633.73
0.015==
2
2b
w
T σσ
=Fcal
:( )
( )
5%1 , 47
1%1 , 47
4.08
7.31
FF
=
=
:( )
( )
5%1 , 47
1%1 , 47
cal
cal
F FF F
>
>
H0.
- )(Pagan , Breusch: :LM2 = 15.52
LM2 > 3,845%H0
.LM2 > 6,631%H0.
:H0
.
5-2-:-:
0 01 02 05 0: ...H β β β β= = = =
:1H
:22.70olswF =
:( )
( )
5%4 , 47
1%4 , 47
2.61
3.83
FF
=
=

:( )
( )
5%4 , 47
1%4 , 47
olsw
olsw
F FF F
>
>
H0. -(poolability test):
0 1 2 5: ...k k k kH β β β β= = = =
:1H
:10.18poolF =
:( )
( )
5%16 , 35
1%16 , 35
2.01
2.70
FF
=
=
:( )
( )
5%16 , 35
1%16 , 35
pool
pool
F FF F
>
>
H0.
:H0
)GDP ()EF(
.
:
Hsiao)1986(102
.
(37) Christophe HURLIN, L’économétrie des données de panel" Modèleslinéaires simples"(France :Ecole Doctorale Edocif), p10.
Hsiao)1986 ()12.(

:
:)29 :(
)LGFCF()LGFCF(
WithinBetweenOLSEGLSWithinBetweenOLSEGLS
1.30)0.98(
1.77)2.27(
3.85)3.40(
0.28 -)0.03 -(
3.15)2.76(
6.98)4.51(
LGDP0.42)4.70((*)
0.94)18.85(
0.91)32.45(
0.79)18.12(
0.41)4.28(
0.98)4.94(
0.89)27.5(
0.70)12.65(
LEF0.48 -)1.55 -(
1.32 -)3.29 -(
1.17 -)5.51 -(
0.55 -)2.45 -(
0.48 -)1.50 -(
1.30 -)2.30 -(
1.22 -)8.5 -(
0.65 -)2.53 -(
LEOPEN0.035)0.27(
0.16)0.19(
0.18 -)1.6 -(
0.20 -)2.16 -(
(*)t-Student
:
83
200570%
15%3%

2%1995 -2005
1.8%
2005102.25747
586067
149
))29((
50%
59%
GDP
)r =0.97()GDP% ((GFCF%)
))13 (164(

62%2004
" "8502.5%
)MENA(50%
))29((

.
)GDP ()EF (
)GDS ( .

:
)(
:1-
.2-(GFCF)
).(
3-) (
.4-)GDP(
.5-)GDP()EF (
.6-
.7-
) ( .


:
I-:1.
.
2.
.3.
.
4.) (
.5.
.
6..
7.)GDP ()EF ( ) (.
8. .9..
10.
.
II -::
E .
E)PVAR.(


I.:
.:1.) :1
2002(.2. ) : 1
2002(.3. ) :
2(.
4. ) :41992(.
5.) :1998(.
6.):1994(.7.) :
1997(.
8.) :2004(.
9. ) :2000(.
.:
10.2003 :2003.
11. :]14152005.[

.:
12.
2000.13.
1992.
.:14.
2003-2004.
II.:
.:
15. BOURBONNAIS Régis et Michel TERRAZA, Analyse des séries temporellesen économie (France: PUF, 1er ED, 1998).
16. BREMOND Janine, Mieux comprendre l'économie, (France : Edition Liris,1993, 2ème Ed).
17. DUHARCOURT Pierre, La fonction d'investissement, (France : Serey, 19701).18. GREENE William, trad. Dedier SCHLACTHER et autres, Econométrie,
(France: Pearson Education, 5ème Ed, 2005).19. GUJARATI Damodar, Basic econometrics, (USA : The GLSraw-Hill
Companies, 4th Ed, 2004).20. JOHNSTON Jack, Méthodes économétriques, Trad, Bernard GUERRIEN,
(France : Economica, 2ème tome, 1988).21. MADDALA .G.S, Introduction to econometrics, (USA : Macmillan Publishing
Company, 2nd Ed, 1992).22. SAMUELSON Alain, Les grands courants de la pensée économiques, (Algérie :
OPU, 2ème Ed).23. SEVESTRE Patrick, Econonmétrie des données de panel, (France : Dunod,
2002).24. SIDAHMED Abdelkader, Economie du Maghreb, (France : CNRS Edition,
1996).25. VILLIEU Patrick, Macroéconomie : l'investissement, (France : La découverte,
2000).

.:
26. AYOUZ Mourad, Estimation économétrique des fonctions d’importation deproduits agricoles de l’Afrique de l’Ouest, (France : CNRS), 2001.
27. BLANCHARD Pierre, Etude de la consommation (en volume) d’essence,séminaire d’économétrie des panel (France: université Paris 12 VAL DEMARNE), janvier 2000.
28. HASSEN Ayoub et ABDELHAK Kamel, IDE, Croissance et Gouvernance dansles pays Sud de la méditerranée : une estimation sur donné de panel, 2005.
29. HURLIN Christophe et Valérie MIGNON, Synthèse de tests de racine unitairesur données de panel, Université d’Orléans, Janvier 2005.
30. JAMET Stéphanie, Allégements généraux de cautisations sociales et emploi peuqualifier, (France : DARES), 2005.
31. LEVAILLANT Marc, Model à erreurs composées et mock-up mixte, AtelierSAS/MATISSE, (France : CNRS-UMR 8052,Jeudi 07 Avril 2005).
32. SALENIE.B, Guide pratique des séries temporelles, Economie et Prévision,1999.
33. Communication sur le projet de rapport : Les investissements en infrastructureset le rôle des milieux socio économiques dans l’édification de l’espace euroméditerranéen 4ème sommet des CES LISBONNE, 11éme Session plénière CNESSeptembre 1998.
34. Formation permanente à l’économétrie des données de Panel, Ecole Doctorale enSciences Economiques, Gestion et Démographie, (France: UniversitéMontesquieu-Bordeaux, 2005).
35. Rapport de développement des télécommunications dans le monde, UnionInternational des Télécommunications, Genève, 2006.
36. World Investment Report 2005, United Nations, New York and Geneva, 2005
.:
37. ARTHUR Charpentier, cours des séries temporelles, théorie et applications,Université paris – dauphine, 2004.
38. HURLIN Christophe, L’économétrie des données de panel " Models linéairessimple"(France : Ecole Doctorale Edocif)

III. :
39.Microsoft Encarta2005
40.2004.
41.)2004 ([World Development indicators 2004]
42.:www.worldbank.org
43.www.sesrtcic.org
44. :www.Itu.int
45. :www.uis.unesco.org
46.Heritage:www.heritage.org
47. :.who.orgwww
200320042005 GFCF GDS
" """) ∗ (
SPSS ..
∗-1n

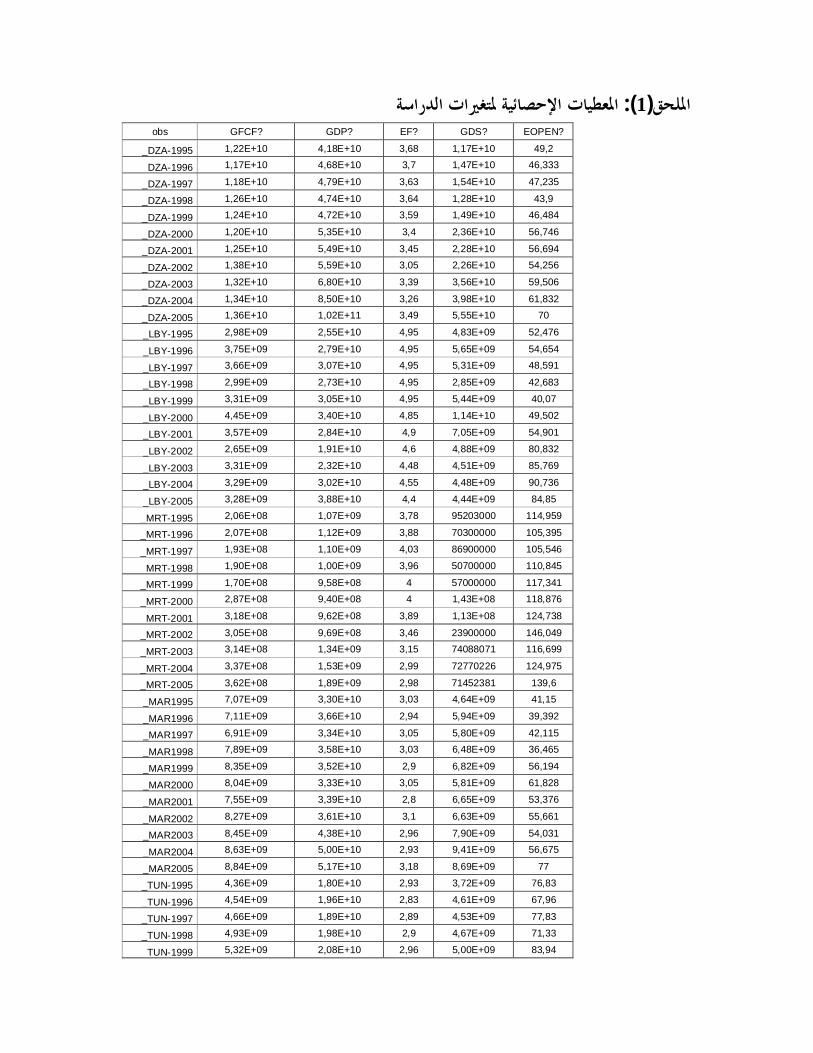
)1 :(obs GFCF? GDP? EF? GDS? EOPEN?
_DZA-1995 1,22E+10 4,18E+10 3,68 1,17E+10 49,2
_DZA-1996 1,17E+10 4,68E+10 3,7 1,47E+10 46,333
_DZA-1997 1,18E+10 4,79E+10 3,63 1,54E+10 47,235
_DZA-1998 1,26E+10 4,74E+10 3,64 1,28E+10 43,9
_DZA-1999 1,24E+10 4,72E+10 3,59 1,49E+10 46,484
_DZA-2000 1,20E+10 5,35E+10 3,4 2,36E+10 56,746
_DZA-2001 1,25E+10 5,49E+10 3,45 2,28E+10 56,694
_DZA-2002 1,38E+10 5,59E+10 3,05 2,26E+10 54,256
_DZA-2003 1,32E+10 6,80E+10 3,39 3,56E+10 59,506
_DZA-2004 1,34E+10 8,50E+10 3,26 3,98E+10 61,832
_DZA-2005 1,36E+10 1,02E+11 3,49 5,55E+10 70
_LBY-1995 2,98E+09 2,55E+10 4,95 4,83E+09 52,476
_LBY-1996 3,75E+09 2,79E+10 4,95 5,65E+09 54,654
_LBY-1997 3,66E+09 3,07E+10 4,95 5,31E+09 48,591
_LBY-1998 2,99E+09 2,73E+10 4,95 2,85E+09 42,683
_LBY-1999 3,31E+09 3,05E+10 4,95 5,44E+09 40,07
_LBY-2000 4,45E+09 3,40E+10 4,85 1,14E+10 49,502
_LBY-2001 3,57E+09 2,84E+10 4,9 7,05E+09 54,901
_LBY-2002 2,65E+09 1,91E+10 4,6 4,88E+09 80,832
_LBY-2003 3,31E+09 2,32E+10 4,48 4,51E+09 85,769
_LBY-2004 3,29E+09 3,02E+10 4,55 4,48E+09 90,736
_LBY-2005 3,28E+09 3,88E+10 4,4 4,44E+09 84,85
_MRT-1995 2,06E+08 1,07E+09 3,78 95203000 114,959
_MRT-1996 2,07E+08 1,12E+09 3,88 70300000 105,395
_MRT-1997 1,93E+08 1,10E+09 4,03 86900000 105,546
_MRT-1998 1,90E+08 1,00E+09 3,96 50700000 110,845
_MRT-1999 1,70E+08 9,58E+08 4 57000000 117,341
_MRT-2000 2,87E+08 9,40E+08 4 1,43E+08 118,876
_MRT-2001 3,18E+08 9,62E+08 3,89 1,13E+08 124,738
_MRT-2002 3,05E+08 9,69E+08 3,46 23900000 146,049
_MRT-2003 3,14E+08 1,34E+09 3,15 74088071 116,699
_MRT-2004 3,37E+08 1,53E+09 2,99 72770226 124,975
_MRT-2005 3,62E+08 1,89E+09 2,98 71452381 139,6
_MAR1995 7,07E+09 3,30E+10 3,03 4,64E+09 41,15
_MAR1996 7,11E+09 3,66E+10 2,94 5,94E+09 39,392
_MAR1997 6,91E+09 3,34E+10 3,05 5,80E+09 42,115
_MAR1998 7,89E+09 3,58E+10 3,03 6,48E+09 36,465
_MAR1999 8,35E+09 3,52E+10 2,9 6,82E+09 56,194
_MAR2000 8,04E+09 3,33E+10 3,05 5,81E+09 61,828
_MAR2001 7,55E+09 3,39E+10 2,8 6,65E+09 53,376
_MAR2002 8,27E+09 3,61E+10 3,1 6,63E+09 55,661
_MAR2003 8,45E+09 4,38E+10 2,96 7,90E+09 54,031
_MAR2004 8,63E+09 5,00E+10 2,93 9,41E+09 56,675
_MAR2005 8,84E+09 5,17E+10 3,18 8,69E+09 77
_TUN-1995 4,36E+09 1,80E+10 2,93 3,72E+09 76,83
_TUN-1996 4,54E+09 1,96E+10 2,83 4,61E+09 67,96
_TUN-1997 4,66E+09 1,89E+10 2,89 4,53E+09 77,83
_TUN-1998 4,93E+09 1,98E+10 2,9 4,67E+09 71,33
_TUN-1999 5,32E+09 2,08E+10 2,96 5,00E+09 83,94

)1(
)2 :(--1-:
Y:Y = C + I + G + (x - M) [1]
:C = a + by
a :.b :.
C[1]:y = a + by + I + G + (X - M)y(1-b) = a + I + G + (X - M)
))((1
1 MXGIab
y −+++−
= [2]
I00I∆
00 II ∆+∆yy + ∆y [2]:
)(1
100 MXGIIa
byy −++∆++
−=∆+ [3]
[3][2]:
00 IkIb1
1y ∆=∆−
=∆
0 < b < 11b1
1>
− :
0Iy ∆>∆
b11k−
=)b(
.
obs GFCF? GDP? EF? GDS? EOPEN?
_TUN-2000 5,11E+09 1,95E+10 2,94 4,62E+09 75,2
_TUN-2001 5,23E+09 2,00E+10 2,99 4,66E+09 80,95
_TUN-2002 5,30E+09 2,10E+10 2,89 4,41E+09 92,19
_TUN-2003 5,60E+09 2,50E+10 2,91 5,50E+09 90,25
_TUN-2004 5,76E+09 2,81E+10 2,94 6,05E+09 77,15
_TUN-2005 5,93E+09 2,87E+10 3,14 6,40E+09 99
ySs
∆∆
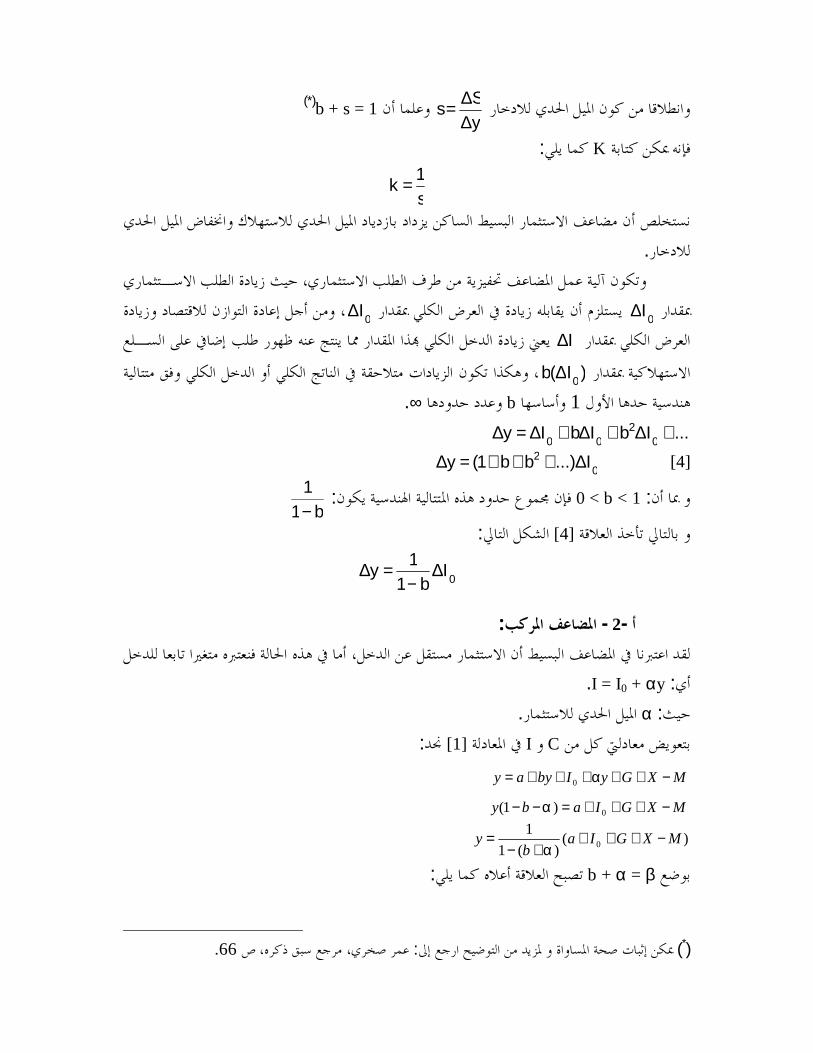
=b + s = 1)*(
K:
s1k =
.
0I∆0I∆
I∆
)I(b 0∆
1b∞....IbIbIy 0
200 +∆+∆+∆=∆
02 I...)bb1(y ∆+++=∆ [4]
:0 < b < 1 :b1
1−
[4]:
0Ib1
1y ∆−
=∆
-2-:
:I = I0 + αy. :α.
CI[1]:
MXGyIbyay −+++++= α0
MXGIaby −+++=−− 0)1( α
)()(1
10 MXGIa
by −+++
+−=
α
b + α = β:
)* ( :66.

][1
10 MXGIay −+++
−=
β [5]
β103
yyyIII 00 ∆+→⇒∆+→
:
][1
100 MXGIIayy −++∆++
−=∆+
β [6]
)6 ()5 (:
00 IkI1
1y ∆′=∆β−
=∆ [7]
β−=′
11k.
-: -1-
y0t=1
)0I∆(t=1y0
) 0I∆ ( .
( )0I∆t=2 )I(b 0∆
)I(b 0∆t=2:
0002 IbIyy ∆+∆+=
t=3:
02
0003 IbIbIyy ∆+∆+∆+=
t = T:
01T
1TT Ibyy ∆+= −−
01T
02
000T Ib...IbIbIyy ∆++∆+∆+∆+= −
103.
y1
y2

01T2
0T I)b...bb1(yy ∆++++=− − [8][8]b:
0T1T2
0T I)bb...bb(b)yy( ∆++++=− − [9]
[9][8]:T
000T0T bIIb)yy()yy( ∆−∆=−−−
0T
0T I)b1()b1)(yy( ∆−=−−
b1b1Iy
T
0 −−
∆=∆
0Iky ∆′′=∆ [10]
:b1
b1kT
−−=′′.
-2-:
0I∆
t=1:
001 Iyy ∆+=
)I(b 0∆
0I∆t=2:
0012 IIbyy ∆−∆+=
00002 IIbIyy ∆−∆+∆+=
002 Ibyy ∆+=
t=2(y2)(y0)
t=1:
0012 IIbyy ∆−∆=−
0I)1b(yy 012 <∆−=−
t=30I)1b(b ∆−
y3:
023 I)1b(byy ∆−+=
0003 I)1b(bbyyy ∆−++=
02
03 Ibyy ∆+=
y0y2

:
01T
0T Ibyy ∆+= −
:
01T Iby ∆=∆ −
0* Iky ∆=∆ [11]
)3 :(.
AB( )n,m( )q,p
(Kronecker)BA ⊗( )nq,mp:baBA ij=⊗
:ija.:
2 22 2
1 23 3 4 4
1 3 43 3 4 4
2 12 22 2
a b a bc d c d
a b a b a bc d c d c d
a b a bc d c d
− ⊗ =
2 N T NTI I I− ⊗ =
:1-ABBA ⊗≠⊗
2-( ) ( )CBCACBA ⊗+⊗=⊗+
3-( )( ) BDACDC.BA ⊗=⊗⊗
4-( ) 111 BABA −−− ⊗=⊗
5-( ) BABA ′⊗′=′⊗

)4 :(-LevinLin
:Christophe HURLIN et Valerie MIGNION, Une synthese des tests de racine unitaire surdonnées de panel, (France: Université d'Orleans, 2005), p13.
-IPS
:Ibid, p20

)5 :(Ω.
:
ε+= Bxy( ) ( ) ( ) ( )1,NT1,KK,NT1,NT
:( ) 0x =εΕ( ) Ω=εxVar
:( )
( ) ( )
( )BW
BW
TJI
TJII
TJ
TJII
T1TJ
TJII
JTJ
TJII
JII
JIJI
JII
2u
2w
2w
2w
2u
2w2
w
TN2
w
2u
2wT
TN2w
T2w
2u
2wT
TN2w
2w
2uTT
TN2w
T2w
2uTT
NN2w
T2w
2u
TN2w
TN2uTN
2w
TN2uNT
2w
σ+σ+σ=
σσ+σ
+σ=
⊗
σσ+σ
+
−⊗σ=
σσ+σ
+
−⊗σ=
σσ
++
−⊗σ=
σσ
++−⊗σ=
σσ
+⊗σ=
⊗σ+⊗σ=
⊗σ+σ=Ω
( )2u
2w Tσ+σ2
wσΩ
)6 :(Kruskal
KruskalOLSGLS∗∗∗ +β= uxy
:( ) ∗∗ σ= IuVar 2H:
HXX ∗∗ =Γ

)7 :()MATLAB(-IPS:
Lgfcf
[ADF]=ADF_Individual(y,2,[3 1 0 3 0],3)
[results]=Test_IPS(y,2,3)
tbar: -0.7705Wbar: 1.3846Wbar_pvalue: 0.9169Zbar: 1.5864Zbar_pvalue: 0.9437critical: [-2.3263 -1.6449 -1.2816]tbar_DF: -1.3462Zbar_DF: 0.3412Zbar_DF_pvalue: 0.6335pi: [5x1 double]tstats_ind: [5x1 double]pmax: 3Ti: [5x1 double]model: ' Model with intercept: Model 2'
Lgdp
[ADF]=ADF_Individual(y,2,[3 1 2 2 0],3)
[results]=Test_IPS(y,2,3)
tbar: 1.6547Wbar: 6.2463Wbar_pvalue: 1.0000Zbar: 6.8313Zbar_pvalue: 1.0000critical: [-2.3263 -1.6449 -1.2816]tbar_DF: 0.3972Zbar_DF: 4.1117Zbar_DF_pvalue: 1.0000pi: [5x1 double]tstats_ind: [5x1 double]pmax: 3Ti: [5x1 double]model: ' Model with intercept: Model 2'
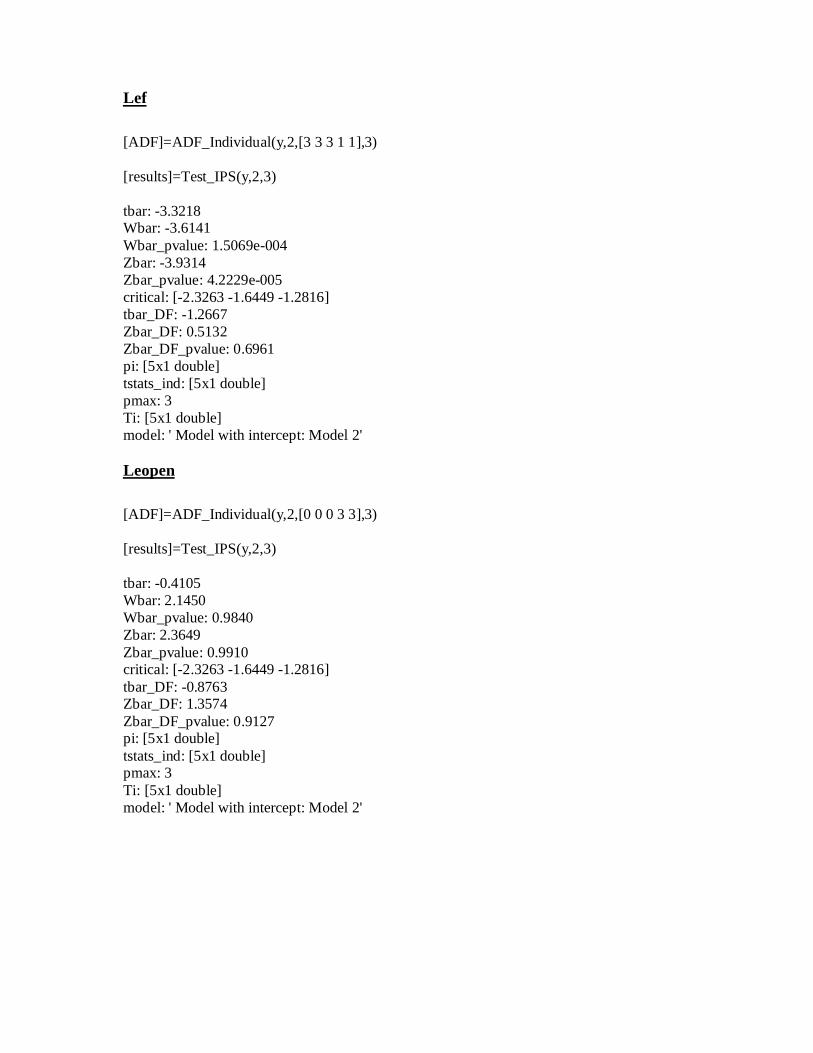
Lef
[ADF]=ADF_Individual(y,2,[3 3 3 1 1],3)
[results]=Test_IPS(y,2,3)
tbar: -3.3218Wbar: -3.6141Wbar_pvalue: 1.5069e-004Zbar: -3.9314Zbar_pvalue: 4.2229e-005critical: [-2.3263 -1.6449 -1.2816]tbar_DF: -1.2667Zbar_DF: 0.5132Zbar_DF_pvalue: 0.6961pi: [5x1 double]tstats_ind: [5x1 double]pmax: 3Ti: [5x1 double]model: ' Model with intercept: Model 2'
Leopen
[ADF]=ADF_Individual(y,2,[0 0 0 3 3],3)
[results]=Test_IPS(y,2,3)
tbar: -0.4105Wbar: 2.1450Wbar_pvalue: 0.9840Zbar: 2.3649Zbar_pvalue: 0.9910critical: [-2.3263 -1.6449 -1.2816]tbar_DF: -0.8763Zbar_DF: 1.3574Zbar_DF_pvalue: 0.9127pi: [5x1 double]tstats_ind: [5x1 double]pmax: 3Ti: [5x1 double]model: ' Model with intercept: Model 2'

Lgds
[ADF]=ADF_Individual(y,2,[2 3 3 1 1],3)
[results]=Test_IPS(y,2,3)
tbar: -2.0105Wbar: -1.1115Wbar_pvalue: 0.1332Zbar: -1.0954Zbar_pvalue: 0.1367critical: [-2.3263 -1.6449 -1.2816]tbar_DF: -1.6329Zbar_DF: -0.2787Zbar_DF_pvalue: 0.3902pi: [5x1 double]tstats_ind: [5x1 double]pmax: 3Ti: [5x1 double]model: ' Model with intercept: Model 2'
-MW:Lgfcf
[MW]=Test_MW(x,2,[1 1 2 0 0],3)PMW: 11.9978PMW_Critical: [23.2093 18.3070 15.9872]PMW_pvalue: 0.2852ZMW: 0.4467ZMW_Critical: [2.3263 1.6449 1.2816]ZMW_pvalue: 0.3275pvalue: [5x1 double]pi: [5x1 double]pmax: 2Ti: [5x1 double]tstats: [5x1 double]sample: [5x2 double]model: ' Model with intercept: Model 2'

Lgdp
[MW]=Test_MW(x,2,[0 0 1 0 0],3)PMW: 6.3921PMW_Critical: [23.2093 18.3070 15.9872]PMW_pvalue: 0.7813ZMW: -0.8067ZMW_Critical: [2.3263 1.6449 1.2816]ZMW_pvalue: 0.7901pvalue: [5x1 double]pi: [5x1 double]pmax: 2Ti: [5x1 double]tstats: [5x1 double]sample: [5x2 double]model: ' Model with intercept: Model 2'
Lef
[MW]=Test_MW(x,2,[2 1 1 0 2],3)PMW: 6.3491PMW_Critical: [23.2093 18.3070 15.9872[
PMW_pvalue: 0.7851ZMW: -0.8164ZMW_Critical: [2.3263 1.6449 1.2816[
ZMW_pvalue: 0.7929pvalue: [5x1 double[pi: [5x1 double[
pmax: 2Ti: [5x1 double[tstats: [5x1 double[sample: [5x2 double[
model: ' Model with intercept: Model 2
Leopen[MW]=Test_MW(x,2,[2 2 0 1 1],3)PMW: 11.3410PMW_Critical: [23.2093 18.3070 15.9872]PMW_pvalue: 0.3316ZMW: 0.2999ZMW_Critical: [2.3263 1.6449 1.2816]ZMW_pvalue: 0.3821pvalue: [5x1 double]pi: [5x1 double]pmax: 2Ti: [5x1 double]tstats: [5x1 double]sample: [5x2 double]model: ' Model with intercept: Model 2'

Lgds
[MW]=Test_MW(x,2,[2 1 0 2 0],3)PMW: 11.3777PMW_Critical: [23.2093 18.3070 15.9872]PMW_pvalue: 0.3289ZMW: 0.3081ZMW_Critical: [2.3263 1.6449 1.2816]ZMW_pvalue: 0.3790pvalue: [5x1 double]pi: [5x1 double]pmax: 2Ti: [5x1 double]tstats: [5x1 double]sample: [5x2 double]
model: ' Model with intercept: Model 2'
)8 :(MATLAB
MATLAB
:v
v
v
v
v
v
MATLAB
.MATLABMatrix Laboratory
LINPACK
EISPACKMATLAB
.MATLAB
.

)9 :(6.12SAS
SAS(Statistical Analysis System)
.SAS:
:-Program Editor:-Log:SAS ...-Output:
(Command bar)SAS
SAS(Statments)SAS
DATA) (PROC)(SAS);(

RUN
:
)Procédure (SAS:FREQ :DATA :SAS
TABLES :FREQ
GCHART :VBAR :GCHART
CHISQ :2χALL :PROC FREQ
MISSING :PRINT :NOPRINT
REG :TSCSREG::
1-Within
2-MCQG
RANONE) (FIXONE)(CSTS.
GLM:Within ABSORBCLASS.
MEAN:SAS
.
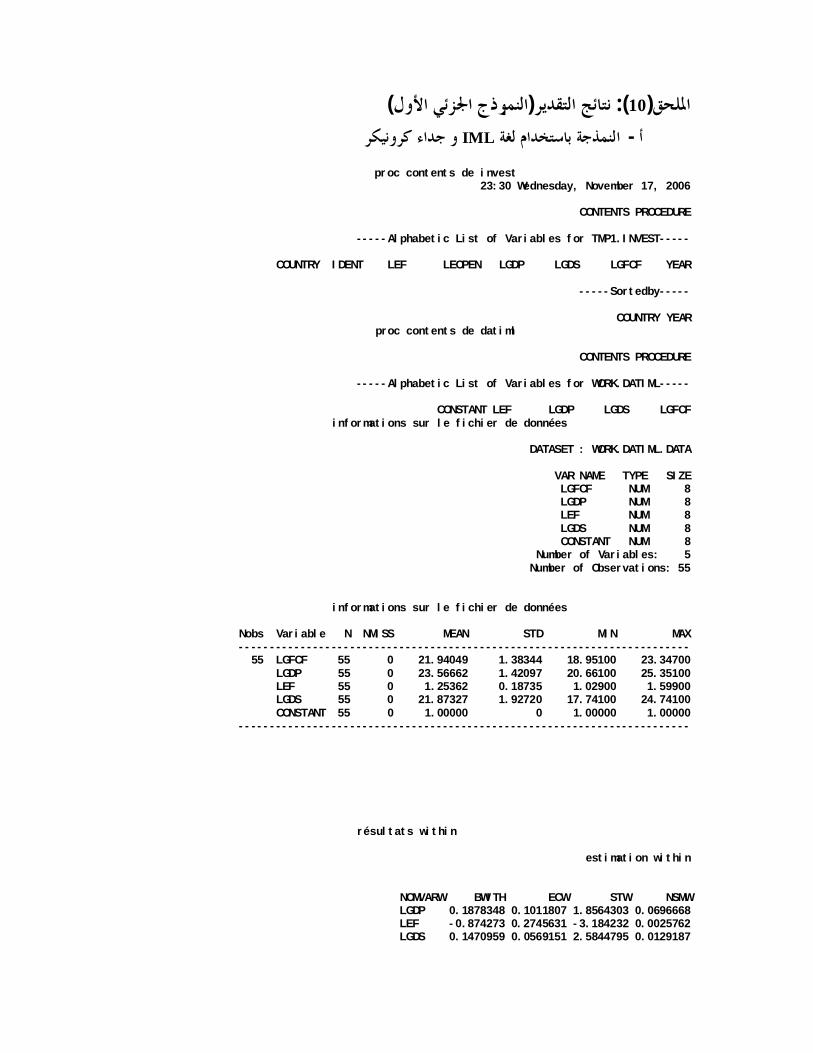
)10 :()(-IML
proc contents de invest 23:30 Wednesday, November 17, 2006
CONTENTS PROCEDURE
-----Alphabetic List of Variables for TMP1.INVEST-----
COUNTRY IDENT LEF LEOPEN LGDP LGDS LGFCF YEAR
-----Sortedby-----
COUNTRY YEAR proc contents de datiml
CONTENTS PROCEDURE
-----Alphabetic List of Variables for WORK.DATIML-----
CONSTANT LEF LGDP LGDS LGFCF informations sur le fichier de données
DATASET : WORK.DATIML.DATA
VAR NAME TYPE SIZE LGFCF NUM 8 LGDP NUM 8 LEF NUM 8 LGDS NUM 8 CONSTANT NUM 8
Number of Variables: 5 Number of Observations: 55
informations sur le fichier de données
Nobs Variable N NMISS MEAN STD MIN MAX ------------------------------------------------------------------------- 55 LGFCF 55 0 21.94049 1.38344 18.95100 23.34700 LGDP 55 0 23.56662 1.42097 20.66100 25.35100 LEF 55 0 1.25362 0.18735 1.02900 1.59900 LGDS 55 0 21.87327 1.92720 17.74100 24.74100 CONSTANT 55 0 1.00000 0 1.00000 1.00000 -------------------------------------------------------------------------
résultats within
estimation within
NOMVARW BWITH ECW STW NSMW LGDP 0.1878348 0.1011807 1.8564303 0.0696668 LEF -0.874273 0.2745631 -3.184232 0.0025762 LGDS 0.1470959 0.0569151 2.5844795 0.0129187

SIG2W sig²w 0.0137646
matrice de var-cov du within
VBWITH 0.0102375 0.011645 -0.00296 0.011645 0.0753849 -0.00248 -0.00296 -0.00248 0.0032393
-:
proc contents de invest 16:30 Thursday, November 18, 2002
CONTENTS PROCEDURE
-----Alphabetic List of Variables for TMP1.INVEST-----
COUNTRY IDENT LEF LEOPEN LGDP LGDS LGFCF YEAR
-----Sortedby-----
COUNTRY YEAR statistiques descritives sur les principales variables
Variable N Mean Std Dev Minimum Maximum -------------------------------------------------------------------- LGFCF 55 21.9404909 1.3834395 18.9510000 23.3470000 LGDP 55 23.5666182 1.4209706 20.6610000 25.3510000 LEF 55 1.2536182 0.1873459 1.0290000 1.5990000 LGDS 55 21.8732727 1.9271995 17.7410000 24.7410000 --------------------------------------------------------------------
corrélation des principales variables
Correlation Analysis
4 'VAR' Variables: LGFCF LGDP LEF LGDS corrélation des principales variables
Correlation Analysis
Pearson Correlation Coefficients / Prob > |R| under Ho: Rho=0 / N = 55
LGFCF LGDP LEF LGDS
LGFCF 1.00000 0.97599 -0.25928 0.97514 0.0 0.0001 0.0559 0.0001
LGDP 0.97599 1.00000 -0.10451 0.98076 0.0001 0.0 0.4477 0.0001
LEF -0.25928 -0.10451 1.00000 -0.10326 0.0559 0.4477 0.0 0.4531
LGDS 0.97514 0.98076 -0.10326 1.00000 0.0001 0.0001 0.4531 0.0
estimation within

Model: MODEL1NOTE: No intercept in model. R-squa re is redefined.
Dependent Variable: WLGFCF
Analysis of Variance
Sum of Mean Source DF Squares Square F Value Prob>F
Model 3 0.58289 0.19430 15.617 0.00010.64694 0.0124452Error
U Total 55 1.22983
Root MSE 0.11154 R-square 0.4740 Dep Mean -0.00000 Adj R-sq 0.4436
C.V. -8.633795E16
estimation within
Parameter Estimates
Parameter Standard T for H0: Variable DF Estimate Error Parameter=0 Prob > |T|
0.05621.9530.09619328WLGDP 1 0.187835.001503.349-0.261029370.874273-WLEF 1
0.00892.7180.05410966WLGDS 1 0.147096
:SAS
( )wNT k−( )( )1w
N T k− −
)GDS (SAS:-IML
proc contents de invest12:20 Friday, February 22, 2002
CONTENTS PROCEDURE
-----Alphabetic List of Variables for TMP1.INVEST-----
COUNTRY IDENT LEF LEOPEN LGDP LGDS LGFCF YEAR
-----Sortedby-----
COUNTRY YEARproc contents de datiml
CONTENTS PROCEDURE
-----Alphabetic List of Variables for WORK.DATIML-----
CONSTANT LEF LGDP LGFCFinformations sur le fichier de données
Nobs Variable N NMISS MEAN STD MIN MAX-------------------------------------------------------------------------55 LGFCF 55 0 21.94049 1.38344 18.95100 23.34700

LGDP 55 0 23.56662 1.42097 20.66100 25.35100LEF 55 0 1.25362 0.18735 1.02900 1.59900CONSTANT 55 0 1.00000 0 1.00000 1.00000
-------------------------------------------------------------------------
résultats within
estimation within
NOMVARW BWITH ECW STW NSMWLGDP 0.3222604 0.0917794 3.5112511 0.0009817LEF -0.761658 0.286673 -2.656889 0.0106764
SIG2Wsig²w 0.0153933
matrice de var-cov du within
VBWITH0.0084235 0.01048830.0104883 0.0821814
estimation between
NOMVAR BBETW ECB STB NSMBCONSTANTE 1.3073406 1.3281607 0.984324 0.4287309LGDP 0.9458456 0.0501642 18.855008 0.002801LEF -1.321958 0.4009645 -3.296946 0.0809798
SIG2Bsig²b 0.0242412
matrice de var-cov du between
VBBETW1.764011 -0.061615 -0.244983-0.061615 0.0025164 0.0018431-0.244983 0.0018431 0.1607725
résultats mcqg
esimation mcqg
NOMVAR BMCQG ECG STG NSMGCONSTANTE 3.8514028 1.1324647 3.4009032 0.0013795LGDP 0.7969271 0.0439692 18.124666 0LEF -0.551834 0.2247525 -2.455297 0.0178315
matrice de var-cov des mcqg
VBMCQG1.2824763 -0.048203 -0.11299-0.048203 0.0019333 0.0021074-0.11299 0.0021074 0.0505137
SIG2W SIG2B SIG2U SIG2Gsig2w = 0.0153933 sig2b = 0.0242412 sig2u = 0.0228419 sig2g = 0.0273857
THETAtheta = 0.7597342

-:
proc contents de invest
CONTENTS PROCEDURE
-----Alphabetic List of Variables for TMP1.INVEST-----
COUNTRY IDENT LEF LEOPEN LGDP LGDS LGFCF YEAR
corrélation des principales variables12:20 Friday, February 22, 2002
Correlation Analysis
3 'VAR' Variables: LGFCF LGDP LEF
Pearson Correlation Coefficients / Prob > |R| under Ho: Rho=0 / N = 55
LGFCF LGDP LEF
LGFCF 1.00000 0.97599 -0.259280.0 0.0001 0.0559
LGDP 0.97599 1.00000 -0.104510.0001 0.0 0.4477
LEF -0.25928 -0.10451 1.000000.0559 0.4477 0.0
estimation mco
Dependent Variable: LGFCF
Analysis of Variance
Sum of MeanSource DF Squares Square F Value Prob>F
Model 2 101.03194 50.51597 1132.781 0.0001Error 52 2.31892 0.04459
C Total 54 103.35086
Root MSE 0.21117 R-square 0.9776Dep Mean 21.94049 Adj R-sq 0.9767
C.V. 0.96249
Parameter Estimates
Parameter Standard T for H0:Variable DF Estimate Error Parameter=0 Prob > |T|
INTERCEP 1 1.400639 0.53593096 2.613 0.0117LGDP 1 0.934030 0.02033499 45.932 0.0001LEF 1 -1.174258 0.15423568 -7.613 0.0001
Durbin-Watson D 0.604(For Number of Obs.) 551st Order Autocorrelation 0.641
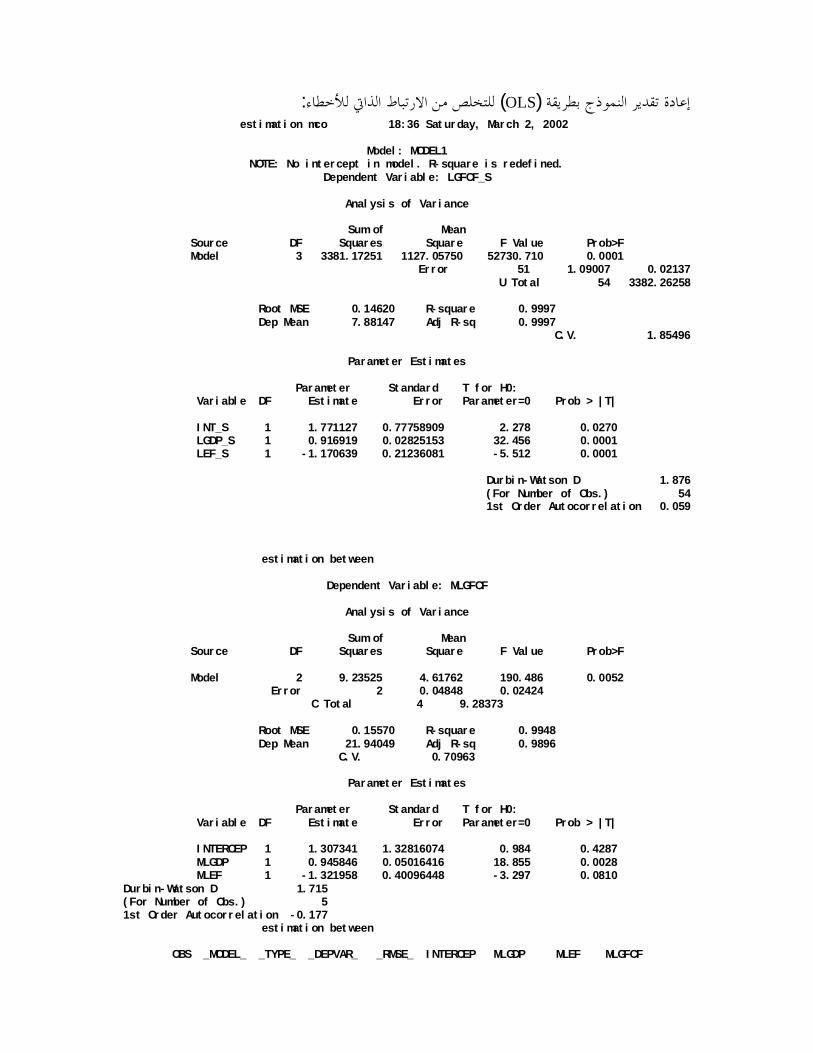
)OLS (:estimation mco 18:36 Saturday, March 2, 2002
Model: MODEL1NOTE: No intercept in model. R-square is redefined.
Dependent Variable: LGFCF_S
Analysis of Variance
Sum of MeanSource DF Squares Square F Value Prob>FModel 3 3381.17251 1127.05750 52730.710 0.0001
Error 51 1.09007 0.02137 U Total 54 3382.26258
Root MSE 0.14620 R-square 0.9997Dep Mean 7.88147 Adj R-sq 0.9997
C.V. 1.85496
Parameter Estimates
Parameter Standard T for H0:Variable DF Estimate Error Parameter=0 Prob > |T|
INT_S 1 1.771127 0.77758909 2.278 0.0270LGDP_S 1 0.916919 0.02825153 32.456 0.0001LEF_S 1 -1.170639 0.21236081 -5.512 0.0001
Durbin-Watson D 1.876(For Number of Obs.) 541st Order Autocorrelation 0.059
estimation between
Dependent Variable: MLGFCF
Analysis of Variance
Sum of MeanSource DF Squares Square F Value Prob>F
Model 2 9.23525 4.61762 190.486 0.0052Error 2 0.04848 0.02424
C Total 4 9.28373
Root MSE 0.15570 R-square 0.9948Dep Mean 21.94049 Adj R-sq 0.9896
C.V. 0.70963
Parameter Estimates
Parameter Standard T for H0:Variable DF Estimate Error Parameter=0 Prob > |T|
INTERCEP 1 1.307341 1.32816074 0.984 0.4287MLGDP 1 0.945846 0.05016416 18.855 0.0028MLEF 1 -1.321958 0.40096448 -3.297 0.0810
Durbin-Watson D 1.715(For Number of Obs.) 51st Order Autocorrelation -0.177
estimation between
OBS _MODEL_ _TYPE_ _DEPVAR_ _RMSE_ INTERCEP MLGDP MLEF MLGFCF

1 MODEL1 PARMS MLGFCF 0.15570 1.30734 0.94585 -1.32196 -1
estimation within
NOTE: No intercept in model. R-square is redefined.Dependent Variable: WLGFCF
Analysis of Variance
Sum of MeanSource DF Squares Square F Value Prob>F
Model 2 0.49095 0.24548 17.608 0.00010.73888 0.0139453Error
U Total 55 1.22983
Root MSE 0.11807 R-square 0.3992Dep Mean -0.00000 Adj R-sq 0.3765C.V. -9.139468E16
Parameter Estimates
Parameter Standard T for H0:Variable DF Estimate Error Parameter=0 Prob > |T|
0.00053.6900.08734292WLGDP 1 0.3222600.00732.792-0.272815760.761658-WLEF 1
Durbin-Watson D 1.135(For Number of Obs.) 551st Order Autocorrelation 0.418
.
)Within(:
estimation within 18:36 Saturday, March 2, 2002
Model: MODEL1NOTE: No intercept in model. R-square is redefined.
Dependent Variable: WLGFCF_S
Analysis of Variance
Sum of MeanSource DF Squares Square F Value Prob>FModel 2 0.39529 0.19765 17.771 0.0001
0.57833 0.0111252Error U Total 54 0.97362
Root MSE 0.10546 R-square 0.4060Dep Mean 0.00174 Adj R-sq 0.3832
C.V. 6058.14512
Parameter Estimates
Parameter Standard T for H0:Variable DF Estimate Error Parameter=0 Prob > |T|

0.00014.7940.08860723WLGDP_S 1 0.4248010.10911.630-0.298467710.486609-WLEF_S 1
Durbin-Watson D 1.664(For Number of Obs.) 541st Order Autocorrelation 0.165
.
estimation mcqg
NOTE: No intercept in model. R-square is redefined.Dependent Variable: GLGFCF
Analysis of Variance
Sum of MeanSource DF Squares Square F Value Prob>F
Model 3 1534.10881 511.36960 18672.888 0.0001Error 52 1.42405 0.02739U Total 55 1535.53286
Root MSE 0.16549 R-square 0.9991Dep Mean 5.27155 Adj R-sq 0.9990C.V. 3.13923
Parameter Estimates
Parameter Standard T for H0:Variable DF Estimate Error Parameter=0 Prob > |T|
GLGDP 1 3.8514028 1.13246473.40090320.0013795GLEF 10.79692710.043969218.1246660
GCONST 1 -0.551834 0.22475252.455297-0.0178315
test LM2 de Breusch-Pagan : H0 : sig²(u) = 0
OBS SSEIT2 SSQUOLS N T NT KB KW LMTEST P
1 6.47890 2.31892 5 11 55 3 2 8.85001 .0058617
)11 :()(-IML
proc contents de invest12:20 Friday, February 22, 2002
CONTENTS PROCEDURE
-----Alphabetic List of Variables for TMP1.INVEST-----
COUNTRY IDENT LEF LEOPEN LGDP LGDS LGFCF YEA CONTENTS PROCEDURE
-----Alphabetic List of Variables for WORK.DATIML-----
CONSTANT LEF LEOPEN LGDP LGFCF

informations sur le fichier de données
Nobs Variable N NMISS MEAN STD MIN MAX-------------------------------------------------------------------------55 LGFCF 55 0 21.94049 1.38344 18.95100 23.34700
LGDP 55 0 23.56662 1.42097 20.66100 25.35100LEF 55 0 1.25362 0.18735 1.02900 1.59900LEOPEN 55 0 4.23616 0.36882 3.59600 4.98300CONSTANT 55 0 1.00000 0 1.00000 1.00000
-------------------------------------------------------------------------
résultats within
estimation within
NOMVARW BWITH ECW STW NSMWLGDP 0.3190289 0.0961349 3.3185539 0.0017533LEF -0.754134 0.295606 -2.551145 0.0140517LEOPEN 0.0133152 0.1044223 0.1275127 0.8990786
SIG2Wsig²w 0.0157154
matrice de var-cov du within
VBWITH0.0092419 0.0092124 -0.0026460.0092124 0.0873829 0.0061618-0.002646 0.0061618 0.010904
résultats between
estimation between
NOMVAR BBETW ECB STB NSMBCONSTANTE -0.286974 8.3729353 -0.034274 0.978189LGDP 0.9821841 0.1987529 4.9417351 0.1271087LEF -1.302255 0.565624 -2.302334 0.2608591LEOPEN 0.1683692 0.8625337 0.1952031 0.8772731
SIG2Bsig²b 0.0467029
matrice de var-cov du between
VBBETW70.106045 -1.63914 -1.296367 -7.044716-1.63914 0.0395027 0.0223408 0.160567-1.296367 0.0223408 0.3199305 0.0870601-7.044716 0.160567 0.0870601 0.7439644
résultats mcqgesimation mcqg
NOMVAR BMCQG ECG STG NSMGCONSTANTE 6.9857542 1.5456646 4.5195797 0.0000432LGDP 0.7063194 0.0557962 12.658927 2.22E-16LEF -0.653732 0.2579802 -2.534041 0.014745LEOPEN -0.20568 0.0949189 -2.166899 0.0354572
matrice de var-cov des mcqg

VBMCQG2.3890789 -0.079999 -0.203328 -0.056545-0.079999 0.0031132 0.003871 0.0004199-0.203328 0.003871 0.0665538 0.0067674-0.056545 0.0004199 0.0067674 0.0090096
SIG2W SIG2B SIG2U SIG2Gsig2w = 0.0157154 sig2b = 0.0467029 sig2u = 0.0452742 sig2g = 0.0234857
THETAtheta = 0.8250983
-
proc contents de investCONTENTS PROCEDURE
-----Alphabetic List of Variables for TMP1.INVEST-----
COUNTRY IDENT LEF LEOPEN LGDP LGDS LGFCF YEAR
corrélation des principales variables
Correlation Analysis
4 'VAR' Variables: LGFCF LGDP LEF LEOPEN
Pearson Correlation Coefficients / Prob > |R| under Ho: Rho=0 / N = 55
LGFCF LGDP LEF LEOPEN
LGFCF 1.00000 0.97599 -0.25928 -0.771840.0 0.0001 0.0559 0.0001LGDP 0.97599 1.00000 -0.10451 -0.785710.0001 0.0 0.4477 0.0001
LEF -0.25928 -0.10451 1.00000 -0.033360.0559 0.4477 0.0 0.8089
LEOPEN -0.77184 -0.78571 -0.03336 1.000000.0001 0.0001 0.8089 0.0
estimation mco
Analysis of VarianceSum of Mean
Source DF Squares Square F Value Prob>F
Model 3 101.18470 33.72823 794.097 0.0001Error 51 2.16616 0.04247
C Total 54 103.35086
Root MSE 0.20609 R-square 0.9790Dep Mean 21.94049 Adj R-sq 0.9778
C.V. 0.9393
Parameter Estimates
Parameter Standard T for H0:Variable DF Estimate Error Parameter=0 Prob > |T|
INTERCEP 1 3.632868 1.28801086 2.821 0.0068LGDP 1 0.884875 0.03264412 27.107 0.0001LEF 1 -1.228809 0.15324689 -8.018 0.0001

LEOPEN 1 -0.237344 0.12514930 -1.896 0.0636Durbin-Watson D 0.612(For Number of Obs.) 551st Order Autocorrelation 0.641
)OLS (:estimation mco 18:40 Sunday, March 3, 2002
Model: MODEL1NOTE: No intercept in model. R-square is redefined.
Dependent Variable: LGFCF_S
Analysis of Variance
Sum of MeanSource DF Squares Square F Value Prob>FModel 4 3381.22752 845.30688 40833.789 0.0001
Error 50 1.03506 0.02070U Total 54 3382.26258
Root MSE 0.14388 R-square 0.9997Dep Mean 7.88147 Adj R-sq 0.9997
C.V. 1.82553
Parameter EstimatesParameter Standard T for H0:
Variable DF Estimate Error Parameter=0 Prob > |T|
INT_S 1 3.151483 1.14134802 2.761 0.0080LGDP_S 1 0.890089 0.03231021 27.548 0.0001LEF_S 1 -1.154841 0.20921699 -5.520 0.0001LEOPEN_S 1 -0.180171 0.11052800 -1.630 0.1094
Durbin-Watson D 1.891(For Number of Obs.) 541st Order Autocorrelation 0.048
estimation between
Dependent Variable: MLGFCFAnalysis of Variance
Sum of MeanSource DF Squares Square F Value Prob>F
Model 3 9.27531 3.09177 367.181 0.0383Error 1 0.00842 0.00842
C Total 4 9.28373
Root MSE 0.09176 R-square 0.9991Dep Mean 21.94049 Adj R-sq 0.9964
C.V. 0.41823
Parameter Estimates
Parameter Standard T for H0:Variable DF Estimate Error Parameter=0 Prob > |T|
INTERCEP 1 -0.285585 1.93429516 -0.031 0. 978189MLGDP 1 0.989658 0.25214162 4.945 0. 1271087MLEF 1 -1.301121 0.23853657 -2.305 0. 2608591MLEOPEN 1 0.162021 0.18705898 0.191 0. 8772731
Durbin-Watson D 1.812(For Number of Obs.) 51st Order Autocorrelation -0.297

estimation between
OBS _MODEL_ _TYPE_ _DEPVAR_ _RMSE_ INTERCEP MLGDP MLEF MLEOPEN MLGFCF
1 MODEL1 PARMS MLGFCF 0.091762 -0.285585 0.98965 -1.30112 0.16202 -1
estimation within
NOTE: No intercept in model. R-square is redefined.Dependent Variable: WLGFCF
Analysis of VarianceSum of Mean
Source DF Squares Square F Value Prob>F
Model 3 0.49095 0.16365 11.517 0.00010.73888 0.0142152Error
U Total 55 1.22983Root MSE 0.11920 R-square 0.3992Dep Mean -0.00000 Adj R-sq 0.3645
C.V. -9.226928E16Parameter Estimates
Parameter Standard T for H0:Variable DF Estimate Error Parameter=0 Prob > |T|
0.00063.6550.0881790322601WLGDP 1 0.30.00792.765-0.27542696165850.7-WLEF 10.99901180.0.00090444111320.0WLEOPEN 1
Durbin-Watson D 1.135(For Number of Obs.) 551st Order Autocorrelation 0.418
.
)Within(:estimation within 18:40 Sunday, March 3, 2002
Model: MODEL1NOTE: No intercept in model. R-square is redefined.
Dependent Variable: WLGFCF_S
Analysis of Variance
Sum of MeanSource DF Squares Square F Value Prob>FModel 3 0.39675 0.13225 11.692 0.0001
Error 51 0.57687 0.01131U Total 54 0.97362
Root MSE 0.10635 R-square 0.4075Dep Mean 0.00174 Adj R-sq 0.3726
C.V. 6109.53433
Parameter Estimates
Parameter Standard T for H0:Variable DF Estimate Error Parameter=0 Prob > |T|
WLGDP_S 1 0.413826 0.09444311 4.382 0.0001WLEF_S 1 -0.482470 0.30122021 -1.602 0.1154
WLEOPEN_S 1 0.035179 0.09798284 0.359 0.7211

Durbin-Watson D 1.665(For Number of Obs.) 541st Order Autocorrelation 0.166
estimation mcqg
NOTE: No intercept in model. R-square is redefined.Dependent Variable: GLGFCF
Analysis of Variance
Sum of MeanSource DF Squares Square F Value Prob>F
Model 4 4511.44673 1127.86168 65588.835 0.0001Error 51 0.87699 0.01720
U Total 55 4512.32373
Root MSE 0.13113 R-square 0.9998Dep Mean 9.03907 Adj R-sq 0.9998
C.V. 1.45074
Parameter Estimates
Parameter Standard T for H0:Variable DF Estimate Error Parameter=0 Prob > |T|
GLGDP 1 0.7063194 0.0557962 12.658927 2.22E-16
GLEF 1 -0.653732 0.2579802 -2.534041 0.014745 GLEOPEN 1 -0.20568 0.0949189 -2.166899 0.0354572
GCONST 1 6.9857542 1.5456646 4.5195797 0.0000432
test LM2 de Breusch-Pagan : H0 : sig²(u) = 0
OBS SSEIT2 SSQUOLS N T NT KB KW LMTEST P
1 7.31380 2.16616 5 11 55 4 3 15.5299 .00016242
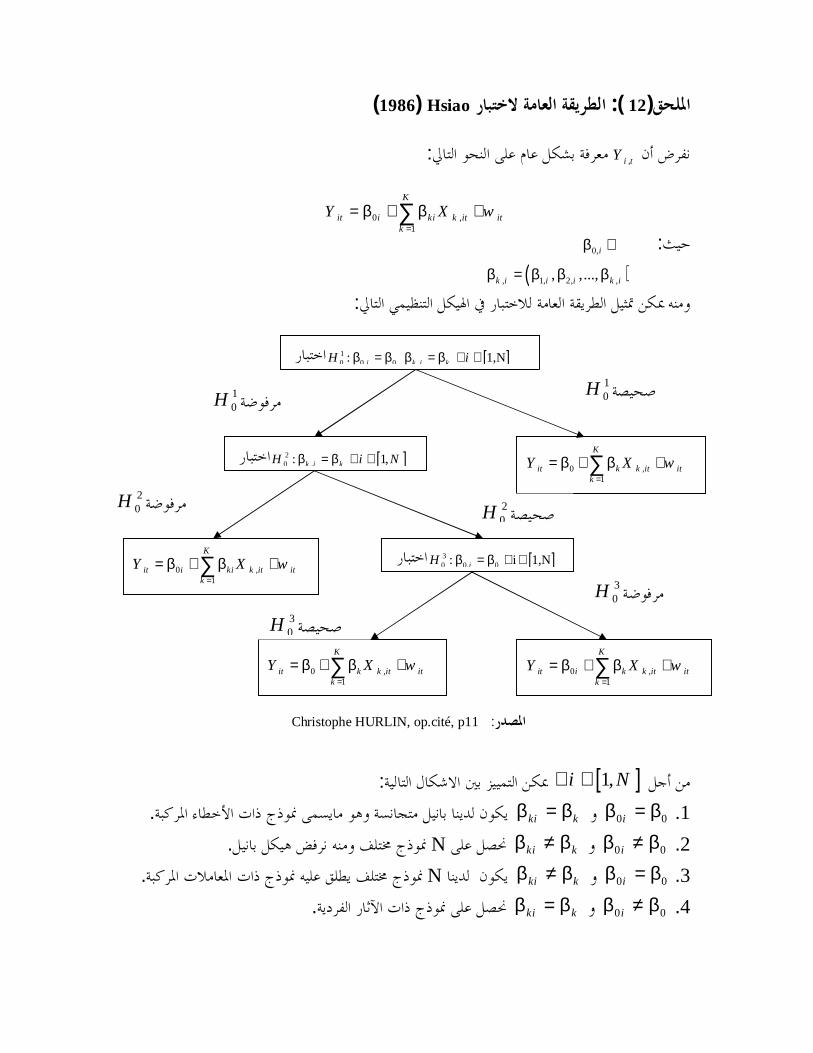
)12 :(Hsiao)1986(
,i tY:
:0,iβ ∈
( ), 1, 2, ,, ,...,k i i i k iβ β β β=
:
: Christophe HURLIN, op.cité, p11
[ ]1,i N∀ ∈:
1 .0 0iβ β=ki kβ β=.
2 .0 0iβ β≠ki kβ β≠N.
3 .0 0iβ β=ki kβ β≠ N.
4 .0 0iβ β≠ki kβ β=.
0 ,1
K
it i ki k it itk
Y X wβ β=
= + +∑
[ ]10 0, 0 ,: 1,Ni k i kH iβ β β β= = ∀ ∈
0 ,1
K
it k k it itk
Y X wβ β=
= + +∑[ ]20 ,: 1,k i kH i Nβ β= ∀ ∈
[ ]30 0, 0: i 1,NiH β β= ∀ ∈
0 ,1
K
it i ki k it itk
Y X wβ β=
= + +∑
0 ,1
K
it i k k it itk
Y X wβ β=
= + +∑0 ,1
K
it k k it itk
Y X wβ β=
= + +∑
10H1
0H
20H
20H
30H
30H

)13 :(
-5
0
5
10
15
20
25
30
95 96 97 98 99 00 01 02 03 04 05
GDP_DZA(%) GFCF_DZA(%)
-40
-30
-20
-10
0
10
20
30
40
95 96 97 98 99 00 01 02 03 04 05
GDP_LBY(%) GFCF_LBY(%)
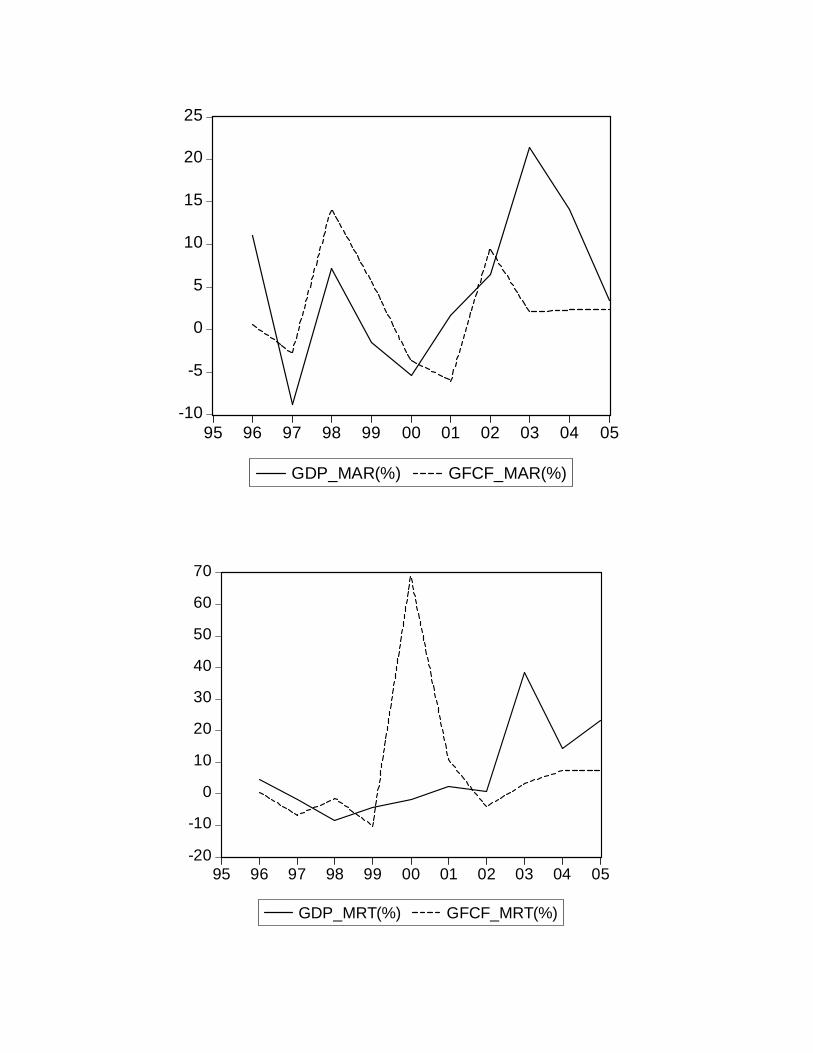
-10
-5
0
5
10
15
20
25
95 96 97 98 99 00 01 02 03 04 05
GDP_MAR(%) GFCF_MAR(%)
-20
-10
0
10
20
30
40
50
60
70
95 96 97 98 99 00 01 02 03 04 05
GDP_MRT(%) GFCF_MRT(%)

-10
-5
0
5
10
15
20
95 96 97 98 99 00 01 02 03 04 05
GFCF_TUN(%) GDP_TUN(%)


![02 - EDITAL AMPLIAÃ Ã O MONTEIRO LOBATOaltinopolis.sp.gov.br/licitacoes/assets/editais/...W ( ] µ o ] v } o ] Z µ D i } ' ] U í ð ð t W í ð X ï ñ ì r ì ì ì & } v W ~](https://img.pdfslide.tips/doc/110x75/5f3ae394106a482b6220e749/02-edital-ampliaf-f-o-monteiro-w-o-v-o-z-d-i-u-.jpg)

![ITå° å ¥è£ å ©é ã ã ©ã ·2020 20200603 · 2020-06-25 · ,7 Ë ¸ \Õ\Î\®\Ð ï Ó Ì 4 » ? ! t ° õ k µ » \¶ ¹ £ ]c à Ò Ð\Õ Ë\Á\É,7],]d]S\Ù\ Ì 4 \Ò\Ô\ô\è\Ã\](https://img.pdfslide.tips/doc/110x75/5f47206f6f60993e1213edca/it-2020-20200603-2020-06-25-7-.jpg)

![u Ã] ][] ]S]'][]0\Ò\Á\Ð[t[u «\Ø ý a\ü \é\ W\¹\Ø k µ\Ñ\Ø M 0 ð Z\ü\ì\Î\ ð u à /\Ù K D Î\ì \ë Ô ú[t[z[s u à 0 ±\Ò W\¹\ \¿\è\À\è\Ô µ µ \Ñ\Ø u Ã](https://img.pdfslide.tips/doc/110x75/60d987c3c584834c45145141/u-f-s0tu-a-w-k-m-0-z.jpg)