Embed Size (px)
Citation preview
ÖRNEKLEME TEKNİKLERİ
Neuman, 2000: CHP.8
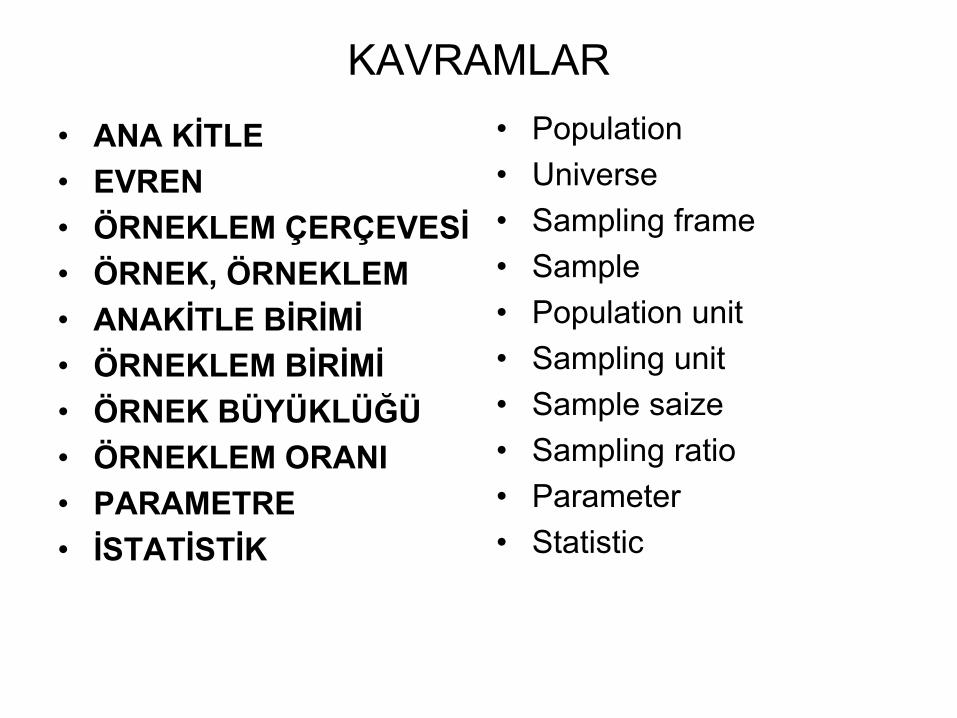
KAVRAMLAR
• ANA KİTLE • EVREN• ÖRNEKLEM ÇERÇEVESİ• ÖRNEK, ÖRNEKLEM• ANAKİTLE BİRİMİ• ÖRNEKLEM BİRİMİ• ÖRNEK BÜYÜKLÜĞÜ• ÖRNEKLEM ORANI• PARAMETRE• İSTATİSTİK
• Population• Universe• Sampling frame• Sample• Population unit• Sampling unit• Sample saize• Sampling ratio• Parameter• Statistic
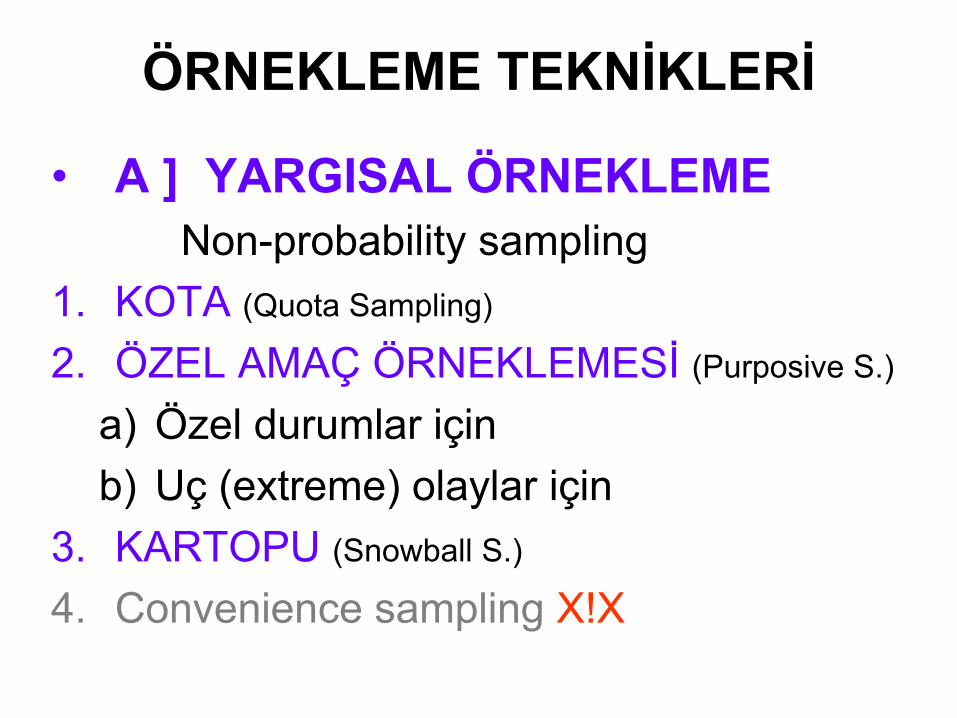
ÖRNEKLEME TEKNİKLERİ
• A ] YARGISAL ÖRNEKLEMENon-probability sampling
1. KOTA (Quota Sampling)
2. ÖZEL AMAÇ ÖRNEKLEMESİ (Purposive S.)
a) Özel durumlar içinb) Uç (extreme) olaylar için
3. KARTOPU (Snowball S.)
4. Convenience sampling X!X
ÖZEL AMAÇ ÖRNEKLEMESİ(Purposive S.)
a) Özel durumlar içinb) Uç (extreme) olaylar için kullanılır; Tipik & genel geçerli durumlar için
kullanılmaz.

KOTA ÖRNEKLEMESİ
A B
DC
ANA KİTLENİN YAPISI İÇİNDE FARKLI
ÖZELLİKLER VAR
a
c d
bANA KİTLE ÖZELLİKLERİNİN ORANI (%)ÖRNEĞE AYNEN YANSITILIYOR

KOTA ÖRNEKLEMESİ
• (+) Görece düşük maliyetli.• (+) Uygulanması kolay
• (-) Hata – Kategorilerilerin belirlenmesinde– Kategoriler tüm ana kitle terimlerini tüketmiyorsa– Kategoriler çakışıyorsa.
• (-) Sistematik hata - Kotaların doldurulmasında

ÖRNEKLEME TEKNİKLERİ
• B ] OLASILIKLI ÖRNEKLEME1. BASİT RASTLANTILI (simple random)
2. SİSTEMATİK (systematic)
3. KATMANLI (stratified)
4. KÜME (cluster)
5. ÇOK AŞAMALI (multi-staged)
6. ALAN OLASILIK ÖRNEKLEMESİ (area)
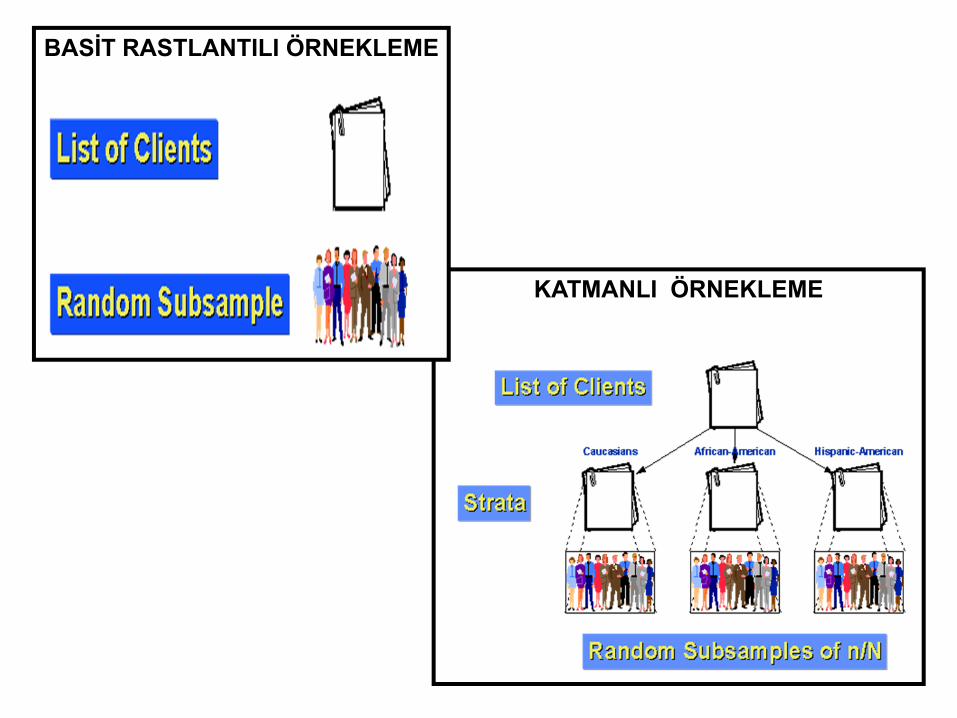
KATMANLI ÖRNEKLEME
BASİT RASTLANTILI ÖRNEKLEME

SİSTEMATİK ÖRNEKLEME
All

ÖRNEKLEM ÇERÇEVESİ:
liste
N = 140n = 14
Örnekl. Oranı %10K=140/10 = 14
Ana kitleyi 14 eşit parçaya böl.
İlk parçadan b.r. olarak bir terim seç.
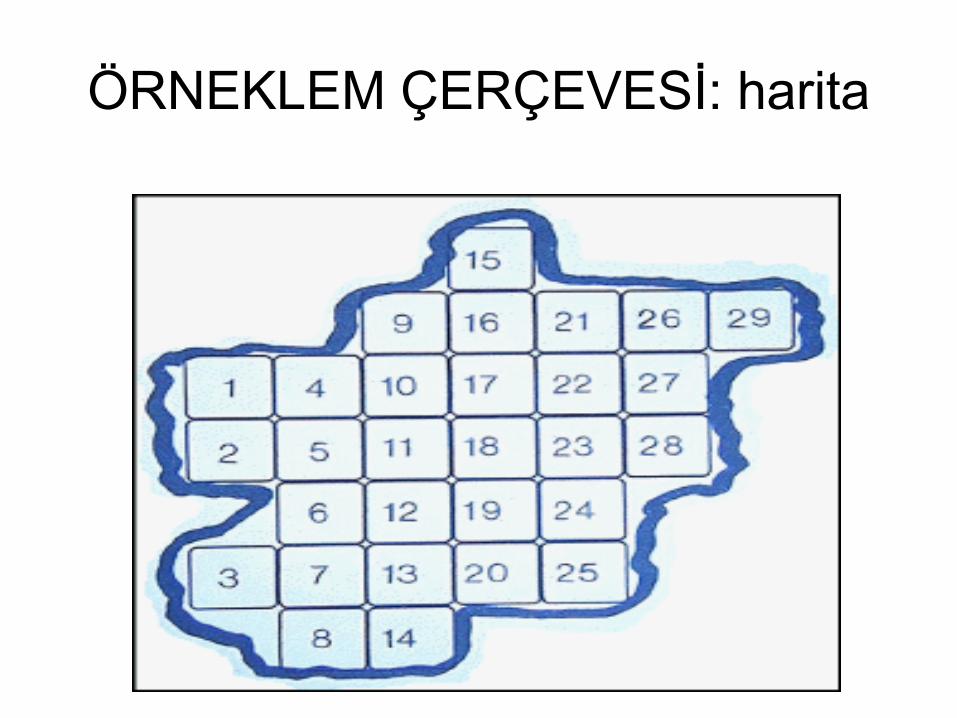
ÖRNEKLEM ÇERÇEVESİ: harita

KÜME ÖRNEKLEMESİ

ÖRNEKLEM ÇERÇEVESİ: küme listesi
DIST_NAME MAH_NAME POP_2000 AREA_HA POP_DEN_HA BLD_COUNT
KAºITHANE ̦R¦NTEPE 17010 37 457 1294
KAºITHANE YAHYA KEMAL 16028 30 530 1393
GAZ¦OSMANPAÌA H▄RR¦YET 25248 47 538 1549
̦ÌL¦ ¦ZZETPAÌA 7402 18 408 538
GAZ¦OSMANPAÌA ÌEMS¦PAÌA 19348 35 548 1261
ESENLER ORUÃ RE¦S 36715 66 553 2304
ESENLER HAVAALANI 26638 57 466 1852
BAºCILAR FAT¦H 35328 62 570 2294
BAºCILAR KEMALPAÌA 26470 56 474 1869
ESENLER B¦RL¦K 22421 55 411 1634
BEYOºLU FET¦HTEPE 14534 31 475 1408
EY▄P RAM¦ CUMA 10460 23 450 886
BEYOºLU KAPTANPAÌA 16458 41 401 1279
BAºCILAR ÃINAR 29100 64 454 1633
BAºCILAR KAZIM KARABEK¦R 19829 49 401 1294
BAºCILAR YILDIZTEPE 32596 61 533 1824
G▄NGÍREN G▄NEÌTEPE 43222 73 593 1497
BAHÃEL¦EVLER CUMHUR¦YET 28024 68 411 1385
ZEYT¦NBURNU GÍKALP 17012 29 592 1223
ZEYT¦NBURNU S▄MER 30385 65 465 1439

http://www.surveysystem.com/sscalc.htm
Confidence Level: 95% 99%
Sample Size:
Population:
Percentage:
Confidence Interval:
Find Confidence IntervalDetermine Sample Size
Confidence Level: 95% 99%
Confidence Interval:
Population:
Sample size needed:
ÖRNEK BÜYÜKLÜĞÜ

Sample Size Calculator Terms: Confidence Interval & Confidence LevelThe confidence interval is the plus-or-minus figure usually reported in newspaper or television opinion poll results. For example, if you use a confidence interval of 4 and 47% percent of your sample picks an answer you can be "sure" that if you had asked the question of the entire relevant population between 43% (47-4) and 51% (47+4) would have picked that answer.
The confidence level tells you how sure you can be. It is expressed as a percentage and represents how often the true percentage of the population who would pick an answer lies within the confidence interval. The 95% confidence level means you can be 95% certain; the 99% confidence level means you can be 99% certain. Most researchers use the 95% confidence level.
When you put the confidence level and the confidence interval together, you can say that you are 95% sure that the true percentage of the population is between 43% and 51%. The wider the confidence interval you are willing to accept, the more certain you can be that the whole population answers would be within that range.
http://www.surveysystem.com/sscalc.htm


![Holografi-2011Güz-D1 [Uyumluluk Modu] - Yıldız Teknik Üniversitesiyildiz.edu.tr/~oscg/dersnotlari/holografi/D1.pdf · 2012-01-09 · Holografi, Giri ş Holografi geçefi, geçeğeyake](https://img.pdfslide.tips/doc/110x75/5cd3624788c993e80a8dbc38/holografi-2011guez-d1-uyumluluk-modu-yildiz-teknik-ue-oscgdersnotlariholografid1pdf.jpg)