Embed Size (px)
Citation preview
����������� ���� ����
��������� ��� ����� ��������������� ��� ��������������������������� � �����
�
���������������������� ��� �������
�������������������� ������������������ �� �!���
�
���������"� ������������������� ������ ����
#$$%&'

Acknowledgements
We wish to thank the Employment Strategy Department of the ILO for providing financial assistance to the project and serving as a sounding board to our ideas. In particular, the authors thank Mr. Muqtada for his intellectual guidance throughout the duration of the project. Ms. Anne Drougard further gave very constructive edit advice and commentary. We however bear all responsibility for the arguments that are advanced. The authors are respectively Director, Development Policy Research Unit (DPRU), University of Cape Town (UCT) and Deputy-Director, DPRU, UCT. All comments can be sent to [email protected] or [email protected].
Preface
In its simplest form, globalization is meant to capture the idea that the world through its numerous nation-states has increased its inter-connectedness at a tremendous pace over the last two to three decades. The paper attempts firstly to identify the five key economic markers of globalization, namely: The growth in trade flows between economies around the globe; the proliferation of ICTs, captured more specifically as technological change; the rapid growth in cross-border capital flows and finally a process of intensive tariff liberalization, accompanied by the formation of a number of regional trade blocs. A detailed examination of the content of each of these markers forms the first key component of the paper. However, one of intellectual anchors of this paper is the notion that the labour market serves as the conduit through which the social and welfare impacts of globalization are transmitted. Hence the second key segment of the document attempts to explore how the combination of these five discrete, yet interlinked, forces of globalization have together served to engender labour market outcomes in the developing world. Hence, we focus then on the various channels through which economic globalization has affected the functioning of the labour market in the developing world. Four key issues are interrogated namely, the quantity effects in the form of within-country employment shifts, cross-border labour mobility, the price effects in terms of wage distributions and wage inequality, and finally changing regulations governing work together with the changing nature of work itself.
The data garnered on relative wage and employment shifts principally since the 1990s indicate that – on average – most countries sampled reflect patterns congruent with a rightward shift in the labour demand function. Put differently, there appears to be sufficient evidence that in numerous developing countries around the world, the relative wage of non-production workers is increasing together with a rise in their relative employment levels. Furthermore, evidence in the paper shows that all five markers of economic globalization have all contributed, albeit differentially, to this increased preference for non-production workers, matched by a rising price being offered for their services. In terms of wage differentials, the data suggests that within the developing world, technology and FDI flows are the strongest contributors to growing wage inequality. In addition, while the evidence on this remains tentative, there is provisional evidence to suggest that trade, in impacting on technology could indirectly also be raising developing country wage differentials. The evidence on the impact of globalization on absolute wages are mixed, with trade flows and trade liberalization tending to lower wages, while FDI flows are associated with higher domestic earnings.
The unemployment shifts observed during the 1990s are on the basis of extremely patchy data for developing countries. All the same, these reveal that over this period in many developing economies, unemployment rates tended to increase (with a few notable exceptions) and within this, the shares of educated unemployed individuals was rising. Finally, the proportion of unemployed individuals with no previous job did increase across a number of sampled countries – alluding to the fact that the unemployment problem in the developing world has a strong youth dimension. In terms of labour mobility globalization, through its impact on developed country skilled labour shortages has resulted in, as one of its unintended consequences, an increased outflow of skilled labour from the developing world. While the cost to the source country remains, the benefits to the latter in the form of remittances and the possibility of re-immigration, serve to mitigate partially the obvious consequences of a developing country losing its most scarce human resource.
Finally, in terms of the regulatory and policy challenges posed by globalization, the paper shows that these revolve around whether prevailing country-level or regional institutions represent the most appropriate configuration for assisting in managing regional and national development interests within a globalized world. Ultimately, it is critical that relevant agencies and actors respond appropriately, effectively and timely to these new options and constraints posed by the process of globalization.
The Employment Strategy Department, through its Employment Analysis Unit, is carrying out policy research on a number of current themes which include, among others, the employment focus in macroeconomic policy decisions and the interaction between employment/labour market and macroeconomic policies in an era of globalization. This paper is one in this set of studies. The views expressed in the paper belong to the authors and need not necessarily reflect those of the ILO.
Peter Auer Chief
Employment Analysis Unit
Duncan Campbell Director a.i.
Employment Strategy Department
Contents
1. Introduction........................................................................................................................................1
2. Defining and Characterizing Globalization.....................................................................................1 Trade Flows ........................................................................................................................................................ 2 Technological Change ........................................................................................................................................ 4 The Incidence of Structural Shifts ..................................................................................................................... 11
3. Globalization and Labour Market Outcomes in the Developing World.....................................18 Employment and Wage Effects from Globalization .......................................................................................... 18 Relative Wage and Employment Shifts in the Developing World...................................................................... 20 Labour Supply Growth Amidst Labour Demand Shifts..................................................................................... 35
4. The Labour Market Regulatory Environment..............................................................................41 The Institutional Conditions Shaping the Regulatory Environment.................................................................. 41 Informality and the Need for Increased Institutional Capacity: SSA................................................................ 45 The Lean Social Democracies: Eastern Europe, India, South Africa, Latin America ...................................... 48 Flexibility and subcontracting coupled with widening access to democratic institutions: the NICs ................ 52 Concerns for Policy Makers ............................................................................................................................. 55
7. Conclusion ........................................................................................................................................57
Bibliography .........................................................................................................................................60
Appendix...............................................................................................................................................65
Tables and figures
Table 1: Annual World Trade Growth in Percentage Points, 1980-98 (Constant US$).............................................................. 2 Table 2: Trade as a Share of PPP GDP, 1990 & 1998 ................................................................................................................ 3 Table 3: Selected Indicators of Technological Change, by World Regions ................................................................................ 5 Table 4: Teledensity by Quintile and Location........................................................................................................................... 6 Table 5: Net Private Capital Flows and FDI by World Region & Income Class, 1990 & 1998 ($millions)............................... 7 Table 6: Foreign Direct Investment in 1998, by region and country........................................................................................... 8 Table 7: Surges in Private-to-Private Net Capital Inflows and Financial Crises......................................................................... 9 Table 8: Trends in Average Tariff Rates for Selected Developing Countries, 1990-99 (unweighted in per cent) .................. 10 Table 9: Protection on Merchandise Trade, 1995 ..................................................................................................................... 11 Table 10: Share of GDP by Economic Activity for Different World Regions (1980 & 1994) ................................................. 13 Table 11: Structure of Output in Developing Economies (value added as percentage of GDP) ............................................... 16 Table 12: Value-Added and Employment, by Country: 1990-1999.......................................................................................... 21 Table 13: Changing Shares of Employment by Main Sector: 1980-97..................................................................................... 22 Table 14: Share of Non-Production Worker Employment, by Country .................................................................................... 23 Table 15: Share of Employment of Highly Skilled Workers in Total Employment.................................................................. 25 Table 16: Production and Non-Production Wage Growth Rates............................................................................................... 26 Table 17: Ratio of Non-Production to Production Mean Wages, by Country........................................................................... 27 Table 18: Ratio of Non-Production to Production Wages in Manufacturing, by Country ........................................................ 27 Table 19: Share of Non-Production Worker Wage Bill in Total Wage Bill.............................................................................. 28 Table 20: Estimated Contribution of Trade, Technology and Education to Wage and Income Differentials in Chile.............. 31 Table 21: Impact of Foreign Ownership in the Manufacturing Industry on Wages in Venezuela and Mexico......................... 33 Table 22: Unemployment Rates During the 1990s ................................................................................................................... 35 Table 23: Ratio of Low-Level Educated to High-level Educated Unemployed ........................................................................ 36 Table 24: Unemployment and EAP Changes, by Education Level........................................................................................... 37 Table 25: Share of Unemployed with No Previous Work Experience or Occupation............................................................... 38 Table 26: Immigration to the USA, by Education Level, 1990................................................................................................. 39 Table 27: Remittances to Source Countries .............................................................................................................................. 40 Table 29: Hourly Compensation in Dollars for Manufacturing Production Workers in Selected Countries, 1992................... 50 Table 30: Employment distribution in Taiwan ......................................................................................................................... 54 Table 31: Highest levels of educational qualifications of employees ....................................................................................... 55 Table 32: Labour force participation rates ................................................................................................................................ 55

Figure 1: Relative Wage and Employment Dynamics in a Supply-Demand Framework ........................................................ 19 Figure 2: Ratio of Non-Production to Production Worker Employment................................................................................. 24 Figure 3: Wage Distributions for Domestic and Foreign Owned Manufacturing Firms in South Africa................................ 34 Tables and Figures in Appendix Table A1: Structure of Output in World’s Five Largest Economies ........................................................................................ 66 Table A2: Exports and Imports by World Region ($ Millions), 1990 & 1998........................................................................ 67 Table A3: Wage Differentials In Manufacturing .................................................................................................................... 67 Table A4: Share of Production Worker Employment, by Country ........................................................................................... 69 Table A5: Ratio of Non-Production to Production Worker Employment ................................................................................. 69 Figure A1: Value-Added & Employment in Agriculture, by Developing Country................................................................. 68 Figure A2: Value-Added & Employment in Services, by Developing Country ..................................................................... 68

1
1. Introduction
The concept of ‘globalization’ has disproportionately engaged the attention of
researchers, academics, policy makers and social activists the world over. More recently, and perhaps more overtly, the debate has shifted to the perceived consequences of this phenomenon, albeit its extremely broad and somewhat nebulous defining characteristics. At times, this reaction has been transformed into public displays of anger towards a system that is believed in some quarters to benefit the few at the expense of the many, and to perpetuate and exacerbate the poverty and inequality experienced by most of the world’s population today. This paper however does not profess to provide any fundamental evaluation of the impact of globalization on the developing world's growth and development trajectory. Instead the paper is narrower and more modest in its scope.
The intention is to try and characterize the phenomenon of globalization in its different manifestations, and to assess the relationship between globalization and poverty & inequality - both within and between countries. The key contribution of the paper though is its explicit focus on the labour market as the conduit through which the social and welfare impacts of globalization are transmitted. The intellectual anchor here is the notion that access to income determines the nature of household poverty and inequality in a society; and in all economies the labour market remains the key access point for this income accumulation. Simply put, the labour market remains the filter through which the distributional and poverty outcomes of globalization are shaped. It remains critical therefore that the impact of globalization on an economy's labour market is detailed. We hope therefore, in what follows, to provide a comprehensive snapshot, through marshalling secondary source data, of how the various components of globalization have significantly altered the functioning of labour markets in a large number of developing country economies.
The paper begins by defining globalization through its characterizing features. After considering the impact of globalization on poverty and inequality on the basis of existing evidence, the paper goes on to consider in detail the various channels through which globalization has impacted on (and will continue to) the functioning of labour markets in the developing world.
2. Defining and Characterizing Globalization
The word 'globalization' remains a composite term utilized to capture a variety of contrasting phenomenon that are often, in and of themselves complex and multi-faceted. In its simplest form, globalization is meant to impart the notion that the world through its numerous nation-states has increased its inter-connectedness at a tremendous pace over the last two to three decades1. We will concentrate here purely on the economic manifestations of globalization. We deliberately ignore therefore issues relating to for example, culture, crime, environmental degradation, that are clearly essential to a more complete appreciation of the phenomenon of globalization.
1 Indeed the idea that this is a new phenomenon is of course correctly challenged by many observers, who note that the 20th century as a whole was shaped by the forces of globalization (World Bank, 2000). A more exact representation of this emphasis on the last two to three decades, is that the pace of globalization increased more dramatically than in any other period in the 20th century.
2
Given the above emphasis we can thus identify five key economic markers of globalization. These are:
1. The growth in trade flows between economies around the globe.
2. The proliferation of ICTs, captured more specifically as technological change
3. The rapid growth in cross-border capital flows
4. Intensive tariff liberalization, accompanied by the formation of a number of regional trade blocs and
5. The significant structural changes in domestic economies away from primary production towards service industry output
We turn now to dealing discretely with each of these markers of globalization. It has to be remembered that the above four are all intricately inter-linked. Trade flows for example have undoubtedly facilitated the spread of ICTs ; changes in trade policy regimes have encouraged or hindered trade flow trends and so on. As alluded to above, the period of globalization will refer here to the period beginning in the early 1980s, although it is recognized that more generally this period does not capture the full evolution of world economic integration.
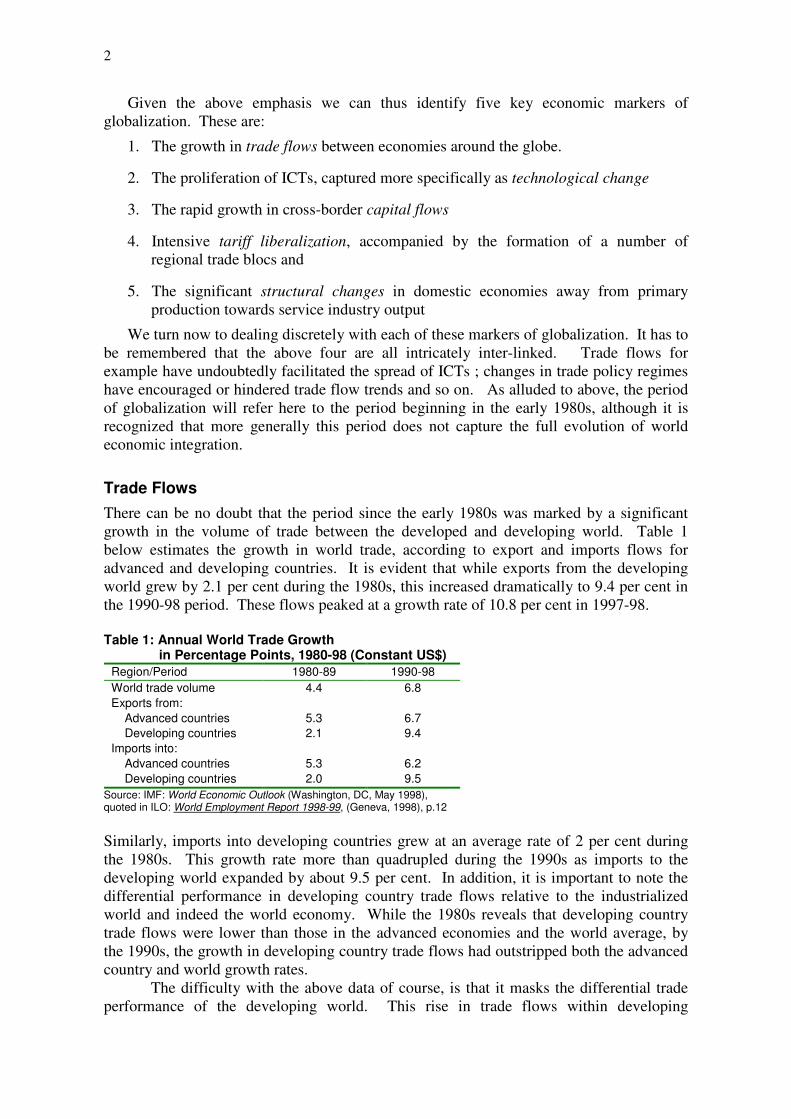
Trade Flows There can be no doubt that the period since the early 1980s was marked by a significant growth in the volume of trade between the developed and developing world. Table 1 below estimates the growth in world trade, according to export and imports flows for advanced and developing countries. It is evident that while exports from the developing world grew by 2.1 per cent during the 1980s, this increased dramatically to 9.4 per cent in the 1990-98 period. These flows peaked at a growth rate of 10.8 per cent in 1997-98. Table 1: Annual World Trade Growth in Percentage Points, 1980-98 (Constant US$)
Region/Period 1980-89 1990-98 World trade volume 4.4 6.8 Exports from: Advanced countries Developing countries
5.3 2.1
6.7 9.4
Imports into: Advanced countries Developing countries
5.3 2.0
6.2 9.5
Source: IMF: World Economic Outlook (Washington, DC, May 1998), quoted in ILO: World Employment Report 1998-99, (Geneva, 1998), p.12
Similarly, imports into developing countries grew at an average rate of 2 per cent during the 1980s. This growth rate more than quadrupled during the 1990s as imports to the developing world expanded by about 9.5 per cent. In addition, it is important to note the differential performance in developing country trade flows relative to the industrialized world and indeed the world economy. While the 1980s reveals that developing country trade flows were lower than those in the advanced economies and the world average, by the 1990s, the growth in developing country trade flows had outstripped both the advanced country and world growth rates.
The difficulty with the above data of course, is that it masks the differential trade performance of the developing world. This rise in trade flows within developing
3
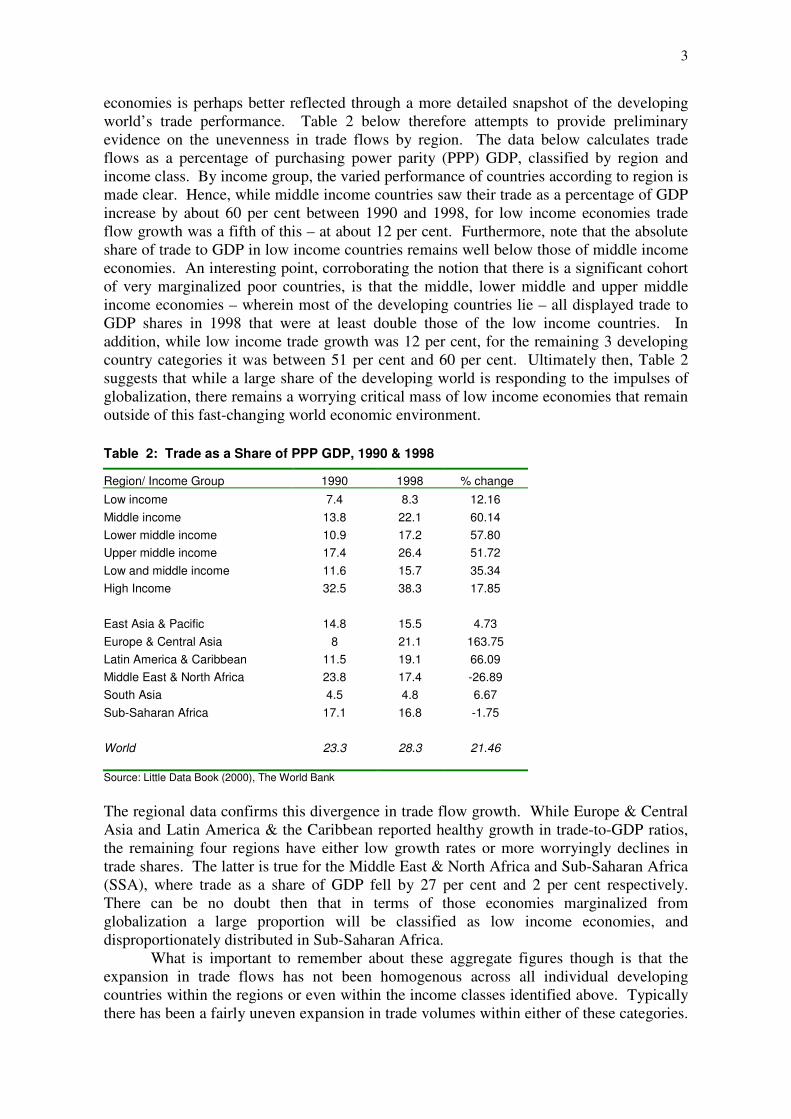
economies is perhaps better reflected through a more detailed snapshot of the developing world’s trade performance. Table 2 below therefore attempts to provide preliminary evidence on the unevenness in trade flows by region. The data below calculates trade flows as a percentage of purchasing power parity (PPP) GDP, classified by region and income class. By income group, the varied performance of countries according to region is made clear. Hence, while middle income countries saw their trade as a percentage of GDP increase by about 60 per cent between 1990 and 1998, for low income economies trade flow growth was a fifth of this – at about 12 per cent. Furthermore, note that the absolute share of trade to GDP in low income countries remains well below those of middle income economies. An interesting point, corroborating the notion that there is a significant cohort of very marginalized poor countries, is that the middle, lower middle and upper middle income economies – wherein most of the developing countries lie – all displayed trade to GDP shares in 1998 that were at least double those of the low income countries. In addition, while low income trade growth was 12 per cent, for the remaining 3 developing country categories it was between 51 per cent and 60 per cent. Ultimately then, Table 2 suggests that while a large share of the developing world is responding to the impulses of globalization, there remains a worrying critical mass of low income economies that remain outside of this fast-changing world economic environment.
Table 2: Trade as a Share of PPP GDP, 1990 & 1998
Region/ Income Group 1990 1998 % change Low income 7.4 8.3 12.16 Middle income 13.8 22.1 60.14 Lower middle income 10.9 17.2 57.80 Upper middle income 17.4 26.4 51.72 Low and middle income 11.6 15.7 35.34 High Income 32.5 38.3 17.85 East Asia & Pacific 14.8 15.5 4.73 Europe & Central Asia 8 21.1 163.75 Latin America & Caribbean 11.5 19.1 66.09 Middle East & North Africa 23.8 17.4 -26.89 South Asia 4.5 4.8 6.67 Sub-Saharan Africa 17.1 16.8 -1.75 World 23.3 28.3 21.46 Source: Little Data Book (2000), The World Bank The regional data confirms this divergence in trade flow growth. While Europe & Central Asia and Latin America & the Caribbean reported healthy growth in trade-to-GDP ratios, the remaining four regions have either low growth rates or more worryingly declines in trade shares. The latter is true for the Middle East & North Africa and Sub-Saharan Africa (SSA), where trade as a share of GDP fell by 27 per cent and 2 per cent respectively. There can be no doubt then that in terms of those economies marginalized from globalization a large proportion will be classified as low income economies, and disproportionately distributed in Sub-Saharan Africa.
What is important to remember about these aggregate figures though is that the expansion in trade flows has not been homogenous across all individual developing countries within the regions or even within the income classes identified above. Typically there has been a fairly uneven expansion in trade volumes within either of these categories.
4
However, even at the individual country level, these divergences in trade flows are evident. In the typology of Dollar & Kraay (2001), one can distinguish between developing countries that are 'globalizers' and those that are 'non-globalizers'. The former, for example, expanded their trade-to-GDP ratios from 16 per cent in the 1960s to 33 per cent of GDP in the 1990s. Conversely the second set of developing economies witnessed their trade volumes decline from 60 per cent to 49 per cent over the same period. One of the difficulties with this nomenclature though is that despite the decline in trade volumes for the non-globalizers, the absolute value of their trade volumes remains much higher than those of the globalizers. It remains true however that within this cohort of non-globalizing developing countries, the world's poorest nations are disproportionately represented. Their trade with the rest of the world continues to stagnate, and rather than being affected adversely or positively from this specific component of globalization, these economies continue to remain firmly outside the world trading system.
This very brief overview makes it clear firstly, that one of the first key markers of globalization is the increased propensity, on average, for developing countries to export and import goods and services. These growing trade flows suggest that on average, a large proportion of the developing world are displaying a fairly high response rate to the changing world trade system. One of the important caveats to this trend however is that a core of the least developed economies, whether identified as individual economies, region or income class, continue to remain excluded from this growing incidence of world trade. The character of the trade response in the different developing countries will in turn have a set of specific labour market outcomes. We hope, in the sections below to deal very specifically with the impact that increased trade flows have had on labour markets in the developing world.
Technological Change As mentioned above, there can be no doubt that greater trade integration between economies has affected (and is affected by) the process of technological change within individual economies. The purpose here is to recognize this linkage, but then to simply document the existence of technological change and technology deepening that has occurred within the developing world. At the same time however, we will verify the existence of this maldistribution of accumulation in technology both between and within individual developing countries – a process that has become popularly known as the ‘digital divide’.
One of the key differences between the evolution of globalization before the 1980s and the period thereafter, is that the post-1980 period is marked by the spread of the micro-electronics revolution. The proliferation of Information and Communication Technologies (ICTs) has forever altered the manner in which enterprises function, compete and trade. The advent of the ICT revolution promises the potential for example, for firms to improve internal efficiency, increase productivity and make the geographical distance between buyer and seller obsolete.
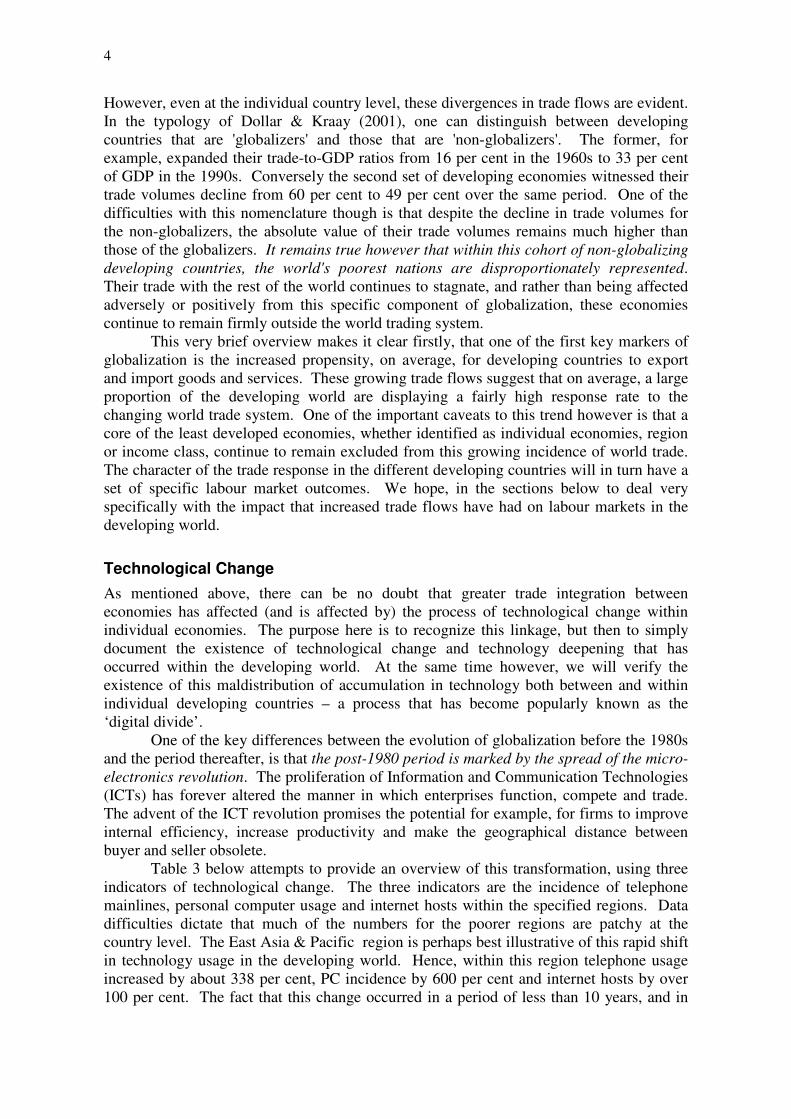
Table 3 below attempts to provide an overview of this transformation, using three indicators of technological change. The three indicators are the incidence of telephone mainlines, personal computer usage and internet hosts within the specified regions. Data difficulties dictate that much of the numbers for the poorer regions are patchy at the country level. The East Asia & Pacific region is perhaps best illustrative of this rapid shift in technology usage in the developing world. Hence, within this region telephone usage increased by about 338 per cent, PC incidence by 600 per cent and internet hosts by over 100 per cent. The fact that this change occurred in a period of less than 10 years, and in
5
the case of internet usage 3 years, is powerfully indicative of the intensive influence of ICTs in the developing world. Table 3: Selected Indicators of Technological Change, by World Regions
Year Telephone mainlines (per 1000 people)
Personal computers (per 1000 people)
Internet hosts (per 10 000 people)*
World 1990 100 25 34.8 1998 146 71 120.02 % Change 46.00 184.00 244.89
East Asia & Pacific 1990 16 2 1.28 1998 70 14 2.69 % Change 337.50 600.00 110.16
Europe & central Asia 1990 125 18 6.21 1998 200 35 18.87 % Change 60.00 94.44 203.86
Latin America & Caribbean 1990 64 6 3.48 1998 123 34 22.33 % Change 92.19 466.67 541.67
M.East & N.Africa 1990 37 10 0.2 1998 81 … 0.55 % Change 118.92 n.a. 175.00
South Asia 1990 6 0 0.06 1998 19 3 0.22 % Change 216.67 n.a. 266.67
Sub-Saharan Africa 1990 10 7 2.03 1998 14 .. 2.73 % Change 40.00 n.a. 34.48 *: These estimates are for the period 1997-2000 Source: Little Data Book (2000), The World Bank & World Development Report, 2000/1.
Despite this, it is clear that there remains a divergence in technology adoption across the developing world. Sub-Saharan Africa, once again, is indicative of this divergence: While internet hosts increased by over 500 per cent in Latin America & the Caribbean, in Africa the adoption rate was a mere 34 per cent. While there are 123 telephone mainlines per 1000 individuals in the former region, for SSA, the figure is 14. Technological accumulation rates are clearly diverging between economies within the developing world. An interesting reflection of the manner in which SSA is falling behind in this process is that in 1990, SSA had a greater spread of telephone mainlines than South Asia. However, 8 years later, the position had reversed with South Asia’s adoption of telecommunications greater than that of SSA.
The import of technology and the rate of accumulation amongst developing countries is that it remains a necessary (though not sufficient) condition for growth and development. Research has pointed to the fact that poor access to and accumulation of technology amongst developing countries may act as a hindrance to being able to fully exploit the advantages posed by trade and investment flows (Grace et al,2001). An estimate by Elbadawi (1999) showed that half of the difference in African exports of manufactures relative to East Asia was a result of the poor technology endowments in SSA. The variable (interestingly) used to proxy for this technology difference was the number of fax machines per 1000 individuals in each of the regions. Clearly this should be taken to represent the existence (or lack thereof) of ICTs in the two regions and is a particularly powerful reflection of the importance of technology in securing a competitive
6
and growth advantage in the developing world. To put its importance into perspective, the share of corruption in explaining the difference in export performance was 4 per cent and that of infrastructure 27 per cent (Elbadawi,1999).
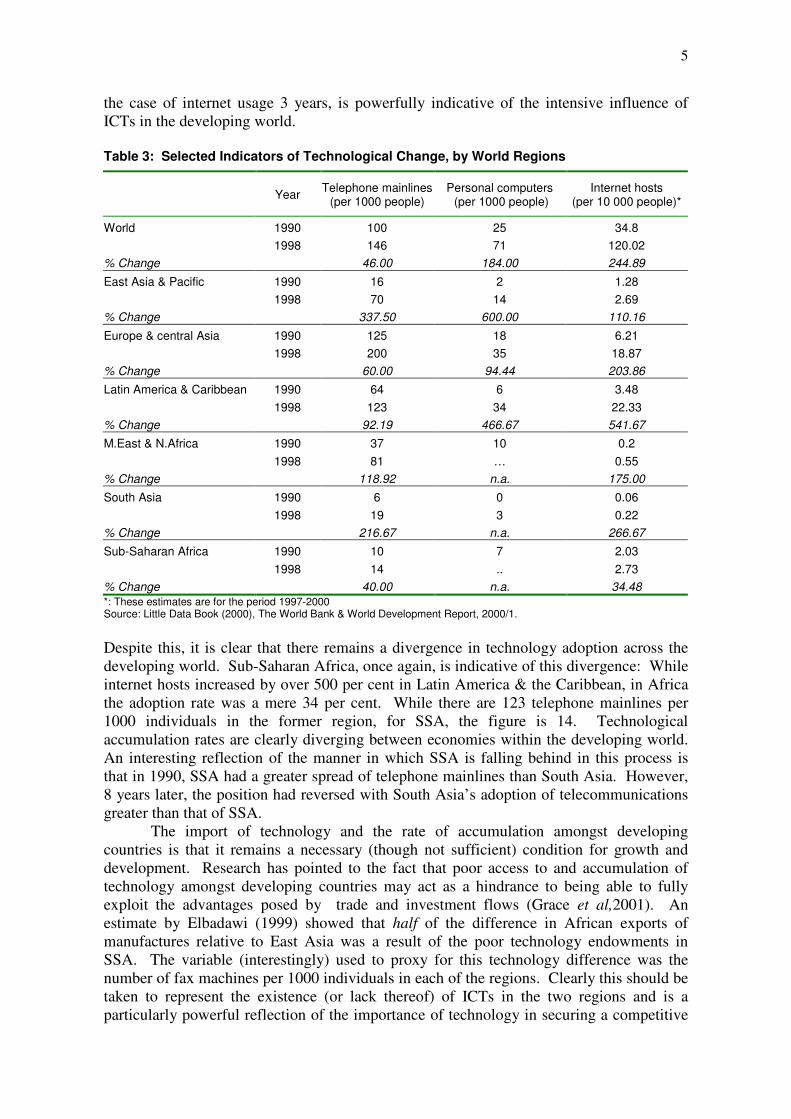
A final point to consider in the technology arena is that it poses critical within-country as well as between-country challenges for many developing economies. Hence, while the digital divide is undoubtedly operative between the developing and the developed world, there remain severe differentials within countries. This in turn will exacerbate existing inequalities within societies. Lack of access to technology then is likely to endure as a critical endowment in predicting levels of income and, by implication, levels of poverty within any given cohort. Evidence from a variety of sources already points to the fact that lower educated individuals, households in rural areas and females have a higher probability of yielding low levels of technology access and accumulation. The table below, shows that on one measure of technology, teledensity, there are significant differences by income levels. For example, in Nepal while 11 per cent of the wealthiest quintile of households have access to a phone, the figure is close to zero for all other dwellings in the society. Table 4: Teledensity by Quintile and Location
Poorest Quintile Quintile 2 Quintile 3 Quintile 4 Richest
Quintile Urban
teledensity Rural
teledensity
Nepal 0 0 0 0.5 11.0 10.38 0.11 Panama 1.7 11.0 27.5 51.5 73.8 57.45 9.27 South Africa 0.6 4.7 14.7 33.3 75.0 46.42 10.72 Source: Grace et al (2000), & October Household Survey,1995 for South African data.
In South Africa and Panama, while the distributions are more even, the difference as one moves up the income distribution is stark. For example, while over three-quarters of all households in South Africa and Panama have access to a telephone, this figure is 1.7 per cent and 0.6 per cent for the 2 countries amongst the poorest quintile. In addition, the spatial divide makes it plain that any rural development strategy, aimed at supporting and growing the incomes of the rural poor would have to address the issue of improving access to ICTs.
This cursory and no doubt inadequately detailed section has made it plain that technology is a critical marker of economic globalization. Importantly it remains a vital ingredient to the process of growth and development in the developing world. As such then, divergence in rates of technological accumulation would mean divergences in growth and development. The fact that these differentials in technology operate at both the inter- and intra-country level suggests that an international and domestic growth challenge arises from poor technology accumulation rates. Below, we will of course elucidate on the role of technology ( as a sub-component of economic globalization) in impacting on labour markets in the developing world.
Financial Flows
One of the equally visible developments in the world economy since the 1980s has been the proliferation of private capital flows and foreign direct investment into the developing world. There can be no doubt that the ICT revolution, the increase in asset class categories open to foreign investors and the more active behaviour of multi-national corporations has spurred this growth in capital flows.
7
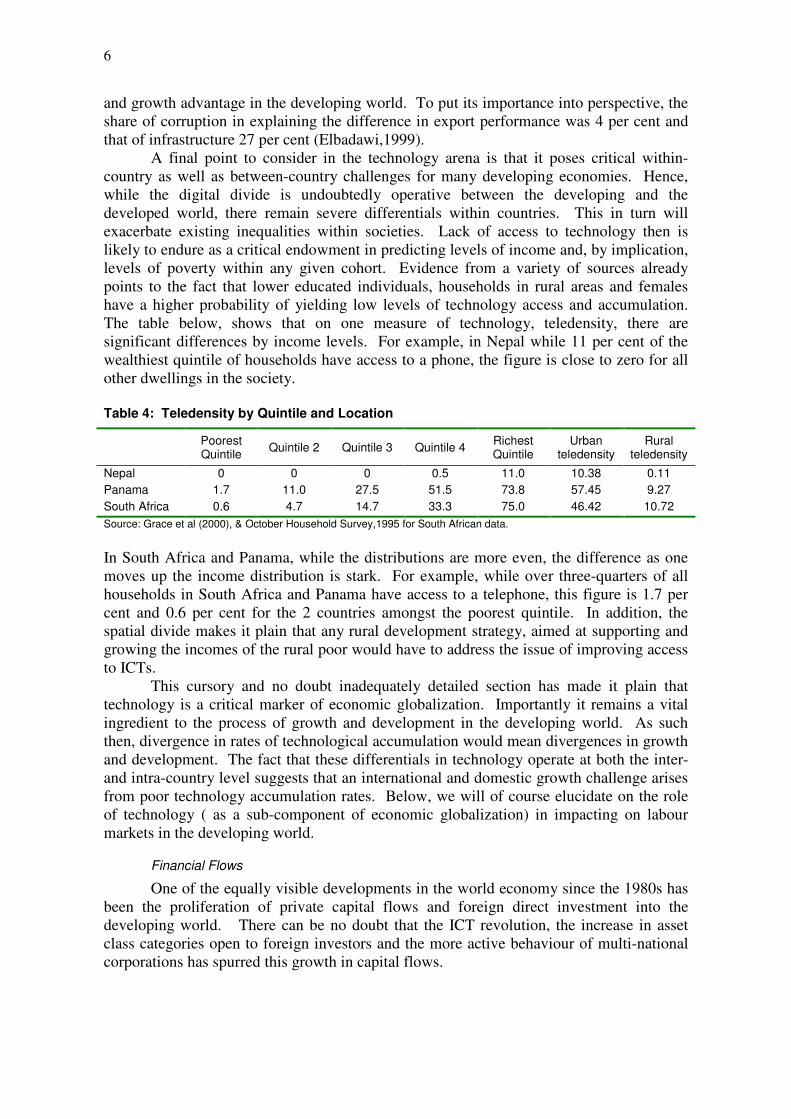
Table 5 below provides a post –1990 assessment of the trends in FDI and private capital flows by world region and income class. A perusal of the figures across all categories indicates, in the first instance, that FDI and net private capital flows grew much more rapidly than trade flows. It would seem then that in terms of integration in the goods and services markets, it is these financial flows rather than trade flows that are the key marker of economic globalization. For example, while low income FDI grew by over 350 per cent between 1990 and 1998, trade-to-GDP ratios for this category of economies grew by 12 per cent over the same period. Indeed, the table makes it clear that the lowest rate of increase for either form of financial flows was an 84 per cent growth in capital flows for low income economies. Table 5: Net Private Capital Flows and FDI by World Region & Income Class, 1990 & 1998
($millions)
Net Private Capital Flows FDI 1990 1998 % Change 1990 1998 % Change
World .. .. .. 193382 619258 220.23 Low income 6648 12231 83.98 2201 10674 384.96 Middle income 38959 255469 555.74 21929 160267 630.84 Lower middle income .. .. .. .. .. .. Upper middle income .. .. .. .. .. .. Low and middle income 42606 267700 528.32 24130 170942 608.42 High Income .. .. 169252 448316 164.88 East Asia & Pacific 18720 67249 259.24 11135 64162 476.22 Europe & Central Asia 7649 53342 597.37 1051 24350 2216.84 Latin America & Caribbean 12412 126854 922.03 8188 69323 746.64 Middle East & North Africa 369 9223 2399.46 2458 5054 105.61 South Asia 2174 7581 248.71 464 3659 688.58 Sub-Saharan Africa (SSA) 1283 3452 169.06 834 4364 423.26 Source: World Development Report, 2000/1
Figures for net private capital flows by region indicate a massive rise in the Middle East & North Africa region, where these net flows increased by over 2000 per cent in the 8-year period. This was however, off an extremely low base of $369 million capital flows in 1990, explained no doubt in part by the poor reporting in the individual countries that make up this region2. Perhaps more pertinent are the figures for Latin America & the Caribbean where net private capital flows and FDI flows increased by 922 per cent and 747 per cent respectively. This is reflected at the country level, where a significant number of the larger economies in the region yielded very high growth rates in financial flows. The unevenness in these flows however is a reflection of the differentials in country and regional experiences of globalization. The data shows for example, that in 1998 SSA received 0.7 per cent of all FDI recorded in the world. The figure for Latin America & the Caribbean was 11 per cent and East Asia & the Pacific, 10 per cent. Note that despite the 423 per cent increase in FDI flows for SSA over the period, as a share of total FDI flows, the growth rate here was far below that of the Latin America & the Caribbean and East Asia & the Pacific regions. As with trade flow trends therefore, and indeed the discussion on
2 No data exists for example on Oman, Djibouti, Saudi Arabia, Iraq, Libya, Jordan, the West Bank & Gaza, Bahrain, Qatar and the UAE.
8
technological change, there is clearly a disproportionate share of developing country FDI and private capital flows being diverted to specific regions of the world.
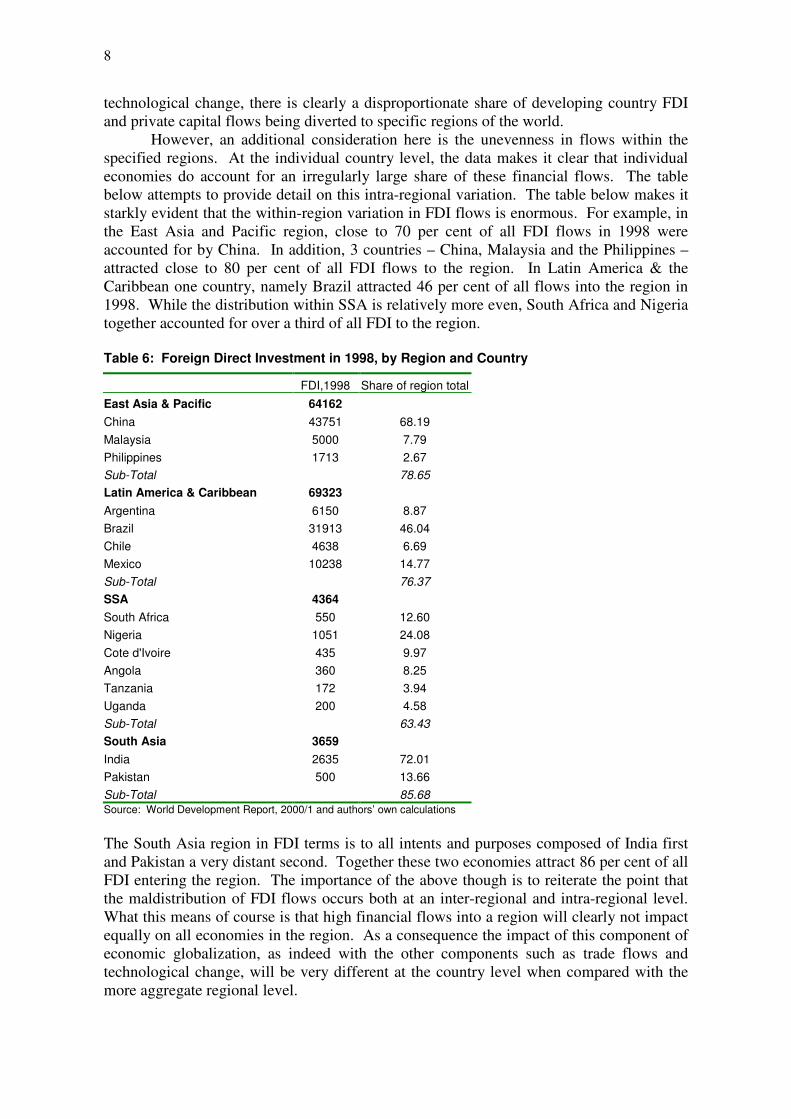
However, an additional consideration here is the unevenness in flows within the specified regions. At the individual country level, the data makes it clear that individual economies do account for an irregularly large share of these financial flows. The table below attempts to provide detail on this intra-regional variation. The table below makes it starkly evident that the within-region variation in FDI flows is enormous. For example, in the East Asia and Pacific region, close to 70 per cent of all FDI flows in 1998 were accounted for by China. In addition, 3 countries – China, Malaysia and the Philippines – attracted close to 80 per cent of all FDI flows to the region. In Latin America & the Caribbean one country, namely Brazil attracted 46 per cent of all flows into the region in 1998. While the distribution within SSA is relatively more even, South Africa and Nigeria together accounted for over a third of all FDI to the region. Table 6: Foreign Direct Investment in 1998, by Region and Country
FDI,1998 Share of region total East Asia & Pacific 64162 China 43751 68.19 Malaysia 5000 7.79 Philippines 1713 2.67 Sub-Total 78.65 Latin America & Caribbean 69323 Argentina 6150 8.87 Brazil 31913 46.04 Chile 4638 6.69 Mexico 10238 14.77 Sub-Total 76.37 SSA 4364 South Africa 550 12.60 Nigeria 1051 24.08 Cote d'Ivoire 435 9.97 Angola 360 8.25 Tanzania 172 3.94 Uganda 200 4.58 Sub-Total 63.43 South Asia 3659 India 2635 72.01 Pakistan 500 13.66 Sub-Total 85.68 Source: World Development Report, 2000/1 and authors’ own calculations The South Asia region in FDI terms is to all intents and purposes composed of India first and Pakistan a very distant second. Together these two economies attract 86 per cent of all FDI entering the region. The importance of the above though is to reiterate the point that the maldistribution of FDI flows occurs both at an inter-regional and intra-regional level. What this means of course is that high financial flows into a region will clearly not impact equally on all economies in the region. As a consequence the impact of this component of economic globalization, as indeed with the other components such as trade flows and technological change, will be very different at the country level when compared with the more aggregate regional level.
9
One of the new considerations in the era of globalization in the 1990s relates to the proliferation of private capital flows in the developing world. Such portfolio investment does remain a double-edged sword. While such investment does provide much-needed domestic capital market liquidity to a developing country, its short-term nature increases the propensity for financial crises. These crises are essentially driven by large unexpected fluctuations in these portfolio investments, resulting often in domestic market destabilization.
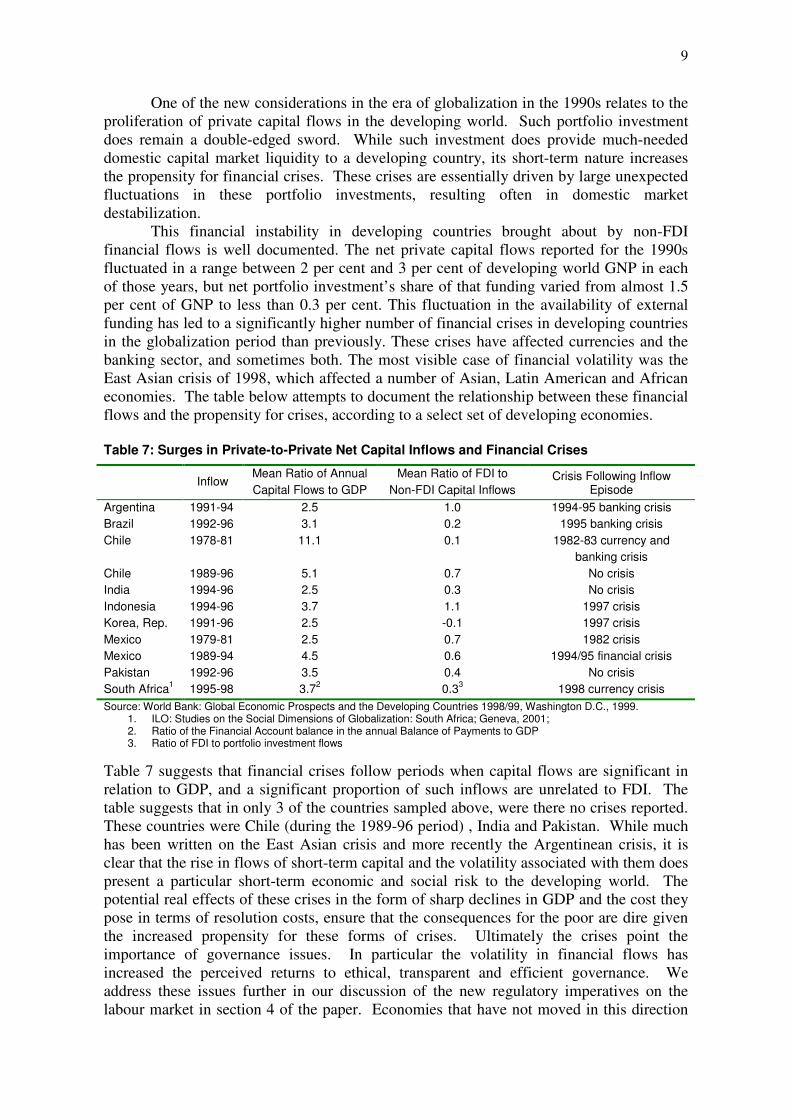
This financial instability in developing countries brought about by non-FDI financial flows is well documented. The net private capital flows reported for the 1990s fluctuated in a range between 2 per cent and 3 per cent of developing world GNP in each of those years, but net portfolio investment’s share of that funding varied from almost 1.5 per cent of GNP to less than 0.3 per cent. This fluctuation in the availability of external funding has led to a significantly higher number of financial crises in developing countries in the globalization period than previously. These crises have affected currencies and the banking sector, and sometimes both. The most visible case of financial volatility was the East Asian crisis of 1998, which affected a number of Asian, Latin American and African economies. The table below attempts to document the relationship between these financial flows and the propensity for crises, according to a select set of developing economies. Table 7: Surges in Private-to-Private Net Capital Inflows and Financial Crises
Inflow Mean Ratio of Annual Capital Flows to GDP
Mean Ratio of FDI to Non-FDI Capital Inflows
Crisis Following Inflow Episode
Argentina 1991-94 2.5 1.0 1994-95 banking crisis Brazil 1992-96 3.1 0.2 1995 banking crisis Chile 1978-81 11.1 0.1 1982-83 currency and
banking crisis Chile 1989-96 5.1 0.7 No crisis India 1994-96 2.5 0.3 No crisis Indonesia 1994-96 3.7 1.1 1997 crisis Korea, Rep. 1991-96 2.5 -0.1 1997 crisis Mexico 1979-81 2.5 0.7 1982 crisis Mexico 1989-94 4.5 0.6 1994/95 financial crisis Pakistan 1992-96 3.5 0.4 No crisis South Africa1 1995-98 3.72 0.33 1998 currency crisis Source: World Bank: Global Economic Prospects and the Developing Countries 1998/99, Washington D.C., 1999.
1. ILO: Studies on the Social Dimensions of Globalization: South Africa; Geneva, 2001; 2. Ratio of the Financial Account balance in the annual Balance of Payments to GDP 3. Ratio of FDI to portfolio investment flows
Table 7 suggests that financial crises follow periods when capital flows are significant in relation to GDP, and a significant proportion of such inflows are unrelated to FDI. The table suggests that in only 3 of the countries sampled above, were there no crises reported. These countries were Chile (during the 1989-96 period) , India and Pakistan. While much has been written on the East Asian crisis and more recently the Argentinean crisis, it is clear that the rise in flows of short-term capital and the volatility associated with them does present a particular short-term economic and social risk to the developing world. The potential real effects of these crises in the form of sharp declines in GDP and the cost they pose in terms of resolution costs, ensure that the consequences for the poor are dire given the increased propensity for these forms of crises. Ultimately the crises point the importance of governance issues. In particular the volatility in financial flows has increased the perceived returns to ethical, transparent and efficient governance. We address these issues further in our discussion of the new regulatory imperatives on the labour market in section 4 of the paper. Economies that have not moved in this direction
10
have been those most vulnerable to external financial shocks (World Bank, 2000). In addition, the crises continue to raise the importance of an effective international financial architecture that would in part protect the developing world from what has become a very visible, but negative, consequences of economic globalization.
Trade Policy Regime Shifts
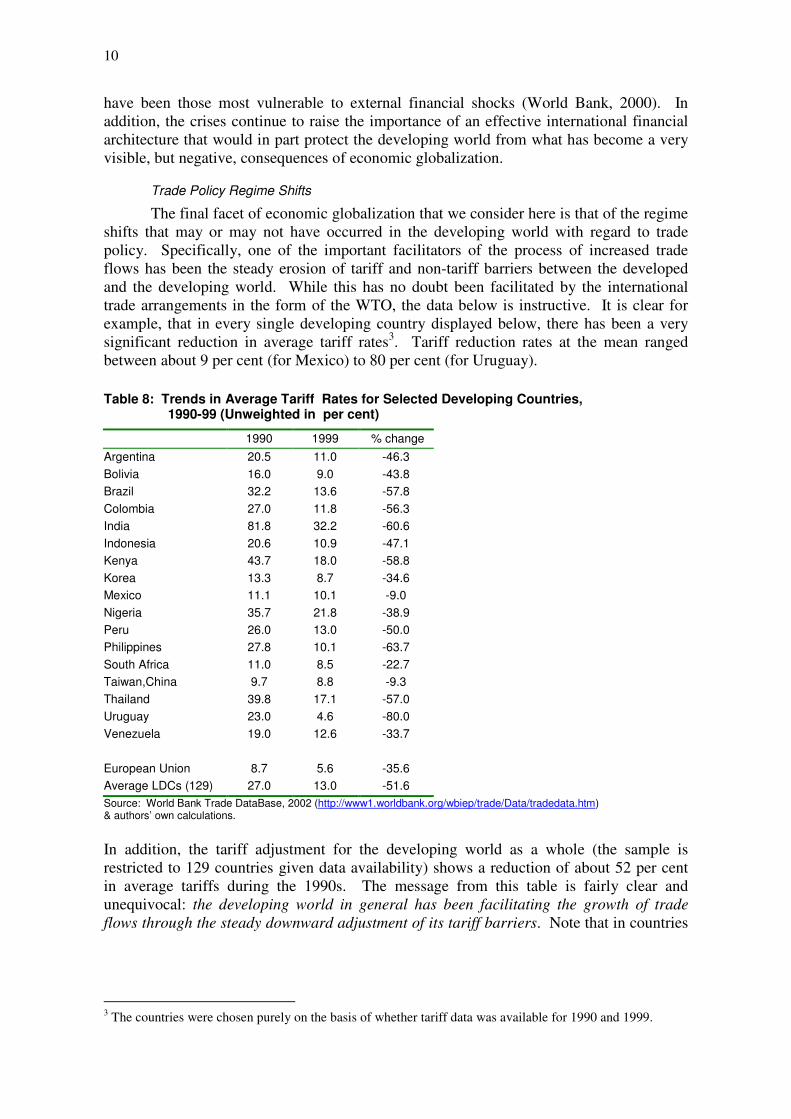
The final facet of economic globalization that we consider here is that of the regime shifts that may or may not have occurred in the developing world with regard to trade policy. Specifically, one of the important facilitators of the process of increased trade flows has been the steady erosion of tariff and non-tariff barriers between the developed and the developing world. While this has no doubt been facilitated by the international trade arrangements in the form of the WTO, the data below is instructive. It is clear for example, that in every single developing country displayed below, there has been a very significant reduction in average tariff rates3. Tariff reduction rates at the mean ranged between about 9 per cent (for Mexico) to 80 per cent (for Uruguay).
Table 8: Trends in Average Tariff Rates for Selected Developing Countries, 1990-99 (Unweighted in per cent)
1990 1999 % change Argentina 20.5 11.0 -46.3 Bolivia 16.0 9.0 -43.8 Brazil 32.2 13.6 -57.8 Colombia 27.0 11.8 -56.3 India 81.8 32.2 -60.6 Indonesia 20.6 10.9 -47.1 Kenya 43.7 18.0 -58.8 Korea 13.3 8.7 -34.6 Mexico 11.1 10.1 -9.0 Nigeria 35.7 21.8 -38.9 Peru 26.0 13.0 -50.0 Philippines 27.8 10.1 -63.7 South Africa 11.0 8.5 -22.7 Taiwan,China 9.7 8.8 -9.3 Thailand 39.8 17.1 -57.0 Uruguay 23.0 4.6 -80.0 Venezuela 19.0 12.6 -33.7 European Union 8.7 5.6 -35.6 Average LDCs (129) 27.0 13.0 -51.6 Source: World Bank Trade DataBase, 2002 (http://www1.worldbank.org/wbiep/trade/Data/tradedata.htm) & authors’ own calculations.
In addition, the tariff adjustment for the developing world as a whole (the sample is restricted to 129 countries given data availability) shows a reduction of about 52 per cent in average tariffs during the 1990s. The message from this table is fairly clear and unequivocal: the developing world in general has been facilitating the growth of trade flows through the steady downward adjustment of its tariff barriers. Note that in countries
3 The countries were chosen purely on the basis of whether tariff data was available for 1990 and 1999.
11
where the adjustment was relatively low – Taiwan, Mexico and South Africa for example, the initial value of average tariffs was also relatively low4.
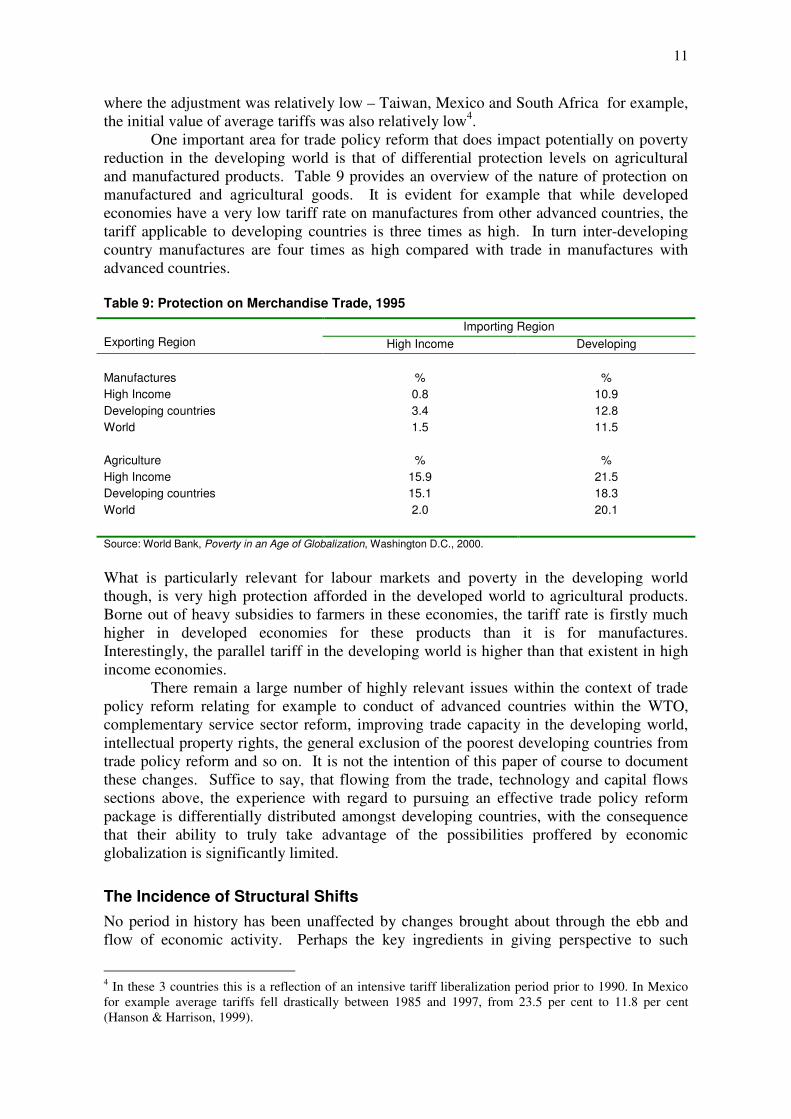
One important area for trade policy reform that does impact potentially on poverty reduction in the developing world is that of differential protection levels on agricultural and manufactured products. Table 9 provides an overview of the nature of protection on manufactured and agricultural goods. It is evident for example that while developed economies have a very low tariff rate on manufactures from other advanced countries, the tariff applicable to developing countries is three times as high. In turn inter-developing country manufactures are four times as high compared with trade in manufactures with advanced countries. Table 9: Protection on Merchandise Trade, 1995
Importing Region Exporting Region High Income Developing Manufactures % % High Income Developing countries World
0.8 3.4 1.5
10.9 12.8 11.5
Agriculture % % High Income Developing countries World
15.9 15.1 2.0
21.5 18.3 20.1
Source: World Bank, Poverty in an Age of Globalization, Washington D.C., 2000.
What is particularly relevant for labour markets and poverty in the developing world though, is very high protection afforded in the developed world to agricultural products. Borne out of heavy subsidies to farmers in these economies, the tariff rate is firstly much higher in developed economies for these products than it is for manufactures. Interestingly, the parallel tariff in the developing world is higher than that existent in high income economies.
There remain a large number of highly relevant issues within the context of trade policy reform relating for example to conduct of advanced countries within the WTO, complementary service sector reform, improving trade capacity in the developing world, intellectual property rights, the general exclusion of the poorest developing countries from trade policy reform and so on. It is not the intention of this paper of course to document these changes. Suffice to say, that flowing from the trade, technology and capital flows sections above, the experience with regard to pursuing an effective trade policy reform package is differentially distributed amongst developing countries, with the consequence that their ability to truly take advantage of the possibilities proffered by economic globalization is significantly limited.
The Incidence of Structural Shifts No period in history has been unaffected by changes brought about through the ebb and flow of economic activity. Perhaps the key ingredients in giving perspective to such
4 In these 3 countries this is a reflection of an intensive tariff liberalization period prior to 1990. In Mexico for example average tariffs fell drastically between 1985 and 1997, from 23.5 per cent to 11.8 per cent (Hanson & Harrison, 1999).
12
changes in economic activity have been the growth of employment and the growth of economic output generated out of it. This remains true even where the rhythm and tempo of this change has been slow and it remains true despite the relatively dispersed degree of structural and institutional variations, which exist in each specific country. Two closely related but independent endogenous forces have been instrumental in accelerating the pace of these changes: capital accumulation and technological change and we shall provide pointers to them in our overview, which reflects on the conditions within specific countries. Increased labour productivity and increased output within firms facilitates capital accumulation or capital intensification, particularly where the market is competitively structured and regulated so that firms are price responsive within their core factor markets. At the same time, the imperative to generate equivalent results through the ambit of new technologies by either renewing or improving what exits in firms generally become a new index in defining the benchmark for firms in the sector. It would seem that all new firms would have to be judged in its capital endowment and acquisition by the benchmark in the capital endowments of already existing firms. Similar criteria would define what the wages and skills level of the workforce is, but the bidding process would be established through the temporal results of the market mechanism. Ultimately however, these benchmarks establish the criteria by which firms are judged and the results are reconciled and assessed at the end of each year. The effects of the above process would be manifest in a careful scrutiny of the available data. Even though such data is normally limited, productivity changes would be suggestive of a growing capital intensity within firms. Changes in technology would operate in tandem. However where an incremental shift in productivity is discernable coupled with significant shifts either upwards or downwards in employment, it implies that the data symbolizes a dual process of production method changes in which capital accumulation and technological changes are central.
Normally operating in tandem to the above is a combination of endogenous and exogenously induced changes. These usually contribute to some variation in the growth rates between different sectors of the economy. The exogenous changes include changes in consumer preferences as well as the organizational and size structure of firms in the sector and the manner that this correlates to production outputs within the sector. Highly monopolistic sectors are normally a disincentive for high risk investment initiatives from new and smaller companies. In such an event, the structure of the sector can determine its dynamism. Sectors that have a more overt monopolistic structure are not likely to engage in capital investment if there is no imperative for this to happen. Relatively stagnate sectors are not likely to employ new workers, but they are likely to shed them. Dynamic sectors will show the reverse: but exhibit high levels of aggregate productivity and productivity per unit of labour input. Hence, in instances where labour market statistics are the only available source of data depicting either of the above process of static or dynamic change, it is incumbent on economic analysts to draw the inferences, which are most likely to remain invisible without thorough probing. Therefore the record of shifts in the employment composition of the labour force is central to understand the process.
Within the context of these shifts in employment that are induced through capital intensification and technological change, a simultaneous shift in the skills that employers require from the workforce is initiated. While the immediate effect of this is for a demand in new skills, the accumulated effect of this gradually becomes inscribed in the skills composition of the entire workforce. As the process become long term and systemic setting new benchmarks in what firms regard as basic to operate the new capital and technology, there is a corresponding process of job segmentation and redefinition within the occupational structure of firms. Where the changes are systematic, new job categories are spawned. The evidence and the consensus around it is that the shift towards computer
13
aided machinery that stems from the microelectronics revolution seems to favour the employment of skilled workers over unskilled. This is generally because numerically controlled machinery requires a high level of conceptual and numerical literacy among employees such as the ability to read machine manuals and undertake basic programming particularly where changes in batch production manufacturing are required. At the level of production outputs, the shift from mass to batch production methods, which characterized the evolution from a phase of Fordist to post-Fordism industrial organization, had repercussions for the skill composition of the workforce. The shift suggests that that a more highly skilled workforce would form the bastion or core of the employment force within these reconfigured organizational regimes. Again, the accumulation of changes in the skills demanded within firms leads eventually to shifts and a realignment at an occupational level. These shifts are pertinently captured through employment and occupational decompositions and the data that we have assembled provides strong evidence that the process alluded to above is being manifested at a global level.
Structural Shifts in the World Economy
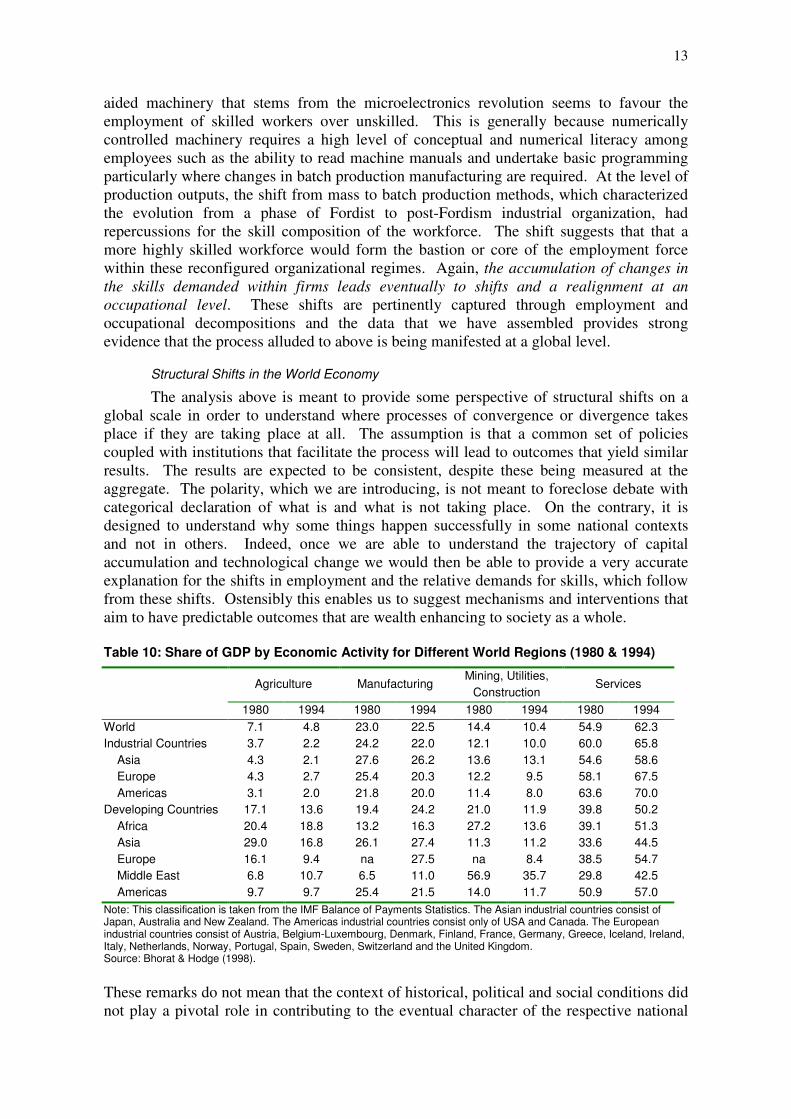
The analysis above is meant to provide some perspective of structural shifts on a global scale in order to understand where processes of convergence or divergence takes place if they are taking place at all. The assumption is that a common set of policies coupled with institutions that facilitate the process will lead to outcomes that yield similar results. The results are expected to be consistent, despite these being measured at the aggregate. The polarity, which we are introducing, is not meant to foreclose debate with categorical declaration of what is and what is not taking place. On the contrary, it is designed to understand why some things happen successfully in some national contexts and not in others. Indeed, once we are able to understand the trajectory of capital accumulation and technological change we would then be able to provide a very accurate explanation for the shifts in employment and the relative demands for skills, which follow from these shifts. Ostensibly this enables us to suggest mechanisms and interventions that aim to have predictable outcomes that are wealth enhancing to society as a whole. Table 10: Share of GDP by Economic Activity for Different World Regions (1980 & 1994)
Agriculture Manufacturing Mining, Utilities,
Construction Services
1980 1994 1980 1994 1980 1994 1980 1994 World 7.1 4.8 23.0 22.5 14.4 10.4 54.9 62.3 Industrial Countries 3.7 2.2 24.2 22.0 12.1 10.0 60.0 65.8 Asia 4.3 2.1 27.6 26.2 13.6 13.1 54.6 58.6 Europe 4.3 2.7 25.4 20.3 12.2 9.5 58.1 67.5 Americas 3.1 2.0 21.8 20.0 11.4 8.0 63.6 70.0 Developing Countries 17.1 13.6 19.4 24.2 21.0 11.9 39.8 50.2 Africa 20.4 18.8 13.2 16.3 27.2 13.6 39.1 51.3 Asia 29.0 16.8 26.1 27.4 11.3 11.2 33.6 44.5 Europe 16.1 9.4 na 27.5 na 8.4 38.5 54.7 Middle East 6.8 10.7 6.5 11.0 56.9 35.7 29.8 42.5 Americas 9.7 9.7 25.4 21.5 14.0 11.7 50.9 57.0 Note: This classification is taken from the IMF Balance of Payments Statistics. The Asian industrial countries consist of Japan, Australia and New Zealand. The Americas industrial countries consist only of USA and Canada. The European industrial countries consist of Austria, Belgium-Luxembourg, Denmark, Finland, France, Germany, Greece, Iceland, Ireland, Italy, Netherlands, Norway, Portugal, Spain, Sweden, Switzerland and the United Kingdom. Source: Bhorat & Hodge (1998).
These remarks do not mean that the context of historical, political and social conditions did not play a pivotal role in contributing to the eventual character of the respective national
14
economies and with it setting limits to the scope of manoeuvre within the labour market to mitigate the more deleterious effects of these changes. Table 10 shows the evolution of the share of GDP by economic activity for industrial and developing countries in different regions of the world economy. The overall data indicates that over the 14 year period 1980-1994, there has been an observable shift in the World GDP, even if disaggregated by economic sector: the contribution from agriculture and mining, utilities and construction has declined substantially, while manufacturing has experienced a marginal decline. The big benefactor from this trend has been the growth in services and related activities. In terms of global proportions, services contributed 62.3 per cent of GDP in 1994 compared to 54.9 per cent in 1980.
Using the industrial countries as a proxy of the relative share in the distribution of economic activity by sector for the mature economies, one can safely conclude that there is a high likelihood that developing economies will over time have entered the phase of industrialized development and would most likely exhibit a similar pattern in the distribution in its economic activity. The sectoral shifts in economic activity that have occurred in the world economy since 1980 are seen to occur to a greater and lesser degree in the industrialized economies. All of agriculture, manufacturing, mining, utilities and construction exhibit similar trends on the aggregate in Asia, Europe and the Americas. Similarly the share of GDP in industrialized countries concentrated in services increased both regionally and in the aggregate. In Europe and the Americas, more than two thirds (67.5 per cent and 70 per cent respectively) of GDP are derived from service related activities. From our previous evidence, it is important to note that not only has the output derived from services increased dramatically, there has also been a substantial increase in the net value added through services and service related outputs. This value is not only tangible: there is an intangible core to this value that is monitored and protected by trade marks, copy rights and other forms in which knowledge is preserved. Even the embodiment and presentation of this value is conveyed through technologies that are distinct from those traditionally used in the past such as in a print format. The medium through which these ‘high tech’ or ‘knowledge commodities’ are transmitted incorporates a increased concentration of ICT usage. The human capital required to utilize and manipulate it therefore has generated different attributes and competencies at the workplace and in society generally.
Now the very strong presumption which is being made and this is supported by a wide range of evidence is that increased capital intensity in traditional employment sectors such as agriculture, manufacturing, utilities and mining coupled with technological diffusion has resulted in the level of outputs from these sectors increasing dramatically since the mid-1950s. This achievement has occurred using an incrementally smaller labour force for an equivalent value of output. Hence in sectors that are following this trajectory: where output has remained roughly constant, employment has decreased in proportion to the increases in productivity; and where employment has remained relatively constant, output has increased in proportion to the increase in productivity. Fueled by the imperatives to improve technology through the re-organization of work, and coupled with the renewed international commodity competition that has been brought about by trade liberalization, the effect of this process has largely resulted in structural changes that are systematized through shifts in employment. Of course a host of countervailing influences dictated by corporate cultures in various parts of the globe often slackens these movements and sometimes masks these from our comprehension for short periods. But these countervailing measures appear to be converging towards similarities in different contexts with some common standards rewarding the highly skilled disproportionately to the unskilled.
15
If one looks at the share of GDP by economic activity, the ‘industrialized’ benchmark of increasing shifts in sectors are being replicated to a lesser extent in the developing countries. From Table 10, it is noticeable that on the aggregate the share of GDP held by agriculture, mining, utilities and construction in the developing countries mirrors the trends that we noticed in the industrialized countries for the period 1980 to 1994. The exception is manufacturing which has actually increased from 19.4 per cent to 24.2 per cent of aggregate developing country GDP. This suggests a second critical trend in the data: that while industrialized countries yielded a declining share of manufacturing in overall GDP, the developing world has increased its share of manufacturing output. In one sense then, there has ostensibly been a redistribution of global manufacturing output – away from the developed toward the developing world. Specifically, between 1980 and 1994, while the share of industrialized country GDP in manufacturing declined by 2.2 percentage points, in the developing world it increased by 4.8 percentage points. Note also that this latter increase was true for all regions within the developing world.
The above therefore suggests that two key factors characterize this final component of globalization. Firstly, a significant structural change has occurred in the global economy, as all regions within the world economy have increased their output in services, relative to agriculture. Indeed there almost seems to be a direct shift, over this period, out of primary production, into services. Secondly, the manufacturing industry reveals a more interesting trend, marked by a shift in global production from the developed to the developing world – with the shares of manufacturing in GDP reflecting this pattern.
Structural Shifts within the Developing World
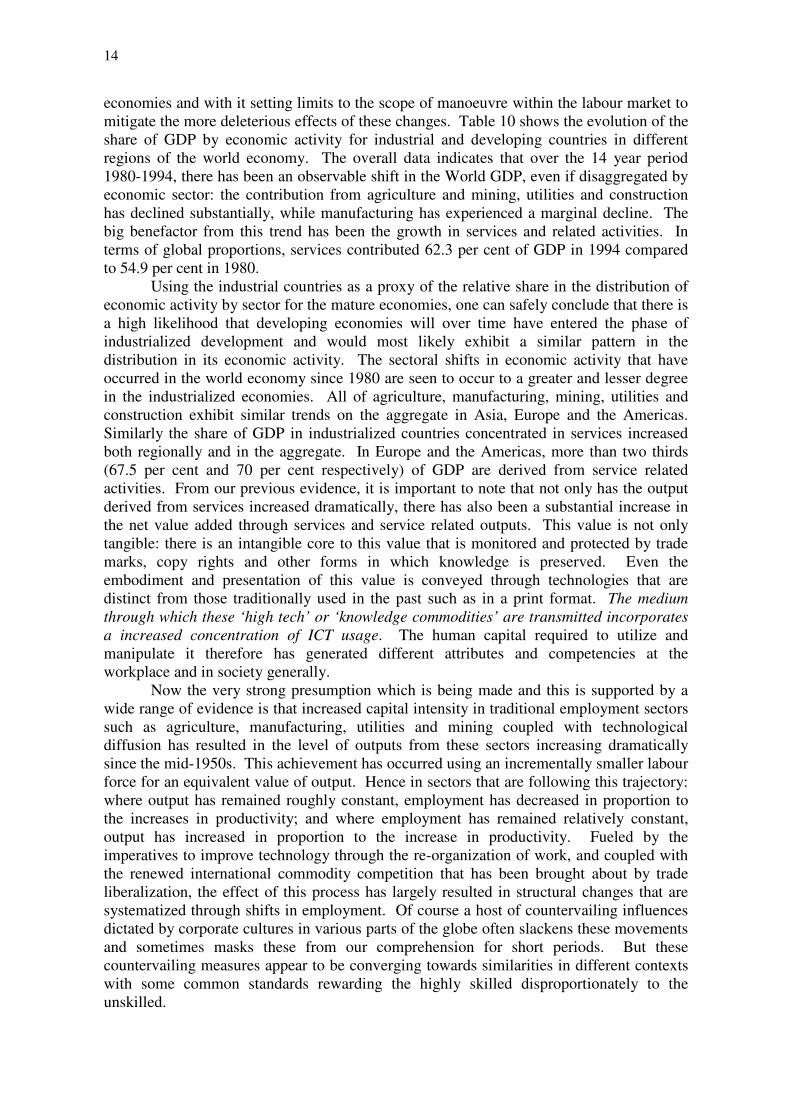
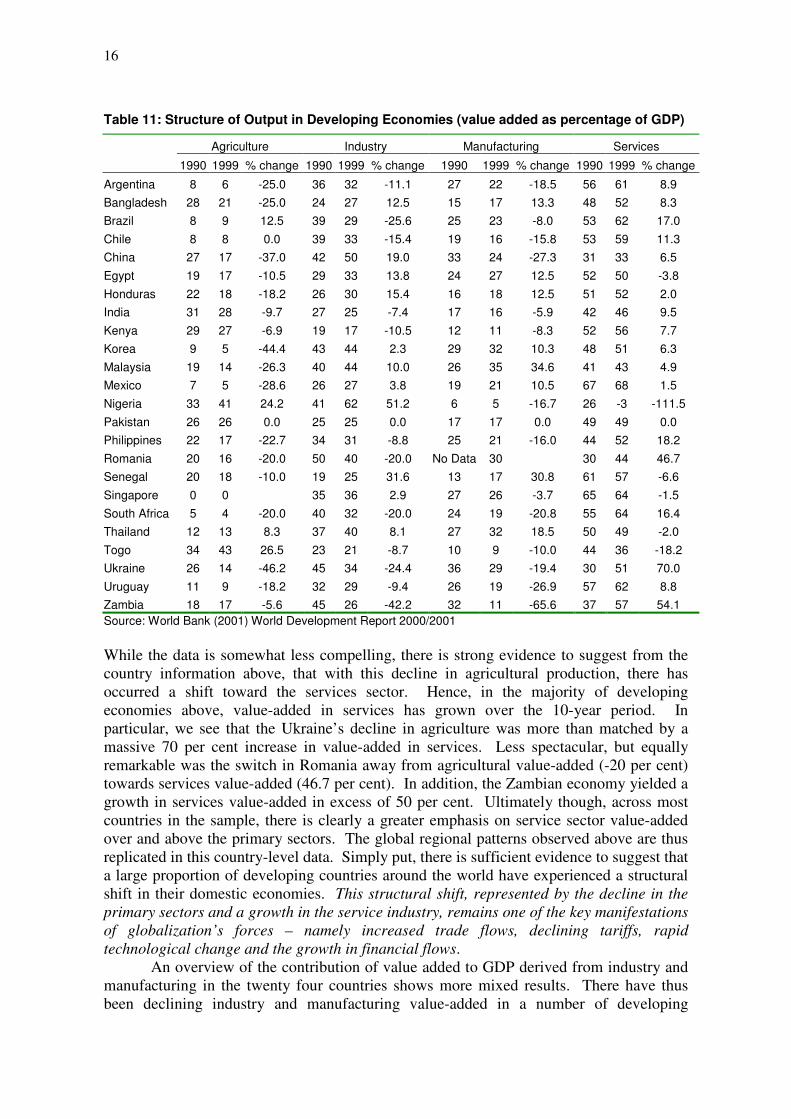
It is important to assess the degree to which the regional structural shifts outlined above, are indeed representative at the country level for the developing world. These do not necessarily detract from the accuracy of the picture presented in Table 10 above, but they contribute to an assessment of the intra-regional unevenness that may arise when analyzing one of the key economic markers (as we show later with respect to the employment consequences) of globalization. Table 11 therefore presents data on the change in value-added as a share of GDP in 4 main sectors, for a sub-sample of 24 developing economies, for 1990 and 1999.
Perhaps the strongest result from the table, and one that is replicated in the regional figures, is the decline in agriculture as a share of value-added across almost all countries in the sub-sample. Hence, out of the 24 countries covered, the contribution of agriculture fell in 20 out of 24 countries. The largest declines were recorded for the Ukraine, China and South Korea – where the drop in agriculture’s value-added ranged between 37 per cent and 46 per cent. Indeed, across all the individual economies, agriculture’s decline was rapid over what is a fairly short time period. The exceptions to the above trend were Brazil, Nigeria, Thailand and Togo. In Brazil, despite being the second largest developing economy after the People’s Republic of China, the percentage value added to GDP declined from 1990 to 1999 for industry and manufacturing but increased for services. In Nigeria the agricultural and industry share of value added to GDP increased but it declined by 17 per cent in manufacturing and catastrophically by 111 per cent in services.
16
Table 11: Structure of Output in Developing Economies (value added as percentage of GDP)
Agriculture Industry Manufacturing Services
1990 1999 % change 1990 1999 % change 1990 1999 % change 1990 1999 % change
Argentina 8 6 -25.0 36 32 -11.1 27 22 -18.5 56 61 8.9 Bangladesh 28 21 -25.0 24 27 12.5 15 17 13.3 48 52 8.3 Brazil 8 9 12.5 39 29 -25.6 25 23 -8.0 53 62 17.0 Chile 8 8 0.0 39 33 -15.4 19 16 -15.8 53 59 11.3 China 27 17 -37.0 42 50 19.0 33 24 -27.3 31 33 6.5 Egypt 19 17 -10.5 29 33 13.8 24 27 12.5 52 50 -3.8 Honduras 22 18 -18.2 26 30 15.4 16 18 12.5 51 52 2.0 India 31 28 -9.7 27 25 -7.4 17 16 -5.9 42 46 9.5 Kenya 29 27 -6.9 19 17 -10.5 12 11 -8.3 52 56 7.7 Korea 9 5 -44.4 43 44 2.3 29 32 10.3 48 51 6.3 Malaysia 19 14 -26.3 40 44 10.0 26 35 34.6 41 43 4.9 Mexico 7 5 -28.6 26 27 3.8 19 21 10.5 67 68 1.5 Nigeria 33 41 24.2 41 62 51.2 6 5 -16.7 26 -3 -111.5 Pakistan 26 26 0.0 25 25 0.0 17 17 0.0 49 49 0.0 Philippines 22 17 -22.7 34 31 -8.8 25 21 -16.0 44 52 18.2 Romania 20 16 -20.0 50 40 -20.0 No Data 30 30 44 46.7 Senegal 20 18 -10.0 19 25 31.6 13 17 30.8 61 57 -6.6 Singapore 0 0 35 36 2.9 27 26 -3.7 65 64 -1.5 South Africa 5 4 -20.0 40 32 -20.0 24 19 -20.8 55 64 16.4 Thailand 12 13 8.3 37 40 8.1 27 32 18.5 50 49 -2.0 Togo 34 43 26.5 23 21 -8.7 10 9 -10.0 44 36 -18.2 Ukraine 26 14 -46.2 45 34 -24.4 36 29 -19.4 30 51 70.0 Uruguay 11 9 -18.2 32 29 -9.4 26 19 -26.9 57 62 8.8 Zambia 18 17 -5.6 45 26 -42.2 32 11 -65.6 37 57 54.1 Source: World Bank (2001) World Development Report 2000/2001 While the data is somewhat less compelling, there is strong evidence to suggest from the country information above, that with this decline in agricultural production, there has occurred a shift toward the services sector. Hence, in the majority of developing economies above, value-added in services has grown over the 10-year period. In particular, we see that the Ukraine’s decline in agriculture was more than matched by a massive 70 per cent increase in value-added in services. Less spectacular, but equally remarkable was the switch in Romania away from agricultural value-added (-20 per cent) towards services value-added (46.7 per cent). In addition, the Zambian economy yielded a growth in services value-added in excess of 50 per cent. Ultimately though, across most countries in the sample, there is clearly a greater emphasis on service sector value-added over and above the primary sectors. The global regional patterns observed above are thus replicated in this country-level data. Simply put, there is sufficient evidence to suggest that a large proportion of developing countries around the world have experienced a structural shift in their domestic economies. This structural shift, represented by the decline in the primary sectors and a growth in the service industry, remains one of the key manifestations of globalization’s forces – namely increased trade flows, declining tariffs, rapid technological change and the growth in financial flows.
An overview of the contribution of value added to GDP derived from industry and manufacturing in the twenty four countries shows more mixed results. There have thus been declining industry and manufacturing value-added in a number of developing
17
economies. Argentina (industry and manufacturing), Brazil (industry and manufacturing), Chile (industry and manufacturing), China (manufacturing), India (industry and manufacturing), Kenya (industry and manufacturing), Nigeria (manufacturing), Philippines (industry and manufacturing), Romania (industry), Singapore (manufacturing), South Africa (industry and manufacturing), Togo (industry and manufacturing) the Ukraine (industry and manufacturing), Uruguay (industry and manufacturing) and Zambia (industry and manufacturing) all bear testimony to this unpredictable movement in the two main sectors within the developing world.
It may be correct to say that two forces have been responsible for these declines in the sector contribution to GDP. In industry in particular, and South Africa remains the prime example of this trend, falling international commodity prices in the mining and energy industries in particular have accelerated the introduction of machinery and more capital intensive technologies to make up and adjust for the declining profits of the sector. Technological intensification has increased the capacity of these sectors to remain vibrant, but it has also resulted in significant job losses. In the manufacturing sector on the other hand, technological intensification has resulted in the prices of manufactured goods falling. In both of the above instances, the falling prices which have accelerated technological intensification (industry) and the technological intensification which has accelerated output efficiencies and price declines (manufacturing) has resulted in the value added contribution to GDP from both sectors declining in relation to historical trends and in relation to services which has had a high diffusion of technological innovation accompanied by high returns from investment and sales.
A comparison between developing countries and industrialized countries dispels the pessimism, which may incorrectly be ascribed to the preceding analysis. In fact Table A1 in the appendix, shows that while GDP in the world’s five largest economies (United States, Japan, Germany, France and the United Kingdom) has grown in nominal terms between 1990 and 1999, the value added as a percentage of GDP obtained from agriculture, industry and manufacturing have declined. But far from representing a case of de-industrialization5 with the export of capital, the evidence shows that efficiency factors stimulated by technological intensification resulting in real price declines, coupled with the large scale expansion of FDI depicts similar converging patterns between the agricultural, industry and manufacturing sectors of developing and industrialized economies. The industrialized countries have however built up a pre-eminent position in the services sector and if the statistics are correct, the United States and France appear to be trend setters in this sphere.
We elucidated at the outset, on the five key markers of globalization, namely the growth in trade flows, technological change, trade policy regime shifts, the increased incidence of cross-border capital flows and finally dealt with here, the structural shift in sectoral production that has occurred in both the developed and the developing world. Specifically on the latter they have been manifest in a rapid growth in the services sector, combined with a decline in the primary sectors (essentially agriculture). In addition, there is provisional evidence to suggest that this structural shift, at the regional level at least, is also manifested in a shift in production away from manufacturing in the developed world toward output expansion in the developing world. It is however, the combination of these five discrete, yet inter-linked, forces of globalization that together have served to engender labour market outcomes in the developing world. We explore these wage, employment and regulatory effects in the sections that follow below.
5 There was a burgeoning academic literature produced on the de-industrialization theme in the 1980s. A representative sample includes Bluestone & Harrison (1982) and Rowthorn & Wells (1987).
18
3. Globalization and Labour Market Outcomes in the Developing World
The above has tried to provide a cursory, but necessary contextual, overview of the major tenets of economic globalization. One of the key, if not the key, debates in the context of globalization in the developing world is the linkage between this process and the potential welfare effects it is likely to engender in the developing world. As a result there has been much work done into assessing how the nature and extent of inter- and intra-country poverty and inequality has and is continuing to be, affected by the various facets of economic globalization. Popular questions and issues include the relationship between trade and income inequality, or the nature of the trade, growth and poverty nexus (Dollar,1992; Dollar & Kraay; 2001; Lindert & Williamson,2001; Rama,2001). These studies remain critical to any attempt at measuring the final-round impact of globalization on the welfare of households in the society.
The aim of this section of the paper however is narrower. We also work from the assumption that the various forces of globalization namely, trade flows; technological change; financial flows and trade policy regime shifts will ultimately have an impact on the welfare of households in the developing world. The approach we take here though is that the conduit through which welfare effects at the household level are finally determined, is to a large extent the labour market. The labour market is the arena within which income opportunities, in the main, present themselves to individuals. Access to this income, in many cases, will be a very strong determinant of the nature of household poverty and inequality in a society. As a consequence, if we derive a detailed understanding of how globalization has impacted on different components of an economy’s labour market, we are implicitly provided with an intellectual anchor around which to understand the impact of these labour market changes on household welfare.
Given this approach the rest of this paper will try, through the use essentially of secondary material and limited primary sources, to describe the various channels through which economic globalization has affected the functioning of the labour market in the developing world. Four key issues are interrogated namely, the quantity effects in the form of employment shifts within-country; cross-border labour mobility; the price effects in terms of wage distributions and wage inequality; and finally changing regulations governing work together with the changing nature of work itself.
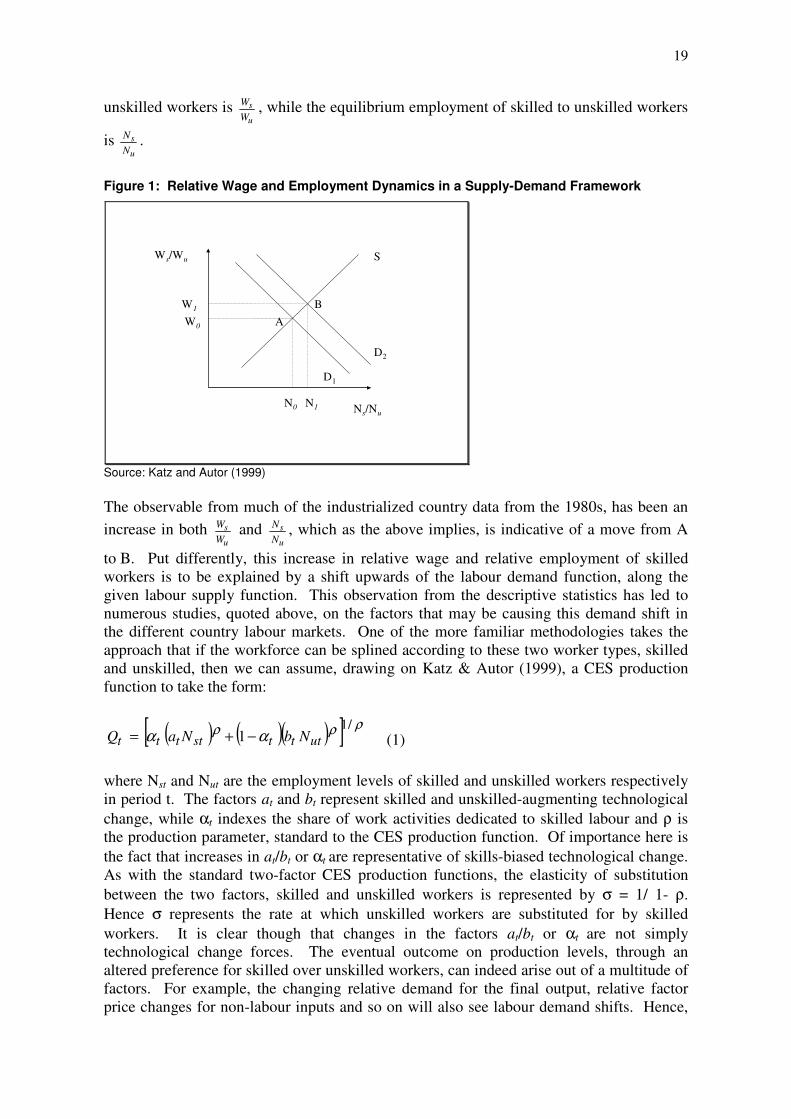
Employment and Wage Effects from Globalization One of the key developments observed in empirical studies of industrialized country labour markets, has been the increase in relative wages of skilled (graduate educated) to (high school or less educated) unskilled workers over time (Katz & Murphy,1992; Bound & Johnson,1992; Autor et al, 1998). What made this observation all the more intriguing of course, was the fact that over the same specified period, the demand for educated workers, relative to less educated workers also increased. This led then to an examination of the potential explanators for this labour demand shift, beyond relative factor price shifts, given that the inverse relationship between wages and employment did not hold up in the data. As is now well known, this phenomenon has been described very aptly in a simple supply-demand framework, such as the one displayed below. If we assume that the labour market is in an initial equilibrium at point A, then the equilibrium relative wage of skilled to
19
unskilled workers is u
sWW , while the equilibrium employment of skilled to unskilled workers
is u
sNN .
Figure 1: Relative Wage and Employment Dynamics in a Supply-Demand Framework
Ws/Wu
Ns/Nu
D1
D2
S
N0 N1
W0
W1
AB
Source: Katz and Autor (1999) The observable from much of the industrialized country data from the 1980s, has been an increase in both
u
sWW and
u
sNN , which as the above implies, is indicative of a move from A
to B. Put differently, this increase in relative wage and relative employment of skilled workers is to be explained by a shift upwards of the labour demand function, along the given labour supply function. This observation from the descriptive statistics has led to numerous studies, quoted above, on the factors that may be causing this demand shift in the different country labour markets. One of the more familiar methodologies takes the approach that if the workforce can be splined according to these two worker types, skilled and unskilled, then we can assume, drawing on Katz & Autor (1999), a CES production function to take the form:
( ) ( )( )[ ] ρρρ αα/1
1 utttstttt NbNaQ −+= (1) where Nst and Nut are the employment levels of skilled and unskilled workers respectively in period t. The factors at and bt represent skilled and unskilled-augmenting technological change, while αt indexes the share of work activities dedicated to skilled labour and ρ is the production parameter, standard to the CES production function. Of importance here is the fact that increases in at/bt or αt are representative of skills-biased technological change. As with the standard two-factor CES production functions, the elasticity of substitution between the two factors, skilled and unskilled workers is represented by σ = 1/ 1- ρ. Hence σ represents the rate at which unskilled workers are substituted for by skilled workers. It is clear though that changes in the factors at/bt or αt are not simply technological change forces. The eventual outcome on production levels, through an altered preference for skilled over unskilled workers, can indeed arise out of a multitude of factors. For example, the changing relative demand for the final output, relative factor price changes for non-labour inputs and so on will also see labour demand shifts. Hence,
20
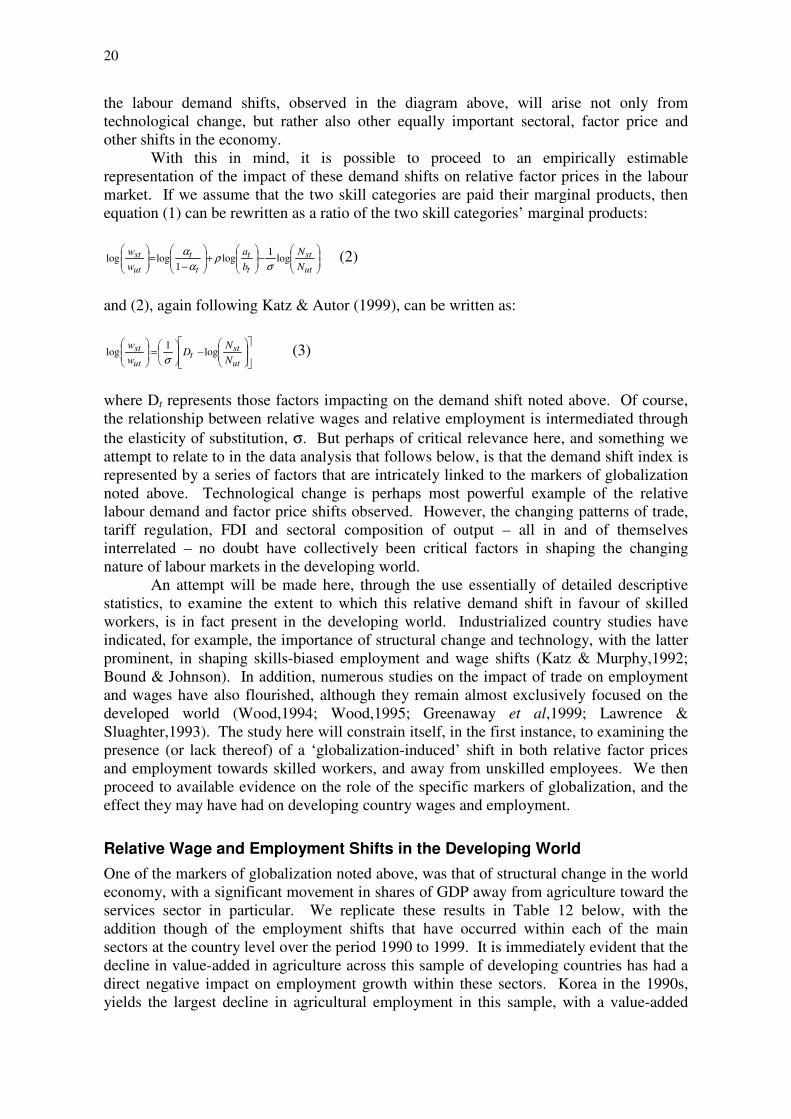
the labour demand shifts, observed in the diagram above, will arise not only from technological change, but rather also other equally important sectoral, factor price and other shifts in the economy.
With this in mind, it is possible to proceed to an empirically estimable representation of the impact of these demand shifts on relative factor prices in the labour market. If we assume that the two skill categories are paid their marginal products, then equation (1) can be rewritten as a ratio of the two skill categories’ marginal products:
���
����
�−���
����
�+���
����
�
−=���
����
�
ut
st
t
t
t
t
ut
stNN
ba
ww
log1
log1
loglogσ
ρα
α (2)
and (2), again following Katz & Autor (1999), can be written as:
���
�
�
���
����
�−�
�
���
�=���
����
�
ut
stt
ut
stNN
Dww
log1
logσ
(3)
where Dt represents those factors impacting on the demand shift noted above. Of course, the relationship between relative wages and relative employment is intermediated through the elasticity of substitution, σ. But perhaps of critical relevance here, and something we attempt to relate to in the data analysis that follows below, is that the demand shift index is represented by a series of factors that are intricately linked to the markers of globalization noted above. Technological change is perhaps most powerful example of the relative labour demand and factor price shifts observed. However, the changing patterns of trade, tariff regulation, FDI and sectoral composition of output – all in and of themselves interrelated – no doubt have collectively been critical factors in shaping the changing nature of labour markets in the developing world.
An attempt will be made here, through the use essentially of detailed descriptive statistics, to examine the extent to which this relative demand shift in favour of skilled workers, is in fact present in the developing world. Industrialized country studies have indicated, for example, the importance of structural change and technology, with the latter prominent, in shaping skills-biased employment and wage shifts (Katz & Murphy,1992; Bound & Johnson). In addition, numerous studies on the impact of trade on employment and wages have also flourished, although they remain almost exclusively focused on the developed world (Wood,1994; Wood,1995; Greenaway et al,1999; Lawrence & Sluaghter,1993). The study here will constrain itself, in the first instance, to examining the presence (or lack thereof) of a ‘globalization-induced’ shift in both relative factor prices and employment towards skilled workers, and away from unskilled employees. We then proceed to available evidence on the role of the specific markers of globalization, and the effect they may have had on developing country wages and employment.
Relative Wage and Employment Shifts in the Developing World One of the markers of globalization noted above, was that of structural change in the world economy, with a significant movement in shares of GDP away from agriculture toward the services sector in particular. We replicate these results in Table 12 below, with the addition though of the employment shifts that have occurred within each of the main sectors at the country level over the period 1990 to 1999. It is immediately evident that the decline in value-added in agriculture across this sample of developing countries has had a direct negative impact on employment growth within these sectors. Korea in the 1990s, yields the largest decline in agricultural employment in this sample, with a value-added
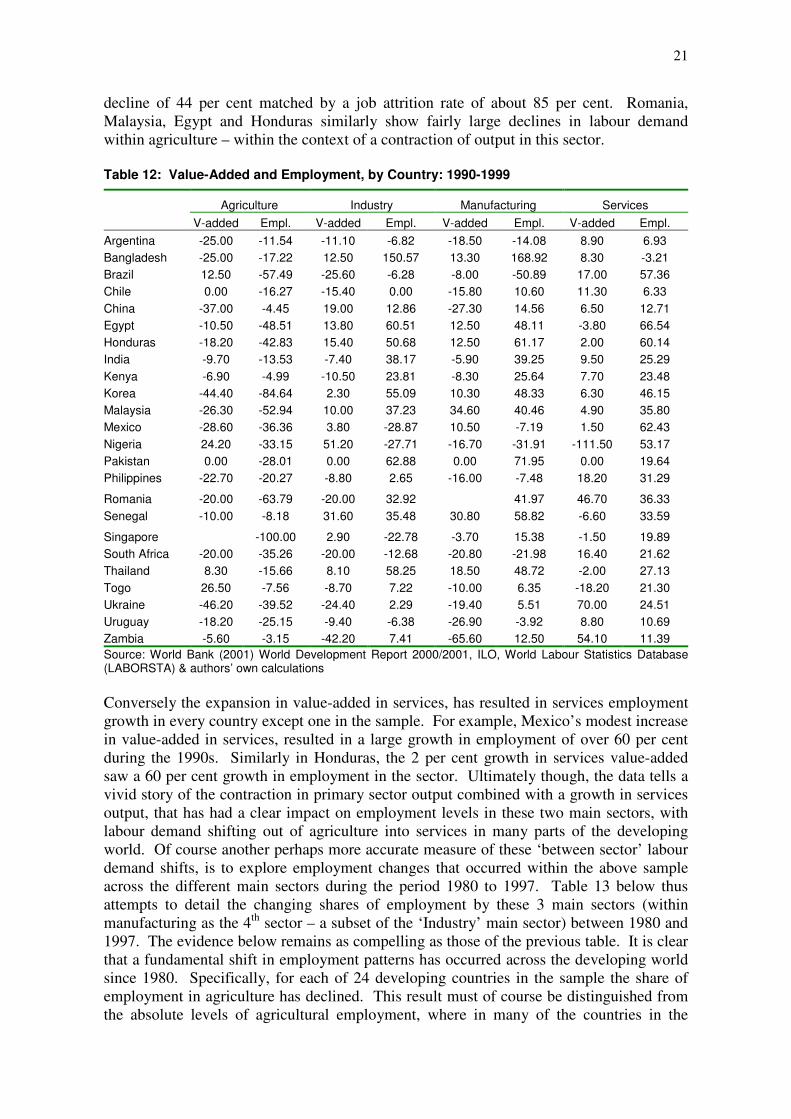
21
decline of 44 per cent matched by a job attrition rate of about 85 per cent. Romania, Malaysia, Egypt and Honduras similarly show fairly large declines in labour demand within agriculture – within the context of a contraction of output in this sector. Table 12: Value-Added and Employment, by Country: 1990-1999
Agriculture Industry Manufacturing Services V-added Empl. V-added Empl. V-added Empl. V-added Empl.
Argentina -25.00 -11.54 -11.10 -6.82 -18.50 -14.08 8.90 6.93 Bangladesh -25.00 -17.22 12.50 150.57 13.30 168.92 8.30 -3.21 Brazil 12.50 -57.49 -25.60 -6.28 -8.00 -50.89 17.00 57.36 Chile 0.00 -16.27 -15.40 0.00 -15.80 10.60 11.30 6.33 China -37.00 -4.45 19.00 12.86 -27.30 14.56 6.50 12.71 Egypt -10.50 -48.51 13.80 60.51 12.50 48.11 -3.80 66.54 Honduras -18.20 -42.83 15.40 50.68 12.50 61.17 2.00 60.14 India -9.70 -13.53 -7.40 38.17 -5.90 39.25 9.50 25.29 Kenya -6.90 -4.99 -10.50 23.81 -8.30 25.64 7.70 23.48 Korea -44.40 -84.64 2.30 55.09 10.30 48.33 6.30 46.15 Malaysia -26.30 -52.94 10.00 37.23 34.60 40.46 4.90 35.80 Mexico -28.60 -36.36 3.80 -28.87 10.50 -7.19 1.50 62.43 Nigeria 24.20 -33.15 51.20 -27.71 -16.70 -31.91 -111.50 53.17 Pakistan 0.00 -28.01 0.00 62.88 0.00 71.95 0.00 19.64 Philippines -22.70 -20.27 -8.80 2.65 -16.00 -7.48 18.20 31.29
Romania -20.00 -63.79 -20.00 32.92 41.97 46.70 36.33 Senegal -10.00 -8.18 31.60 35.48 30.80 58.82 -6.60 33.59
Singapore -100.00 2.90 -22.78 -3.70 15.38 -1.50 19.89 South Africa -20.00 -35.26 -20.00 -12.68 -20.80 -21.98 16.40 21.62 Thailand 8.30 -15.66 8.10 58.25 18.50 48.72 -2.00 27.13 Togo 26.50 -7.56 -8.70 7.22 -10.00 6.35 -18.20 21.30 Ukraine -46.20 -39.52 -24.40 2.29 -19.40 5.51 70.00 24.51 Uruguay -18.20 -25.15 -9.40 -6.38 -26.90 -3.92 8.80 10.69 Zambia -5.60 -3.15 -42.20 7.41 -65.60 12.50 54.10 11.39 Source: World Bank (2001) World Development Report 2000/2001, ILO, World Labour Statistics Database (LABORSTA) & authors’ own calculations Conversely the expansion in value-added in services, has resulted in services employment growth in every country except one in the sample. For example, Mexico’s modest increase in value-added in services, resulted in a large growth in employment of over 60 per cent during the 1990s. Similarly in Honduras, the 2 per cent growth in services value-added saw a 60 per cent growth in employment in the sector. Ultimately though, the data tells a vivid story of the contraction in primary sector output combined with a growth in services output, that has had a clear impact on employment levels in these two main sectors, with labour demand shifting out of agriculture into services in many parts of the developing world. Of course another perhaps more accurate measure of these ‘between sector’ labour demand shifts, is to explore employment changes that occurred within the above sample across the different main sectors during the period 1980 to 1997. Table 13 below thus attempts to detail the changing shares of employment by these 3 main sectors (within manufacturing as the 4th sector – a subset of the ‘Industry’ main sector) between 1980 and 1997. The evidence below remains as compelling as those of the previous table. It is clear that a fundamental shift in employment patterns has occurred across the developing world since 1980. Specifically, for each of 24 developing countries in the sample the share of employment in agriculture has declined. This result must of course be distinguished from the absolute levels of agricultural employment, where in many of the countries in the
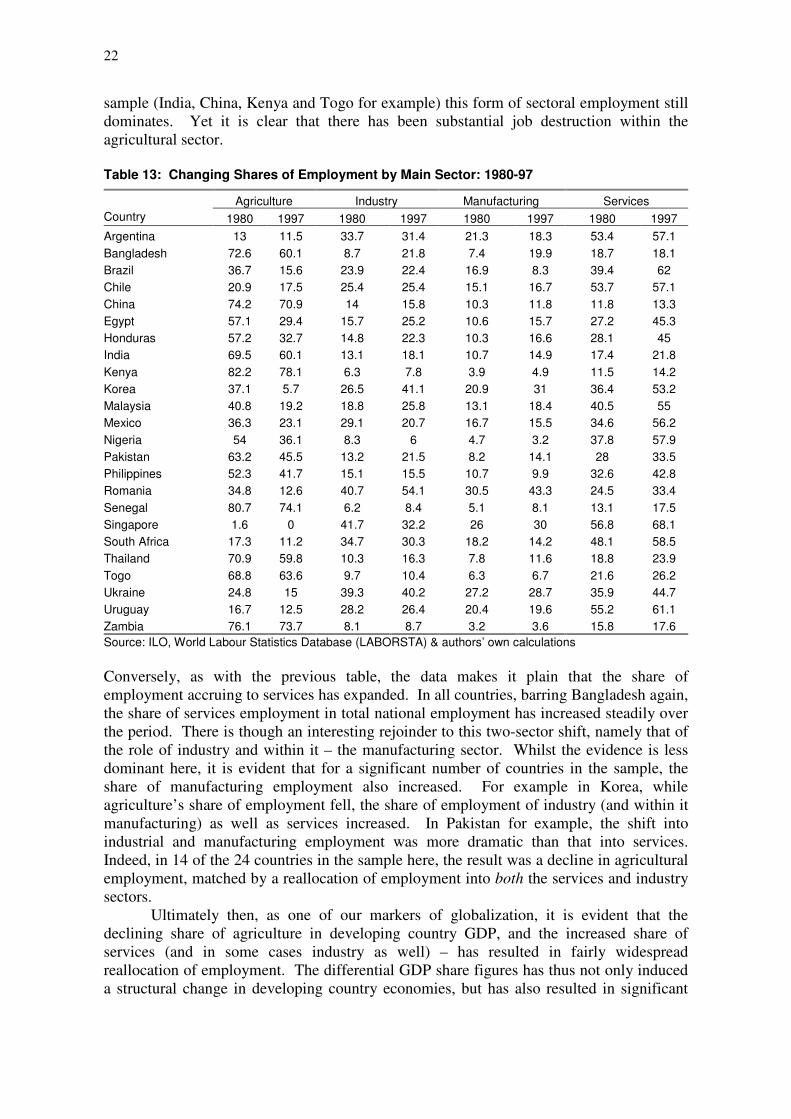
22
sample (India, China, Kenya and Togo for example) this form of sectoral employment still dominates. Yet it is clear that there has been substantial job destruction within the agricultural sector. Table 13: Changing Shares of Employment by Main Sector: 1980-97
Agriculture Industry Manufacturing Services Country 1980 1997 1980 1997 1980 1997 1980 1997 Argentina 13 11.5 33.7 31.4 21.3 18.3 53.4 57.1 Bangladesh 72.6 60.1 8.7 21.8 7.4 19.9 18.7 18.1 Brazil 36.7 15.6 23.9 22.4 16.9 8.3 39.4 62 Chile 20.9 17.5 25.4 25.4 15.1 16.7 53.7 57.1 China 74.2 70.9 14 15.8 10.3 11.8 11.8 13.3 Egypt 57.1 29.4 15.7 25.2 10.6 15.7 27.2 45.3 Honduras 57.2 32.7 14.8 22.3 10.3 16.6 28.1 45 India 69.5 60.1 13.1 18.1 10.7 14.9 17.4 21.8 Kenya 82.2 78.1 6.3 7.8 3.9 4.9 11.5 14.2 Korea 37.1 5.7 26.5 41.1 20.9 31 36.4 53.2 Malaysia 40.8 19.2 18.8 25.8 13.1 18.4 40.5 55 Mexico 36.3 23.1 29.1 20.7 16.7 15.5 34.6 56.2 Nigeria 54 36.1 8.3 6 4.7 3.2 37.8 57.9 Pakistan 63.2 45.5 13.2 21.5 8.2 14.1 28 33.5 Philippines 52.3 41.7 15.1 15.5 10.7 9.9 32.6 42.8 Romania 34.8 12.6 40.7 54.1 30.5 43.3 24.5 33.4 Senegal 80.7 74.1 6.2 8.4 5.1 8.1 13.1 17.5 Singapore 1.6 0 41.7 32.2 26 30 56.8 68.1 South Africa 17.3 11.2 34.7 30.3 18.2 14.2 48.1 58.5 Thailand 70.9 59.8 10.3 16.3 7.8 11.6 18.8 23.9 Togo 68.8 63.6 9.7 10.4 6.3 6.7 21.6 26.2 Ukraine 24.8 15 39.3 40.2 27.2 28.7 35.9 44.7 Uruguay 16.7 12.5 28.2 26.4 20.4 19.6 55.2 61.1 Zambia 76.1 73.7 8.1 8.7 3.2 3.6 15.8 17.6 Source: ILO, World Labour Statistics Database (LABORSTA) & authors’ own calculations Conversely, as with the previous table, the data makes it plain that the share of employment accruing to services has expanded. In all countries, barring Bangladesh again, the share of services employment in total national employment has increased steadily over the period. There is though an interesting rejoinder to this two-sector shift, namely that of the role of industry and within it – the manufacturing sector. Whilst the evidence is less dominant here, it is evident that for a significant number of countries in the sample, the share of manufacturing employment also increased. For example in Korea, while agriculture’s share of employment fell, the share of employment of industry (and within it manufacturing) as well as services increased. In Pakistan for example, the shift into industrial and manufacturing employment was more dramatic than that into services. Indeed, in 14 of the 24 countries in the sample here, the result was a decline in agricultural employment, matched by a reallocation of employment into both the services and industry sectors.
Ultimately then, as one of our markers of globalization, it is evident that the declining share of agriculture in developing country GDP, and the increased share of services (and in some cases industry as well) – has resulted in fairly widespread reallocation of employment. The differential GDP share figures has thus not only induced a structural change in developing country economies, but has also resulted in significant
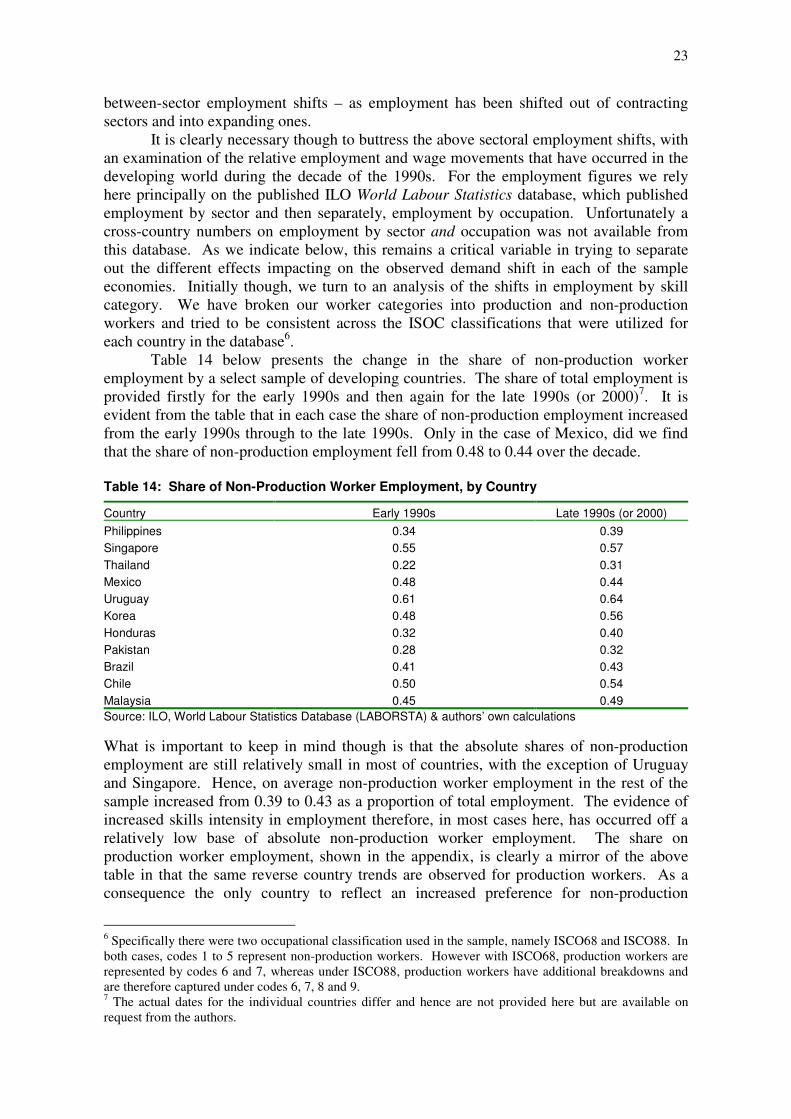
23
between-sector employment shifts – as employment has been shifted out of contracting sectors and into expanding ones.
It is clearly necessary though to buttress the above sectoral employment shifts, with an examination of the relative employment and wage movements that have occurred in the developing world during the decade of the 1990s. For the employment figures we rely here principally on the published ILO World Labour Statistics database, which published employment by sector and then separately, employment by occupation. Unfortunately a cross-country numbers on employment by sector and occupation was not available from this database. As we indicate below, this remains a critical variable in trying to separate out the different effects impacting on the observed demand shift in each of the sample economies. Initially though, we turn to an analysis of the shifts in employment by skill category. We have broken our worker categories into production and non-production workers and tried to be consistent across the ISOC classifications that were utilized for each country in the database6.
Table 14 below presents the change in the share of non-production worker employment by a select sample of developing countries. The share of total employment is provided firstly for the early 1990s and then again for the late 1990s (or 2000)7. It is evident from the table that in each case the share of non-production employment increased from the early 1990s through to the late 1990s. Only in the case of Mexico, did we find that the share of non-production employment fell from 0.48 to 0.44 over the decade. Table 14: Share of Non-Production Worker Employment, by Country
Country Early 1990s Late 1990s (or 2000) Philippines 0.34 0.39 Singapore 0.55 0.57 Thailand 0.22 0.31 Mexico 0.48 0.44 Uruguay 0.61 0.64 Korea 0.48 0.56 Honduras 0.32 0.40 Pakistan 0.28 0.32 Brazil 0.41 0.43 Chile 0.50 0.54 Malaysia 0.45 0.49 Source: ILO, World Labour Statistics Database (LABORSTA) & authors’ own calculations What is important to keep in mind though is that the absolute shares of non-production employment are still relatively small in most of countries, with the exception of Uruguay and Singapore. Hence, on average non-production worker employment in the rest of the sample increased from 0.39 to 0.43 as a proportion of total employment. The evidence of increased skills intensity in employment therefore, in most cases here, has occurred off a relatively low base of absolute non-production worker employment. The share on production worker employment, shown in the appendix, is clearly a mirror of the above table in that the same reverse country trends are observed for production workers. As a consequence the only country to reflect an increased preference for non-production
6 Specifically there were two occupational classification used in the sample, namely ISCO68 and ISCO88. In both cases, codes 1 to 5 represent non-production workers. However with ISCO68, production workers are represented by codes 6 and 7, whereas under ISCO88, production workers have additional breakdowns and are therefore captured under codes 6, 7, 8 and 9. 7 The actual dates for the individual countries differ and hence are not provided here but are available on request from the authors.
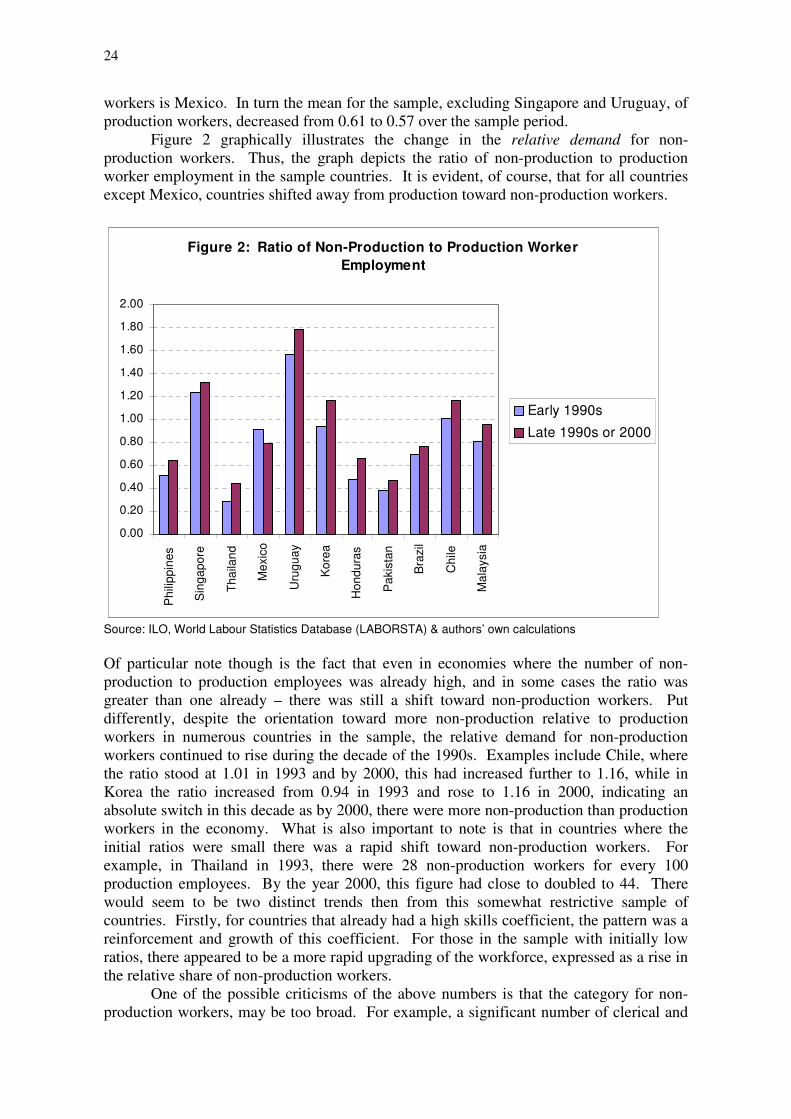
24
workers is Mexico. In turn the mean for the sample, excluding Singapore and Uruguay, of production workers, decreased from 0.61 to 0.57 over the sample period.
Figure 2 graphically illustrates the change in the relative demand for non-production workers. Thus, the graph depicts the ratio of non-production to production worker employment in the sample countries. It is evident, of course, that for all countries except Mexico, countries shifted away from production toward non-production workers.
Figure 2: Ratio of Non-Production to Production Worker Employment
0.00
0.20
0.40
0.60
0.80
1.00
1.20
1.40
1.60
1.80
2.00
Phi
lippi
nes
Sin
gapo
re
Thai
land
Mex
ico
Uru
guay
Kor
ea
Hon
dura
s
Pak
ista
n
Bra
zil
Chi
le
Mal
aysi
a
Early 1990s
Late 1990s or 2000
Source: ILO, World Labour Statistics Database (LABORSTA) & authors’ own calculations Of particular note though is the fact that even in economies where the number of non-production to production employees was already high, and in some cases the ratio was greater than one already – there was still a shift toward non-production workers. Put differently, despite the orientation toward more non-production relative to production workers in numerous countries in the sample, the relative demand for non-production workers continued to rise during the decade of the 1990s. Examples include Chile, where the ratio stood at 1.01 in 1993 and by 2000, this had increased further to 1.16, while in Korea the ratio increased from 0.94 in 1993 and rose to 1.16 in 2000, indicating an absolute switch in this decade as by 2000, there were more non-production than production workers in the economy. What is also important to note is that in countries where the initial ratios were small there was a rapid shift toward non-production workers. For example, in Thailand in 1993, there were 28 non-production workers for every 100 production employees. By the year 2000, this figure had close to doubled to 44. There would seem to be two distinct trends then from this somewhat restrictive sample of countries. Firstly, for countries that already had a high skills coefficient, the pattern was a reinforcement and growth of this coefficient. For those in the sample with initially low ratios, there appeared to be a more rapid upgrading of the workforce, expressed as a rise in the relative share of non-production workers.
One of the possible criticisms of the above numbers is that the category for non-production workers, may be too broad. For example, a significant number of clerical and
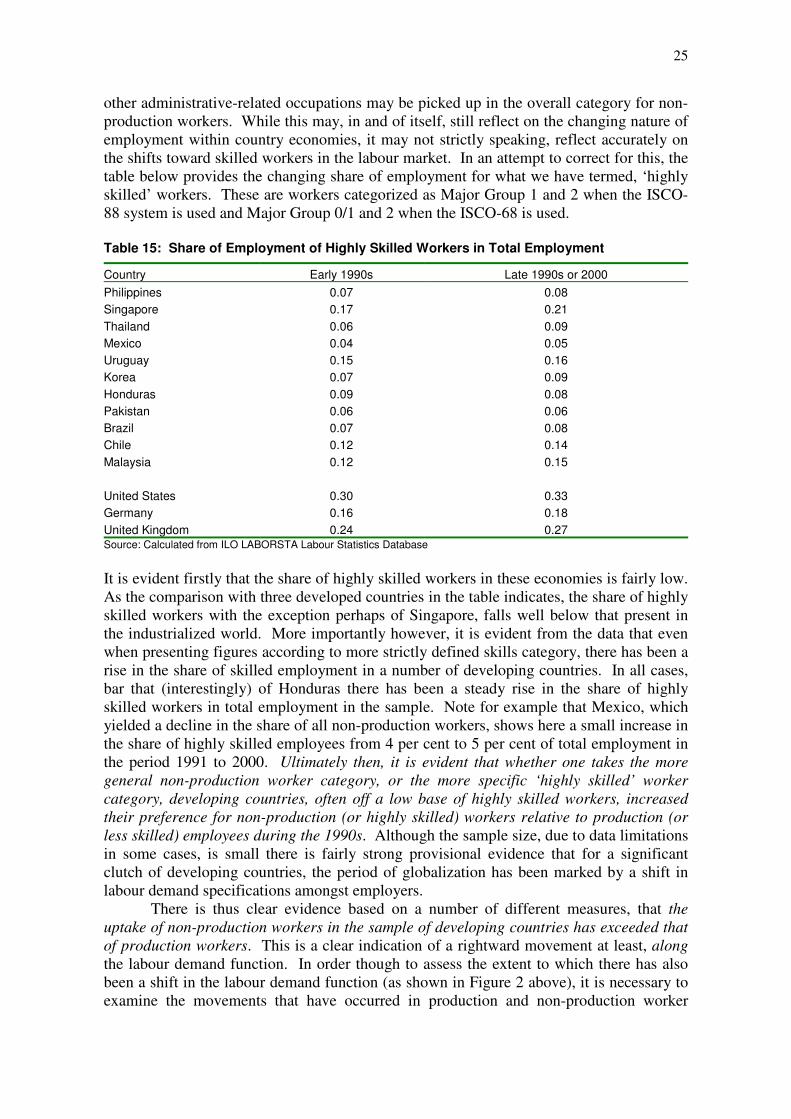
25
other administrative-related occupations may be picked up in the overall category for non-production workers. While this may, in and of itself, still reflect on the changing nature of employment within country economies, it may not strictly speaking, reflect accurately on the shifts toward skilled workers in the labour market. In an attempt to correct for this, the table below provides the changing share of employment for what we have termed, ‘highly skilled’ workers. These are workers categorized as Major Group 1 and 2 when the ISCO-88 system is used and Major Group 0/1 and 2 when the ISCO-68 is used. Table 15: Share of Employment of Highly Skilled Workers in Total Employment
Country Early 1990s Late 1990s or 2000 Philippines 0.07 0.08 Singapore 0.17 0.21 Thailand 0.06 0.09 Mexico 0.04 0.05 Uruguay 0.15 0.16 Korea 0.07 0.09 Honduras 0.09 0.08 Pakistan 0.06 0.06 Brazil 0.07 0.08 Chile 0.12 0.14 Malaysia 0.12 0.15 United States 0.30 0.33 Germany 0.16 0.18 United Kingdom 0.24 0.27 Source: Calculated from ILO LABORSTA Labour Statistics Database
It is evident firstly that the share of highly skilled workers in these economies is fairly low. As the comparison with three developed countries in the table indicates, the share of highly skilled workers with the exception perhaps of Singapore, falls well below that present in the industrialized world. More importantly however, it is evident from the data that even when presenting figures according to more strictly defined skills category, there has been a rise in the share of skilled employment in a number of developing countries. In all cases, bar that (interestingly) of Honduras there has been a steady rise in the share of highly skilled workers in total employment in the sample. Note for example that Mexico, which yielded a decline in the share of all non-production workers, shows here a small increase in the share of highly skilled employees from 4 per cent to 5 per cent of total employment in the period 1991 to 2000. Ultimately then, it is evident that whether one takes the more general non-production worker category, or the more specific ‘highly skilled’ worker category, developing countries, often off a low base of highly skilled workers, increased their preference for non-production (or highly skilled) workers relative to production (or less skilled) employees during the 1990s. Although the sample size, due to data limitations in some cases, is small there is fairly strong provisional evidence that for a significant clutch of developing countries, the period of globalization has been marked by a shift in labour demand specifications amongst employers.
There is thus clear evidence based on a number of different measures, that the uptake of non-production workers in the sample of developing countries has exceeded that of production workers. This is a clear indication of a rightward movement at least, along the labour demand function. In order though to assess the extent to which there has also been a shift in the labour demand function (as shown in Figure 2 above), it is necessary to examine the movements that have occurred in production and non-production worker
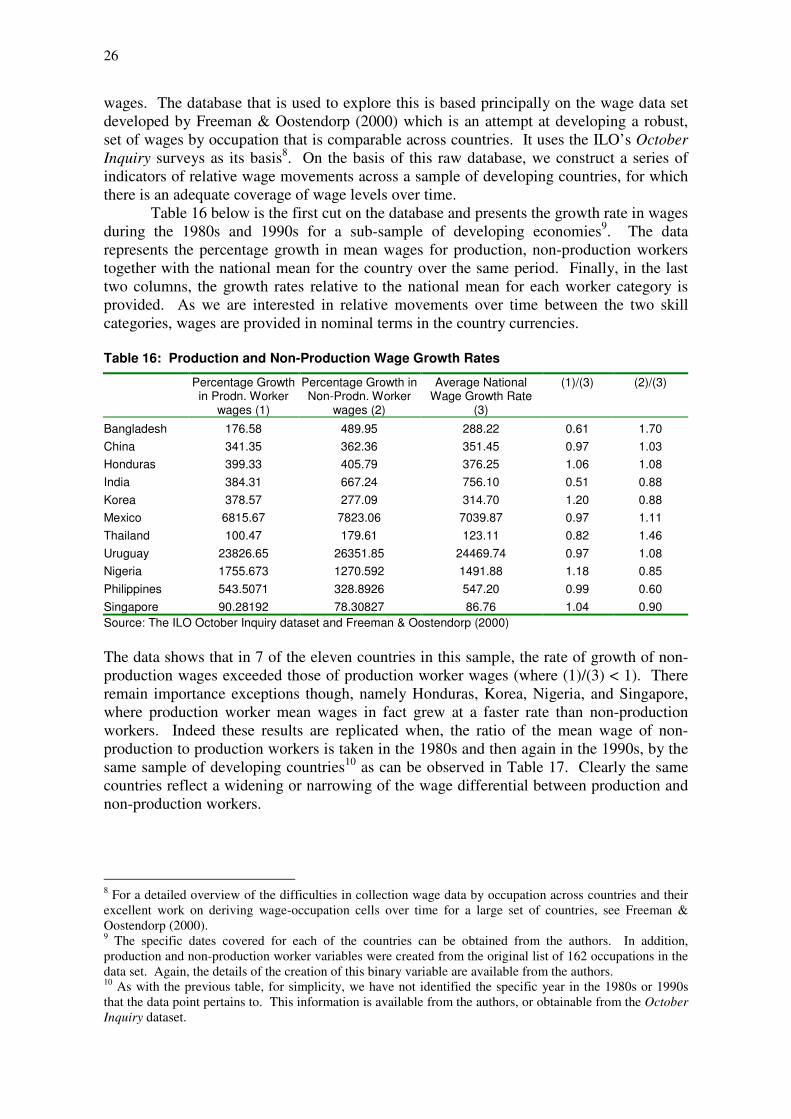
26
wages. The database that is used to explore this is based principally on the wage data set developed by Freeman & Oostendorp (2000) which is an attempt at developing a robust, set of wages by occupation that is comparable across countries. It uses the ILO’s October Inquiry surveys as its basis8. On the basis of this raw database, we construct a series of indicators of relative wage movements across a sample of developing countries, for which there is an adequate coverage of wage levels over time.
Table 16 below is the first cut on the database and presents the growth rate in wages during the 1980s and 1990s for a sub-sample of developing economies9. The data represents the percentage growth in mean wages for production, non-production workers together with the national mean for the country over the same period. Finally, in the last two columns, the growth rates relative to the national mean for each worker category is provided. As we are interested in relative movements over time between the two skill categories, wages are provided in nominal terms in the country currencies. Table 16: Production and Non-Production Wage Growth Rates
Percentage Growth in Prodn. Worker
wages (1)
Percentage Growth in Non-Prodn. Worker
wages (2)
Average National Wage Growth Rate
(3)
(1)/(3) (2)/(3)
Bangladesh 176.58 489.95 288.22 0.61 1.70 China 341.35 362.36 351.45 0.97 1.03 Honduras 399.33 405.79 376.25 1.06 1.08 India 384.31 667.24 756.10 0.51 0.88 Korea 378.57 277.09 314.70 1.20 0.88 Mexico 6815.67 7823.06 7039.87 0.97 1.11 Thailand 100.47 179.61 123.11 0.82 1.46 Uruguay 23826.65 26351.85 24469.74 0.97 1.08 Nigeria 1755.673 1270.592 1491.88 1.18 0.85 Philippines 543.5071 328.8926 547.20 0.99 0.60 Singapore 90.28192 78.30827 86.76 1.04 0.90 Source: The ILO October Inquiry dataset and Freeman & Oostendorp (2000) The data shows that in 7 of the eleven countries in this sample, the rate of growth of non-production wages exceeded those of production worker wages (where (1)/(3) < 1). There remain importance exceptions though, namely Honduras, Korea, Nigeria, and Singapore, where production worker mean wages in fact grew at a faster rate than non-production workers. Indeed these results are replicated when, the ratio of the mean wage of non-production to production workers is taken in the 1980s and then again in the 1990s, by the same sample of developing countries10 as can be observed in Table 17. Clearly the same countries reflect a widening or narrowing of the wage differential between production and non-production workers.
8 For a detailed overview of the difficulties in collection wage data by occupation across countries and their excellent work on deriving wage-occupation cells over time for a large set of countries, see Freeman & Oostendorp (2000). 9 The specific dates covered for each of the countries can be obtained from the authors. In addition, production and non-production worker variables were created from the original list of 162 occupations in the data set. Again, the details of the creation of this binary variable are available from the authors. 10 As with the previous table, for simplicity, we have not identified the specific year in the 1980s or 1990s that the data point pertains to. This information is available from the authors, or obtainable from the October Inquiry dataset.
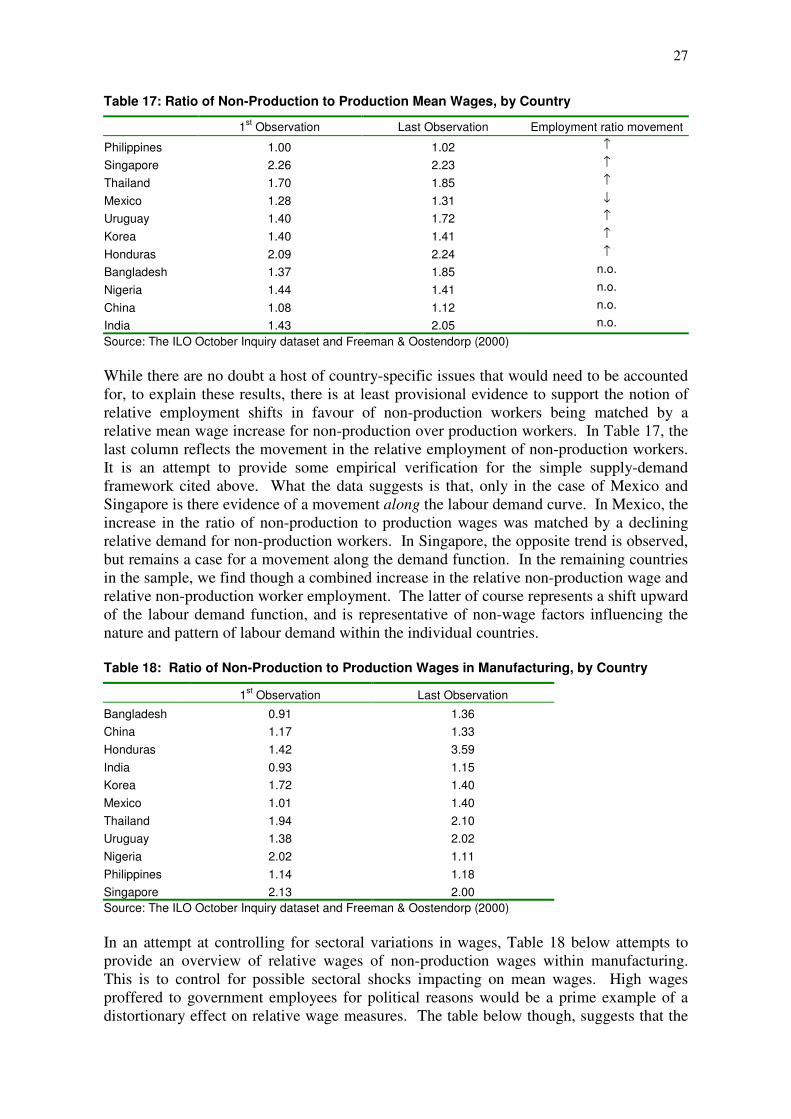
27
Table 17: Ratio of Non-Production to Production Mean Wages, by Country
1st Observation Last Observation Employment ratio movement
Philippines 1.00 1.02 ↑
Singapore 2.26 2.23 ↑
Thailand 1.70 1.85 ↑
Mexico 1.28 1.31 ↓
Uruguay 1.40 1.72 ↑
Korea 1.40 1.41 ↑
Honduras 2.09 2.24 ↑
Bangladesh 1.37 1.85 n.o.
Nigeria 1.44 1.41 n.o.
China 1.08 1.12 n.o.
India 1.43 2.05 n.o.
Source: The ILO October Inquiry dataset and Freeman & Oostendorp (2000) While there are no doubt a host of country-specific issues that would need to be accounted for, to explain these results, there is at least provisional evidence to support the notion of relative employment shifts in favour of non-production workers being matched by a relative mean wage increase for non-production over production workers. In Table 17, the last column reflects the movement in the relative employment of non-production workers. It is an attempt to provide some empirical verification for the simple supply-demand framework cited above. What the data suggests is that, only in the case of Mexico and Singapore is there evidence of a movement along the labour demand curve. In Mexico, the increase in the ratio of non-production to production wages was matched by a declining relative demand for non-production workers. In Singapore, the opposite trend is observed, but remains a case for a movement along the demand function. In the remaining countries in the sample, we find though a combined increase in the relative non-production wage and relative non-production worker employment. The latter of course represents a shift upward of the labour demand function, and is representative of non-wage factors influencing the nature and pattern of labour demand within the individual countries. Table 18: Ratio of Non-Production to Production Wages in Manufacturing, by Country
1st Observation Last Observation
Bangladesh 0.91 1.36 China 1.17 1.33 Honduras 1.42 3.59 India 0.93 1.15 Korea 1.72 1.40 Mexico 1.01 1.40 Thailand 1.94 2.10 Uruguay 1.38 2.02 Nigeria 2.02 1.11 Philippines 1.14 1.18 Singapore 2.13 2.00 Source: The ILO October Inquiry dataset and Freeman & Oostendorp (2000) In an attempt at controlling for sectoral variations in wages, Table 18 below attempts to provide an overview of relative wages of non-production wages within manufacturing. This is to control for possible sectoral shocks impacting on mean wages. High wages proffered to government employees for political reasons would be a prime example of a distortionary effect on relative wage measures. The table below though, suggests that the
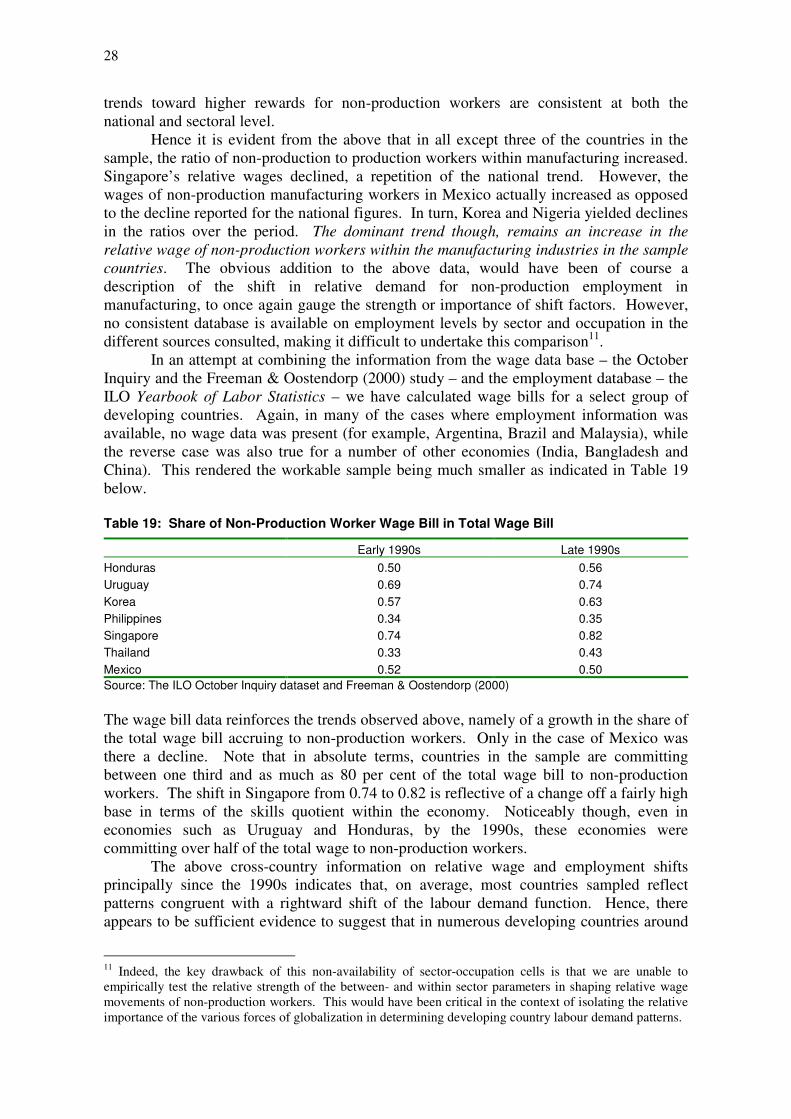
28
trends toward higher rewards for non-production workers are consistent at both the national and sectoral level.
Hence it is evident from the above that in all except three of the countries in the sample, the ratio of non-production to production workers within manufacturing increased. Singapore’s relative wages declined, a repetition of the national trend. However, the wages of non-production manufacturing workers in Mexico actually increased as opposed to the decline reported for the national figures. In turn, Korea and Nigeria yielded declines in the ratios over the period. The dominant trend though, remains an increase in the relative wage of non-production workers within the manufacturing industries in the sample countries. The obvious addition to the above data, would have been of course a description of the shift in relative demand for non-production employment in manufacturing, to once again gauge the strength or importance of shift factors. However, no consistent database is available on employment levels by sector and occupation in the different sources consulted, making it difficult to undertake this comparison11.
In an attempt at combining the information from the wage data base – the October Inquiry and the Freeman & Oostendorp (2000) study – and the employment database – the ILO Yearbook of Labor Statistics – we have calculated wage bills for a select group of developing countries. Again, in many of the cases where employment information was available, no wage data was present (for example, Argentina, Brazil and Malaysia), while the reverse case was also true for a number of other economies (India, Bangladesh and China). This rendered the workable sample being much smaller as indicated in Table 19 below. Table 19: Share of Non-Production Worker Wage Bill in Total Wage Bill
Early 1990s Late 1990s Honduras 0.50 0.56 Uruguay 0.69 0.74 Korea 0.57 0.63 Philippines 0.34 0.35 Singapore 0.74 0.82 Thailand 0.33 0.43 Mexico 0.52 0.50 Source: The ILO October Inquiry dataset and Freeman & Oostendorp (2000) The wage bill data reinforces the trends observed above, namely of a growth in the share of the total wage bill accruing to non-production workers. Only in the case of Mexico was there a decline. Note that in absolute terms, countries in the sample are committing between one third and as much as 80 per cent of the total wage bill to non-production workers. The shift in Singapore from 0.74 to 0.82 is reflective of a change off a fairly high base in terms of the skills quotient within the economy. Noticeably though, even in economies such as Uruguay and Honduras, by the 1990s, these economies were committing over half of the total wage to non-production workers.
The above cross-country information on relative wage and employment shifts principally since the 1990s indicates that, on average, most countries sampled reflect patterns congruent with a rightward shift of the labour demand function. Hence, there appears to be sufficient evidence to suggest that in numerous developing countries around
11 Indeed, the key drawback of this non-availability of sector-occupation cells is that we are unable to empirically test the relative strength of the between- and within sector parameters in shaping relative wage movements of non-production workers. This would have been critical in the context of isolating the relative importance of the various forces of globalization in determining developing country labour demand patterns.
29
the world, the relative wage of non-production workers is increasing together with a rise in relative employment levels. The source of these demand shifts is precisely where the importance of the forces of globalization and its labour market linkages arise. All five of our markers outlined in the introductory section, have a role in understanding this factor price and quantity shift. The growth in trade flows, rapid technological change, rising FDI and short-term capital flows, rapid tariff liberalization and finally structural changes in the individual economies, have all undoubtedly contributed to this increased preference for non-production workers, matched by a rising price being offered for their services. Simply put, the different facets of globalization lie at the heart of this shift in the nature of labour demand patterns across the developing world. The next obvious step though is to try and determine which particular components of globalization are important in explaining these altering labour market dynamics. While the work on the developed world is fairly well documented, very little such analysis has been undertaken on the developing world. We turn now though to an examination of some of the research that has been undertaken in this area – focusing particularly on how the different components of globalization may have impacted on absolute and relative wage levels in the developing world.
Globalization and Wage Differentials: Cross Country Evidence
The general focus in the globalization debate has been its impact on income inequality in an economy. We consider here the narrower issue of the impact of globalization on wage inequality, of course a central theme in the comparison of relative wage and relative employment shifts discussed above. Within the context of the above discussion on labour demand shifts, we attempt here to analyze the cross-country evidence on how globalization has impacted on wage inequality in the developing world.
Rama (2001) attempts to assess the impact of globalization on wage differentials through two different regression specifications. In the first instance, the impact of various facets of globalization on the standard deviation of logged wages is measured. Secondly the same explanatory variables are combined to measure their impact on the returns to education, as a proxy for growing differentials in earnings. The results show generally a very poor fit, as most of the globalization indicators across the countries sampled, do not impact on wage differentials by occupation. Only in the case of the first estimate, do we find that trade flows result in an increase in wage inequality. Specifically, a 1 per cent increase in trade flows, caused wage inequality by occupation to increase by 0.052 per cent. The measure of trade liberalization, namely the open economy dummy variable, as well as FDI flows, are insignificant determinants of wage inequality in the sample.
Expectedly, different yet not entirely contradictory results are reached by Freeman & Oostendorp (2000) in their detailed update and reworking of the ILO’s October Inquiry wage dataset. The authors find here that trade does result in an increase in wage dispersion. However, their measure of trade is related to GDP levels12, and the coefficient on their first specification is positive indicating that the higher the national income of an economy, the greater the level of wage dispersion. However, when a union variable is added to the equation, the impact of trade is more than halved, with the union variable of course significant in reducing wage differentials (Freeman & Oostendorp, 2000). Country studies within the developing world are limited, but two such studies, one for Chile and the other for South Africa, both suggest that trade is an insignificant determinant of wage differentials (Abdi & Edwards,2002; Reinecke & Torres, 2001). The combination of this, admittedly patchy and at present somewhat speculative research, is obliquely supportive of
12 The measure the authors use is capitaperGDP
GDPMX •+
30
the notion that the impact of trade flows or liberalization on shaping wage differentials is small in the developing world.
However, there is very strong evidence that in numerous developing countries, the wage differential between skilled and unskilled workers has grown over time. Hence, while trade flows and liberalization may not provisionally be the culprits for growing wage inequality, clearly a significant shift in these differentials has taken place. For example, Robbins (1996) in a very detailed study on the impact of trade on wages, shows that in numerous developing countries, particularly in Latin America there has been growing differential between skilled and unskilled workers, as measured by returns to education levels. Two developing country estimates are worth mentioning here: South Africa and Mexico. In South Africa, the ratio between workers of all occupations and elementary workers in manufacturing between 1995 and 2000 increased (see Table A3 in the Appendix). In Mexico, between 1984 and 1990, the period of the economy’s intensive liberalization, the ratio of hourly wages between white and blue-collar workers increased from 1.93 to 2.55 (Hanson & Harrison, 1999).
If trade flows and openness appear to be relatively small contributors to growing differentials, what then is the evidence on FDI flows? It would seem, if the developed country evidence is to be believed, that technological change is a primary determinant of relative demand shifts (Katz & Murphy, 1992) in the economy – so lending credence to the view that technology and its disproportionate demand for skilled workers, has raised the premium on these workers, and so contributed to increased in-country wage differentials. Once again, the evidence compiled by Rama (2001) is most instructive. The cross-country regression run here has as the dependent variable, returns to education (additional earnings per year of schooling), with the set of covariates similar to those noted above. The returns to education variable, should a coefficient be positive, would indicate a higher return to those with higher levels of education, so raising wage differentials in the labour market. With this specification, the openness variable is insignificant, while the trade variable is significant in the narrow specification, but loses power when other variables are included.
It is the FDI variable though that interests us here. For both specifications, FDI is shown to be a highly significant and positive determinant of returns to education. In other words, FDI flows contribute toward an increase in earnings differentials within the countries sampled. Specifically, the coefficient values suggest that an additional point of GDP in FDI is associated with an increase of five percentage points in the returns to an additional year of schooling. Technology as embedded in foreign capital inflows, it would seem, rather than trade or openness is the key determinant of wage inequality. This result matches well with the data provided above on the role of MNCs in increasing wages relative to domestic firms. For in the aggregate, despite raising wages within firms, it is possible that this has the effect of increasing in-country differentials. Two country studies also support this conclusion. In an input-output analysis of changing labour demand patterns in South Africa, Edwards (1999) finds that it is technology rather than trade which explains the rising relative demand for skilled workers in the period 1993-97. Specifically, the author finds that while exports caused the demand for unskilled workers to increase by 2 per cent, technology resulted in a decline in unskilled labour demand of 10 per cent (Edwards, 1999). Conversely exports and technology both increased the demand for skilled workers by similar magnitudes. In their study of the Chilean labour market, Reinecke & Torres (2001) find that exports, measured in different ways, is an insignificant determinant of wage inequality in Chile. In contrast, technological change (which they measure by using a time trend) yields a significant and positive effect on wage inequality over the period 1960-96. Specifically, the authors on the basis of their regression results isolate the relative impact of trade, technology and education on wage differentials in Chile over this
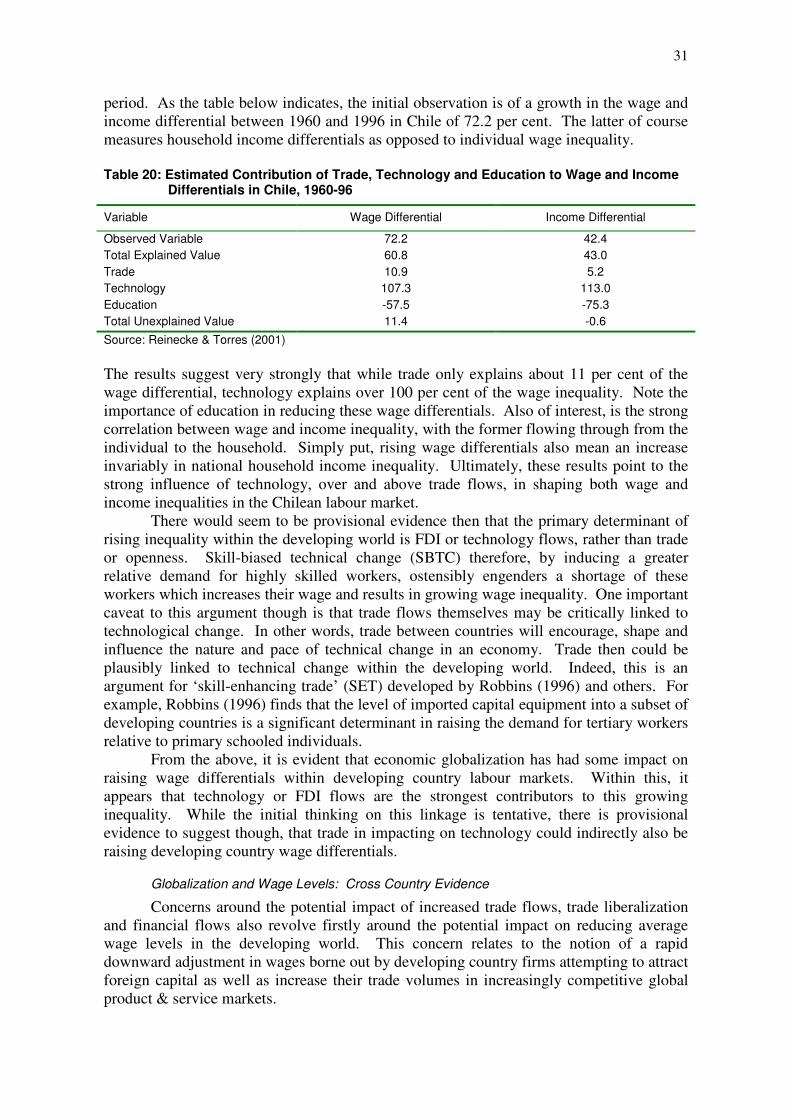
31
period. As the table below indicates, the initial observation is of a growth in the wage and income differential between 1960 and 1996 in Chile of 72.2 per cent. The latter of course measures household income differentials as opposed to individual wage inequality. Table 20: Estimated Contribution of Trade, Technology and Education to Wage and Income
Differentials in Chile, 1960-96
Variable Wage Differential Income Differential
Observed Variable 72.2 42.4 Total Explained Value 60.8 43.0 Trade 10.9 5.2 Technology 107.3 113.0 Education -57.5 -75.3 Total Unexplained Value 11.4 -0.6 Source: Reinecke & Torres (2001) The results suggest very strongly that while trade only explains about 11 per cent of the wage differential, technology explains over 100 per cent of the wage inequality. Note the importance of education in reducing these wage differentials. Also of interest, is the strong correlation between wage and income inequality, with the former flowing through from the individual to the household. Simply put, rising wage differentials also mean an increase invariably in national household income inequality. Ultimately, these results point to the strong influence of technology, over and above trade flows, in shaping both wage and income inequalities in the Chilean labour market.
There would seem to be provisional evidence then that the primary determinant of rising inequality within the developing world is FDI or technology flows, rather than trade or openness. Skill-biased technical change (SBTC) therefore, by inducing a greater relative demand for highly skilled workers, ostensibly engenders a shortage of these workers which increases their wage and results in growing wage inequality. One important caveat to this argument though is that trade flows themselves may be critically linked to technological change. In other words, trade between countries will encourage, shape and influence the nature and pace of technical change in an economy. Trade then could be plausibly linked to technical change within the developing world. Indeed, this is an argument for ‘skill-enhancing trade’ (SET) developed by Robbins (1996) and others. For example, Robbins (1996) finds that the level of imported capital equipment into a subset of developing countries is a significant determinant in raising the demand for tertiary workers relative to primary schooled individuals.
From the above, it is evident that economic globalization has had some impact on raising wage differentials within developing country labour markets. Within this, it appears that technology or FDI flows are the strongest contributors to this growing inequality. While the initial thinking on this linkage is tentative, there is provisional evidence to suggest though, that trade in impacting on technology could indirectly also be raising developing country wage differentials.
Globalization and Wage Levels: Cross Country Evidence
Concerns around the potential impact of increased trade flows, trade liberalization and financial flows also revolve firstly around the potential impact on reducing average wage levels in the developing world. This concern relates to the notion of a rapid downward adjustment in wages borne out by developing country firms attempting to attract foreign capital as well as increase their trade volumes in increasingly competitive global product & service markets.
32
Rama (2001) is again illuminating on the possible impact of trade flows and FDI on absolute wage levels in an economy. Results from the cross-country work on this data suggests in the first instance that trade flows, measured in different ways and according to alternate specifications, has had the effect of reducing wages by occupation. For all regressions, the author included year, country and occupation controls and that the explanatory variables are all lagged by one year. What is critical for our purposes here is that the author notes that these regressions were run for developing countries only, and states that the results presented are very similar (Rama, 2001:9).
When trade-to-GDP is used as a proxy for trade flows, the author shows that in both specifications, trade is a significant determinant of reducing wages by occupation across the countries in the sample. In a second specification, when additional variables such as per capita GDP, and political and economic liberty indices are included - trade flows are still shown to be important in reducing average wages in an economy. Specifically, a 1 per cent increase in trade-to-GDP ratios is estimated to cause between a 0.13 to 0.28 per cent decline in wages by occupation. When estimating the impact of trade liberalization on wages by occupation, similar results are yielded. The author uses the Sachs & Warner (1995) definition of openness to determine how this may affect wage levels. The effect is significant and negative, indicating that more open economies result in lower wages by occupation. This relationship holds true for both functional specifications, although the impact of openness on wages is smaller when accounting for other variables. The FDI-to-GDP variable, which is a part-proxy it must be remembered for technology, shows the opposite sign however13. In this case, higher levels of FDI lead to increased wages by occupation. The relationship is also close to a one-to-one relationship, irrespective of the specification. Hence, a 1 per cent increase in FDI-to-GDP levels results in 1 to 1.1 per cent increase in wages by occupation.
There would seem to be two forces at work here. Firstly, FDI, through its facilitation of new technologies may in fact be representative of the level of new technology diffusion in the country. Hence, the greater the propensity for new technology adoption, the higher the demand for new, more skilled workers. This in turn raises the demand for skilled workers and (assuming a constant supply) its price, so raising the mean wage in the economy. Secondly, and perhaps more pertinent here, is the role of large multi-national corporations (MNCs) in affecting absolute wage levels in an economy. Large corporations are of course the public face of FDI in any developing country and as such their location into a developing country14 will have important economic and welfare outcomes. Limited research into the impact of large foreign companies on destination country wages, affirms that these corporations do pay higher wages for all workers, relative to domestic firms. For example a study by Figlio & Blonigen (1999) showed that the relocation of foreign firms does result in a hike in remuneration for all workers within a specified region. Table 21 below, using evidence from Venezuela and Mexico estimates the impact that foreign ownership of a firm has on wage levels within the sample of firms. All regressions shown in Table 21 included industry, regional and year dummies and the figures pertain to the manufacturing industry only. 13 The endogenous growth theory work of Romer (1993) for example spoke of ‘idea gaps’ – gaps between nations in terms of knowledge and ideas relevant to long-run growth, and noted that such gaps were most strongly influenced by the extent of FDI entering the country. 14 MNCs would either invest the entire value chain production process in the destination developing country, or ‘slice up the value chain’ and relocate the production of intermediaries to the lower-wage, low-skills intensive developing country. This form of ‘international outsourcing’ has of course become extremely prevalent during the 1980s and 1990s. See Feenstra & Hanson (1996) for more details on the impact of such outsourcing on the developed world’s labour markets.
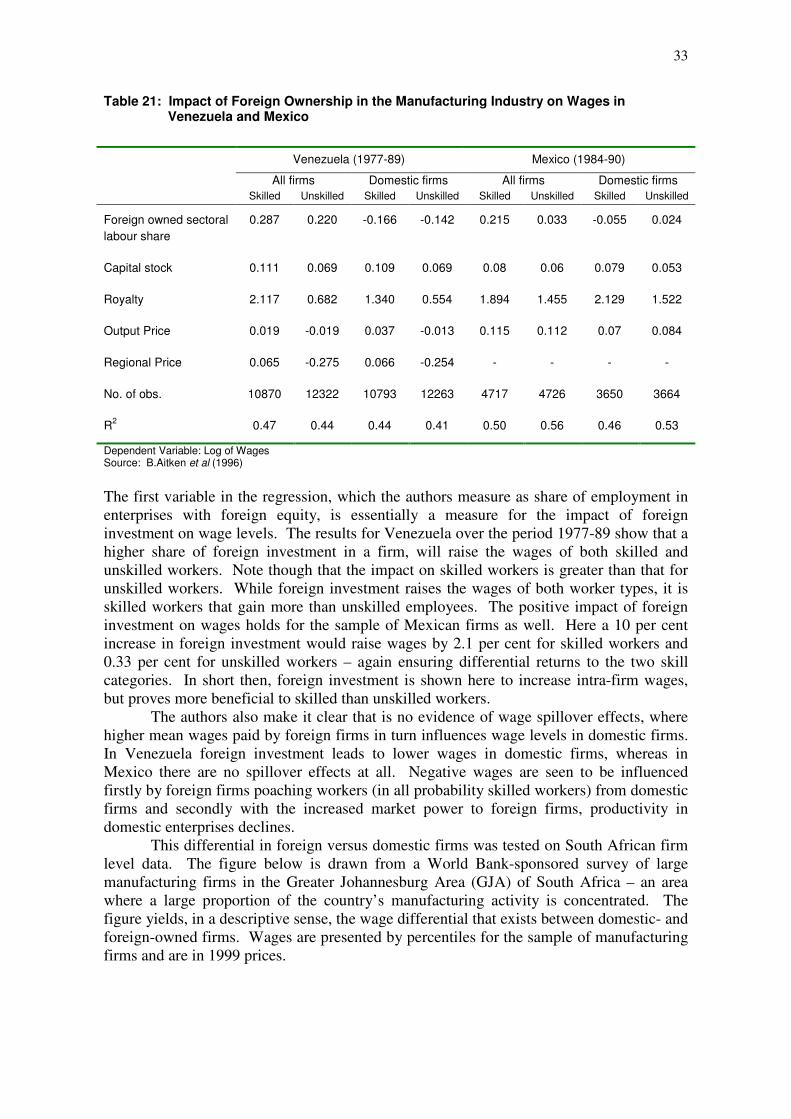
33
Table 21: Impact of Foreign Ownership in the Manufacturing Industry on Wages in Venezuela and Mexico
Venezuela (1977-89) Mexico (1984-90)
All firms Domestic firms All firms Domestic firms Skilled Unskilled Skilled Unskilled Skilled Unskilled Skilled Unskilled
Foreign owned sectoral labour share
0.287 0.220 -0.166 -0.142 0.215 0.033 -0.055 0.024
Capital stock 0.111 0.069 0.109 0.069 0.08 0.06 0.079 0.053
Royalty 2.117 0.682 1.340 0.554 1.894 1.455 2.129 1.522
Output Price 0.019 -0.019 0.037 -0.013 0.115 0.112 0.07 0.084
Regional Price 0.065 -0.275 0.066 -0.254 - - - -
No. of obs. 10870 12322 10793 12263 4717 4726 3650 3664
R2 0.47 0.44 0.44 0.41 0.50 0.56 0.46 0.53
Dependent Variable: Log of Wages Source: B.Aitken et al (1996)
The first variable in the regression, which the authors measure as share of employment in enterprises with foreign equity, is essentially a measure for the impact of foreign investment on wage levels. The results for Venezuela over the period 1977-89 show that a higher share of foreign investment in a firm, will raise the wages of both skilled and unskilled workers. Note though that the impact on skilled workers is greater than that for unskilled workers. While foreign investment raises the wages of both worker types, it is skilled workers that gain more than unskilled employees. The positive impact of foreign investment on wages holds for the sample of Mexican firms as well. Here a 10 per cent increase in foreign investment would raise wages by 2.1 per cent for skilled workers and 0.33 per cent for unskilled workers – again ensuring differential returns to the two skill categories. In short then, foreign investment is shown here to increase intra-firm wages, but proves more beneficial to skilled than unskilled workers.
The authors also make it clear that is no evidence of wage spillover effects, where higher mean wages paid by foreign firms in turn influences wage levels in domestic firms. In Venezuela foreign investment leads to lower wages in domestic firms, whereas in Mexico there are no spillover effects at all. Negative wages are seen to be influenced firstly by foreign firms poaching workers (in all probability skilled workers) from domestic firms and secondly with the increased market power to foreign firms, productivity in domestic enterprises declines.
This differential in foreign versus domestic firms was tested on South African firm level data. The figure below is drawn from a World Bank-sponsored survey of large manufacturing firms in the Greater Johannesburg Area (GJA) of South Africa – an area where a large proportion of the country’s manufacturing activity is concentrated. The figure yields, in a descriptive sense, the wage differential that exists between domestic- and foreign-owned firms. Wages are presented by percentiles for the sample of manufacturing firms and are in 1999 prices.
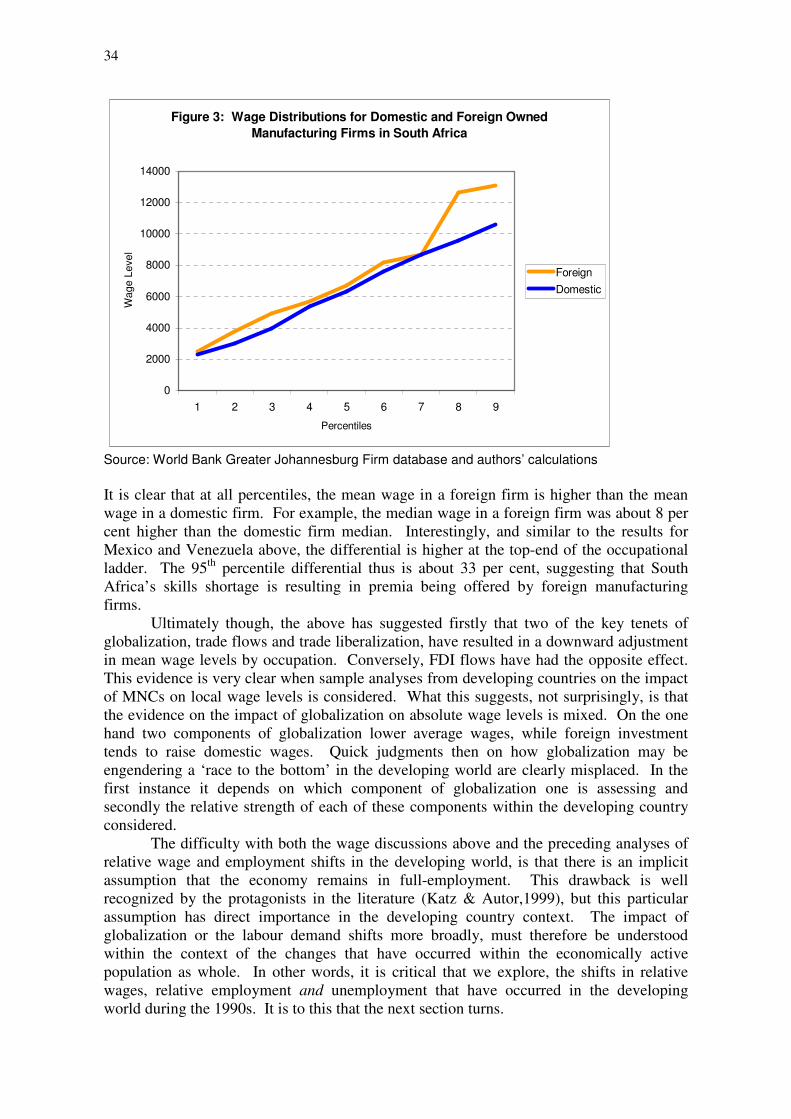
34
Figure 3: Wage Distributions for Domestic and Foreign Owned Manufacturing Firms in South Africa
0
2000
4000
6000
8000
10000
12000
14000
1 2 3 4 5 6 7 8 9
Percentiles
Wag
e Le
vel
ForeignDomestic
Source: World Bank Greater Johannesburg Firm database and authors’ calculations It is clear that at all percentiles, the mean wage in a foreign firm is higher than the mean wage in a domestic firm. For example, the median wage in a foreign firm was about 8 per cent higher than the domestic firm median. Interestingly, and similar to the results for Mexico and Venezuela above, the differential is higher at the top-end of the occupational ladder. The 95th percentile differential thus is about 33 per cent, suggesting that South Africa’s skills shortage is resulting in premia being offered by foreign manufacturing firms.
Ultimately though, the above has suggested firstly that two of the key tenets of globalization, trade flows and trade liberalization, have resulted in a downward adjustment in mean wage levels by occupation. Conversely, FDI flows have had the opposite effect. This evidence is very clear when sample analyses from developing countries on the impact of MNCs on local wage levels is considered. What this suggests, not surprisingly, is that the evidence on the impact of globalization on absolute wage levels is mixed. On the one hand two components of globalization lower average wages, while foreign investment tends to raise domestic wages. Quick judgments then on how globalization may be engendering a ‘race to the bottom’ in the developing world are clearly misplaced. In the first instance it depends on which component of globalization one is assessing and secondly the relative strength of each of these components within the developing country considered.
The difficulty with both the wage discussions above and the preceding analyses of relative wage and employment shifts in the developing world, is that there is an implicit assumption that the economy remains in full-employment. This drawback is well recognized by the protagonists in the literature (Katz & Autor,1999), but this particular assumption has direct importance in the developing country context. The impact of globalization or the labour demand shifts more broadly, must therefore be understood within the context of the changes that have occurred within the economically active population as whole. In other words, it is critical that we explore, the shifts in relative wages, relative employment and unemployment that have occurred in the developing world during the 1990s. It is to this that the next section turns.
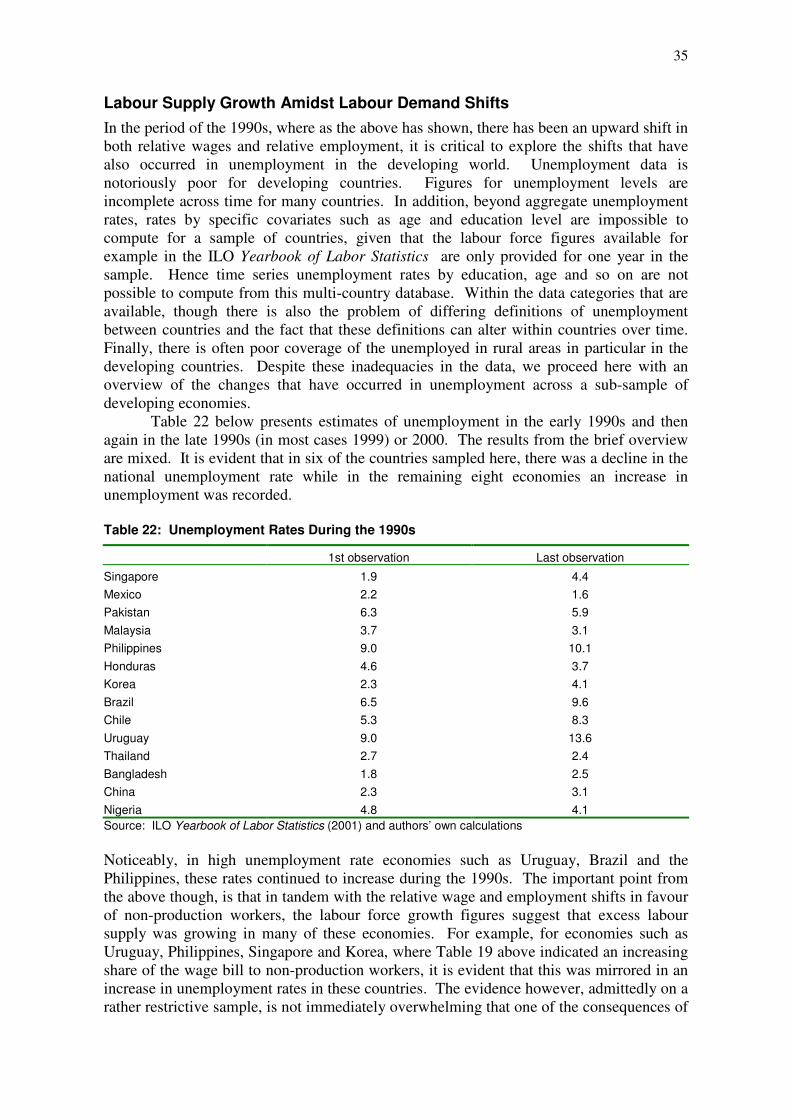
35
Labour Supply Growth Amidst Labour Demand Shifts In the period of the 1990s, where as the above has shown, there has been an upward shift in both relative wages and relative employment, it is critical to explore the shifts that have also occurred in unemployment in the developing world. Unemployment data is notoriously poor for developing countries. Figures for unemployment levels are incomplete across time for many countries. In addition, beyond aggregate unemployment rates, rates by specific covariates such as age and education level are impossible to compute for a sample of countries, given that the labour force figures available for example in the ILO Yearbook of Labor Statistics are only provided for one year in the sample. Hence time series unemployment rates by education, age and so on are not possible to compute from this multi-country database. Within the data categories that are available, though there is also the problem of differing definitions of unemployment between countries and the fact that these definitions can alter within countries over time. Finally, there is often poor coverage of the unemployed in rural areas in particular in the developing countries. Despite these inadequacies in the data, we proceed here with an overview of the changes that have occurred in unemployment across a sub-sample of developing economies.
Table 22 below presents estimates of unemployment in the early 1990s and then again in the late 1990s (in most cases 1999) or 2000. The results from the brief overview are mixed. It is evident that in six of the countries sampled here, there was a decline in the national unemployment rate while in the remaining eight economies an increase in unemployment was recorded. Table 22: Unemployment Rates During the 1990s
1st observation Last observation
Singapore 1.9 4.4 Mexico 2.2 1.6 Pakistan 6.3 5.9 Malaysia 3.7 3.1 Philippines 9.0 10.1 Honduras 4.6 3.7 Korea 2.3 4.1 Brazil 6.5 9.6 Chile 5.3 8.3 Uruguay 9.0 13.6 Thailand 2.7 2.4 Bangladesh 1.8 2.5 China 2.3 3.1 Nigeria 4.8 4.1 Source: ILO Yearbook of Labor Statistics (2001) and authors’ own calculations Noticeably, in high unemployment rate economies such as Uruguay, Brazil and the Philippines, these rates continued to increase during the 1990s. The important point from the above though, is that in tandem with the relative wage and employment shifts in favour of non-production workers, the labour force growth figures suggest that excess labour supply was growing in many of these economies. For example, for economies such as Uruguay, Philippines, Singapore and Korea, where Table 19 above indicated an increasing share of the wage bill to non-production workers, it is evident that this was mirrored in an increase in unemployment rates in these countries. The evidence however, admittedly on a rather restrictive sample, is not immediately overwhelming that one of the consequences of
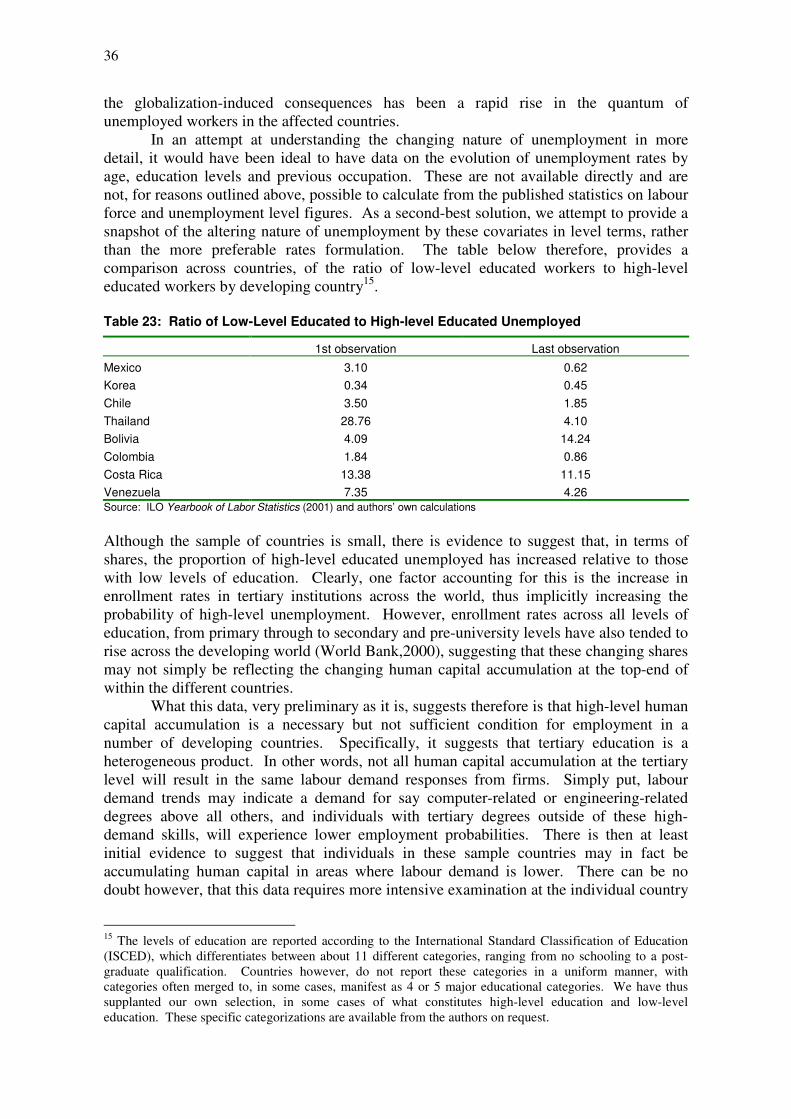
36
the globalization-induced consequences has been a rapid rise in the quantum of unemployed workers in the affected countries.
In an attempt at understanding the changing nature of unemployment in more detail, it would have been ideal to have data on the evolution of unemployment rates by age, education levels and previous occupation. These are not available directly and are not, for reasons outlined above, possible to calculate from the published statistics on labour force and unemployment level figures. As a second-best solution, we attempt to provide a snapshot of the altering nature of unemployment by these covariates in level terms, rather than the more preferable rates formulation. The table below therefore, provides a comparison across countries, of the ratio of low-level educated workers to high-level educated workers by developing country15. Table 23: Ratio of Low-Level Educated to High-level Educated Unemployed
1st observation Last observation
Mexico 3.10 0.62 Korea 0.34 0.45 Chile 3.50 1.85 Thailand 28.76 4.10 Bolivia 4.09 14.24 Colombia 1.84 0.86 Costa Rica 13.38 11.15 Venezuela 7.35 4.26 Source: ILO Yearbook of Labor Statistics (2001) and authors’ own calculations
Although the sample of countries is small, there is evidence to suggest that, in terms of shares, the proportion of high-level educated unemployed has increased relative to those with low levels of education. Clearly, one factor accounting for this is the increase in enrollment rates in tertiary institutions across the world, thus implicitly increasing the probability of high-level unemployment. However, enrollment rates across all levels of education, from primary through to secondary and pre-university levels have also tended to rise across the developing world (World Bank,2000), suggesting that these changing shares may not simply be reflecting the changing human capital accumulation at the top-end of within the different countries.
What this data, very preliminary as it is, suggests therefore is that high-level human capital accumulation is a necessary but not sufficient condition for employment in a number of developing countries. Specifically, it suggests that tertiary education is a heterogeneous product. In other words, not all human capital accumulation at the tertiary level will result in the same labour demand responses from firms. Simply put, labour demand trends may indicate a demand for say computer-related or engineering-related degrees above all others, and individuals with tertiary degrees outside of these high-demand skills, will experience lower employment probabilities. There is then at least initial evidence to suggest that individuals in these sample countries may in fact be accumulating human capital in areas where labour demand is lower. There can be no doubt however, that this data requires more intensive examination at the individual country
15 The levels of education are reported according to the International Standard Classification of Education (ISCED), which differentiates between about 11 different categories, ranging from no schooling to a post-graduate qualification. Countries however, do not report these categories in a uniform manner, with categories often merged to, in some cases, manifest as 4 or 5 major educational categories. We have thus supplanted our own selection, in some cases of what constitutes high-level education and low-level education. These specific categorizations are available from the authors on request.
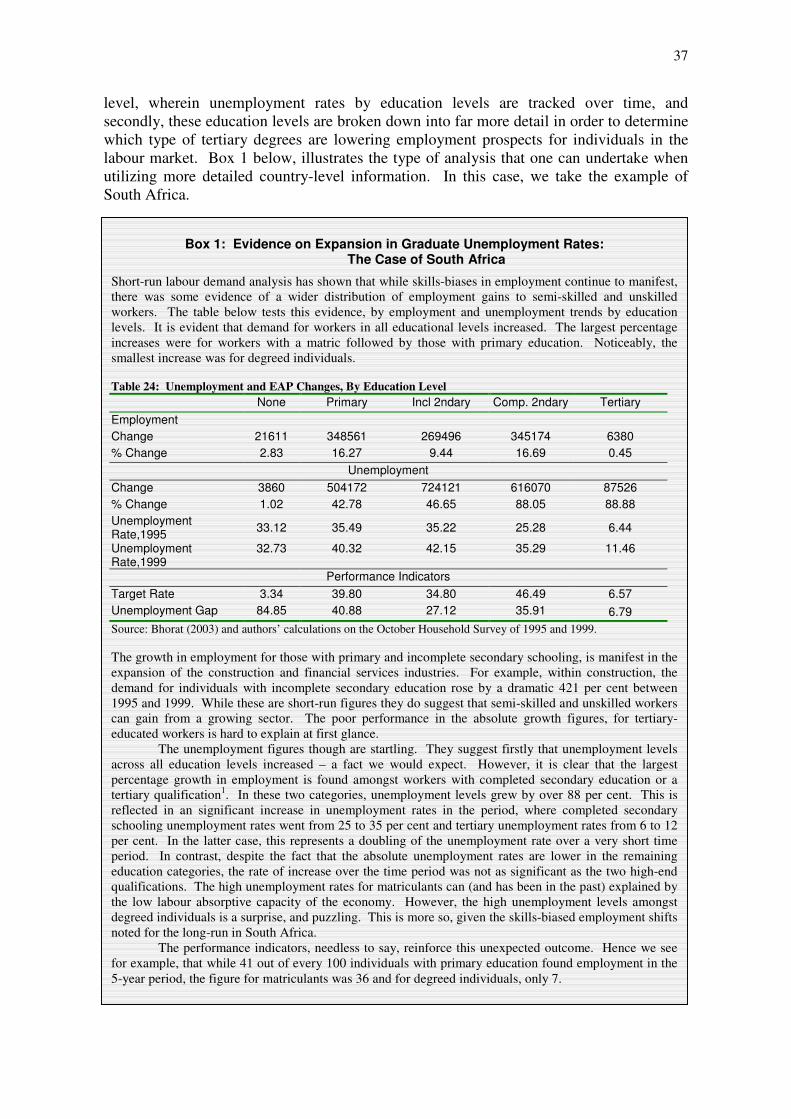
37
level, wherein unemployment rates by education levels are tracked over time, and secondly, these education levels are broken down into far more detail in order to determine which type of tertiary degrees are lowering employment prospects for individuals in the labour market. Box 1 below, illustrates the type of analysis that one can undertake when utilizing more detailed country-level information. In this case, we take the example of South Africa.
Box 1: Evidence on Expansion in Graduate Unemployment Rates:
The Case of South Africa
Short-run labour demand analysis has shown that while skills-biases in employment continue to manifest, there was some evidence of a wider distribution of employment gains to semi-skilled and unskilled workers. The table below tests this evidence, by employment and unemployment trends by education levels. It is evident that demand for workers in all educational levels increased. The largest percentage increases were for workers with a matric followed by those with primary education. Noticeably, the smallest increase was for degreed individuals. Table 24: Unemployment and EAP Changes, By Education Level
None Primary Incl 2ndary Comp. 2ndary Tertiary Employment Change 21611 348561 269496 345174 6380 % Change 2.83 16.27 9.44 16.69 0.45
Unemployment Change 3860 504172 724121 616070 87526 % Change 1.02 42.78 46.65 88.05 88.88 Unemployment Rate,1995 33.12 35.49 35.22 25.28 6.44
Unemployment Rate,1999
32.73 40.32 42.15 35.29 11.46
Performance Indicators Target Rate 3.34 39.80 34.80 46.49 6.57 Unemployment Gap 84.85 40.88 27.12 35.91 6.79 Source: Bhorat (2003) and authors’ calculations on the October Household Survey of 1995 and 1999. The growth in employment for those with primary and incomplete secondary schooling, is manifest in the expansion of the construction and financial services industries. For example, within construction, the demand for individuals with incomplete secondary education rose by a dramatic 421 per cent between 1995 and 1999. While these are short-run figures they do suggest that semi-skilled and unskilled workers can gain from a growing sector. The poor performance in the absolute growth figures, for tertiary-educated workers is hard to explain at first glance.
The unemployment figures though are startling. They suggest firstly that unemployment levels across all education levels increased – a fact we would expect. However, it is clear that the largest percentage growth in employment is found amongst workers with completed secondary education or a tertiary qualification1. In these two categories, unemployment levels grew by over 88 per cent. This is reflected in an significant increase in unemployment rates in the period, where completed secondary schooling unemployment rates went from 25 to 35 per cent and tertiary unemployment rates from 6 to 12 per cent. In the latter case, this represents a doubling of the unemployment rate over a very short time period. In contrast, despite the fact that the absolute unemployment rates are lower in the remaining education categories, the rate of increase over the time period was not as significant as the two high-end qualifications. The high unemployment rates for matriculants can (and has been in the past) explained by the low labour absorptive capacity of the economy. However, the high unemployment levels amongst degreed individuals is a surprise, and puzzling. This is more so, given the skills-biased employment shifts noted for the long-run in South Africa.
The performance indicators, needless to say, reinforce this unexpected outcome. Hence we see for example, that while 41 out of every 100 individuals with primary education found employment in the 5-year period, the figure for matriculants was 36 and for degreed individuals, only 7.
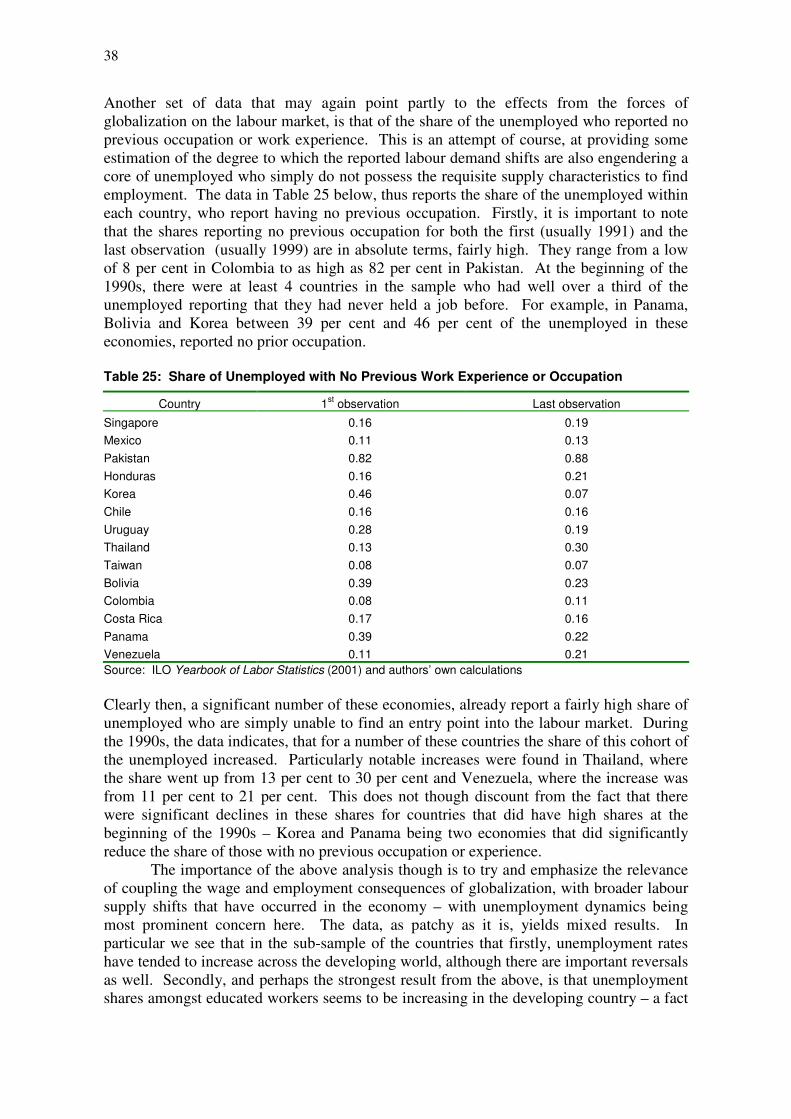
38
Another set of data that may again point partly to the effects from the forces of globalization on the labour market, is that of the share of the unemployed who reported no previous occupation or work experience. This is an attempt of course, at providing some estimation of the degree to which the reported labour demand shifts are also engendering a core of unemployed who simply do not possess the requisite supply characteristics to find employment. The data in Table 25 below, thus reports the share of the unemployed within each country, who report having no previous occupation. Firstly, it is important to note that the shares reporting no previous occupation for both the first (usually 1991) and the last observation (usually 1999) are in absolute terms, fairly high. They range from a low of 8 per cent in Colombia to as high as 82 per cent in Pakistan. At the beginning of the 1990s, there were at least 4 countries in the sample who had well over a third of the unemployed reporting that they had never held a job before. For example, in Panama, Bolivia and Korea between 39 per cent and 46 per cent of the unemployed in these economies, reported no prior occupation. Table 25: Share of Unemployed with No Previous Work Experience or Occupation
Country 1st observation Last observation
Singapore 0.16 0.19 Mexico 0.11 0.13 Pakistan 0.82 0.88 Honduras 0.16 0.21 Korea 0.46 0.07 Chile 0.16 0.16 Uruguay 0.28 0.19 Thailand 0.13 0.30 Taiwan 0.08 0.07 Bolivia 0.39 0.23 Colombia 0.08 0.11 Costa Rica 0.17 0.16 Panama 0.39 0.22 Venezuela 0.11 0.21 Source: ILO Yearbook of Labor Statistics (2001) and authors’ own calculations Clearly then, a significant number of these economies, already report a fairly high share of unemployed who are simply unable to find an entry point into the labour market. During the 1990s, the data indicates, that for a number of these countries the share of this cohort of the unemployed increased. Particularly notable increases were found in Thailand, where the share went up from 13 per cent to 30 per cent and Venezuela, where the increase was from 11 per cent to 21 per cent. This does not though discount from the fact that there were significant declines in these shares for countries that did have high shares at the beginning of the 1990s – Korea and Panama being two economies that did significantly reduce the share of those with no previous occupation or experience.
The importance of the above analysis though is to try and emphasize the relevance of coupling the wage and employment consequences of globalization, with broader labour supply shifts that have occurred in the economy – with unemployment dynamics being most prominent concern here. The data, as patchy as it is, yields mixed results. In particular we see that in the sub-sample of the countries that firstly, unemployment rates have tended to increase across the developing world, although there are important reversals as well. Secondly, and perhaps the strongest result from the above, is that unemployment shares amongst educated workers seems to be increasing in the developing country – a fact
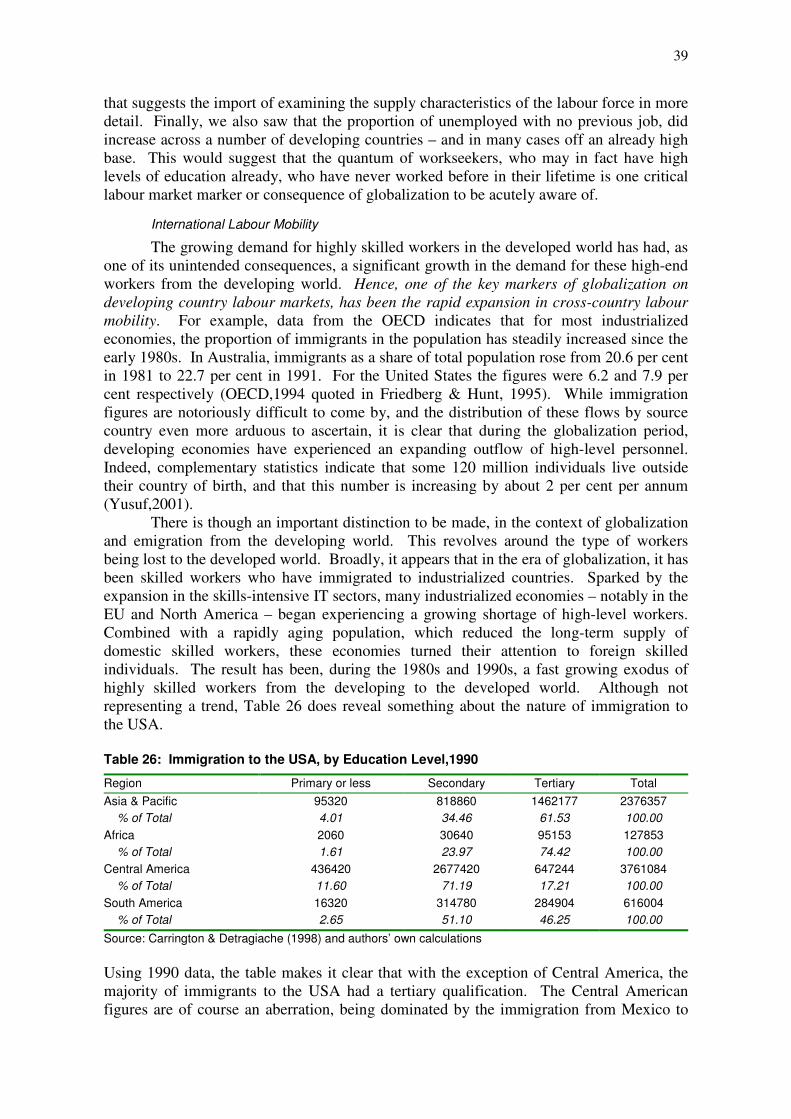
39
that suggests the import of examining the supply characteristics of the labour force in more detail. Finally, we also saw that the proportion of unemployed with no previous job, did increase across a number of developing countries – and in many cases off an already high base. This would suggest that the quantum of workseekers, who may in fact have high levels of education already, who have never worked before in their lifetime is one critical labour market marker or consequence of globalization to be acutely aware of.
International Labour Mobility
The growing demand for highly skilled workers in the developed world has had, as one of its unintended consequences, a significant growth in the demand for these high-end workers from the developing world. Hence, one of the key markers of globalization on developing country labour markets, has been the rapid expansion in cross-country labour mobility. For example, data from the OECD indicates that for most industrialized economies, the proportion of immigrants in the population has steadily increased since the early 1980s. In Australia, immigrants as a share of total population rose from 20.6 per cent in 1981 to 22.7 per cent in 1991. For the United States the figures were 6.2 and 7.9 per cent respectively (OECD,1994 quoted in Friedberg & Hunt, 1995). While immigration figures are notoriously difficult to come by, and the distribution of these flows by source country even more arduous to ascertain, it is clear that during the globalization period, developing economies have experienced an expanding outflow of high-level personnel. Indeed, complementary statistics indicate that some 120 million individuals live outside their country of birth, and that this number is increasing by about 2 per cent per annum (Yusuf,2001).
There is though an important distinction to be made, in the context of globalization and emigration from the developing world. This revolves around the type of workers being lost to the developed world. Broadly, it appears that in the era of globalization, it has been skilled workers who have immigrated to industrialized countries. Sparked by the expansion in the skills-intensive IT sectors, many industrialized economies – notably in the EU and North America – began experiencing a growing shortage of high-level workers. Combined with a rapidly aging population, which reduced the long-term supply of domestic skilled workers, these economies turned their attention to foreign skilled individuals. The result has been, during the 1980s and 1990s, a fast growing exodus of highly skilled workers from the developing to the developed world. Although not representing a trend, Table 26 does reveal something about the nature of immigration to the USA. Table 26: Immigration to the USA, by Education Level,1990
Region Primary or less Secondary Tertiary Total Asia & Pacific 95320 818860 1462177 2376357 % of Total 4.01 34.46 61.53 100.00 Africa 2060 30640 95153 127853 % of Total 1.61 23.97 74.42 100.00 Central America 436420 2677420 647244 3761084 % of Total 11.60 71.19 17.21 100.00 South America 16320 314780 284904 616004 % of Total 2.65 51.10 46.25 100.00
Source: Carrington & Detragiache (1998) and authors’ own calculations Using 1990 data, the table makes it clear that with the exception of Central America, the majority of immigrants to the USA had a tertiary qualification. The Central American figures are of course an aberration, being dominated by the immigration from Mexico to
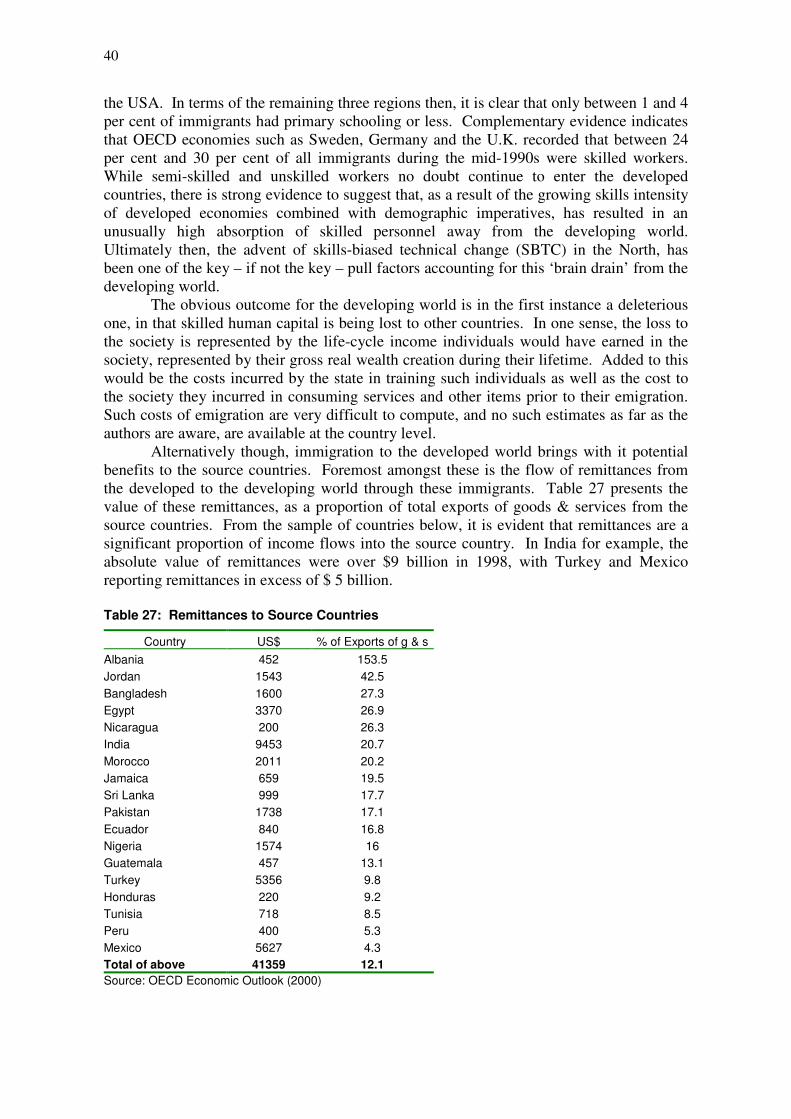
40
the USA. In terms of the remaining three regions then, it is clear that only between 1 and 4 per cent of immigrants had primary schooling or less. Complementary evidence indicates that OECD economies such as Sweden, Germany and the U.K. recorded that between 24 per cent and 30 per cent of all immigrants during the mid-1990s were skilled workers. While semi-skilled and unskilled workers no doubt continue to enter the developed countries, there is strong evidence to suggest that, as a result of the growing skills intensity of developed economies combined with demographic imperatives, has resulted in an unusually high absorption of skilled personnel away from the developing world. Ultimately then, the advent of skills-biased technical change (SBTC) in the North, has been one of the key – if not the key – pull factors accounting for this ‘brain drain’ from the developing world.
The obvious outcome for the developing world is in the first instance a deleterious one, in that skilled human capital is being lost to other countries. In one sense, the loss to the society is represented by the life-cycle income individuals would have earned in the society, represented by their gross real wealth creation during their lifetime. Added to this would be the costs incurred by the state in training such individuals as well as the cost to the society they incurred in consuming services and other items prior to their emigration. Such costs of emigration are very difficult to compute, and no such estimates as far as the authors are aware, are available at the country level.
Alternatively though, immigration to the developed world brings with it potential benefits to the source countries. Foremost amongst these is the flow of remittances from the developed to the developing world through these immigrants. Table 27 presents the value of these remittances, as a proportion of total exports of goods & services from the source countries. From the sample of countries below, it is evident that remittances are a significant proportion of income flows into the source country. In India for example, the absolute value of remittances were over $9 billion in 1998, with Turkey and Mexico reporting remittances in excess of $ 5 billion. Table 27: Remittances to Source Countries
Country US$ % of Exports of g & s Albania 452 153.5 Jordan 1543 42.5 Bangladesh 1600 27.3 Egypt 3370 26.9 Nicaragua 200 26.3 India 9453 20.7 Morocco 2011 20.2 Jamaica 659 19.5 Sri Lanka 999 17.7 Pakistan 1738 17.1 Ecuador 840 16.8 Nigeria 1574 16 Guatemala 457 13.1 Turkey 5356 9.8 Honduras 220 9.2 Tunisia 718 8.5 Peru 400 5.3 Mexico 5627 4.3 Total of above 41359 12.1 Source: OECD Economic Outlook (2000)
41
As a share of goods and services exports, it is evident that Albania in particular yields remittances that are about 150 per cent of the value of exports from the source country. Jordanian immigrants in turn have repatriated income that in 1998 was over 40 per cent of the nominal value of the economy’s exports. Bangladeshi, Egyptian and Nicaraguan immigrants in turn also reveal fairly high levels of remittances relative to exports from their respective home countries. Ultimately then, one of the key benefits of immigration from the developing world is that the income earned abroad is often repatriated, hence serving in many cases as a vital additional income source to inhabitants in the source country. For indigent households, this source of income remains a vital social safety net.
At a different level, one of the benefits of immigration lies in the probability of immigrants returning to their source country. Indeed, evidence indicates that about 22 per cent of immigrants who arrived in the USA between 1981 and 1990, returned to their home country (Friedberg & Hunt, 1995). Complementary evidence also supports this notion of re-immigration, arriving at similar repatriation rates (OECD,2000). Given this, skilled immigrants would have upgraded their human capital, developed new skills, gained experienced and possibly even established networks within their area of expertise. Simply put, the immigrant that returns to the source country, returns as a far more useful asset to the economy than when they originally left.
What the above, very brief overview, has suggested thus is that globalization through its impact on developed country skilled labour shortages has had, as one of its unintended consequences, an increased outflow of skilled labour from the developing world. While the cost to the source country remains, the benefits to the latter in the form of remittances and the possibility of re-immigration, serve to mitigate against the obvious deleterious consequences of a developing country losing its most scarce human resource.
4. The Labour Market Regulatory Environment
The Institutional Conditions Shaping the Regulatory Environment In the contemporary phase, the five key economic markers of globalization appear to have had distinct impacts on national economies particularly within the short-term. But in spite of these differences the evidence suggests that over time a significant convergence in industrial relations practices has been methodically taking place. This convergence signifies interventions that are deemed appropriate for stable employment relations. The contemporary phase of globalization has indicated the necessity for a regulatory environment that departs from the historical concerns with fiscal and monetary interventions exclusively. Instead it has established a requirement for more directed and targeted interventions. In part this has resulted from the gradually diminishing capacity for states to control and dictate monetary, fiscal and exchange rate policies and use it as an instrument to advance national prosperity. This means that fiscal policy loses its capacity to act as a counter cyclical instrument to maintain full employment (Solimano, 1999: 8). Governments consequently follow consistently austere fiscal policies, and often these are pro-cycle aimed at cutting fiscal spending or reducing taxes. Usually the reduction in rates of taxation are a precursor to cuts in fiscal expenditure. Consistent adherence to these policies, particularly during periods of recession, normally aggravates employment and income losses where fiscal support is absent. It appears that as a result of the reduced capacity of states to independently shape monetary and fiscal or even exchange rate policy within a highly interdependent global system, state economic policy has gradually moved to cultivate conditions in which national economic agents can largely exploit supply side
42
advantages. But the configuration of supply led interventions, have to be subsumed to the imperatives of demand led requirements and these in turn coexist within an interdependent global economy. Within such a system, new conditions have often resulted in traditional institutions no longer being sufficient to perform these functions. In a perverse way, globalization establishes conditions, which necessitate the reform and construction of new institutions and institutional practices.
The gist of our argument is that globalization, while eroding the traditional mandate of institutions in economic policy has increased the burden and responsibility of ancillary institutions to perform new and incremental functions and exercise a facilitative role to advance the competitive ability of nations. A number of effects flow from this situation, which we shall elaborate in more detail below.
Increased State Regulation of the Labour Market
Labour market regulation in particular is increasingly becoming a key feature of state intervention and increasing recognition has come to the fore for its integration with traditional macroeconomic interventions. This is especially true where state ownership had been deployed as an element of macroeconomic intervention. These interventions have over a period resulted in a decline of direct state participation in economic activities to one in which state regulation through a number of policy mechanisms is invoked to direct the conduct of economic activities. Hence, the period of state withdrawal had been characterized by a concerted attempt to privatize, either partially or wholly, state economic enterprises and state controlled utilities such as transport, energy and telecommunications. When it does occur, these are often the first to be earmarked in the privatization effort. In order to illuminate the attractiveness of such assets and secure the highest return on their sale, the milieu of public sector governance has had to demonstrate greater transparency, accountability and opportunity. Active measures were often sought to raise finance whereby the employees of such enterprises could acquire a small ownership stake in these. In the society generally, the state guarantees and oversees a spectrum of constitutional and ethical policies and objectives, in which electoral and broadly human rights mandates have come to dominate. The onus for these interventions have a range of sources, and multi-lateral institutions such as the World Bank, UNESCO and the ILO together with multi-lateral human rights and interest specific non-governmental organizations such as the International Red Cross and Red Crescent Societies, Green Peace etc. have configured objectives which are often inherited as the mandates for particular governments concerned with maintaining continuity in the reform of specific national policies.
Although largely framed in a non-partisan fashion, the stated beneficiaries of such policies include groups such as the youth, rural farmers, small-scale business entrepreneurs, potential women entrepreneurs as well as vulnerable segments of the rural and urban workforce. The pertinence for such measures have largely been invoked on the basis of considerations and sensitivity to issues of equity and inclusivity. Although these interventions can chiefly be characterized as being skewed towards the supply side, they are often directly linked to the demand side spin-offs, which are anticipated to emerge from them, especially with respect to the stronger labour market participation of the workforce and greater propensity for entrepreneurial activities such as enterprise development, new product development and adoption of competitive business practices.
In fact, supply side interventions have coexisted with a plethora of social policies, particularly in the OECD countries that are concerned to ameliorate the effects of the gradual paradigm and institutional restructuring that accompanies it. With respect to the labour market the new orientation has led to the postulation of a sharp distinction between passive and active labour market policies. Passive labour policies have historically and
43
until recently been associated with a relatively high degree of fiscal manoeuvre from a large number of governments that had inherited so-called social democratic institutions. In many instances these provide adequate support for income maintenance for the unemployed, particularly when it is required most urgently, usually in the aftermath of an economic recession. But limitations on an unmitigated fiscal expansion have mitigated passive measures being the sole policy instruments to guarantee increased labour market participation. Therefore active policies have been resurrected to greater prominence. Active labour market policies are designed to actively facilitate greater labour market participation under conditions in which the traditionally assumed character of core full-time formal employment no longer applies. The imperatives of global competition have been a central determinant in the plurality of the type of employment relations in which highly rigid formal relations now coexist with greater employment flexibility as is evidenced by a greater incidence of part-time work and as a corollary there now may be a greater incidence towards multiple job holding. These features of the new employment configuration appear to be more pervasive within the service sector economy but are also characterizing economies where formal sector employment has not kept abreast of the growth of new entrants to the labour market. Flexibility and part-time work under regimes of significant protective and regulatory conditions such as minimum wage legislation is still a feature that is uniquely characteristic of the highly developed industrial economies. These features are being gradually reproduced in the newly industrializing economies as well but there has as yet been no systemic fervor on the part of the states within these economies to regulate these aspects of employment relations.
It however does not mean that these newly developing and industrializing economies will not be required to adjust to the new labour market imperatives within their national economies within the foreseeable future. No single region has been spared having to confront these shifting circumstances and even in the less rapidly industrializing countries such as Latin America and the wholly agrarian economies of Sub-Saharan Africa and mainland Asia, the situation has necessitated institutional responses that have been tailored almost exclusively to interventions promoting active labour market policies not all of which have had positive outcomes. Fiscal restraints have inadvertently played a role in foreclosing a long-term association with passive labour market policies in the low and middle-income developing countries even though they are seen to operate in tandem in the developed world. The imperatives of showing tangible results from labour market policies, has meant that active policies have often been vigorously pursued, when it involves retraining, re-skilling and entrepreneurship development. Within these economies, the labour market has been characterized by a greater incidence of economic activities outside of the formal labour market. Active policies therefore have the unintended effect of developing into a partnership between the state and the target group that has been identified for labour market support. Whereas, the economies of the OECD have had to contend with flexibility within the formal labour market or as in the newly industrializing economies flexibility within a subcontracting economy these conditions have been largely absent in the developing countries. In fact, in these economies, usually after the limits of further agrarian expansion have been reached as well as a reduction in agricultural sector employment has occurred, flexibility has generally become informalized. Flexibility therefore exists with weak bonds between the informal and formal sectors. Strong bonds between economic agents in the formal and the informal sector arise only when they intentionally enter relations that subvert the controls of the formal sector (usually obtaining a service for a lower cost) and with it obligations laid down by the state.
44
Internal Labour Market Flexibility
In the newly industrializing economies for instance, flexibility appears to be a direct appendage and therefore largely dependent on contracts and orders for firms located in the formal economy. These firms are often in the competitive export sector and concerned to derive the economic benefits obtained from outsourcing and sub-contracting arrangements largely to compete with international firms which are not entirely devoted to a similar system of production organization. It is this feature, which provides firms with an ability to exploit a competitive advantage.
In the developing economies, the incidence of informality has not been associated with deriving a reduction in the operational costs for firms located in the formal sector since the symbiotic linkage between informal sector enterprises and formal sector enterprises are not as highly developed as they appear to be for the newly industrializing economies of South East Asia in particular. Informality in the developing economies has resulted in the imperatives of the labour market not being able to absorb new entrants sufficiently into employment (e.g. South Africa, Argentina, Brazil and many SSA countries exhibit some of these features). Consequently, labour supply within these economies, have largely outstripped demand. And while the capacity of these economies to generate new jobs have been torpid, they have also been susceptible to job losses from either unregulated competition or purposeful subcontracting by firms in the informal economy (e.g. Clothing Manufacture in South Africa). These shifts give the impression of competition for a market share in the domestic economy between formal and informal enterprises, often masking relations of association between them. In some of the medium income developing economies (South Africa in particular), informal clothing manufacturing has undermined the viability of established low technology clothing firms that focus on serving the low value end of the domestic market. Elsewhere, and this appears to be more pronounced in Sub-Saharan Africa, the cheap importation of second hand clothing from the industrialized countries has had a similar impact. Neither do such firms perform well on the export markets since they are often pitted against firms from newly industrializing countries, which embody higher factor productivities: newer technologies and cheaper labour costs.
Consequently this has set a number of labour market regulatory challenges in the sphere of labour market policy that are unique to the developmental stages and institutional requirements within each developing country setting. Although the array of developing country economies that are analyzed in this paper can be placed in different developmental clusters, there are imperatives, which are leading generally to a wider coherence and convergence in the policies that are being tailored for each specific economic region. These concern the protection and rights of employees, the degree to which employers comply with the standards and criteria upholding protection and rights and from the part of the state, the capacity to enforce these rights and standards. All of these concerns are the object of interventions framed by policy makers. There is a wide spectrum of variation in the enforceability of these labour standards, but the capacity in this sphere provides a barometer in the progress which labour market regulatory reform has been registered under conditions of globalization. Although these concern employment relations generally, state involvement in policies and strategies designed to advance skills development, entrepreneurial training and other supply side interventions have operated in tandem, often ameliorating and gradually eliminating the features that are more conflictual in nature.
Through the use of specific economic markers of the incidence and pervasiveness of globalization, a very detailed sketch has been provided concerning the interconnection between the economy and the operation of the labour market. Our observations suggest that while there is a wide degree of autonomy in the manner by which institutions adapt
45
and respond to these economic forces, a point is reached whereby the institutional configuration within particular national economies generates a counterfoil and a reactive dynamism to the direct and tangible effects that are witnessed and postulated by the process of globalization. These imperatives become a challenge to existing institutions, to harness a range of capacities embodied through economic agents, and particularly in the way these economic agents are connected institutionally through the labour market. Often an unspoken tripartite organizational form becomes the instrument through which new possibilities in governance and organizational systems are formulated and subsequently regulated. It has also emerged as the point of intersection at which the concerns of policy making can have a significant impact, especially when synchronicity in traditional macroeconomic policies begin to coincide with the more complex microeconomic policies that are demanded through active labour market interventions. It may even be apt to conceive this notion of synchronicity as embodying degrees of variation, becoming strong according to the different institutional capacities contained within developing country institutions. Here, it is useful to incorporate an institutional periodization into our analysis, in order to demonstrate how the economic imperatives of globalization give rise to converging institutional responses. A periodization implies differences in the magnitude of institutional adaptation but these are nonetheless directed at identifying and highlighting the challenges that are likely to be associated with each. Our argument debunks the notion that globalization represents an automatic reductive tendency towards the lowest common denominator wherein all semblance of institutional intervention directed to establish basic regulatory conditions and standards are futile and redundant. Our argument is the exact opposite.
Informality and the Need for Increased Institutional Capacity: SSA The relatively weak position of the private sector formal economy in Africa, implied that the gradual process of economic liberalization that began in the late 1980s and early 1990s created economic vulnerability within these economies. While the initial aims at economic liberalization was directed at the unshackling of markets from state control and to initiate a move toward balanced budget expenditure, it resulted in a trimming of the public sector wage bill and a reevaluation of specific social programmes (Ibhawoh, 1999). On their own terms, these measures were concerned to achieve policy changes and reforms that combined both “short-run stabilization measures and longer-run adjustment measures” (Van der Hoeven & Van der Geest, 1999: 9). In Africa the economic shocks that resulted from structural adjustment policies in particular, generated a high degree of social cost that resulted in a growing polarization towards the process. In particular countries in Africa, it contributed to the consolidation of political regimes that were more authoritarian. Ibhawoh argues that the structural adjustment policies that were advocated by the IMF and the World Bank limited the scope for ruling groups to deploy its traditional co-optive and clientelist form of political management. The failure of the ruling groups to sustain existing patterns of coalitions, patronage relations and sectional claims resulted in political rule becoming infused with repressive measures (Ibhawoh, 1999: 161). It generally blunted popular enthusiasm for the process: often culminating in systemic popular resistance. Repressive measures were usually deployed to contain this process and political dictatorships were often established after resistance had been momentarily contained (e.g. Nigeria). Although the majority of countries in Asia and Latin America are outside the political system indicated for a large number of African countries in particular, there are some, which exhibit similar features. One can argue that the new economic imperatives that were imposed on fragile political systems initially, established conditions where state structures and repressive capacities became disorganized, despite conveying a
46
rhetoric of support for progressive labour legislation as is witnessed by the number of signatory countries to ILO labour conventions.
The gradual dissolution in the regulatory capacity of the state within the countries of SSA, was an inducement for various economic agents to conduct economic activities outside the purview of state control. A strong motive for this was an avoidance of the various forms of revenue collection by the state, particularly through income and sales. Another was the relative absence of information collection to carry out the functions of state organization: census and household data within such state systems are relatively minimal. All economic classes invested minimal obligations to the system for what could be obtained in return. Essentially, the space to do so gave license for economic activities to be arranged through informal mechanisms. In Africa, the systematic growth of informality attests to a weakening of economic organization within the formal sector of the domestic economy (except within foreign controlled organizations) both within the private and public spheres of this sector. In largely agrarian economies, state employment has overshadowed private sector formal employment. State employment has served largely as the vehicle of formal sector employment. But while resorting to informality in the short and medium terms, especially during periods of monetary crisis when problems in securing an adequate livelihood for the populace becomes noticeable, in the long term informality leads to a gradual undermining of the economic and social stability of centralized states. It is particularly pertinent where strong states are required to bridge the geographical, ethnic, language and economic tensions of diverse societies that have been constituted through colonial histories (e.g. Congo, Somalia, Sierra Leone). Our argument is that where the informal sector crowds out the formal sector and where successful informal economic activities display resistance at being incorporated and transformed into some degree of formality, merely because of remuneration costs to enterprises, it becomes an obstacle to economic expansion. Outside SSA, informality has been constituted as a structural offshoot of formal economic activity.
Informality and the Disorganization of the State and Society
Risk-taking within informal sector economies, generally tend to be associated with risks against starvation and less with risks calculated to increase the size of the enterprise and generate larger profits. Harnessing the productivity gains that stem from improvements in the division and specialization of labour normally implies a shift from purely household production and small-scale production units towards more intensive and large scale production units. The former is concerned with creating a surplus to replicate the activity of the cycle, while the latter is concerned with accelerating profit growth and growth in the size of the enterprise. Informal economic units are not proficient at producing cheap mass-produced goods for a mass consumer market, unless the goods embody aspects of skill that machinery is not equipped to replicate adequately (e.g. craft activities such as wood-making and basket-making). Within informal sector economies a strong tension exists between trade and exchange on the one hand and autarchy on the other. In many of the economies of SSA, and indeed, this is the situation that regimes with a modernizing agenda have had to confront, globalization occurred under conditions whereby participation in international markets was becoming more difficult as the terms of trade and foreign debt shifted in favour of the developed economies. Systems of autarchy could proliferate because it did not presume a highly developed and complex state capacity: merely one that was an organ to protect the population against internal and foreign aggression and to ensure that new recruits would be adequately trained to man the state bureaucracy. Therefore, where economic systems are trapped into informal relations that are not able to progress and transform towards greater formality, and insertion into the
47
regulatory regime of the state, it ultimately means that the system is caught within static informality. Such a situation contributes to the dislocation and disorganization of the functions and activities that are performed by the state.
A characteristic trend of the labour market in Sub-Saharan Africa is the wide dispersion that exists between the number of people entering the labour force and the number of jobs being created in the overall economy. A noticeable feature of this process is the inadequate number of jobs that are created in the formal sector. Out of necessity, the informal sector therefore had to serve as the principal vehicle in the creation of new jobs. The number of jobs thus created, have been insufficient to provide adequate livelihoods to incumbents in those positions. In the long term such jobs have therefore been difficult to sustain. Many of those depending on such positions have really been inserted into survivalist economic activities. Ultimately, the causes for this occurrence, is as a result of structural demographic features of the labour market whereby the labour force generally grows at a faster pace than the formal sector is able to absorb through the provision of new jobs and much has been alluded to it already in the above sections of the paper. Consequently new entrants to the labour market are incorporated into informal employment. It has led in most cases to an increased informalization of the economy and the relative absence of institutional mechanisms in the form of effective social nets. This has meant that in the absence of the economy being able to create new jobs, there are no other institutional mechanisms by which this problem of growing unemployment and growing informalization can be adequately addressed (Van der Geest & van der Hoeven, 1999). The formal economy for instance has not been able to compensate for the decline of public sector employment, which the privatization of public sector enterprises had contributed towards. Compounding this further as Van der Geest and Van der Hoeven point out, the institutions of labour supply particularly those represented through the education and training institutions appear to exhibit a relatively weak capacity at supplying graduates with the appropriate skills for the labour market. Often too, universal access to primary schooling does not take place adequately and support mechanisms for secondary education are geographically skewed towards the urban sector. Post-secondary education systems tend to adhere to curricula offerings that often mirror the early post-colonial period in which training in engineering and trade occupations in particular was disparaged in favour of training for occupations within the state bureaucracy. There does not appear to be an effective enterprise driven lobby that is able to shift the orientation of educational delivery towards labour needs that are driven by the demands of the economy. Therefore largely because the precise configuration of institutions that would attenuate the adverse effects of dis-employment on the labour market did not exist, has compounded the cycle of employment breakdown, falling wages and deteriorating working conditions resulting from the sharp inclination to informal sector employment and the relative shrinkage of the formal sector.
Formal sector employees within these economies however obtain premia on wages and employment conditions relative to those employees located in the informal sector. However precarious, these premia become progressively skewed towards employees in the highly skilled occupations. Workers in these employment categories have a greater scope of migrating to economies that have a higher propensity of maintaining premium wages on skills that are in high demand. Essentially this serves as a pull-factor for skilled labour migration towards such economies. Such alternatives can become decisive when attempts are made to legislate limitations on the wage premia obtained within the domestic economies where informality is pervasive. Though not unique, the labour migration of professionals from countries in SSA including South Africa, have followed this trajectory. However, this was mainly towards the OECD countries and to the liberal gulf states of the
48
Middle East, which have vigorously recruited skilled staff by offering internationally competitive salary compensations.
The Lean Social Democracies: Eastern Europe, India, South Africa, Latin America Stemming from previous research conducted on the characterization of the South African labour market in a globalizing world as an example of a lean social democracy (Bhorat, Lundall and Rospabe, 2002), we extend the notion of lean social democracies to include a larger circle of national economies. It is contended that a large number of developing economies, some of which have been historically under the mantle of repressive political regimes, have embarked through systemic processes of reform towards regimes that embodied a wider spectrum of constitutional governance. One should recognize that these repressive regimes often had a strong penal code in which judicial pronouncements concerning the existing statutes were derived with some apparent autonomy to the contemporary agents wielding political power. Repression was supported through effective jurisprudential explanations of the law and whether these pronouncements were formulated in South Africa, the Soviet Union, Brazil or Chile certain rights making provision for social security, unemployment compensation, industrial accident insurance etc were accorded to specific segments of the workforce. In South Africa, the process was inscribed with racial exclusion: black workers had no identity as workers but white workers did. Coloured and Asian workers had an identity but this was tied to differential rights. The changes to these designations were relatively slow and it was only in the mid-1980s, more than a decade before political rights were universally accorded to the population, that the system of industrial relations in South Africa was de-racialized. Compensation schemes in South Africa generally did not set strenuous limitations on the working of overtime, and neither was the regulation of working hours standardized to conform to ILO Conventions. However, an effective adherence to the remuneration and compensation for overtime working was provided. In many instances therefore, particularly in the Latin American countries and in South Africa, despite the rights that were universally and differentially accorded, labour law itself was regulated with a high degree of formality and protocol. Perhaps the same designation holds for the Soviet Union, although it must be noted that as a state controlled economy, economic incentive systems operated differently. There were biases in the judgment of the courts, as it indeed was the case under similar repressive regimes, but the biases were derived on the basis of legal precedents. New precedents that unsettled old judgments were also common and this encouraged the oppressed population to use the courts under certain circumstances to limit an unmitigated abuse of state power. These were temporary measures, which often embroiled the state in time-consuming litigation.
However once the repressive regimes began to reform and dismantle features of the repressive state apparatus, many features of the statutory system that embodied and defended particular rights, particularly those rights that facilitated a more balanced participation between employers and employees were extended. In the Latin American countries as well as in South Africa, the labour sympathetic rights that were inherited from previous regimes were generally not abolished. In fact where these rights had only an exclusive coverage they generally became applicable to a wider spectrum of recipients. Under some of the post-repressive and democratic regimes, which were subsequently installed, these rights became universally applicable. In South Africa for instance after the election of a democratic regime, there was a rapid process to adopt the 40 hour working week as a universal standard (See Lundall, 2002). The parliamentary dispensations that emerged with the demise of the overall grouping of post-repression societies, was
49
relatively active at embracing the notion of the new constitutional democracies which they had effectively become and proceeded to rapidly redesign the statutory system by introducing and promulgating new legislation which expressed the constitutionality that they were attempting to construct. Such regimes are often seduced by the rhetoric and symbolism of the new legal architecture and as a result of limited economic resources to co-opt supporting constituents are compelled to resort to a provision of rights which these constituent groups can use to harness economic resources. These regimes essentially cultivate a system of rights but it abrogates the responsibility of the state to provide a universal system of social security support. While not all the constitutional regimes in the developing world have roots in repressive dispensations, many of these tend to have a relatively large population and these traverse a range of geographical, ethnic and language differences. In the case of India, Brazil and Russia, a large number of autonomous federal states or republics are incorporated into its wider geographical boundaries (For India see Bhattacherjee, 2002) The burden for social security is therefore shifted almost wholly from the state authorities to the parties of an industrial agreement, namely at the level of the firm. Social security therefore becomes a temporal right that generates a defined benefit for a specific time period. Its size and duration is furthermore determined by the length of time an employee was engaged in full-time employment.
The Enterprises as the bastion of Social Security Support
Drawing on evidence from Latin America, Domeland and Gill (2002) observed that in all three of Argentina, Brazil and Chile there was an attempt in the 1990s, to strengthen the enforcement of institutions, particularly within firms, to meet severance payments. Since most Latin American countries have relatively poor or non-existent social security systems, protection for workers as a result of income losses caused through dismissals or unemployment is provided through severance payments. Failure as well as the incorrect registration of employees by employers would result in increased fines for employers. In 1991, the Chilean government increased the resources available to its enforcement inspectorate, streamlined the legislation and also embarked upon mass media campaigns to highlight the new legislation. Since 1998 the same process has been underway in Brazil with increased penalties for non-compliance (Domeland and Gill, 2002: 12). In addition to severance payment provisions, workers in Latin America can make use of compensation funds, which are individualized funds to which workers can regularly transfer part of their salaries. In the event of being unemployed they can draw from these compensation funds. Partial withdrawals from the funds can be made for housing, education or health expenses (Domeland and Gill, 2002: 18). In Brazil, the Fundo de Garantia do Tempo de Servico, (FGTS) which was created during the period of military dictatorship, while it provides a compensation fund for each worker, equivalent to a monthly contribution of 8 per cent of the salary, makes provision for a penalty on employers who dismiss workers unfairly equivalent to 10 per cent of the balance in the compensation fund (FGTS) of the particular worker at the time of dismissal. In 1988 this fine was increased to 40 per cent of the FGTS. It is therefore quite clear that the onus of social security in Brazil is transferred as an obligation from the state to workers with provision for sanctions on employers for cases of unfair dismissal.
Cox Edwards argues that labour legislation in Latin American countries has historically had a long association with protecting job security. “Typical measures include severe limitations on temporary hiring and the imposition of substantial costs – in the form of severance payments – on dismissals” (Cox Edwards, 1997: 137). Despite this fact, labour turnover in Brazil has been higher than that recorded in OECD countries generally. In 1989, 39.66 percent of jobs in legally registered firms changed hands within the year. A
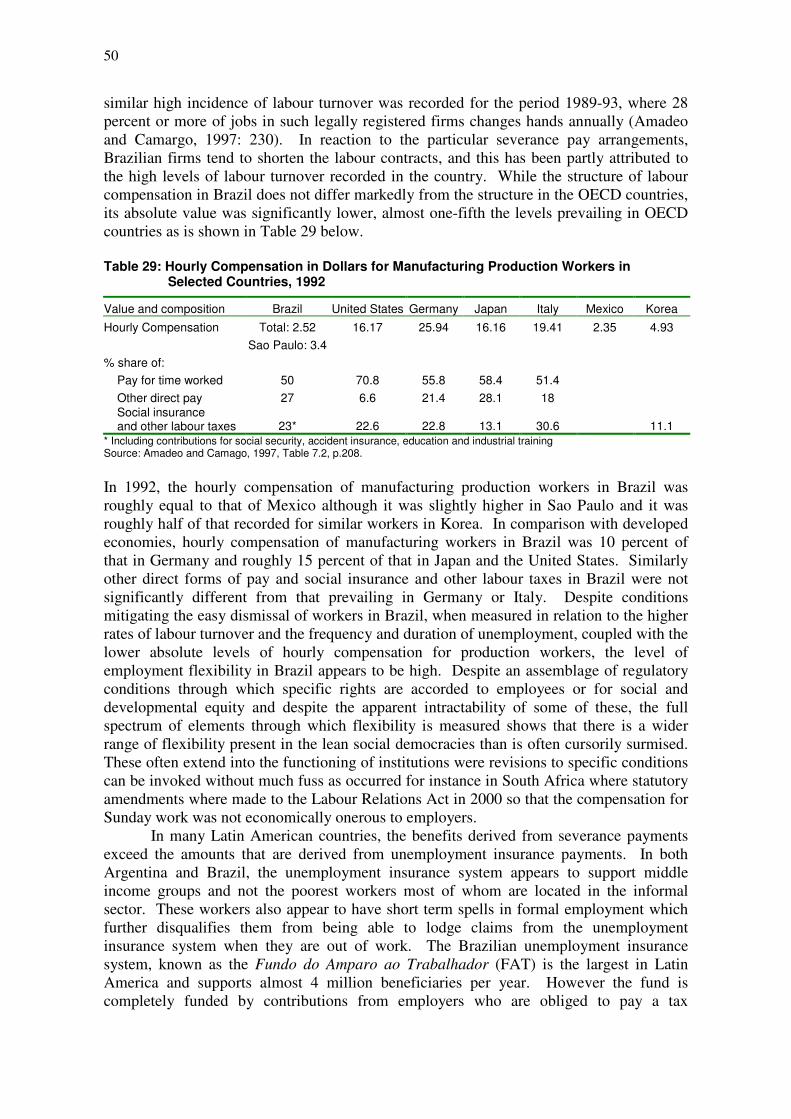
50
similar high incidence of labour turnover was recorded for the period 1989-93, where 28 percent or more of jobs in such legally registered firms changes hands annually (Amadeo and Camargo, 1997: 230). In reaction to the particular severance pay arrangements, Brazilian firms tend to shorten the labour contracts, and this has been partly attributed to the high levels of labour turnover recorded in the country. While the structure of labour compensation in Brazil does not differ markedly from the structure in the OECD countries, its absolute value was significantly lower, almost one-fifth the levels prevailing in OECD countries as is shown in Table 29 below.
Table 29: Hourly Compensation in Dollars for Manufacturing Production Workers in
Selected Countries, 1992
Value and composition Brazil United States Germany Japan Italy Mexico Korea Hourly Compensation Total: 2.52 16.17 25.94 16.16 19.41 2.35 4.93 Sao Paulo: 3.4 % share of: Pay for time worked 50 70.8 55.8 58.4 51.4 Other direct pay 27 6.6 21.4 28.1 18 Social insurance and other labour taxes 23* 22.6 22.8 13.1 30.6 11.1 * Including contributions for social security, accident insurance, education and industrial training Source: Amadeo and Camago, 1997, Table 7.2, p.208.
In 1992, the hourly compensation of manufacturing production workers in Brazil was roughly equal to that of Mexico although it was slightly higher in Sao Paulo and it was roughly half of that recorded for similar workers in Korea. In comparison with developed economies, hourly compensation of manufacturing workers in Brazil was 10 percent of that in Germany and roughly 15 percent of that in Japan and the United States. Similarly other direct forms of pay and social insurance and other labour taxes in Brazil were not significantly different from that prevailing in Germany or Italy. Despite conditions mitigating the easy dismissal of workers in Brazil, when measured in relation to the higher rates of labour turnover and the frequency and duration of unemployment, coupled with the lower absolute levels of hourly compensation for production workers, the level of employment flexibility in Brazil appears to be high. Despite an assemblage of regulatory conditions through which specific rights are accorded to employees or for social and developmental equity and despite the apparent intractability of some of these, the full spectrum of elements through which flexibility is measured shows that there is a wider range of flexibility present in the lean social democracies than is often cursorily surmised. These often extend into the functioning of institutions were revisions to specific conditions can be invoked without much fuss as occurred for instance in South Africa where statutory amendments where made to the Labour Relations Act in 2000 so that the compensation for Sunday work was not economically onerous to employers.
In many Latin American countries, the benefits derived from severance payments exceed the amounts that are derived from unemployment insurance payments. In both Argentina and Brazil, the unemployment insurance system appears to support middle income groups and not the poorest workers most of whom are located in the informal sector. These workers also appear to have short term spells in formal employment which further disqualifies them from being able to lodge claims from the unemployment insurance system when they are out of work. The Brazilian unemployment insurance system, known as the Fundo do Amparo ao Trabalhador (FAT) is the largest in Latin America and supports almost 4 million beneficiaries per year. However the fund is completely funded by contributions from employers who are obliged to pay a tax
51
equivalent to 0.65 per cent of total sales to FAT. But the duration over which a benefit can be derived is limited and ranges from three to five months and the rate of the benefit ranges from the weekly wage to double the weekly wage. Only workers with a formal contract who have been laid off by their employers are eligible for benefits. However, a worker must have worked for at least six months during the last three years to receive the minimum benefit and after having received the full benefits, the worker is not eligible to receive additional benefits for another 16 months (Domeland and Gill, 2002: 24). The unemployment insurance system in South Africa operates under similar principles. Employer contributions to the Unemployment Insurance Fund (UIF) have been supported historically by regular contributions from the government but these were at a significantly lower level. However over time this contribution from the government has declined and is only applied with parliamentary approval to maintain the liquidity of the fund, especially in periods of severe unemployment. In order to maintain the principle of equity, all employees in South Africa are required to pay monthly contributions to the Unemployment Insurance Fund equivalent to just over 1 per cent of gross salary. This is matched by an equivalent contribution by the employer. However, workers earning beyond a particular ceiling only make contributions up to a particular ceiling and conversely in the event of becoming unemployed would only obtain benefits corresponding to the payment ceiling. This means that even very high wage earners are obliged to pay contributions to the Unemployment Insurance Fund, matched by the contributions of the employer. This limitation indicates that the Unemployment Insurance Fund serves very indirectly as a mechanism to redistribute benefits from high-income earners whose skills attributes provide some protection against falling into unemployment. In any event, the relatively low benefits that such high income earners can claim in the event of being unemployed are likely to be much lower than they could secure through private insurance schemes and so the hassle of lodging claims to the state managed UIF fund would be a disincentive because the claims would have low payouts. To some extent therefore the Unemployment Insurance Fund in South Africa serves as a re-distributive tax from high earning employees to low earning employees and while the state has been exonerated of the burden to finance the scheme, it serves to regulate and enforce compliance to the new conditions and regulations. The justification for this stance in the sphere of social policy is on the basis of rights it invokes through the principles of equity. Although the actual amount of the contributions borne by all employees is relatively negligible, the arrangement enables a wider public constituency to be mobilized to provide financial sustenance to interventions that may broadly carry the appellation of being social democratic. This is because those without the means are targeted as the sole recipients of unemployment support and this is only made possible through the conscious regulation and intervention of the state. Ultimately the state shifts the burden of unemployment maintenance onto employers and employees and regulates the collection and disbursement of the particular benefits.
Walter Connor (1996: 165) suggests that the process of democratisation that was experience in Russia during the early 1990s may be characterized as a shift from a corporatist authoritarian regime to a relatively more democratic corporatist regime. Similar transitions of regimes occurred in Brazil and Spain and this was largely engineered through the elites in the society being able to engineer pacts to affect the transition towards democracy, thus avoiding a political collapse. In Russia old institutions were resurrected to pursue the agenda of a transition, but most of these institutions were ill-equipped to manage the new mandates and challenges of a transitional society moving towards the institutionalization of democracy. In Russia therefore the attempts of the transition were characterized by a semblance of institutional collapse and disorganization.
52
Nonetheless the ingredients of a lean social democracy in the instances recorded occur where there is an attempt to retain the principles in the system of social security under new forms of social accountability. However with the added pressures for the sustainability of the support mechanisms to operate such a system new debates and dialogues usually rages for its reform. The tendency towards becoming a lean social democracy appears to be a hallmark of middle income developing countries and societies that have made significant investments in developing relatively more democratic constitutional dispensations yet are constrained to provide universal forms of social security because it would put the burden of financing it on a comparative narrower band of middle and high income earners. Faced with usual cohort of multiple demands for fiscal support, the tendency is for most of these governments to instead invest in programmes that enhance human capital acquisition and skills development programmes are increasingly becoming more prominent. These commitments are also in line with policies aimed at maintaining active labour market interventions.
Another reason, perhaps, can be cited to explain this shift in obligation away from the state, as the traditional guarantor of life long employment provision. In many Latin American countries there has been an incremental growth in the rates of unemployment. However, what is even more significant has been the rapid growth in the informal sector. Informality had increased in every Latin American country by the 1990s with estimates showing that 80 out of 100 new jobs were created in the informal sector (Domeland and Gill, 2002: 2). Similar processes are underway in South Africa (Fakude, 2000), Russia and India (Bhattacherjee, 2002) in particular. One of the perverse and unintended effects of the growth in informality is that its significant size gives the state a legitimate exit from upholding the automatic right to providing posts in state institutions and government bodies to specific cohorts of new labour market entrants. This principle of entitlement had been tacitly cultivated in the post-colonial period where university graduates in particular were absorbed into the state bureaucracy. Under the lean social democracies, this notion is jettisoned for demand led selections.
Flexibility and subcontracting coupled with widening access to democratic institutions: the NICs Unlike the lean social democracies that experienced the two-fold shedding of repressive forms of social organization and the gradual erosion of a pervasive system of social security, the South East Asian economies, particularly those that came to be referred to as the East Asian tigers were characterized by repressive organizational forms maintained by regimes that were overwhelmingly military juntas or repressive one party nationalist regimes. These regimes also perpetuated weak and in many instances virtually ineffective social security mechanisms. Social security was essentially provided in the form of rapid economic growth. In most instances the continuation of extended family networks provided additional supports to social security. The rapid industrialization that characterized these national economies meant that shocks in migration and urbanization patterns within a predominantly agrarian social structure (see Table 11 above) tended to result in unemployment levels being gradually absorbed by a growing economy. The fact that vanguard newly industrializing economies (Taiwan, South Korea, Hong Kong and Singapore) were recipients of relatively large FDI flows from the USA, Japan and Britain coupled with a high internal rate of savings was an added stimulus to the rapid process of industrialization. The successes in the processes of economic growth however were among the major factors contributing to changes in the system of industrial relations and the regulation of the labour market within these economies. The successes led to occupational shifts in which a burgeoning knowledge workforce gradually came to
53
symbolize middle class and democratic aspirations within these specific societies. It appears that the principle factors for this impetus was largely exogenous and exerted an effect on the labour market of the larger of these economies (i.e. South Korea and Taiwan) at roughly the same time. These exogenous forces unleashed internal social pressures that have played an important role over the recent period.
The late 1980s (approximately 1987) was a crucial turning point in political liberalization in both South Korea and Taiwan. This period witnessed rapid expansion in the manufacturing and tertiary sector in South Korea and a labour market that became conducive for the expansion and growth of trade unions (Deery and Mitchell, 1993: 14). In South Korea this led to the gradual amendment of the country’s labour laws. These reforms triggered a wave of activity in the formation of new trade unions and also witnessed a period of unprecedented industrial action. The economic successes in the industrialization process in South Korea began to open it up to lobbying activity from labour groups in trade partner countries for the inclusion of labour standards as a condition for participation in trade related international forums. Membership to the ILO was granted to South Korea in 1991 and this gave internal labour groups a vehicle to highlight the violation of labour rights and the principles of freedom of association. It served as an initial impetus for reform because the ILO recommended that the country’s labour laws be revised in line with the ILO’s principles of freedom of association (Park and Park, 2000: 84). A similar process of exogenous pressure was invoked in 1996 when South Korea joined the Organization of Economic Co-operation and Development (OECD). In response to objections raised by some member countries against its admission because of the nature of its labour laws, a Presidential Commission on Industrial Relations Reform was established to recommend reforms of South Korea’s labour laws. The reforms set in motion a more participative industrial relations system, which Park and Park (2000: 83) have labelled ‘neo-corporatist’ that meets the requirements of expanding high tech ‘knowledge intensive’ industries which is dependent on a highly educated workforce (Bamber & Ross: 2000: 10). The process of progressing along a ‘knowledge intensive’ industrialization path has had a similar impact on the regulatory shifts in the industrial relations system of Taiwan. In both South Korea and Taiwan, liberalization and democratisation of the regulatory framework of industrial relations has been accelerated by the successes of globalization internally.
Economic Growth, Democratisation and Sub-contracting
Political reforms in Taiwan enabled economic access to be gained to new markets and this in itself generated additional pressures for reform and change. Similar processes will eventually come to the fore in the People’s Republic of China especially when it becomes a significant investor in foreign markets itself, and this would mirror a similar trajectory to that of South Korea and Taiwan. In the 1980s, Taiwan had built up a massive trade surplus with the United States. Unionists and employer groups viewed this as a consequence of low labour standards in Taiwan and therefore bilateral trade meant that Taiwanese and American workers competed unequally in the US market. These lobby groups sought to restrict access of Taiwanese exports to the US market. The pressure led to the Taiwanese government promulgating several changes to its repressive labour legislation and the most important of these was the Fair Labour Standards Law (FLSL) of 1984. Internally the process of democratisation led to a systematic gravitation toward parliamentary and electoral politics and meant that government policies had become more receptive to the demands of the electorate. During the 1990s several pieces of social welfare legislation was promulgated in Taiwan. In 1994 the Health Insurance Act was passed and in 1998 the FLSL was extended to cover workers in all industries. Furthermore
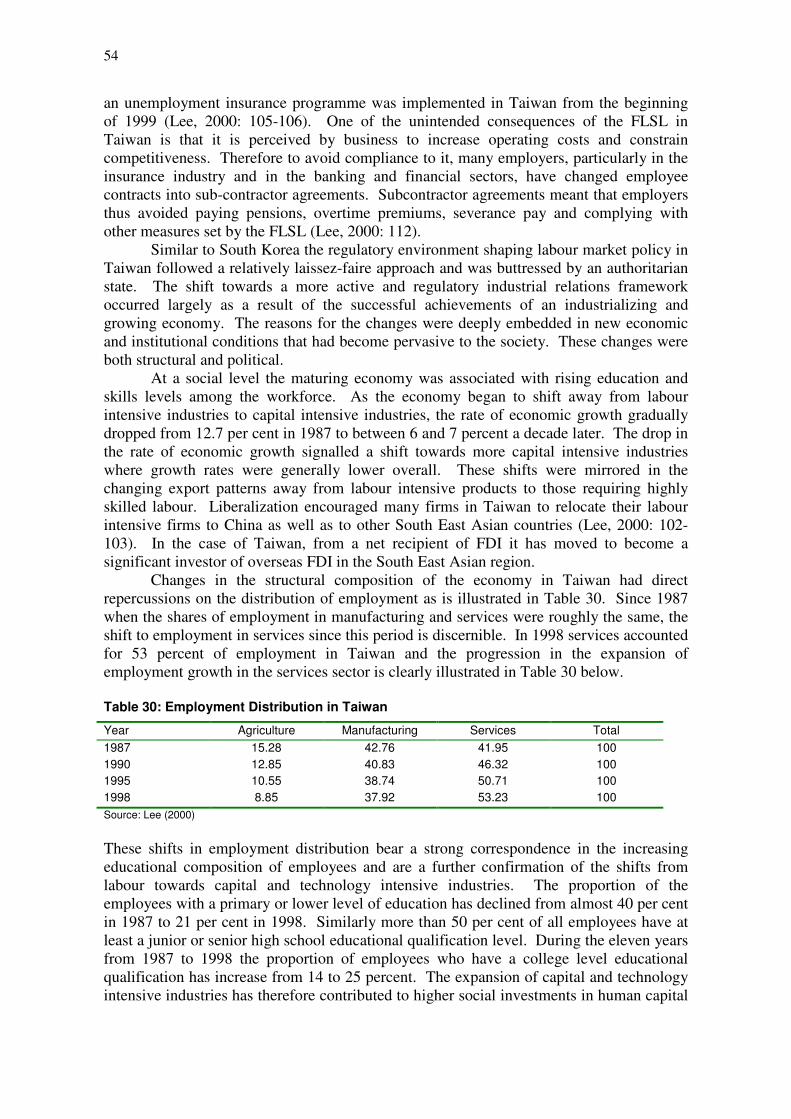
54
an unemployment insurance programme was implemented in Taiwan from the beginning of 1999 (Lee, 2000: 105-106). One of the unintended consequences of the FLSL in Taiwan is that it is perceived by business to increase operating costs and constrain competitiveness. Therefore to avoid compliance to it, many employers, particularly in the insurance industry and in the banking and financial sectors, have changed employee contracts into sub-contractor agreements. Subcontractor agreements meant that employers thus avoided paying pensions, overtime premiums, severance pay and complying with other measures set by the FLSL (Lee, 2000: 112).
Similar to South Korea the regulatory environment shaping labour market policy in Taiwan followed a relatively laissez-faire approach and was buttressed by an authoritarian state. The shift towards a more active and regulatory industrial relations framework occurred largely as a result of the successful achievements of an industrializing and growing economy. The reasons for the changes were deeply embedded in new economic and institutional conditions that had become pervasive to the society. These changes were both structural and political.
At a social level the maturing economy was associated with rising education and skills levels among the workforce. As the economy began to shift away from labour intensive industries to capital intensive industries, the rate of economic growth gradually dropped from 12.7 per cent in 1987 to between 6 and 7 percent a decade later. The drop in the rate of economic growth signalled a shift towards more capital intensive industries where growth rates were generally lower overall. These shifts were mirrored in the changing export patterns away from labour intensive products to those requiring highly skilled labour. Liberalization encouraged many firms in Taiwan to relocate their labour intensive firms to China as well as to other South East Asian countries (Lee, 2000: 102-103). In the case of Taiwan, from a net recipient of FDI it has moved to become a significant investor of overseas FDI in the South East Asian region.
Changes in the structural composition of the economy in Taiwan had direct repercussions on the distribution of employment as is illustrated in Table 30. Since 1987 when the shares of employment in manufacturing and services were roughly the same, the shift to employment in services since this period is discernible. In 1998 services accounted for 53 percent of employment in Taiwan and the progression in the expansion of employment growth in the services sector is clearly illustrated in Table 30 below. Table 30: Employment Distribution in Taiwan
Year Agriculture Manufacturing Services Total 1987 15.28 42.76 41.95 100 1990 12.85 40.83 46.32 100 1995 10.55 38.74 50.71 100 1998 8.85 37.92 53.23 100 Source: Lee (2000)
These shifts in employment distribution bear a strong correspondence in the increasing educational composition of employees and are a further confirmation of the shifts from labour towards capital and technology intensive industries. The proportion of the employees with a primary or lower level of education has declined from almost 40 per cent in 1987 to 21 per cent in 1998. Similarly more than 50 per cent of all employees have at least a junior or senior high school educational qualification level. During the eleven years from 1987 to 1998 the proportion of employees who have a college level educational qualification has increase from 14 to 25 percent. The expansion of capital and technology intensive industries has therefore contributed to higher social investments in human capital
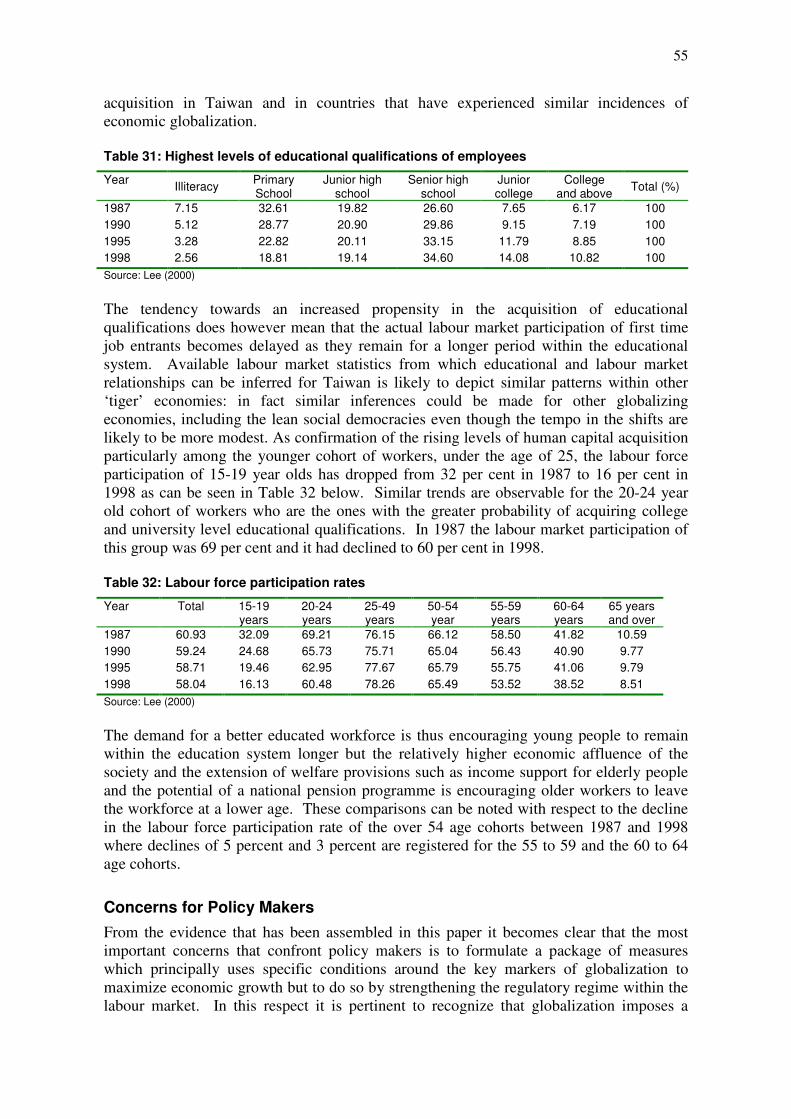
55
acquisition in Taiwan and in countries that have experienced similar incidences of economic globalization. Table 31: Highest levels of educational qualifications of employees
Year Illiteracy Primary School
Junior high school
Senior high school
Junior college
College and above Total (%)
1987 7.15 32.61 19.82 26.60 7.65 6.17 100 1990 5.12 28.77 20.90 29.86 9.15 7.19 100 1995 3.28 22.82 20.11 33.15 11.79 8.85 100 1998 2.56 18.81 19.14 34.60 14.08 10.82 100 Source: Lee (2000)
The tendency towards an increased propensity in the acquisition of educational qualifications does however mean that the actual labour market participation of first time job entrants becomes delayed as they remain for a longer period within the educational system. Available labour market statistics from which educational and labour market relationships can be inferred for Taiwan is likely to depict similar patterns within other ‘tiger’ economies: in fact similar inferences could be made for other globalizing economies, including the lean social democracies even though the tempo in the shifts are likely to be more modest. As confirmation of the rising levels of human capital acquisition particularly among the younger cohort of workers, under the age of 25, the labour force participation of 15-19 year olds has dropped from 32 per cent in 1987 to 16 per cent in 1998 as can be seen in Table 32 below. Similar trends are observable for the 20-24 year old cohort of workers who are the ones with the greater probability of acquiring college and university level educational qualifications. In 1987 the labour market participation of this group was 69 per cent and it had declined to 60 per cent in 1998. Table 32: Labour force participation rates
Year Total 15-19 years
20-24 years
25-49 years
50-54 year
55-59 years
60-64 years
65 years and over
1987 60.93 32.09 69.21 76.15 66.12 58.50 41.82 10.59 1990 59.24 24.68 65.73 75.71 65.04 56.43 40.90 9.77 1995 58.71 19.46 62.95 77.67 65.79 55.75 41.06 9.79 1998 58.04 16.13 60.48 78.26 65.49 53.52 38.52 8.51 Source: Lee (2000)
The demand for a better educated workforce is thus encouraging young people to remain within the education system longer but the relatively higher economic affluence of the society and the extension of welfare provisions such as income support for elderly people and the potential of a national pension programme is encouraging older workers to leave the workforce at a lower age. These comparisons can be noted with respect to the decline in the labour force participation rate of the over 54 age cohorts between 1987 and 1998 where declines of 5 percent and 3 percent are registered for the 55 to 59 and the 60 to 64 age cohorts.
Concerns for Policy Makers From the evidence that has been assembled in this paper it becomes clear that the most important concerns that confront policy makers is to formulate a package of measures which principally uses specific conditions around the key markers of globalization to maximize economic growth but to do so by strengthening the regulatory regime within the labour market. In this respect it is pertinent to recognize that globalization imposes a
56
different set of demands on the labour market regime and often the institutions that prevailed in a less globalized dispensation, are inadequately equipped to cope with these new global imperatives. The institutional reforms required under a more global dispensation, needs to be grounded within specific national economic contexts. It is ideal for the institutions that are formed out of the process, to be located within effective and democratic forms of representation.
The momentum of change spearheaded by lead economies within specific regions ought to be used to shift less dynamic economies along the same trajectory. Measures to facilitate and increase cross border trade between developing countries often leads to a strengthening of regional collaboration and integration and trade liberalization is usually an initial outcome of the process between developing economies. The competition for increased capital flows, mostly from the developed countries, but in the case of China a large bulk of this is obtained from Taiwan, impose further demands on the reform of the capital markets within the developing world. For instance, reforms that have gained momentum due to shifts in tariff liberalization can enhance the attractiveness of FDI within domestic markets of developing country economies.
The general and specific comparative country evidence which this paper has advanced, is that despite the regional variation in the experience of globalization, the morbid race to the bottom which many anti-globalizers argue is the case, does not occur in the long term. The process of economic globalization is certainly marked by adjustments and shocks which have concerns for policy makers in terms of the types of interventions that are necessary to mitigate the negative and deleterious short term effects of the process. Again taking account of the regional variation in the process of globalization has enabled us to give a more adequate specification of the likely employment relations and social safety nets that are more likely to become entrenched within particular regions. These regional variations are directly associated with structural changes that have occurred within domestic economies. The effects of these economic markers reverberated directly within the domestic economies of developing countries. Where the markers of globalization and in particular the advances brought through technological change have coincided and been matched by adjustments to political freedom, institutions generally are placed at an advantage to meeting the challenges of globalization. The technological influence appears to exert a fundamental influence as a catalyst to these changes. Even in SSA where poverty and competition for scarce resources remains a severe constraint to the maintenance of social cohesion the shift toward more transparent and democratic forms of organizing economic activities appears to be definitely taking root. Globally, the process of democratisation, has in itself has been the outcome of an array of institutional configurations whereby actions associated with the hegemony of specific interest blocks (the military, the party or the ‘volk’) have been challenged by an emerging vibrant constitutionality within which democratic practices have begun to be established. It has meant that a wider spectrum of interests have been accommodated within the purview of existing institutions. The obligation towards managing the process of globalization has definitely moved from traditional interests towards institutions capable of incorporating plurality. The quest and the social momentum towards democracy ironically has had it most strenuous renewal in a world that hesitantly started to embrace globalization rhetorically while responding to it economically as an imperative of economic common sense.
Globalization itself has concentrated attention on the beneficial effects of economic management, which covers both the macroeconomic and the microeconomic dimension of the labour market. Appropriate policy interventions in the labour market can mitigate the effects of short-terms shocks such as capital flight, unemployment and skills migration.
57
But globalization creates the setting for measures that can enhance the welfare of citizens in every country where the process has already started. Since globalization in itself unleashes reforms to the system of economic management on a global scale, the policies that are aligned to correspond with these shifts ought to provide conditions within which historically dis-empowered or vulnerable groups are given the space and support mechanisms to benefit from and become winners. With the appropriate policies and programmes in place, short-term adjustments can be reconfigured so that even the losers are equipped to be winners. At a programmatic level, the increased emphasis that is being placed on active labour market policies to increase labour market performance and participation and to reduce the effects of poverty is in the correct direction. Multilateral and national institutions are beginning to take the lead in this direction. Mechanisms of specifying the correct mix of active labour market interventions for specific countries now requires to be periodically evaluated and interrogated. These specifications have to be evaluated with respect to the broader macroeconomic (e.g. tariff liberalization) and microeconomic environments (e.g. technological changes) as well as in relation to changes in employment structures within developing countries.
Perhaps the most significant challenge that globalization poses across regions and within specific country contexts are whether prevailing institutions represent the most appropriate configuration for assisting in managing regional and national developmental interests in a global world. The challenge is to interrogate the issue before crises compel either systemic paralysis (e.g. Argentina, and many other developing countries in SSA) or dictates an automatic adjustment over which national and regional agencies abdicate control to an indeterminate outcome. In the last resort, the challenge is to generate interventions so that the necessary institutional responsiveness can be registered sooner. Lethargy, inactivity and capitulation reinforces the notion that globalization offers no alternative but a race to the bottom.
7. Conclusion
The impact of the combination of the five markers that have been used to characterize economic globalization enables us to pinpoint its central impacts on the labour market. Each of the markers have a direct impact on the labour market but our argument has been to show that the negative effects are largely overshadowed by the positive effects. The recent historical experience has demonstrated the important significant impact that trade flows, capital flows and technological change exert on the labour market of developing countries. All of these exert a monumental effect and indeed are the chief catalysts for the structural changes that we have witnessed within developing country economies. The comparative country evidence has illustrated the benefits that are associated with the increased tempo of trade flows. The debate is equally divided between apportioning the catalytic effects of these issues to trade on the one side or to technology on the other. The notion of trade as the catalyst emphasizes the importance that this has on the growth of capital flows and technological shifts within enterprises resulting in undeniable structural changes being brought about as a result. In the more technologically determinist argument, technology is purported to be the chief catalyst for bringing about these changing processes. This takes place as a result of new and innovative technologies being infused and diffused into the productive sphere of the economy and contributes dramatically to structural changes and ultimately political freedoms. In the latter instance, new technologies are purported to be creating the climate and the conditions whereby new
58
market potentials can be tapped by trade penetration and simultaneously the establishment of capital flows firstly through FDIs but soon after with more short-term portfolio investments by investors principally seeking positive returns. The slant in our own analysis shows how the adoption of changing technologies and principally ICTs have had a dramatic impact on the composition and growth of the skilled employment categories: this has been demonstrated through a rising demand for tertiary and service sector workers. In an earlier paper these trends were demonstrated for South Africa (Bhorat, Lundall and Rospabe, 2002) and the evidence assemble thus far has shown this to be taking place more rapidly in countries that are demonstrating a proclivity towards globalization. But the elements of the technological catalyst appear to be strong even in countries that are exhibiting a weaker response towards trade liberalization and capital flows. One of the unintended consequences of the high demand for skilled labour in the developed world is that this demand resonates within the developing world and incentives in the form of wage premia are exerted onto high-end skilled workers in developing countries to migrate and take up positions in developed countries. To some extent the pressure on the outward migration of skilled workers is partially mitigated by FDI flows which have an equally upward impact on the wages in developing countries. Migration per se may even generate short-term benefits to countries from supply countries through income repatriation to the home country of the immigrant. In the Southern Africa region, the South African economy continues to play this role, which it has done historically. The developed economies have historically played this role but significantly newly industrializing and oil-rich economies of the South are maintaining this relationship, with benefits to the source countries of economic migrants. When the pressures towards wage premiums are conceived in combination with the shift towards knowledge based activities using ICTs then it becomes clear that huge countervailing pressures against a race to the bottom is being created in the developing world for the skilled segments of the labour force. These tendencies are even observed in landlocked SSA economies such as Burkina Faso, but often mirror what is taking place within the developed world. The race to the bottom that is claimed to be taking place therefore appears to be globally diffused and is concentrated within specific sectors characterized by informality. In fact globalization appears to be an equalizing process in the manner in which it distributes high and low wage jobs. Low wage jobs are no longer the exclusive preserve of the developing world but are reallocated to economies where the capital and labour endowments are not being retooled and re-skilled adequately. The opposite applies to high wage jobs which are to be found in economies with strong service and tertiary sectors placing premiums on the acquisition of new technologies, consistent sources of capital formation and high levels of appropriate human capital acquisition. Sassen’s case studies in New York city indicate that the growth of casual employment is quite pervasive in the garment, furniture, construction, packaging and electronics industries (Sassen, 1997: 16) with high concentration from specific communities, particularly immigrants who are poorly endowed with the requisite human capital attributes (but rich in specific craft skills). The point to recognize however, is that such industries have to compete with cheaper goods and services from developing economies. The sectors that do not build on specific temporal advantages by investing in new technologies and upgrading the skills base of the work force as well as finding ways to exploit higher value adding niches within traditional sectors will come under pressure from cheaper producers in the traditional low value and ‘knowledge’ deficient industries.
What is striking from the evidence is a complex interpenetration that not only characterizes old developed with old developing countries but also new developed (e.g. Taiwan) and developing countries (e.g. South Africa and Malaysia) with old developing
59
countries (e.g. SSA and South Africa vis-à-vis Malaysian FDI). Therefore the linkages between developing and developed economies can no longer be characterized as exclusively North-South linkages (particularly with respect to FDI). The different patterns of capital accumulation and conceptions of new investment opportunities are contributing to these new trends. Therefore, growth and development does result in developing economies having an exogenous impact within an economic region, the so-called growth in ‘South-South links. Examples that stand out include, South African investments in SADC countries particularly within the retail sector (see Muradzikwa, 2002), Malaysian investments in South Africa (see Padayachee & Valodia, 1999) and Taiwanese investments in China. Net FDI flows therefore exert a definite growth impact within developing countries. These resonate directly on the employment and income potential of the labour market.
However the globalization of financial services as evidenced in the proliferation of private portfolio investment, has resulted in developing economies becoming susceptible to financial crises. This occurs particularly with crises driven by large and unexpected fluctuations in portfolio and short-term investments. Again the problem is of definite concern to policy makers concerned to mitigate the negative effects of such crises on the labour market. Apart from other instruments of macroeconomic stability the new global dispensation again poses the question of the appropriate macroeconomic instruments to manage and perhaps starve off such conditions. Again the developing country response to recent crises of this nature (e.g. Malaysia and Argentina) may have provided us with instructive scenarios about the available instruments that we have in place and most effective mechanisms in wielding these. Here it may be instructive to reconsider the effectiveness of a Tobin tax and the appropriateness of experimenting with regulatory instruments such as anti-bankruptcy laws. Even the radical new conditions necessitating a reconsideration of the trade policy regime requires that policy makers may have to reevaluate the pace of macroeconomic liberalization in relation to the microeconomic welfare consequences which these have. This challenge is endemic in a polarity that contrasts globalization with respect to long-term economic growth. They are not incompatible but the paper has nonetheless attempted to isolate the points where they appear incompatible. We need to think about the trade-offs that are often imposed between globalization and long-term growth which the real world compels us to periodically consider. But we need to do so with a menu of policy inventions to ensure that the process of globalization and the objectives of long term growth do not come apart carelessly at the seams.
60
Bibliography
Abdi, T. & Edwards, L. (2002) Trade, Technology & Wage Inequality in South Africa University of Cape
Town DPRU Working Paper 02/60. Aitken, B., Harrison, A. & Lipsey, R.E. (1996) Wages and Foreign Ownership: A Comparative study of
Mexico, Venezuela and the United States Journal of International Economics 40: 345-371. Amadeo, E.J. & Camargo, J.M. (1997) ‘Brazil: Regulation and Flexibility in the Labour Market’, in
Edwards, S. and Claudia Lustig, N. (Eds.) (1997) Labor Markets in Latin America: Combining Social Protection with Market Flexibility, pp.201-234.
Autor, D.H., Katz, L.F. & Krueger, A.B. (1998) Computing inequality: have computers changed the labor
market? Quarterly Journal of Economics 113: 1169-1213. Bamber, G.J & Ross, P.K. (2000) ‘Industrialization, democratisation and employment relations in the Asia
Pacific’ in Bamber, G.J., Park, F., Lee, C., Ross, P.K. and Broadbent, K. (Eds.) Employment Relations in the Asia-Pacific: Changing approaches, pp.3-19
Bamber, G.J., Park, F., Lee, C., Ross, P.K. & Broadbent, K. (Eds.) Employment Relations in the Asia-Pacific:
Changing approaches. St. Leonards, New South Wales: Allen & Unwin. Bates, R.H. (n.d) ‘Globalization: Less than meets the Ear?’, mimeo, pages, 16. Betcherman, G. (1996) ‘Globalization, labour markets and public policy’ in Boyer, R. and Drache, D. (Eds.)
States against Markets. London and New York: Routledge, pp.250-269. Bhattacherjee, D. (2002) ‘From the National to the Local: The Effects of Globalization on Indian Industrial
Relations’, in Tadashi Hanami (Ed) (2002) Global Integration and Challenges for Industrial Relations and Human Resource Management in the Twenty-First Century. Selected Papers from the 12th IIRA World Congress, Tokyo. JIP Report Series No.9. Tokyo: The Japan Institute of Labour.
Bhorat, H. (n.d) Economic Growth, Poverty and Inequality: A Framework for South Africa. Unpublished
mimeo. Bhorat, H. (2003) The Post-Apartheid Challenge: Labour Demand Trends in the South African Labour
Market, 1995-1999. DPRU Working Paper No 03/82. Development Policy Research Unit, University of Cape Town.
Bhorat, H. & Hodges, J. (1999) Decomposing shifts in labour demand in South Africa South African Journal
of Economics, 67(3), 348-380. Bhorat, H., Lundall, P. & Rospabe, S. (2002) The South African labour market in a globalizing world:
Economic and legislative considerations ILO Employment Paper 2002/32. Bluestone, B. & Harrison, B. (1982) The De-Industrialization of America: Plant Closings, Community
Abandonment and the Dismantling of Basic Industry. Basic Books: New York. Bound, J. & Johnson, G. (1992) Changes in the Structure of Wages in the 1980’s: An Evaluation of
Alternative Explanations 82(3): 371-392. Carr, M. & Chen, M.A. (2002) Globalization and the Informal Economy: How Global Trade and Investment
Impact on the Working Poor. Employment Sector Working Paper 2002/1. Geneva: International Labour Office.
Carrington, W. & Detragiache, E. (1998) ‘How Big is the Brain Drain’ IMF Working Paper 102. Connor, W.D. (1996) Tattered Banners: labor, conflict and corporatism in post-communist Russia.
Westview Press: Boulder, Colorado.
61
Cox Edwards, A. (1997) ‘Labor Market Regulation in Latin America: An Overview’, in Edwards, S. and
Claudia Lustig, N. (Eds.) (1997) Labor Markets in Latin America: Combining Social Protection with Market Flexibility, pp.127-150.
Deery, S. & Mitchell, R. (1993) Labour law and industrial relations in Asia: eight country studies. Longman
Cheshire: Melbourne, Australia. Dollar, D. & Kraay, A. (2001) ‘Growth is good for the poor’, Policy Research Working Paper, 2587,
Washington DC: The World Bank. Dollar, D. (1992) World Bank. Outward-oriented Developing Economies Really Do Grow More Rapidly:
Evidence from 95 LDCs, 1976 – 1985. Economic Development and Cultural Change 523-544. University of Chicago Press.
Domeland, D. & Gill, I. (2002) ‘Labor Reform in Latin America during the 1990s’ in Gill, I., Montenegro, C.
and Domeland, D. (Ed) (2002) Crafting Labor Policy: Techniques and Lessons from Latin America. Washington: The World Bank & Oxford University Press.
Doms, M., Dunne, T. & Troske, K. (1997) Workers, Wages, and Technology The Quarterly Journal of
Economics: 253-290. President and Fellows of Harvard College and the Massachusetts Institute of Technology.
Edwards, L. (1999) Trade liberalization, structural change and occupational employment in South Africa.
Paper presented at the Trade and Industrial Policy Secretariat (TIPS) Annual Forum, Muldersdrift, 19-22 September.
Edwards, S. & Claudia Lustig, N. (Eds.) (1997) Labor Markets in Latin America: Combining Social
Protection with Market Flexibility. Washington: Brookings Institution Press. Elbadawi, I. Can Africa Export Manufactures? The Role of Endowment, Exchange Rates and Transaction
Costs. Development Research Group and Africa Region, World Bank. Feenstra, R. & Hanson, G. (1996), Globalization, Outsourcing and Wage Inequality’, American Economic
Review, 86(2),240-5. Figlio, D.N. & Blonigen, B.A. (1999) The effects of direct foreign investment on local communities. NBER
Working Paper 7274. Freeman, R. & Oostendorp, R. (2000) Wages Around the World: Pay Across Occupations and Countries.
Working Paper 8058 National Bureau of Economic Research. Freeman, R. (1979) The Effect of Demographic Factors on Age-Earnings Profiles The Journal of Human
Resources 14(3) 289–318 University of Wisconsin Freeman, R. (1980) An Empirical Analysis of the Fixed Coefficient “Manpower Requirements” Model,
1960-1970 The Journal of Human Resources Vol. 15(2): 176 - 199 Regents of the University of Wisconsin System
Friedberg, R. & Hunt, J. (1995) ‘The Impact of Immigrants on Host Country Wages, Employment and
Growth’ Journal of Economic Perspectives 9(2) 23-44. Fakude, G. (2000) Informalization in KwaZulu-Natal’s Clothing Sector. SDS Research Report No.37.
University of Natal (Durban): School of Development Studies (SDS). Gaston, N. & Nelson, D. (2001) Integration, FDI and Labour Markets: Microeconomic Perspectives
Globalization and Labour Markets Programme Research Paper Series 2001/31 University of Nottingham
62
Grace, J., Kenny, C., Qiang, C., Lui, J. & Reynolds, T. (2001) Information and Communication Technologies and Broad-Based Development: a Partial Review of the Evidence. Draft Paper 02/14/01
Greenaway, D., Hine, R.C. & Wright, P.W. (1999) ‘An Assessment of the Impact of Trade on Employment
in the United Kingdom’, European Journal of Political Economy, Vol.15: 485-500. Greenaway, D & Nelson, D. (Ed.) (2001) Globalization and Labour Markets. Two Volumes. Cheltenham:
Edward Elgar. Hanson, G. & Harrison, A. (1999) Trade Liberalization and Wage Inequality in Mexico. Industrial and Labor
Relations Review, Vol. 52(2) January, Cornell University. Harrison, A. (1991) Openness and Growth A Time Series, Cross-Country Analysis for Developing
Countries. Working Paper World Development Report The World Bank Ibhawoh, B. (1999) ‘Structural Adjustment, Authoritarianism and Human Rights in Africa’, Comparative
Studies of South Asia, Africa and the Middle East, vol 19 (1): 158-167. Jackman, R., Layard. R., Manacorda, M. & Petrongolo, B. (1997) European Versus US Unemployment:
Different Responses to Increased Demand for Skill? Centre for Economic Performance Discussion Paper No. 349.
Karanassou, M. & Snower, DJ. (1998) How Labour Market Flexibility Affects Unemployment: Long-Term
Implications of the Chain Reaction Theory The Economic Journal, 108(May), 832-849. Royal Economic Society Blackwell Publishers.
Katz & Murphy (1992) Changes in relative wages, 1963-1983: supply and demand factors, Quarterly Journal
of Economics, February. Katz, L. & Autor, D. (1999) ‘Changes in the Wage Structure and Earnings Inequality’ Handbook of Labor
Economics 3A(26)1463-1555. Kuhn, P. (1995) Labour Market Polarization: Canada in International Perspective McMaster University
Department of Economics. Lawrence, R. & Slaughter, M. (1993) ‘Trade and US Wages: Great Sucking Sound and Small Hiccup?’,
Brookings Papers on Economic Activity, 2, 161-227. Lee, J.S. (2000) ‘Changing approaches to employment relations in Taiwan’ in Bamber, G.J., Park, F., Lee,
C., Ross, P.K. and Broadbent, K. (Eds.) Employment Relations in the Asia-Pacific: Changing approaches, pp.100-116.
Li, H., Squire, L. & Zou, H. (1998) Explaining International and Intertemporal Variations in Income
Inequality The Economic Journal, 108(January), 26-43. Royal Economic Society Blackwell Publishers.
Lindert, P. & Williamson, J. (2001) Does Globalization make the World more Unequal? Paper presented at a
conference on Globalization in Historical Perspective. Lundall, P. (2002) Special Problems in Securing a Reduction in Working Hours: The Case of Security
Workers. DPRU Working Paper No 02/69. Development Policy Research Unit, University of Cape Town.
Machin, S. January (2002) Labour Market Inequality and Changes in the Relative Demand for Skills
“Explanations of Rising Economic Inequality” Paper for the Royal Statistical Society Conference Department of Economics, University of College London and Centre for Economic Performance, London School of Economics.
Milner, C. & Wright, P. (1998) Modelling Labour Market Adjustment to Trade Liberalization in an
Industrialising Economy The Economic Journal, 108 (March), 509-528, Royal Economic Society.
63
Mishel, L. & Bernstein, J. (1998) Technology and the Wage Structure: Has Technology’s Impact Accelerated
since the 1970s? Research in Labor Economics, Vol. 17: 305-355. Muradzikwa, S. (2002) Foreign Investment in SADC. DPRU Working Paper No 02/67. Development Policy
Research Unit, University of Cape Town. OECD (2000) Economic Outlook. Padayachee, V. & Valodia, I. (1999) Malaysian Investment in South Africa: South-South Relations in a
Globalizing Environment? Journal of Contemporary African Studies 17(2): 287-297. Park, F. & Park, Y. (2000) ‘Changing approaches to employment relations in South Korea’ in Bamber, G.J.,
Park, F., Lee, C., Ross, P.K. and Broadbent, K. (Eds.) Employment Relations in the Asia-Pacific: Changing approaches, pp. 80-99.
Rama, M. (2001) Globalization, Inequality and Labor Market Policies The World Bank Development
Research Group. Reinecke, G. & Torres, R. (2001) Studies in the Social Dimension of Globalization: Chile. International
Labour Office, Geneva. Robbins, D. (1995) Trade, Trade Liberalization and Inequality in Latin America and East Asia: Synthesis of
Seven Country Studies Mimeo, Harvard Institute for International Development. Rodrik, D. (1992) Economics and Politics: Yesterday and Today Political Economy and Development Policy
European Economic Review 36 329-336. North Holland. Romer, P. (1993) Idea Gaps and Object Gaps in Economic Development Journal of Monetary Economics
(32) Rowthorn, R.E. & Wells, J.R. (1987) De-Industrialization and Foreign Trade. Cambridge University Press:
Cambridge. Sachs, J. & Warner, A. (1995) ‘ Economic Reform and the Process of Global Integration’, Brookings Papers
on Economic Activity, 0(1)1-95. Sachs, J.D. & Shatz, H.J. (May 1996). ‘U.S. Trade with Developing Countries and Wage Inequality’
Globalization and the US Labor Market Vol. 86(2): 234-245. Sachs, J. Globalization and Employment Harvard Institute for International Development. Sassen, S. (1997) Informalization in advanced market economies. Development Policies Department
Discussion Paper on Issues in Development No.20. Geneva: International Labour Office. Solimano, A. (1999) ‘Globalization and National Development at the end of the 20th Century: Tensions and
Challenges’, mimeo, The World Bank. Pages, Summary and Conclusions Van der Geest, W. & van der Hoeven, R. (Eds) (1999) Adjustment, Employment and Missing Institutions in
Africa: The Experience in Eastern and Southern Africa. International Labour Office, Geneva in association with James Currey, Oxford.
Van der Hoeven, R. & Van der Geest, W. (1999) ‘Africa’s Adjusted Labour Markets: Can Institutions
Perform?’ in Van der Geest and Van der Hoeven (Eds) Adjustment and Missing Institutions in Africa, pp.9-32.
Wood, A. (1994) North-South Trade, Employment and Inequality: Changing Fortunes in a Skill-driven
World Oxford, Clarendon Press. Wood, A. (1995) ‘How trade hurt unskilled workers’, Journal of Economic Perspectives 9:57-80.

64
World Bank (2000) Poverty in an Age of Globalization. World Bank: Washington. Yusuf, S. (2001) Glolbalization and the Challenge for Developing Countries. World Bank Paper, June.

65
Appendix
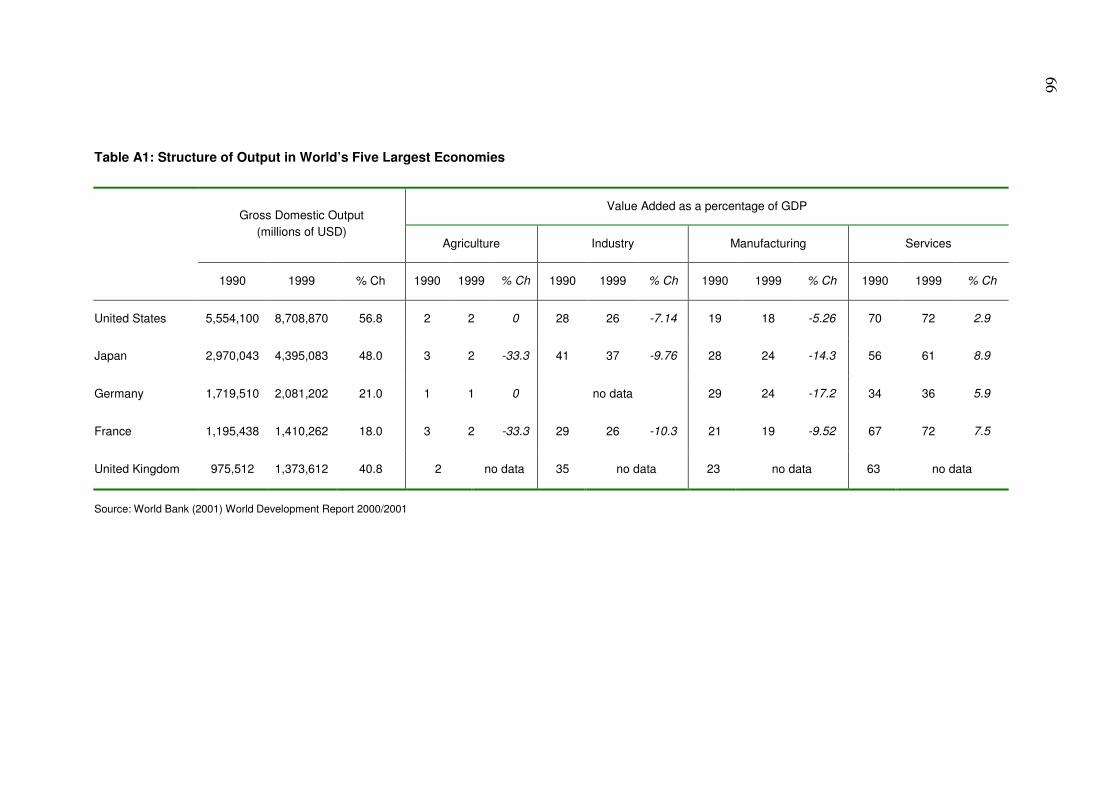
Table A1: Structure of Output in World’s Five Largest Economies
Value Added as a percentage of GDP Gross Domestic Output
(millions of USD) Agriculture Industry Manufacturing Services
1990 1999 % Ch 1990 1999 % Ch 1990 1999 % Ch 1990 1999 % Ch 1990 1999 % Ch
United States 5,554,100 8,708,870 56.8 2 2 0 28 26 -7.14 19 18 -5.26 70 72 2.9
Japan 2,970,043 4,395,083 48.0 3 2 -33.3 41 37 -9.76 28 24 -14.3 56 61 8.9
Germany 1,719,510 2,081,202 21.0 1 1 0 no data 29 24 -17.2 34 36 5.9
France 1,195,438 1,410,262 18.0 3 2 -33.3 29 26 -10.3 21 19 -9.52 67 72 7.5
United Kingdom 975,512 1,373,612 40.8 2 no data 35 no data 23 no data 63 no data
Source: World Bank (2001) World Development Report 2000/2001
66
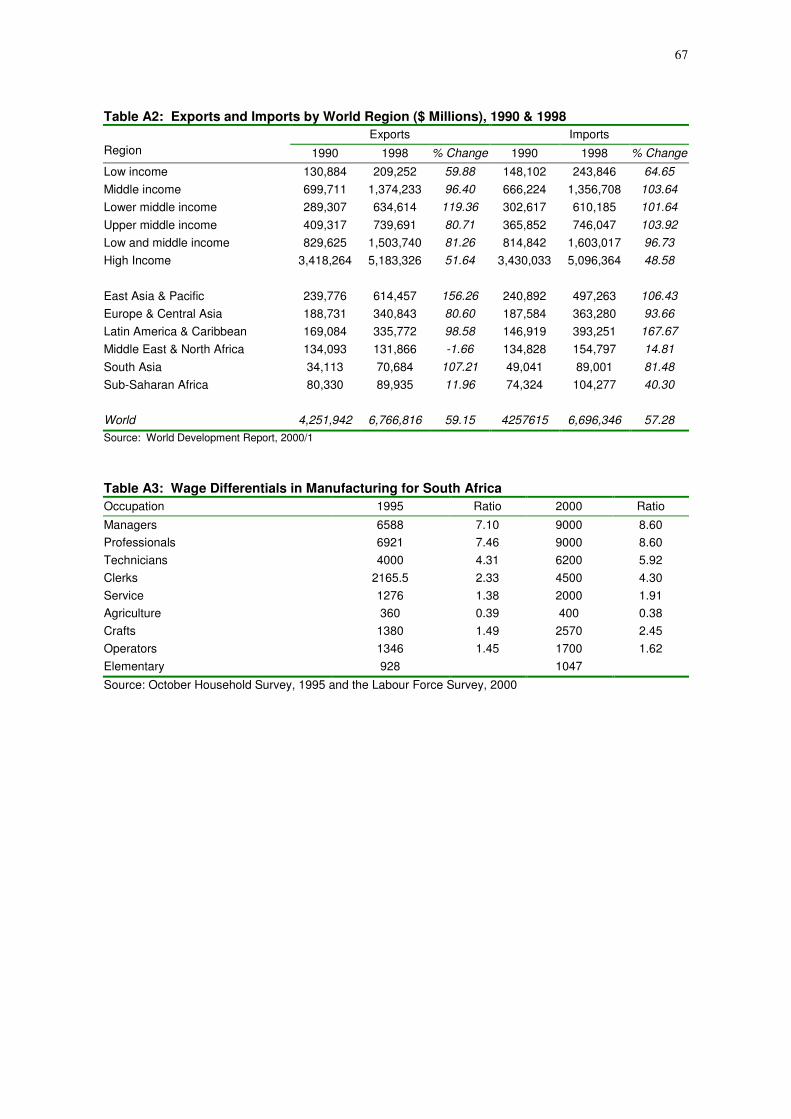
67
Table A2: Exports and Imports by World Region ($ Millions), 1990 & 1998
Exports Imports Region 1990 1998 % Change 1990 1998 % Change
Low income 130,884 209,252 59.88 148,102 243,846 64.65 Middle income 699,711 1,374,233 96.40 666,224 1,356,708 103.64 Lower middle income 289,307 634,614 119.36 302,617 610,185 101.64 Upper middle income 409,317 739,691 80.71 365,852 746,047 103.92 Low and middle income 829,625 1,503,740 81.26 814,842 1,603,017 96.73 High Income 3,418,264 5,183,326 51.64 3,430,033 5,096,364 48.58 East Asia & Pacific 239,776 614,457 156.26 240,892 497,263 106.43 Europe & Central Asia 188,731 340,843 80.60 187,584 363,280 93.66 Latin America & Caribbean 169,084 335,772 98.58 146,919 393,251 167.67 Middle East & North Africa 134,093 131,866 -1.66 134,828 154,797 14.81 South Asia 34,113 70,684 107.21 49,041 89,001 81.48 Sub-Saharan Africa 80,330 89,935 11.96 74,324 104,277 40.30 World 4,251,942 6,766,816 59.15 4257615 6,696,346 57.28 Source: World Development Report, 2000/1
Table A3: Wage Differentials in Manufacturing for South Africa Occupation 1995 Ratio 2000 Ratio
Managers 6588 7.10 9000 8.60 Professionals 6921 7.46 9000 8.60 Technicians 4000 4.31 6200 5.92 Clerks 2165.5 2.33 4500 4.30 Service 1276 1.38 2000 1.91 Agriculture 360 0.39 400 0.38 Crafts 1380 1.49 2570 2.45 Operators 1346 1.45 1700 1.62 Elementary 928 1047 Source: October Household Survey, 1995 and the Labour Force Survey, 2000
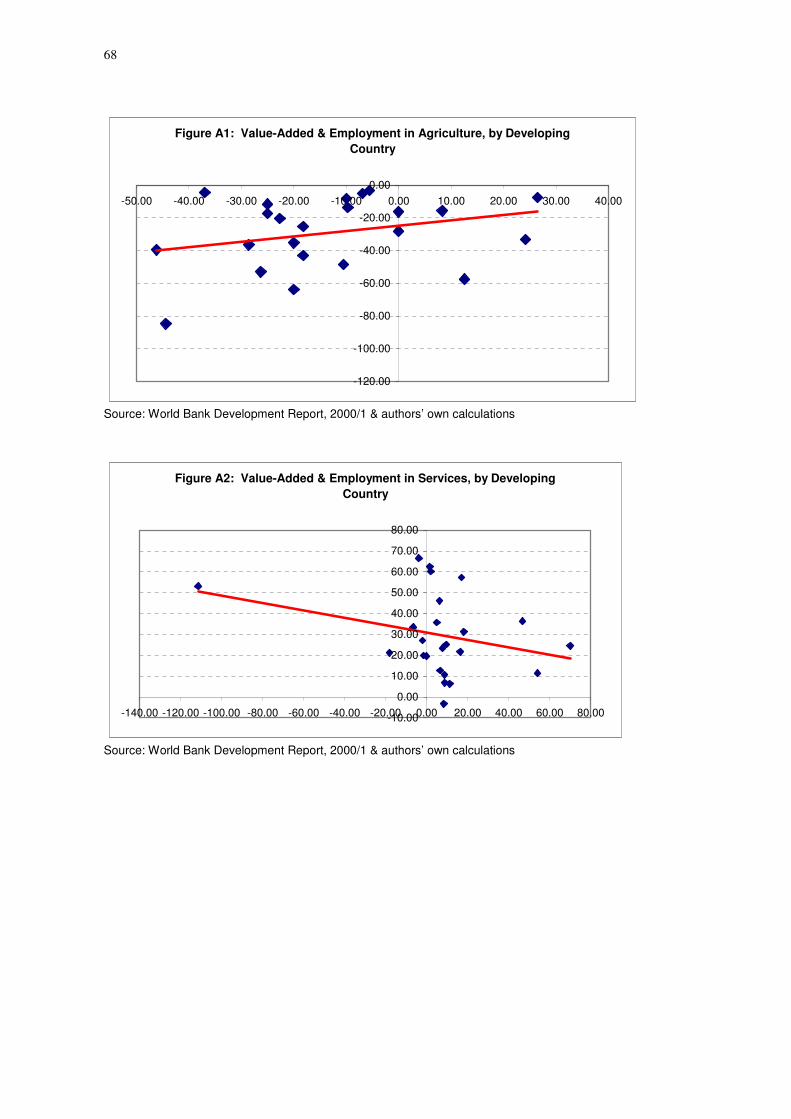
68
Figure A1: Value-Added & Employment in Agriculture, by Developing Country
-120.00
-100.00
-80.00
-60.00
-40.00
-20.00
0.00-50.00 -40.00 -30.00 -20.00 -10.00 0.00 10.00 20.00 30.00 40.00
Source: World Bank Development Report, 2000/1 & authors’ own calculations
Figure A2: Value-Added & Employment in Services, by Developing Country
-10.00
0.00
10.00
20.00
30.00
40.00
50.00
60.00
70.00
80.00
-140.00 -120.00 -100.00 -80.00 -60.00 -40.00 -20.00 0.00 20.00 40.00 60.00 80.00
Source: World Bank Development Report, 2000/1 & authors’ own calculations
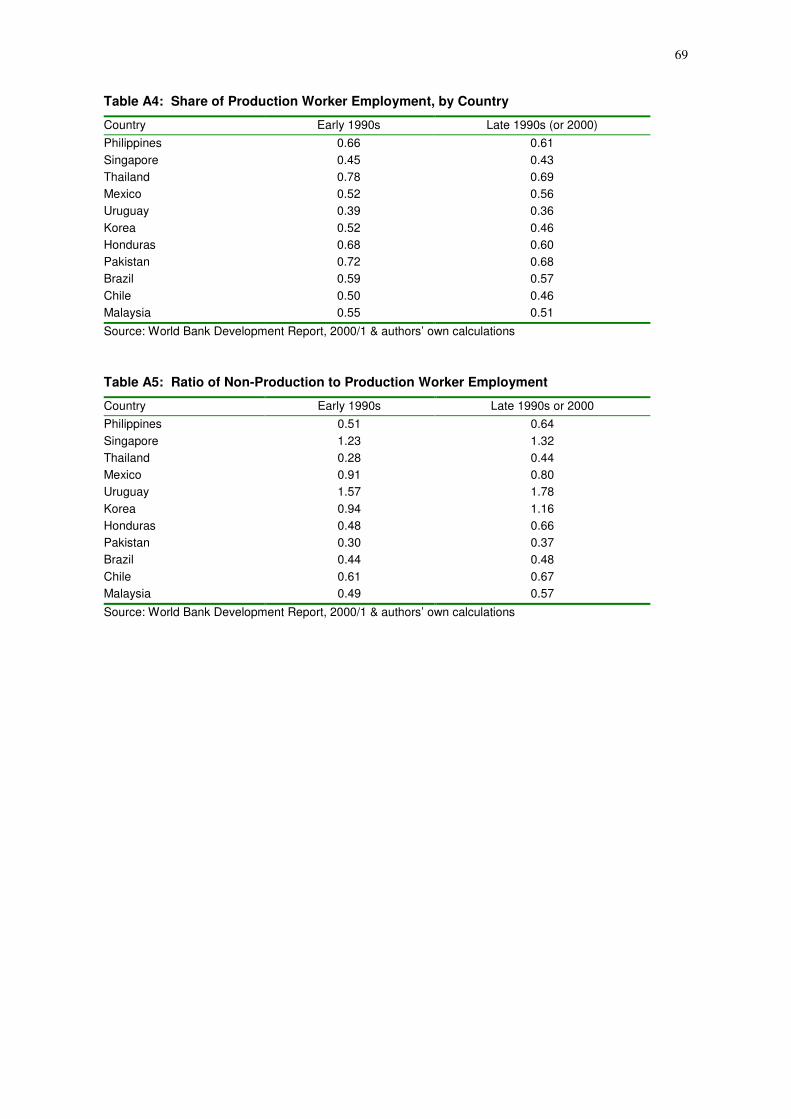
69
Table A4: Share of Production Worker Employment, by Country
Country Early 1990s Late 1990s (or 2000) Philippines 0.66 0.61 Singapore 0.45 0.43 Thailand 0.78 0.69 Mexico 0.52 0.56 Uruguay 0.39 0.36 Korea 0.52 0.46 Honduras 0.68 0.60 Pakistan 0.72 0.68 Brazil 0.59 0.57 Chile 0.50 0.46 Malaysia 0.55 0.51 Source: World Bank Development Report, 2000/1 & authors’ own calculations Table A5: Ratio of Non-Production to Production Worker Employment
Country Early 1990s Late 1990s or 2000 Philippines 0.51 0.64 Singapore 1.23 1.32 Thailand 0.28 0.44 Mexico 0.91 0.80 Uruguay 1.57 1.78 Korea 0.94 1.16 Honduras 0.48 0.66 Pakistan 0.30 0.37 Brazil 0.44 0.48 Chile 0.61 0.67 Malaysia 0.49 0.57 Source: World Bank Development Report, 2000/1 & authors’ own calculations
The present document is one in a set of studies on macroeconomic reforms,
globalization and labour market policies, which includes the following:
• Employment Paper No. 2003/32: The South African labour market in a globalizing
world, by Haroon Bhorat. • Employment Strategy Paper No. 2004/1: Macroeconomic reforms and a labour policy
framework for India, by Jayati Ghosh. • Employment Strategy Paper No. 2004/2: Macroeconomic reforms, labour markets and
labour policies: Chile, 1973-2000, by Guillermo Campero. • Employment Strategy Paper No. 2004/3: Employment and labour market effects of
globalization: selected issues for policy management, by Haroon Bhorat and Paul Lundall.
�����������������������������������������
2004/1
Macroeconomic reforms and a labour policy framework for India, by Jayati Ghosh
2004/2 Macroeconomic reforms, labour markets and labour policies: Chile, 1973-2000, by Guillermo Campero
2004/3
Employment and labour market effects of globalization: Selected issues for policy management, by Haroon Bhorat and Paul Lundall
2004/4 Successful employment and labour market policies in Europe and Asia and the Pacific, by Claire Harasty (ed.)
2004/5 Global poverty estimates and the millennium goals: Towards a unified framework, by Massoud Karshenas
2004/6 The labour market effects of US FDI in developing countries, by Robert E. Lipsey
2004/7 Industrial relations, social dialogue and employment in Argentina, Brazil and Mexico, by Adaberto Cardoso
2004/8 Global employment trends for women, 2004, by Sara Elder and Dorothea Schmidt
2004/9 Active labour market policies around the world: Coping with the consequences of globalization, by Peter Auer, Ümit Efendioglu and Janine Leschke
All papers are downloadable from our website at www.ilo.org/public/english/employment/strat/espapers.htm


![Journal of Dentistry - Tannhjulet...restricted toughness and hardness, and residual monomers following polymerization [9]. Independent data on OBLs is scarce, and it has been altogether](https://img.pdfslide.tips/doc/110x75/5ea282c1d701b11a4f7395c8/journal-of-dentistry-tannhjulet-restricted-toughness-and-hardness-and-residual.jpg)


![Pl[a]ywood - EX-posed](https://img.pdfslide.tips/doc/110x75/568c49e11a28ab491695ee22/playwood-ex-posed.jpg)