Embed Size (px)
Citation preview

May 31, 2011
ODNR Division of Recycling &
Litter Prevention 2049 Morse Road, Bldg B1 Columbus, Ohio 432296693
Submitted by:
PO Box 2, 82 Main Street
Windsor, Vermont 05089
Tel: 802‐674‐2840
Fax: 802‐674‐6915
Ohio Glass Recycling Study Final Report

FORWARD The Division of Recycling & Litter Prevention commissioned this study, very simply, to improve how Ohio connects those who have glass with those who need glass. Currently Ohio manufacturers use about 110,000 tons of recycled glass per year from Ohio and surrounding states… yet their need is greater – roughly 275,000 - 295,000 tons per year. The study results indicate that Ohio has a huge capacity for glass recovery. Roughly 90 percent of all glass containers consumed in Ohio are disposed of in landfills as opposed to recycled. While glass remains an important part of Ohio's industrial base there appears to be a disconnect on the value of glass being recovered. Glass continues to go to landfills primarily due to perceived lack of markets and an inefficient system for collection and processing. Using recycled glass costs less than using raw materials by reducing energy demands. Implementing strategies that can strengthen glass recycling programs across the state can create a competitive advantage for Ohio's manufacturers. Long-term, the division will work with industry stakeholders to establish an infrastructure that will help Ohio manage the value inherent in everything now being lost into landfills. Jobs will also be created throughout the supply chain. Looking forward, the creation of a glass recycling infrastructure represents the first significant step towards establishing Ohio, and Ohio's manufacturers, as leaders in green business practices that can continue to reap dividends for generations. Recycling is good business and it is good policy. Going forward, recycling glass represents an opportunity to begin systemic change that will be felt throughout our economy and our communities.
Ohio Glass Recycling Study FINAL REPORT, May 31, 2011
heodore R. Lozier Terrie TerMeer hief, DRLP Assistant Chief, DRLP TC

Ohio Glass Recycling Study FINAL REPORT, May 31, 2011
TABLE OF CONTENTS xecutive Summary.............................................................................................................................ES.1 E
Introduction.................................................................................................................................................. 1
Background................................................................................................................................................... 1
Current and Projected Future Demand for Recycled Glass ..................................................... 2
Processing (Beneficiation) Capacity .................................................................................................. 6
Current Generation and Recycling (Supply) of Container Glass in Ohio ........................... 7
Mass Balance Analysis of the Current Glass Recovery System ............................................20
Analysis of Alternative Strategies to Increase the Supply of Recycled Glass in Ohio 22
indings ........................................................................................................................................................33 F
PPENDIX....................................................................................................................................................35 A

EXECUTIVE SUMMARY The Ohio Department of Natural Resources (ODNR) contracted with DSM nvironmental Services, Inc. (DSM) to conduct an analysis of the supply and demand Efor container glass in Ohio.
SM D
’s scope of work included the following tasks:
• Identify current and projected future demand for recycled glass cullet, includingspecifications and limitations to the use of glass cullet;
• y Estimate the current supply of recycled glass in Ohio, and compare this supplwith the existing and expected future demand;
• asing the supply of Evaluate alternatives (or strategies) for significantly increglass to meet Ohio glass industry demands; and,
Develop rough estimates of the costs for each alternative. • Demand for Additional Recycled Glass Cullet Glass manufacturing is an important part of Ohio’s manufacturing base with five anufacturing facilities for container glass, fiberglass and reflective coatings, as well m
as four glass processing facilities to supply the manufacturing plants. Because of manufacturing energy savings associated with substituting glass cullet for raw materials and, in the case of fiberglass, increased demand for insulation manufactured with recycled glass, both the container glass and fiberglass industries re anxious to source significantly more recycled glass cullet than is currently aavailable from Ohio municipalities. All of these plants can use both recycled float (plate) glass and container glass, and can source material from within Ohio as well as from surrounding states. Table E.1 illustrates that current recycled glass cullet use by Ohio manufacturers is approximately 110,000 tons per year, but that the Ohio glass manufacturers need between 275.000 and 295,000 tons of glass cullet per year, meaning that an dditional 165 to 185 thousand new tons of recycled glass cullet are required to eet demand.
am Table E.1 Current and Future Demand for Glass Cullet
Ohio Glass Recycling Study FINAL REPORT, May 31, 2011
CurrentUse Low High Color
Industry (tons) (tons) (tons)Glass Bottles 15,000 100,000 100,000 >95% FlintFiberglass 65,000 145,000 165,000 < 20 ‐ 40% AmberOther (Bead and Block) 30,000 30,000 30,000 Mixed
Total: 110,000 275,000 295,000
Difference: 165,000 185,000
Potential Demand
ES 1

Glass Processing Capacity Recycled glass cullet cannot be used until it has been processed to remove ontaminants, and ground to a specific size. In addition, for glass container use, it cmust also be color sorted if it has been collected as mixed color glass. Ohio is fortunate to have significant glass processing capacity, with four processing plants: two Strategic Materials plants in Cleveland and Newark; a Rumpke facility in Dayton which is about to be expanded; and, a large Dlubak facility in Upper Sandusky. Table E.2 illustrates that there is sufficient processing capacity in Ohio to meet current demand, with the potential to expand to meet much of the projected future capacity. However, because of O‐I demand for flint glass only at their anesville plant, it may be necessary to invest in additional optical sorting capacity Zto sort mixed color glass to meet this demand. It is important to note that much of the glass processors current throughput is from industrial plate glass supplies. In addition, Ohio based processors currently supply out of state end users. Based on interviews with glass processors and manufacturers, DSM believes that most industrial plate glass is already being ecovered for recycling and that only minor amounts potentially remain available in he waste stream. rt Table E.2 C(
urrent and Planned Processing Capacity for Glass in Ohio Total tons for four reporting facilities)
Ohio Glass Recycling Study FINAL REPORT, May 31, 2011
Pro ng Facility
Current Planned/PotentialInput Output Input Output(tons) (tons) (tons) (tons)
Tot l, Four Facilities 209,000 174,300 275,000 213,000acessi
t of (1) Input is different from Current Use (Table 1) since processors currently supply ou
2) etail, see Report Table 2 and discussion in “Processing Capacity”. state end users.For additional d
(
Potential Supply of Additional Glass Cullet Ohio does not collect data sufficient to accurately estimate glass generation, or to disaggregate residential and commercial sources of glass. Because relatively ccurate estimates are essential to projecting the potential supply of glass in Ohio, aDSM expended significant effort on the analysis of supply. DSM reviewed data submitted to the Ohio EPA by solid waste districts and the 2003 Ohio landfill waste characterization study; obtained beer, wine and liquor sales data to assess on‐premise (bar and restaurant) generation of glass bottles; and, analyzed the potential supply of plate glass currently not being recycled. DSM also conducted five days of residential refuse and recycling route sorting to improve understanding f the potential to recover additional glass containers from residential versus ocommercial sources. Table E.3 presents DSM’s best estimate of the potential supply, and current recycling rate for glass in Ohio (exclusive of industrial plate glass, as discussed above). As illustrated by Table E.3, roughly 390,000 tons of residential glass and

126,000 tons of glass from businesses was generated in Ohio in 2010, with only about 54,400 (rounded) tons of container glass recycled, leaving 408,000 additional tons of non‐recycled glass potentially available for recovery. Table E.3 Total Glass Generation, By Sector and Type, and Estimated Current Recovery in Ohio (2009)
Average
Per Capita Total
Residential (lbs) (tons)
Container Glass
Beverage 51 292,000
Food 11 64,000
Plate Glass (1) 6 35,000
Total, Residential: 68 390,000
Commercial
Container Glass (2) 16 92,000
Other Glass (3) 6 35,000
Total Commercial: 22 126,000
Total Glass: 90 517,000
54,395
11%
Recovery, from Table 3:
Estimated Recovery:
(1) Estimated at 12 lbs per capita, based on EPA data and assuming 50% is residential. lass per discussions with distributors. EPA data and assuming 50% is commercial.
(2) Estimated to be 25% of total beverage gt 12 lbs per capita, based on
4) Numbers may not add due to rounding. (3) Estimated a( Potential Strategies to Meet Demand As discussed above, DSM believes that most of the industrial scrap glass (plate and windshield) is already being collected for recycling, and that any significant increase n future supply will have to come primarily from increased collection of container iglass. DSM analyzed five strategies for recovering additional glass to meet Ohio glass manufacturers demand for glass cullet. Each of these strategies will require capital investments and higher operating costs. This analysis does not address who will pay the cost to achieve the higher demand, but does recognize that a primary reason for the low glass recycling rates in Ohio is that landfill costs are low, and diverting dditional glass will cost money over and above what it currently costs to landfill lass. Theag
Ohio Glass Recycling Study FINAL REPORT, May 31, 2011
five strategies are:
• Expansion of single stream curbside recycling to include additional households that have curbside collection of refuse but no curbside collection of recyclables;

Ohio Glass Recycling Study FINAL REPORT, May 31, 2011
• n‐ Implementation of glass recycling programs for bars and restaurants (e.g. opremise beverage sales);
• Source separated collection of glass by color using glass drop‐off locations throughout Ohio;
• placement glass and Recovery of additional plate glass from windshield reconstruction and demolition activities; and,
• Enactment of beverage container deposit legislation The first four strategies can be implemented through incremental changes to existing programs, and could yield new quantities of glass sufficient to provide much of the potential future demand, as summarized below. Recovery of additional lass cullet through a beverage container deposit program would require new glegislation.
n su I
mmary, the findings of DSM’s evaluation were the following.
• Expanding curbside collection to all households with curbside refuse collection could supply roughly 68,000 new tons of glass after accounting for losses during separation and processing. This expansion would have the added benefit of creating substantial new supplies of paper, and plastic, aluminum and steel containers. However, there would be a need for continued investment in best management practices at the single stream MRFs to reduce glass losses, and at the glass processing facilities to color separate and remove contaminants. It is estimated that expanding curbside collection to achieve recovery of an additional 68,000 net tons of new glass cullet would cost an estimated $68.4 million annually. However, this cost is not exclusive to glass, because it would include collection of all curbside materials, including plastic, aluminum, tin, and paper. This cost also does not take into account any savings in collection costs, avoided tip fees or other collection efficiencies that might reduce total refuse and recycling system costs.
• A recycling program for bars and restaurants, modeled after the existing three pilot programs in Ohio, and the state‐wide North Carolina program, could eventually recover an estimated 53,000 (rounded) new tons of glass cullet. Total costs are estimated to range from $1.5 ‐ $3 million at a participation rate of 66 percent of all bars and restaurants. Costs are relatively low because DSM assumes that bars and restaurants would realize significant savings in refuse
collection and disposal costs if glass were diverted for recycling.
• Expanded drop‐off programs to serve urban and suburban populations that currently do not have access to either curbside or drop‐off recycling could recover an additional 14,400 tons of container glass. DSM has assumed that new drop‐offs serving primarily residential areas would be source separated by color, but drop‐offs serving a mix of residential and commercial (bar and restaurant) establishments would accept three‐mix glass. DSM’s rough estimate of total system costs associated with households and businesses driving to drop‐offs to deliver recycled glass, as well as to construct and operate the drop‐offs, collect and transfer this material to glass processors and clean to market
specifications is in the range of $5.5 to $6 million dollars.
• Combining expanded curbside and drop‐off programs with recycling for bars and restaurants could eventually meet roughly 73 to 82 percent of future

Ohio Glass Recycling Study FINAL REPORT, May 31, 2011
demand, and when combined with new capacity to process existing three‐mix MRF tonnage, could potentially meet all of the projected future demand.
• An additional 10,000 tons (rounded) of plate glass might be recovered through implementation of a windshield glass replacement recycling program and additional recovery of replacement plate glass during building renovation and demolition. DSM did not estimate costs associated with these potential
expansions.
• Finally, although not an incremental change, deposit legislation for glass bottles could recover an estimated 239,000 tons of glass, which would be more than ufficient to supply future Ohio glass manufacturing demand.
s

Page 1 Ohio Glass Recycling Study FINAL REPORT, May 31, 2011
INTRODUCTION The Ohio Department of Natural Resources (ODNR) contracted with DSM Environmental Services, Inc. (DSM) to conduct an analysis of the supply and demand for container glass in Ohio that would result in “comprehensive data that reflects the overall market status of glass in Ohio…and identify strategies to assist communities in esigning programs to maximize the quality of glass recovery for recycling and to
he market for a beneficial end use.” densure that recovered glass effectively moves from t
SM D
’s scope of work included the following tasks:
• Identify current and projected future demand for recycled glass cullet, includingspecifications and limitations to the use of glass cullet;
• ly Estimate the current supply of recycled glass in Ohio, and compare this suppwith the existing and expected future demand;
• y of glass to meet Evaluate alternatives for significantly increasing the supplOhio glass industry demands; and,
alternative. • Develop rough estimates of the costs for each This report presents DSM’s analysis and findings.
BACKGROUND Glass manufacturing is an important part of Ohio’s manufacturing base with five anufacturing facilities for container glass, fiberglass and reflective coatings, as well m
as four glass processing facilities to supply the manufacturing plants. Because of manufacturing energy savings associated with substituting glass cullet for raw materials and, in the case of fiberglass, increased demand for insulation manufactured with recycled glass, both the container glass and fiberglass industries re anxious to source significantly more recycled glass cullet than is currently aavailable from Ohio municipalities. As discussed below, despite the demand for recycled glass by Ohio industries, roughly 90 percent of all glass containers consumed in Ohio are disposed of in landfills, as opposed to recycled; with much of the glass cullet supplied to Ohio glass manufacturers coming from industrial sources of plate glass. This is primarily because the value of glass cullet is relatively low given the low cost of raw materials that glass cullet substitutes for in the manufacturing process. Just as importantly, Ohio’s relatively low landfill prices, combined with the relatively high cost of collecting, processing, and transporting recycled glass containers, limits the incentive for solid waste districts and waste management companies to increase the supply of glass cullet from container glass.

Page 2 O
hio Glass Recycling Study FINAL REPORT, May 31, 2011
plate and container glass, unless ot
CURRENT AND PROJECTED FUTURE DEMAND FOR
ECYCLED GLASS R There are currently six manufacturing plants in Ohio sourcing recycled glass. Owens‐Brockway Glass Container, Inc. (O‐I) produces clear liquor bottles at its manufacturing facility in Zanesville, OH. Owens Corning (OC) has two fiberglass manufacturing facilities in Ohio (Newark and Mount Vernon) and Johns Manville has one plant in Defiance, OH (a second plant in Richmond, IN is just over the border from Ohio and is projected to need post consumer recycled glass in the future). Potters Industries in Cleveland produces glass beads, primarily for highway safety arking systems. Finally, Whitacre Greer in Alliance, OH sources relatively small m
quantities of recycled glass cullet for brick and block applications. Current and future demand is based on information supplied by the various plants nd is subject to changes in economic conditions, especially for the fiberglass amanufacturers which are dependent on construction activity. All of these plants can use both recycled float (plate) glass and container glass, and can source material from within Ohio as well as from surrounding states.1 As iscussed below, DSM’s analysis focuses on increasing the supply of container glass, das opposed to plate glass for two reasons. First, based on interviews with key stakeholders it appears that the majority of plate glass is already being recovered, although relatively small quantities of windshield replacement glass and some quantities of plate glass from building demolition or window replacements may potentially be available over and above the current supply. Second, ODNR is primarily concerned with increasing the supply of ontainer glass – which represents the majority of glass that is currently disposed cinstead of recycled. It should be noted, however that float (plate) glass is a significant contributor to recycled glass cullet use in Ohio. This industrial (primarily) scrap is much cleaner, and more homogeneous than container glass, and is primarily flint. As a result it can e blended with container glass to meet the specifications of most glass bmanufacturers. DSM was unable to obtain a detailed breakdown of current use of plate glass versus container glass from the glass manufacturers for two reasons. First with the exception of the Rumpke facility, all of the glass processors process plate and container glass, and often mix container glass and plate glass cullet together. Second, one out‐of‐state glass processor selling into Ohio was unwilling to disclose information on the mix of plate and container glass cullet, and two in‐state processors process relatively small quantities of source separated recycled container glass which they often mix with plate glass cullet. Therefore the data reported on current use and potential future use should be assumed to be a mix of
herwise noted.
1
Neither OC plant currently uses container glass, only plate glass.

3 PageOhio Glass Recycling Study FINAL REPORT, May 31, 2011
DSM has also concentrated on increasing the supply of in‐state glass cullet, recognizing that it will be difficult to source sufficient glass from Ohio (as detailed in his report), and that additional, out‐of‐state supply will be necessary to augment in‐tate supply. ts Demand for Cullet for the Production of Container Glass The O‐I plant in Zanesville produces only clear (flint) bottles, thus the supply of cullet must be 95 percent or greater flint. Total current annual throughput is roughly 200,000 (rounded) tons per year, of which roughly 18 percent (36,000 tons) is cullet. However, a significant portion of this cullet is “prompt (plant) scrap” rom rejected bottles during production, with only 20,000 (rounded) tons being fcullet from outside of the plant. O‐I has a corporate goal to increase the use of recycled cullet to 60 percent of throughput. Assuming that the quantity of process rejects (plant scrap) remains elatively the same, reaching the 60 percent cullet goal would require another 4,000 (rounded) tons of recycled cullet (greater than 95 percent flint) per year. r8 Demand for Cullet for the Production of Fiberglass The fiberglass manufacturers did not disclose specific information on their separate plants in Ohio. One plant currently uses roughly 900 tons per month (10,800 tons er year) of recycled container glass. The other two plants use between 50,000 and p60,000 tons of cullet, but no container glass. Based on discussions with both Johns Manville, and Owens Corning, total demand for container and plate glass cullet for fiberglass production in Ohio is assumed to be roughly 145,000 to 165,000 tons of cullet per year. This is based on corporate oals of between 25 and 50 percent recycled glass content, depending on individual roduct specifications and overall company commitments. gp Demand for Cullet for the Production of Glass Beads and Brick/Block Potter Industries uses roughly 25,000 – 30,000 tons per year of recycled float (plate) glass at its Cleveland facility. They report that they do not need an additional supply of cullet. Data are not available on the demand by Whitacre Greer, although ccording to its supplier it is a relatively small amount – less than 1,000 tons per ear. ay Specifications for Container and Fiberglass Manufacturing DSM was provided specifications by all of the container and fiberglass anufacturers. While a number of suppliers of cullet have access to these m
specifications, DSM was asked to not disclose them in this public document. In general, material specifications are important to this analysis for the following reasons. First, source separated glass from industrial sources (plate glass) and container glass collected from source separated drop‐offs is cleaner than commingled glass collected in curbside programs (either dual stream or single stream). As a result, processing costs to reduce ceramics, organic contamination,

Page 4 O
hio Glass Recycling Study FINAL REPORT, May 31, 2011
and metals are lower for source separated glass than for “three mix” glass produced from materials recovery facilities. Both the container glass and the fiberglass industries have relatively low tolerances for organic materials, with specifications of roughly 500 parts per million for total organic contamination, or roughly 1,500 – 3,000 parts per million for “Loss on Ignition” (LOI) measures of organic carbon. As a result, losses during processing of three mix container glass can be as high as 30 percent of incoming loads, although he glass processors interviewed by DSM believe they can reduce these losses to troughly 20 percent of incoming loads. Second, “three mix” glass from curbside collection programs is not marketable to the O‐I container glass plant in Zanesville without color sorting because that plant produces only clear glass bottles, and therefore requires cullet that is a minimum 95 percent flint. For this reason, processing glass collected commingled at the curbside o meet the O‐I specification will necessarily require investment in optical sorting tequipment. Third, while the fiberglass industry can use “three mix” cullet, there is a limit to the amount of reduced glass (primarily amber) which they can tolerate. In the case of the three plants in Ohio, the limit is reported to range between 20 and 40 percent. Pulling large quantities of flint glass out of three mix cullet to supply the O‐I ontainer glass plant could therefore require the addition of plate glass cullet to cassure that the percent amber meets the fiberglass manufacturers specifications. Fourth, ceramics are a significant issue with both container glass and fiberglass. The specification for container glass and for fiberglass is similar, at roughly 40 – 70 parts per million (ppm). It has been reported that recycled glass from bars and estaurants is more likely to be contaminated with ceramics because of the potential rto dispose of ceramic cups and plates with the bar and restaurant glass.2 Finally material size also plays a role in meeting the demand of the manufacturers. One question that needs to be addressed is where in the supply chain should glass beneficiation occur? For example, should the glass manufacturers, who are demanding more cullet, invest in equipment to process recycled glass; or should the nvestment occur at independent glass processors, who will then need to sell the
ssing costs. iresulting clean and sized glass cullet at a higher price to justify the proce For example, ceramics are significantly more of a problem for fiberglass manufacturers when the material is not finely ground (12 – 20 mesh) because of damage to the spinner heads. However, optical sorting, and removal of non‐glass contaminants requires much larger particle sizes (roughly 3/8 – 5/8 size). That means that ceramic contaminant removal and color sorting have to occur before final grinding and screening. Currently this is occurring at the glass processors, not at the glass manufacturer level, and the glass manufacturers are specifying cullet hat is furnace ready, rather than sourcing dirtier pre‐processed cullet (at lower ost) and processing to meet furnace ready specifications. tc
2
Meeting with Ernie Guder, Owens Corning, October 20, 2010.

Page 5
Use of Plant Scrap Both the container glass and the fiberglass plants currently include scrap from the production process in their total reported use of cullet. In the case of O‐I, these bottle rejects represent almost one‐half of current cullet use. Data are not available on the percent of plant scrap used at the Ohio fiberglass plants, although given the recycled content commitments of Owens Corning and Johns Manville, DSM speculates that plant scrap is a significant contributor to total recycled content. Plant scrap has been deducted from potential future demand because it is assumed that these plants will continue to use this material as part of their cullet input. Demand Summary Table 1 presents current use, and potential future demand, exclusive of plant scrap. As discussed above, current use includes both plant scrap, and float (plate) glass. It is likely that each manufacturer is using all available plant scrap, and is trying to reduce the quantity of plant scrap generated at the facility. As such there is no additional supply of this material. Similarly, as discussed in the Supply section below, it is likely that most sources of clean, industrial plate glass have already been identified and are being recycled in Ohio. Therefore, it is a reasonable assumption that most additional demand for cullet is going to have to be met through increased recycling of container glass, with small quantities potentially available from windshield replacement glass and construction and demolition projects, and/or imports of glass cullet from surrounding states. Table 1 Current and Future Demand for Glass Cullet
CurrentUse Low High Color
Industry (tons) (tons) (tons)Glass Bottles 15,000 100,000 100,000 >95% FlintFiberglass 65,000 145,000 165,000 < 20 ‐ 40% AmberOther (Bead and Block) 30,000 30,000 30,000 Mixed
Total: 110,000 275,000 295,000
Difference: 165,000 185,000
Potential Demand
Ohio Glass Recycling Study FINAL REPORT, May 31, 2011

Page 6
PROCESSING (BENEFICIATION) CAPACITY Recycled glass cullet cannot be used until it has been processed to remove ontaminants, and ground to a specific size. In addition, for glass container use, it cmust also be color sorted if it has been collected as mixed color glass. Ohio is fortunate to have significant glass processing capacity, with four processing plants: two Strategic Materials plants in Cleveland and Newark; a Rumpke facility in Dayton which is about to be expanded; and, a large Dlubak facility in Upper andusky. The question is, given the demand for additional cullet, can the existing Splants meet the increased demand, or is additional capacity required. he answer depends on three factors: throughput capacity, residue rates, and the Tcolor sort capacity for three mix glass. DSM has been provided confidential throughput capacity for each of the glass processing plants as well as current residue (loss) rates. DSM has also discussed with the manager of each facility the potential for increasing throughput given either planned plant expansions, or the potential to operate with more than one hift per day. Table 2 sums both current, and potential, input and output for the four sprocessing plants based on data provided to DSM by each of the glass processors. It should be noted when comparing Tables 1 and 2 that sufficient glass processing capacity exists in Ohio to supply current use, based solely on throughput. However, existing in‐state demand is also driven by specifications. One glass processor sells recycled cullet to an OC fiberglass manufacturer outside of Ohio, but not to the two plants in Ohio. The O‐I facility needs flint glass only, and sources significant quantities of cullet from out‐of‐state. And, the Rumpke processing plant, as urrently configured, cannot color sort the three‐mix glass. Therefore, glass cullet is urrently imported to and exported from Ohio. cc Table 2 C(
urrent and Planned Processing Capacity for Glass in Ohio Total tons for four reporting facilities)
Ohio Glass Recycling Study FINAL REPORT, May 31, 2011
ilities 209,000 174,300 275,000 213,000Processing Facility
Current Planned/PotentialInput Output Input Output(tons) (tons) (tons) (tons)
Total, Four Fac Table 2 Notes: (1) Planned capacity based on recent discussions with ODNR. (2) Potential capacity is based on assumed changes in number of shifts per day at two facilities. (3)For source separated materials received, losses are assumed to be 15%, and for three‐mix
of potential input given material losses are assumed to be 30% of current input and 20%
. changes in plant design. (4) Input and output represents estimated in‐state supply only(5) One facility did not report on the potential for expansion.

Page 7 Ohio Glass Recycling Study FINAL REPORT, May 31, 2011
CURRENT GENERATION AND RECYCLING (SUPPLY) OF ONTAINER GLASS IN OHIO C
There are no current data sets available to accurately estimate glass generation in Ohio, or to disaggregate residential and commercial sources of glass. Because relatively accurate estimates are essential to projecting the potential supply of glass n Ohio, DSM has expended significant effort on the analysis of supply, involving the olloif
wing tasks:
• Review Ohio EPA data submitted by the Ohio solid waste districts on current collection and management of container glass for recycling;
• Review the 2003 Ohio waste disposal characterization data, and comparison against more recent waste disposal characterizations for other states (Pennsylvania, Delaware and Connecticut);
• Conduct recovery rate sorting of representative neighborhoods to develop rough estimates of per household generation of glass, and the percent set out for recycling versus thrown away;
• Disaggregate household generation from commercial generation of container glass to determine what percent of glass generation is likely to be from commercial activities (especially bars and restaurants);
• Obtain data on beer, wine and liquor sales for on‐premise consumption (bars and restaurants);
• eer, wine Estimate total units of glass bottles from on‐premise consumption of band liquor based on average bottle size and weight; and,
Estimate the potential supply of plate glass potentially available from •windshield repair and C&D wastes.
he results of these tasks are discussed below. T Review of Ohio EPA Data and Survey on Current Glass Recycling hio EPA compiles solid waste district and recycling facility reports on municipal olidOs
waste recycling and disposal. Recycling data are reported in two ways:
• Recycling facilities report annual quantities handled by material category, as available (e.g. some material is handled commingled so reported as mixed recyclables); and,
Solid Waste Districts report annual materials recycling in the geographic region, •by material category.
oth these data sets were used as a basis for estimating and analyzing glass Brecycling in the State. DSM then conducted telephone surveys of all of the larger materials recovery facilities to verify glass recycling numbers reported, and to determine materials flow, end use and losses. DSM also surveyed all of the larger solid waste districts here data on quantities in the region, or on materials flow, was not clear to verify uantities and materials flow. wq

From these two survey efforts, and follow‐up interviews with glass processors, rokers and end users, DSM was able to estimate annual glass container recycling bfrom Ohio generators last year.3 These results are shown in Table 3. TR
able 3 esidential and Commercial Container Glass Recycling Reported
Residential Commercial TotalReported Glass Recycling (tons) (tons) (tons)Curbside Glass (1) 34,600 4,100 38,700Drop‐off Glass (2) Three Mix 7,740 860 8,600 Separated 2,970 330 3,300
Total Glass: 45,310 5,290 50,6003,79554,395
Additional Glass Recycling Estimate:Total Glass Recycling Estimate:
Table 3 Notes: (1) Commercial curbside glass recycling is based on Ohio EPA MRF facility reports. 2) Drop‐off glass allocated to commercial vs residential is estimated by DSM based on urveys at drop‐offs in other states. (s Based on the research, reported glass recycling in Table 3 is more likely to represent an under‐count rather than over‐count of Ohio glass recycling because some small supplies of glass collected for recycling may have been missed. In addition one processor reported processing more container glass than DSM was able to track. For these reasons, DSM believes the amount of glass recycled may be 5 to 10 percent ore than the amount reported so DSM adjusted the total glass recycling estimate m
up by 7.5 percent. herefore DSM estimates that roughly 54,400 tons were recycled in Ohio last year. his equates to 9.5 pounds per capita. TT Review of Waste Characterization Data DSM reviewed the Ohio waste disposal characterization data (carried out in 2003) and compared the Ohio data with similar waste disposal characterizations from Connecticut, Delaware and Pennsylvania. Table 4 presents the comparison which includes container glass (e.g., glass bottles and jars) as well as other glass (e.g., plate glass and windshield glass).
Page 8 Ohio Glass Recycling Study FINAL REPORT, May 31, 2011
3 Surveys were conducted in November through December 2010 and Ohio EPA MRF facility data was available for CY 2009.

Page 9
Table 4 Municipal Solid Waste Composition Results for Glass from Select States, and Ohio
Residential Commercial Total Glass (1) Population DisposedState Study Year (%) (%) (%) (tons) (pop) (lbs/cap/yr)Connecticut 2008 2.2% 2.0% 2.1% 51,065 3,501,252 29Delaware 2006‐07 3.2% 2.0% 2.4% 26,864 850,366 63
Ohio Glass Recycling Study FINAL REPORT, May 31, 2011
03 4.7% 465,550 11,542,645 8146
Ohio 20Pennsylvania 2001‐02 3.3% 1.8% 3.0% 282,316 12,290,000
Table 4 Notes:
(1) Published in report, or in the case of Ohio, calculated as a percent of 2009 MSW tons disposed, as reported by Ohio EPA.
study to compute per capita disposal estimate for that year, (2) Population shown is year ofxcept for Ohio where 2009 is used. 3) Data sources are footnoted.e( 4
Table 4 illustrates that Ohio may dispose of more glass per capita than other states where recent waste characterization data are available. Ohio also has the highest fraction of the waste stream represented by glass. However because the study methodology may vary from state to state, and because Ohio has likely expanded access to recycling since 2003, these totals were used as only one method to estimate total glass generation. It should be noted that Connecticut is a bottle bill state and therefore should have lower glass disposal rates given typically higher recovery rates for beverage containers in bottle bill states. Delaware was also a bottle bill state at the time of the waste characterization, although the Delaware ottle bill was not as effective as in other states because it excluded aluminum everage containers. bb Residential Sorting for Recovery Rate Estimates One of the key components of DSM’s research was to conduct recovery rate sorting of recyclables collected from representative households across different income neighborhoods in Ohio. The purpose of these recovery rate sorts was to better understand what percent of glass is likely to be generated by households as opposed to commercial activities,5 and what percent of glass is currently being captured on the recycling truck versus disposed (e.g. collected on the refuse truck). The recovery
dies used for this analysis included:
• , Ohio 4 Stu
Engineering Solutions and Design. State of Ohio Waste Characterization StudyDNR. April 2004.
• RW Beck. Statewide Waste Composition Study. Pennsylvania Department of Environmental Protection. April 2003.
• d DSM, Cascadia, MSW Consultants. Connecticut State‐wide Solid Waste Composition anCharacterization Study, Final Report. May 26, 2010.
• DSM, Cascadia, MSW Consultants. Delaware Solid Waste Authority State‐wide Waste Characterization Study, 2006‐2007. Final Report, October 31, 2007.
5 One of the limitations of waste characterization studies is that a significant amount of residential waste is typically characterized as “commercial waste” during the ampling because it is coming in on trucks that collect business waste mixed with ontainer waste from apartments and other multi‐family households. sc

Page 10 Ohio Glass Recycling Study
tal weight of each material in the recycling as a percentage of the total weight of
FINAL REPORT, May 31, 2011
the five routes sampled. To calculato
rate sorts also provide another source of information on the mix of colors of residential glass, when compared to commercial glass. Recovery rate sorting was carried out over five days on five different Rumpke refuse and recycling collection routes. Two of the routes were located in Franklin County (Worthington and Hilliard), one route in the City of Delaware (Delaware County), nd two routes were located in Montgomery County/Dayton (Harrison Township aand Englewood). These five routes were specifically chosen by Rumpke (with DSM’s input) to represent varying neighborhood demographics typical of Ohio. Four of the routes had parallel curbside collection of recyclables and refuse. The City of Delaware route as refuse collection only, and households along that route can recycle using drop‐w
off recycling centers. DSM followed a random sampling process to ensure representative samples were obtained from each route. For each route, DSM obtained a total count of households served. From this count, DSM selected the “nth” household to create a random sample of approximately 40 households that was representative of the entire route. e.g., if the route size was 400 households, then DSM collected both refuse and (recyclables from every 10th set out). Rumpke provided two trucks to collect the curbside samples; one truck collected the curbside refuse set‐outs while another truck followed the refuse truck and collected the recycling set‐outs from the same households if they were available. DSM employees rode inside the refuse and recycling trucks to ensure the sample was andomly selected and not influenced by the driver, and that the entire set out (both rrefuse and recycling) was included in each sampled household. After the sample was collected, the trucks drove back to the Rumpke facility and weighed in before dumping their load in the designated sorting area. The truck ould then weigh out once the load was dumped, giving DSM an accurate weight of w
both the refuse and recycling samples collected. DSM trained enumerators sorted through the refuse pulling out and weighing all categories of material by material type (e.g., clear glass beverage containers, clear glass food containers, etc.). Once the refuse pile was sorted, the enumerators sorted through the recyclable sample, sorting recyclables by material type and weighing each material. The resulting sort data were used to calculate a recovery rate by recyclable material (i.e., what percent of the recyclable material was found in
l the refuse set outs as opposed to the recycling set outs), as well to determine totaglass disposal (and glass disposal by color), by household for each route sampled. The data were then annualized (multiplying by 52 weeks) to account for weekly collection, and the data across the five routes averaged to derive a rough estimate of er household generation of glass, by color, and to evaluate current recovery rates pfor glass on refuse and recycling routes.[1] Table 5 presents the range and average for recyclables recovery by material over
te the recovery rate for each sample route, the
[1] DSM does not represent that the data collected are statistically representative of household generation in Ohio, only that the samples were statistically representative of household behavior on the particular routes sampled.

Page 11
the material in both the refuse and recycling was calculated, and is shown as a percentage. Table 5 illustrates that recovery rates for glass on routes with curbside collection of refuse and recycling averaged 50 percent. Table 5 Recovery Rate Results of Rumpke Sorts (1)
Weds Thurs Fri Tue Weds Average
Recovery Recovery Recovery Recovery Recovery RecoveryRate Rate Rate Rate Rate Rate
Material Categories (%) (%) (%) (%) (%) (%)Clear Glass ‐ Food/Beverage NAClear Glass ‐ Beverage NA 40% 100% 47% 39% 56%Clear Glass ‐ Food NA 74% 61% 8% 19% 41%Amber Glass NA 48% 93% 31% 23% 49%Green Glass NA 52% 97% 86% 0% 59%Plate Glass NA 0% 0% 0% 0% 0%
Subtotal, Glass: 52% 90% 31% 26% 50%
PET ‐ Beverage NA 51% 86% 28% 37% 51%PET ‐ Food NA 56% 53% 0% 30% 35%HDPE Containers NA 68% 82% 29% 31% 52%Aluminum Cans NA 35% 73% 3% 25% 34%Bi‐metal Cans NA 39% 54% 8% 11% 28%Newspaper NA 72% 93% 33% 64% 66%Cardboard NA 61% 65% 37% 50% 53%Mixed Paper
ToNA 35% 50% 19% 23% 32%
Rumpke Recovery RatesColumbus Dayton
tal Recyclables 51% 75% 24% 34% 46% Table 5 Notes: 1) The City of Delaware (Wednesday route) is a refuse only route and therefore the recovery (rate could not be calculated. Contamination of the recyclable materials was also measured by weighing the residuals after sorting and weighing all recyclable materials. This issue is peripherally important to this analysis in that it is often assumed that single stream recycling results in very high contamination rates that negatively impact on processing of recyclables. Because single stream collection of curbside recyclables is ne of the options analyzed for this report, it is helpful to know whether this should obe a significant concern for Ohio. As Table 6 illustrates, contamination rates averaged 8.2 percent for the four routes, which is significantly lower than reports in the literature of single stream contamination rates as high as 20 – 30 percent. Only one route ‐ the Englewood Route on Wednesday in Dayton contained double‐digit contamination, while two outes had contamination rates of about three percent which is as low as one would xpect from dual stream collection systems. re Table 6 Contamination Rates of Rumpke Route Sorts
TotalThurs Fri Tue Weds Average
8.1% 2.7% 3.0% 19.0% 8.2%
Columbus Dayton
Ohio Glass Recycling Study FINAL REPORT, May 31, 2011

ge 12
Table 7 presents estimated annualized per capita and per household generation of each recyclable material calculated by summing what each sample household set out for recycling and what they set out in their waste container and then multiplying by 52 weeks (all routes sampled had weekly collection). Based on the recovery rate sorting, each household generates three pounds of glass per week, which can be converted to an annual per capita generation (based on census statistics for average household size in Ohio) of 63 pounds of glass per person per year. It is also mportant to note that glass comprises 21 percent of the weight of all of the irecycling materials. Table 7 probably understates the quantity of non‐container glass found in residential waste because most non‐container glass is found in durables which are often not set out with residential refuse. These materials are often disposed as part of a clean out, mixed with construction waste, or treated as bulky or special waste and handled in a separate trip. Table 7 Per Household and Per Capita Generation of Recyclable Materials (Weekly and Annual Pounds Setout, All Routes Sampled)
Ohio Glass Recycling Study FINAL REPORT, May 31, 2011
5.01 261 106
Recyclable Material
Weekly Annual AnnualPounds per Pounds per Pounds perHousehold Household Capita
(lbs) (lbs) (lbs)Clear Glass ‐ Beverage 0.57 30 12Clear Glass ‐ Food 0.45 23 9Amber Glass 1.56 81 33Green Glass 0.41 21 9Plate Glass 0.02 1.2 0.5
Subtotal, All Glass: 3.01 157 63PET Beverage 0.48 25 10PET Food 0.11 5 2HDPE Containers 0.50 26 11Aluminum Cans 0.38 20 8Bi‐metal Cans 0.54 28 11Newspaper 3.02 157 64Cardboard 1.16 60 24Mixed Paper
Total, All Recycling: 14.22 739 299 Table 7 Notes:
(1) Weekly pounds were calculated by dividing the sample weight by the number of households sampled.
(2) Annual pounds were calculated by multiplying the weekly household weight by 52 weeks, the collection frequency for each route.
(3) nnual pounds per capita were calculated by dividing the household weight by 2.47 sehold size in Ohio.
Apersons, the average hou
Pa
Table 8 presents the composition of the samples collected in the context of total waste and recyclables set out at the curb for disposal and recycling. Table 8 was created by summing refuse and recycling quantities for each day and dividing the weight of each material by the total sample weight. Table 8 illustrates that, on average, total recyclables (containers and paper) represent 30 percent of total

Page 13
household waste; and that glass containers represent an average of 6.4 percent of total household waste from the sampled households. A breakdown of the composition of each sample by refuse and by recycling is shown in Appendix A. Table 8 Composition of Total Material (Refuse and Recycling) by Route Sample
Wed Thu Fri Tue Wed All
Refuse Total Total Total Total Total
Material Categories (%) (%) (%) (%) (%) (%)Clear Glass ‐ Food/Beverage 2.4% 2.7% 2.0% 1.4% 2.3% 2.2%Clear Glass ‐ Beverage 1.5% 0.9% 0.6% 1.6% 1.1%Clear Glass ‐ Food 1.2% 1.1% 0.8% 0.7% 0.9%Amber Glass 2.5% 2.6% 4.0% 4.0% 3.4% 3.3%
Green Glass 0.8% 1.9% 1.2% 0.2% 0.2% 0.9%
Plate Glass 0.2% 0.0% 0.0% 0.0% 0.0% 0.0%
Subtotal, Glass: 5.9% 7.2% 7.2% 5.6% 5.9% 6.4%
PET Containers ‐ Food/Beverage 1.2% 1.5% 1.0% 1.6% 1.0% 1.3%
PET ‐ Beverage 1.3% 0.7% 1.3% 0.8% 1.0%
PET ‐ Food 0.2% 0.2% 0.3% 0.2% 0.2%
HDPE Containers 1.0% 1.6% 0.7% 1.3% 0.8% 1.1%
Aluminum Cans 1.0% 1.1% 0.4% 0.9% 0.6% 0.8%Bi‐metal Cans 1.4% 0.7% 0.9% 1.8% 1.1% 1.2%
Subtotal, Plastic & Metal: 4.5% 5.0% 2.9% 5.6% 3.5% 4.3%
Newspaper 4.5% 8.5% 9.2% 4.3% 5.1% 6.3%Cardboard 2.9% 2.5% 2.7% 2.0% 1.9% 2.4%Mixed Paper 9.4% 14.7% 8.7% 10.1% 10.2% 10.6%
Subtotal, Paper: 16.7% 25.7% 20.6% 16.5% 17.2% 19.3%Total Recyclables 27.2% 37.9% 30.8% 27.7% 26.6% 30.0%
Ohio Glass Recycling Study FINAL REPORT, May 31, 2011
All Other ‐ residuals and refuse 72.8% 62.1% 69.2% 72.3% 73.4% 70.0%Total: 100.0% 100.0% 100.0% 100.0% 100.0% 100.0%
Columbus Dayton
Percent of Composition
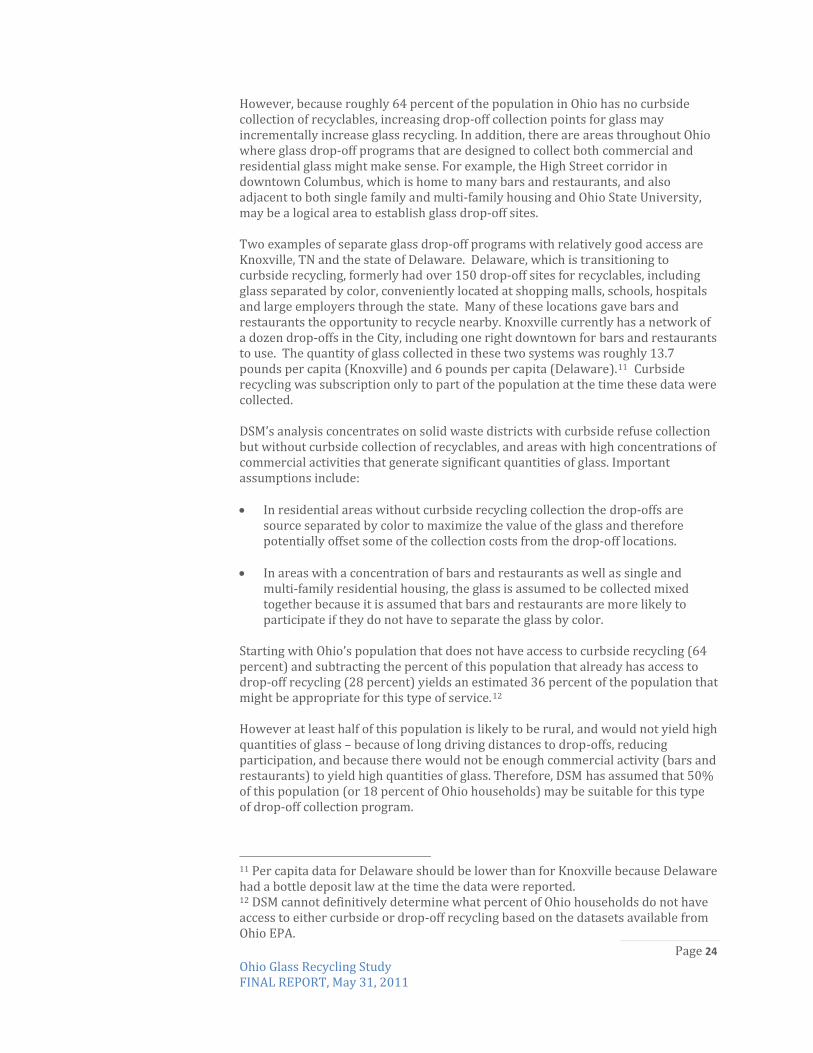
Finally, Figure 1 illustrates that majority of the glass DSM sorted from the sampled households was amber glass (typically beer bottles), while clear glass comprised 34% of all of the glass. The percent of amber glass is higher than reported from samples of mixed glass coming out of the Rumpke glass processing facility, where mber ranged from 35 – 40 percent of the three‐mix glass and flint averaged 42 apercent. DSM believes that the Ohio container glass color mix is roughly 42% flint, 39% amber, and 19% green when accounting for both residential and commercial sources, as discussed in more detail below.

Page 14
Figure 1 Percent of Glass by Color Available Curbside Based on Limited Sample
Sales Data and Literature Research DSM conducted additional literature research, and worked with the Wholesale Beer and Wine Association of Ohio to finalize DSM’s estimates of total generation of glass ontainers and other glass in Ohio and to estimate on‐premise and commercial ccontainer glass generation. First, DSM reviewed the literature and DSM benchmark data on glass generation. This included EPA’s annual characterization of materials generation in the United States, recent Rhode Island and Vermont studies, Delaware’s disposal and recycling reports, and California’s published beverage container sales and return data. The goal was to normalize the data and compare estimated per capita pounds of glass enerated across states, and nationwide. These results are shown in Table 9 on a er capita basis. gp Table 9 P(
er Capita Beverage Container Glass and Total Glass Generation Lbs/Capita/Year)
50.2 12.7 13.8 76.7
Beverage Food Other TotalState/Region Year (lbs) (lbs) (lbs) (lbs)Rhode Island 2008 70.6 15.4 86.0Delaware 2006‐07 82.4Vermont 2006 85.3 NACalifornia 2009 56.4 NAUS (EPA Data) 2008 52.3 13.7 13.8 79.8
Ohio Glass Recycling Study FINAL REPORT, May 31, 2011
US (EPA Data) 2009 Table 9 Sources: DSM Environmental Services. Analysis of Beverage Container Redemption System Options to
de Island. Rhode Island Resource Recovery Corporation. Increase Municipal Recycling in RhoFINAL REPORT, May 2009.
Solid Waste Authority Statewide Waste ort, October 31, 2007.
DSM, Cascadia, MSW Consultants. Delaware . Final Repy Council Annual Reports, 2007, 2008 and 2009.
Characterization Study, 2006‐2007Delaware Recycling Public AdvisorDSM Environmental Services, Inc. Extended Producer Responsibility For Packaging in Vermont. March 26, 2010 State of California. California Biannual Report of Beverage Container Sales, Returns, Redemption, and Recycling Rates. 2009.

Page 15
U.S. EPA. and Figure.S. EPA. Municipal Solid Waste Generation, Recycling, and Disposal in the United States: Facts nd Figures for 2008.
Municipal Solid Waste Generation, Recycling, and Disposal in the United States: Facts s for 2009.
Ua Because glass packaging and other glass generation is likely to vary from state to state based on socio‐economic factors, distribution networks and consumer references, DSM was particularly interested in looking at sales and other data pspecific to Ohio. To accomplish this, DSM estimated glass liquor bottle generation (in tons) based on published data on gallons of liquor sold in Ohio (2009) and the percentage packaged in glass (estimated at 70 percent) as opposed to PET.6 Applying an average container weight to a liquor bottle enabled DSM to estimate total tons of glass enerated from liquor bottles. DSM estimates that roughly 22,300 tons of liquor gbottles were consumed in Ohio in 2009. DSM also worked with the Wholesale Beer and Wine Association of Ohio to estimate otal sales of beer and wine in glass bottles and to convert sales to pounds of glass tgenerated. The results of these two efforts are shown in Table 10 on a per capita and total tons basis. Food containers and jars were added assuming food containers and jars epresent 17% of total glass containers, consistent with US EPA MSW haracterization data for glass packaging in 2008 and 2009. rC Table 10 Per Capita and Total Estimated Glass Container Generation Based on Sales Data and Container Weight Estimates for Ohio (200910)
Per Capita Ohio TotalBeverage and Food Containers (lbs) (tons)Wine, Beer and Other Beverages 60 344,350Liquor 4 22,292
Ohio Glass Recycling Study FINAL REPORT, May 31, 2011
and Jars 13 73,32876 439,971
Food ContainersTotal:
Tab e 10 Notes: 1) This table excludes all non container glass. 2) Food containers and jars assumed to represent 17% of total.
l((
Estimating Total Generation of Glass 6 Elizabeth Lessner, owner of multiple bars and restaurants in Central Ohio confirmed that 750 ml bottles are primarily used, and Jan Ciemiecki, the Retail Operations Director for VT, estimated that 25% of liquor sales are on‐premise sales (bars and restaurants) and that liquor sold in glass bottles represent about 70% of bottle sold. There were 10.8 million gallons of spirituous liquor sold in Ohio in 2010. Assuming the majority was sold in 750 ml bottle (weighing an average of 530 grams per bottle), approximately 54.5 million bottles representing roughly 22,300 ons of were sold in Ohio in 2010, of which roughly 5,600 tons (25%) was sold for n‐premise consumption. to

Page 16
Table 11 compares per capita glass generation in Ohio based on the literature review and the Ohio specific estimates, as discussed above. Note that the waste characterization data for Ohio (far right column) provides only a total, and does not break out glass by type. Table 11 Estimates of Annual per Capita Glass Generation from Sorts, Sales Data and Waste Characterization Data
Ohio Glass Recycling Study FINAL REPORT, May 31, 2011
9.4 90
Sort Data (1)
Sales Data (2)
Waste Comp Current Total(Disposal) Recovery Generation (3)
Residential (lbs) (lbs) (lbs) (lbs) (lbs)Container Glass Beverage 53 48 Food 9 13Plate Glass 0.5 NA NATotal, Residential: 63 60 8.5
Commercial Container Glass (4) 16 16 0.9Other Glass NA NA
Total Glass: 79 76 81
Tab e 11 Notes:
l
(1) Sort Data from Table 7, except for Commercial Glass. (2) From Table 10.
(3) Waste Comp Disposal estimate is added to Current Recovery estimate for Total Generation.
4) Estimated to be 25% of total container glass sales per discussions with Wholesale Beer and Wine Association of Ohio.
(
hile the three per capita estimates appear to be roughly equivalent, there are
r. Wthree differences that need to be accounted fo irst, the sort and sales data columns are for container glass only, while the waste
s (plate and conFcomposition data column includes all glas tainer). Second, the sort and sales data represent total generation (including what is ultimately disposed and what is ultimately recycled) while the waste composition ata represents net generation (that portion of the glass disposed), leaving out the
recycled (exclus trial glass). droughly 10 pounds per capita currently ive of post indus hird, the sort and sales data represent circa 2010 data, while the waste Tcomposition data represents circa 2003 glass disposal. Table 12, below, adjusts for these differences and presents DSM’s best estimate of total glass generation for commercial and residential glass, and current recovery; and then calculates a recovery rate for glass for Ohio or roughly 11 percent.

Page 17
Table 12 Total Glass Generation, By Sector and Type, and Est. Current Recovery in Ohio (2009)
OFINAL REPORT, May 31, 2011
mated Recovery:
AveragePer Capita Total
Residential (lbs) (tons)Container Glass Beverage 51 292,000 Food 11 64,000Plate Glass (1) 6 35,000Total, Residential: 68 390,000
Commercial Container Glass (2) 16 92,000Other Glass (3) 6 35,000Total Commecial: 22 126,000
Total Glass: 90 517,00054,39511%
Recovery, from Table 3:Esti
Table 12 Notes:
(1) Estimated at 12 lbs per capita, based on EPA data and assuming 50% is residential. lass. EPA data and assuming 50% is commercial.
(2) Estimated to be 25% of total beverage g3) Estimated at 12 lbs per capita, based on 4) Numbers may not add due to rounding. (( Other Glass Supply Table 12 presents DSM’s best estimate of total glass generation and recycling as part of the municipal solid waste stream. Some additional glass supply may be available in the construction and demolition waste stream, and from discards from industrial plate glass manufacturing. DSM believes, based on interviews with the glass processing facility managers, that the vast majority of post industrial glass waste is already being recovered in Ohio (reflected in the totals in Table 2 ), and therefore does not represent a potential new supply. That leaves two potential new supplies – indshield glass from automobile windshield replacement, and plate glass from w
construction and demolition activities. Each is discussed below. Glass from automobile windshield replacement and dismantling is probably ategorized by the US EPA as durables and part of municipal solid waste generation, c
and therefore accounted for in the “other glass” categories in Table 12. Automotive glass recovery at windshield and other repair shops is a relatively new concept, and may provide a potential new supply of flint glass in Ohio. Currently E.L. Harvey is collecting automotive replacement glass from 36 windshield repair shops in Massachusetts and shipping about 50 tons per month to Dlubak in Ohio.7
usetts can be used to estimate how much
hio Glass Recycling Study
The E.L. Harvey data from Massachwindshield glass could potentially be recovered from Ohio. 7 Telephone conversation with Ben Harvey, E.L. Harvey, January 19, 2010.

18 PageOhio Glass Recycling S
sales into Ohio and typical glass packaging used.
tudy FINAL REPORT, May 31, 2011
• Discussions with the Wholesal
The 2007 economic census lists Ohio as having 339 Auto Glass Replacement establishments while Massachusetts has 209 establishments. Shop size in Ohio is slightly smaller with average gross receipts at $514k as opposed to $741k in Massachusetts. Applying quantities recycled per establishment (1.4 tons per month) n Massachusetts to Ohio establishments, an estimated 5500 tons of automotive iwindshield glass is potentially available from this sector in Ohio. Some construction and demolition glass is included in Table 12, but some additional C&D glass may be disposed of at C&D landfills, and not classified as municipal solid aste. DSM has attempted to estimate the potential supply of this additional glass in w
Ohio using C&D waste composition data from other states. Data on C&D waste composition indicates that glass is a relatively small source of potential supply at 0.6 percent or 769 tons disposed at Delaware (DSWA) landfills, and 1.1 percent from California targeted C&D waste studies.8 Assuming that glass represents one percent of C&D waste in Ohio, and assuming that glass from C&D waste imported to Ohio landfills would not be recoverable, DSM estimates that roughly 16,700 tons of Ohio generated C&D glass is disposed in Ohio. Assuming that 25 percent is potentially recoverable (because most glass would be broken and not vailable for recovery in most C&D processing facilities), roughly 4,200 tons of Ohio aC&D glass might be available for recovery. Given the estimated 462,600 (rounded) tons of glass potentially available from municipal solid waste – primarily container glass, it is obvious that even aggressive indshield and C&D recovery programs would represent a relatively small fraction w
of total potential glass supply in Ohio. Finally CRT glass is a growing area of recycling that was not examined as part of this nalysis. However Dlubak Glass located in Ohio does accept and process this aterial from electronic recyclers in Ohio and in other states.
am Glass Generation, By Color As stated above, container glass manufacturers need consistent sources of single color glass. In addition, there are limits to the quantities of amber which can be sed in fiberglass manufacturing. These two factors present an additional challenge, uover and above simply finding sufficient supply of new cullet. he color mix of glass generated in Ohio was investigated by DSM by looking at hreTt
e sources:
• DSM sort data (Table 8) which estimates generation from curbside residential customers (but that may be low in plate glass, due to both the limited sample
e size and any restrictions on bulky good set outs that may be present on the fivroutes);
• Review of the literature looking for data that may be pertinent to Ohio’s glass supply; and,
e Wine and Beer Association about distributers
8 Sources: Delaware Waste Characterization Report; and, Detailed Characterization of Construction and Demolition Waste, June 2006. CA EPA, Integrated Waste Management Board.)

Page 19
After reviewing these three sources of data, DSM estimated the total tons of flint, amber and green glass potentially available by container type. These results are shown In Table 13. Table 13 illustrates the importance of beer to the total amber supply, which may explain the high fraction of amber found in DSM’s residential recovery rate analysis. While this might potentially be of concern to fiberglass manufacturers, it should be noted that almost all of the industrial plate glass is flint, hich can be used to mix with amber if the quantity of reduced (amber) glass xceeds a fiberglass manufacturers’ specification for amber. we Table 13 Estimated Glass Generation in Ohio, By Color
Flint Amber Green TotalGlass (tons) (tons) (tons) (tons) Food 64,000 0 0 64,000 Beer and Soda 64,000 192,000 22,000 278,000 Wine 4,000 4,000 74,000 82,000 Liquor 22,000 1,000 1,000 24,000 Other Glass 62,000 3,000 3,000 68,000
Total 216,000 200,000 100,000 516,000
Ohio Glass Recycling Study FINAL REPORT, May 31, 2011
e 42% 39% 19%Percentag T(
ab e 13 Notes: 1) Numbers may not add due to rounding.
l

Page 20 Ohio Glass Recycling Study FINAL REPORT, May 31, 2011
MASS BALANCE ANALYSIS OF THE CURRENT GLASS
RECOVERY SYSTEM It is instructive in analyzing the potential to significantly increase recovery of glass in Ohio to understand how the current glass recovery system works in Ohio. DSM focused on container glass in estimating current recovery. This included surveying andlers and processors of commingled materials to determine the end users of
arate. hglass processed through materials recovery facilities, as well as glass kept sep DSM visited glass processors and end users to better understand processing methods, quality control and contamination issues, and the specifications required by end users. This included site visits to: Strategic Materials facilities in Cleveland and Newark; Rumpke’s facilities in Columbus and Dayton; the Owens Corning, Newark plant; and, the Owens‐Illinois Zanesville plant. While DSM did not conduct a site visit to the Johns Manville fiberglass manufacturing facility, or the Dlubak glass rocessing facility, meetings were held with representatives from Johns Manville, pand a telephone interview was conducted with a representative from Dlubak. DSM also attempted to locate and survey other glass processors and end users in the egion who were handling Ohio material to better understand their supply and
s. rpotential demand. This included CAP Glass (Pennsylvania) and Potters’ Industrie Using data gathered from interviews during these site visits and from telephone surveys, DSM was able to refine estimates of current recovery and make rough estimates of the quantity of container glass flowing to in‐state and out‐of‐state glass processors and end users, as well as the material losses that occur in glass processing. For example, glass may be collected in Ohio and transported to Pennsylvania for processing and then shipped back to an Ohio end market from the ame processor. Conversely, glass may be collected and processed in Ohio and then sshipped to an out‐of‐state end user. Because not all glass handlers and processors would share information, Figure 2 should be regarded as a rough estimate for container glass recovery materials flow. n addition, quantities processed and material losses vary from year to year – these Ifigures represent 2009‐2010 estimates. Finally, some material that is currently processed and used out of state is likely to ove to in‐state processing and end use in 2011, based on an increase in processing m
capacity in the State and with partial support from ODNR. Note that the losses shown in Figure 2 are important because they represent glass hat cannot meet specifications for end products such as fiberglass, container glass tand the bead industry. Finally, in reviewing Figure 2 it should be noted that already more glass that was processed out of state last year is now being processed in state at Rumpke’s Dayton facility.

Page 21 Ohio Glass Recycling Study FINAL REPORT, May 31, 2011
Figure 2 Mass Balance of Current Recovery (2009 Recovery Estimates)
9%800
19% 81%
7,600 33,000
Losses (1) Produced Losses (1) Losses In‐State ProducedOut‐of‐State Produced
15% 85% 20% 29% 27% 44%
600 3,400 1,700 9,500 8,900 14,600
IN STATE (2)
Aggregate, Sand and Other37%
20,200
Figure Notes: (1) Estimated losses based on data from other facilities, and estimated at 15% for source separated material.(2) End Uses Instate estimate (e.g. 19,200 tons) come from instate source separated, 3 mix and commingled processed glass generated in Ohio.(3) End Uses Out of State estimate (e.g. 14,600 tons) come from instate commingled processed glass generated in Ohio.(4) End Uses In State estimated (e.g. 20,200 tons) come from instate and out of state 3 mix and commingled glass generated in Ohio.(5) Small quantities of this material flows out of state.(6) Numbers may not add due to rounding.
6,900
8,400
80%
19,200
INSTATE OUT OF STATEContainers, Fiberglass, and Other
14,60036% 27%
Containers, Fiberglass, and Other
TOTAL ESTIMATED GLASS DIVERSION, IN TONS (Rounded)54,000
Aggregate, Sand, and Other
17%Three Mix
9,400
Commingled75%
40,600
91%
Source Separated, By Color7%
4,000
8,600
Produced
BENEFICIATIONCRUSHING, SIZING AND
MIXING
COLLECTION
MRF PROCESSING`
OPTICAL SORITNG
OPTICAL SORITNG
END USES

Page 22 Ohio Glass Recycling Study FINAL REPORT, May 31, 2011
ANALYSIS OF ALTERNATIVE STRATEGIES TO INCREASE HE SUPPLY OF RECYCLED GLASS IN OHIO T
DSM’s analysis of the demand for glass cullet in Ohio illustrates that there is a significant shortfall between what the Ohio glass industry (container and fiberglass) can use and the supply of recycled glass currently collected by municipalities and private waste haulers. As discussed in previous sections of this report, it is likely that most of the industrial scrap glass (plate and windshield) is already being ollected, and that any significant increase in future supply will have to come cprimarily from increased collection of container glass. SM has been tasked with an analysis of a series of strategies that are potentially vaiDa
lable to bridge this gap. These strategies include:
• f locations Source separated collection of glass by color using glass drop‐of
• throughout Ohio; Keeping glass separate on the single stream collection vehicles;
• Enactment of glass recycling programs for bars and restaurants (on‐ premiseconsumption);
• Construction or conversion of one or more facilities in Ohio to process three‐eet container cullet mix glass from expanded single stream recycling to m
specifications; and, • Enactment of beverage container deposit legislation. description of each strategy, followed by DSM’s analysis of the potential for ncreasing the supply from each of these strategies is presented below. Ai It is important to note here that DSM’s primary task was to assess the potential demand and supply of recycled glass. While DSM has provided very rough estimates of the potential cost of each alternative, the detailed analysis of costs necessary to guide future State and private investments in creating additional supply is beyond the scope of this analysis, but would be the logical followup to this report. One of the primary reasons for the lack of supply of glass cullet in Ohio is that current market prices are insufficient to attract the additional supply. If the glass manufacturing industries in Ohio want large increases in glass cullet supply they are going to have to adjust their payments to attract this glass. As the following analysis illustrates, in many cases it is simply too expensive to eparate, transport and process glass cullet given the value of the resulting ullet, when compared to managing the glass as refuse and landfilling it. sc Assumptions for Analysis One key to increasing the supply of recycled container glass is to increase access to parallel recycling collection in Ohio for all recyclables. DSM worked with Ohio EPA to develop a list of municipalities with municipally sponsored curbside recycling collection, those with subscription collection, and those with drop‐off collection only. DSM also attempted to identify those municipalities that had dropped glass recycling from their curbside collection programs.

From this research, supplemented by limited telephone surveys, DSM developed the following estimates for use in this analysis. First, roughly 36 percent of the State’s population is estimated to have access to curbside glass recycling collection, as shown below in Table 14. Access is defined as subscribing to service (and paying the subscription price), or being provided curbside collection of recyclables as part of the refuse collection system (whether or not the household participates, the household has the option to participate for no charge). Table 14 Population Served By Curbside Recycling
Population in Collection Region
Percentage Served by Recycling Collection
Total Population Served
Percent of State Population
Curbside Recycling Service (persons) (%) (persons) (%)Municipal Curbside 5,347,640 75% 4,010,730 35%Subscription Curbside 2,294,434 5% 114,722 1%
Curbside Population 4,125,452 36%
Second, roughly 28 percent of the state is estimated to have access to drop‐off glass recycling. Access to drop‐off recycling is harder to define but was derived from dding together the district populations that have drop‐off recycling and subtracting
aout any that do not accept glass at their drop‐offs. Finally, the balance of the population, roughly 36% either do not pay for and subscribe to curbside recycling, or do not have easy access to glass recycling ecause their program does not include glass, or because there are no easily ccessible drop‐off recycling locations. ba Source Separate Collection of Glass by Color Using DropOffs Keeping glass separated by color, and from other materials, at the source can theoretically yield the highest quality glass cullet for both container glass and fiberglass manufacturers. Drop‐off collection of glass is relatively common in Western Europe; however it is not clear how effective drop‐off collection of source eparated glass would be in Ohio given the much lower population density and a slack of such programs in the United States. DSM’s data from surveys of drop‐off recycling in Columbus indicate that roughly 8 percent of households with curbside refuse collection were participating in Columbus’s drop‐off recycling program in 2008.9 Therefore it is unlikely that a system that relies on drop‐off recycling of residential glass will be sufficient to supply significant quantities of glass in areas where curbside collection of refuse is the norm. The Medina County drop‐off program for glass confirms this assumption ‐ the County is recovering roughly 4.3 pounds per household of glass (when ompared to average household generation of 68 pounds – see Table 12, above) rom their glass drop‐off program.cf 10
Page 23Ohio Glass Recycling Study
FINAL REPORT, May 31, 2011
9 Data from drop‐off surveys in the City of Columbus, 2008. 10 Based on data reported to DSM of total tons of glass recovered from the drop‐offs and a County population of roughly 170,000.
Page 24Ohio Glass Recycling Study FINAL REPORT, May 31, 2011
However, because roughly 64 percent of the population in Ohio has no curbside collection of recyclables, increasing drop‐off collection points for glass may incrementally increase glass recycling. In addition, there are areas throughout Ohio where glass drop‐off programs that are designed to collect both commercial and residential glass might make sense. For example, the High Street corridor in downtown Columbus, which is home to many bars and restaurants, and also djacent to both single family and multi‐family housing and Ohio State University, amay be a logical area to establish glass drop‐off sites. Two examples of separate glass drop‐off programs with relatively good access are Knoxville, TN and the state of Delaware. Delaware, which is transitioning to curbside recycling, formerly had over 150 drop‐off sites for recyclables, including glass separated by color, conveniently located at shopping malls, schools, hospitals and large employers through the state. Many of these locations gave bars and restaurants the opportunity to recycle nearby. Knoxville currently has a network of a dozen drop‐offs in the City, including one right downtown for bars and restaurants to use. The quantity of glass collected in these two systems was roughly 13.7 pounds per capita (Knoxville) and 6 pounds per capita (Delaware).11 Curbside ecycling was subscription only to part of the population at the time these data were rcollected. DSM’s analysis concentrates on solid waste districts with curbside refuse collection but without curbside collection of recyclables, and areas with high concentrations of ommercial activities that generate significant quantities of glass. Important ssuca
mptions include:
• In residential areas without curbside recycling collection the drop‐offs are ource separated by color to maximize the value of the glass and therefore spotentially offset some of the collection costs from the drop‐off locations.
• In areas with a concentration of bars and restaurants as well as single and multi‐family residential housing, the glass is assumed to be collected mixed together because it is assumed that bars and restaurants are more likely to participate if they do not have to separate the glass by color.
Starting with Ohio’s population that does not have access to curbside recycling (64 percent) and subtracting the percent of this population that already has access to rop‐off recycling (28 percent) yields an estimated 36 percent of the population that dmight be appropriate for this type of service.12 However at least half of this population is likely to be rural, and would not yield high quantities of glass – because of long driving distances to drop‐offs, reducing participation, and because there would not be enough commercial activity (bars and restaurants) to yield high quantities of glass. Therefore, DSM has assumed that 50% f this population (or 18 percent of Ohio households) may be suitable for this type f drop‐off collection program. oo
11 e Per capita data for Delaware should be lower than for Knoxville because Delawarhad a bottle deposit law at the time the data were reported. 12 DSM cannot definitively determine what percent of Ohio households do not have access to either curbside or drop‐off recycling based on the datasets available from Ohio EPA.

25
Using Knoxville, TN quantities recovered as an example (at 13.7 pounds per capita), adding glass drop‐offs for the 18 percent of Ohio’s population currently not served is estimated to yield an additional 14,400 tons (rounded) of material as shown below in Table 15. Table 15 Estimate of Potential Additional Material Recycled by the Addition of New Dropoff Recycling Sites Additional Glass Supply Population Served (18%) 2,110,012
Page Ohio Glass Recycling Study FINAL REPORT, May 31, 2011
ed 13.7Lbs/capita collectTons Collected: 14,418
ab e 15 Notes: 1) The estimate of 13.7 lbs per capita is taken from Knoxville, TN. T l( DSM’s rough estimate of total system costs to deliver this material to the drop‐off locations, construct and operate the drop‐offs, collect and transfer this material to lass processors and clean to market specifications might be in the range of $5.5 to 6 mg$
illion dollars. Key assumptions include the following:
• Fifteen percent of households/businesses choose to use the drop‐offs. • ver Each household or business drives an average of 75 miles per year to deli
material.13 • It costs roughly $45 ‐ $75 per ton to operate the drop‐offs and collect the
material. It costs an additional $18 to $37 per ton to transfer to existing glass processing
facilities and process the material for use by the glass industry. •
Expanding Curbside Recycling DSM proposed in the initial work plan to evaluate the potential to keep glass separate on the curbside collection trucks. A significant amount of curbside collection in the State of Oregon, for example, keeps glass separate from all other comingled recyclables on the curbside truck, as do municipalities in eastern Iowa ending material to the City Carton single stream MRF adjacent to Cedar Rapids, sIowa. owever, as DSM moved forward with the Ohio analysis a decision was made to not eriHs
ously consider this option for the following reasons:
• First and foremost, Rumpke and Waste Management, the two largest haulers in Ohio both currently collect all material including glass comingled and deliver he collected material to single stream plants configured to handle glass as part f the mix. to
13 DSM survey data on household behavior using Columbus drop‐offs indicated that the average household drove 61 miles per year out of their way to use the Columbus drop‐offs. DSM has increased the mileage to 75 mile per household assuming that many of these drop‐offs would serve less urbanized populations.

e 26 PagOhio Glass Recycling Study FINAL REPORT, May 31, 2011
• Second, Rumpke has made a significant investment in processing the resulting three‐mix glass at their Dayton facility, and is moving forward with color sorting equipment for this material. Similarly, Strategic Materials has the capability to manage this material at its Cleveland processing plant, where material from Waste Management is delivered.
• Third, a review of timing data indicates that separately collecting glass on the truck while collecting all other material comingled increased collection stop time by 60 percent.
14 This type of an increase appears to be cost‐prohibitive for most curbside collection programs, although it is beyond the scope of this analysis to complete this type of cost analysis.
• Fourth, according to a 2008 report prepared by the Oregon Department of Environmental Quality, roughly 20 percent of the glass collected in programs with a separate compartment for glass ended up in the comingled recyclables.
15 This is only 10 percentage points less than the losses reported for processing three‐mix material, which when added to the increase stop time would indicate that it is not worth the additional costs.
Instead, DSM determined that given the existing three‐mix processing infrastructure in Ohio, and the relatively large percentage of curbside refuse collection households without parallel access to curbside collection of recyclables, that greater quantities f new container glass could be obtained by offering curbside collection to a greater opercentage of the population.16 Table 16 below presents an estimate of how much glass, and other recyclable material, might by collected from expanding curbside collection programs to a greater percentage of Ohio’s urban and suburban population. As shown in Table 16, an estimated 85,000 additional (rounded) tons of glass might be recovered from expanding curbside recycling. These estimates are based on the amount of glass set out for recycling during DSM’s sort in Columbus and Dayton. It should be noted that while this expansion would add 85,000 tons of new input glass to existing single stream MRFs, it would also add roughly 330,000 tons (rounded) of recycled paper, plastic, aluminum and steel for a total of 415,000 tons of additional material recycled.
14 How to Collect Plastics for Recycling, American Plastics Council, 1995, p. 33 15 Glass Recycling Through Curbside Collection and Container Deposit Legislation, Oregon Department of Environmental Quality, June 2008, p. 2. 16 It is assumed that the majority of these households would receive single stream collection given that the two largest haulers in Ohio collect recyclables single stream, but some smaller haulers might offer dual stream collection where bottles and cans are kept separate from paper. Ultimately, however, whether it is dual stream or single stream collection, the resulting curbside glass will be three‐mix glass requiring further processing.

Page 27
Table 16 Estimated Glass Recovered from Expanded Curbside Collection Programs (And Recovery of Other Materials)
Households(%) Served (lbs/hh) (tons) (lbs/hh) (tons)
Curbside refuse and no recycling 54% Urban Households 22% 1,006,093 75 37,728 375 188,642Suburban households 22% 1,006,093 95 47,789 450 226,371
Total Recycled, Tons: 85,518 415,013
Glass Collected All Material
Table 17 presents a very rough estimate of the total cost to add parallel curbside collection for 2 million (rounded) households that currently do not have curbside recycling collection. This cost is not exclusive to glass, because it would include collection of all curbside materials, including plastic, aluminum, tin, and paper in addition to glass. This cost also does not take into account any savings in collection osts, avoided tip fees or other collection efficiencies that might reduce total refuse nd recycling system costs. ca TC
able 17 osts to Provide Expanded Curbside Recycling
HouseholdsMonthly
Household Cost Annual Cost(hhs) ($/hh) ($)
No recycling 2,978,793 Urban Households 991,938 $2.50 $29,758,138Suburban Households 991,938 $3.25 $38,685,579
Total Cost: $68,443,716 Expansion and Conversion of Processing Capacity to Manage the AdditionaCurbside Tonnage Adding 85,000 tons of recycled glass to the existing system would require the capacity to process this material. DSM does not have data on losses of glass during single stream processing, but a rough estimate might be that 20 percent of the incoming glass to the single stream MRF is lost as fines and residue, resulting in oughly 68,000 tons of three‐mix glass that would have to be processed at existing
l
r
Ohio Glass Recycling Study FINAL REPORT, May 31, 2011
or new glass processing facilities. As discussed above, this is roughly equivalent to the potential capacity of the existing processors based on announced expansions and the assumed ability to run one or more glass processing plants two shifts per day (see Table 2). However, it might be cost effective to construct additional processing capacity nearer to the new supply. It is beyond the scope of this analysis to estimate the cost of constructing new glass processing capacity, although it is probably reasonable to assume that pgrading an existing facility with optical sorting capabilities (for both color sorting nd potentially ceramics removal) might range from $3 ‐ $5 million dollars. ua

28 Page Ohio Glass Recycling Study
parately or as part of a single stream collection at relatively low per ton costs.
FINAL REPORT, May 31, 2011
Bars and restaurants offer the oppse
Given the location of existing capacity in Cleveland, Dayton and Upper Sandusky, and the location of both container and fiberglass manufacturing plants in Zanesville nd Newark, it might make sense to address the need for additional processing apacity based on regional demand and supply within Ohio. ac Source Separation of Glass from Bars and Restaurants North Carolina was the first state in the United States to adopt a law requiring that all Alcoholic Beverage Control (ABC) permit holders serving alcoholic beverages on premise “separate, store and recycle all recyclable beverage containers”. The law ent into effect on January 1, 2008, and is enforced by the North Carolina Alcoholic w
Beverage Control Commission.17 According to Scott Mouw, State Recycling Program Director, before the law only around 250 bars and restaurants were recycling beverage containers. Now, roughly two‐thirds of the 9000 ABC permit holders recycle beverage containers, resulting in n estimated increase in glass beverage container recycling of roughly 35,000 tons aper year. This analysis assumes that Ohio would implement a bar and restaurant recycling program as one way to increase the supply of glass, and that over time the program would yield similar results to North Carolina. There are three existing pilot rograms in Cincinnati, Columbus and Marion (see below) that can be used as a pmodel for further expansion. However, there are two important issues associated with implementation of a bar and restaurant recycling program like North Carolina’s. First, according to Ernie Guter, Owens Corning, bar and restaurant glass tends to be high in ceramic contamination which is an issue for both container glass and fiberglass manufacturers. Second, it is important to estimate the color mix of bar and estaurant glass to determine if the color mix is likely to be different from rresidential glass. DSM has received data from the Beer and Wine Association of Ohio concerning estimated units of beer and wine sold in Ohio to on‐premise accounts. DSM has also surveyed one of the largest distributors into the state as to the type of beer sold in the state and from this has made rough estimates of the percent of beer and wine bottles that are amber, green and flint. In addition, as discussed in the previous ection, DSM used Liquor Control Board data and data from other states to estimate sthe amount of liquor bottles that might be generated on‐premise. From these sources, DSM estimated total beer, wine and liquor sales and the estimated amount that was generated on premise. Roughly, as shown in Table 12, an estimated 92,000 tons of beverage (and food) containers are generated by the commercial sector. Current recycling of this material is relatively low, and estimated at no more than 5,000 tons. This material comes mostly from single tream collection programs and from drop‐off recycling with a small amount coming sfrom separate glass collection programs.
ortunity to collect large quantities of glass
17 Delaware’s recent universal recycling law enacted this past year is supposed to lead to a similar regulatory approach in Delaware.

Page 29
Currently there are several programs in the State that target this material. Hamilton County (Cincinnati), Marion County (Marion) and Columbus (Nationwide Properties) have all launched programs targeted at bars and restaurants. Data were not available on quantities collected per establishment, therefore DSM used the orth Carolina data (6 tons per establishment per year) to estimate potential N
quantities. There are 13,691 establishments permitted in Ohio to service alcohol. Table 18 shows the quantities of glass that might be captured based on different participation ates and an average annual collection rate of 6 tons from each participating stablishment. re Table 18 Estimated Recovery of Glass from Bar and Restaurant Recycling Program in Ohio Number of Permitted Bars and Restaurants 13691
% Participation 25% 50% 66%Participating Establishments 3,423 6,846 9,036Annual Tons Collected Per Establishment (tons) 6 6 6
Tons Collected for Recycling: 19,966 39,932 52,710Current Commercial Recovery 2,645 2,645 2,645
Total Recovery: 22,611 42,577 55,355Percent Commercial Recovery: 25% 46% 60%
Tab e 18 Notes: (1) Percent recovery based on 92,000 tons assumed available from bars and restaurants. 2) Current commercial recovery from bars and restaurants is estimated to be 50% of total
commercial recovery.
l
(
Finally, the cost of serving these bars and restaurants was estimated based on a small sample of costs reported by Ohio’s current programs. There are two potential ways that collection could be done – as part of a single stream recycling route that was set up to service establishments that were not rich in paper, or as a separate glass collection route. Either way, the material would need to be delivered to a rocessing facility for further processing, or for transfer to a glass processing pfacility. Current prices in two cities – Columbus and Cincinnati – are reported to be $65 ‐ $75 per month for 4‐5 toters collected weekly or around $30 – 35 per ton. At these rices, the establishments are saving money over refuse collection and disposal, peven at the relatively low Ohio disposal prices. Prices in other cities may not be as advantageous, and could run as much as $60 per ton or more, depending on the haulers available and the distance to processing facilities. These costs are shown below in Table 19 on a per ton basis for a high and low scenario. Based on Table 19, total system costs are estimated to range from $1.5 ‐ $3 million at a participation rate of 66 percent of all bars and restaurants, recovering roughly 55,000 tons.
Ohio Glass Recycling Study FINAL REPORT, May 31, 2011

30
TE
able 19 stimated Total Cost of Bar and Restaurant Recycling
Tons Recycled 19,966 39,932 52,710Cost Per Ton (low) $30 $30 $30
Total Cost: $598,981 $1,197,963 $1,581,311Cost Per Ton (high) $60 $60 $60
Total Cost: $1,197,963 $2,395,925 $3,162,621 Enactment of a Deposit on Beverage Containers DSM’s analysis for Ohio is based on reported recovery rates for beverage containers n other deposit states, reflecting a reduction in container glass set out in recycling ibins/carts and an increase in container glass redeemed for the deposit. Table 20 presents the estimated quantities of container glass that might be recovered from enactment of a bottle bill, and the net quantities after considering the amount of glass currently collected from existing curbside bins. As illustrated by able 20, DSM estimates that enactment of a bottle bill could result in an additional 39,000 tons of glass.T2
18
Table 20 Estimated Recovery of Additional Glass from Bottle Bill
Generation Recovery Rate Recovery RecoveryGlass (lbs/capita) (%) (lbs/capita) (tons) Beer and Soda 48 70% 33.7 195,000 Wine 14 70% 9.9 57,000 Liquor 4 60% 2.5 15,000
Total: 66.6 46.2 266,00027,000
239,000From Current Container Recovery (50%)
Net Additional Glass: The costs of a glass only bottle bill are challenging to estimate for two reasons. First, each of the bottle bill states has a different system, which impacts on costs. Costs can be significantly greater if all brand owners are required to account for their bottles, when compared to systems where the bottles can be comingled with deposit refunds paid based on sales data instead of return data. Costs also vary significantly depending on whether retailers are required to accept bottles for edemption or whether bottles can only be redeemed at stand‐alone redemption rcenters. Second, glass is the hardest material to handle under a bottle bill because of weight
ainers separate by brand is expensive for all and breakage issues. Keeping cont
PageOhio Glass Recycling Study FINAL REPORT, May 31, 2011
18 It should be noted that 70 percent recovery rates are relatively typical for bottle bill material, however, Delaware’s recovery rate for a bottle bill which excluded aluminum was significantly lower; therefore if Ohio were to enact a bottle bill for glass only quantities collected might be lower.

Page 31 Ohio Glass Recycling Study FINAL REPORT, May 31, 2011
Table 21 shows rough, order of mabo
materials, however glass is typically cased in mother cartons by brand, adding costs to both the retailer (who must purchase and store the separate cases) and handler, who must pick up and load the cased or palleted glass. In contrast, aluminum and ET can be bagged by brand and tossed onto collection trucks with counts based on Pbag counts as opposed to individual bottle or case counts. One way to solve part of this challenge is through commingling agreements among distributors that require sharing of sales data and paying into the system based on sales versus returns. This approach, however, assumes a cooperative system would e set up in Ohio specifically for a bottle bill and for glass. Review of this type of bsystem was beyond the scope of this study. For this reason, DSM estimates of the cost to operate a bottle bill in Ohio assume higher per container handling costs for glass than the average for all materials. For purposes of this analysis, DSM has assumed a handling fee of 5 cents per container, and collection costs of 2 cents per container to account for case and pallet handling of glass bottles and brand recordkeeping at redemption sites. These may or may not be reasonable, but a detailed analysis is beyond the scope of this report. Finally rocessing costs and net revenues for material are included for the separated glass, pbased on glass generation estimates by color including in this report. These costs do not include the cost of the generator (consumer) to deliver glass to a redemption facility or retail outlet, or the additional cost to the retailer to offer beverage container redemption to customers. For example, many retailers in bottle bill states choose to lease or purchase reverse vending machines and/or set up eparate areas for redemption in their stores at costs beyond those reimbursed sthrough a handling fee. DSM has surveyed the behavior of customers returning deposit containers, and like households using drop‐off recycling facilities (see above) the majority of those who redeem containers19 make a special trip. This special trip cost needs to be included in total system costs. Based on DSM’s 2009 Rhode Island report (the most recent analysis conducted of bottle bills by DSM) the average person redeeming containers brings 5,320 containers back per year and drives 150 (rounded) miles (out of their way) per year.20 Dividing the total estimated number of glass bottles that would be redeemed by 5,320 and multiplying by 150 miles yields total redemption miles of 6.1 million redemption miles per year. Using the current IRS rate of $0.50 per mile 2yields a total redemption return cost of $13 million (rounded) per year. SM’s estimated costs also do not include the costs to the distributors for D
administering such a program, or to the State for managing one. Finally these costs do not address the issue of who keeps unredeemed deposits that re often used by distributors to fund the program, or retained by the State to fund aother programs.
gnitude estimates of the cost of a traditional ttle bill with retailer and redemption centers in Ohio. Adding consumer
19 significant number of deposit containers are redeemed by individuals other
n the beverage consum A
tha er. 20 Analysis of Beverage Container Redemption System Options to Increase Municipal Recycling in Rhode Island. Prepared For Rhode Island Resource Recovery Corporation. Final Report, May 2009.

Page 32
redemption costs (an estimated $13 million as discussed above) results in a total estimated cost of $78.8 million. Table 21 Estimated Annual Cost of Bottle Bill for Glass Containers Only
Glass Collected Cost Per Ton Total Annual Cost(tons) ($) ($)
Handling Fee (1) 266,000 $174 $46,281,963Collection from point of redemption (2) 266,000 $70 $18,512,785Handling & Processing (3) 266,000 $20 $5,320,000
Subtotal: 266,000 $264 $70,114,748Scrap Value Amber 138,150 ‐$19 ‐$2,578,800 Flint 61,200 ‐$26 ‐$1,611,600 Green 67,650 ‐$2 ‐$112,750
Subtotal: 267,000 ‐$4,303,150Net Cost 267,000 $246 $65,811,598
Table 21 Notes: (1) Handling fee of 5 cents applied to an estimated 925.6 million containers returned.
e (2) Collection costs based on estimated 1.5 cents per container for collection, which may blow for glass kept separate. (3) Processing/transfer cost assumes glass is brought to location for counting and QC for proper distributor allocation.
Ohio Glass Recycling Study FINAL REPORT, May 31, 2011

Page 33 Ohio Glass Recycling Study FINAL REPORT, May 31, 2011
FINDINGS Based on the analysis of supply and demand completed by DSM, and information ade available from the various stakeholders participating in the system, or racking recycling, DSM offers the following findings: mt S upply and Demand
• Ohio’s glass manufacturing industry currently uses approximately 110,000 tons of glass cullet; however their total potential demand is between 275,000 and 95,000 tons per years, representing an increase in demand of between 2165,000 and 185,000 tons of new glass cullet per year.
• Glass processors in Ohio are currently processing 209,000 tons of recycled plate and container glass in Ohio, and selling 174,000 (rounded) tons of glass cullet to both in‐state and out‐of‐state users. Planned processing plant expansions coupled with the potential to run more than one shift indicates that existing processors could process up to 275,000 tons of recycled glass per year, producing 213,000 tons of cullet.
• Ohio residents and businesses generate roughly 517,000 tons of glass per year, and recycle roughly 54,400 tons of container glass, or about 11 percent of total
generation.
• The remaining 462,600 tons represent potential tonnage to supply Ohio’s glass
manufacturing industry.
• Most of the available plate glass is already being recovered from industrial and commercial sources; leaving container glass as the largest source of potentially recyclable material. However there are an estimated 10,000 potential tons of indshield replacement glass and construction and demolition glass that might lso be available.
wa
Potential Strategies to Meet Demand DSM has analyzed four primary strategies for meeting the potential future demand. Each of these strategies will require capital investments and higher operating costs. This analysis does not address who will pay the cost to achieve the higher demand, but does recognize that a primary reason for the low glass recycling rates in Ohio is hat landfill costs are low, and diverting additional glass will cost money over and tabove what it currently costs to landfill glass. Much of the “low hanging fruit” (primarily industrial plate glass and source separated drop‐off recycling) is already being recovered. Therefore, achieving significant increases in supply will require that the glass manufacturing industry be willing to pay a price for recycled cullet sufficient to attract the types of investment ecessary to collect, transport, and process the glass cullet to meet industry pecifications. ns

Page 34 Ohio Glass Recycling Study FINAL REPORT, May 31, 2011
Given state and municipal budget constraints, it is likely that incremental improvements to existing systems will be implemented first. Ultimately, these improvements could yield new quantities of glass sufficient to provide much of the potential future demand, as summarized below:
• Expanding curbside collection to all households with curbside refuse collection
could supply roughly 68,000 new tons of glass after accounting for losses during separation and processing. This expansion would have the added benefit of creating substantial new supplies of paper, and plastic, aluminum and steel containers. However, there would be a need for continued investment in best management practices at the single stream MRFs to reduce glass losses, and at the glass processing facilities to color separate and remove contaminants.
• A recycling program for bars and restaurants, modeled after the existing three pilot programs in Ohio, and the state‐wide North Carolina program, could
eventually recover an additional estimated 53,000 (rounded) new tons.
• Expanded drop‐off programs to serve urban and suburban populations that currently do not have access to either curbside or drop‐off recycling could recover an additional 14,400 tons of container glass. DSM has assumed that new drop‐offs serving primarily residential areas would be source separated by color, but drop‐offs serving a mix of residential and commercial (bar and
restaurant) establishments would accept three‐mix glass.
• Combining expanded curbside and drop‐off programs with recycling for bars and restaurants could eventually meet roughly 73 to 82 percent of future demand, and when combined with new capacity to process existing three‐mix
and.
MRF tonnage, could potentially meet all of the projected future dem
• Meeting the large future demand for flint glass to supply container manufacturing will mean that existing glass processors may need to mix plate glass with the remaining mixed color glass to assure that the amber specification for fiberglass manufacturing can be met; however that should not
be a significant issue given the amount of plate glass available.
• While there may be sufficient throughput capacity with existing glass processors to manage new curbside and drop‐off supplies of three‐mix material, there will be a need for additional color and contaminant sorting capacity. Given the demand for glass cullet in central Ohio, it may be that constructing new
processing capacity in that region would make economic sense.
• Finally, although not an incremental change, deposit legislation for glass bottles could recover an estimated 239,000 tons of glass, which would be more than sufficient to supply future Ohio glass manufacturing demand.

Page 35 Ohio Glass Recycling Study FINAL REPORT, May 31, 2011
APPENDIX

APPENDIX C omposition of Sort Samples By Route Day and Sample Type, and Totals For Each Day
WedsRefuse Recycle Refuse Total Recycle Refuse Total Recycle Refuse Total Recycle Refuse Total Recycle Refuse Total
Material Categories (%) (%) (%) (%) (%) (%) (%) (%) (%) (%) (%) (%) (%) (%) (%) (%)Clear Glass ‐ Food/Beverage 2.4% 7.0% 1.5% 2.7% 6.7% 0.6% 2.0% 5.1% 1.2% 1.4% 6.7% 1.7% 2.3% 6.4% 1.5% 2.2%Clear Glass ‐ Beverage 2.9% 1.1% 1.5% 3.9% 0.0% 0.9% 4.1% 0.4% 0.6% 5.5% 1.1% 1.6% 4.1% 0.6% 1.1%Clear Glass ‐ Food 4.1% 0.4% 1.2% 2.8% 0.6% 1.1% 1.0% 0.8% 0.8% 1.2% 0.6% 0.7% 2.3% 0.6% 0.9%Amber Glass 2.5% 6.1% 1.7% 2.6% 15.5% 0.4% 4.0% 17.8% 2.9% 4.0% 6.9% 3.0% 3.4% 11.6% 2.1% 3.3%Green Glass 0.8% 4.8% 1.2% 1.9% 4.9% 0.1% 1.2% 2.4% 0.0% 0.2% 0.0% 0.3% 0.2% 3.0% 0.5% 0.9%Plate Glass 0.2% 0.0% 0.0% 0.0% 0.0% 0.0% 0.0% 0.0% 0.0% 0.0% 0.0% 0.0% 0.0% 0.0% 0.0% 0.0%
Subtotal, Glass: 5.9% 17.9% 4.4% 7.2% 27.1% 1.0% 7.2% 25.3% 4.1% 5.6% 13.6% 4.9% 5.9% 21.0% 4.1% 6.4%
PET Containers ‐ Food/Beverage 1.2% 3.7% 0.9% 1.5% 3.1% 0.3% 1.0% 5.3% 1.3% 1.6% 3.3% 0.7% 1.0% 3.9% 0.9% 1.3%PET ‐ Beverage 3.1% 0.8% 1.3% 2.7% 0.1% 0.7% 5.3% 1.0% 1.3% 2.8% 0.6% 0.8% 3.5% 0.6% 1.0%PET ‐ Food 0.5% 0.1% 0.2% 0.5% 0.1% 0.2% 0.0% 0.3% 0.3% 0.5% 0.2% 0.2% 0.4% 0.2% 0.2%HDPE Containers 1.0% 5.3% 0.7% 1.6% 2.5% 0.2% 0.7% 5.3% 1.0% 1.3% 2.3% 0.6% 0.8% 3.8% 0.7% 1.1%Aluminum Cans 1.0% 1.9% 0.9% 1.1% 1.2% 0.1% 0.4% 0.4% 1.0% 0.9% 1.4% 0.5% 0.6% 1.2% 0.7% 0.8%Bi‐metal Cans 1.4% 1.4% 0.6% 0.7% 1.9% 0.5% 0.9% 2.0% 1.8% 1.8% 1.1% 1.1% 1.1% 1.6% 1.1% 1.2%
Subtotal, Plastic & Metal: 4.5% 12.2% 3.1% 5.0% 8.8% 1.1% 2.9% 12.9% 5.1% 5.6% 8.1% 3.0% 3.5% 10.5% 3.3% 4.3%
Newspaper 4.5% 29.5% 3.0% 8.5% 35.8% 0.8% 9.2% 20.6% 3.1% 4.3% 29.4% 2.1% 5.1% 28.8% 2.7% 6.3%Cardboard 2.9% 7.4% 1.2% 2.5% 7.4% 1.3% 2.7% 11.0% 1.4% 2.0% 8.3% 1.1% 1.9% 8.5% 1.6% 2.4%Mixed Paper 9.4% 24.7% 12.0% 14.7% 18.2% 5.8% 8.7% 26.7% 8.8% 10.1% 20.9% 8.8% 10.2% 22.6% 9.0% 10.6%
Subtotal, Paper: 16.7% 61.6% 16.2% 25.7% 61.3% 7.9% 20.6% 58.2% 13.3% 16.5% 58.7% 12.0% 17.2% 60.0% 13.2% 19.3%Total Recyclables 27.2% 91.7% 23.7% 37.9% 97.2% 10.0% 30.8% 96.5% 22.5% 27.7% 80.4% 19.9% 26.6% 91.4% 20.7% 30.0%
Other ‐ residuals and refuse 72.8% 8.3% 76.3% 62.1% 2.8% 90.0% 69.2% 3.5% 77.5% 72.3% 19.6% 80.1% 73.4% 8.6% 79.3% 70.0%Total: 100.0% 100.0% 100.0% 100.0% 100.0% 100.0% 100.0% 100.0% 100.0% 100.0% 100.0% 100.0% 100.0% 100.0% 100.0% 100.0%
AVERAGESAll Five DaysPercent of Composition Thursday Friday Tuesday Wednesday
Columbus Dayton
Page Ohio Glass Recycling Study FINAL REPORT, May 31, 2011
36


![[Wales Event Recycling Guide] - wrapcymru.org.uk Event Recycling Guide.pdf · wales event recycling guide This is the second edition of the ‘wales event recycling guide’ and has](https://img.pdfslide.tips/doc/110x75/5e7358e8e09d4c24fa787bf2/wales-event-recycling-guide-event-recycling-guidepdf-wales-event-recycling.jpg)