Embed Size (px)
Citation preview

August 2014 – DNB Markets - Torbjørn Kjus 1
Oil Market Outlook
Oil Market Outlook - Peace sells, but who’s buying?
- “Can you put a price on peace?” Dave Mustaine - Megadeth
- Revising up our long-dated oil price view due to lower
expected investments in the oil industry, but still bearish to the next three year’s oil price formation

August 2014 – DNB Markets - Torbjørn Kjus 2
Oil Market Outlook
Content
1 Overall outlook ............................................................................ 3
2 The oil price discovery ................................................................ 5
3 Seasonality in the oil market – Is it there? ................................ 19
4 Investments in the global oil industry vs production & price ..... 24
5 US Shale oil production – evolution or revolution? ................... 28
6 Large changes in trade patterns and refining ........................... 32
7 Where is the accelerating global oil demand growth? .............. 35
8 Oil demand in the OECD continue to trend lower ..................... 37
9 Non-OECD oil demand continues to grow but at what rate? .... 39
10 Chinese oil demand growth not as strong as before ................ 42
11 Fundamental balance – supply vs demand .............................. 49
12 Peace sells – but who’s buying? Not Iraq it seems… ............... 51
13 The 2015 oil price score card ................................................... 60
14 The DNB Markets Brent price forecast ..................................... 61
15 The DNB Markets commodity team .......................................... 62

August 2014 – Torbjørn Kjus 3
DNB Markets | Oil Market Outlook
1 Overall outlook Until April 2012 we held one of the most bullish views on oil prices out there, but then we changed
that view due to our take on the US shale revolution. We thought shale oil would be a game
changer in the oil industry. In hindsight it was probably correct to classify the US shale revolution
as a game changer, but several “games” are still in the midst of playing out and we have not at all
seen all the potential changes the shale revolution will bring to trade patterns, oil refining,
geopolitics, US domestic energy politics, US economic growth/trade balance and global crude and
oil product prices.
We would claim that our prior bullish analysis for oil price formation would probably have
materialized, had we not seen the immense growth in oil production from the US during the past
three years. Why is that? It is because spare capacity in core-OPEC (Saudi/UAE/Kuwait) is
currently estimated to be about 2.9 million b/d. This is approximately the same amount as the
growth in US shale oil production during the past three years. At the same time, unplanned
outages in the oil industry has grown about 2.6 million b/d, mainly due to political issues in Libya,
Iran, Iraq, Syria and Yemen. In other words; had we not seen the growth in US shale oil, the world
oil system would now be running on practically no spare capacity other than strategic storage.
Such a situation would likely have pushed the oil price significantly higher, but instead the spot
Brent price has flattened and even started trending lower. This is quite amazing, noting the
geopolitical development we have seen in key oil producing countries. We have seen a civil war
developing in Syria, civil war like conditions in Iraq and Libya, social unrest and oil sabotage in
Yemen and Nigeria, an oil embargo vs Iran and almost a war between Ukraine and Russia. If we
two years ago had believed in this kind of geopolitical news flow and at the same time had not
believed the US shale revolution was a game changer, we would have kept our bullish view on oil
prices.
0
1
2
3
4
5
6
7
8
9
Nov-01 Nov-03 Nov-05 Nov-07 Nov-09 Nov-11 Nov-13
Mill
ion b
/d
OPEC Spare Capacity (IEA Monthly)
Core OPEC (Saudi/UEA/Kuwait) Rest of OPECSource: IEA, DNB Markets
Now the question we need to ask is if the unplanned outages in the oil industry will continue to rise
going forward. There are of course very large volumes at risk in Iraq, related to the Sunni-Shiite
conflict that rages there, but so far the Basrah region, where all the growth in exports and
production has been coming from the latest year, seems very well protected by the Shiites. One
could also argue that in a 2-4 year perspective a potential new Kurdish state in North-Iraq or at
least a more autonomous Kurdistan will mean more barrels to the market and not less. Kurdistan
has seized control of most of the northern Iraqi oil resources and with new pipelines in place
maybe 2-3 years down the road we could see large growth in exports from that region. In a 5-10
-1000
-500
0
500
1000
1500
2000
2500
3000
3500
4000
Jan-10 Jan-11 Jan-12 Jan-13 Jan-14 Jan-15
kbd
Growth In Unplanned Outages Have More Than Offset Shale Crude Output - is that sustainable also gowing forward?
US shale crude production US FWD shale crude production
Change unplanned disruptions since 2010 Unplanned disruptions FWD
Source: PIRA Energy, DNB Markets
August 2014 – Torbjørn Kjus 4
DNB Markets | Oil Market Outlook
year perspective however the fact that western oil companies will not operate in a war zone and
the likely large reduction in investments in Iraq that will follow from this, suggest that oil production
in Iraq 5-10 years down the road will be lower than what we thought last year.
At the same time we have seen that International Oil Companies (IOC’s) are reducing their global
oil spending in 2014 by approximately 1% after having seen yearly growth in spending of about 8%
per year from these players since the millennium change. We hence believe it is justified to
increase our 2018-2020 Brent price forecast by some dollars, but we maintain our bearish stance
on 2015-2017 since a cut in investments will do little to avoid the over supplied market we forecast
for the next 3-4 years. The next 3-4 years will most likely provide an acceleration of start-ups of
new oil projects based on the investments already executed through the past 5-8 years. A cut in oil
investments for 2014 and 2015 will not help curtail this expected growth in production outside of
OPEC for the coming couple of years in our opinion.
We do not believe that the MENA region will be a nicer, calmer place going forward. That is not our
argument to maintain our bearish stance to the shorter end of our price deck. We believe
unplanned outages will stay high, but that does not mean they will continue to increase the next 2-
3 years the same way they have done the past 2-3 years. We believe that there is an equally large
chance that we will see some return of barrels from Libya/Iran the coming couple of years as the
chance of loosing barrels from Iraq. We believe that we would need to see significant oil sabotage
playing out in the Basrah region in Iraq (the southern part that is currently controlled by the Shiites)
in order to see further growth in global unplanned outages in the oil industry. It will probably not be
enough to see a civil war ranging in the middle of the country. When we at the same time believe
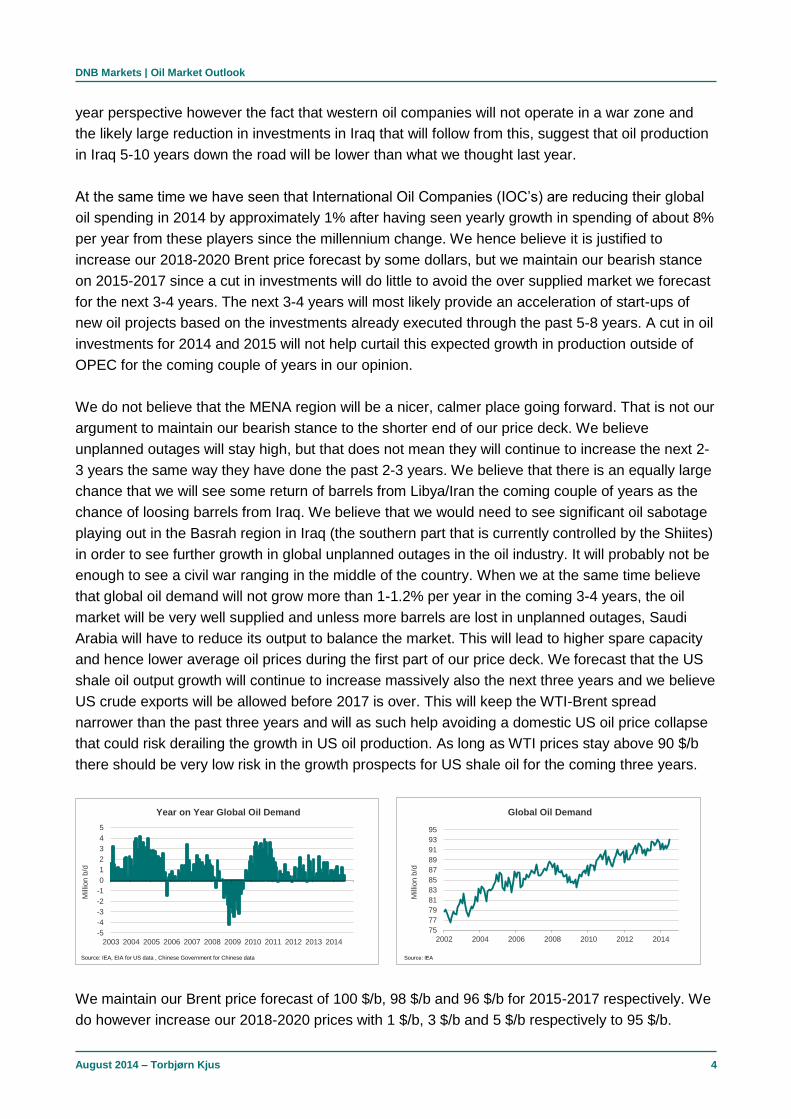
that global oil demand will not grow more than 1-1.2% per year in the coming 3-4 years, the oil
market will be very well supplied and unless more barrels are lost in unplanned outages, Saudi
Arabia will have to reduce its output to balance the market. This will lead to higher spare capacity
and hence lower average oil prices during the first part of our price deck. We forecast that the US
shale oil output growth will continue to increase massively also the next three years and we believe
US crude exports will be allowed before 2017 is over. This will keep the WTI-Brent spread
narrower than the past three years and will as such help avoiding a domestic US oil price collapse
that could risk derailing the growth in US oil production. As long as WTI prices stay above 90 $/b
there should be very low risk in the growth prospects for US shale oil for the coming three years.
-5
-4
-3
-2
-1
0
1
2
3
4
5
2003 2004 2005 2006 2007 2008 2009 2010 2011 2012 2013 2014
Mill
ion b
/d
Year on Year Global Oil Demand
Source: IEA, EIA for US data , Chinese Government for Chinese data
We maintain our Brent price forecast of 100 $/b, 98 $/b and 96 $/b for 2015-2017 respectively. We
do however increase our 2018-2020 prices with 1 $/b, 3 $/b and 5 $/b respectively to 95 $/b.
75
77
79
81
83
85
87
89
91
93
95
2002 2004 2006 2008 2010 2012 2014
Mill
ion b
/d
Global Oil Demand
Source: IEA

August 2014 – Torbjørn Kjus 5
DNB Markets | Oil Market Outlook
2 The oil price discovery
In the broad picture oil prices are formed in the interrelation between three different factors. The
starting point is always the supply and demand for crude oil and oil products. The fundamental
balance can however be affected by interpretations of both politics and market psychology. Most
oil market watchers are aware that politics has been and still is one of the largest contributors to
the oil price formation. As an example, oil prices will be supported if the market consensus is that
an outright civil war will take foothold in Iraq, even if the fundamental situation suggests a
weakening market. Psychology has to do with what kind of news flow that most of the market
players emphasize. Normally the oil market is not capable of taking too many issues under
consideration at the same time, so only a few factors will affect the general market psychology at a
given time. This could be things like a civil war in Libya/Iraq, sabotage in Nigeria, possible Russian
sanctions vs Europe related to the Ukraine tension, strong or weak macro economic numbers from
the US or China, new record high oil production in the US, possible exports of crude from the US, a
possible FED rate hike, etc.
Politics and psychology plays their important part of the oil price formation but we believe that at
the end of the day, the fundamental situation will prevail in forming global oil prices. Basically this is
the question; is supply stronger than demand? Or is demand stronger than supply? This is
extremely hard to answer on a global basis and that is why the historical numbers for global supply
and global demand deviate between the large agencies. You will find that IEA, EIA and OPEC do
not agree on what supply and demand for oil was in any given year, not only forward looking but
backwards looking as well.
The fundamental balance is further complicated by the fact that there are two balances and not
one. There is one supply-demand balance between the crude oil producer and the refiner and
there is another balance between the refiner and the consumer of the product. One has to
remember that crude oil generally is not consumed by anyone. It has to be refined to a product like
gasoline, diesel, jet fuel, etc before it can be consumed. The exception is some direct burning of
crude oil to generate power in countries like Japan, Saudi Arabia and China, but generally
speaking almost all crude oil must be refined to a product before it becomes useful to the general
public.
Sometimes, like in 2008 for example, imbalances in the product market can lead prices higher for
the whole oil complex. Crude oil prices in the summer of 2008 almost reached 150 $/b based on
lack of upgrading capacity in the global refining sector to produce enough diesel. Because all the
diesel upgrading units (Hydrocrackers and Hydrotreaters) in the global refining sector was already
fully utilized in March 2008 (then the crude price was about 100 $/b), the only way to produce more
diesel was to run more crude oil through the distillate towers, and since the natural diesel content
in crude oil is normally about 30-40% a refiner needed three barrels of crude in order to produce
that incremental barrel of diesel in the summer of 2008. That gearing effect brought oil prices to
record levels that summer. The problem for oil analysts at the time was that there are many
months lag time before we can see the data for global refinery throughput, and hence be able to
see exactly what was going on.

August 2014 – Torbjørn Kjus 6
DNB Markets | Oil Market Outlook
One of the largest issues that have made analysts work in the blind in recent years is the Chinese
stock piling of strategic crude storage. So far in 2014 there are so many missing barrels in the
Chinese crude oil balance that it suggest that large crude stock piling has been going on. These
stock builds are not reported as commercial stocks, in fact they are not reported anywhere. We just
have to assume that the fact that supply of crude has been much larger than demand for crude in
China recently, suggest that strategic stock piling has taken place. This type of hidden behaviour
by the Chinese reduces the value of any fundamental balance of supply vs demand. Stock piling is
not demand, but it nonetheless increases the imports of crude oil. How do you treat this in the
balance? Should it be counted as demand since we can assume that it will go on for some years?
When will the strategic stock building stop and the market loose the positive artificial demand
impulse from that kind of imports? The Chinese has stated targets of reaching 500 million barrels
of strategic storage by 2020, but that number is fluctuating according to which source you use.
There are also many different numbers out there on how much strategic storage that has now been
built and this makes it difficult to assume what will happen through the coming couple of years with
respect to Chinese crude oil imports.
-4.0
-3.0
-2.0
-1.0
0.0
1.0
2.0
2002 2003 2004 2005 2006 2007 2008 2009 2010 2011 2012 2013 2014 2015
Mill
ion b
/d
Missing barrels vs OECD stocks
Source: IEA, DNB
Another very interesting issue that has started to play out in recent years is that the share of oil
demand that is covered outside refining is increasing. This is very much related to the shale gas
revolution is the US that has made LPG extremely cheap. LPG has always been reported as an oil
liquid, that is; it has always been included under oil demand. The challenge to preparing the correct
balance of oil supply and demand is that most of the new LPG that has hit the market in recent
years has been coming from natural gas production and not crude oil production. It is difficult to
adjust for these issues in the balances but people need to be aware of what is going on. LPG can
be produced from distilling crude oil but it can also be extracted from natural gas. Wet gas is
extracted from the rich gas in a terminal like Kårstø in Norway for example. Then that wet gas
(LPG) is put on ships and sold into the market. As and example of how skewed this could be when
we only look at the headline demand and supply numbers we can mention that in 2013 global oil
demand grew 1.2 million b/d according to the IEA. Does that mean that the world needed 1.2
million b/d of new crude oil in that year? No it is not that simple at all. According to the global
consultancy firm FGE, global demand for crude oil (refinery throughput) only increased about 0.5
million b/d last year. This just illustrate that one needs to be very careful when discussing the
world’s need for more crude oil.
-0.9
-0.6
-0.3
0.0
0.3
0.6
0.9
1.2
1.5
Jan-00 Jan-02 Jan-04 Jan-06 Jan-08 Jan-10 Jan-12 Jan-14
Millio
n b
/d
Missing Chinese Crude Barrels(based on net crude imports plus domestic crude production less refinery throughput - avg 0.3)
Source: China OGP, Xinhua News, The Chinese General Administration & Customs, National Bureau of Statistics

August 2014 – Torbjørn Kjus 7
DNB Markets | Oil Market Outlook
Until ten years ago it was easier to be an oil market analyst. You would then correct predict the
price movement on oil if you were able to predict the commercial oil stock changes in the OECD.
This has changed after 2003. From 2002-2009 people saw that non-OPEC liquids production was
not able to grow despite large growth in investments in the oil industry so OPEC had to step up
and increase its production. The flip side of increased OPEC production was reduced upstream
spare capacity. The market saw this happening and again there was increased talk in the market of
peak oil.
At the same time oil demand exploded to the upside in emerging markets with China in the lead,
propelled by population growth a growing middle class and urbanization. In this period the long end
of the forward curve started rising and created a contango environment where the longer end is
more expensively priced than the shorter end. This was unusual, because until then the oil price
had only been able to increase in a backwardated environment. Since the buffer of upstream
capacity was reduced there was a need to build a buffer closer to the consumers and the market
helped to achieve that in opening up a contango environment that incentivised traders to build oil
inventories in the OECD.

August 2014 – Torbjørn Kjus 8
DNB Markets | Oil Market Outlook
Before 2003 one could use the oil inventory vs oil price relationship to argue if there was a price
premium in the oil market that was not related to the fundamental situation. If the oil price was
higher than what it should be based on the regression plot between oil prices and inventories one
could say that a price premium existed and it could even be quantified. As can be seen in the plot
below this has no longer been possible after 2003 as the correlation has weakened to such an
extent that it is not meaningful to use it any more. In our opinion it is no longer valid to say that if
OECD oil stocks are building or drawing it should give you a certain level of oil prices.
What we have seen after 2007 is that financial players in the oil market have become gradually
more important in the oil price formation. Easier access to the oil market through electronic trading
and almost 24/7 opening hours has led to a lot of new players entering the oil market the last 6-8
years. The general public can trade oil through ETFs (Exchange Traded Funds) and Hedge Funds
and Pension Funds have seen oil and commodities as a way of diversifying their portfolio and
make excess returns. This has also meant that psychology has become a more important factor in
the oil price formation process that what it was ten years ago in our opinion.

August 2014 – Torbjørn Kjus 9
DNB Markets | Oil Market Outlook
It has also meant that the volume traded on electronic contracts (paper oil) in both London and
New York has exploded to the upside in recent years. The volume in the Brent market for the
prompt contracts, where more than 90% of the volume is traded, has increased five-fold since
electronic trading overtook the pit trading in London. Now about 500 million barrels is traded every
day just in the prompt Brent contracts on the ICE platform. This is more than five times the daily
physical demand for oil globally and in addition we have the NYMEX platform and a very large
OTC volume traded through banks and other swap dealers. Paper traded oil is now probably about
15-20 times larger than physical oil demand. The volume growth has however tapered off the last
couple of years and now seems to have stabilized in a range between 500-600 kbd for the prompt
Brent contracts.

August 2014 – Torbjørn Kjus 10
DNB Markets | Oil Market Outlook
You do not even have to do the scatter plot and perform the regression analysis (we have of
course done that as well) in order to see that there is a very close relationship between oil price
movements and the net positions held by speculators in the oil market. With speculators we mean
players who do not have a hedging need in the oil market; that is they are not naturally long or
short oil. Physical oil producers and oil consumers are not in this category, neither are swap
dealers like Goldman Sachs and other large banks, because if you are a swap dealer you have a
need to hedge the exposure you have taken on. These positions are only reported once a week
and hence it is not possible to lead or lag the data to see what is affecting what. Are the non-
commercials pushing the price up and down or are they merely reacting to the price movements?
Adding positions when the price increases and reducing when the price drops? Since we only have
access to cut-off positions on Tuesday evenings we can only compare the net financial positions
with the oil price at the same timing once a week. And if you led or lag the data, the correlation
weakens dramatically. We would hence need daily data to come closer to a conclusion on this
theme but as of now, that is not available.
Our hypothesis is that sudden changes in market psychology among the non-commercial players
(the speculators who do not have a hedging need) will affect the oil price formation in the short
term as they accumulate or sell off net oil positions. It is very difficult to foresee the next movement
in positioning from the non-commercial players in the oil market and it is difficult to say what the
normal neutral net length is for these players as there has been a tendency to set new record net
long positions in recent years. What we however have seen is that whenever these players
accumulate net record long positions they rarely stay very long at the “mountain top” before
positions are reduced as profit is taken. This has on occasions regularly unleashed a sales
pressure in the market that has chopped many dollars of the oil price, before positions have again
been rebuilt.

August 2014 – Torbjørn Kjus 11
DNB Markets | Oil Market Outlook
In order to rebuild the positions there however needs to be a new positive interpretation of the
market, and that is never guaranteed. Incidents that can lead to increased net positions from these
players include civil war in Iraq and Libya, improved macro economic data from the US, large
reported oil stock draws, etc. If suddenly the interpretation is that barrels will return from Libya, that
Iraqi production will in fact increase no matter if the ISIS group progresses in non-oil territory, if Iran
looks to return to the market as a normal country and if US oil production maintains its growth rate,
these players can choose to take profits and “run for cover”. We saw an incident similar to this
description taking place in July/August when Brent prices have dropped 12-14 $/b since the peak
in June.
90
95
100
105
110
115
120
125
130
0
30
60
90
120
150
180
210
240
270
Jul-11 Jan-12 Jul-12 Jan-13 Jul-13 Jan-14 Jul-14
$/b
Mill
ion
ba
rre
ls
ICE London Managed Money Net Brent Oil Length & Brent Price
(Net length of Brent Futures)
ICE Brent Futures Net Length Brent 1st MonthSource: Reuters
As we have described above the oil price discovery process changed in the years 2003-2007. And
then the 2008-09 period was also different due to the financial crisis and the big recession. We had
never seen oil prices trending higher in a contango environment before, but after 2006 we saw a
gradual return to the old pattern of price movements where price strength is more prevalent in
periods of strong backwardation, while weakening time spreads (smaller backwardation or even
contango) has been a leading indicator for what will happen to the flat price of oil (nominal oil
prices), often with a 2-4 weeks lead time.
Brent 1st vs 3rd month (thick line, RHS) before 2003 and flat price of Brent:
Daily QLCOc1, QLCOc3 03/01/1989 - 01/05/2003 (LON)
SMA, Spread(QLCOc1, QLCOc3), 30
15/07/2014, 0.70
SMA, Line(QLCOc1), 30
15/07/2014, 111.13
Value
USD
Bbl
Auto
-0.5
0
0.5
1
1.5
2
2.5
Price
USD
Bbl
Auto
12
15
18
21
24
27
30
1989 1990 1991 1992 1993 1994 1995 1996 1997 1998 1999 2000 2001 2002 2003
1980 1990 2000
70
75
80
85
90
95
100
105
110
115
0
100
200
300
400
500
600
Sep-10 Mar-11 Sep-11 Mar-12 Sep-12 Mar-13 Sep-13 Mar-14 Sep-14 Mar-15
$/b
Mill
ion b
arr
els
Non-Commercial Net Oil Length(Non-Commercial total net length of WTI, RBOB & Heat - Futures & Options)
Source: CFTC

August 2014 – Torbjørn Kjus 12
DNB Markets | Oil Market Outlook
Brent 1st vs 3rd month (thick line, RHS) 2003-2006 and flat price of Brent:
Daily QLCOc1, QLCOc3 15/09/2003 - 14/08/2006 (LON)
SMA, Spread(QLCOc1, QLCOc3), 30
15/07/2014, 0.70
SMA, Line(QLCOc1), 30
15/07/2014, 111.13
Value
USD
Bbl
Auto
-1.2
-0.9
-0.6
-0.3
0
0.3
0.6
0.9
Price
USD
Bbl
Auto
30
35
40
45
50
55
60
65
O N D J F M A M J J A S O N D J F M A M J J A S O N D J F M A M J J A
Q4 2003 Q1 2004 Q2 2004 Q3 2004 Q4 2004 Q1 2005 Q2 2005 Q3 2005 Q4 2005 Q1 2006 Q2 2006
Brent 1st vs 3rd month (thick line, RHS) 2006-2014 and flat price of Brent:
Daily QLCOc1, QLCOc3 10/03/2006 - 17/12/2014 (LON)
SMA, Spread(QLCOc1, QLCOc3), 30
19/08/2014, -0.82
SMA, Line(QLCOc1), 30
19/08/2014, 105.83
Value
USD
Bbl
Auto
-4.5
-4
-3.5
-3
-2.5
-2
-1.5
-1
-0.5
0
0.5
1
1.5
Price
USD
Bbl
Auto
50
60
70
80
90
100
110
120
Q2 Q3 Q4 Q1 Q2 Q3 Q4 Q1 Q2 Q3 Q4 Q1 Q2 Q3 Q4 Q1 Q2 Q3 Q4 Q1 Q2 Q3 Q4 Q1 Q2 Q3 Q4 Q1 Q2 Q3 Q4 Q1 Q2 Q3 Q4
2006 2007 2008 2009 2010 2011 2012 2013 2014
As the backwardation or contango develops through time, this still seems to be a good indicator of
the tightness/looseness in the physical Brent market. When the loading programmes for Brent,
Forties, Oseberg and Ekofisk (the crude streams that set the Brent quote, BFOE) changes
meaningfully from one month to the next, when refinery margins drops to un-economical levels,
when there is large changes in refinery maintenance that comes unexpected or when West-African
barrels needs to go to Europe to find buyers, these are examples of incidents that will loosen or
tighten the north sea Brent market and as such it will affect the Brent time spreads. If refinery
margins are weakening substantially and the market at the same time see no lost barrels from Iraq
and possibilities of returning barrels from Libya, the backwardation in the Brent-curve will loosen
(become less steep). Recently we have seen weak margins in Asia leading to less need for barrels
from West-Africa which then instead has moved to Europe, and this has contributed to pressure on
the Brent time spreads and flat price.
From June and into August the 1st vs 4th month Brent spread weakened from a 2 $/b
backwardation to a 1.5 $/b contango based on the above mentioned factors. About at the same
August 2014 – Torbjørn Kjus 13
DNB Markets | Oil Market Outlook
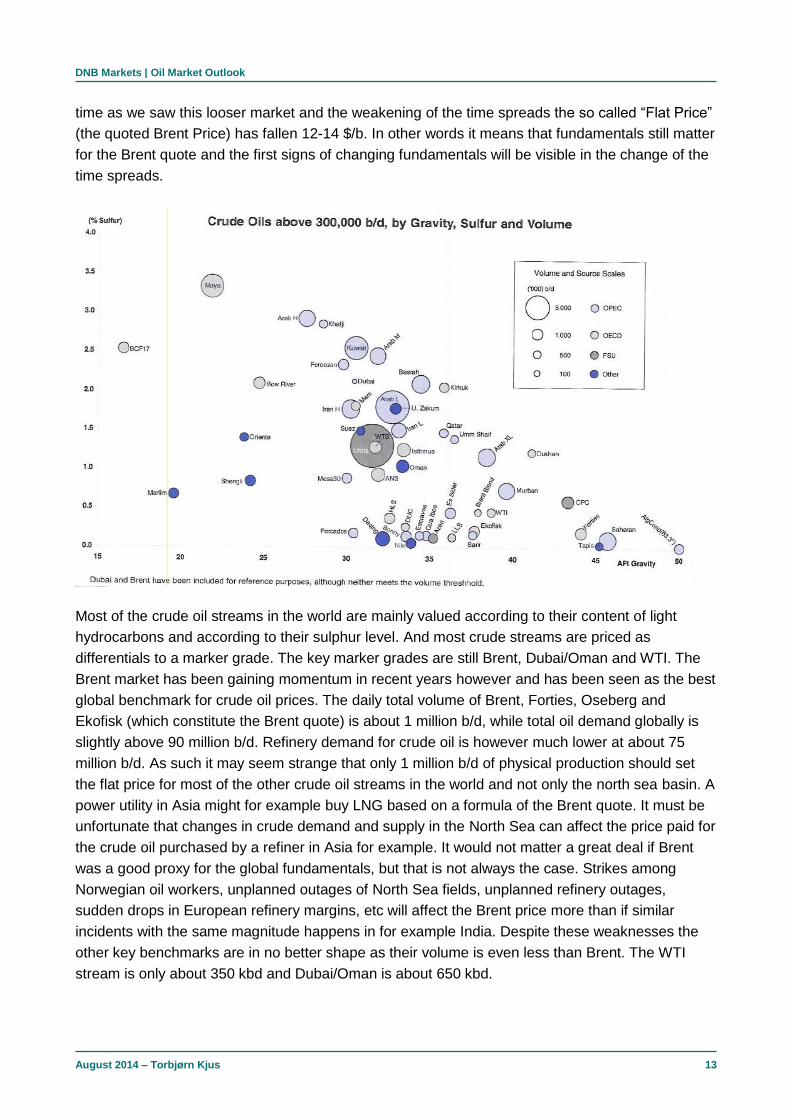
time as we saw this looser market and the weakening of the time spreads the so called “Flat Price”
(the quoted Brent Price) has fallen 12-14 $/b. In other words it means that fundamentals still matter
for the Brent quote and the first signs of changing fundamentals will be visible in the change of the
time spreads.
Most of the crude oil streams in the world are mainly valued according to their content of light
hydrocarbons and according to their sulphur level. And most crude streams are priced as
differentials to a marker grade. The key marker grades are still Brent, Dubai/Oman and WTI. The
Brent market has been gaining momentum in recent years however and has been seen as the best
global benchmark for crude oil prices. The daily total volume of Brent, Forties, Oseberg and
Ekofisk (which constitute the Brent quote) is about 1 million b/d, while total oil demand globally is
slightly above 90 million b/d. Refinery demand for crude oil is however much lower at about 75
million b/d. As such it may seem strange that only 1 million b/d of physical production should set
the flat price for most of the other crude oil streams in the world and not only the north sea basin. A
power utility in Asia might for example buy LNG based on a formula of the Brent quote. It must be
unfortunate that changes in crude demand and supply in the North Sea can affect the price paid for
the crude oil purchased by a refiner in Asia for example. It would not matter a great deal if Brent
was a good proxy for the global fundamentals, but that is not always the case. Strikes among
Norwegian oil workers, unplanned outages of North Sea fields, unplanned refinery outages,
sudden drops in European refinery margins, etc will affect the Brent price more than if similar
incidents with the same magnitude happens in for example India. Despite these weaknesses the
other key benchmarks are in no better shape as their volume is even less than Brent. The WTI
stream is only about 350 kbd and Dubai/Oman is about 650 kbd.

August 2014 – Torbjørn Kjus 14
DNB Markets | Oil Market Outlook
It is important to be aware of the fact that generally speaking crude oil is about worthless for
anyone else than a refiner. There is some direct crude burn in China, Japan and Saudi, but
generally speaking the crude has to be refined into a product before it can be consumed. Total
demand for crude oil by refiners globally is about 75 million b/d but the reported oil liquids demand
is much higher at 92 million b/d. The largest single product is gasoline which has global demand of
about 23 million b/d. The product with the largest growth, however, is diesel where global demand
now has reached almost 16 million b/d. In the non-OECD however, there will be several countries
that do not have the same strict sulphur requirements as in most of the OECD. This means that in
several non-OECD countries a product that would be classified as “Other Gasoil” in the OECD
might be classified as diesel in the non-OECD. If we include “Other Gasoil” in the diesel-category
the global diesel/gasoil demand is the largest pool of demand at more than 26 million b/d. On a
timely basis the IEA does not have figures for how large part of the oil liquids demand that is
connected to transportation, but in the World Energy Outlook from November last year, the IEA has
data from 2012 where transportation is put at 46.7 million b/d of total primary oil demand of 87.4
million b/d for that year. Transportation was hence 53.4% of total primary oil demand by sector in
2012.

August 2014 – Torbjørn Kjus 15
DNB Markets | Oil Market Outlook
If we look at the development for growth in demand by the different oil products there is a quite
interesting picture that emerges. Since the early 1990’s a clear picture has emerged with respect to
which products that are winners and which that are losers. The key winners with respect to growth
are LPG/Ethane, Diesel and Naphtha. The past ten years these products have grown on average
about 3% per year. The key oil product, gasoline, has however grown much less at only 1.2% per
year and there is no accelerating trend in the gasoline demand growth. If we look at the three best
performers, it is in fact only diesel that mainly needs crude oil as feedstock for its production. The
other key star performers; LPG/Ethane and Naphtha can be produced from Natural Gas and not
only from crude oil. The US shale revolution has started to change these dynamics in a very
profound way already.
Why would you use expensive crude oil to produce LPG to sell into the market if you rather can
use cheap Natural Gas to produce the same product? The global oil demand that was covered
outside refining used to be around 11% before the shale revolution. Now this number has
increased to almost 15% since 2008. Why is this important when we are discussing the global
crude oil price discovery? The answer is that it is important because people need to be aware that
total demand growth for oil products is not at all the same as total demand growth for crude oil.

August 2014 – Torbjørn Kjus 16
DNB Markets | Oil Market Outlook
Demand growth for oil products has never been the same as demand growth for crude oil, but the
challenge is that the last few years the difference has been blowing out, due to the reasons
mentioned above. According to IEA-data global oil demand (demand for oil products) increased 1.2
million b/d in 2013 while global refinery throughput (demand for crude oil) only increased by about
460 kbd according to FGE-data. If we use data from the monthly IEA oil reports on global refinery
throughput the increased refinery throughput in 2013 was even lower at around 300 kbd.
55
60
65
70
75
80
85
90
1986 1988 1990 1992 1994 1996 1998 2000 2002 2004 2006 2008 2010 2012 2014
Mill
ion b
/d
Global Crude Demand vs Crude Supply
Global oil demand as reported by IEA
Global crude refinery throughput (crude demand)
Total crude supply as reportd by IEASource: FGE for crude runs, IEA for crude supply and global oil demand
Total oil products demand growth is always interesting but it could in fact be even more interesting
to know how much crude oil demand will move from year to year when forecasting crude oil prices.
We have tried to illustrate this in another way in the graph above to the right. The blue line is oil
demand as it is reported every month by the IEA in its monthly Oil Market Reports. It is very visible
that demand growth is still there for oil liquids, except during the big recession, but the story is not
the same for crude supply and demand. We still hear people claiming that crude supply is not able
to grow and has flattened out since 2005, but there are lag effects at work here and since 2009
global crude supply has increased almost 3.7 million b/d to 75.8 million b/d YTD in 2014, despite
the big problems in several OPEC countries like Libya, Nigeria and Iran.

August 2014 – Torbjørn Kjus 17
DNB Markets | Oil Market Outlook
Non-OPEC production of crude oil has in fact increased about 2.8 million b/d from 2009 and until
the latest data in 2014. If you look at the red and the green line in the graph above to the right, it
becomes quite logical what has happened to average oil prices since 1986 in our opinion. In the
1990’s the growth in crude supplies was larger than the growth in crude demand. In that decade
we saw six years of falling crude prices. After 1999 and until 2013, we saw crude prices increase in
12 out of those 14 years as demand for crude oil started to increase. In the beginning this
increased demand for crude oil was met by increased production from OPEC, hence crude supply
was able to keep pace with crude demand. The flip side of higher crude supplies from OPEC was
however lower spare capacity.
As OPEC increased its crude production from 27.2 million b/d in 2001 to 30.7 million b/d in 2007
the market saw the negative development in spare capacity and oil prices started to rise. After
2008 OPEC has not been able to reach the 32.4 million b/d it produced in June that year and non-
OPEC was not able to step in. Hence crude prices continued to increase until 2013 when we saw
that crude prices topped out, started flattening and in fact fell on average 3 $/b that year. Suddenly
Non-OPEC was again able to deliver strong growth in crude supplies, mainly due to the North
American shale revolution. According to the IEA data, non-OPEC crude oil supply was able to grow
0.9 million b/d in 2013. That is the third largest growth number for crude supply outside of OPEC
ever recorded and 2014 is on track to grow about 1.1 million b/d, which will only be matched by
year 2000.
99.57%99.47% 99.48%
99.61%
98.71%
95%
96%
97%
98%
99%
100%
Naphta Gasoline Jet Gasoil FO 3.5%
Correlations to Dated Brent - level basis
If you are able to forecast the direction of global crude oil prices (Brent) you will be able to forecast
also the price direction of the key oil products. Based on monthly average prices for Brent Dated
and ICE Gasoil for the last 20 years, we find a correlation of 99.6% between the two and an R-
Square of 0.992. We get almost the same results if we only look at the last ten years, and we get
very strong correlations for all the key oil products. The weakest correlation is for Resid Fuel at
98.7% and an R-Square of 0.974, which is still very strong by the way.
y = 8.535x + 11.682R² = 0.9922
0
200
400
600
800
1,000
1,200
1,400
0 20 40 60 80 100 120 140
$/m
t
$/bbl
Brent Dated vs ICE Gasoil

August 2014 – Torbjørn Kjus 18
DNB Markets | Oil Market Outlook
There are however differences between the oil products when it comes to leading and lagging
effects towards the crude price development. The leading oil products like gasoline and diesel can
at times lead the prices of the whole oil complex. The price of diesel can for example at times push
the crude price both up and down, but it can also be a follower as the crude price is moved by
other factors. This is not the case for Resid Fuel. The largest part of the Resid Fuel demand is
bunkers for the shipping industry, and it is always pricing at a rebate vs crude oil. Crude oil is
always worth more than Resid Fuel and hence it can be described as a waste product. Refineries
would like not to produce this product at all if they could avoid it. Hence the price of Resid Fuel is
always lagging the crude price and never leading it anywhere. The shipping industry should be
very aware of these differences in price formation as the industry tightens the spec for bunker fuels
from 1% sulphur to only 0.1% sulphur in the so called ECA zones on January 1st in 2015.
The ECA zones are the Baltic Sea, the North Sea, North America and the Caribbean. If shippers
servicing these waters are not massively investing in scrubbers and/or LNG engines, we will see a
very meaningful shift from consumption of Resid Fuels to consumption of Marine Gasoil from these
players next year. FGE expect a global shift of 0.5-0.6 million b/d between these products during
2015. It means that part of the shipping industry is moving from consuming a lagging oil product to
consuming a leading product, and that could have large consequences for their costs and hence
for the oil products they choose to hedge.
August 2014 – Torbjørn Kjus 19
DNB Markets | Oil Market Outlook
3 Seasonality in the oil market – Is it there? In the oil market there are several important seasonal effects that take place almost every year at
the same months. Some of the most important are refinery maintenance (peak in April/May and
August/September), oil field maintenance (particularly in the North Sea), demand for heating
products (gasoil, heating oil, propane), demand for gasoline (the US driving season), production of
biofuels (always easier in the summer), the Atlantic hurricane season (peak in early September),
Saudi Arabia’s direct crude burning in the summer time for generating power to air-conditioning,
etc, etc.
Quite often one will see arguments from analysts relating to seasonal elements being used as
bullish or bearish arguments for the short term direction of crude oil prices. This is in isolation
problematic. Why is that? Because despite all the seasonal elements mentioned above there is no
statistical significant element that suggest that there is any seasonality in the crude oil prices.
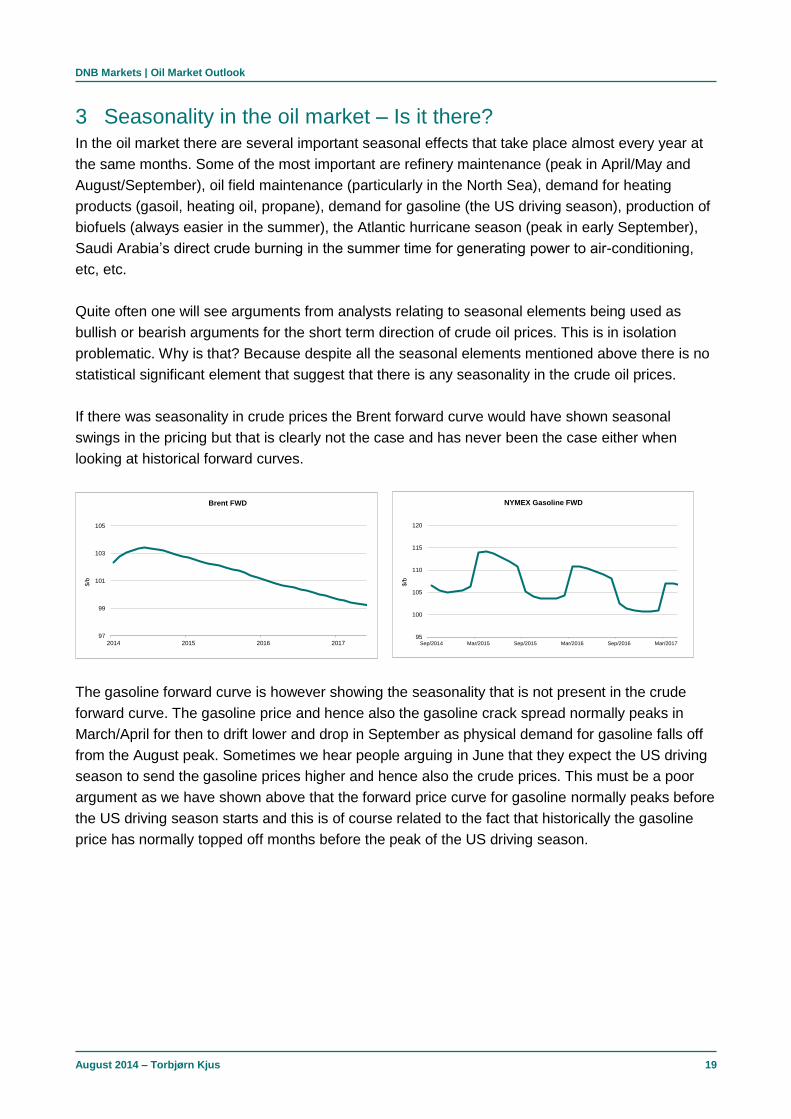
If there was seasonality in crude prices the Brent forward curve would have shown seasonal
swings in the pricing but that is clearly not the case and has never been the case either when
looking at historical forward curves.
97
99
101
103
105
2014 2015 2016 2017
$/b
Brent FWD
The gasoline forward curve is however showing the seasonality that is not present in the crude
forward curve. The gasoline price and hence also the gasoline crack spread normally peaks in
March/April for then to drift lower and drop in September as physical demand for gasoline falls off
from the August peak. Sometimes we hear people arguing in June that they expect the US driving
season to send the gasoline prices higher and hence also the crude prices. This must be a poor
argument as we have shown above that the forward price curve for gasoline normally peaks before
the US driving season starts and this is of course related to the fact that historically the gasoline
price has normally topped off months before the peak of the US driving season.
95
100
105
110
115
120
Sep/2014 Mar/2015 Sep/2015 Mar/2016 Sep/2016 Mar/2017
$/b
NYMEX Gasoline FWD

August 2014 – Torbjørn Kjus 20
DNB Markets | Oil Market Outlook
7.9
8.4
8.9
9.4
9.9
Jan Jan Feb Mar Apr May Jun Jul Aug Sep Oct Nov Dec
Mill
ion b
/d
US Gasoline Demand(Product Supplied)
Range 5 year avg 2013 2014Source: US DOE
During the past 4 years we have seen an oil price development through the year where prices
have fallen into the second quarter, but then recovered into the third and fourth quarter. One might
think this was the normal behavior as global demand for oil products increases into February for
then to fall until May and then rise significantly during the rest of the year.
86.5
87.0
87.5
88.0
88.5
89.0
89.5
90.0
90.5
Jan Feb Mar Apr May Jun Jul Aug Sep Oct Nov Dec
Mill
ion b
/d
World Oil Products Demand - last 5 year average
Source: IEA, DNB Markets
Despite the fact that global oil demand has moved in a very similar pattern as the oil price the last
four years, this is in fact not according to the normal price movement through the year. If we look at
the average price movement for Brent-prices through the year since 1989 another pattern emerge
where the price on average has increased until September for then to drop back during the last 4
months of the year. The same pattern would be visible for the Brent price after the change of the
millennium.
5
10
15
20
25
30
Sep/2014 Mar/2015 Sep/2015 Mar/2016
$/b
NYMEX Gasoline Crack FWD

August 2014 – Torbjørn Kjus 21
DNB Markets | Oil Market Outlook
0.95
1.00
1.05
1.10
1.15
1.20
1.25
Jan Jan Feb Mar Apr May Jun Jul Aug Sep Oct Nov Dec
Ind
ex
Seasonal Brent First Month Crude Prices 1989-2013
Source: DNB Markets, Reuters
Since the forward curve is not reflecting any seasonality in the Brent price and since the average
price development for Brent-prices the past 25 years (and also the past 10 years) is showing no
relationship with what is happening to seasonal oil demand through the year, it is probably a good
argument against using seasonal demand patterns as a key argument for what is going to happen
to oil prices. We are not saying that seasonal factors never affect the price discovery but it
probably needs to be in combination with other factors in the oil market in order to move prices. It
is for example not enough to state that we think oil prices will drop in the second quarter because
that has happened the past 4 years. We have shown above that it is in fact only the past 4 years
that a price drop in the second quarter has materialized. Equally it is not a particularly good
argument for higher oil prices when you are standing in September that global oil demand is now
increasing seasonally so the oil price should increase as well. But if for example the seasonal
change comes in addition to another argument it could definitely have a price effect in our view.
If for example global demand for crude oil (refinery throughput) is increasing significantly as
refineries are coming out of maintenance at the same time as global inventories of crude oil stocks
are very low, the seasonal effect of the refinery throughput may provide an upward price
movement in crude oil. If OECD oil stocks are low that argument of higher refinery throughput
could be used as an argument for higher oil prices. The problem with this argument however is that
if it is not crude oil stocks that are low, but product stocks, as refineries return from maintenance a
lot of new oil products are going to be produced while crude stocks will draw down but from a high
level. It is also visible in the graphs below that despite increasing demand for oil products from May
to August last year, there was no drawdown in OECD product stocks but instead a build as
refineries were ramping up runs. If we are in a situation where crude stocks are low while refineries
are into the seasonal ramp up we would however view the situation differently and would say that
the seasonal ramp up in crude throughput should be bullish to crude oil prices.
0.90
0.95
1.00
1.05
1.10
1.15
Jan Jan Feb Mar Apr May Jun Jul Aug Sep Oct Nov Dec
Ind
ex
Seasonal Brent First Month Crude Prices 2010-2013
Source: DNB Markets, Reuters

August 2014 – Torbjørn Kjus 22
DNB Markets | Oil Market Outlook
1,250
1,300
1,350
1,400
1,450
1,500
1,550
Jan Feb Mar Apr May Jun Jul Aug Sep Oct Nov Dec
Mill
ion b
arr
els
OECD Total Industry Product Stocks
5 year range 5 year avg 2013 2014Source: IEA
Last year global refinery throughput increased more than 4 million b/d from May to the peak in July
according to IEA data. How was the world able to cope with this massive increase in refinery
throughput in just those few months? Did we see a large increase in OPEC production to cover for
this massive increase in crude demand? The answer is no. OPEC reduced its crude production by
about 0.2 million b/d from May to July. How about non-OPEC crude production then? Yes there
was an increase but only 0.35 million b/d in crude output. Biofuel also increased 0.2 million b/d in
the period but that did not do anything to cover crude demand of course. We have one more
contribution in the visible reported data and that is crude stocks in the OECD. Did they draw down
massively then in this period? Well, they drew down 36 million barrels which equals 0.6 million b/d.
It can hardly be described as a massive stock drawdown compared with the reported increase in
refinery throughput of more than 4 million b/d for the period.
Something is clearly missing in the data here. We have demand for crude increasing by 4 million
b/d and we can only identify increased crude supply and stock draws of net 1 million b/d. Using the
JODI-database and adding our own database for Chinese oil stock movements, we can identify
another 16 million barrels stock draw for the May-July period last year. This is only about 0.3
million b/d and still leaves us with about 2.7 million b/d of increased crude demand that we cannot
figure out how was covered. The most plausible alternative is probably that the crude stock draws
in the non-OECD was much larger than what we can find in the JODI-data, but 2.7 million b/d
equals 162 million barrels and that seems very large. One would think that this large increase in
crude throughput last year without a subsequent large increase in production would send crude oil
prices exploding to the upside in this period. The Brent price did increase from May to July but by
no more than 5.5 $/b. The peak month for the Brent price last year was in fact September, and by
then the demand for crude oil had already decreased for two months…
850
900
950
1,000
1,050
Jan Feb Mar Apr May Jun Jul Aug Sep Oct Nov Dec
Mill
ion b
arr
els
OECD Total Industry Crude Stocks
5 year range 5 year avg 2013 2014Source: IEA

August 2014 – Torbjørn Kjus 23
DNB Markets | Oil Market Outlook
The point is that it is hard to forecast the price development for crude prices based on the global
seasonal changes in crude demand. We have seen people forecasting that global refinery
throughput will swing seasonally up by 2.4 million b/d from May to August, and they wonder where
this incremental production is going to come from. Well, this number is very close to the average
increase in global crude throughput from May to August and crude stocks in the OECD are higher
than the 5-year average. The US still has very high crude oil stock levels while Europe is close to
the 5-year average. Non-OECD crude stocks are not very visible and based on the story from last
year the JODI-data does not seem very trustworthy, but at least is seems that China holds more
crude inventory than last year. The bottom line is that seasonal factors can be quite tricky to use as
arguments for what is going to happen to oil prices in the short term, at least if you only use one
seasonal argument and don’t’ take other factors into consideration at the same time.
70
71
72
73
74
75
76
77
78
79
Jan Feb Mar Apr May Jun Jul Aug Sep Oct Nov Dec
Mill
ion b
/d
Global Refinery Throughput
5 year range 5 year avg 2013 2014Source: IEA
0.0
1.0
2.0
3.0
4.0
5.0
6.0
7.0
8.0
9.0
Jan Feb Mar Apr May Jun Jul Aug Sep Oct Nov Dec
Mill
ion
b/d
Global CDU Refinery Maintenance
2011 2012 2013 2014Source: FGE

August 2014 – Torbjørn Kjus 24
DNB Markets | Oil Market Outlook
4 Investments in the global oil industry vs production & price Two years ago we warned that the shale oil revolution might be a threat to the most expensive oil
projects around the world. We argued that the most expensive barrels risk being pushed out of the
market by shale oil, just like the Russian Shtokman project was pushed out of the market by shale
gas. Shale oil is not particularly cheap, it seems to require Brent prices in the 60-105 $/b range in
order to be developed, but the cost curve is very different from the other resources out there.
0
20
40
60
80
100
120
140
160
180
1% 10% 19% 28% 37% 46% 55% 64% 73% 82% 91% 100%
$/b
% of Supply
Current Marginal Supply vs Oil Price(The bars show the high end of majority analyst estimates of break even prices by source)
OPEC Spare Capacity Conventional Middle East Conventional CIS
Conventional Africa Conventional South America Most Off-Shore
Shale Liquids Tar Sands Expensive Off-Shore, GTL, CTL, Biofuel, Arctic?
Global Oil Demand
Source: J.T.Gabrielsen Consulting (study on analyst estimates of break even prices by source of supply), IEA, PIRA Energy, DNB Markets
According to the Goldman Sachs report “400 projects to change the world”, which was released on
May 16, the cost curve for the shale projects range from 60-105 $/b, however 90% of the curve is
flat at 80-85 $/b. According to the Goldman report, it would require an oil price of 40-100 $/b to
develop 4 Million b/d of peak production from Deepwater projects, 20-110$/b for Traditional
projects to reach 4 Million b/d, 40-110$/b for Heavy oil projects to reach 5 million b/d at peak and
35-110$/b to develop Ultra deepwater at peak production of 8 million b/d. It would however not
require a higher oil price than 85 $/b to see peak production of US shale oil reach 10.5 million b/d.
This changes the whole industry as there is no longer a requirement for oil prices to increase
anymore in order to cover the market need for the rest of the decade. We hence maintain our view
of the oil market that we launched two years ago when we claimed that the shale oil is a game
changer for the global oil industry.
There are several quotes from Goldmans’ top 400 report we would fully agree with. Here are some
of them: “As shale supply continues to grow from the US with no potential upside to oil demand,
significant downside risks continue to plague oil prices”. “Shale dominates volumes and pushes
high cost developments into irrelevance”. “Assuming the pace of activity in developing US shale oil
reserves remains high – a scenario that is likely with oil prices above 85 $/b – the global oil market
will continue to be well supplied in our view. We believe this could have material consequences for
oil discoveries that sit at the top of the cost curve, which may not get developed”. “The
consequence of shale developments is a displacement of projects with break-evens above 85 $/b
Brent”.
0
20
40
60
80
100
120
140
160
180
1% 10% 19% 28% 37% 46% 55% 64% 73% 82% 91% 100%
$/b
% of Supply
2020 Marginal Supply vs Oil Price(The bars show the high end of majority analyst estimates of break even prices by source)
OPEC Spare Capacity Conventional Middle East Conventional CIS
Conventional Africa Conventional South America Most Off-Shore
Shale Liquids Tar Sands Expensive Off-Shore, GTL, CTL, Biofuel, Arctic?
Global Oil Demand
Source: J.T.Gabrielsen Consulting (study on analyst estimates of break even prices by source of supply), IEA, PIRA Energy, DNB Markets

August 2014 – Torbjørn Kjus 25
DNB Markets | Oil Market Outlook
It seems the oil majors are now responding to this new situation after pressure from their
shareholders. The focus is shifting from volume to project economics and return focused capital
discipline. Why would you in the new resource world invest billions of dollars to develop a project
that requires 100 $/b or higher to break even? Studies have shown that more than 400 billion USD
of global CAPEX is at risk if oil majors choose not to invest in projects that require a higher oil price
than 85 $/b in order to be developed. According to Barclays Capital’s E&P spending report
published in June, the oil majors will be cutting their spending by 1% in 2014. Total global E&P
spending will still grow 6% to 712 billion USD according to the report, but the increase is coming
from US independents and from National Oil Companies and not from the oil majors. US CAPEX
E&P spending is set to increase by 9.6% as focus continues to shift towards US onshore. US
CAPEX spending has now increased from about 100 billion USD in year 2010 to an estimated 164
billion USD in 2014.
A growth of 6% in global E&P CAPEX spending might not seem too bad, but remember that the
average yearly growth has been about 14% since year 2000. For the oil majors the average growth
in the 2000-2013 period has been 8.1% according to the Barclays report. For the last three years
the average growth in E&P CAPEX spending for the oil majors has been 12%. This puts a drop in
CAPEX of 1% from the oil majors into perspective. IHS upstream spend report for Q2 which was
recently released confirms the same trend as in the Barclays report that the growth in global
upstream spending is not as strong as before. IHS estimates that the growth will be 4.7% in 2014
and 6.3% in 2015 after having averaged 13% in the years 2011-2013. DNB Markets own E&P
spending report was released last week and the conclusions are fairly similar to the mentioned
figures from the Barclays report. The report points to broadly flat offshore spending for 2014 and
early indications for 2015 are soft as well. After having seen a compound annual growth rate
(CAGR) of 22% on offshore spending in the 2003-2008 period and 16% in the 2010-2013 period it
is a totally different world for the offshore service industry right now with basically flattish growth.
Total global E&P spending is in the report estimated to increase 4.3% in 2014 but the growth is
coming mainly from US onshore spending which in our in-house survey is estimated to grow 7.3%
this year. The oil majors are expected to cut their CAPEX spending by 0.7%, which is very similar
to the conclusions from the Barclays report.

August 2014 – Torbjørn Kjus 26
DNB Markets | Oil Market Outlook
Some analysts claim that the cut in CAPEX spending from the oil majors will result in higher oil
prices. The argument might be valid, but if it is valid it will be extremely difficult to time the effect of
lower investments and how and when it will hit production growth. Will it take three years, will it
take six years, or will it take even longer before reduced CAPEX from oil majors hits the production
numbers meaningfully enough to provide any price support for the oil market? It is also important to
be aware of the diminishing role the oil majors hold in the oil market now, compared with just 6-7
years ago. In 2007 the oil majors produced about 15% of the global oil liquids output. Now this has
dropped to around 10%. The oil majors are no longer the key providers of growth in oil liquids
output and we saw large decreases in production from these players in 2011 and 2012.
Several of these players seem however about to turn the corner when it comes to production data
for oil liquids output. In 2013 production from these players was practically flat and for some of
them we actually saw some growth last year. The market did not need any growth from these
players the in 2013 and so far into 2014 we see record high growth in oil liquids production outside
of OPEC, even without the oil majors on board. Nonetheless we will probably see some growth
contributions also from these players in the coming 3-4 years, even though the market may not
need these barrels. This of course has to do with the lag effects from investments to production in
the oil industry. Many of these companies have built their investments and key projects through the
last 7-10 years and it seems we have just started on a 3-5 year period where we will see a
substantial increase in project start-ups. Exxon, the largest of the international oil majors, is starting
up a record number of projects this year according to the company. This happens even as the
company communicated CAPEX cuts of 13% from 2013 to 2015. Exxon still expects its oil liquids
production to increase by about 300 kbd to 2.35 million b/d from 2013 to 2016.
Historical CAPEX numbers for the global oil industry shows that from 1981 to 1987 global CAPEX
spending fell almost 50%. One might assume that such a large reduction in spending would have
resulted in weaker oil production numbers fairly quickly. Well, that did not happen. In fact, during
the period from 1981 to 1987, non-OPEC production ex. FSU increased from 25.4 million b/d to
31.2 million b/d. It took about 4-5 years before the massive cut in spending started to affect
production growth negatively, and production did not decrease it only grew much slower.

August 2014 – Torbjørn Kjus 27
DNB Markets | Oil Market Outlook
From 1986 to 1990 production only grew 0.8 million b/d, but then started accelerating again until
1996. Then we had a very weak period of production growth outside of OPEC and FSU, where
production practically did not increase for 12 years from 1997 and until 2009, despite the extreme
increase in CAPEX spending in the oil industry from 2002 to 2009. After 2009 we have however
seen global oil liquids production including NGLs but excluding OPEC and FSU increase by a large
4.1 million b/d. Again there seems to have been a large lag effect from investment and the effect
this has on production numbers.
It is also worth highlighting that in the period 2002 to 2009 where CAPEX in the oil industry started
“exploding” to the upside, we mainly saw cost inflation and not much activity growth. The year 2006
is probably the best example. In that year the global CAPEX spending grew nearly 30%, yet
activity growth was negative. How can one expect to see production growth in such an
environment? The last couple of years however the activity growth has been the largest part of the
spending growth and not inflation. Maybe this together with the shale revolution in the US can help
explain why non-OPEC production also outside the US has started to perform a lot better the last
two years. A good example is the Norwegian oil sector which has been in decline since the
millennium change. During 2013 we saw a large increase in the activity level in the Norwegian
Continental Shelf and surely enough, Norwegian oil production during the autumn of 2013 stopped
declining. The average yearly decline in Norwegian oil production has been around 5% the past
ten years and in 2013 the decline was 3.7% after having been 6.2% in 2012. With half of the year
behind us for 2014 we have seen an increase in Norwegian oil production compared with the first
half of 2013.
-25%
-20%
-15%
-10%
-5%
0%
5%
10%
15%
2003 2004 2005 2006 2007 2008 2009 2010 2011 2012 2013 2014
Norwegian decline rate
Source: IEA
-40%
-30%
-20%
-10%
0%
10%
20%
30%
40%
2003 2004 2005 2006 2007 2008 2009 2010 2011 2012 2013 2014
UK decline rate
Source: IEA

August 2014 – Torbjørn Kjus 28
DNB Markets | Oil Market Outlook
5 US Shale oil production – evolution or revolution? The total oil production outside of OPEC has increased about 1.8 million b/d vs last year in 2014
and about 1.5 million b/d of this is crude oil according to the IEA database. This means that more
than 83% of the increase in non-OPEC output this year is classified as crude oil and not NGLs.
The US is still behind most of the growth in oil liquids output outside OPEC at about 1.3 million b/d,
where 1 million b/d is crude oil and 0.3 million b/d is NGLs. The US is in other words still the most
important country for growth in oil production outside of OPEC and it will most likely continue to be
the most important growth country for the rest of the decade.
US crude oil production peaked in November 1970 at 10 million b/d and had then been in more or
less steady decline to about 5 million b/d of production in 2006. Then gradually higher oil prices
meant more investments in existing production and hence field decline was kept in check and
production stabilized around 5 million b/d until 2009. Then during 2009 and 2010 we saw a jump in
production to about 5.5 million b/d mainly due to better production from offshore Gulf of Mexico.
Then during 2011 the shale revolution really started kicking in. Since January 2011 US crude
production has increased about 3 million b/d and is currently about 8.5 million b/d. If we include the
almost 3 million b/d of NGLs output (mainly ethane/propane/butane from natural gas fields) then
US total oil liquids production is record high and approaching 11.5 million b/d. US NGLs production
has increased about 1 million b/d since 2009. Since domestic demand could not keep pace with
this production growth of NGLs, and since exports of oil products is allowed, we have seen US
total NGLs exports “explode” to the upside since 2009 from 100 kbd to about 700 kbd. Most of this
export is LPG.
-1.5
-1.0
-0.5
0.0
0.5
1.0
1.5
2.0
2.5
3.0
2003 2004 2005 2006 2007 2008 2009 2010 2011 2012 2013 2014
Mill
ion
b/d
Year on Year Global Non-OPEC Supply
Source: IEA

August 2014 – Torbjørn Kjus 29
DNB Markets | Oil Market Outlook
Crude oil exports are not allowed under US law and condensate is generally included under the
crude oil definition. Since exports of refined products are allowed, it means that this to a large
extent becomes a question of definitions of what is a product and what is crude oil. If you can
classify the oil as a product you do not need a permission to export it. Recently two potential US oil
exporters were given a permission to export condensate from the Eagle Ford under a ruling by the
US Bureau of Industry and Security (BIS). Crude oil is defined as a liquid hydrocarbon that has not
been processed through a crude oil distillation tower, but the two companies claims that their
stabilization process of the condensates involves distillation and hence these products are no
longer under the definition as crude oil but satisfies the definition as a refined product once the
most volatile components are removed in the so called stabilizer. The BIS agreed in this
interpretation and this has unleashed a lot of discussions in the industry as virtually all condensate
and crude oil passes through some sort of stabilizer in the field.
If more companies apply for similar treatment it could lead to a meaningful increase in condensate
exports from the US which in turn could be the first step for a general allowance to export US
domestically produced crude oil. The first export of this type looks to be from the Eagle Ford field in
Texas. Eagle Ford production includes many different grades of crude but is mainly concentrated
at API gravities in the low 40’s. For information we can mention that the Brent API number is 37.9.
Eagle Ford output of crude oil with API above 50 will probably be around 250-300 kbd in the
second half of 2014, but the growth in Eagle Ford production the latest year has mainly been in
material with API below 50. Do however remember that the ruling from the BIS is not about API
number but about stabilizing the oil at the field in a simple distillation process and as such there is
no guarantee that other producers/exporters will use this ruling to get a license to export crude with
API numbers above 50. Questions on the controversial ruling by the BIS have been raised by
Congressional leaders and it will be interesting to see what comes out of this during the coming
year. The US EIA plans to release two reports in September examining some of the key issues
surrounding a potential end to the country’s ban on crude exports that has been in place for
decades. No matter the outcome of the mentioned ruling we would claim that we are one step
closer to see exports of crude from the US and we would expect the first crude exports to take
place within the next three years.
In our opinion the word revolution is definitely a good description of the increased US crude oil
production the last couple of years. A revolution of a market is described in the Oxford dictionaries
as “a dramatic and wide-ranging change in conditions, attitudes or operation”. That is a good
description of what has happened in the US oil market, and as far as we know, there was no highly
respected analyst that predicted that the US would be able to increase its crude oil production by 3
million b/d in just three years. It has happened with a speed and magnitude that certainly classifies
to be branded as a revolution, also due to the fact that the extraction technique is different from the
traditional oil industry. Goldman Sachs writes in their top 400 report that since 2008, shale has
added 158 billion barrels of oil reserves among the 400 projects they track in the report and this is
twice the amount added through traditional exploration over the past 15 years. In our view this
change in the market is dramatic and it has wide ranging effects on pricing, trading patterns, US
domestic politics, the global refining industry, geopolitics, etc. In other words it is a revolution.

August 2014 – Torbjørn Kjus 30
DNB Markets | Oil Market Outlook
We could see that the word evolution could also be used, in the sense that the shale resources
would probably not have hit the market had oil prices stayed below 50 $/b. The rising oil price has
released a supply response that was hard to predict just three years ago and as such one could
also use the world evolution to describe what is going on in the oil industry. But since the shale
industry is a totally different industry than the traditional oil industry we think the word revolution is
a better description.
Traditionally until a well is drilled into the ground it is impossible to know for sure if any
hydrocarbons will be found. Some wells turn out to be dry while others contain oil. The whole game
for a large oil company has been to minimize the risk of drilling expensive dry wells through huge
spending on seismic data, gravity and magnetic surveys and usage of super computers to crunch
the data. Many of the world’s smartest scientists and geologists maneuvers through the massive
amounts of data in order to decide where to drill the wells, but at the end of the day one cannot be
sure that the resource is really there until the well is drilled. There has in other words always been
a large element of luck involved in this industry as the conventional production has targeted small
and hard-to-find accumulations of oil.
The shale revolution is now changing the odds as shale production is mainly produced directly
from the source rock and not from oil accumulations of trapped oil that is hard to find. Instead shale
production targets formations which stretch continuously over tens of thousands of square meters.
The buried oil resources are less dense than water and unless it is stopped on its way upwards in
a formation capable of trapping the oil it will migrate up to the surface where it will evaporate. Most
of the world’s oil has been lost in this kind of evaporation through history. Only the last 150 years
has the global oil industry been able to drill below ground to locate pockets of trapped oil and bring
this to the surface. Until the shale revolution oil could not be produced directly from the source rock
as the pores in the rock were too small and too poorly connected. One had to wait for the migration
of the oil and for the oil to be trapped in a reservoir. Conventional oil and shale oil are often found
in the same areas. In Texas for example the shale oil now produced is from the source rock that
has already contributed to decades of conventional production in the same area. One of the
revolutionary differences between shale oil and conventional oil, however, is said to be that shale
oil should be more broadly distributed than conventional fields as you do not have to wait for the
migration. One could produce from the source rock even when no oil has previously been trapped
and produced above that source rock. Not all of these resources will prove economically feasible of
course. They have to compete with other sources in terms of cost of production and some shale
will probably prove to be too expensive. New countries and companies will however be included in
the oil industry due to this new resource and as such the shale oil revolution is in our opinion a true
game changer.

August 2014 – Torbjørn Kjus 31
DNB Markets | Oil Market Outlook
In order to try and put the shale revolution into perspective, let us use a quote from the recently
released IEA Medium Term Oil market Report. The following quote is from page 1 in the executive
summary: “In this Report, the baseline of US and Canadian production for 2013 is 330 kbd higher
than had been expected last year, 420 kbd greater than forecast in 2012, 2.2 million b/d higher
than anticipated in 2011 and 3.21 million b/d above 2010 projections.” In other words, the supply of
crude oil in 2013 was 3.2 million b/d higher than what the agency predicted 4 years ago. We have
seen a new Iraq thrown into the market in under 4 years. And for the years 2012-14, the IEA is on
track to miss their initial forecast for production growth in these three years by about 2 million b/d.
The IEA is of course not the only forecaster that has been way to negative to the growth in US
shale oil production. In 2012 the US Energy Information Agency (EIA) estimated that production
from eight selected shale oil fields would range from a low case of 0.7 million b/d to a high case of
2.8 million b/d by 2035. The high end of that projection is now already surpassed. If someone told
you in 2010 that the IEA is going to miss their production estimates for the US by more than 3
million b/d during the next 3 years and you believed them, it would not be very difficult to be
bearish to oil prices. In fact it would be kind of strange if you did not turn bearish to oil prices if you
thought that was going to happen. The Brent price is however still above 100 $/b, but that is due to
factors we will discuss later in the report.
0
200
400
600
800
1000
1200
1400
Jul-11 Jan-12 Jul-12 Jan-13 Jul-13 Jan-14 Jul-14
Kb
d
IEA Forecasted YoY Growth In US Liquids Production
2012 2013 2014 2015Source: IEA Monthly Oil Market Reports

August 2014 – Torbjørn Kjus 32
DNB Markets | Oil Market Outlook
6 Large changes in trade patterns and refining The large increase in US domestic oil production has brought with it large reductions in net oil
imports. The country flipped into becoming a net exporter of refined products just three years ago
and crude oil imports has dropped from above 10 million b/d in 2008 to now stand closer to 7
million b/d. African crude oil is generally speaking no longer heading for the US market and this is
how the US shale revolution has affected the global crude oil price. The crude that is no longer
flowing to the US market has to find other buyers in Europe but even more so in Asia. As the
African barrels instead of moving to the US GOM has been forced to mainly target the Asian
market, this has supported the crude freight market as the tonne/miles for these barrels have
increased threefold. But now there are no more African barrels that can be removed and for the
shipping industry the big question is who will be the next to drop out. If US exports of crude oil is
not allowed, more imports will have to be forced out, and that may be barrels from the Persian Gulf
(which will be negative for tonne/miles) or maybe it will be Venezuela/Mexico (which will be positive
for tonne/miles). If on the other hand US exports of crude are allowed, the gross imports and
exports movements that will follow will probably be positive for crude shippers.
Since it is still not allowed to export the domestically produced US crude oil and since pipelines
now have been built to move the congested US crude oil from Cushing in Oklahoma down to the
US refinery cluster at the Gulf Coast, the crude price in the US GOM has disconnected from the
global oil prices. This happened exactly one year ago as the long held discount of Brent vs
Louisiana Light Sweet (LLS) suddenly flipped in favor of Brent. In other words, Brent has priced
structurally more expensive than LLS during the latest year and this has never happened before.
Please note that we are here not at all discussing the Brent vs WTI spread which blew out already
three years ago due to the lack of pipeline take-away capacity from Cushing. This latest
development through the last year between the waterborne crudes in Europe and the US is more
interesting in our view as it influences the physical behavior of the US refineries much more
pronounced as almost half of that country’s refining capacity is located around the Gulf Coast.

August 2014 – Torbjørn Kjus 33
DNB Markets | Oil Market Outlook
So what does a US refiner which is located at the US GOM do when suddenly he has a feedstock
cost that is 5-10 $/b cheaper than the prior year compared with his European competitors. It is
quite an easy question right? He starts ramping up his crude throughput as much as possible of
course, because unlike the crude producer the refiner is allowed to export his products. A good
chunk of this export has hit Europe. According to IEA data US exports of oil products to Europe
increased from 1.45 million b/d in 1H-2013 to 2.56 million b/d in 1H-2014. In addition the US
refiners have taken market shares from their European peers in Africa and Latin America. In
practice the fact that the US does not allow exports of its crude oil but allows exports of refined
products can be viewed as subsidizing the country’s refining industry. This surely must be
problematic with respect to free trade agreements, etc. Currently the EU is pushing for raw
materials, including oil and gas to be part of the proposed Transatlantic Trade and Investment
Partnership and is seeking the elimination of US exports restrictions according to the Financial
Times.
Several studies have recently shown that the benefits would be much larger for the US economy if
free exports of crude were allowed. There would be much more jobs created by allowing crude
exports than by allowing only refined product exports and that should be possible to sell for US
politicians to its electorate. No more refineries will be built in the US even if the current situation
prevails (hence very few extra jobs in refining) and even if exports of domestically produced crude
oil might increase the domestic crude price vs the international price of crude and hence reduce
the refinery margin for US refiners, it would not reduce the number of jobs in the refining industry.
But if exports of crude oil would be allowed it would create a lot of new jobs. IHS has calculated
that due to increased direct upstream investments and hence production growth, 964.000 new US
jobs would be created if free trade is allowed. IHS calculates that free trade would increase oil
production by 1.2 million b/d compared with the current situation and that investments will increase
by 82 billion USD.
Even if it is not allowed to export the US domestically produced crude oil, the US does not exist in
a vacuum and the flip side of the increased refinery throughput in the US (extra crude demand) is
reduced refinery throughput in Europe.
11.5
12.0
12.5
13.0
13.5
14.0
14.5
15.0
15.5
16.0
16.5
17.0
Jan Jan Feb Mar Apr May Jun Jul Aug Sep Oct Nov Dec
Mill
ion
b/d
US Refinery Crude Runs
Range 5 year avg 2013 2014Source: US DOE
European refiners started to massively scale back their throughput at the exact same time as the
US refiners started to scale up their throughput. Since last summer the refinery throughput in the
EU has been reduced by about 0.9 million b/d. This is the key reason why the lost barrels from
Libya were not able to push the Brent price higher.

August 2014 – Torbjørn Kjus 34
DNB Markets | Oil Market Outlook
After all the market lost about 1 million b/d of light sweet crude oil from Libya last summer which
mainly went short haul just across the Mediterranean to European refiners, but despite a short term
spike in oil prices that sent the market to a 117 $/b high in late August, the market has in fact
trended lower since then, despite still ongoing problems in Libya, despite the outbreak of civil war
like conditions in Iraq and despite still shut out barrels from Iran due to the nuclear stand-off.
The key issue to be aware of is that even though Europe lost a lot of crude supply since last
summer, we have also lost about the same level of crude demand. Since EU crude oil demand has
continued to weaken we have seen days of demand coverage for crude oil stocks in the EU
increase from about 41 days of coverage in January 2012 to now stand at about 50 days of
coverage. Crude oil stocks in Europe are hence on the high side despite all the lost barrels from
Libya and others.
34
37
40
43
46
49
52
55
58
Jan-2003 Jan-2005 Jan-2007 Jan-2009 Jan-2011 Jan-2013
Days
EU Crude Oil Stocks - Days of Demand Coverage
Source: Euroilstocks via Reuters

August 2014 – Torbjørn Kjus 35
DNB Markets | Oil Market Outlook
7 Where is the accelerating global oil demand growth? IMF adjusted its global economic growth forecast for 2014 down to 3.4% in late July. This is 0.4%
stronger than the growth reported for 2013. For 2015 the IMF still expect global economic growth
of 4%. Based on the old relationship between global economic growth and global oil demand
growth we should see about 1.5% oil demand growth in 2014 based on 3.4% economic growth (a
long-term oil intensity factor of 0.45). Yet oil demand growth so far in 2014 is only 0.9% which
equals 0.8 million b/d. Last year global oil demand grew 1.1 million b/d which equals 1.2%. Why is
not global oil demand growth accelerating compared with last year when global economic growth is
13% stronger than in 2013? We think it has a lot to do with which regions we see the economic
growth improving. The advanced economies are on track to improve the economic growth
significantly from 1.5% the last three years to around 2% in 2014, while the emerging and
developing economies experienced economic growth of 5.3% the last three years while 2014 is on
track to come in below 5% growth. The average economic growth in the emerging economies has
in fact averaged 6.4% the last ten years and hence economic growth in that part of the world is
significantly lower than before.
Demand change in % Change 2012 Change 2013 YoY Last 3 mts 2014 YTD Chg: Forecast 2014 Forecast 2015
North America (Canada, Mexico) 0.3 % 0.1 % -1.3 % -1.8 % -1.1 % 0.0 %
US -2.1 % 2.1 % -0.4 % 0.3 % 0.2 % 0.0 %
OECD Europe -2.9 % -1.4 % -1.6 % -1.9 % -1.1 % 0.0 %
Australia, New Zealand, Japan, Korea, Chile 4.3 % -1.7 % -2.9 % -1.6 % -0.9 % 0.0 %
Europe/Africa Med & FSU 2.0 % 1.7 % 1.8 % 2.2 % 2.1 % 2.0 %
Middle East AG excl. Iran and Saudi 5.6 % 3.7 % 2.7 % 3.7 % 3.4 % 3.0 %
Iran -0.3 % 0.3 % 2.2 % 2.6 % 2.7 % 3.0 %
Saudi Arabia 6.8 % 1.9 % 4.7 % 4.2 % 3.7 % 3.0 %
Asia Pacific/East Africa excl. China and India 2.7 % 3.2 % 3.2 % 3.1 % 3.1 % 3.0 %
China 4.6 % 2.4 % 2.8 % 2.3 % 2.1 % 2.0 %
India 5.0 % 0.4 % 2.6 % 2.1 % 2.1 % 2.0 %
West Africa 3.1 % 1.8 % 4.1 % 1.7 % 2.3 % 3.0 %
Latin America (excl. Mexico) 3.3 % 3.2 % 2.6 % 3.0 % 2.8 % 2.5 %
Total World 1.2 % 1.2 % 0.8 % 0.9 % 1.0 % 1.3 %
Demand change in Million b/d Change 2012 Change 2013 YoY Last 3 mts 2014 YTD Chg: Forecast 2014 Forecast 2015
North America (Canada, Mexico) 12 -1 -59 -82 -55 4
US -405 399 -79 62 32 -2
Europe -428 -197 -227 -263 -154 7
Australia, New Zealand, Japan, Korea 349 -150 -230 -131 -89 14
Total OECD -472 51 -595 -414 -265 23
Europe/Africa Med & FSU 145 134 138 166 154 163
Middle East AG excl. Iran and Saudi 132 91 71 92 88 79
Iran -6 3 40 46 51 54
Saudi Arabia 192 52 148 126 111 94
Asia Pacific/East Africa excl. China and India 224 272 281 269 270 268
China 434 232 282 226 215 200
India 177 15 98 81 82 75
West Africa 40 24 54 23 30 41
Latin America (excl. Mexico) 206 204 174 195 179 173
Total Non-OECD 1,543 1,026 1,287 1,225 1,180 1,149
North America -393 398 -138 -19 -23 2
Europe/Africa Med & FSU -283 -63 -89 -98 1 171
Middle East AG/Asia Pacific/East Africa 1,501 515 691 710 728 785
Middle East AG 318 146 259 264 250 228
Asia Pacific/East Africa 1,184 369 432 445 478 557
West Africa 40 24 54 23 30 41
Latin America (excl. Mexico) 206 204 174 195 179 173
Total World 1,070 1,077 692 810 915 1,172

August 2014 – Torbjørn Kjus 36
DNB Markets | Oil Market Outlook
Since 1983 the trend line global oil demand growth has been 1.7% according to the BP stats. Then
the recession kicked in during 2008-09 but the last 4 years we have again seen growth in oil
demand. The growth in oil demand the last couple of years has been stable and solid but it is at the
same time about 0.4-0.5% weaker than before the 25-year old almost linear trend line of 1.7%
growth was broken in 2008. Are we going to return to the trend line? If all the changes in demand
that we have seen during the past 6-7 years have only been cyclical due to changes in macro-
economic conditions one could argue that we could in fact return to the old trend line. We do
however not believe that all the changes in oil demand is due to cyclical factors alone and hence
we do not believe that the old trend line can be achieved for the coming 5-10 years.
77
79
81
83
85
87
89
91
93
95
97
99
2003 2005 2007 2009 2011 2013 2015
Mill
ion b
/d
Global Oil Demand(12-month mavg)
Source: IEA

August 2014 – Torbjørn Kjus 37
DNB Markets | Oil Market Outlook
8 Oil demand in the OECD continue to trend lower OECD oil demand continue to trend lower despite a 6-9 month period of strong growth in US oil
demand that now seems to be fading away. It has to do with substitution and efficiency
improvements and not only with economic growth. As oil prices ran away from all the other energy
prices after 2003, why would not people try to use other sources of energy if they can? This
substitution effect accelerated the faster the oil price increased and particularly affected the usage
of Resid Fuel and Heating oil in the OECD. There is not that much more potential for further
negative substitution effects in the OECD, but every year the heating oil market grows smaller in
both Europe and the US, and Japan is likely to restart a solid chunk of their nuclear power which
will also replace some of the stationary oil usage in that country. This kind of reduced oil demand
will not come back if the economy starts growing because another energy source has captured that
demand. Why would a German who has finally ditched his heating oil tank and put a solar panel on
his rooftop ever dig up his garden again and put back a heating oil tank?
43
44
45
46
47
48
49
50
51
52
53
2002 2004 2006 2008 2010 2012 2014
Mill
ion b
/d
OECD Oil Demand
Source: IEA (except for the US where EIA is used as the source)
Efficiency improvement is the other key factor that has removed the old relationship between
economic growth and oil demand growth in the OECD. There is a growing focus on improved
efficiency in the shipping sector, in buildings and houses and of course in the road and air
transportation sector. As an example the average window sticker Miles Per Gallon (MPG) in new
cars sold in the US has improved from 20 MPG in 2007 to 25.5 MPG in 2014. This is only the start
of a longer process as the combined new US Corporate Average Fuel Economy (CAFE) standards
for Passenger cars and Light trucks will reach about 50 MPG by 2025.

August 2014 – Torbjørn Kjus 38
DNB Markets | Oil Market Outlook
According to the University of Michigan – Transportation Research Institute; “Recent studies have
shown that – per person, per driver and per household – we now have fewer light-duty vehicles, we
drive each of them less, and we consume less fuel than in the past.” The International Council of
Clean Transportation says that new policies on car efficiencies will improve the new cars sold in
China with an annual rate of 6.2% for the years 2016-2020, for the EU by 6.1% from 2015-2020,
for the US by 5.3% from 2017-2025 and for Japan by 3.5% from 2015-2020.
We also think it is interesting that that peak driving per capita in the US in fact peaked in 2005 and
not in 2009, when the big recession hit. It is also noteworthy that if the reduced US driving was only
related to cyclical factors concerning the economy, we would have expected to still see total driving
corresponding closely with disposable income per capita. This is not the case anymore as can be
seen in the graph to the right below.

August 2014 – Torbjørn Kjus 39
DNB Markets | Oil Market Outlook
9 Non-OECD oil demand continues to grow but at what rate? We have long argued that urbanization, a growing population and a growing middle class will
continue to propel non-OECD oil demand higher also during the rest of the current decade. We
have not seen any oil analysts having as a base case that non-OECD oil demand will not continue
to grow at least in a 2020-perspective. The interesting question to us is hence not if oil demand will
grow, but by how much it will grow. Will we continue to see periods of oil demand growth of 4-8%
in the non-OECD, like we saw for many periods from 2003-2010, or will we have to settle into a
lower range of 2-4%? We believe in the latter. The economic growth will no longer be 10% or
higher in China, India will not return to 8-9%, Brazil will not return to 5% and Russia is probably at
negative economic growth currently.
We believe that even though we still expect strong demand growth for energy in the coming years
based on the mentioned mega trends above (population growth, urbanization and a larger middle
class), we do not believe oil will be the winner in the energy mix. Will oil for example play a
particularly large role in bringing electricity to the 1.5 billion people that lack such access today?
We do not think so. Other energy sources like natural gas and renewables will probably take most
of that market. Diesel will be more of a back-up fuel in power generation if the grid falls down for
example.

August 2014 – Torbjørn Kjus 40
DNB Markets | Oil Market Outlook
Since 2003 the non-OECD share of global oil demand has grown from 38% to 50% of the market.
In the same period the non-OECD demand for oil has grown by 16 million b/d to 46 million b/d.
Since 2004 this demand growth has been almost along a straight line at 1.2 million b/d per year.
36%
38%
40%
42%
44%
46%
48%
50%
52%
2002 2004 2006 2008 2010 2012 2014
Non-OECD Share Of Global Oil Demand
Source: IEA
Through this whole period oil demand in most of the emerging markets has been protected by
petroleum subsidies. A country like Indonesia for example uses almost 15% of its state budget on
direct petroleum price subsidies according to IMF. India use 7%, Malaysia use 6%, Egypt use 31%,
Iran 17%, Iraq 13% and Saudia Arabia 14%. Had these large subsidies not been in place we
believe demand growth would have been much softer in countries like Saudi Arabia, Venezuela,
Iran, India, Indonesia, Thailand, Malaysia, etc. Then the increase in the global oil price during the
past ten years would likely have been able to better mirror consumer behavior, just like we see in
the US when gasoline prices rise at the pumps. Hence in order to maintain this growth of 1.2
million b/d of oil demand growth going forward we believe the system of maintaining the large
petroleum subsidies must remain in place. Otherwise we are likely to see more price elastic
demand also in the emerging markets which has been behind most of the demand growth for oil
during the past ten years. So will these subsidies remain in place?
The table below shows direct petroleum subsidies as a percentage of the state budget:
28
30
32
34
36
38
40
42
44
46
48
2002 2004 2006 2008 2010 2012 2014
Mill
ion b
/d
Non-OECD Oil Demand
Source: IEA

August 2014 – Torbjørn Kjus 41
DNB Markets | Oil Market Outlook
The large oil exporting countries like Saudi Arabia, Iran, Iraq and Venezuela can of course better
afford to continue with petroleum subsidies the higher the oil price, but there is an alternative cost
there as well since the cheap petroleum creates a wasteful use of energy and way higher domestic
demand growth than what would otherwise have happened. It is no wonder people use a lot of
gasoline in Saudi Arabia when the cost at the pump is only 0.8 $/gallon. In Venezuela it is an
unbelievably low 0.05 $/gallon, the cheapest in the world, according to the Washington Post. In
comparison the average gasoline price in the US is around 3.7 $/gallon, but this is very low
compared with Norway at 10.8 $/gallon. The global average price is 5.5 $/gallon and as such
gasoline is in fact still cheap in the US while China is close to the world average, now at around 5.1
$/gallon.
These cheap petroleum prices in many of the developing countries removes oil revenues from the
state budget that these countries could have achieved from higher exports instead of costly
domestic consumption. Still, with the current political unrest playing out in North-Africa/Middle-East
(MENA) it will be hard to remove petroleum subsidies in some of these countries. People have
become accustomed to cheap diesel and gasoline and we have seen that removal of subsidies can
unleash riots among the citizens in some countries that have reduced or removed such subsidies.
Petroleum subsidies are however not mainly a support to the poor and as such it should be doable
with proper communication to the public to replace petroleum subsidies with for example food
subsidies if executed the correct way. We still do not have as our base case that this will happen to
any meaningful extent in the key oil exporting countries but we note that for example powerful
people in the Saudi royal family has expressed deep concern that the subsidies are distorting the
Saudi economy.
The large Asian oil importing countries are another story however. For several of these large
countries we have through the past year seen an interesting development taking place where
several of them have started removing petroleum subsidies. These countries include India,
Malaysia and Indonesia. Oil demand in these 3 countries is 6 million b/d, which equals about 6.5%
of global oil demand. In our book it is not negligible when so large oil consumers start removing
subsidies and as such allow their consumers to see higher petroleum prices at the pumps. If this
has an effect on demand growth at all, it will not be positive. What we have seen so far is that
Indian oil demand growth which averaged 160 kbd in 2011-2012 has turned to no growth the last
12 months. In Indonesia Q1 oil demand declined YoY by 8 kbd according to JBC Energy. Average
demand growth in Indonesia has been 60 kbd per year the last 5 years according to IEA data. JBC
Energy’s explanation for the weaker Indonesian oil demand was subsidy cuts and a weakening of
the Rupiah. This sounds plausible in our book.
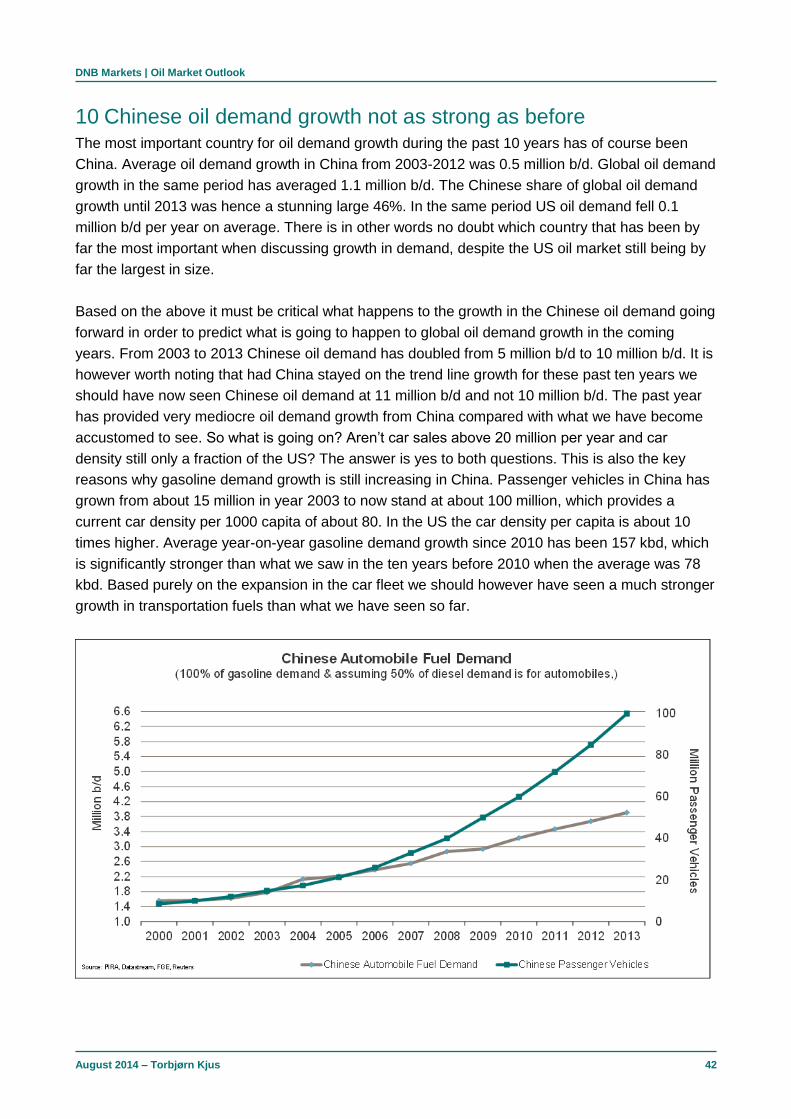
August 2014 – Torbjørn Kjus 42
DNB Markets | Oil Market Outlook
10 Chinese oil demand growth not as strong as before The most important country for oil demand growth during the past 10 years has of course been
China. Average oil demand growth in China from 2003-2012 was 0.5 million b/d. Global oil demand
growth in the same period has averaged 1.1 million b/d. The Chinese share of global oil demand
growth until 2013 was hence a stunning large 46%. In the same period US oil demand fell 0.1
million b/d per year on average. There is in other words no doubt which country that has been by
far the most important when discussing growth in demand, despite the US oil market still being by
far the largest in size.
Based on the above it must be critical what happens to the growth in the Chinese oil demand going
forward in order to predict what is going to happen to global oil demand growth in the coming
years. From 2003 to 2013 Chinese oil demand has doubled from 5 million b/d to 10 million b/d. It is
however worth noting that had China stayed on the trend line growth for these past ten years we
should have now seen Chinese oil demand at 11 million b/d and not 10 million b/d. The past year
has provided very mediocre oil demand growth from China compared with what we have become
accustomed to see. So what is going on? Aren’t car sales above 20 million per year and car
density still only a fraction of the US? The answer is yes to both questions. This is also the key
reasons why gasoline demand growth is still increasing in China. Passenger vehicles in China has
grown from about 15 million in year 2003 to now stand at about 100 million, which provides a
current car density per 1000 capita of about 80. In the US the car density per capita is about 10
times higher. Average year-on-year gasoline demand growth since 2010 has been 157 kbd, which
is significantly stronger than what we saw in the ten years before 2010 when the average was 78
kbd. Based purely on the expansion in the car fleet we should however have seen a much stronger
growth in transportation fuels than what we have seen so far.

August 2014 – Torbjørn Kjus 43
DNB Markets | Oil Market Outlook
Until 2006 the expansion in passenger cars and the expansion in transportation fuel demand
followed each other, but after 2006 we have seen that automobile fuel demand growth has been
quite linear at about 200 kbd per year. It takes in other words about 5 years to increase oil demand
for passenger cars in China with 1 million b/d. Even though this is a strong number, it is weak in
comparison with the growth rate in the US oil production where it only takes 1 year to increase
production with 1 million b/d... Total Chinese oil demand grew only 0.2 million b/d in 2013 (mainly
related to gasoline), hence the growth in the US oil production currently outperforms Chinese oil
demand by a factor of 5 to 1. This is of course very different than what the world looked like just 3
years back in time. Gasoline demand growth will continue in China and as such probably lead to
still net demand growth for oil, but our argument is that gasoline demand growth alone will probably
not be able to maintain total Chinese oil demand growth at 500 kbd per year.
The key “culprit” for why we believe the past growth rate for oil demand cannot be maintained is
diesel. Diesel used to be the product that delivered the best growth rate in China. From 2003-2012
the average growth rate was almost twice as strong as gasoline demand, but something happened
last year when diesel demand stopped growing and in fact demand growth for diesel has been
negative so far in 2014. Will this trend continue? Or is it reasonable to expect that oil demand
growth in China will get back close to the average we have seen the past ten years? This should
be a very important question to get right if you want to correctly predict the oil price formation next
year and the coming years.
1.0
1.5
2.0
2.5
3.0
3.5
4.0
Jan-00 Jan-02 Jan-04 Jan-06 Jan-08 Jan-10 Jan-12 Jan-14
Mill
ion
b/d
Chinese Calculated Diesel Demand(Adjusted for inventory change since June-2009)
Source: China OGP, Xinhua News, The Chinese General Administration & Customs, National Bureau of Statistics
IEA in July forecasted Chinese oil demand growth of almost 0.45 million b/d for 2015, but revised
this down to 0.39 million b/d in the August report. We think demand growth will come in at only
about half that number and most of this will be gasoline demand.

August 2014 – Torbjørn Kjus 44
DNB Markets | Oil Market Outlook
We do not think there is any reason to expect a revival in Chinese diesel demand for the rest of the
current decade and if diesel is not on board, we do not believe it will be possible to see such a
strong demand number that the IEA is forecasting.
We see three key reasons for not expecting a revival in Chinese diesel demand. Number one is
that diesel is much more tilted towards the investment cycle in China than gasoline, and
investment growth will see a smaller share of total economic growth in China in coming years. We
already see these signs in the economy and particularly the construction sector is set to contribute
less to economic growth than in the past ten years.
-60
-40
-20
0
20
40
60
80
100
120
Jun-02 Jun-06 Jun-10 Jun-14
China: Real estate investment and commodity imports
Percent change from year before
Commodity imports (USD, 3m lag)
Housing starts (urban areas, 3mma)
Source: Thomson Datastream/ DNB Markets
The construction sector uses a lot of diesel. In fact about 40% of the demand in the transportation
sector derives from real estate and construction services. You have to use a lot of diesel when you
build a new Manhattan and the Chinese are not building as many new Manhattans as before. This
is hence negative for diesel demand growth.

August 2014 – Torbjørn Kjus 45
DNB Markets | Oil Market Outlook
Points number two and number three has mainly to do with pollution. The new Chinese leadership
has declared war on pollution after particle emissions in Beijing and other large Chinese cities has
reached record levels during the past year. This kind of air pollution gets the blame for the 5-year
lower life expectancy in Beijing compared with cleaner cities and it also gets the blame for the
increasing Chinese infertility rates. During the past 20 years studies have shown that infertility
rates among people in fertile age in China have increased from 2.5% to 12.5%. Coal and car traffic
gets the main blame and this has led to Beijing limiting the number of motor vehicles in the city to 6
million and to set a target of reducing gasoline and diesel usage by 5% in the five years to 2017.
The particle emissions from diesel trucks also seem to have led the Chinese to prefer natural gas
for trucking. The number of natural gas filling stations in China has increased from about 800 in
2012 to now stand at 3.500 according to recent figures from FGE. About 3.200 stations are open to
the public. In the US we have so far seen very limited substitution from gasoline/diesel to natural
gas in the transportation sector, but in China the numbers are surprising hugely to the upside.

August 2014 – Torbjørn Kjus 46
DNB Markets | Oil Market Outlook
The data we have received from FGE says that natural gas usage in the Chinese transportation
sector has increased from 34 kbd in 2007 to 245 kbd in 2013. The graph looks like a hockey-stick
and we see no reason why this trend should not continue as there are no particle emissions from
natural gas usage and hence it is a perfect solution to that particular problem. These 245 kbd of
natural gas demand would have been increased diesel demand, had we not seen this substitution.
About half of the diesel consumption in China is not related to the transportation sector but is what
we call stationary demand. This is demand for power generation, industrial production, heating,
etc. The third reason why we do not picture a revival of Chinese diesel demand in coming years is
that we see substitution also in this sector. Growth in renewable energy is so immense in China
that diesel is probably meeting competition from these energy sources in some of the stationary
sectors. China is in 2014 installing 57 GW of new capacity in solar, wind, nuclear and hydro. These
are huge numbers, but there are of course very different utilization rates for these different energy
sources.
An expanding nuclear capacity of 9 GW can provide about 66 TWH due to the high utilization rate
while 14 new GW of solar only yields about 17 TWH of new power production. Still, if we add these
four sources together with their different utilization rates we reach almost 180 TWH of new power
generation capacity from these four renewable sources just in 2014.

August 2014 – Torbjørn Kjus 47
DNB Markets | Oil Market Outlook
This is the same as almost one third of total German electricity consumption and it is about 3.5% of
total Chinese electricity consumption. The past 5 years the total Chinese electricity generation has
on average increased 378 TWH per year according to the BP stats, so the 2014 increase in just
those 4 mentioned renewable sources cover about half of that yearly total growth. We can also
mention that the year-on-year growth in Chinese electricity output in recent months has dropped to
about 5%, which compares with an average of almost 10% growth in recent years.
It seems to us that the Chinese are more serious and responds faster to the pollution threats than
most people are aware of. We believe this can be highlighted by looking at Chinese coal
production vs electricity output. These two factors have for years corresponded very well together.
An increase in coal output has gone hand in hand with an increase in electricity output and vice
versa. We believe it is highly interesting that this no longer seems to be the case. The growth in
coal output has the last three years dropped from 20% to about 4% and with the old relationship
intact it should have corresponded to a drop in electricity output of about 5%, instead electricity
output continues to grow. One might think that increased imports of coal is weighing up for the
decreased domestic output of coal, but that does not seem to be the case as imports of coal has
been about flat the last year. This suggests that renewables have already captured a meaningful
market share of electricity generation in China.
Chinese growth in crude imports has been very strong so far this year, and this has grabbed many
headlines. Oil market players however have to remember that crude imports are not at all the same
as oil demand. Crude imports have been about 6.1 million b/d during the first half of 2014. This is a
large 0.6 million b/d higher than the first half of 2013. This large increase in crude imports since
last year has been very supportive to crude prices so far this year. A 0.6 million b/d increase is
larger than total oil production from the OPEC member Ecuador, just to put things into perspective.
The challenge in using this number as a proxy for demand growth is that supply of crude into China
(imports and production) has been about 0.5 million b/d higher than demand for crude in China
from the country’s refineries. In other words; this increase in crude imports does not represent
demand for consumption, but demand for inventory. To be more precise; it is demand for strategic
storage. If we multiply 0.5 million b/d with 180 days and assume that all the missing barrels have
gone into strategic storage it becomes about 90 million barrels.

August 2014 – Torbjørn Kjus 48
DNB Markets | Oil Market Outlook
As we have written before the potential to further fill strategic storage for the rest of this year is very
unclear and we read different estimates for how much more the Chinese can potentially fill during
2014. If the market should lose this impulse of 0.5 million b/d “artificial” demand for the rest of 2014
it will be much more important for global crude oil balances than most other factors in the market.
The only single impulses that can match this unpredictable and “hidden” factor is what will happen
to production in Libya, Iraq and Iran going forward.
-0.9
-0.6
-0.3
0.0
0.3
0.6
0.9
1.2
1.5
Jan-00 Jan-02 Jan-04 Jan-06 Jan-08 Jan-10 Jan-12 Jan-14
Mill
ion
b/d
Missing Chinese Crude Barrels(based on net crude imports plus domestic crude production less refinery throughput - avg 0.3)
Source: China OGP, Xinhua News, The Chinese General Administration & Customs, National Bureau of Statistics
It is unfortunate that there is not more openness with respect to this data. CNPC said in a
statement that by end 2013 China had 141 million barrels in strategic reserves. IEA has estimated
that by end 2015 the strategic reserves will be 272 million barrels. If all the missing barrels this
year have gone to strategic reserves it would imply that the level now is about 230 million barrels. If
correct it suggests that only 42 million more can be filled until the end of 2015. The mentioned
numbers are however highly uncertain. Geopolitical unrest in Iraq, Libya, Ukraine, etc has probably
incentivised China to speed up the filling of its strategic reserves. This behaviour has as such
supported the physical crude market and hence the price, but it would be highly interesting to know
precisely how much more capacity that is available to be filled for the rest of the year and for the
coming years…
0.0
1.0
2.0
3.0
4.0
5.0
6.0
7.0
8.0
Jan-00 Jan-02 Jan-04 Jan-06 Jan-08 Jan-10 Jan-12 Jan-14M
illio
n b
/d
Chinese Net Crude Imports
Source: China OGP, Xinhua News, The Chinese General Administration & Customs, National Bureau of Statistics

August 2014 – Torbjørn Kjus 49
DNB Markets | Oil Market Outlook
11 Fundamental balance – supply vs demand In our global supply vs demand model we use IEA data per country as the basis for historical data.
As we have described in the chapter “Oil price discovery” the large agencies are not in agreement
even on what the historical data for supply and demand has been and of course they do also
disagree in the forward looking balances. Oil data quality on a global scale is difficult, but we have
to use what we got and despite the weaknesses we believe IEA has the best historical data sets.
We do however not agree on their forecasts for oil supply and demand. The IEA in July published
the first detailed supply-demand balances by country for 2015. The agency then believed global oil
demand growth would accelerate in 2015 to 1.4 million b/d on the back of a gaining momentum in
the global economy. This projected demand growth was revised down to 1.3 million b/d in the
August report which was released last week. The IEA do admit that recent disappointing economic
indicators has prompted the IMF to hint that its forecast of economic growth might be trimmed, and
as we know the IEA base its oil demand assumption on IMF-forecasts of economic growth. The
agency also admit that though Chinese strategic stock building has kept crude imports elevated,
Chinese demand growth remains sluggish and global refinery runs have fallen short of
expectations in Q2.
Given these mentioned statements from the IEA it is hard to understand why the agency in the July
report expected such a large growth in oil demand from China next year. As mentioned above the
IEA expected Chinese oil demand to grow nearly 0.45 million b/d next year in the July report. This
was revised down to 0.39 million b/d in the August report but in our opinion the projected growth is
still way too high and we see few reasons why sluggish Chinese oil demand growth should
suddenly rebound next year. We also believe the IEA is too optimistic to oil demand growth in other
parts of the non-OECD. We believe economic growth in Russia will be weak, and the political
situation in North-African countries and Middle-Eastern countries bordering the Mediterranean
does not bode well for economic growth in the region. There is much unrest and political turmoil
and the renewed escalation of the Israel-Palestine conflict will not be helpful at all. We believe in
zero growth in oil demand from the OECD next year and 1.1-1.2 million b/d growth in demand from
the non-OECD. On the net we forecast about 0.15 million b/d lower global oil demand growth for
2015 than what the IEA is forecasting.
In addition we believe the IEA again will be too conservative with their estimates for growth in US
oil production. The agency forecasted growth of 0.7 million b/d of US oil liquids production for 2015
in the July report. This was increased to 0.75 million b/d in the August report but we believe the
number is still not high enough. We, on the other hand, believe we will see the fourth year in a row
with production growing above 1 million b/d in 2015. The IEA has been forced to revise its
estimates for US production growth upwards in nearly every monthly report for the past 35 months
and we see no reason why this should change yet. From what we hear after talking to key
operators in the US shale oil industry, 2015 will be a very strong growth year. Particularly the
Permian basin will start to show up with larger production numbers. We hence forecast that non-
OPEC production will grow 1.4 million b/d next year, not including biofuels and OPEC NGL’s. IEA
forecast 0.3 million b/d weaker growth than that. On the total net we see the call on OPEC crude oil
dropping by 0.6 million b/d in 2015 compared with 2014.

August 2014 – Torbjørn Kjus 50
DNB Markets | Oil Market Outlook
DNB Markets World Oil Supply-Demand Balance: 2008 Change 2009 Change 2010 Change 2011 Change 2012 Change 2013 Change 2014 Change 2015
OECD Demand 48.4 -2.0 46.3 0.6 47.0 -0.5 46.4 -0.5 46.0 0.1 46.0 -0.3 45.7 0.0 45.8
Non-OECD Demand 38.1 1.2 39.3 2.4 41.7 1.3 43.1 1.5 44.6 1.0 45.6 1.2 46.8 1.1 48.0
Total Demand 86.5 -0.9 85.6 3.1 88.7 0.8 89.5 1.1 90.6 1.1 91.6 0.9 92.5 1.2 93.7
Non-OPEC Supply 49.2 0.7 49.8 1.0 50.8 0.2 51.0 0.5 51.5 1.2 52.7 1.5 54.2 1.4 55.6
OPEC NGL's and non-conventional oil 4.5 0.6 5.1 0.4 5.5 0.4 5.9 0.4 6.2 0.0 6.3 0.2 6.4 0.3 6.7
Global Biofuels 1.4 0.2 1.6 0.2 1.8 0.0 1.8 0.0 1.9 0.2 2.0 0.1 2.1 0.1 2.3
Total Non-OPEC supply 55.1 1.4 56.5 1.7 58.2 0.6 58.7 0.8 59.6 1.3 60.9 1.8 62.7 1.8 64.5
Call on OPEC crude (and stocks) 31.4 -2.3 29.1 1.4 30.5 0.2 30.7 0.2 31.0 -0.3 30.7 -0.9 29.8 -0.6 29.2
OPEC Crude Oil Supply (Last known number dragged fwd) 31.6 -2.5 29.1 0.1 29.2 0.7 29.9 1.4 31.3 -0.8 30.5 -0.2 30.2 0.2 30.4
Implied World Oil Stock Change 0.2 0.0 -1.3 -0.8 0.3 -0.3 0.4 1.2
IEA World Oil Supply-Demand Balance (August 2014): 2008 Change 2009 Change 2010 Change 2011 Change 2012 Change 2013 Change 2014 Change 2015
OECD Demand 48.4 -2.0 46.3 0.6 47.0 -0.5 46.4 -0.5 46.0 0.1 46.0 -0.2 45.8 -0.1 45.7
Non-OECD Demand 38.1 1.2 39.3 2.4 41.7 1.3 43.1 1.5 44.6 1.0 45.6 1.2 46.9 1.4 48.3
Total Demand 86.5 -0.9 85.6 3.1 88.7 0.8 89.5 1.1 90.6 1.1 91.6 1.0 92.7 1.3 94.0
Non-OPEC Supply 49.2 0.7 49.8 1.0 50.8 0.2 51.0 0.5 51.5 1.2 52.7 1.5 54.1 1.1 55.2
OPEC NGL's and non-conventional oil 4.5 0.6 5.1 0.4 5.5 0.4 5.9 0.4 6.2 0.0 6.3 0.1 6.4 0.3 6.7
Global Biofuels 1.4 0.2 1.6 0.2 1.8 0.0 1.8 0.0 1.9 0.2 2.0 0.1 2.1 0.1 2.2
Total Non-OPEC supply 55.1 1.4 56.5 1.7 58.2 0.6 58.7 0.8 59.6 1.3 60.9 1.7 62.6 1.5 64.1
Call on OPEC crude (and stocks) 31.4 -2.3 29.1 1.4 30.5 0.2 30.7 0.2 31.0 -0.3 30.7 -0.7 30.0 -0.2 29.9
OPEC Crude Oil Supply (Last known number dragged fwd) 31.6 -2.5 29.1 0.1 29.2 0.7 29.9 1.4 31.3 -0.8 30.5 -0.2 30.2 0.2 30.4
Implied World Oil Stock Change 0.2 0.0 -1.3 -0.8 0.3 -0.3 0.2 0.6
OPEC World Oil Supply-Demand Balance (August 2014): 2008 Change 2009 Change 2010 Change 2011 Change 2012 Change 2013 Change 2014 Change 2015
OECD Demand 48.4 -2.0 46.4 0.6 47.0 -0.5 46.5 -0.5 46.0 -0.1 45.9 -0.1 45.8 0.0 45.8
Non-OECD Demand 37.7 0.7 38.4 1.9 40.3 1.3 41.6 1.4 43.0 1.1 44.1 1.2 45.3 1.2 46.5
Total Demand 86.1 -1.3 84.8 2.5 87.3 0.8 88.1 0.9 89.0 1.0 90.0 1.1 91.1 1.2 92.3
Non-OPEC Supply (Incl all Biofuel) 50.4 0.7 51.1 1.3 52.4 0.0 52.4 0.5 52.9 1.3 54.2 1.5 55.7 1.3 57.0
OPEC NGL's and non-conventional oil 4.1 0.2 4.3 0.7 5.0 0.4 5.4 0.2 5.6 0.1 5.7 0.1 5.8 0.2 6.0
Total Non-OPEC supply 54.5 0.9 55.4 2.0 57.4 0.4 57.8 0.7 58.5 1.4 59.9 1.6 61.5 1.5 63.0
Call on OPEC crude (and stocks) 31.6 -2.2 29.4 0.5 29.9 0.4 30.3 0.2 30.5 -0.4 30.1 -0.5 29.6 -0.3 29.3
OPEC Crude Oil Supply (Last known number dragged fwd) 31.2 -2.5 28.7 0.5 29.2 0.7 29.9 1.4 31.3 -0.8 30.5 -0.2 30.2 0.2 30.4
Implied World Oil Stock Change -0.4 -0.7 -0.7 -0.4 0.8 0.4 0.6 1.1
EIA World Oil Supply-Demand balance (August 2014): 2008 Change 2009 Change 2010 Change 2011 Change 2012 Change 2013 Change 2014 Change 2015
OECD Demand 47.6 -2.2 45.4 0.7 46.1 -0.3 45.8 0.1 45.9 0.1 46.0 -0.2 45.9 0.0 45.9
Non-OECD Demand 38.2 0.7 38.9 2.1 41.0 1.5 42.5 0.8 43.3 1.2 44.4 1.3 45.7 1.4 47.1
Total Demand 85.8 -1.5 84.3 2.7 87.1 1.2 88.3 0.9 89.2 1.3 90.4 1.1 91.6 1.4 93.0
Non-OPEC Supply (Incl all Biofuel) 49.7 0.8 50.5 1.3 51.8 0.2 52.0 0.7 52.7 1.4 54.0 1.8 55.8 1.1 56.9
OPEC NGL's and non-conventional oil 4.5 0.3 4.8 0.8 5.5 -0.3 5.3 0.5 5.8 0.5 6.2 0.1 6.3 0.3 6.5
Total Non-OPEC supply 54.1 1.1 55.2 2.1 57.3 -0.1 57.2 1.2 58.4 1.8 60.3 1.8 62.1 1.3 63.4
Call on OPEC crude (and stocks) 31.7 -2.6 29.1 0.7 29.8 1.3 31.1 -0.3 30.8 -0.6 30.2 -0.7 29.5 0.1 29.6
OPEC Crude Oil Supply (Last known number dragged fwd) 31.3 -2.2 29.1 0.1 29.2 0.7 29.9 1.4 31.3 -0.8 30.5 -0.2 30.2 0.2 30.4
Implied World Oil Stock Change -0.4 0.0 -0.6 -1.1 0.6 0.3 0.8 0.9
During the first half of 2014 we have seen OECD oil stocks build 104 million barrels, based on IEA
data and non-OECD stocks build 61 million barrels, based on JODI data. In addition we know that
the Chinese have probably added significant amounts of strategic oil stocks so far in 2014. If we
assume that all the missing barrels in the Chinese crude oil balance has gone into strategic
storage we arrive at 90 million barrels. If we add these mentioned stock builds together we get at a
huge 255 million barrels of global oil stock builds so far this year. We can never know if our supply-
demand balance is using the correct numbers, but based on the identified stock builds mentioned
above we are in no doubt that the market has been over-supplied so far in 2014. We believe the
key reason for why this has not resulted in significantly lower oil prices is the geopolitical turmoil in
Iraq, Ukraine and Libya which has resulted in increased demand for strategic inventory, most
noteworthy in China. If we are correct in that assumption it will be immensely important for the oil
price formation in 2015 how much more strategic inventories that can technically be added in
China during 2015. If there are not that many facilities ready and available to be filled, the oil
market might lose a very strong supportive factor next year.

August 2014 – Torbjørn Kjus 51
DNB Markets | Oil Market Outlook
12 Peace sells – but who’s buying? Not Iraq it seems… Since the so-called “Arab spring” started playing out during the start of 2011 we have said
numerous times that we do not believe we will see an end to the unrest in the Middle-East/North
Africa (MENA) for a long time yet. In our opinion this has to do with demographic factors coupled
with poverty and information flows. Religion of course plays a big role in this as well, particularly in
the conflict in Iraq/Syria between the Shiite’s and the Sunni’s and in the conflict between Israel and
Palestine. Even without the religious tensions there would however have been large chances of
social unrest in this region. Why is that? Well, first of all the unemployment rates are very high and
particularly for young people. That is never a good sign if you want a stable community. Secondly
the whole population is very young. The average median age globally is 29 years of age, while in
countries like Yemen, Palestine, Iraq and Syria, the median age is 17, 18, 18 and 21 respectively.
There is also much more males than females in the whole region. Who is more violent? Males or
females?…
If this is not enough we have the so called J-curve which basically is a plot of social & political
openness vs a country’s social stability. The plot shows that whenever a country starts to climb the
ladder of more openness, the country stability drops. Countries that have still not opened up for
free information flows and as such still maintain a great deal of stability are countries like North
Korea, China and Russia. In most of the countries in the MENA region however information has
started flowing through widespread usage of cell phones, broad access to the internet, access to
satellite tv, etc. We believe this combination of demographics and information flows would have
resulted in an unstable social situation no matter religious conflicts. But when you in addition put
the religious back drop into this perspective the situation becomes explosive, just like we now see
in Iraq, Syria and at the Gaza strip.

August 2014 – Torbjørn Kjus 52
DNB Markets | Oil Market Outlook
The most important new critical geopolitical development for the oil market and oil industry during
the last couple of months has been the advance of Sunni militias into Iraq led by the Islamic State
of Iraq and Syria (ISIS). The group has been growing its power in Syria and is now strong enough
to capture territory in Iraq with the help of local Sunni militias. ISIS controls large parts of northern
and western Iraq and the situation in Iraq can be described as a state of sectarian civil war. The
ISIS military forces are less than half of the Iraqi forces, but the general Sunni population in Iraq is
cooperating with the militias because they fear the militias less than they have feared Shiite Prime
Minister Nouri al-Maliki. It is unlikely that Shiite coalition forces can take back ISIS controlled
territory without significant US or Iranian support. The Sunni population feels discriminated by the
Shiite controlled government and it will probably be extremely difficult to resolve the situation
without addressing this underlying problem.
Prime Minister Maliki was not willing to compromise vs the Sunnis and this seems to be the key
reason why the US administration has been reluctant to offer significant help to the Iraqi
government other that air support. Maliki has been facing pressure from all sides to step down and
not pursue a third term as Prime Minister, in order to find a solution to the crisis, but until last week
he showed no willingness to step down from power. It was always highly unlikely to re-unify Iraq
while Maliki was still in power. Parliamentary elections were held in Iraq on April 30 and last week
the new Iraqi president Fouad Masoum asked Haidar al-Abadi to become Prime Minister and to
form a new Iraqi government. Maliki however initially refused to step down after deploying militias
and special forces on the streets, creating a dangerous political showdown in Baghdad.
Washington, which helped install Maliki following its 2003 invasion that toppled Saddam Hussein,
congratulated Haidar al-Abadi as the new Prime Minister. Maliki said initially in a televised speech
that the president's decision to name a replacement for him was a dangerous violation of the
constitution and, flanked by political allies, he vowed to fix the mistake. Maliki's son-in-law, Hussein
al-Maliki, even called the move illegal and said it would be overturned in court. Washington warned
Maliki not to stir the waters by using force to cling to power. "There should be no use of force, no
introduction of troops or militias in this moment of democracy for Iraq," US Foreign Secretary John
Kerry stated last week. He also stated that the government formation process is critical in terms of
sustaining stability and calm in Iraq. Washington has insisted that it has not been involved in the
selection of new Prime Minister al-Abadi but some US officials stated last week that people are
relieved that they have chosen somebody and that it was not Maliki. Maliki also appears to have
alienated several of his Shiite supporters as Iraq's most influential Shiite cleric, Ali Sistani, basically
ordered Maliki to leave power less than two weeks ago. He then declared that politicians who cling
to power were making a "grave mistake".
We also saw the Iranian supreme leader Ayatollah Ali Khamenei endorsing al-Abadi last week as
he distanced himself from Maliki. Iranian media has in fact reported that Khamenei last month sent
an envoy to Iraq to discuss with Shiite political leaders and religious leaders to find an alternative to
Maliki. Maliki claimed that since he was the leader of the largest political bloc in the parliament
after the elections the constitution says he is the one that should have been asked by the president
to form a new government and not al-Abadi.

August 2014 – Torbjørn Kjus 53
DNB Markets | Oil Market Outlook
Malikis Dawa Party had however in fact already called on Iraqi politicians to work with al-Abadi to
form a new government and late on Thursday last week Maliki decided to step down and endorse
the new Prime Minister al-Abadi. Al-Abadi now has less than a month to form a new Iraqi cabinet.
Sunni tribal leaders had promised to push away ISIS if Maliki hands over his power, but they
probably do not have the military strength to fulfill that promise. In 2007 it required the help of
thousands of US troops to remove extremist militias. This latest development could however easily
be the trigger for Washington to increase its backing of the Iraqi military. The hope is now that an
inclusive and broadly acceptable government in Baghdad could work against the Sunni anger at
Maliki’s policies and hence reverse the gains ISIS has made in Iraq.
The civil-war like conditions in Iraq means that there is an increased probability that Kurdistan will
declare independence or at least it means more autonomy to the Kurdish region (KRG). A unified
Iraqi government might make it more difficult for the Kurds to declare independence so it may not
be in their interest to cooperate with the central government in Baghdad. If the world politicians no
longer believe that there is a viable Iraqi state, then the global acceptance of Kurdistan as a new
state will be much higher. And the worse the fighting becomes the more likely it is that people will
lose faith in a unified Iraq. The first step for the Kurdistan government would be to get support from
Turkey and in fact last week Turkey urged the US to end the prohibition of sale of crude oil directly
from Kurdistan without sending the funds through Baghdad. If Turkey recognizes an independent
Kurdistan, then the Kurds are likely to move forward to achieve this outcome. Such an outcome will
probably also increase the likelihood of the rest of the world recognizing Kurdistan as well.

August 2014 – Torbjørn Kjus 54
DNB Markets | Oil Market Outlook
Escalating unrest ironically increases the chance of a more independent Kurdistan which again
might translate to more Iraqi exports from the north than before the ISIS attacks in Iraq started.
The Kurds have during the recent crisis taken control of most of the northern oil fields, among
others the large Kirkuk field and has in effect pushed its borders westwards. With control of Kirkuk
and other oil fields the Kurds suddenly controls oil production of 500-600 kbd. If the Kurds can then
be independent/sell oil themselves and in addition expand pipeline capacity, exports from that
region could dramatically increase. A new 300 kbd pipeline has been built from Khurmala via
Dohuk to Feshkabur, where it ties into the Turkish pipeline to the Mediterranean port of Ceyhan.
Currently however the Kurds are only exporting around 170 kbd of oil, where only 120 kbd is
through the mentioned pipeline. The remaining is via trucks. Within the next 2-4 years there is
hence a potential for Kurdistan to increase exports by at least 300-500 kbd based on the new
situation that has arisen due to the potential to become independent/more autonomous.
When it comes to the southern Iraqi exports, which is all from the Basrah region, we believe it will
stay fairly unaffected by the ISIS attacks in the short term since basically all the oil fields in this
region is in the Shiite stronghold. It will be difficult for Sunni militias to capture and control any of
this territory and also to launch large disruptive attacks against oil infrastructure. The fighting in
Iraq has however made it more difficult for International Oil Companies (IOCs) to operate also in
the southern parts of the country and several of these companies has pulled staff out of the region.
Costs for these companies of securing personnel and goods are increasing and in addition the
central government in Baghdad will be distracted by the fighting, which will likely lead to
bureaucratic frustrations and delays for the IOCs.

August 2014 – Torbjørn Kjus 55
DNB Markets | Oil Market Outlook
IOCs will find it hard to operate in a war-zone and their investments in Iraq are likely to suffer. This
will probably delay capacity growth plans for the coming years in the south of Iraq. We hence
believe it is justified to expect lower production from Iraq in the longer term, than before the latest
crisis and civil war like conditions erupted. Production in the north could increase more in the
shorter term (next 2-4 years) but southern production growth will be weaker and lead to lower
output in a 4-10 year perspective. We hence believe the ISIS attacks on Iraq justify a higher oil
price for our oil price deck in the years 2018-2020, but not for 2015-2017.
0.0
0.5
1.0
1.5
2.0
2.5
3.0
3.5
Jan-01 Jan-03 Jan-05 Jan-07 Jan-09 Jan-11 Jan-13
Mill
ion b
/d
Iraqi Oil Production
Source: IEA
There are also other geopolitical hot spots for the oil market where Libya and Iran must be
classified as the two most important ones. Nigeria has been stably unstable and still has about 400
kbd shut out of the market due to oil theft and sabotage in the Niger delta. We do not assume that
this situation change in the foreseeable future. Venezuela is also far from its potential oil
production after Hugo Chaves sacked half the work force in PDVSA after the general strike in
December 2002. Venezuelan oil production has trended gradually lower since 2009 and the only
thing that can bring Venezuelan oil production back in growth modus would be to attract more
foreign oil companies and investments. In a post 2020-perspective that may happen if the current
government is changed and the Venezuelan middle class can regain their positions, but our base
case is that in the current decade Venezuelan production will continue to gradually drift lower.
The largest loss of barrels in the oil market the last year has been from Libya. Libyan production so
far in 2014 has been over 1 million b/d lower than the same period last year. In June about 1.2
million b/d of Libyan production was shut out of the market due to political unrest and strikes in oil
ports and oil fields and IEA estimated production at only 240 kbd. In July the force majeure on
several Libyan oil ports were however lifted and several fields were reopened. Even if several ports
open up for exports the first exports that hits the market is from tanks that were full at the terminals.
It will take time, maybe several months to restart facilities that feed the terminals.

August 2014 – Torbjørn Kjus 56
DNB Markets | Oil Market Outlook
If the port deal holds the average exports of crude oil from Libya could range between 0.5 million
b/d to 1.0 million b/d depending on technical difficulties. If the average becomes something in the
middle, at around 0.7-0.8 million b/d, we believe this would be having a bearish effect on the oil
market in 2015. Current reports suggest that Libyan oil production is around 500 kbd at the time of
writing.
There are however no guarantees when it comes to Libya. During the past year we have seen so
many incidences where the government has announced a solution and that a port would be
reopened, only to see that this is not happening. And if one port is opened another gets blocked.
The Libyan government does not have enough military muscles to keep the ports open so
whenever a militia is blocking the port the government has to pay its way out of the problem. When
other militia leaders see what is going on, why not repeat the procedure as it seems to pay of… It
is hard to see that Libya will return to its pre-war capacity of about 1.5 million b/d in the foreseeable
future, but it could be reasonable to see an average production between 0.5-1.0 million b/d in 2015
in our opinion. We do however think the production could be very much on and off.
0.0
0.2
0.4
0.6
0.8
1.0
1.2
1.4
1.6
1.8
2.0
Jan-01 Jan-03 Jan-05 Jan-07 Jan-09 Jan-11 Jan-13
Mill
ion b
/d
Libyan Oil Production
Source: IEA

August 2014 – Torbjørn Kjus 57
DNB Markets | Oil Market Outlook
The country with the second largest number of barrels shut out of the market is Iran, due to the
European oil embargo and the US financial sanctions. Production from Iran has averaged 2.8
million b/d so far this year according to IEA data. In 2007 Iranian production averaged 4 million b/d,
but economic sanctions gradually started reducing the country’s output potential after 2007 and
then the European oil embargo and US escalation of financial sanctions kicked in during 2012 and
this accelerated the decrease in production. If Iran becomes a normal member of the world
community, sanctions are removed and the country is able to attract investments we see no reason
why the former 4 million b/d should not again be possible to reach. It would not happen in 2015 but
within 1-3 years after sanctions are removed and with proper investments we believe it could
happen. Iran has the last six months negotiated with international powers to reach a deal with
respect to its nuclear program. The target is to remove economic sanctions but then Iran must give
up large parts of its nuclear program.
2.0
2.5
3.0
3.5
4.0
Jan-01 Jan-03 Jan-05 Jan-07 Jan-09 Jan-11 Jan-13
Mill
ion b
/d
Iran Oil Production
Source: IEA
The deadline to reach an agreement was on July 20, but the negotiations have now been
prolonged until November 24. We had all along as our base case that the deadline would be
prolonged and as such are not surprised by this outcome. The market was probably also expecting
a prolonged deadline. We see it as positive that there was only a 4 months prolonged deadline and
evaluate the chances of reaching an agreement as fairly good. So much time, effort and prestige
has now been invested in this project and powerful people have been involved. We believe both
sides really want to find a solution. It should be a win-win situation if happens.

August 2014 – Torbjørn Kjus 58
DNB Markets | Oil Market Outlook
The key reason why a full agreement could not be reached by July 20th was that Iran does not
want to give up its rights to own nuclear technology for peaceful purposes. The world powers on
the other hand want to limit the number of centrifuges Iran can hold. Iran believes it has resolved
the most controversial part of its nuclear program and therefore should get significant sanctions
relief. The US however sees Iran's work over the past six months and a promise to continue to
comply for at least seven years simply as not good enough. Washington believes Iranian
cooperation on the nuclear issue must contain an irreversible sacrifice of its enrichment abilities.
The US says that would mean Iran should have fewer than 10.000 working uranium centrifuges in
its possession for a decade. Iran says seven years is more than enough. After that the country will
have to enrich uranium on an industrial scale once its contract with Russia for the supply of nuclear
fuel expires.
A part deal was reached in November last year where the US has agreed to free 2.8 billion USD in
frozen funds in return for Iran converting half of its 20% enriched uranium stocks to 5% material, so
there is some progress going on here. Uranium must be enriched to 90% purity to make an atomic
bomb, but 20% purity levels are just a short step from producing weapons-grade material.
According to the International Atomic Energy Agency (IAEA) Iran is standing by this agreement to
reduce its stock of 20% enriched uranium. Tehran has also refrained from enriching uranium above
5% at any of its nuclear facilities, the IAEA reported in late July.
Bottom line for us in this story is that we see it as very likely with increased oil production and
exports from Iran into the world market within the coming 1-3 years. We do see that there are
domestic road blocks that can prevent a final deal in both USA and Iran however. For the US the
key obstacle is the midterm elections in November where republicans might choose their different
views on foreign politics to differentiate from Barack Obamas administration. In Iran there will be
powerful forces against a nuclear deal from the Revolutionary Guard as the Guard members are
likely to lose out on several of their economic benefits of the current sanctions regime if a final deal
is reached and all sanctions are lifted. Also the Iranian supreme leader Ayatollah Ali Khamenei has
stated publicly that Iran will keep its 10.000 centrifuges or more, and this seems to stand in sharp
contrast to the mentioned US position that these centrifuges will have to be reduced. Rouhani must
navigate these domestic issues, but we see a fair chance of success in that matter.
Another issue that was not at the oil agenda at the start of 2014 is the Russia-Ukraine tensions. US
and Europe has imposed sanctions vs Russia due to its involvement (or non-involvement) in the
riots inside Ukraine where Russian-linked separatists have initiated military actions vs the Ukraine
government in order to separate certain regions from Ukraine and instead be more closely tied to
Russia. The downing of the Malaysia Airlines flight MH17 over Ukraine, where among others many
Dutch people were killed, has increased the tension between Russia and the west. After that
incident new sanctions targeting Russia’s energy, financial and defense sectors have been
imposed from Europe and the US. As retaliation on the western sanctions Russia recently banned
all imports of meat, fish, milk, fruit and vegetables from the US, the EU, Australia, Canada and
Norway. Russia is also evaluating to ban all western aircraft carriers from flying over Russia to and
from Asia. If this happens it will significantly add costs to these carriers and of course increase the
flight time.

August 2014 – Torbjørn Kjus 59
DNB Markets | Oil Market Outlook
The western sanctions towards Russian energy companies and industries will probably lead to
lower investments in the Russian energy sector than if the sanctions had not been imposed.
Possible future joint ventures between western energy companies and Russian energy companies
will now not happen for the foreseeable future and this will most likely result in lower production of
oil from Russia in a 5-10 year perspective than before these mentioned sanctions.
The western tensions vs Russia, caused by the Ukraine crisis, are hence another example of an
incident that will most likely weaken the longer term prospects for oil production growth. As such
the Russia tensions justifies a somewhat higher oil price out on the Brent curve, but it will still not
be very price supportive with respect to leading to much less production from Russia the next 3
years in our opinion. As written earlier in the report we still believe the world will have more than
enough oil available for the next 3 years, despite what is going on in Russia, Libya, Iraq and Iran.
This is mainly due to what we believe will still be below trend line global oil demand growth and the
still massive increase in North American oil production. For the longer term, however, we believe
the new geopolitical developments we have seen this year in Iraq, Russia/Ukraine and Libya
justifies a higher price than what we thought a year ago.
7.0
7.5
8.0
8.5
9.0
9.5
10.0
10.5
11.0
11.5
12.0
2002 2004 2006 2008 2010 2012 2014
Mill
ion b
/d
Russian Oil Liquids Production
Source: IEA

August 2014 – Torbjørn Kjus 60
DNB Markets | Oil Market Outlook
13 The 2015 oil price score card
2015 Oil Price Scorecard Comments Oil Price Weight
Overall Outlook
Non-OPEC supply growth is forecasted to outpace global oil
demand growth, creating a need for less oil from OPEC.
Geopolitical risk will likely continue to be supportive for oil
prices also in 2015, but we believe the physical supply-
demand balance will weaken.
Average
price
100 $/b
Fundamentals
Global Fundamental Balance
The "Call on core-OPEC" crude oil will decrease in 2015, unless unplanned
disruptions in oil producing countries continue to increase. Demand for
inventory may increase on geopolitical risk but that is for oil prices similar to
"pissing in your pants a cold winter day to stay warm"...
BEARISH HIGH
Crude vs Product Balance (Margins)
World refinery capacity additions will outpace global demand growth for
refined products also in 2015, just like in 2014. This means still a challenging
environment for the refining industry, particularly in Europe but also in parts of
Asia.
BEARISH MEDIUM
OECD Stock levelsOECD crude stocks are high but product stocks are low. This situation is likely
to persist in 2015. With weak demand growth in OECD there is less need to
hold high product stocks.NEUTRAL MEDIUM
OPEC Spare CapacityOPEC spare capacity will increase as Saudi Arabia will trottle back some
output, but unplanned outages create a wild card also for 2015. BEARISH MEDIUM
US Oil Statistics - FundamentalsIn the US, oil demand is expected flattish in 2015 but oil productioin will
continue to grow another million b/d, creating still lower need for imports. BEARISH MEDIUM
Global Demand Growth
We believe global oil demand will grow 1.1 million b/d in 2015. All of this will be
in the non-OECD, while OECD will be flattish. China will grow about 0.2 million
b/d. India will grow less than 0.1 million b/d. IEA forecast much stronger
growth for China, but we believe 2015 will be much like 2014.
NEUTRAL MEDIUM
OPEC SupplyTotal OPEC supply is dependant on unplanned disruptions. If disruptions does
not increase, core-OPEC will have to cut output. If so happens spare capacity
will rise for every barrel Saudi/Emirates/Kuwait cuts output.BULLISH LOW
Non-OPEC Supply Non-OPEC supply continue to grow more than demand in 2015, mainly du to
the shale revolution in the US. But we also see meaningful supply growth in
countries like Canada, Brazil, China and Russia. BEARISH MEDIUM
Political Risk
Iraq, Iran, Nigeria, Venezuela,
US, Russia, Israel, MENA, etc
Political risk will continue to be elevated in 2015. For the oil market the
situation in Iraq, Libya and Iran will be particularly important. The Israel-
Palestine conflict also negatively affects the tone for the geopolitical risk in
the region. The Ukraine-Russia tensions could end up having effects on the oil
balances as it could lead to lower supply but also to lower demand.
BULLISH MEDIUM
Other Factors
Financial Money Flow
This is a big wild card for 2015. Financial investors may see owning paper oil
as a hedge against the growing geopolitical risk in the MENA region, but if
demand growth disappoints in the emerging markets they may still choose
other asset classes before oil.
NEUTRAL MEDIUM

August 2014 – Torbjørn Kjus 61
DNB Markets | Oil Market Outlook
14 The DNB Markets Brent price forecast
Historical Historical
Nominal $/b Real (2013) $/b
2001 24.4 32.2
2002 25.0 32.4
2003 28.8 36.5
2004 38.3 47.2
2005 54.5 65.0
2006 65.1 75.3
2007 72.4 81.3
2008 97.3 105.2
2009 61.7 67.0
2010 79.5 84.9
2011 111.3 115.2
2012 111.7 113.3
2013 108.7 108.7
Forecast Forecast
Nominal $/b Real (2014) $/b
Q1-14 108 108
Q2-14 110 110
Q3-14 107 107
Q4-14 105 105
2014 107 107
2015 100 100
2016 98 97
2017 96 93
2018 95 90
2019 95 88
2020 95 86
0
20
40
60
80
100
120
140
160
1995 1998 2001 2004 2007 2010 2013 2016 2019
$/b
Spot Brent History & FWD looking
Possible range FWD (nominal) Forecast nominal
Historical Forecast real (2014 USD)Source: Reuters, DNB Markets

August 2014 – Torbjørn Kjus 62
DNB Markets | Oil Market Outlook
15 The DNB Markets commodity team

August 2014 – Torbjørn Kjus 63
DNB Markets | Oil Market Outlook
Important/Disclaimer
This note (the “Note”) must be seen as marketing material and not as an investment recommendation within the meaning of the Norwegian Securities Trading Act of 2007 paragraph 3-10 and the Norwegian Securities Trading Regulation 2007/06/29 no. 876. The Note has been prepared by DNB Markets, a division of DNB Bank ASA, a Norwegian bank organized under the laws of the Kingdom of Norway (the “Bank”), for information purposes only. The Note shall not be used for any unlawful or unauthorized purposes. The Bank, its affiliates, and any third-party providers, as well as their directors, officers, shareholders, employees or agents (individually, each a “DNB Party”; collectively, “DNB Parties”) do not guarantee the accuracy, completeness, timeliness or availability of the Note. DNB Parties are not responsible for any errors or omissions, regardless of the cause, nor for the results obtained from the use of the Note, nor for the security or maintenance of any data input by the user. The Note is provided on an “as is” basis. DNB PARTIES DISCLAIM ANY AND ALL EXPRESS OR IMPLIED WARRANTIES, INCLUDING, BUT NOT LIMITED TO, ANY WARRANTIES OF MERCHANTABILITY OR FITNESS FOR A PARTICULAR PURPOSE OR USE, FREEDOM FROM BUGS, SOFTWARE ERRORS OR DEFECTS, THAT THE NOTE’S FUNCTIONING WILL BE UNINTERRUPTED OR THAT THE NOTE WILL OPERATE WITH ANY SOFTWARE OR HARDWARE CONFIGURATION. In no event shall DNB Parties be liable to any party for any direct, indirect, incidental, exemplary, compensatory, punitive, special or consequential damages, costs, expenses, legal fees, or losses (including, without limitation, lost income or lost profits and opportunity costs) in connection with any use of the Note, even if advised of the possibility of such damages. Any opinions expressed herein reflect the Bank’s judgment at the time the Note was prepared and DNB Parties assume no obligation to update the Note in any form or format. The Note should not be relied on and is not a substitute for the skill, judgment and experience of the user, its management, employees, advisors and/or clients when making investment and other business decisions. No DNB Party is acting as fiduciary or investment advisor in connection with the dissemination of the Note. While the Note is based on information obtained from public sources that the Bank believes to be reliable, no DNB Party has performed an audit of, nor accepts any duty of due diligence or independent verification of, any information it receives. Confidentiality rules and internal rules restrict the exchange of information between different parts of the Bank and this may prevent employees of DNB Markets who are preparing the Note from utilizing or being aware of information available in DNB Markets/the Bank which may be relevant to the recipients of the Note. The Note is not an offer to buy or sell any security or other financial instrument or to participate in any investment strategy. Distribution of material like the Note is in certain jurisdictions restricted by law. Persons in possession of the Note should seek further guidance regarding such restrictions before distributing the Note. The Note is for clients only, and not for publication, and has been prepared for information purposes only by DNB Markets - a division of DNB Bank ASA registered in Norway with registration number NO 984 851 006 (the Register of Business Enterprises) under supervision of the Financial Supervisory Authority of Norway (Finanstilsynet), Monetary Authority of Singapore, the Chilean Superintendent of Banks, and on a limited basis by the Financial Services Authority of UK. Information about DNB Markets can be found at dnb.no. Additional information for clients in Singapore The Note has been distributed by the Singapore branch of DNB Bank ASA. It is intended for general circulation and does not take into account the specific investment objectives, financial situation or particular needs of any particular person. You should seek advice from a financial adviser regarding the suitability of any product referred to in the Note, taking into account your specific financial objectives, financial situation or particular needs before making a commitment to purchase any such product. You have received a copy of the Note because you have been classified either as an accredited investor, an expert investor or as an institutional investor, as these terms have been defined under Singapore’s Financial Advisers Act (Cap. 110) (“FAA”) and/or the Financial Advisers Regulations (“FAR”). The Singapore branch of DNB Bank ASA is a financial adviser exempt from licensing under the FAA but is otherwise subject to the legal requirements of the FAA and of the FAR. By virtue of your status as an accredited investor or as an expert investor, the Singapore branch of DNB Bank ASA is, in respect of certain of its dealings with you or services rendered to you, exempt from having to comply with certain regulatory requirements of the FAA and FAR, including without limitation, sections 25, 27 and 36 of the FAA. Section 25 of the FAA requires a financial adviser to disclose material information concerning designated investment products which are recommended by the financial adviser to you as the client. Section 27 of the FAA requires a financial adviser to have a reasonable basis for making investment recommendations to you as the client. Section 36 of the FAA requires a financial adviser to include, within any circular or written communications in which he makes recommendations concerning securities, a statement of the nature of any interest which the financial adviser (and any person connected or associated with the financial adviser) might have in the securities. Please contact the Singapore branch of DNB Bank ASA at +65 6212 0753 in respect of any matters arising from, or in connection with, the Note. The Note is intended for and is to be circulated only to persons who are classified as an accredited investor, an expert investor or an institutional investor. If you are not an accredited investor, an expert investor or an institutional investor, please contact the Singapore branch of DNB Bank ASA at +65 6212 0753. We, the DNB group, our associates, officers and/or employees may have interests in any products referred to in the Note by acting in various roles including as distributor, holder of principal positions, adviser or lender. We, the DNB group, our associates, officers and/or employees may receive fees, brokerage or commissions for acting in those capacities. In addition, we, the DNB group, our associates, officers and/or employees may buy or sell products as principal or agent and may effect transactions which are not consistent with the information set out in the Note. Additional Information, including for Recipients in the In the United States: The Note does not constitute an offer to sell or buy a security and does not include information, opinions, or recommendations with respect to securities of an issuer or an analysis of a security or an issuer; rather, it is a “market letter,” as the term is defined in NASD Rule 2211.