Embed Size (px)
Citation preview
Operations Management
Unit 7: Managing Quality (2)
授課教師: 國立臺灣大學工商管理學系 黃崇興 教授
本課程指定教材為 Operations Management: Processes and Supply Chains, 10th ed., Lee J. Krajewski, Larry P. Ritzman, and Manoj K Malhotra, Pearson Education, ©2013
本講義僅引用部分內容,請讀者自行準備。
1
【 本 著 作 除 另 有 註 明 外 , 採 取 創用 CC
「姓名標示-非商業性-相同方式分享」台灣 3.0
版授權釋出】

Six Sigma Improvement Model
2
p.185 Figure 5.4
Acceptance Sampling
3
Acceptance SamplingAcceptable quality level (AQL)
p.185
Acceptance Sampling Interface
4
p.186 Figure 5.5
Statistical Process Control (SPC)
5
Performance measurement Variables Attributes
SamplingSampling distributions
p.186, 187
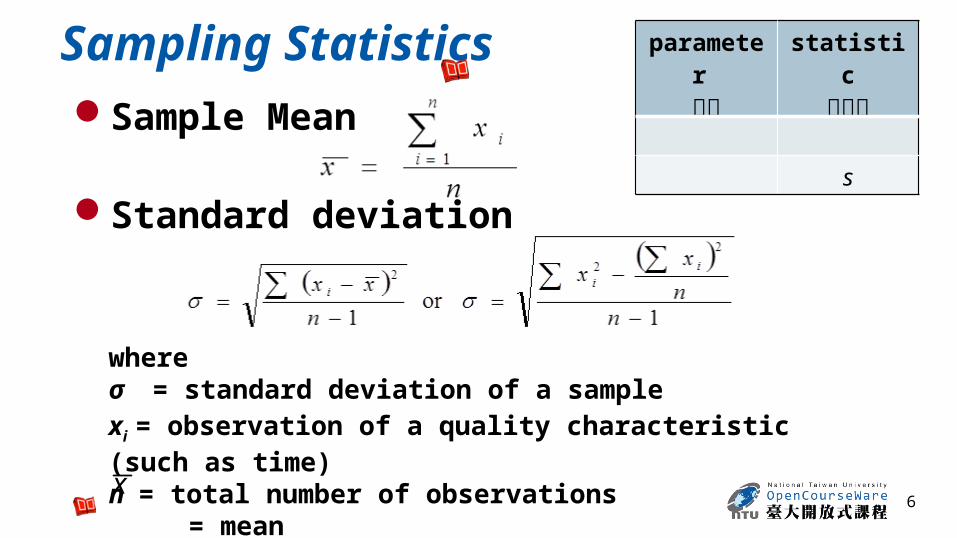
Sampling Statistics
6
Sample Mean
Standard deviation
whereσ = standard deviation of a samplexi = observation of a quality characteristic (such as time)n = total number of observations = meanx
parameter 參數
statistic統計值
s
Sample and Process Distributions
7
p.188 Figure 5.6

Causes of Variation
8
p.188
Common causesAssignable causes
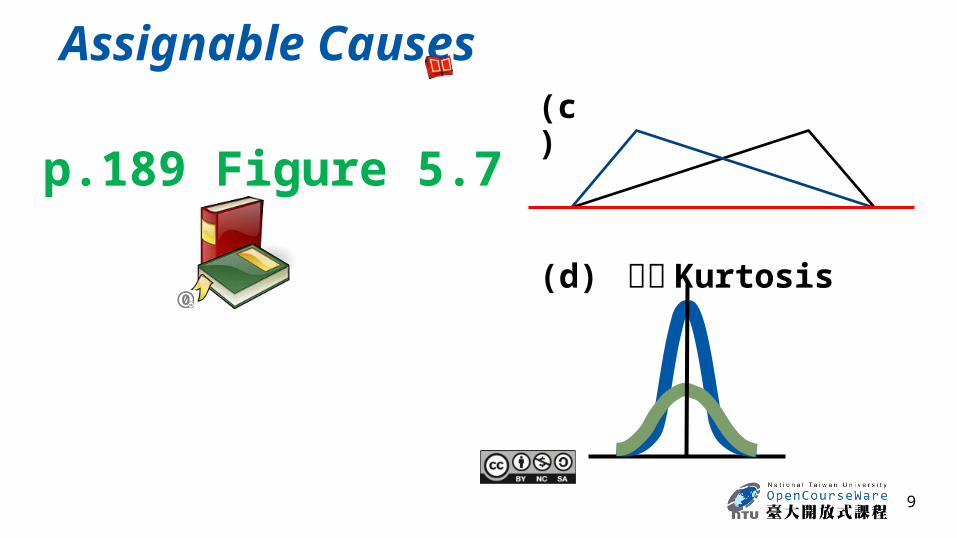
Assignable Causes
9
p.189 Figure 5.7
(c)
(d) 峰度 Kurtosis
Control Charts
10
Time-ordered diagram of process performance Mean Upper control limit Lower control limit
Steps for a control chartp.189
Control Limits and Sampling Distribution
11
p.189 Figure 5.8
Nominal 應然值

Control Charts - Normal
12
p.190 Figure 5.9
Control Chart Errors
13
Two types of error are possible with control charts A type I error occurs A type II error occurs
p.190
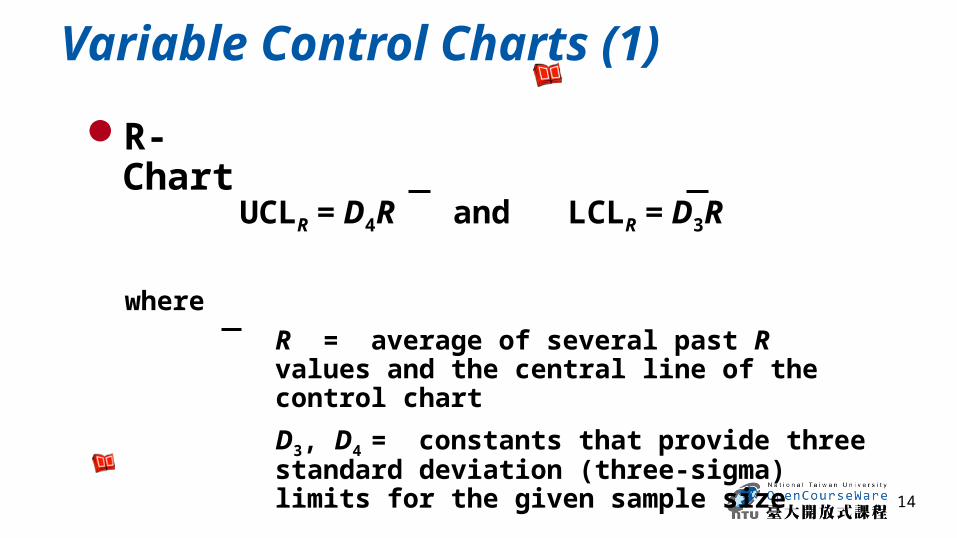
Variable Control Charts (1)
14
UCLR = D4R and LCLR = D3R
where
R = average of several past R values and the central line of the control chart
D3, D4 = constants that provide three standard deviation (three-sigma) limits for the given sample size
R-Chart

Variable Control Charts (2)
15
UCLx = x + A2R and LCLx = x – A2R
x-Chart
where
x = central line of the chart, which can be either the average of past sample means or a target value set for the process
A2 = constant to provide three-sigma limits for the sample mean
Calculating Control Chart Factors
16
p.191 Table 5.1
Example 5.1Using x- and R-Charts
17
p.192, 193

An Alternate Form
18
UCLx = x + zσx and LCLx = x – zσx
where
σx = σ/ nσ = standard deviation of the process distributionn = sample sizex = central line of the chartz = normal deviate number
p.193
EXAMPLE 5.2Using Process Standard Deviation
19
p.194

Control Charts for Attributes
20
nppp / 1
p = the center line on the chart
UCLp = p + zσp and LCLp = p – zσp
and
p-charts
p.194, 195
EXAMPLE 5.3Using a p-Chart
21
p.195, 196

Control Charts for Attributes
22
p.196
UCLc = c + zc and LCLc = c – zc
c-chartsThe mean of the distribution is c and the standard deviation isc
EXAMPLE 5.4Using a c-Chart
23
p.197
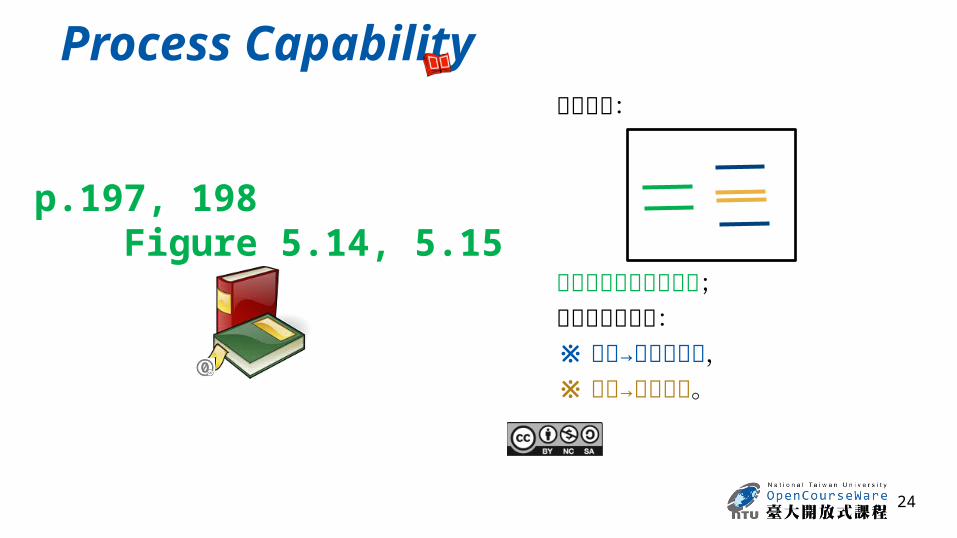
Process Capability
24
p.197, 198 Figure 5.14, 5.15
板書圖示:
綠線表示顧客要求規格;廠商的規格若為:※ 藍線→不符合規格,※ 黃線→符合規格。

Process Capability Index
25
Cpk = Minimum of ,x – Lower specification
3σ
Upper specification – x
3σ
where
σ = standard deviation of the process distribution
p.198
Process Capability Ratio
26
Cp =Upper specification – Lower specification
6σ
p.199

Determining Process Capability
27
4 Steps
p.199

Determining Process Capability Step 4.
28
Cpk
The process is capable.
Continue to monitor the output.
Calculate Cp
Process variability is fine and management should focus on
centering the process.
Management should focus on reducing the variability in the
process until it passes the test
Acceptable
Unacceptable
Unacceptable
Acceptable

EXAMPLE 5.5Assessing Process Capability
29
p.200
Quality Engineering
30
p.199, 200
Quality Loss Function
31
p.201 Figure 5.16
International Quality Documentation Standards
32
ISO 9001:2008 ISO 14000:2004 ISO 26000:2010 Benefits of ISO Certification
p.201, 202
版權聲明
33
頁碼 作品 版權圖示 來源 / 作者
3
Pearson Education / Lee J. Krajewski, Larry P. Ritzman, and Manoj K MalhotraLee J. Krajewski, Larry P. Ritzman, and Manoj K Malhotra, Operations Management: Processes and Supply Chains, 10th ed., Pearson Education,2012. p.185 依據著作權法第 46 、 52 、 65 條合理使用。瀏覽日期: 2013/04/10 。
5
Pearson Education / Lee J. Krajewski, Larry P. Ritzman, and Manoj K MalhotraLee J. Krajewski, Larry P. Ritzman, and Manoj K Malhotra, Operations Management: Processes and Supply Chains, 10th ed., Pearson Education,2012. p.186, 187 依據著作權法第 46 、 52 、 65 條合理使用。瀏覽日期: 2013/04/10 。
6
Pearson Education / Lee J. Krajewski, Larry P. Ritzman, and Manoj K MalhotraLee J. Krajewski, Larry P. Ritzman, and Manoj K Malhotra, Operations Management: Processes and Supply Chains, 10th ed., Pearson Education,2012. p.188 依據著作權法第 46 、 52 、 65 條合理使用。瀏覽日期: 2013/04/10 。
8
Pearson Education / Lee J. Krajewski, Larry P. Ritzman, and Manoj K MalhotraLee J. Krajewski, Larry P. Ritzman, and Manoj K Malhotra, Operations Management: Processes and Supply Chains, 10th ed., Pearson Education,2012. p.188 依據著作權法第 46 、 52 、 65 條合理使用。瀏覽日期: 2013/04/10 。
9 臺灣大學 / 黃崇興教授
版權聲明
34
頁碼 作品 版權圖示 來源 / 作者
10
Pearson Education / Lee J. Krajewski, Larry P. Ritzman, and Manoj K MalhotraLee J. Krajewski, Larry P. Ritzman, and Manoj K Malhotra, Operations Management: Processes and Supply Chains, 10th ed., Pearson Education,2012. p.189 依據著作權法第 46 、 52 、 65 條合理使用。瀏覽日期: 2013/04/10 。
13
Pearson Education / Lee J. Krajewski, Larry P. Ritzman, and Manoj K MalhotraLee J. Krajewski, Larry P. Ritzman, and Manoj K Malhotra, Operations Management: Processes and Supply Chains, 10th ed., Pearson Education,2012. p.190 依據著作權法第 46 、 52 、 65 條合理使用。瀏覽日期: 2013/04/10 。
14
Pearson Education / Lee J. Krajewski, Larry P. Ritzman, and Manoj K MalhotraLee J. Krajewski, Larry P. Ritzman, and Manoj K Malhotra, Operations Management: Processes and Supply Chains, 10th ed., Pearson Education,2012. p.190 依據著作權法第 46 、 52 、 65 條合理使用。瀏覽日期: 2013/04/10 。
15
Pearson Education / Lee J. Krajewski, Larry P. Ritzman, and Manoj K MalhotraLee J. Krajewski, Larry P. Ritzman, and Manoj K Malhotra, Operations Management: Processes and Supply Chains, 10th ed., Pearson Education,2012. p.191 依據著作權法第 46 、 52 、 65 條合理使用。瀏覽日期: 2013/04/10 。
18
Pearson Education / Lee J. Krajewski, Larry P. Ritzman, and Manoj K MalhotraLee J. Krajewski, Larry P. Ritzman, and Manoj K Malhotra, Operations Management: Processes and Supply Chains, 10th ed., Pearson Education,2012. p.193 依據著作權法第 46 、 52 、 65 條合理使用。瀏覽日期: 2013/04/10 。
版權聲明
35
頁碼 作品 版權圖示 來源 / 作者
20
Pearson Education / Lee J. Krajewski, Larry P. Ritzman, and Manoj K MalhotraLee J. Krajewski, Larry P. Ritzman, and Manoj K Malhotra, Operations Management: Processes and Supply Chains, 10th ed., Pearson Education,2012. p.194,195 依據著作權法第 46 、 52 、 65 條合理使用。瀏覽日期: 2013/04/10 。
22
Pearson Education / Lee J. Krajewski, Larry P. Ritzman, and Manoj K MalhotraLee J. Krajewski, Larry P. Ritzman, and Manoj K Malhotra, Operations Management: Processes and Supply Chains, 10th ed., Pearson Education,2012. p.196 依據著作權法第 46 、 52 、 65 條合理使用。瀏覽日期: 2013/04/10 。
24 臺灣大學 / 黃崇興教授
25
Pearson Education / Lee J. Krajewski, Larry P. Ritzman, and Manoj K MalhotraLee J. Krajewski, Larry P. Ritzman, and Manoj K Malhotra, Operations Management: Processes and Supply Chains, 10th ed., Pearson Education,2012. p.198 依據著作權法第 46 、 52 、 65 條合理使用。瀏覽日期: 2013/04/10 。
25 臺灣大學 / 黃崇興教授
版權聲明
36
頁碼 作品 版權圖示 來源 / 作者
26
Pearson Education / Lee J. Krajewski, Larry P. Ritzman, and Manoj K MalhotraLee J. Krajewski, Larry P. Ritzman, and Manoj K Malhotra, Operations Management: Processes and Supply Chains, 10th ed., Pearson Education,2012. p.199 依據著作權法第 46 、 52 、 65 條合理使用。瀏覽日期: 2013/04/10 。
28 臺灣大學 / 黃崇興教授
32
Pearson Education / Lee J. Krajewski, Larry P. Ritzman, and Manoj K MalhotraLee J. Krajewski, Larry P. Ritzman, and Manoj K Malhotra, Operations Management: Processes and Supply Chains, 10th ed., Pearson Education,2012. p.201,202 依據著作權法第 46 、 52 、 65 條合理使用。瀏覽日期: 2013/04/10 。
2-5, 7-13, 16-27, 29-
32
Pixabay/ Unknownhttp://pixabay.com/en/ashton-books-book-42701本作品屬公共領域之著作。瀏覽日期: 2013/04/10 。
2-32
Six Sigma Improvement Model...International Quality Documentation Standards( 各頁標題 )
Pearson Education / Lee J., Larry P. Ritzman, and Manoj K Malhotra,Operations Management: Processes and Supply Chains, 10th ed., P. 185-202 .本作品以著作權法第 46 、 52 、 65 條合理使用。瀏覽日期: 2013/04/10 。