Embed Size (px)
Citation preview

IEEJ © 2015年7月 禁無断転載
Outlook for International Oil Market
The Institute of Energy Economics, Japan
Yoshikazu Kobayashi Manager, Oil Group, Oil Subunit, Fossil Fuels & Electric Power Industry Unit
420th Regular Research Report Presentation Session July 10, 2015 IEEJ:Published in August 2015 All rights reserved

IEE
J ©
201
5
Key Points of Today’s Report
The global oil supply-demand balance will gradually tighten in thesecond half of 2015 as demand increases steadily despite a slowdownin non-OPEC production. Given oil price-lowering factors such asOPEC countries’ possible oil output expansion, high-level inventories inindustrial countries, the Greek debt crisis, and other financial andeconomic factors, however, crude oil prices will remain weak in theperiod.
Crude oil prices will turn up in 2016 as the supply-demand balancetightens moderately. But no substantial price hike is likely as highercrude oil prices are expected to induce an increase in U.S. oilproduction and as Iran is expected to expand oil output in a full-blownmanner if Western economic sanctions on Iran over the nuclearproblem are lifted.
1
IEEJ:Published in August 2015 All rights reserved

IEE
J ©
201
5
Recent Trends of International Crude Oil Prices Crude oil prices bottomed out and turned up in January 2015 after a rapid fall from the
summer of 2014. Since May 2015, the Brent crude oil price has remained stable in the $60-65/bbl range.
Crude oil price volatility has calmed down in the wake of a temporary rise.
Brent crude oil price since 2013
Source: Prepared based on ICE data
Historical volatility (20 days) of Brent crude oil price
Source: ICE 2
IEEJ:Published in August 2015 All rights reserved

IEE
J ©
201
5
Factors behind Oil Price Hikes Since Early 2015 ① Deceleration of U.S. Crude Oil Output Expansion As oil development operations have declined since the fourth quarter of 2014, output growth
has lost steam. Output expansion came to a halt in the second quarter of 2015. At present, however, U.S. production
cannot be concluded as having entered a downward trend.
Source: EIA 3
Crude oil output in Lower 48 U.S. states
IEEJ:Published in August 2015 All rights reserved

IEE
J ©
201
5
Factors behind Oil Price Hikes since Early 2015 ② Demand Recovery U.S. petroleum product demand has recovered on an economic pickup and petroleum
product price falls. Demand has generally increased for petroleum products, particularly gasoline.
Oil demand has steadily increased in China despite economic growth deceleration. Demand has been robust for gasoline, diesel oil and LPG including petrochemical feedstock.
U.S. petroleum product demand changes (year on year)
Source: APEC data
Nominal Chinese petroleum product demand changes (year on year)
Source: U.S. EIA data 4
Others Heavy fuel oil Diesel oil
Jet fuel
Gasoline
LPG
Heavy fuel oil Diesel oil
Kerosene
Gasoline
LPG
IEEJ:Published in August 2015 All rights reserved

IEE
J ©
201
5
Factors behind Oil Price Hikes since Early 2015 ③ Investment Fund Trends Open interest for Brent futures on the ICE increased from January, hitting a record high. As well as open interest, net long positions for managed money increased.
European cold weather, the falling number of U.S. oil drilling rigs in operation, uncertainties about thefuture Middle East situation and other factors apparently encouraged speculative buying amidexpectations of oil price hikes.
But investment has slowed down since April.
ICE market open interest
Source: ICE data
Each player category’s positions on ICE market
Source: ICE data 5
(Long positions)
(Short positions)
1,00
0 co
ntra
cts
1,00
0 co
ntra
cts
Producers/traders Swap dealers Managed money
IEEJ:Published in August 2015 All rights reserved

IEE
J ©
201
5
Future Economic Growth and World Oil Demand World economic activity will gradually expand from 2015 to 2016.
While China’s economic growth will decelerate, OECD countries will steadily recover.
Year-on-year world oil demand growth will rise back above 1 million bpd. Driving global oil demand growth will be demand recovery in North America as well as China, other
Asian countries and the Middle East.
IMF outlook for global GDP growth
Source: Estimates based on IEA, OPEC and EIA data
Year-on-year world oil demand changes and outlook
Source: IMF (April 2015)
Estimate Estimate
6
World Japan U.S. EU China Others
Middle East
Latin America
Other Asian countries
China
Former Soviet Union
OECD Asia
OECD Europe
OECD North America
Total
IEEJ:Published in August 2015 All rights reserved

IEE
J ©
201
5
Non-OPEC Supply Non-OPEC oil output is expected to continue to expand, although the expansion will slow
down in line with the oil price decline. U.S. output, though leveling off recently, will increase for the whole of 2015. It will continue to expand at
a slow pace in 2016 as development cost drops and efficiency improvements encourage development.
Region-by-region non-OPEC oil supply changes (year on year)
Source: EIA
U.S. oil development cost indicators
Note: OPEC data cover NGL Source: Estimates based on IEA, EIA and OPEC data.
Estimate
7
Others
OPEC (NGL)
Latin America
China
Former Soviet Union
Europe
Canada
U.S.
Total (right scale)
IEEJ:Published in August 2015 All rights reserved
IEE
J ©
201
5
Saudi Oil Production Trends At present, there is no sign that Saudi Arabia will change its policy of giving priority to its
market share. As competition continues for the Asian market, Saudi Arabia’s production cut will lead
directly to a decline in its oil market share. Saudi Arabia has lost some of its market share in China to Iraq, Iran and others and may try to defend
its share in response to future output growth in Iran and Iraq.
Saudi oil production trends
Source: China OGP
Changes in China’s crude oil import sources
Source: IEA 8
For domestic refineries
For direct combustion
For exports
Saudi Arabia
Iran
Iraq
Angola
Russia
Venezuela
IEEJ:Published in August 2015 All rights reserved

IEE
J ©
201
5
Future Supply-demand Balance Outlook Supply will remain above demand within 2015, although the supply-demand gap has been
relatively narrowing. The supply-demand balance will gradually tighten with oversupply diminishing in 2016.
Global crude oil supply-demand balance results and outlook
Estimate
9 Source: Estimates based on IEA, EIA and OPEC data
Demand
Supply Supply-demand gap
IEEJ:Published in August 2015 All rights reserved
IEE
J ©
201
5
Financial and Economic Factors Greek default problem
A Greek default could trigger the euro’s decline against the dollar.
European and global financial markets and real economies could be affected.
Oil demand could decline in Europe and other regions.
U.S. Fed’s interest rate hike As the U.S. economy starts a full-blown recovery, the zero interest policy will be terminated.
U.S. Fed Chairwoman Yellen said that it would be appropriate to begin within this year to raiseinterest rates and that any decision would be based on data.
The dollar’s depreciation and financial market money supply drops through an interest rate hikewould exert downward pressure on the crude oil market.
Chinese economy’s New Normal and its future impact on oil demand Economic growth deceleration has so far exerted no remarkable negative impact on oil demand.
In the future, overall energy demand will decelerate through the promotion of energy conservationand a decline in demand for transporting domestically produced coal will work to slow down diesel oildemand.
If demand deceleration becomes remarkable, it may affect market participants’ perception of China’sfuture oil demand.
10
IEEJ:Published in August 2015 All rights reserved

IEE
J ©
201
5
Crude Oil Exports from Iran After sanctions were enhanced in 2012, Iran’s crude oil exports declined by about 1.2 million bpd from
2012 to 2014.
Attention is being paid to how much Iran would increase crude oil exports after the sanctions are lifted.− Iranian Oil Minister Zanganeh said oil output could be increased by 1 million bpd in seven months after the
sanctions are lifted. The IEA has assessed Iran’s surplus oil production capacity as 750,000 bpd. Among others, the U.S. Energy Information Administration has estimated that Iran could expand oil output by 700,000 bpd by the end of 2016. A U.S. think tank has forecast that Iranian oil output could be raised by 500,000-800,000 bpd within six to 12 months after the termination of the sanctions. A consultant in the United Kingdom has predicted that Iran could increase oil output by 500,000 bpd within two to three months after the termination.
Iranian oil export growth will depend heavily on when the sanctions would be lifted and whether Irancould secure sufficient sales channels. If Iran expands oil exports by 700,000-800,000 bpd, internationalcrude oil prices may decline by some $10/bbl.
Source: IEEJ JIME Center Source: EIA
Iran crude oil export trends (2011⇒2014) Sanctions subject to mitigation/repeal
Sanctions based on UNSC resolutions
Freeze on assets, export control, ban on financial support for new trade deals, etc.
Secondary nuclear-related sanctions under U.S. law
Ban on upstream sector development investment and military technology transfers, ban on trade in petroleum products, crude oil, automobiles and petrochemicals, ban on financial, insurance and shipping services, etc.
EU nuclear-related sanctions
Crude oil embargo, ban on insurance/reinsurance, etc.
Relevant Japanese government measures
Freeze on assets, export control, fund transfer prevention, etc.
・・・What sanctions would be lifted when is unknown at present. 11 2011
average For
Europe For
OECD Asia
For non-OECD Asia
Others 2014 average
IEEJ:Published in August 2015 All rights reserved

IEE
J ©
201
5
Price-Boosting/Lowering Factors As well as supply and demand factors, risk, financial and economic factors greatly affect crude oil prices.
Price-boosting factors Price-lowering factors Iran’s export expansion accompanying early
termination of economic sanctions and Iraq’scontinued oil output expansion
Saudi Arabia’s further oil output expansion tocounter abovementioned moves
Dollar appreciation and money supply declineaccompanying U.S. Fed interest rate hikes inor after autumn 2015
Dissemination of adverse financial andeconomic impacts of the Greek debt crisis inEurope and the world
Economic growth deceleration and slumpingdemand in China and other emergingeconomies
Political destabilization factors and terrorism inthe Middle East, including Islamic Stateterrorist attacks and the Yemeni situation
Continuation of recovery in global oil demandincluding U.S. and Chinese demand
Saudi Arabia’s reversal of policy giving priorityto maintaining its market share
U.S. hurricane disasters
Rough Iran nuclear negotiations andcontinuation or enhancement of Westerneconomic sanctions on Iran
12
IEEJ:Published in August 2015 All rights reserved

IEE
J ©
201
5
Outlook on International Crude Oil Prices
13
Following is an outlook on crude oil prices in the second half of 2015 and the whole of 2016:
Basic assumptions for forecasting prices In the international crude oil market in the second half of 2015, the supply-demand balance will
gradually tighten on a slowdown in non-OPEC production and firm demand growth. But crude oilprices will remain weak as a possible OPEC output increase, massive inventories in industrialcountries, and the Greek default problem and other financial and economic factors work to lower oilprices.
In the international crude oil market in 2016, prices will turn upward as the supply-demand balancemoderately tightens. Given that any price hike may induce an increase in U.S. production and thatIran may expand production in 2016 if economic sanctions are lifted, however, no substantial pricehike is likely.
As for price differences between crude oil brands, see the results for the first half of 2015.
Benchmark crude oil
1st half of 2015 (results) 2nd half of 2015 Whole of 2016
Brent $59/bbl $60/bbl±$10 $65/bbl±$10
Dubai $57/bbl $58/bbl±$10 $63/bbl±$10
WTI $53/bbl $55/bbl±$10 $60/bbl±$10
IEEJ:Published in August 2015 All rights reserved

IEE
J ©
201
5
References
14
IEEJ:Published in August 2015 All rights reserved
IEE
J ©
201
5
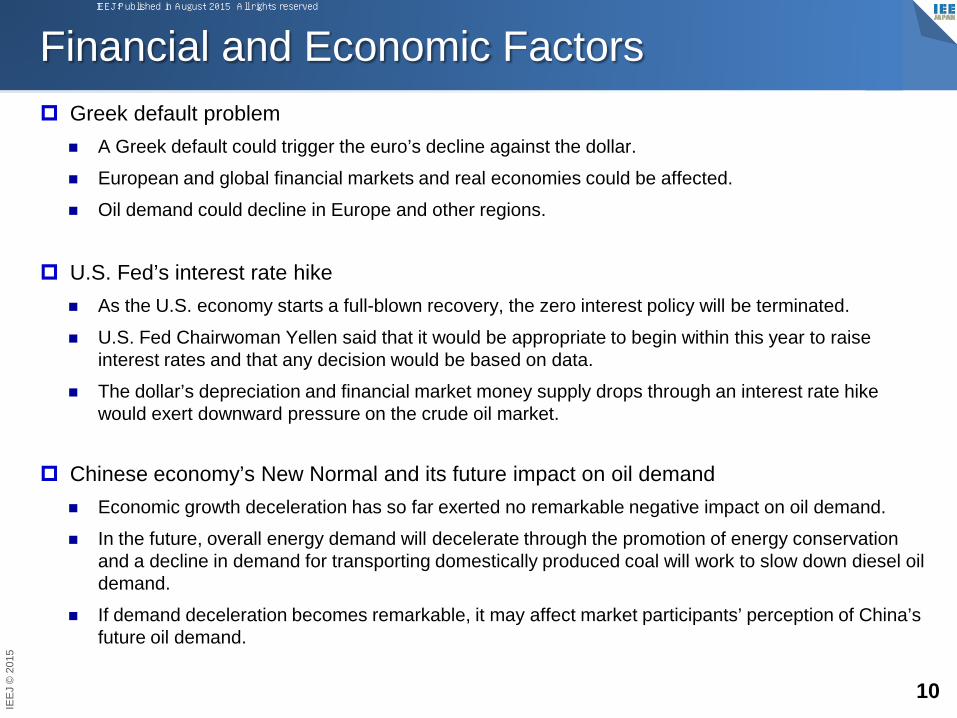
Impacts of Exchange Rate and Stock Market Changes Since the second half of 2014, a strong correlation has existed between exchange rates and crude oil
futures markets Mechanism for a stronger dollar to induce weaker crude oil prices: Stronger dollar ⇒ The dollar rises against other
currencies ⇒ The value of crude oil traded in dollars rise irrespective of actual value or supply/demand factors ⇒Crude oil is overvalued for exchange rate changes alone ⇒ Market participants believe crude oil prices will fall aspresent overvaluation is corrected ⇒ Market participants are prompted to sell crude oil futures.
A U.S. stock market upsurge reflecting a U.S. economic pickup might have been a contributor to oilprices’ rally since early 2015, although stock prices’ correlation with crude oil prices has become weakerthan in the past.
Exchange rate and WTI price
Source: Prepared by the author based on various data
Stock prices and WTI price
Source: Prepared by the author based on FRB and EIA data 15
WTI $/Euro (right scale) WTI Dow Jones industrial average (right scale)
IEEJ:Published in August 2015 All rights reserved

IEE
J ©
201
5
Iraq’s Crude Oil Exports Iraq’s crude oil output has increased by 1 million bpd in the past three years due to new
oilfield and export infrastructure development. The Iraqi government sets an oil production target at 6 million bpd for 2020, after a recent
downward revision.
In June 2015, exports from southern Iraq increased substantially due to an export capacityexpansion.
Source: IEA
Iraq’s crude oil output Iraq’s crude oil exports (SOMO sales)
Source: Iraq Oil Ministry
0.0
0.5
1.0
1.5
2.0
2.5
3.0
3.5
4.0
4.5
2012 2013 2014 2015
million b/d
16
South
North
IEEJ:Published in August 2015 All rights reserved

IEE
J ©
201
5
In April 2015, oil and LNG production was suspended due to the deterioration of the domestic politicalsituation. While the suspension has covered 140,000 bpd in oil output and 6.7 million tons in LNG production, it has had no major
impact on international oil and LNG markets.
Matters of concern include the domestic conflict’s spillover to Saudi Arabia and other neighboringcountries and its possible impacts on recently growing oil traffic through the Bab el-Mandeb Strait.
Yemen’s Oil/Natural Gas Situation
Source: CIA
Yemen and Bab el-Mandeb Strait Oil traffic through Bab el-Mandeb Strait
Source: EIA
Bab el-Mandeb Strait
17
Yemen
Southward (Red Sea ⇒Gulf of Aden) (Products) Southward (Crude oil) Northward (Gulf of Aden⇒Red Sea) (Products) Northward (Crude oil)
IEEJ:Published in August 2015 All rights reserved
Please direct inquiries to: [email protected]