Embed Size (px)
Citation preview
JCER DISCUSSION PAPER No.104
2006 年 8 月
社団法人 日本経済研究センター
Japan Center For Economic Research
Ownership, Foreign Investment and Productivity --A Case Study of the Automotive Industry in China--
(This paper is a part of the research project “Multinational Firms' Strategies in East Asia:A Comparison of Japanese, U.S., European and Korean Firms” sponsored
by Nihon Keizai Shimbun, Inc.)
Deqiang Liu(Tokyo Gakugei University)
Yanyun Zhao(Renmin University of China)
1
Ownership, Foreign Investment and Productivity --A Case Study of the Automotive Industry in China--
Deqiang Liu Tokyo Gakugei University
Yanyun Zhao
Renmin University of China
Abstract
It is widely believed that the enter of multinational automakers and the ownership reforms of native enterprises promoted the development of China’s automotive industry in recent years, but no study has been conducted on it’s productivity. In this study, using micro-data on China’s automakers from 1999 to 2004, we tried to elucidate the characteristics of the development of China’s auto industry. According to the analysis results based on Cob-Douglas type production function, we found, 1) the rapid development of auto industries in China accompanies a rapid improvement in productivity from 1999-2004; 2) in China’s auto industry, foreign-affiliated firms or foreign capital have overwhelming strength with regard to productivity; 3) the improvement in productivity of auto industry is not attributable to foreign-affiliated firms or foreign capital only, the contribution of state capital to productivity has risen gradually, and has approached that of non-state capital.
Keywords: productivity, auto industry, multinational automaker, ownership reform
2
China’s automotive industry has been growing rapidly in recent years1. Auto production
in 2000 totaled 2.07 millions vehicles, but in 2005 it reached 5.7 millions, almost tripling in five years. From the point of view of auto production alone, China has already taken up fourth place among the auto producing countries of the world, after the America, Japan and Germany.
The auto industry is a typical assembling industry because vast numbers of parts are necessary for production. It is also a technology-intensive and knowledge-intensive industry because it demands high performance and quality parts. It is hard to say that China, with a relatively small accumulation of knowledge and technology, has a sizeable comparative advantage in such an industry. However, China’s auto industry has grown up very rapidly thanks to the efforts, which China’s auto enterprises themselves have channeled into restructuring, as well as to ownership reform and the investment of foreign automakers in China (Francois and Spinanger 2004). Particularly taking advantage of China’s WTO accession are foreign enterprises whose arrival in China has added to the workforce. As a result, the main automakers of the world have all entered the Chinese market (Maruyama and Takahashi 2004; Seki 2003).
The problem is, did the productivity of China’s auto industry rise after the arrival of foreign makers and the ownership reforms, which took place in China’s native auto enterprises? In step with China’s rapid economic growth, domestic demand for automobiles increased explosively. In order to satisfy this demand, not only foreign makers but also native automakers promptly increased investment in the industry. If the automotive industry of China grows without improving productivity, development will be hard pressed to continue.
Although there have been a lot of studies on the development and productivity of the manufacturing industry in China up until now (Gordon and Li 1995; Groves et al 1994, 1995; Jefferson et al 1996; Jefferson et al 2003; Jefferson et al 2000; Zheng, Liu, Bigsten 2003; Liu and Otsuka 2004), no study has been conducted on the productivity of the auto industry based on firm level data. Therefore, it is not clear whether the productivity of the auto industry has in fact improved. The purpose of this study is to clarify the influence of foreign automakers on the industry by using the micro-data of assembling firms in China from 1999 to 2004. At the same time, the influence of ownership reforms on productivity will supposedly be elucidated.
The organization of this paper is as follows. Section 1 describes the general development process of China’s auto industry. Section 2 shows the situation of multinational automakers in 1 In this paper, “automotive” or “auto” is used to denote any type of automotive vehicle including cars, trucks, buses, etc.
3
China’s market, focusing particularly on carmakers. Section 3 discusses the characteristics of automakers by ownership type and product type. Section 4 makes the hypotheses of this paper and specifies production function. Section 5 shows the estimation results of production function. Finally, section 6 discusses the implications of the study as well as the problems left by the paper.
1. The development of China’s auto industry China’s auto industry came into being at the beginning of the 1950s. The First Auto
Factory was founded in Changchun, northeastern China, with the technological assistance of the former Soviet Union. Its main product was a truck named “Jiefang (Liberation)". In 1975, the Second Auto Factory was completed in Hubei province and it produced “Dongfeng” trucks. With regard to cars, high-quality cars of the brand name "Hongqi" were produced in the First Auto Factory, and Shanghai Auto Factory mainly produced cars as well. Total car production in China amounted to a mere 5000 even in 1983.
During the period of the “planned economy”, the production of automobiles by large enterprises, which were under the control of central government, was unable to meet the demand of the Chinese economy. From the beginning of the 1970s, central government extended the autonomy of local governments with regard to automobile production. As a result of this policy, auto factories were founded in almost all of the provinces. However, the scale of production was too small, and effective mass production was impossible.
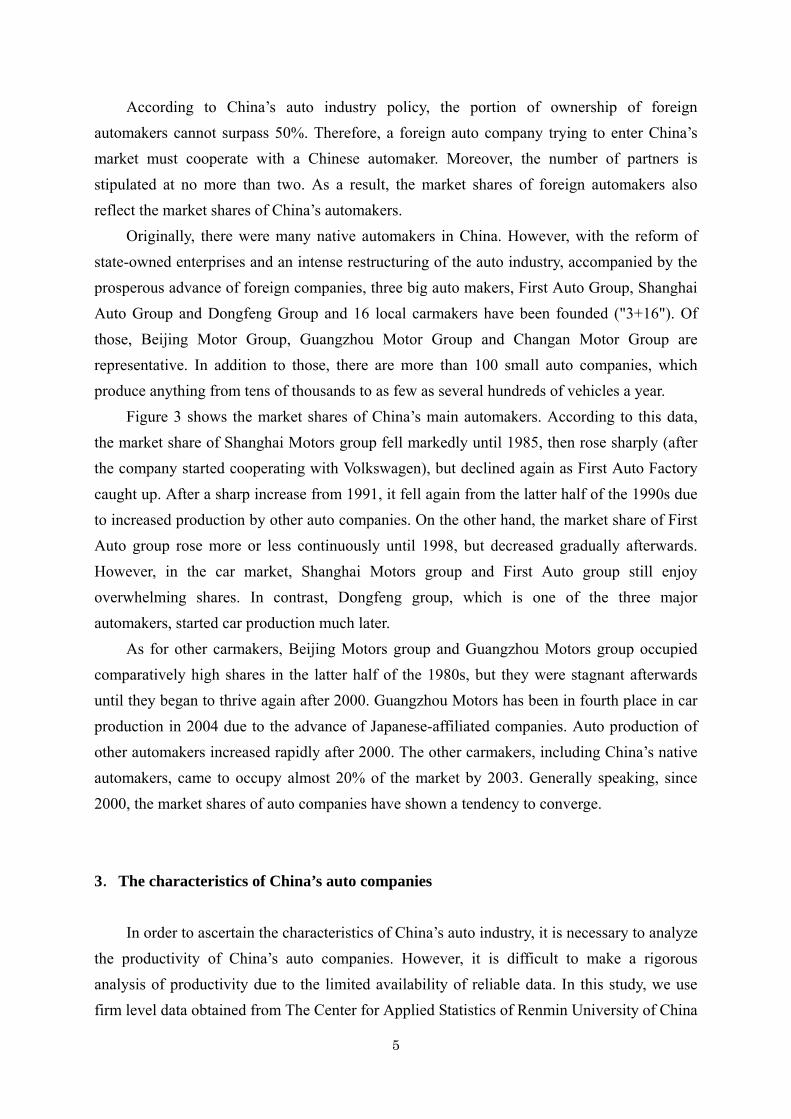
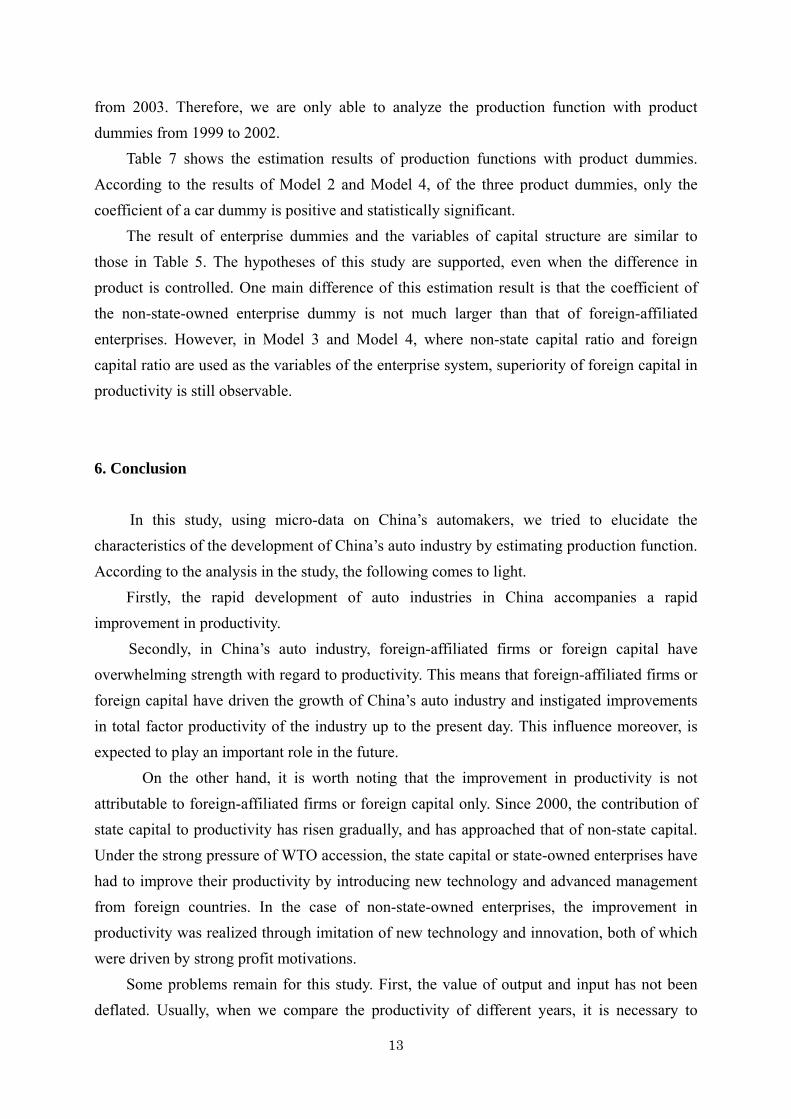
Figure 1 shows the change in auto production from 1963 to 2004. Total auto production, which was only 40,000 in 1963, surpassed 100,000 in 1971, but did not rise above 150,000 in 1978. After the reform and the openness policy were accomplished, the auto industry grew rapidly, and automobile production reached 310,000 in 1984. Nevertheless, it was still necessary to import a large quantity of automobiles every year from foreign countries. In 1985, Shanghai Auto Factory and Volkswagen inaugurated production of "Santana" in China. From then on, there was full-scale cooperation between the Chinese auto industry and multinational auto companies. In the 1990's, with the expansion of China’s openness, the major multinational automakers of the world advanced into China one after another. Auto production in China increased rapidly until 2000. Although the production of trucks was stagnant, the production of cars and buses spread throughout the nation. Furthermore, since the beginning of this century, with China’s accession to the WTO, auto production has increased at an accelerating tempo. In 2005, total auto production reached 5.7 millions, and the production of cars has increased dramatically reaching approximately 3 millions.
4
2. The competition among multinational automakers in China
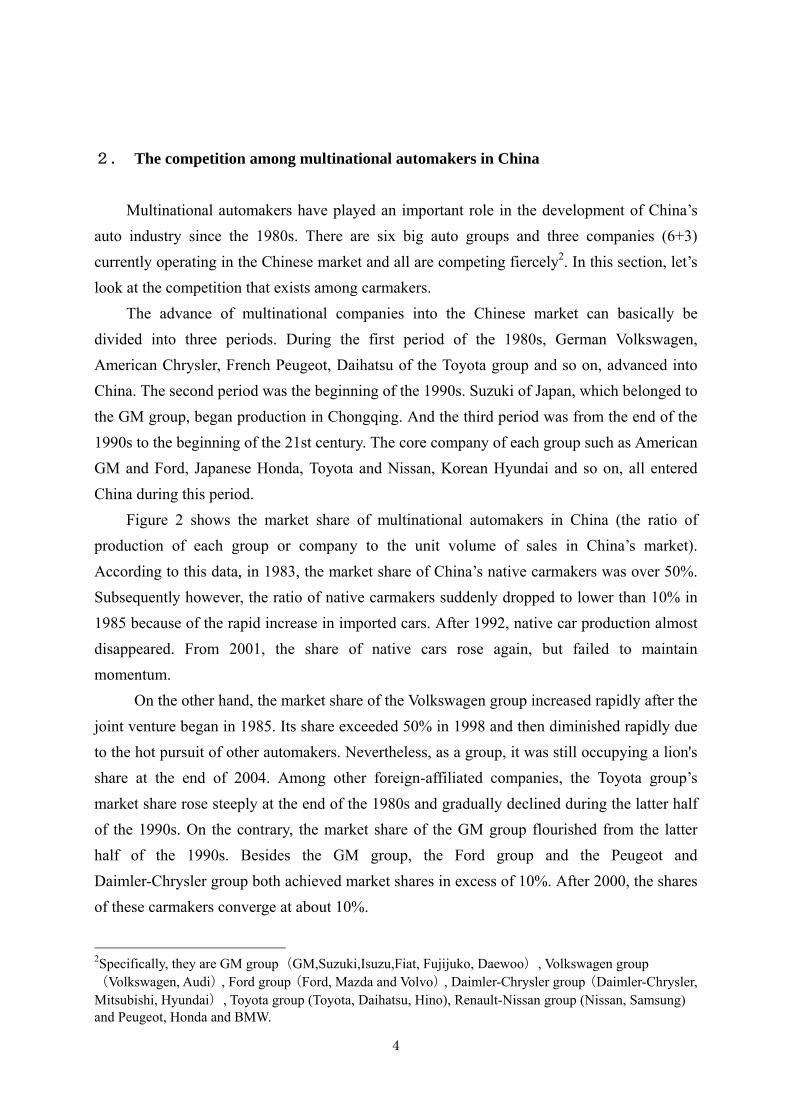
Multinational automakers have played an important role in the development of China’s auto industry since the 1980s. There are six big auto groups and three companies (6+3) currently operating in the Chinese market and all are competing fiercely2. In this section, let’s look at the competition that exists among carmakers.
The advance of multinational companies into the Chinese market can basically be divided into three periods. During the first period of the 1980s, German Volkswagen, American Chrysler, French Peugeot, Daihatsu of the Toyota group and so on, advanced into China. The second period was the beginning of the 1990s. Suzuki of Japan, which belonged to the GM group, began production in Chongqing. And the third period was from the end of the 1990s to the beginning of the 21st century. The core company of each group such as American GM and Ford, Japanese Honda, Toyota and Nissan, Korean Hyundai and so on, all entered China during this period.
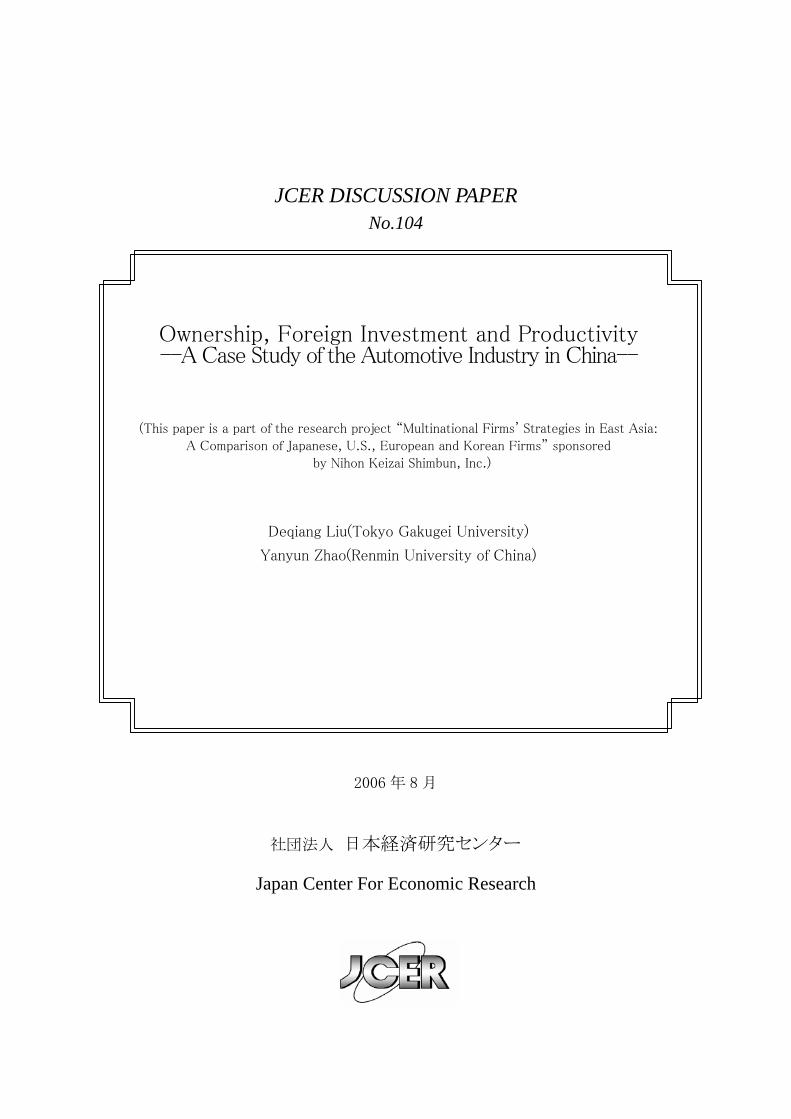
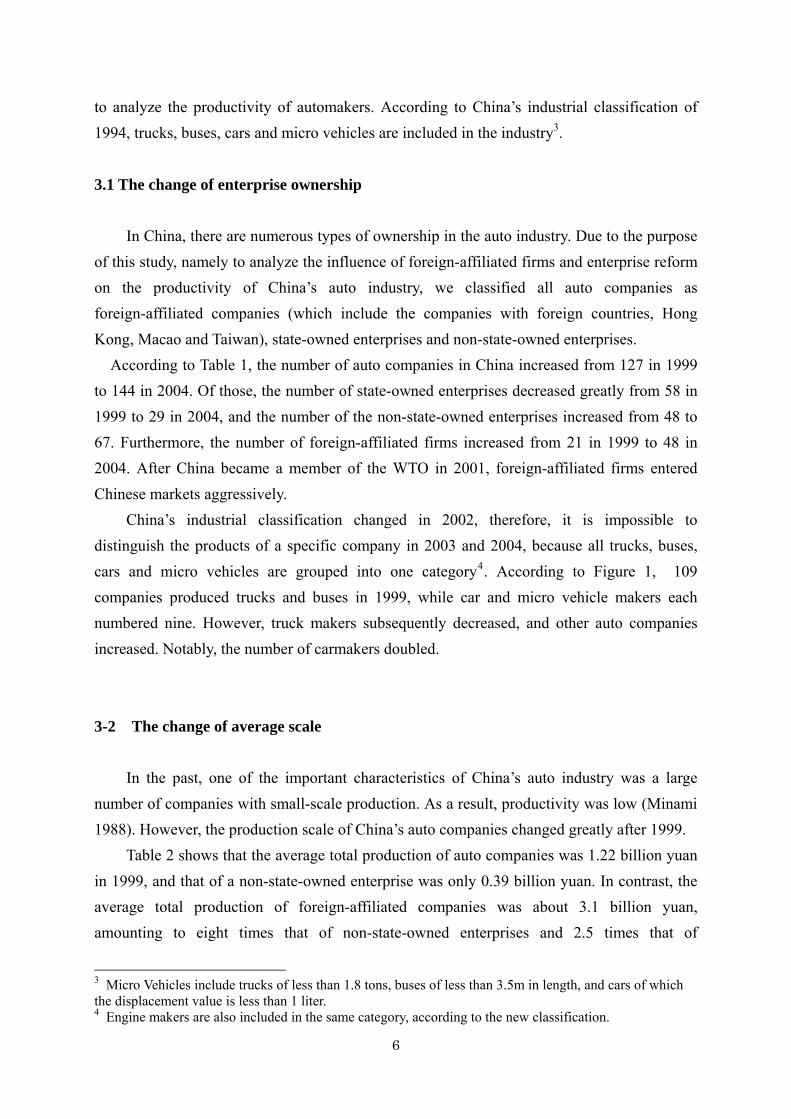
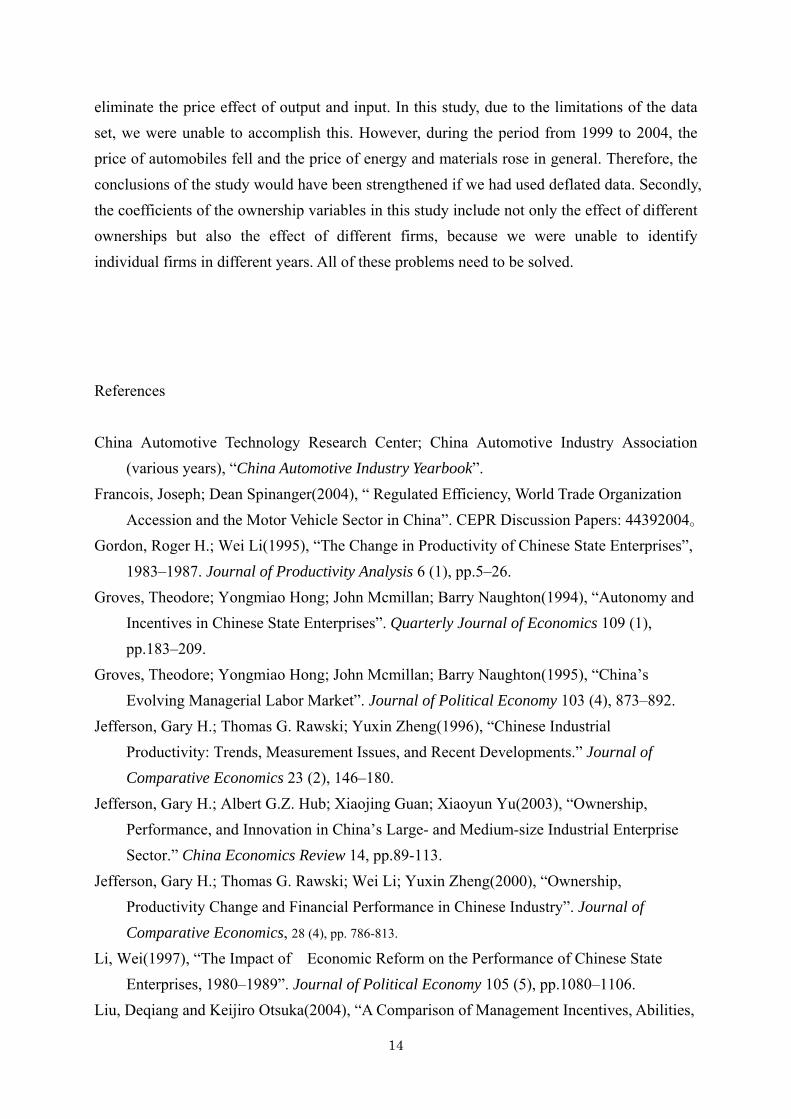
Figure 2 shows the market share of multinational automakers in China (the ratio of production of each group or company to the unit volume of sales in China’s market). According to this data, in 1983, the market share of China’s native carmakers was over 50%. Subsequently however, the ratio of native carmakers suddenly dropped to lower than 10% in 1985 because of the rapid increase in imported cars. After 1992, native car production almost disappeared. From 2001, the share of native cars rose again, but failed to maintain momentum.
On the other hand, the market share of the Volkswagen group increased rapidly after the joint venture began in 1985. Its share exceeded 50% in 1998 and then diminished rapidly due to the hot pursuit of other automakers. Nevertheless, as a group, it was still occupying a lion's share at the end of 2004. Among other foreign-affiliated companies, the Toyota group’s market share rose steeply at the end of the 1980s and gradually declined during the latter half of the 1990s. On the contrary, the market share of the GM group flourished from the latter half of the 1990s. Besides the GM group, the Ford group and the Peugeot and Daimler-Chrysler group both achieved market shares in excess of 10%. After 2000, the shares of these carmakers converge at about 10%.
2Specifically, they are GM group(GM,Suzuki,Isuzu,Fiat, Fujijuko, Daewoo), Volkswagen group(Volkswagen, Audi), Ford group(Ford, Mazda and Volvo), Daimler-Chrysler group(Daimler-Chrysler, Mitsubishi, Hyundai), Toyota group (Toyota, Daihatsu, Hino), Renault-Nissan group (Nissan, Samsung) and Peugeot, Honda and BMW.
5
According to China’s auto industry policy, the portion of ownership of foreign automakers cannot surpass 50%. Therefore, a foreign auto company trying to enter China’s market must cooperate with a Chinese automaker. Moreover, the number of partners is stipulated at no more than two. As a result, the market shares of foreign automakers also reflect the market shares of China’s automakers.
Originally, there were many native automakers in China. However, with the reform of state-owned enterprises and an intense restructuring of the auto industry, accompanied by the prosperous advance of foreign companies, three big auto makers, First Auto Group, Shanghai Auto Group and Dongfeng Group and 16 local carmakers have been founded ("3+16"). Of those, Beijing Motor Group, Guangzhou Motor Group and Changan Motor Group are representative. In addition to those, there are more than 100 small auto companies, which produce anything from tens of thousands to as few as several hundreds of vehicles a year.
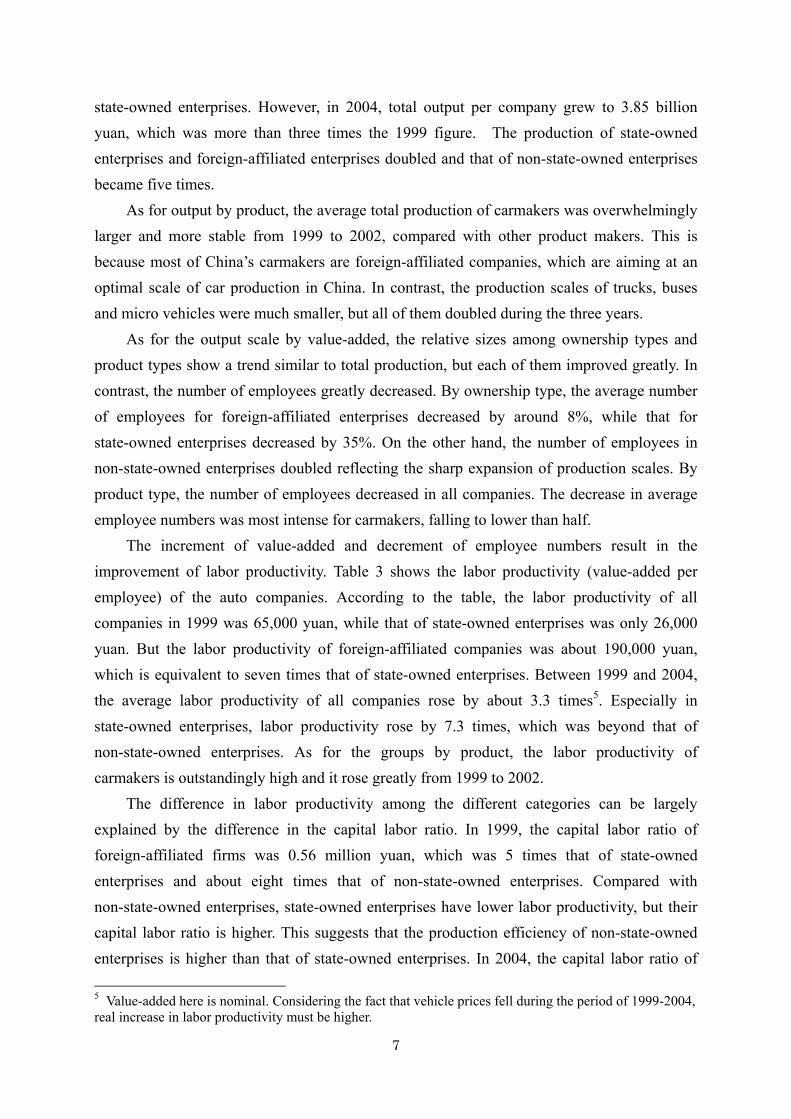
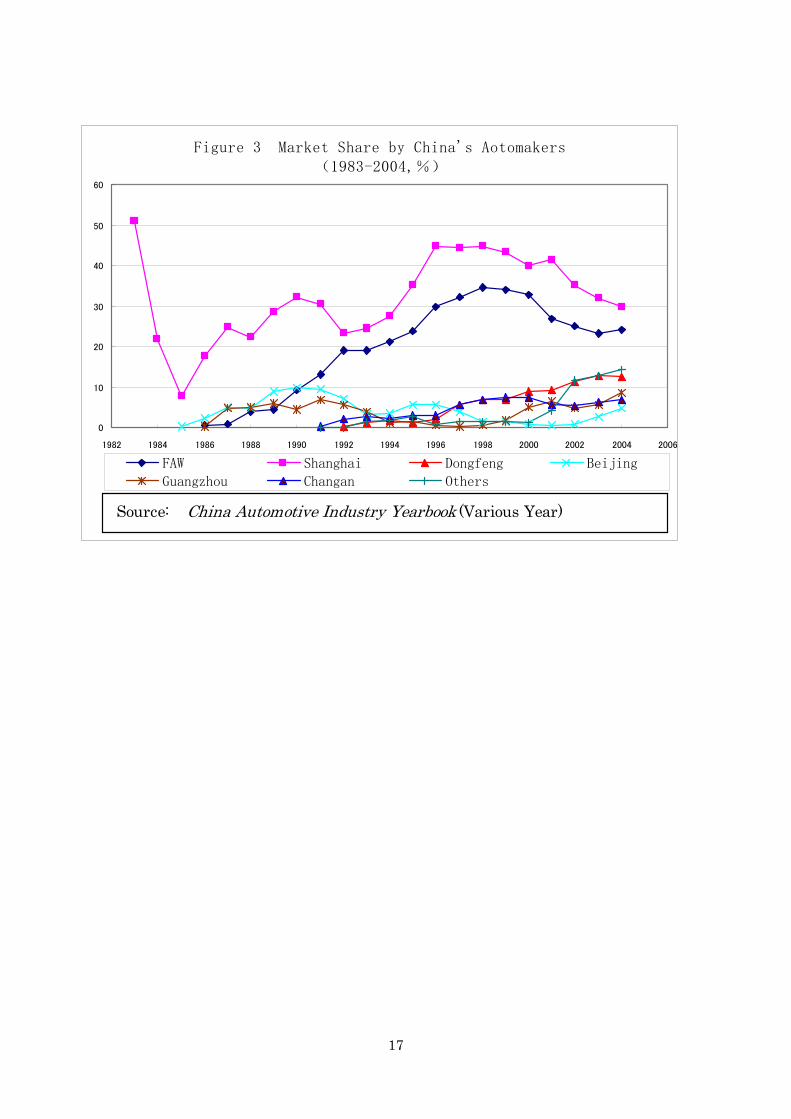
Figure 3 shows the market shares of China’s main automakers. According to this data, the market share of Shanghai Motors group fell markedly until 1985, then rose sharply (after the company started cooperating with Volkswagen), but declined again as First Auto Factory caught up. After a sharp increase from 1991, it fell again from the latter half of the 1990s due to increased production by other auto companies. On the other hand, the market share of First Auto group rose more or less continuously until 1998, but decreased gradually afterwards. However, in the car market, Shanghai Motors group and First Auto group still enjoy overwhelming shares. In contrast, Dongfeng group, which is one of the three major automakers, started car production much later.
As for other carmakers, Beijing Motors group and Guangzhou Motors group occupied comparatively high shares in the latter half of the 1980s, but they were stagnant afterwards until they began to thrive again after 2000. Guangzhou Motors has been in fourth place in car production in 2004 due to the advance of Japanese-affiliated companies. Auto production of other automakers increased rapidly after 2000. The other carmakers, including China’s native automakers, came to occupy almost 20% of the market by 2003. Generally speaking, since 2000, the market shares of auto companies have shown a tendency to converge. 3.The characteristics of China’s auto companies
In order to ascertain the characteristics of China’s auto industry, it is necessary to analyze the productivity of China’s auto companies. However, it is difficult to make a rigorous analysis of productivity due to the limited availability of reliable data. In this study, we use firm level data obtained from The Center for Applied Statistics of Renmin University of China
6
to analyze the productivity of automakers. According to China’s industrial classification of 1994, trucks, buses, cars and micro vehicles are included in the industry3. 3.1 The change of enterprise ownership
In China, there are numerous types of ownership in the auto industry. Due to the purpose
of this study, namely to analyze the influence of foreign-affiliated firms and enterprise reform on the productivity of China’s auto industry, we classified all auto companies as foreign-affiliated companies (which include the companies with foreign countries, Hong Kong, Macao and Taiwan), state-owned enterprises and non-state-owned enterprises.
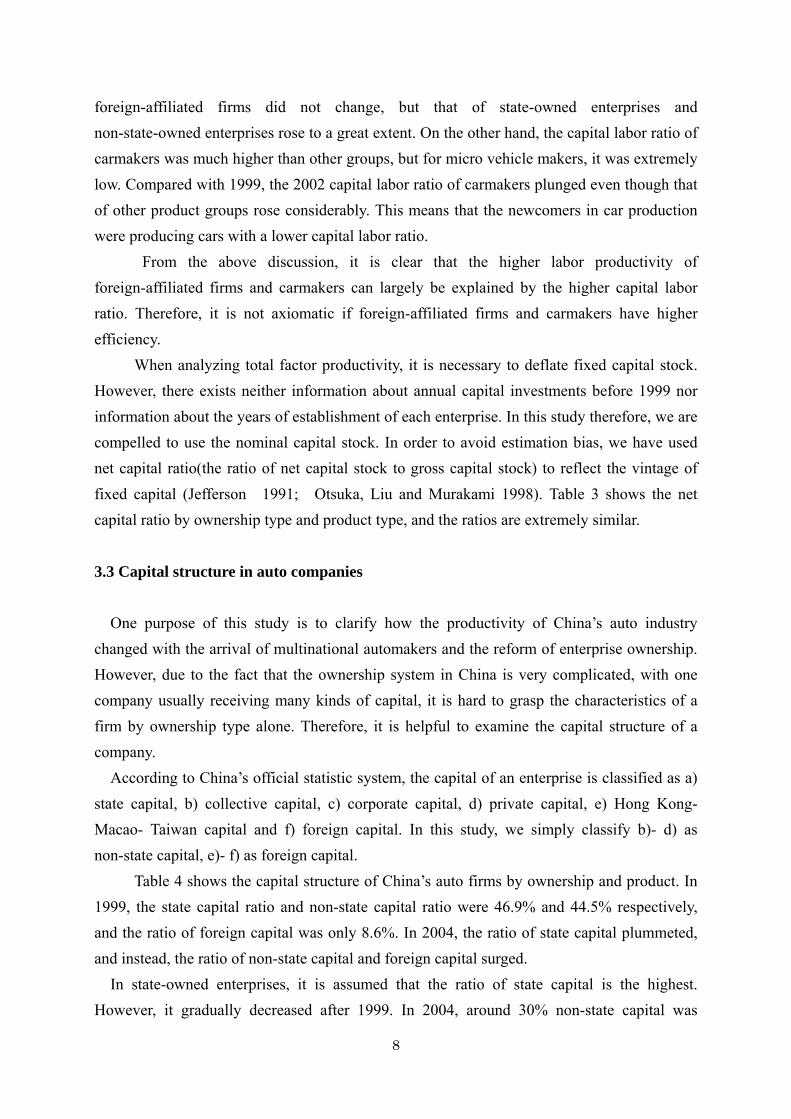
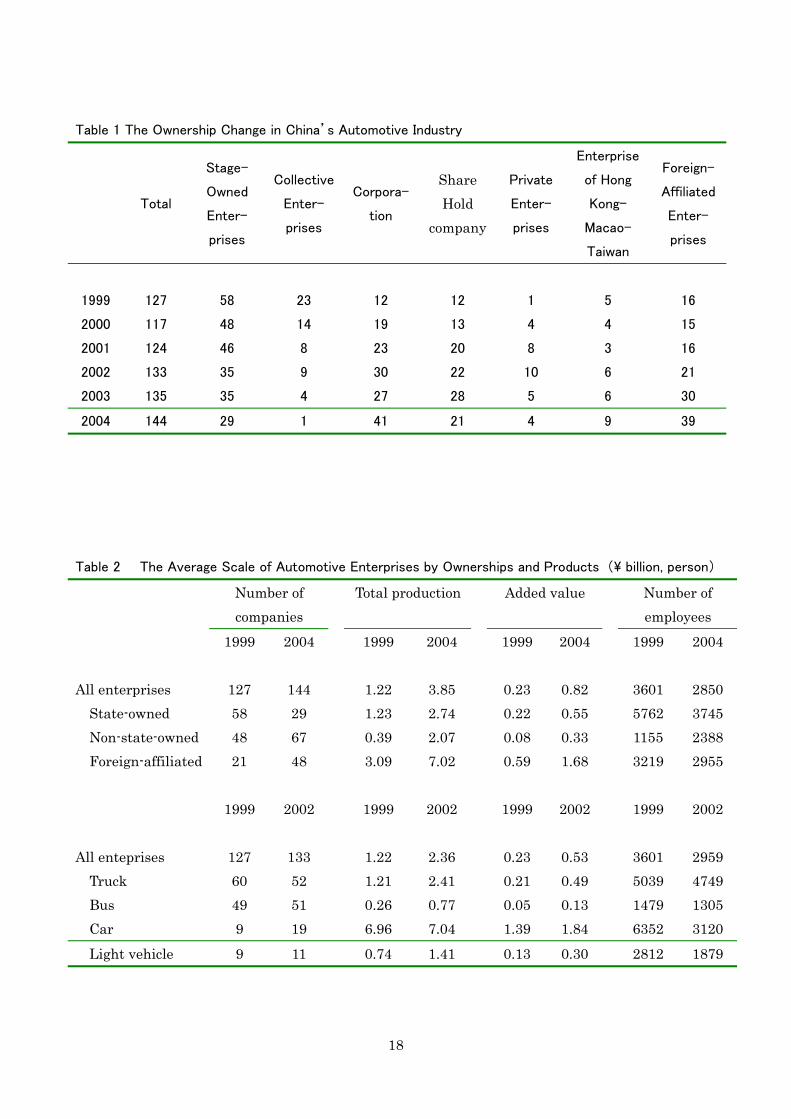
According to Table 1, the number of auto companies in China increased from 127 in 1999 to 144 in 2004. Of those, the number of state-owned enterprises decreased greatly from 58 in 1999 to 29 in 2004, and the number of the non-state-owned enterprises increased from 48 to 67. Furthermore, the number of foreign-affiliated firms increased from 21 in 1999 to 48 in 2004. After China became a member of the WTO in 2001, foreign-affiliated firms entered Chinese markets aggressively.
China’s industrial classification changed in 2002, therefore, it is impossible to distinguish the products of a specific company in 2003 and 2004, because all trucks, buses, cars and micro vehicles are grouped into one category4. According to Figure 1, 109 companies produced trucks and buses in 1999, while car and micro vehicle makers each numbered nine. However, truck makers subsequently decreased, and other auto companies increased. Notably, the number of carmakers doubled. 3-2 The change of average scale
In the past, one of the important characteristics of China’s auto industry was a large
number of companies with small-scale production. As a result, productivity was low (Minami 1988). However, the production scale of China’s auto companies changed greatly after 1999.
Table 2 shows that the average total production of auto companies was 1.22 billion yuan in 1999, and that of a non-state-owned enterprise was only 0.39 billion yuan. In contrast, the average total production of foreign-affiliated companies was about 3.1 billion yuan, amounting to eight times that of non-state-owned enterprises and 2.5 times that of
3 Micro Vehicles include trucks of less than 1.8 tons, buses of less than 3.5m in length, and cars of which the displacement value is less than 1 liter. 4 Engine makers are also included in the same category, according to the new classification.
7
state-owned enterprises. However, in 2004, total output per company grew to 3.85 billion yuan, which was more than three times the 1999 figure. The production of state-owned enterprises and foreign-affiliated enterprises doubled and that of non-state-owned enterprises became five times.
As for output by product, the average total production of carmakers was overwhelmingly larger and more stable from 1999 to 2002, compared with other product makers. This is because most of China’s carmakers are foreign-affiliated companies, which are aiming at an optimal scale of car production in China. In contrast, the production scales of trucks, buses and micro vehicles were much smaller, but all of them doubled during the three years.
As for the output scale by value-added, the relative sizes among ownership types and product types show a trend similar to total production, but each of them improved greatly. In contrast, the number of employees greatly decreased. By ownership type, the average number of employees for foreign-affiliated enterprises decreased by around 8%, while that for state-owned enterprises decreased by 35%. On the other hand, the number of employees in non-state-owned enterprises doubled reflecting the sharp expansion of production scales. By product type, the number of employees decreased in all companies. The decrease in average employee numbers was most intense for carmakers, falling to lower than half.
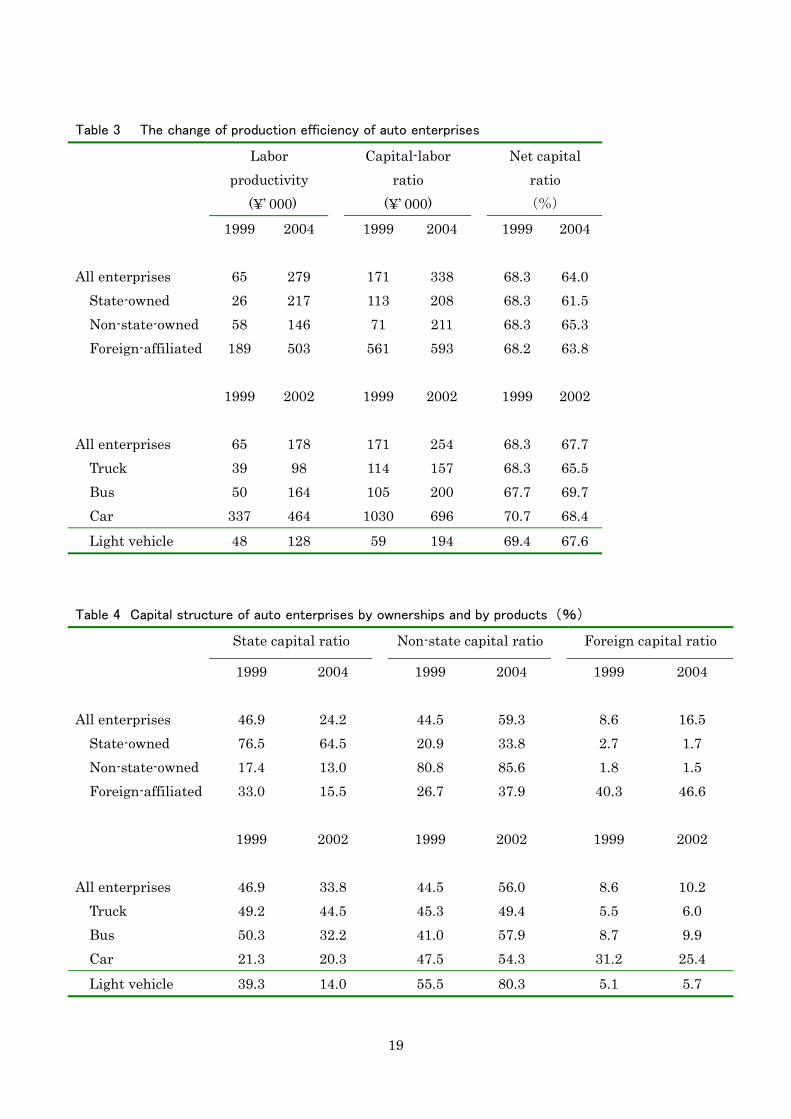
The increment of value-added and decrement of employee numbers result in the improvement of labor productivity. Table 3 shows the labor productivity (value-added per employee) of the auto companies. According to the table, the labor productivity of all companies in 1999 was 65,000 yuan, while that of state-owned enterprises was only 26,000 yuan. But the labor productivity of foreign-affiliated companies was about 190,000 yuan, which is equivalent to seven times that of state-owned enterprises. Between 1999 and 2004, the average labor productivity of all companies rose by about 3.3 times5. Especially in state-owned enterprises, labor productivity rose by 7.3 times, which was beyond that of non-state-owned enterprises. As for the groups by product, the labor productivity of carmakers is outstandingly high and it rose greatly from 1999 to 2002.
The difference in labor productivity among the different categories can be largely explained by the difference in the capital labor ratio. In 1999, the capital labor ratio of foreign-affiliated firms was 0.56 million yuan, which was 5 times that of state-owned enterprises and about eight times that of non-state-owned enterprises. Compared with non-state-owned enterprises, state-owned enterprises have lower labor productivity, but their capital labor ratio is higher. This suggests that the production efficiency of non-state-owned enterprises is higher than that of state-owned enterprises. In 2004, the capital labor ratio of 5 Value-added here is nominal. Considering the fact that vehicle prices fell during the period of 1999-2004, real increase in labor productivity must be higher.
8
foreign-affiliated firms did not change, but that of state-owned enterprises and non-state-owned enterprises rose to a great extent. On the other hand, the capital labor ratio of carmakers was much higher than other groups, but for micro vehicle makers, it was extremely low. Compared with 1999, the 2002 capital labor ratio of carmakers plunged even though that of other product groups rose considerably. This means that the newcomers in car production were producing cars with a lower capital labor ratio.
From the above discussion, it is clear that the higher labor productivity of foreign-affiliated firms and carmakers can largely be explained by the higher capital labor ratio. Therefore, it is not axiomatic if foreign-affiliated firms and carmakers have higher efficiency.
When analyzing total factor productivity, it is necessary to deflate fixed capital stock. However, there exists neither information about annual capital investments before 1999 nor information about the years of establishment of each enterprise. In this study therefore, we are compelled to use the nominal capital stock. In order to avoid estimation bias, we have used net capital ratio(the ratio of net capital stock to gross capital stock) to reflect the vintage of fixed capital (Jefferson 1991; Otsuka, Liu and Murakami 1998). Table 3 shows the net capital ratio by ownership type and product type, and the ratios are extremely similar.
3.3 Capital structure in auto companies
One purpose of this study is to clarify how the productivity of China’s auto industry changed with the arrival of multinational automakers and the reform of enterprise ownership. However, due to the fact that the ownership system in China is very complicated, with one company usually receiving many kinds of capital, it is hard to grasp the characteristics of a firm by ownership type alone. Therefore, it is helpful to examine the capital structure of a company. According to China’s official statistic system, the capital of an enterprise is classified as a) state capital, b) collective capital, c) corporate capital, d) private capital, e) Hong Kong- Macao- Taiwan capital and f) foreign capital. In this study, we simply classify b)- d) as non-state capital, e)- f) as foreign capital.
Table 4 shows the capital structure of China’s auto firms by ownership and product. In 1999, the state capital ratio and non-state capital ratio were 46.9% and 44.5% respectively, and the ratio of foreign capital was only 8.6%. In 2004, the ratio of state capital plummeted, and instead, the ratio of non-state capital and foreign capital surged. In state-owned enterprises, it is assumed that the ratio of state capital is the highest. However, it gradually decreased after 1999. In 2004, around 30% non-state capital was
9
included in the capital of state-owned enterprises with foreign capital featuring minimally. In non-state enterprises, non-state capital comprised more than 80% of the total capital with state capital occupying a little over 10%. In foreign-affiliated enterprises, foreign capital was over 40% and increasing. Because most Chinese partners of foreign-affiliated companies are state-owned enterprises, the ratio of national capital reached one-third in 1999 but decreased to a great extent afterwards. Instead, non-state capital rose considerably.
As for carmakers, the state capital ratio was only 20% in 1999 and changing slowly but surely. The ratio of non-state capital was 47.5% in 1999 and rose to 54.3% in 2002. In contrast, the ratio of foreign capital fell by about six points from 1999 to 2002. For other product makers, foreign capital ratios were less than 10% with little variation. During the period of 1999-2002, the state capital ratio declined and the non-state capital ratio rose, especially for bus and micro vehicle makers.
From the above discussion, it is clear that since the ownership system is very complicated in China, it is hard to grasp the influence of the ownership system on the productivity of automakers by utilizing the official classification of ownership types. Therefore, it is necessary to consider capital structure when analyzing the influence of the ownership system on productivity. 4.Hypotheses and testing method 4.1 Hypotheses
Originally, China’s auto industry developed under the leadership of the government. Therefore, the state-owned enterprises played a critically important role. Under the policy of national seclusion, China’s auto industry survived by thorough protection from the government while bearing comparative disadvantages. However, after China accomplished its openness policy, the auto enterprises introduced foreign technology and foreign investment vigorously. Some big state-owned enterprises tried to boost their development by establishing joint ventures with foreign automakers. Auto production requires numerous parts, and each part requires a high level of technology and know-how. Therefore, the development of automotive industries depends on the technological level of the manufacturing industry as a whole. In China, the level of technology is low and R & D resources are weak, therefore, it is hard to say that China has a comparative advantage in this industry. In contrast, the multinational automakers have strong advantages in technology, capital, management, marketing, R&D and so on. As a result, the productivity of the foreign-affiliated firm will be
10
higher than that of native enterprises. This is the first hypothesis of this study. On the other hand, compared with non-state-owned enterprises, state-owned enterprises
may have a relative advantage in capital, technology and management, but profit motivation and incentive to improve efficiency may be much lower than non-state-owned enterprises. As a result, the productivity of non-state-owned enterprises will be higher than that of state-owned enterprises. This is the second hypothesis of this study.
Furthermore, as discussed in section 2, with China’s accession to the WTO, the ownership reforms in China’s auto industry advanced greatly and multinational automakers entered China at an increasing tempo from the end of the 1990s. As a result, the productivity of China’s auto industry is improving year by year. This is our third hypothesis.
4.2 Method of testing the hypotheses
In order to test the hypotheses mentioned above, we estimated the production function of that including ownership with year dummies as explanatory variables. The production function used is the following Cob-Douglas type. LN(V/L) = c + α×LN(K/L) + (α+β-1)×LN(L) + aiΣMi + ε where V, K, L are value-added, capital stock and labor respectively. V/L is labor productivity (value-added per employee,) and K/L is capital labor ratio (capital stock per employee). c is a constant term, α and β are the production elasticity of capital and labor. (α+β-1) is the coefficient of scale. If it is positive (or negative) it means there is scale economy (or diseconomy) in China’s auto industry. ε is an error term, and Mi denotes other explanatory variables included in the model as follows. 1) Net capital ratio: the ratio of net capital stock to gross capital stock; 2)Non-state-owned enterprise dummy; 3)Foreign-affiliated enterprise dummy; 4)Non-state capital ratio:the amount of non-state capital to total capital; 5)Foreign capital ratio:the total capital amount of Hong Kong, Macao, Taiwan and other foreign capital to total capital; 6)Bus maker dummy; 7)Carmaker dummy; 8)Micro-vehicle maker dummy: 9)Year dummies.
If hypotheses 1 and 2 are true, the coefficient of a foreign-affiliated firm dummy and a non-state-owned enterprise dummy should be positive and statistically significant, and the difference between the coefficient of a foreign-affiliated firm dummy and a non-state-owned enterprise dummy ought to be statistically significant. Also, the non-state capital ratio and foreign capital ratio should be positive and statistically significant, and the difference between
11
the coefficients of the two variables should be statistically significant. In addition, if the productivity of the auto industry improved during the period, the coefficient of the year dummies ought to be positive and statistically significant.
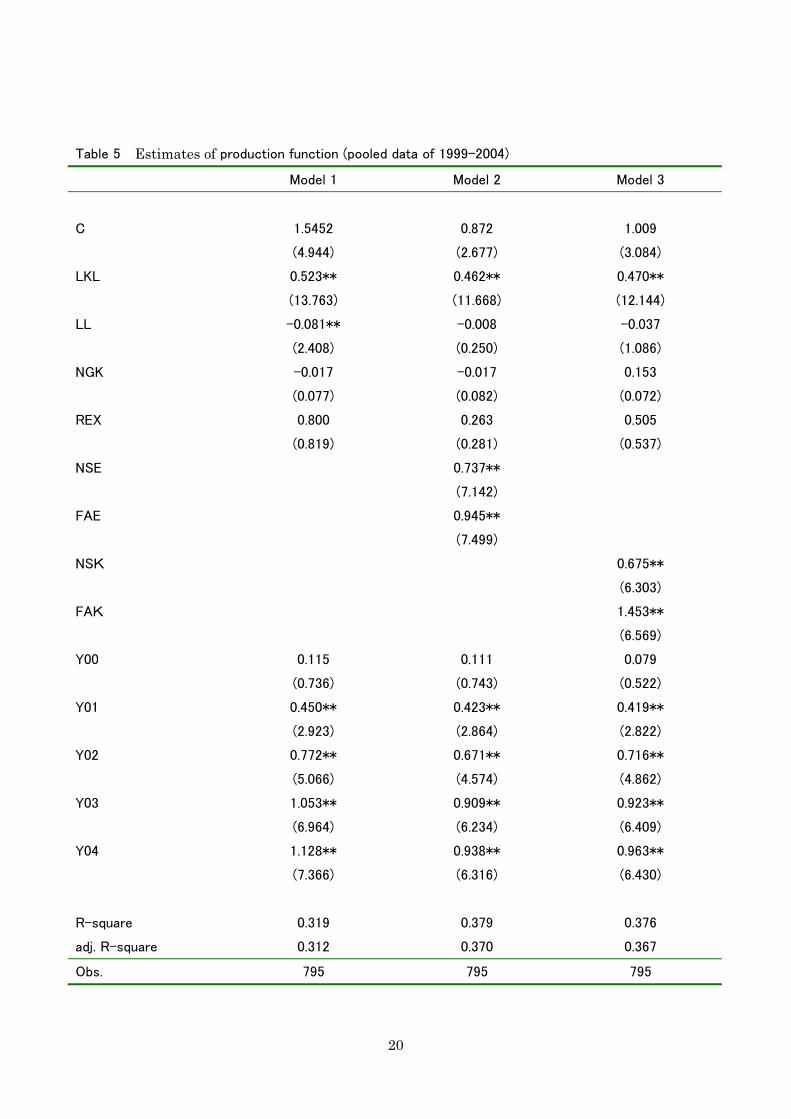
As for other variables, net capital ratio relates to the vintage of capital stock, but both the effects of technical progress and rises in the price of investment goods are included in the variable. If new technology was embodied in new capital goods, the coefficient of this variable tends to be positive, but if the price of new capital goods rose, the coefficient of the variable tends to be negative. It is not clear which effect is stronger. Also with regard to product dummies, it is not self-evident for the relative relation in productivity between these automakers. 5.The estimation results of production function The estimation results of production function based on ordinary least-squares (OLS) method with the pooled data of 1999-2004 are shown in Table 5. First, in Model 1, the simple production function is estimated without ownership or product dummies. It can be seen that the coefficients of year dummies are positive for 2000-2004, and statistically significant from 2001. The coefficients become increasingly larger as years go by. This shows that the productivity of China’s auto industry improved steadily after 1999. These estimation results are consistent with hypothesis 3 of this study.
As for other variables, the coefficient of the capital labor ratio is 0.523 and statistically significant. The coefficient of the net capital ratio is not statistically significant. This shows that the vintage of capital stock did not influence the productivity of automakers. What should be paid attention to here is the coefficient of scale. In this model, the coefficient of scale is negative and statistically significant, which means that a company with small labor scale achieved high productivity.
It is usually pointed out that the production scale of automakers in China is too small. If this is true, there ought to be scale economies, not scale diseconomy. In Model 1, the reasons for scale diseconomy may be explained as follows. 1) The productivity of non-state-owned enterprises and foreign-affiliated enterprises, which have fewer employees, is higher than that of state-owned enterprises with large employee numbers. 2) Even though the productivity of state-owned enterprises improved greatly, the number of employees decreased due to ownership reforms. 3) Another possibility is that scale diseconomy may have occurred due to insufficient division of labor among large enterprises(Murakami, Liu and Otsuka 1996).
Model 2 shows the estimation result with ownership dummies. It shows that the
12
coefficients of the non-state-owned enterprise dummy and the foreign-affiliated firm dummy are positive and statistically significant. Compared with state-owned enterprises, the productivity of non-state-owned firms and foreign-affiliated firms is higher. Also, the difference between the non-state-owned enterprise dummy and the foreign-affiliated enterprise dummy is significant. These estimation results support hypothesis 2 and hypothesis 3 of this study.
In Model 3, instead of enterprise dummies, we used non-state capital ratio and foreign capital ratio to estimate the influence of ownership reform and foreign capital. The coefficients of these variables are both positive and statistically significant. Also, the gap between the coefficients of foreign capital ratio and non-state capital ratio is significant. These results show that, in China’s auto industry, ownership type may not always be an indication of the characteristics of an enterprise, because various types of capital are involved. Even in the same foreign-affiliated firms, production efficiency may vary with different foreign capital ratios.
In Model 2 and Model 3, the coefficients of scale are still negative but no longer statistically significant. These results suggest that the scale diseconomy in Model 1 relates to enterprise type, because non-state-owned enterprises and foreign-affiliated enterprises are relatively small in labor size but effective compared with the state-owned enterprises.
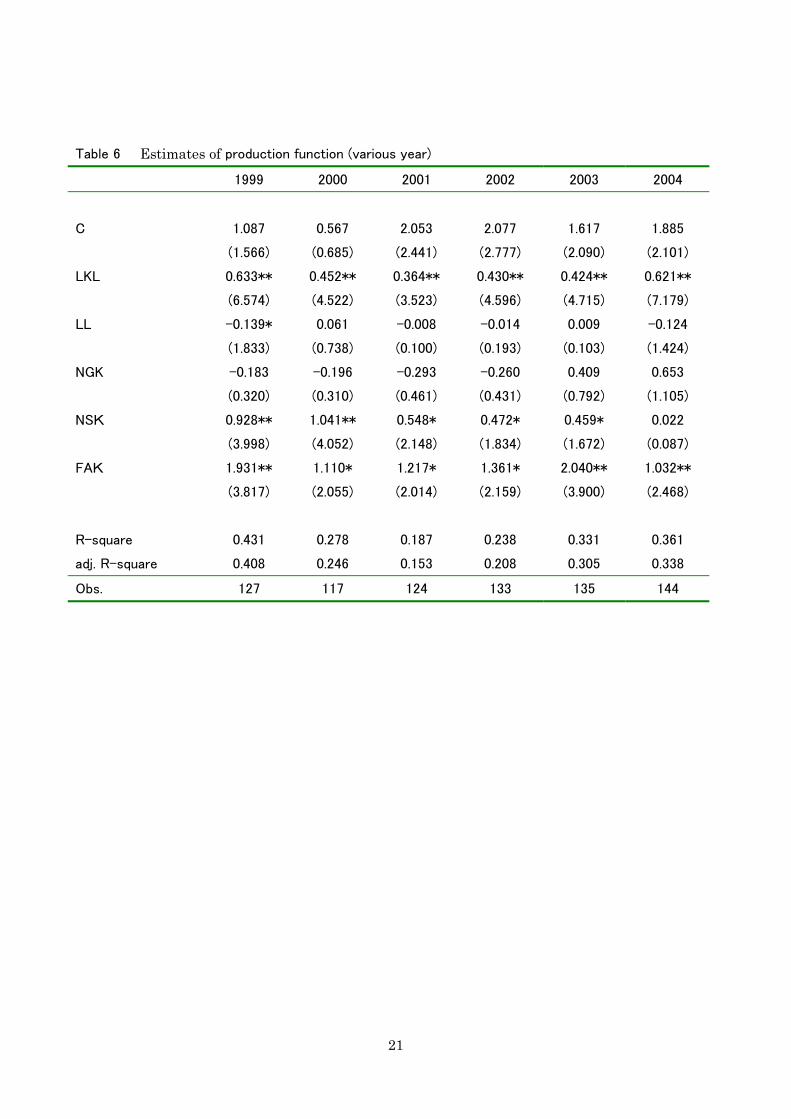
Are hypothesis 1 and hypothesis 2 true every year? Table 6 shows the estimation results of production function from 1999 to 2004, in the case where non-state-owned capital ratios and foreign capital ratios are included6. Even the coefficients of the non-state capital ratios and foreign capital ratios are different every year, but in general, the coefficients of non-state capital ratios decreased during the period from 1999 to 2004. In 2004, the coefficient of non-state capital ratios lost significance. This means that the gap in productivity between state capital and non-state capital disappeared at last.
On the other hand, the coefficients of foreign capital are different every year, but there is no clear trend during the period in question. Even in 2004, the coefficient of the foreign capital ratio is still very big. Generally speaking, the annual estimation results support hypothesis 1 and hypothesis 2.
The auto industry encompasses various kinds of vehicles. In the data set we used in this study, automakers producing trucks, buses, cars and micro vehicles are included. For these products, not only the production technology but also the market may be different. Therefore more data is needed to enable us to add these variables to the model. However, because of the change in China’s industrial classification, all automakers are classified into one category 6 We also estimated production function with enterprise dummies, and the results were similar to those in Model 2, Table 5.
13
from 2003. Therefore, we are only able to analyze the production function with product dummies from 1999 to 2002.
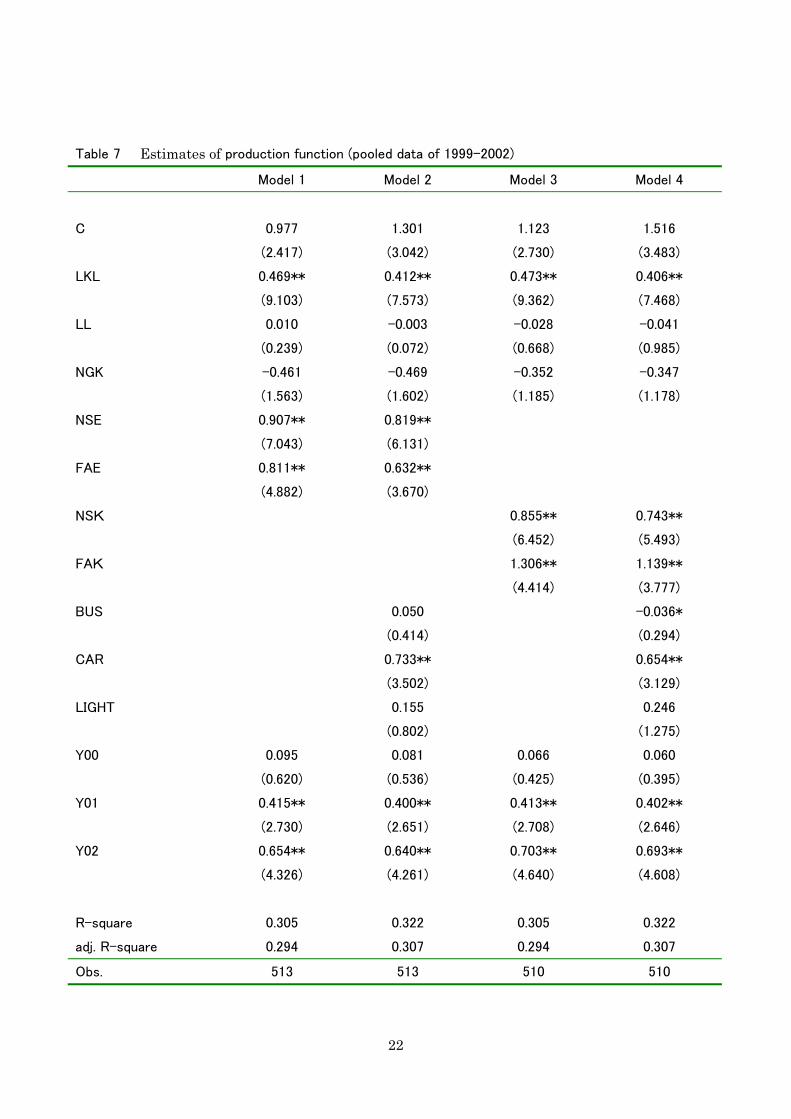
Table 7 shows the estimation results of production functions with product dummies. According to the results of Model 2 and Model 4, of the three product dummies, only the coefficient of a car dummy is positive and statistically significant.
The result of enterprise dummies and the variables of capital structure are similar to those in Table 5. The hypotheses of this study are supported, even when the difference in product is controlled. One main difference of this estimation result is that the coefficient of the non-state-owned enterprise dummy is not much larger than that of foreign-affiliated enterprises. However, in Model 3 and Model 4, where non-state capital ratio and foreign capital ratio are used as the variables of the enterprise system, superiority of foreign capital in productivity is still observable. 6. Conclusion In this study, using micro-data on China’s automakers, we tried to elucidate the characteristics of the development of China’s auto industry by estimating production function. According to the analysis in the study, the following comes to light. Firstly, the rapid development of auto industries in China accompanies a rapid improvement in productivity. Secondly, in China’s auto industry, foreign-affiliated firms or foreign capital have overwhelming strength with regard to productivity. This means that foreign-affiliated firms or foreign capital have driven the growth of China’s auto industry and instigated improvements in total factor productivity of the industry up to the present day. This influence moreover, is expected to play an important role in the future.
On the other hand, it is worth noting that the improvement in productivity is not attributable to foreign-affiliated firms or foreign capital only. Since 2000, the contribution of state capital to productivity has risen gradually, and has approached that of non-state capital. Under the strong pressure of WTO accession, the state capital or state-owned enterprises have had to improve their productivity by introducing new technology and advanced management from foreign countries. In the case of non-state-owned enterprises, the improvement in productivity was realized through imitation of new technology and innovation, both of which were driven by strong profit motivations. Some problems remain for this study. First, the value of output and input has not been
deflated. Usually, when we compare the productivity of different years, it is necessary to
14
eliminate the price effect of output and input. In this study, due to the limitations of the data set, we were unable to accomplish this. However, during the period from 1999 to 2004, the price of automobiles fell and the price of energy and materials rose in general. Therefore, the conclusions of the study would have been strengthened if we had used deflated data. Secondly, the coefficients of the ownership variables in this study include not only the effect of different ownerships but also the effect of different firms, because we were unable to identify individual firms in different years. All of these problems need to be solved. References China Automotive Technology Research Center; China Automotive Industry Association
(various years), “China Automotive Industry Yearbook”. Francois, Joseph; Dean Spinanger(2004), “ Regulated Efficiency, World Trade Organization
Accession and the Motor Vehicle Sector in China”. CEPR Discussion Papers: 44392004。 Gordon, Roger H.; Wei Li(1995), “The Change in Productivity of Chinese State Enterprises”,
1983–1987. Journal of Productivity Analysis 6 (1), pp.5–26. Groves, Theodore; Yongmiao Hong; John Mcmillan; Barry Naughton(1994), “Autonomy and
Incentives in Chinese State Enterprises”. Quarterly Journal of Economics 109 (1), pp.183–209.
Groves, Theodore; Yongmiao Hong; John Mcmillan; Barry Naughton(1995), “China’s Evolving Managerial Labor Market”. Journal of Political Economy 103 (4), 873–892.
Jefferson, Gary H.; Thomas G. Rawski; Yuxin Zheng(1996), “Chinese Industrial Productivity: Trends, Measurement Issues, and Recent Developments.” Journal of Comparative Economics 23 (2), 146–180.
Jefferson, Gary H.; Albert G.Z. Hub; Xiaojing Guan; Xiaoyun Yu(2003), “Ownership, Performance, and Innovation in China’s Large- and Medium-size Industrial Enterprise Sector.” China Economics Review 14, pp.89-113.
Jefferson, Gary H.; Thomas G. Rawski; Wei Li; Yuxin Zheng(2000), “Ownership, Productivity Change and Financial Performance in Chinese Industry”. Journal of Comparative Economics, 28 (4), pp. 786-813.
Li, Wei(1997), “The Impact of Economic Reform on the Performance of Chinese State Enterprises, 1980–1989”. Journal of Political Economy 105 (5), pp.1080–1106.
Liu, Deqiang and Keijiro Otsuka(2004), “A Comparison of Management Incentives, Abilities,
15
and Efficiency between SOEs and TVEs: The Case of the Iron and Steel Industry in China”, Economic Development and Cultural Change 52 (4), pp.759-780.
Maruyama, Tomoo and Yuyichi Takayama ed.(2004), “China’s Automotive Industry in the Time of Global Competition (Gurobaru Kyoso Jidai no Chugoku Jidosha Sangyo)”, Sososha.
Minami, Ryoshin(1988),“China’s Automotive Industry: Industrial Organization and Technology (Chugoku no Jidosha Kogyo: Sangyo Soshiki to Gijutsu )”, Ajia Keizai 29 (12), pp.76-86.
Seki, Mitsuharu(2003), “The Situation of China’s Automotive Industry (Chugoku ni Okeru Jidosha Sangyo no Genjo)”, Kikai to Kogu, 47(10), pp.55-58.
State Statistical Bureau(various years), Zhongguo Tongji Nianjian (China Statistical Yearbook). Zhongguo Tongji Chubanshe .
Zheng, Jinghai; Xiaoxuan Liu; Arne Bigsten(2003), “ Efficiency, Technical Progress, and Best Practice in Chinese State Enterprises (1980–1994) ”, Journal of Comparative Economics 31(1), pp.134–152.
16
Figure 1 The Development of Automotive Industry in China(1963-2004)
0.00
1.00
2.00
3.00
4.00
5.00
6.00
1962
1964
1966
1968
1970
1972
1974
1976
1978
1980
1982
1984
1986
1988
1990
1992
1994
1996
1998
2000
2002
2004
2006
Mill
ion
Automoble Car Truck Bus
Source: China Automotive Industry Yearbook 2005 .
Figure 2 Car Market Share by Multinational Groups in China(1983-2004,%)
0
10
20
30
40
50
60
1982 1984 1986 1988 1990 1992 1994 1996 1998 2000 2002 2004 2006
Volkswagen GM Ford Daimler-CryslerToyota Honda Nissan PeugeotBMW China
Source: China Automotive Industry Yearbook(Various Year)
17
Figure 3 Market Share by China's Aotomakers(1983-2004,%)
0
10
20
30
40
50
60
1982 1984 1986 1988 1990 1992 1994 1996 1998 2000 2002 2004 2006
FAW Shanghai Dongfeng Beijing
Guangzhou Changan Others
Source: China Automotive Industry Yearbook (Various Year)
18
Table 1 The Ownership Change in China’s Automotive Industry
Total
Stage-
Owned
Enter-
prises
Collective
Enter-
prises
Corpora-
tion
Share Hold
company
Private
Enter-
prises
Enterprise
of Hong
Kong–
Macao-
Taiwan
Foreign-
Affiliated
Enter-
prises
1999 127 58 23 12 12 1 5 16
2000 117 48 14 19 13 4 4 15
2001 124 46 8 23 20 8 3 16
2002 133 35 9 30 22 10 6 21
2003 135 35 4 27 28 5 6 30
2004 144 29 1 41 21 4 9 39
Table 2 The Average Scale of Automotive Enterprises by Ownerships and Products (\ billion, person)
Number of companies
Total production Added value Number of employees
1999 2004
1999 2004
1999 2004
1999 2004 All enterprises 127 144 1.22 3.85 0.23 0.82 3601 2850
State-owned 58 29 1.23 2.74 0.22 0.55 5762 3745 Non-state-owned 48 67 0.39 2.07 0.08 0.33 1155 2388 Foreign-affiliated 21 48 3.09 7.02 0.59 1.68 3219 2955
1999 2002 1999 2002 1999 2002 1999 2002 All enteprises 127 133 1.22 2.36 0.23 0.53 3601 2959
Truck 60 52 1.21 2.41 0.21 0.49 5039 4749 Bus 49 51 0.26 0.77 0.05 0.13 1479 1305 Car 9 19 6.96 7.04 1.39 1.84 6352 3120 Light vehicle 9 11 0.74 1.41 0.13 0.30 2812 1879
19
Table 3 The change of production efficiency of auto enterprises
Labor productivity
(¥’ 000)
Capital-labor ratio
(¥’ 000)
Net capital ratio (%)
1999 2004
1999 2004
1999 2004 All enterprises 65 279 171 338 68.3 64.0
State-owned 26 217 113 208 68.3 61.5 Non-state-owned 58 146 71 211 68.3 65.3 Foreign-affiliated 189 503 561 593 68.2 63.8
1999 2002 1999 2002 1999 2002 All enterprises 65 178 171 254 68.3 67.7
Truck 39 98 114 157 68.3 65.5 Bus 50 164 105 200 67.7 69.7 Car 337 464 1030 696 70.7 68.4 Light vehicle 48 128 59 194 69.4 67.6
Table 4 Capital structure of auto enterprises by ownerships and by products (%)
State capital ratio Non-state capital ratio Foreign capital ratio
1999 2004
1999 2004
1999 2004 All enterprises 46.9 24.2 44.5 59.3 8.6 16.5
State-owned 76.5 64.5 20.9 33.8 2.7 1.7 Non-state-owned 17.4 13.0 80.8 85.6 1.8 1.5 Foreign-affiliated 33.0 15.5 26.7 37.9 40.3 46.6
1999 2002 1999 2002 1999 2002 All enterprises 46.9 33.8 44.5 56.0 8.6 10.2
Truck 49.2 44.5 45.3 49.4 5.5 6.0 Bus 50.3 32.2 41.0 57.9 8.7 9.9 Car 21.3 20.3 47.5 54.3 31.2 25.4 Light vehicle 39.3 14.0 55.5 80.3 5.1 5.7
20
Table 5 Estimates of production function (pooled data of 1999-2004)
Model 1 Model 2 Model 3
C 1.5452 0.872 1.009
(4.944) (2.677) (3.084)
LKL 0.523** 0.462** 0.470**
(13.763) (11.668) (12.144)
LL -0.081** -0.008 -0.037
(2.408) (0.250) (1.086)
NGK -0.017 -0.017 0.153
(0.077) (0.082) (0.072)
REX 0.800 0.263 0.505
(0.819) (0.281) (0.537)
NSE 0.737**
(7.142)
FAE 0.945**
(7.499)
NSK 0.675**
(6.303)
FAK 1.453**
(6.569)
Y00 0.115 0.111 0.079
(0.736) (0.743) (0.522)
Y01 0.450** 0.423** 0.419**
(2.923) (2.864) (2.822)
Y02 0.772** 0.671** 0.716**
(5.066) (4.574) (4.862)
Y03 1.053** 0.909** 0.923**
(6.964) (6.234) (6.409)
Y04 1.128** 0.938** 0.963**
(7.366) (6.316) (6.430)
R-square 0.319 0.379 0.376
adj. R-square 0.312 0.370 0.367
Obs. 795 795 795
21
Table 6 Estimates of production function (various year)
1999 2000 2001 2002 2003 2004
C 1.087 0.567 2.053 2.077 1.617 1.885
(1.566) (0.685) (2.441) (2.777) (2.090) (2.101)
LKL 0.633** 0.452** 0.364** 0.430** 0.424** 0.621**
(6.574) (4.522) (3.523) (4.596) (4.715) (7.179)
LL -0.139* 0.061 -0.008 -0.014 0.009 -0.124
(1.833) (0.738) (0.100) (0.193) (0.103) (1.424)
NGK -0.183 -0.196 -0.293 -0.260 0.409 0.653
(0.320) (0.310) (0.461) (0.431) (0.792) (1.105)
NSK 0.928** 1.041** 0.548* 0.472* 0.459* 0.022
(3.998) (4.052) (2.148) (1.834) (1.672) (0.087)
FAK 1.931** 1.110* 1.217* 1.361* 2.040** 1.032**
(3.817) (2.055) (2.014) (2.159) (3.900) (2.468)
R-square 0.431 0.278 0.187 0.238 0.331 0.361
adj. R-square 0.408 0.246 0.153 0.208 0.305 0.338
Obs. 127 117 124 133 135 144
22
Table 7 Estimates of production function (pooled data of 1999-2002)
Model 1 Model 2 Model 3 Model 4
C 0.977 1.301 1.123 1.516
(2.417) (3.042) (2.730) (3.483)
LKL 0.469** 0.412** 0.473** 0.406**
(9.103) (7.573) (9.362) (7.468)
LL 0.010 -0.003 -0.028 -0.041
(0.239) (0.072) (0.668) (0.985)
NGK -0.461 -0.469 -0.352 -0.347
(1.563) (1.602) (1.185) (1.178)
NSE 0.907** 0.819**
(7.043) (6.131)
FAE 0.811** 0.632**
(4.882) (3.670)
NSK 0.855** 0.743**
(6.452) (5.493)
FAK 1.306** 1.139**
(4.414) (3.777)
BUS 0.050 -0.036*
(0.414) (0.294)
CAR 0.733** 0.654**
(3.502) (3.129)
LIGHT 0.155 0.246
(0.802) (1.275)
Y00 0.095 0.081 0.066 0.060
(0.620) (0.536) (0.425) (0.395)
Y01 0.415** 0.400** 0.413** 0.402**
(2.730) (2.651) (2.708) (2.646)
Y02 0.654** 0.640** 0.703** 0.693**
(4.326) (4.261) (4.640) (4.608)
R-square 0.305 0.322 0.305 0.322
adj. R-square 0.294 0.307 0.294 0.307
Obs. 513 513 510 510