Embed Size (px)
Citation preview
Perinatal Periods of Risk
Analytic Issues: Frequently Asked Data &
Analytic Questions
A CityMatCH “How-to-Do” Workshop
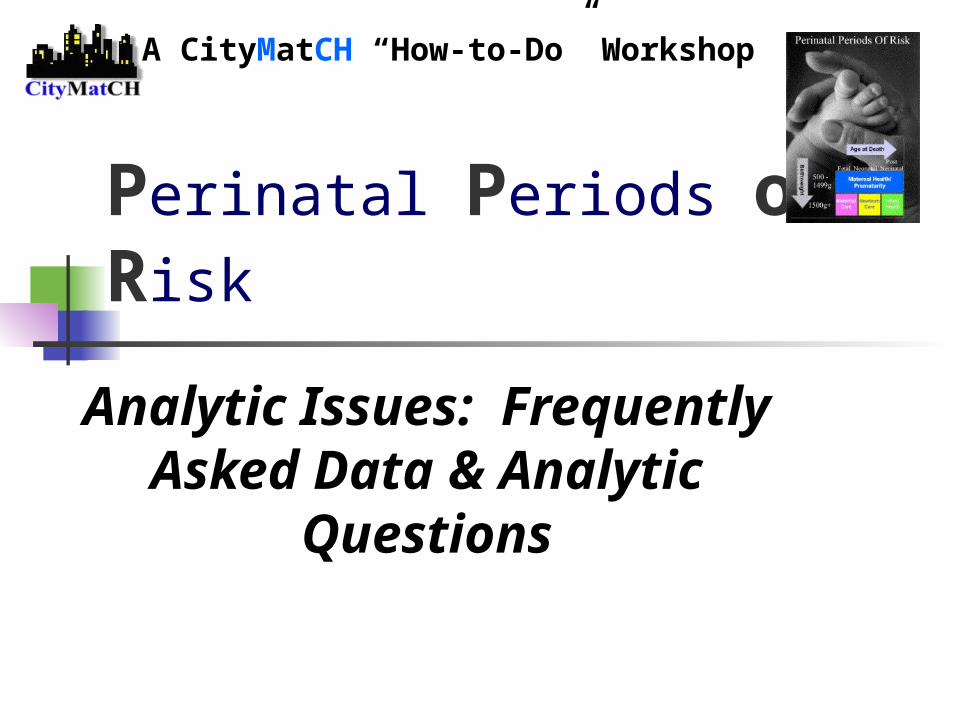
What do you mean by PPOR Analytic Phases?
Phase 1: Identifies the populations with excess mortality. It examines the 4 mortality components—Maternal Health/Prematurity, Maternal Care, Newborn Care & Infant Health—for various populations and uses a reference group to estimate excess mortality.
Phase 2: Explains the excess mortality. It examines reasons for the excess mortality through further epidemiologic studies, mortality reviews and community assessments.
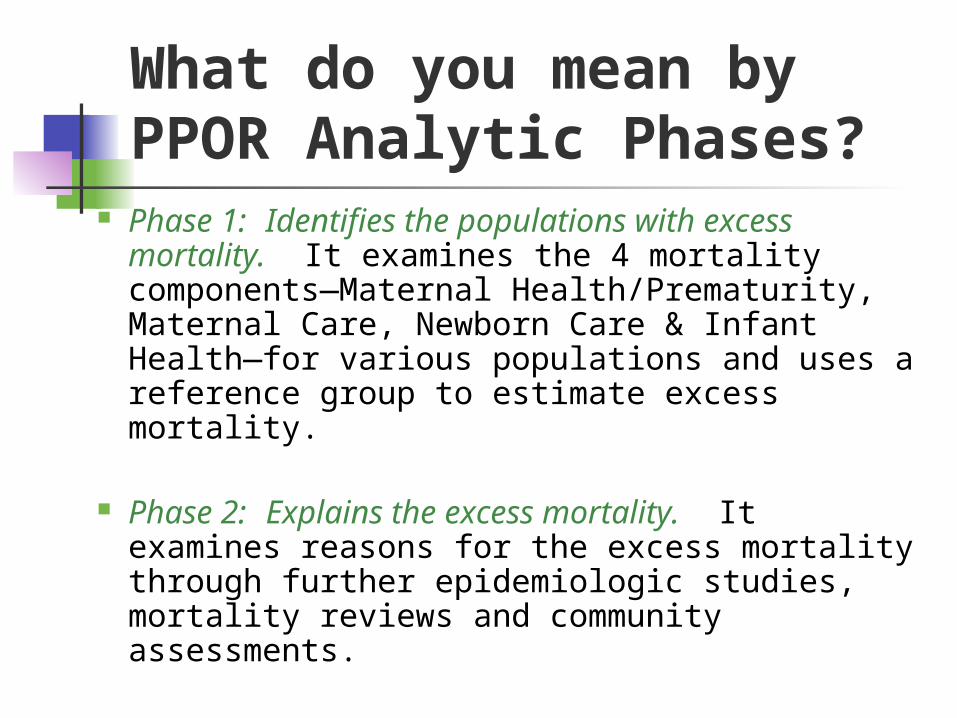
Phase 1 PPOR Analysis: Boston, 1995-97
500- 1499g
1500g
Fetal NeonatalPost
neonatal
108
276
Age at Death
Birth
weig
ht
77 29
Number of Deaths
Total = 241 Total Excess = 106
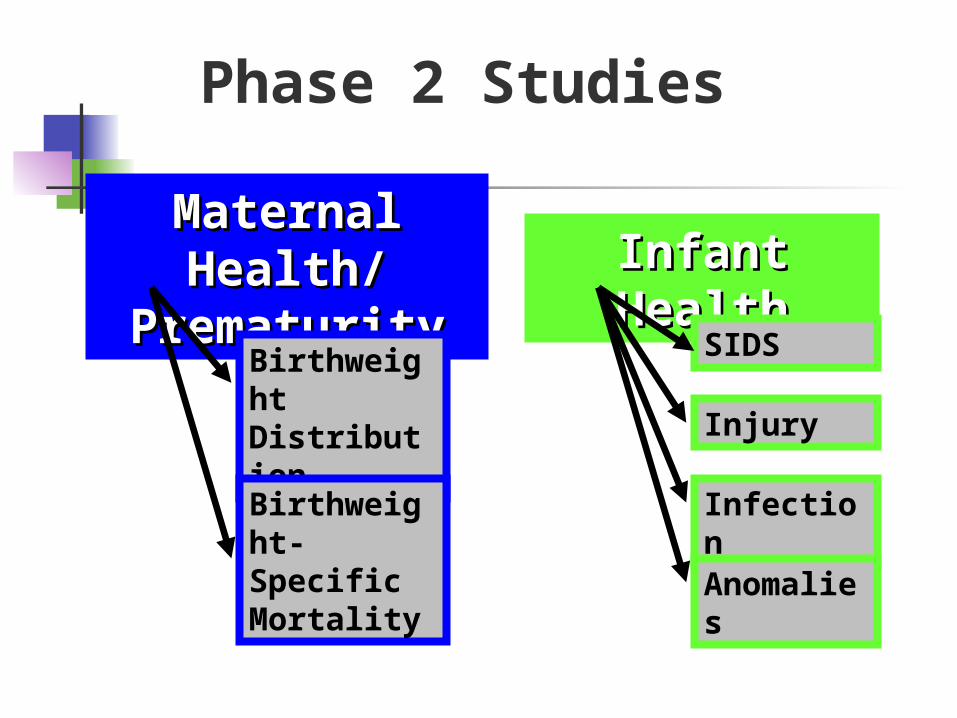
Phase 2 Studies
Maternal Health/ Maternal Health/ PrematurityPrematurity Infant HealthInfant Health
Birthweight Distribution
Birthweight- Specific Mortality
SIDS
Injury
Infection
Anomalies
Fetal & Infant Mortality Reviews
Focus FIMR activities on the group contributing to the gap.
Describe in greater depth the risk factors, events or services that may contribute to the gap.
Validate the quality of vital records and other information.
“Paint the faces behind the numbers”
“What are linked birth and infant death files?”
New PPOR User
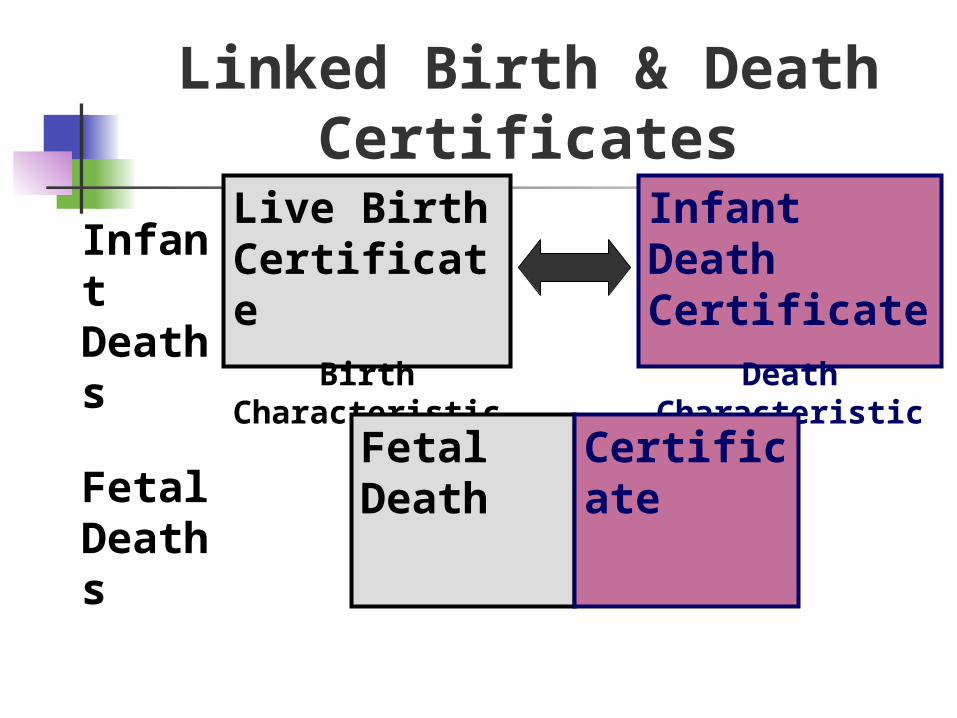
Linked Birth & Death Certificates
Infant Deaths
Live Birth Certificate
Birth Characteristics
Infant Death Certificate
Death Characteristics
Fetal Deaths
Fetal Death Certificate
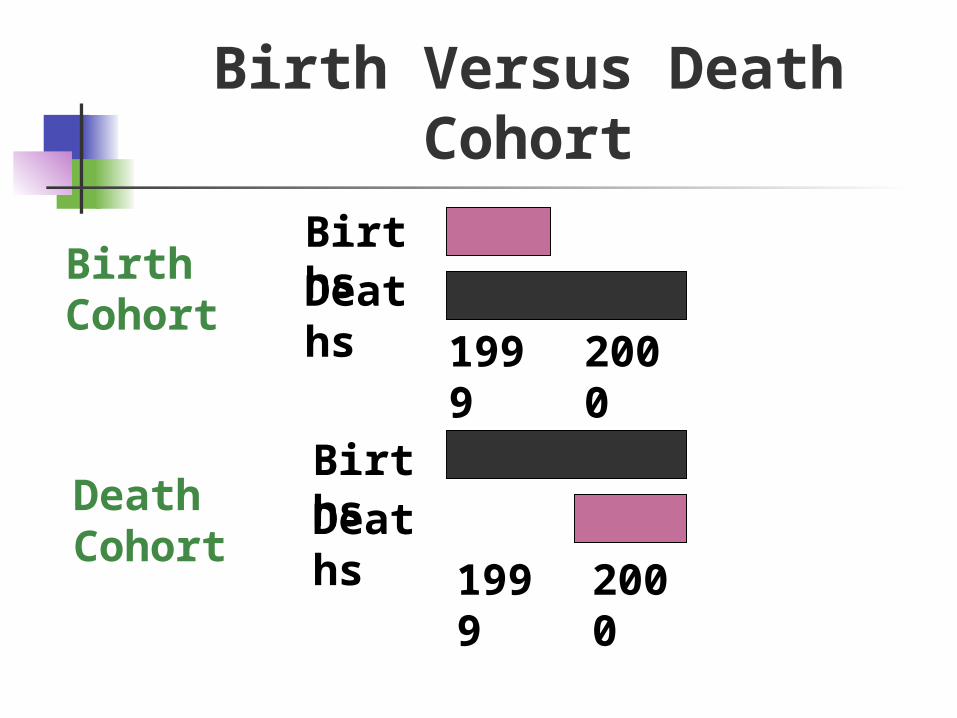
Birth Versus Death Cohort
Birth CohortBirthsDeaths
1999 2000
Death CohortBirthsDeaths
1999 2000
“What is the quality of our certificates? Can we use Fetal Deaths?”
New PPOR User
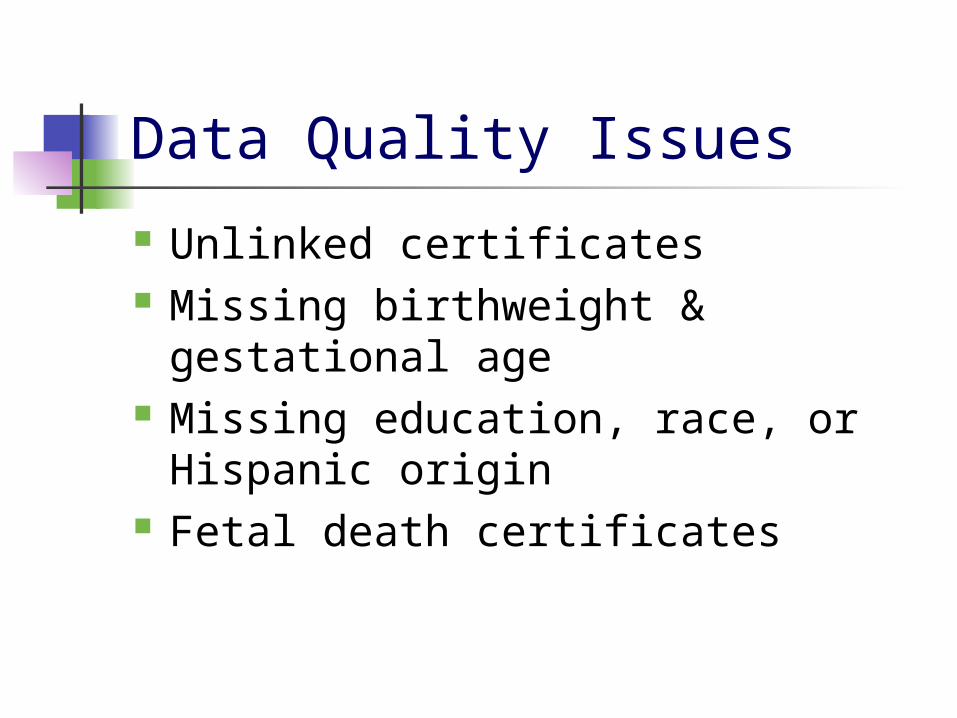
Data Quality Issues
Unlinked certificates Missing birthweight & gestational
age Missing education, race, or
Hispanic origin Fetal death certificates
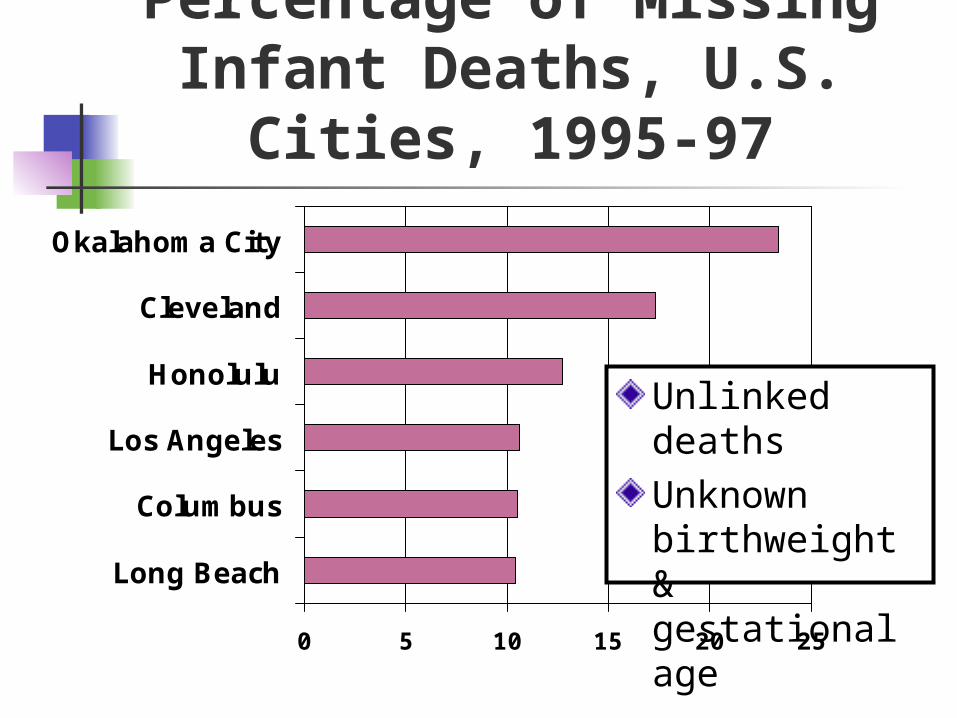
0 5 10 15 20 25
Long Beach
Columbus
Los Angeles
Honolulu
Cleveland
Okalahoma City
Percentage of Missing Infant Deaths, U.S. Cities,
1995-97
Unlinked deathsUnknown birthweight & gestational age
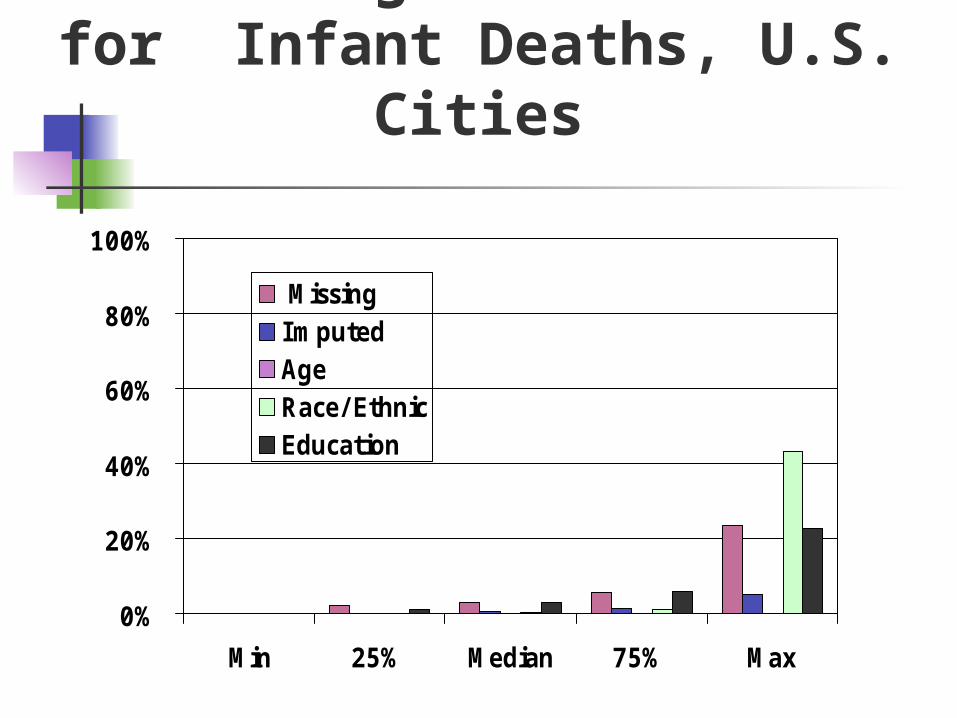
Percentage of Unknowns for Infant Deaths, U.S.
Cities
0%
20%
40%
60%
80%
100%
Min 25% Median 75% Max
MissingImputedAgeRace/ EthnicEducation
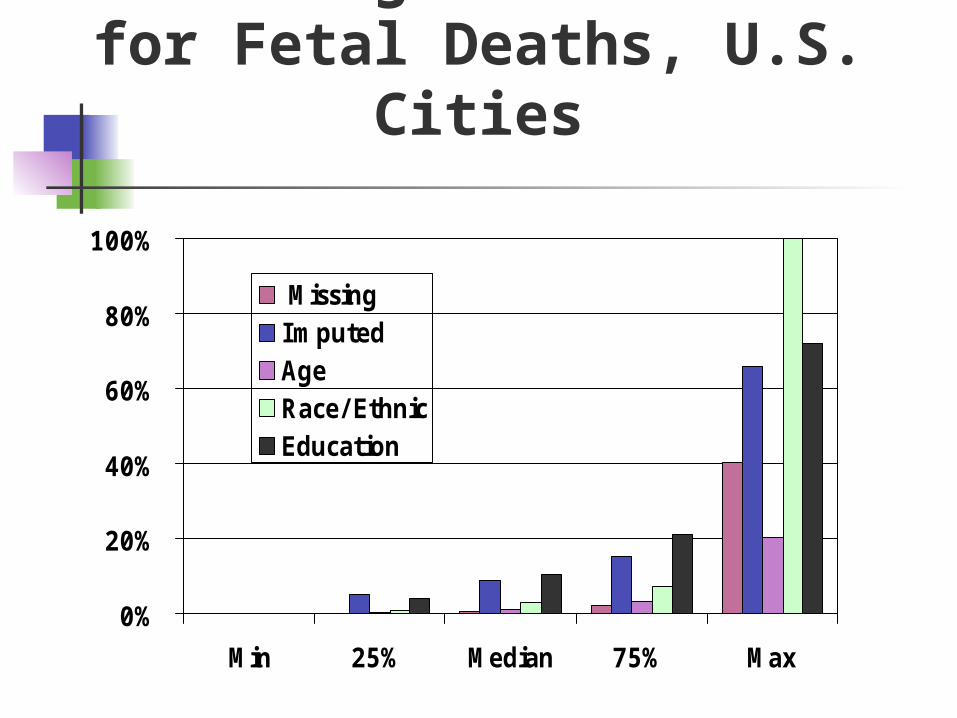
Percentage of Unknowns for Fetal Deaths, U.S.
Cities
0%
20%
40%
60%
80%
100%
Min 25% Median 75% Max
MissingImputedAgeRace/ EthnicEducation
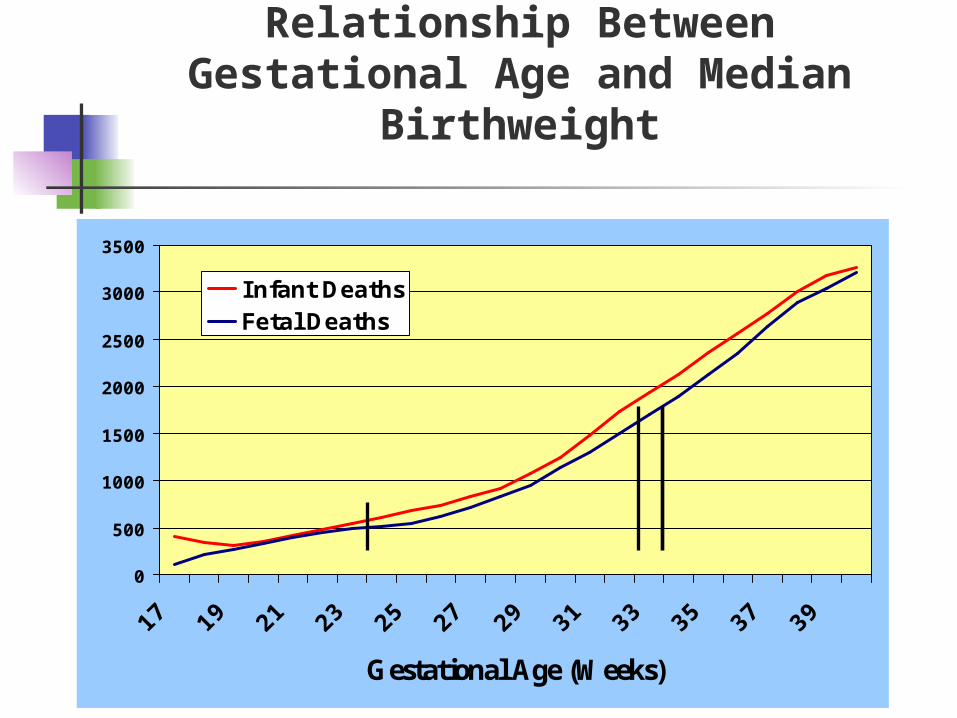
Relationship Between Gestational Age and Median
Birthweight
0
500
1000
1500
2000
2500
3000
3500
Gestational Age (Weeks)
Infant DeathsFetal Deaths
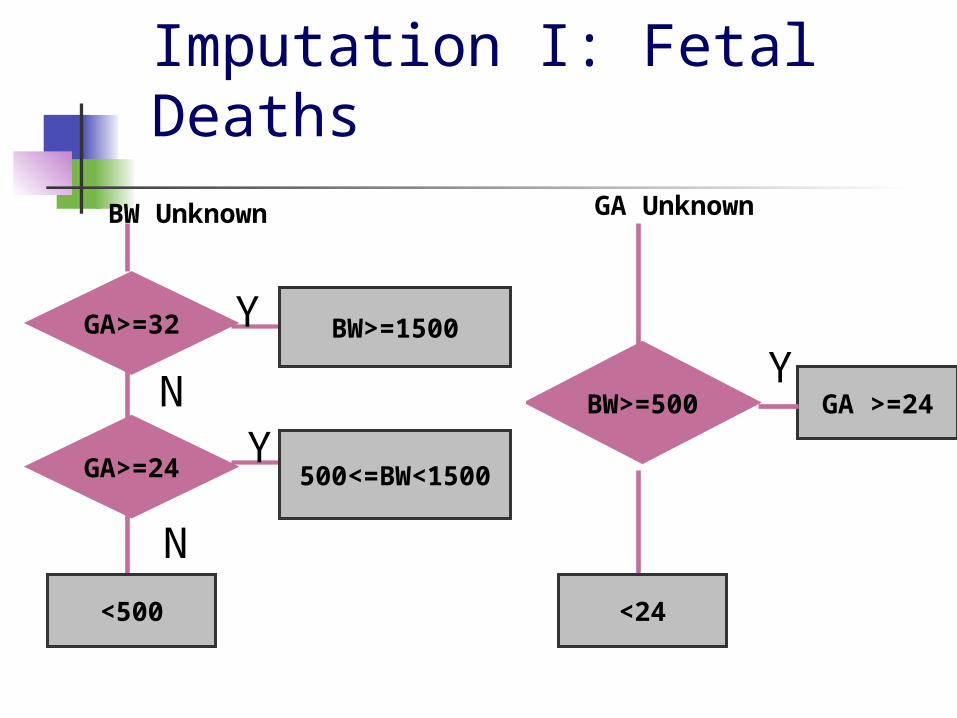
Imputation I: Fetal Deaths
GA>=32 BW>=1500Y
N
GA>=24 Y500<=BW<1500
BW Unknown
N
<500
BW>=500 GA >=24Y
<24
GA Unknown
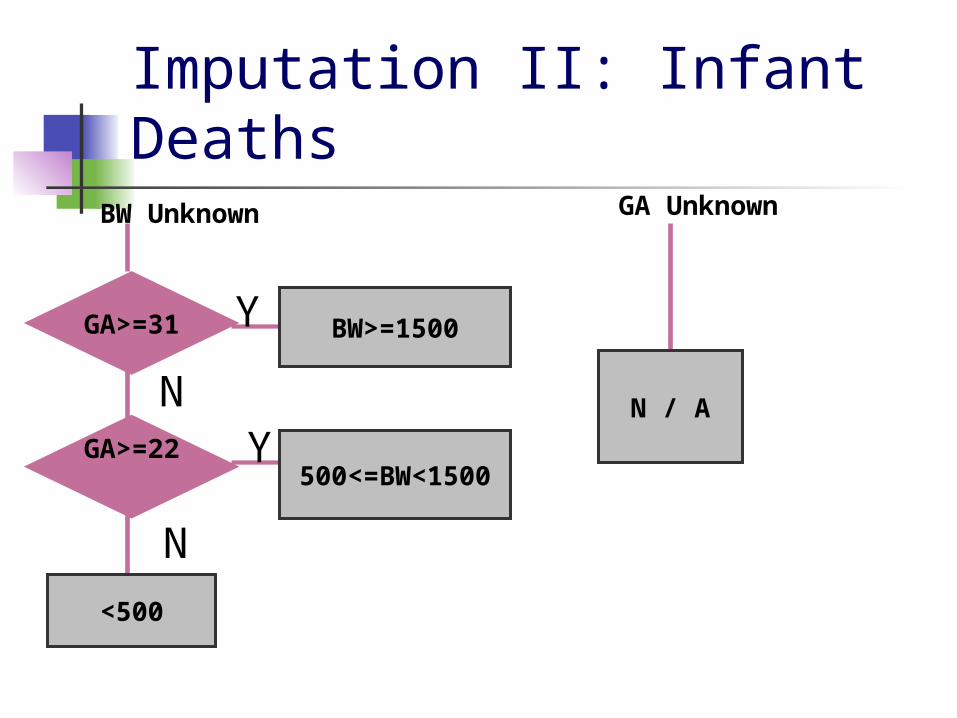
Imputation II: Infant Deaths
GA>=31 BW>=1500Y
NGA>=22 Y
500<=BW<1500
BW Unknown
N
<500
N / A
GA Unknown
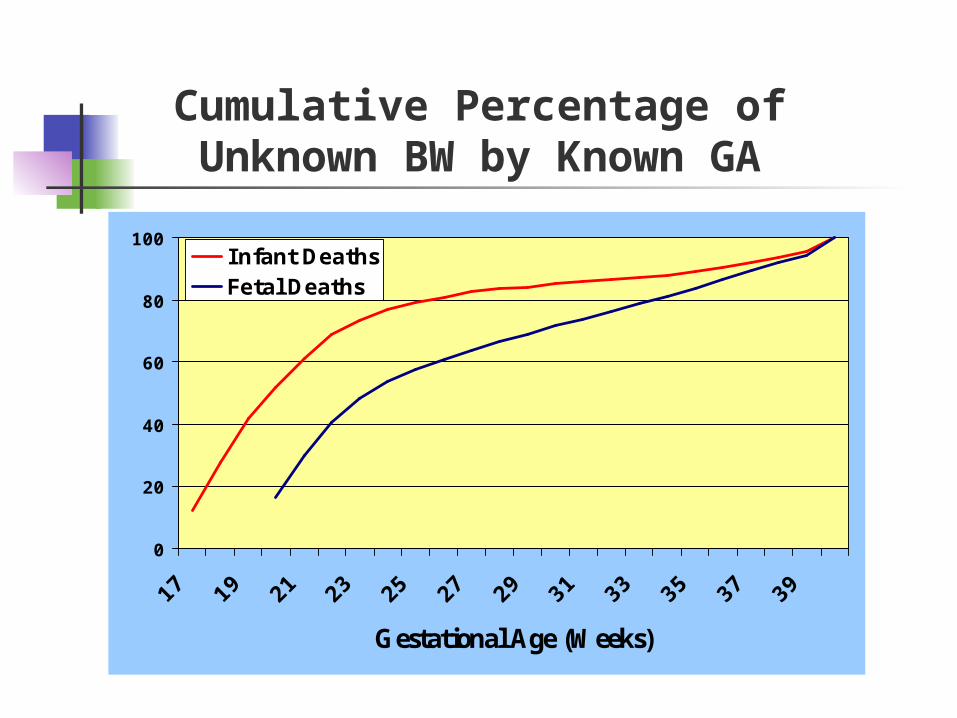
Cumulative Percentage of Unknown BW by Known GA
0
20
40
60
80
100
17 19 21 23 25 27 29 31 33 35 37 39
Gestational Age (Weeks)
Infant DeathsFetal Deaths

“Do we really have to eliminate <500 gram babies? They are a large part of our deaths…”
New PPOR User
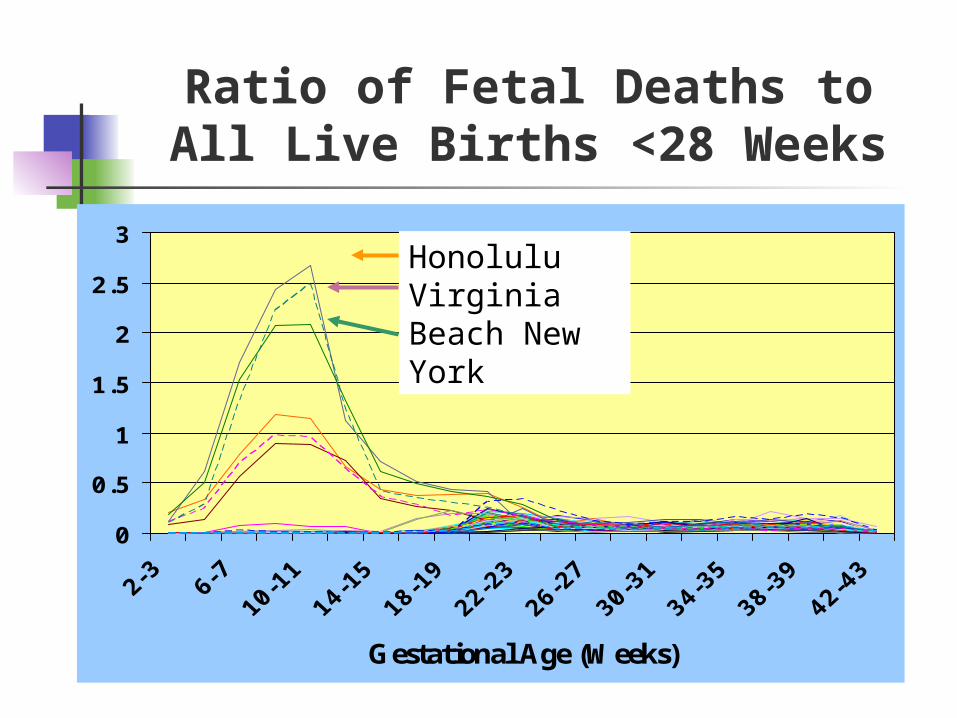
Ratio of Fetal Deaths to All Live Births <28 Weeks
0
0.5
1
1.5
2
2.5
3
Gestational Age (Weeks)
Honolulu Virginia Beach New York
Ratio of Fetal Deaths to All Live Births <28 Weeks
0
0.1
0.2
0.3
0.4
0.5
18-19 20-21 22-23 24-25 26-27 28-29 30-31
Gestational Age (Weeks)
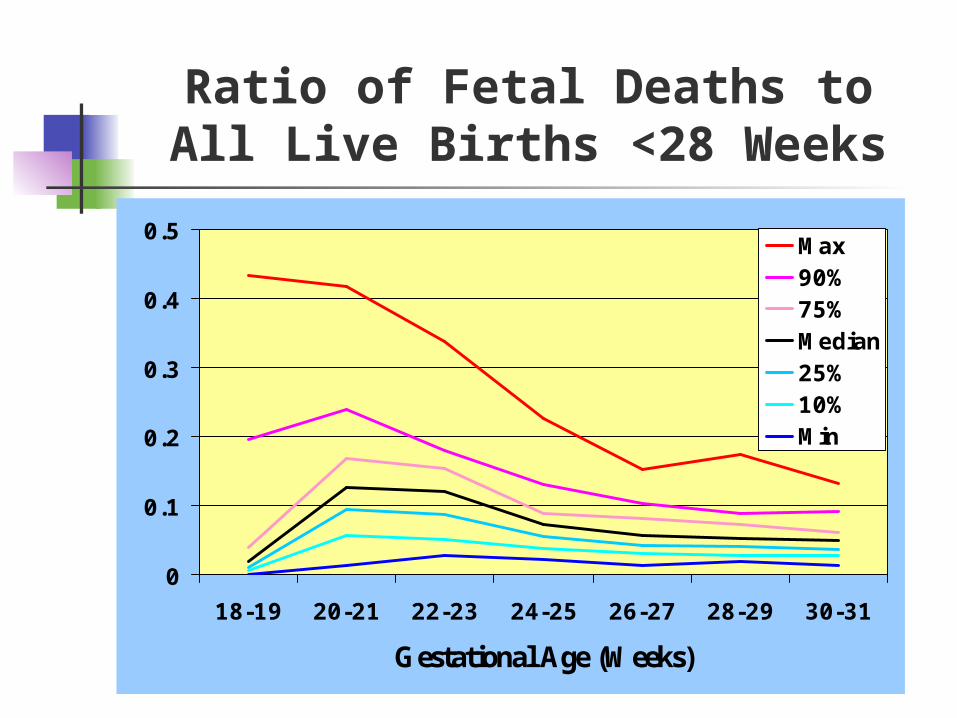
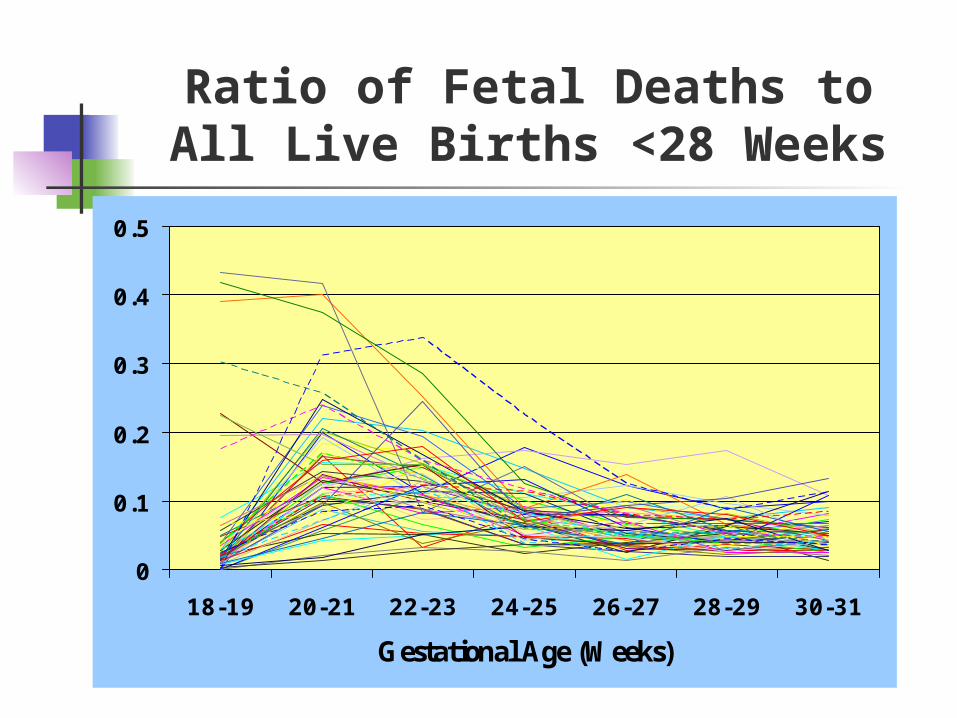
Ratio of Fetal Deaths to All Live Births <28 Weeks
0
0.1
0.2
0.3
0.4
0.5
18-19 20-21 22-23 24-25 26-27 28-29 30-31
Gestational Age (Weeks)
Max 90%75%Median25%10%Min
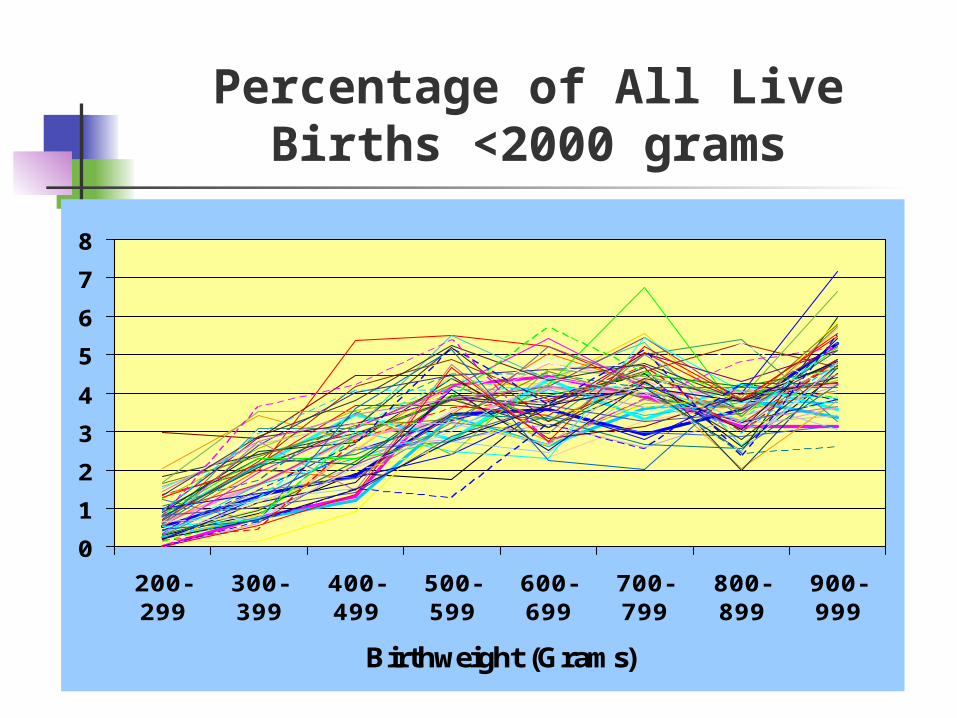
Percentage of All Live Births <2000 grams
0
1
2
3
4
5
6
7
8
200-299
300-399
400-499
500-599
600-699
700-799
800-899
900-999
Birthweight (Grams)
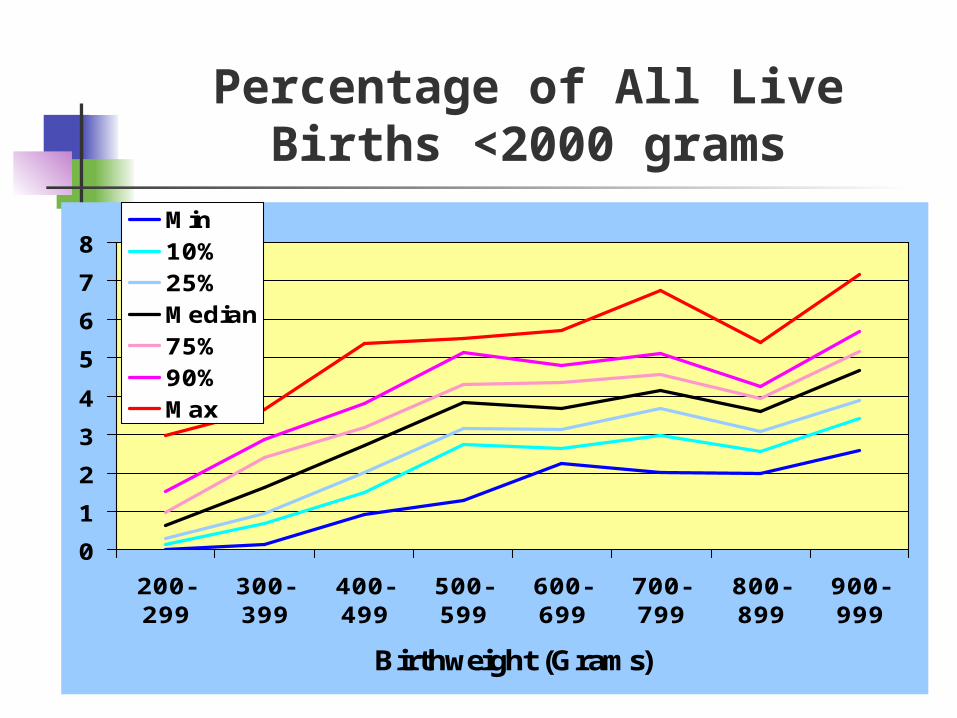
Percentage of All Live Births <2000 grams
0
1
2
3
4
5
6
7
8
200-299
300-399
400-499
500-599
600-699
700-799
800-899
900-999
Birthweight (Grams)
Min10%25%Median75%90%Max
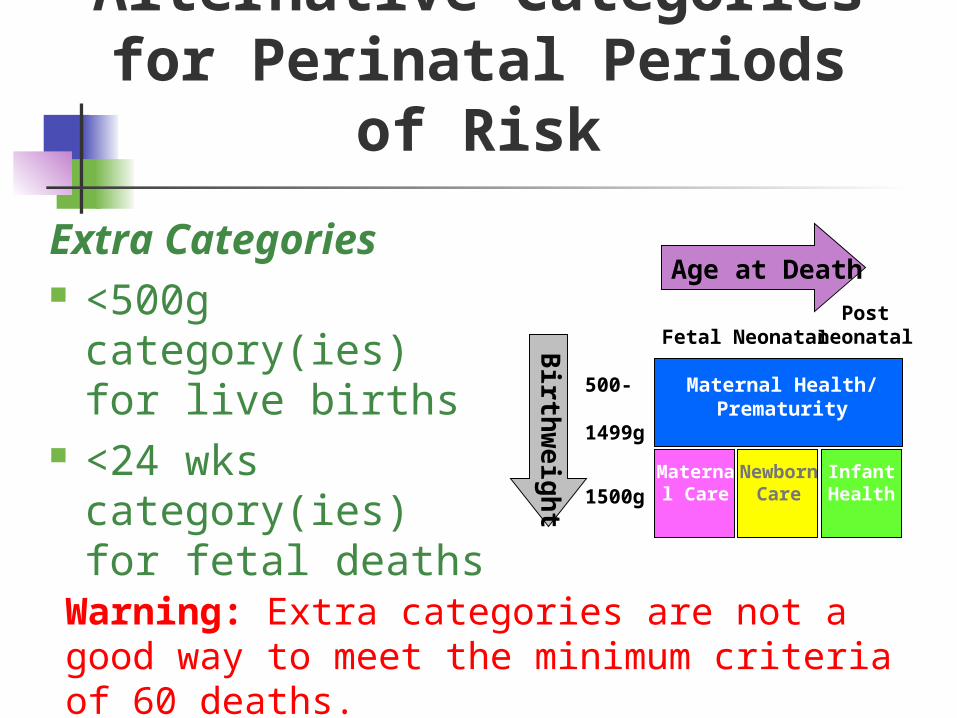
Alternative Categories for Perinatal Periods of
Risk
6
500- 1499g
1500g
Fetal NeonatalPost
neonatal
Maternal Health/ Prematurity
Newborn Care
Age at Death
Birth
we
igh
t Maternal Care
Infant Health
Extra Categories <500g
category(ies) for live births
<24 wks category(ies) for fetal deaths
Warning: Extra categories are not a good way to meet the minimum criteria of 60 deaths.
“Why fetal deaths of less than 24 weeks gestation are excluded from the analysis, but infant deaths of all gestations are considered if they are of 500 grams or more?”
New PPOR User
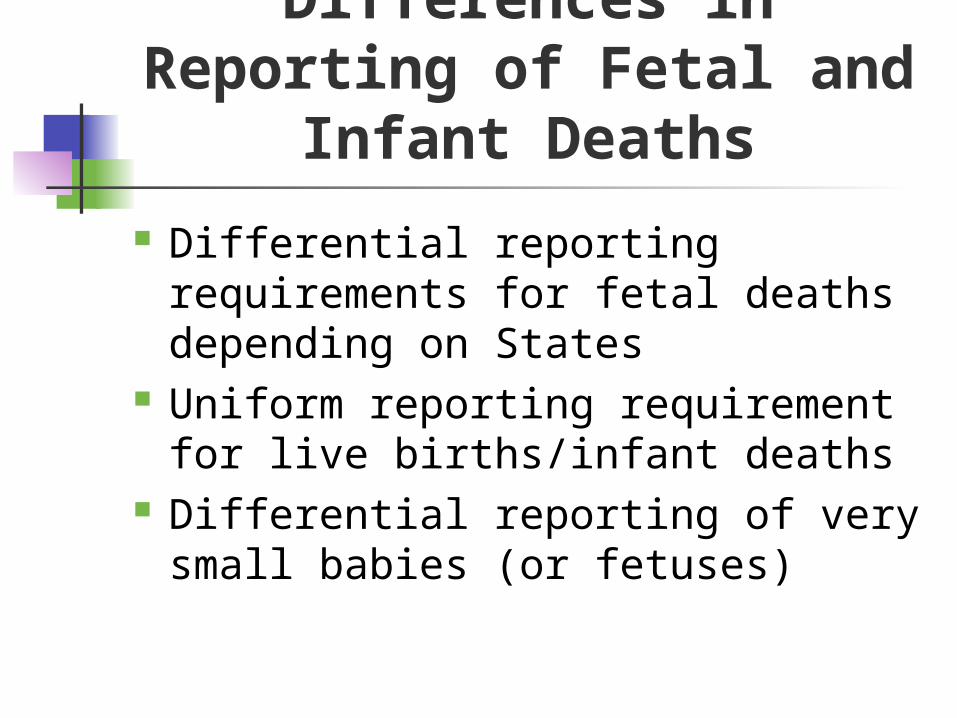
Differences in Reporting of Fetal and
Infant Deaths
Differential reporting requirements for fetal deaths depending on States
Uniform reporting requirement for live births/infant deaths
Differential reporting of very small babies (or fetuses)
“Do we need to exclude babies of less than 500g and fetal deaths of less than 24 weeks gestation from the denominator of feto-infant mortality rates?”
New PPOR User
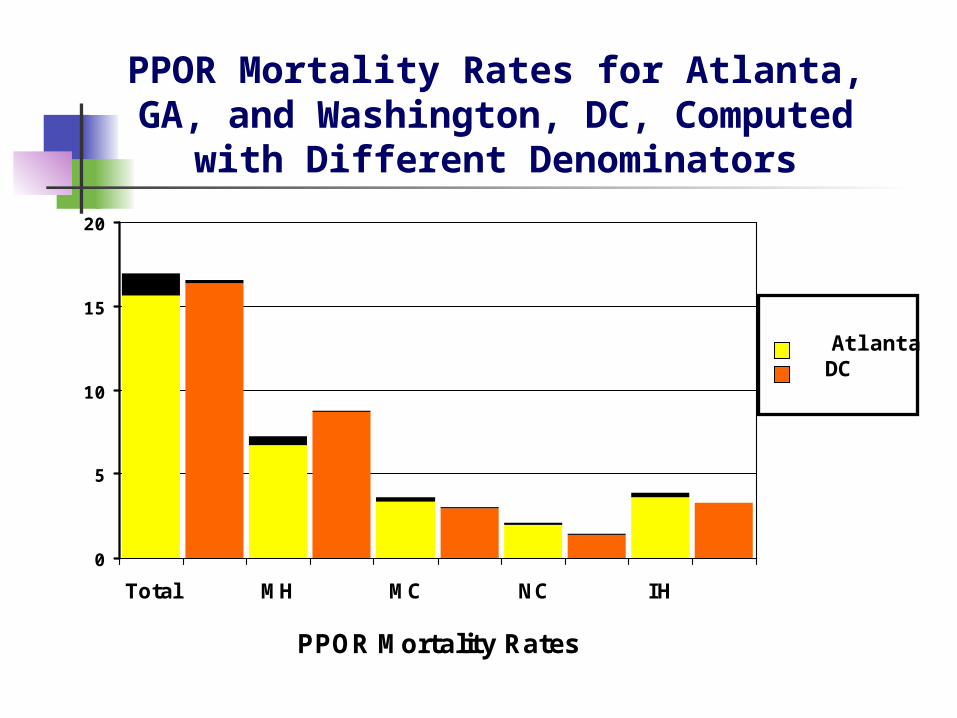
PPOR Mortality Rates for Atlanta, GA, and Washington, DC, Computed with
Different Denominators
0
5
10
15
20
Total MH MC NC IH
PPOR Mortality Rates
AtlantaDC

“Which reference group should we use? Do I need to use a national reference group? Where can I find one?”
New PPOR User

Examine the “Opportunity Gap”
Reference Groups
20 or more years of age 13 or more years of education Non-Hispanic white women
Attempt to choose a simple optimal group; at least 15% of the population
U.S. studies:
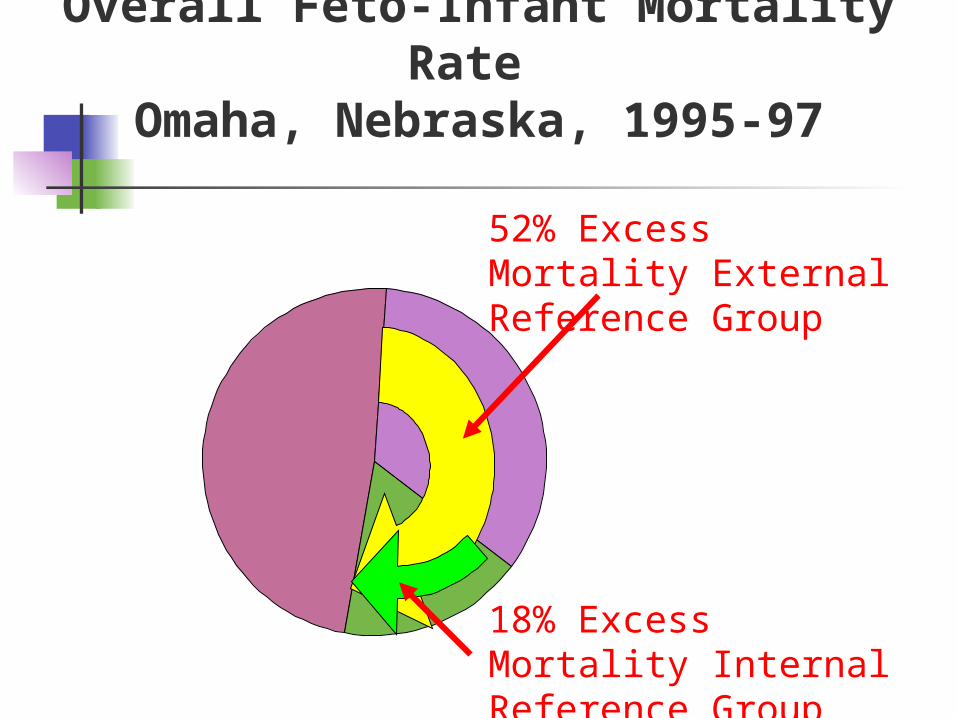
Overall Feto-Infant Mortality Rate Omaha, Nebraska, 1995-97
52% Excess Mortality External Reference Group
18% Excess Mortality Internal Reference Group

Potential Reference Groups
Traditional group: non-Hispanic white women of 20+ years with 13+ years of education.
Population under study (internal) Population from the larger
community (external) National reference group (external) Same as above but with new
characteristics
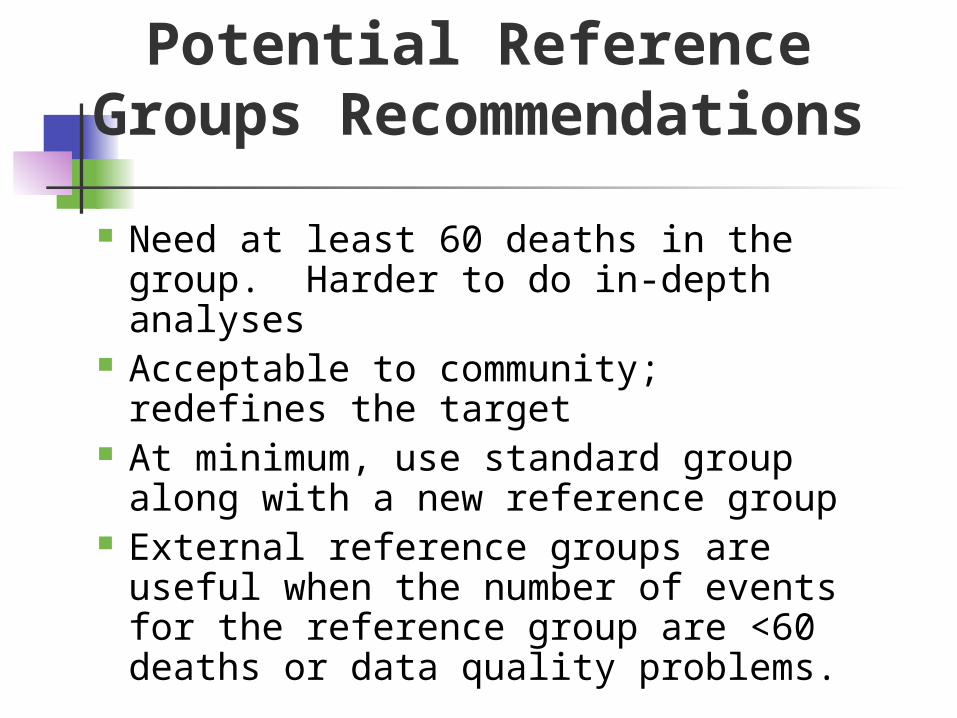
Potential Reference Groups Recommendations
Need at least 60 deaths in the group. Harder to do in-depth analyses
Acceptable to community; redefines the target
At minimum, use standard group along with a new reference group
External reference groups are useful when the number of events for the reference group are <60 deaths or data quality problems.

“What is the difference between residence and occurrence? Which one should we use?”
New PPOR User
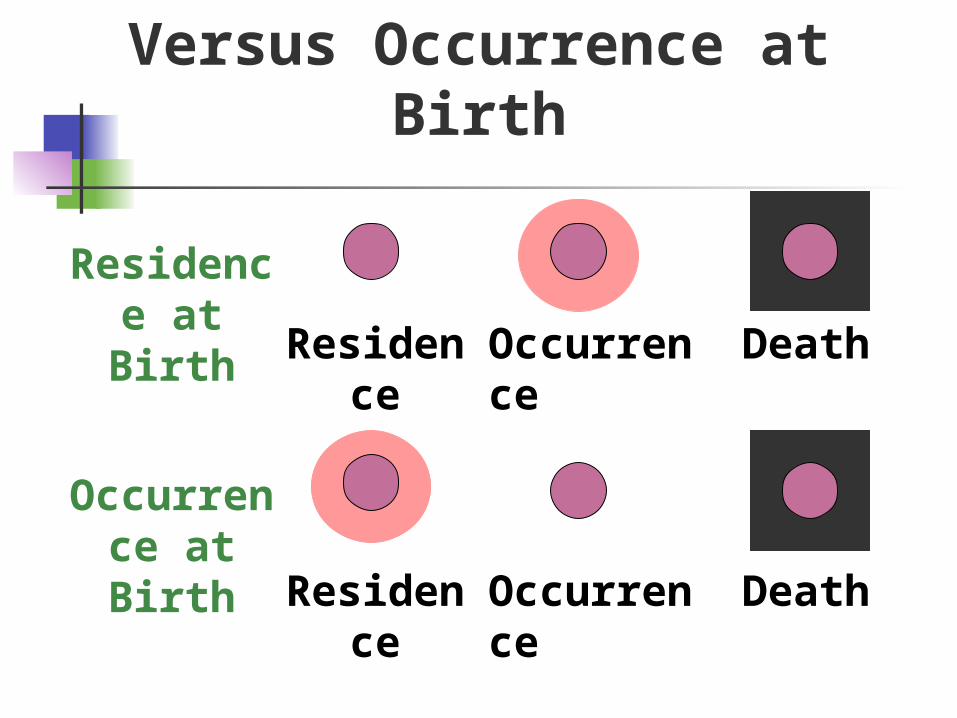
Place of Residence Versus Occurrence at Birth
Residence at Birth
Residence Occurrence
Occurrence at Birth
Death
DeathResidence Occurrence
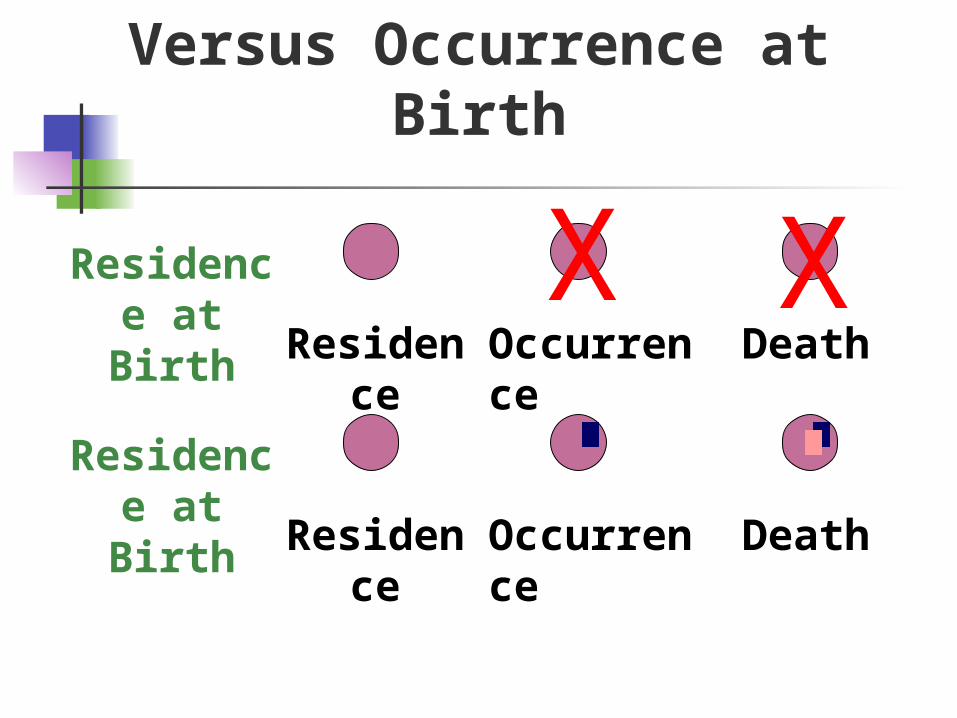
Place of Residence Versus Occurrence at Birth
Residence at Birth
Residence Occurrence Death
Residence at Birth
Residence Occurrence Death
X X

“Who should we include in our PPOR analysis? Can I just study a high risk area or population?”
New PPOR User

Communities Want to Target Specific Groups
High risk geographic area(s) Specific racial or ethnic group Teens Clients Healthy Start Area
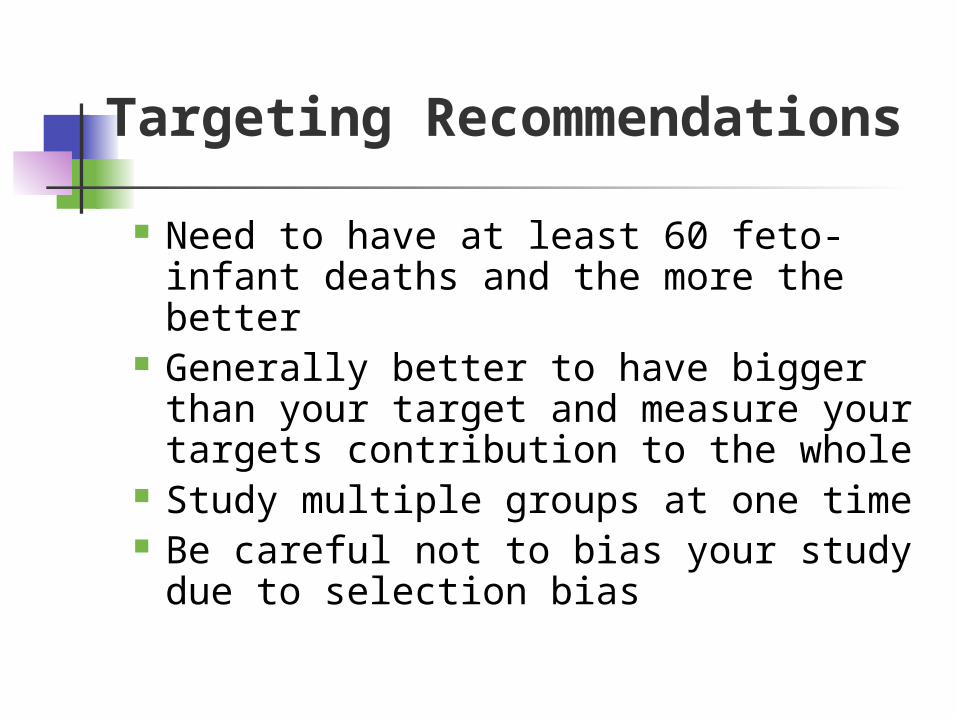
Targeting Recommendations
Need to have at least 60 feto-infant deaths and the more the better
Generally better to have bigger than your target and measure your targets contribution to the whole
Study multiple groups at one time Be careful not to bias your study
due to selection bias
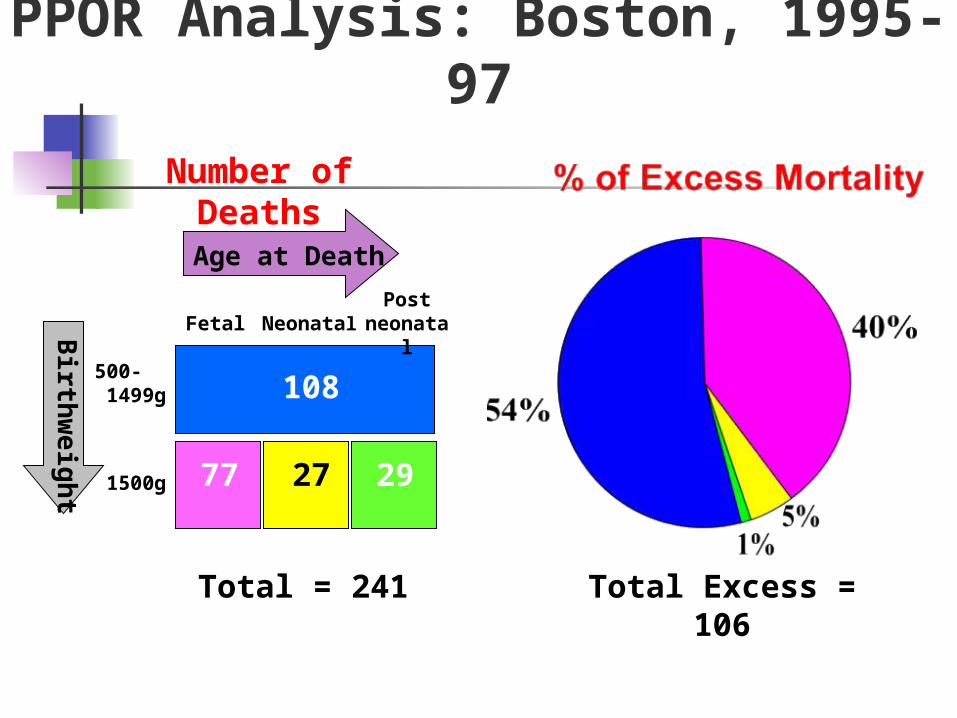
PPOR Analysis: Boston, 1995-97
500- 1499g
1500g
Fetal NeonatalPost
neonatal
108
276
Age at Death
Birth
weig
ht
77 29
Number of Deaths
Total = 241 Total Excess = 106

Communities Want to Exclude Specific Groups
Congenital anomalies Twins and multiple gestation births Occurrences out of the community
“Why do we need at least 60 deaths in all cells?”
New PPOR User
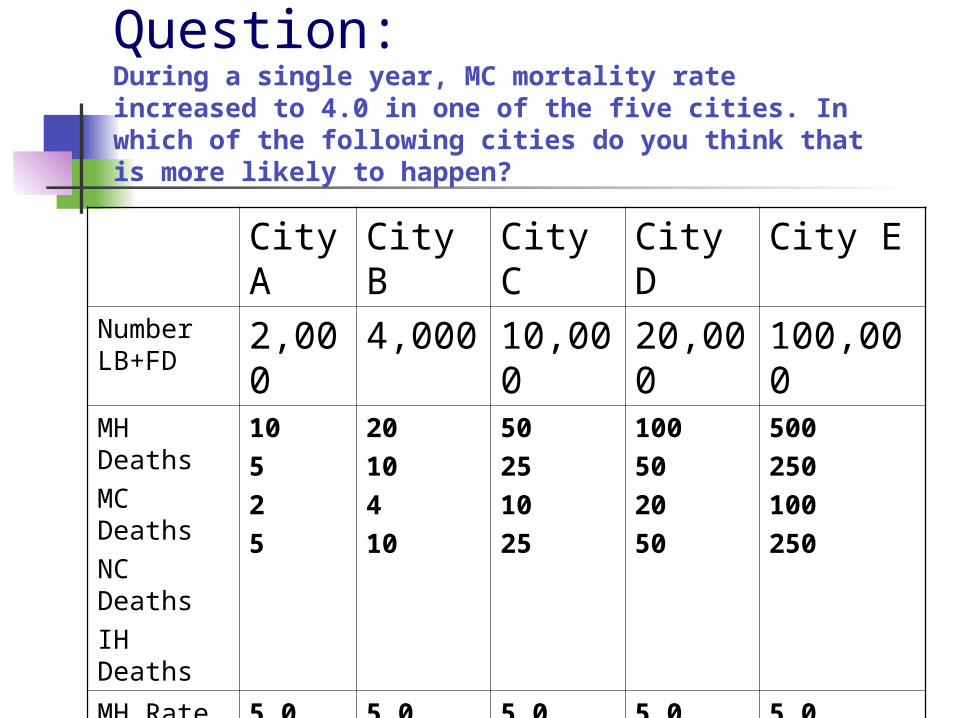
Question: During a single year, MC mortality rate increased to 4.0 in one of the five cities. In which of the following cities do you think that is more likely to happen?
City A
City B City C City D City E
Number LB+FD
2,000
4,000 10,000
20,000
100,000
MH DeathsMC DeathsNC DeathsIH Deaths
10525
2010410
50251025
100502050
500250100250
MH RateMC RateNC RateIH Rate
5.02.51.02.5
5.02.51.02.5
5.02.51.02.5
5.02.51.02.5
5.02.51.02.5
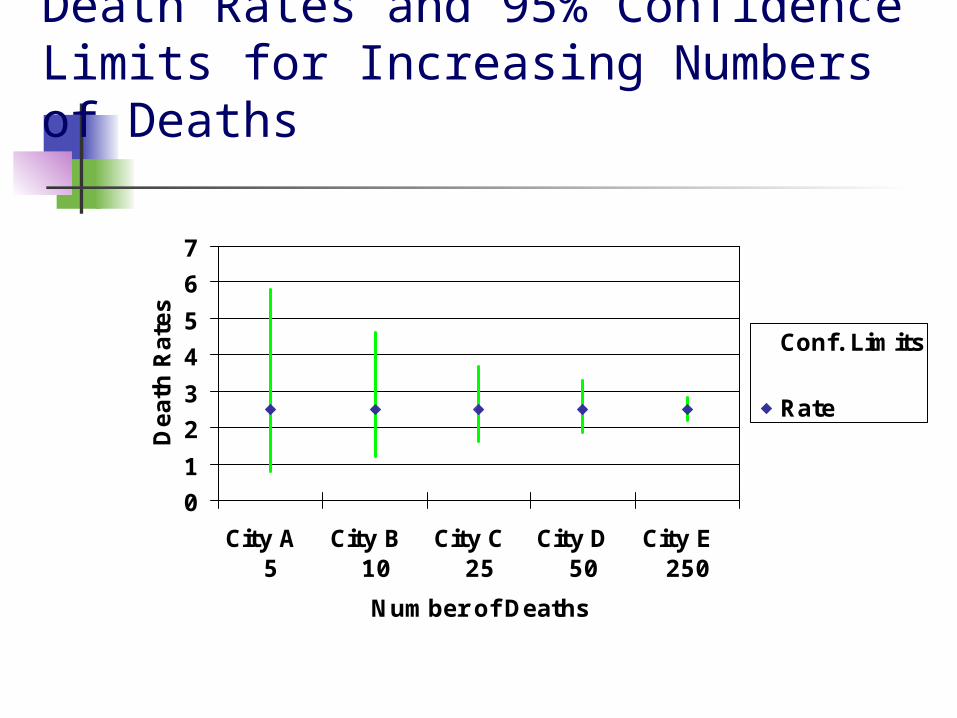
Death Rates and 95% Confidence Limits for Increasing Numbers of Deaths
0
1
2
3
4
5
6
7
City A 5
City B 10
City C 25
City D 50
City E 250
Number of Deaths
Death
Rate
s
Conf. Limits
Rate
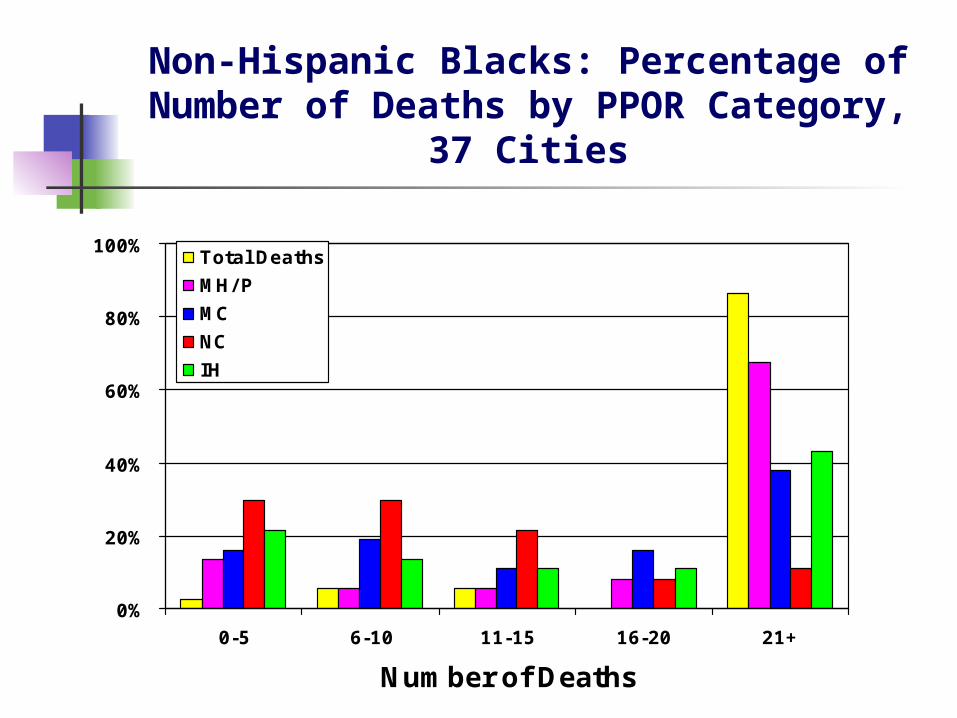
Non-Hispanic Blacks: Percentage of Number of Deaths by PPOR Category,
37 Cities
0%
20%
40%
60%
80%
100%
0-5 6-10 11-15 16-20 21+
Number of Deaths
Total Deaths
MH/ P
MC
NC
IH
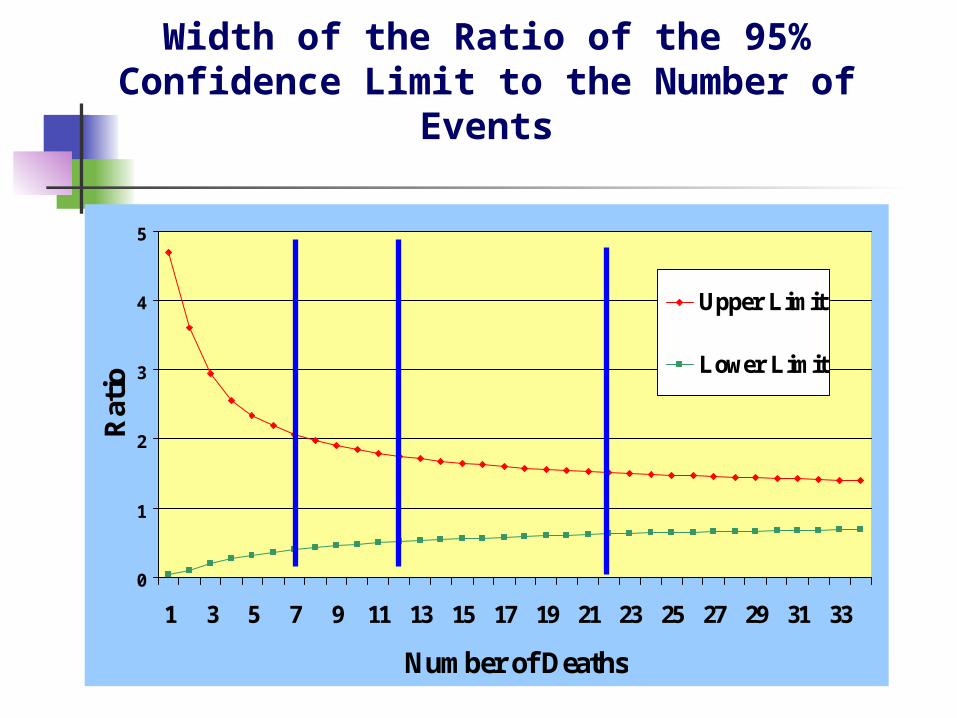
Width of the Ratio of the 95% Confidence Limit to the Number of
Events
0
1
2
3
4
5
1 3 5 7 9 11 13 15 17 19 21 23 25 27 29 31 33
Number of Deaths
Rat
io
Upper Limit
Lower Limit
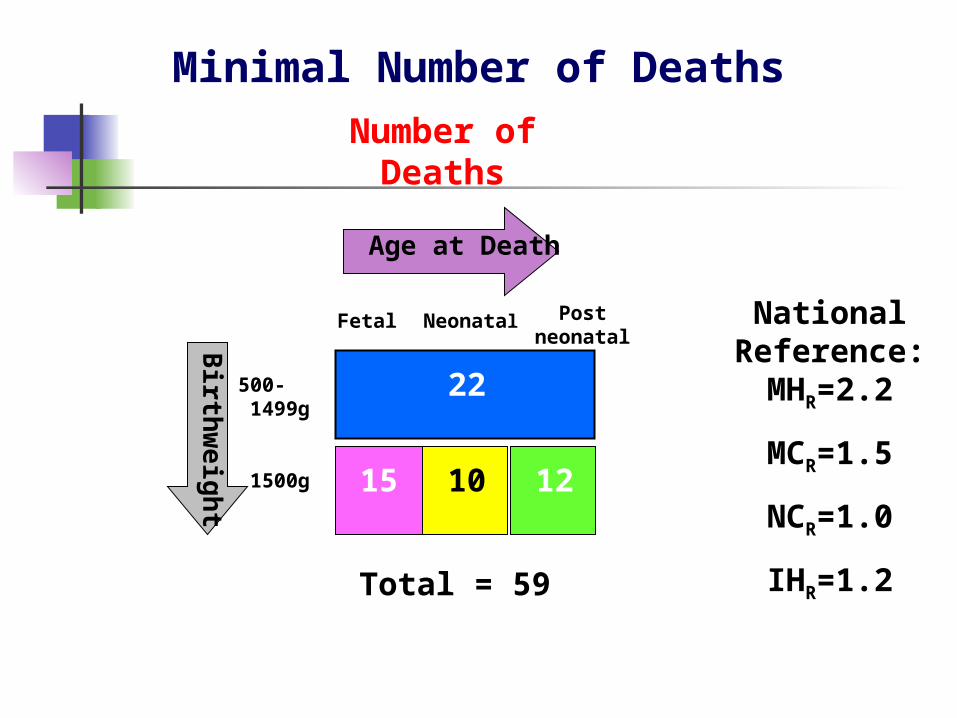
Minimal Number of Deaths
500- 1499g
1500g
Fetal Neonatal Post neonatal
22
10
Age at Death
Birth
weig
ht
12
Number of Deaths
Total = 59
15
National Reference: MHR=2.2
MCR=1.5
NCR=1.0
IHR=1.2
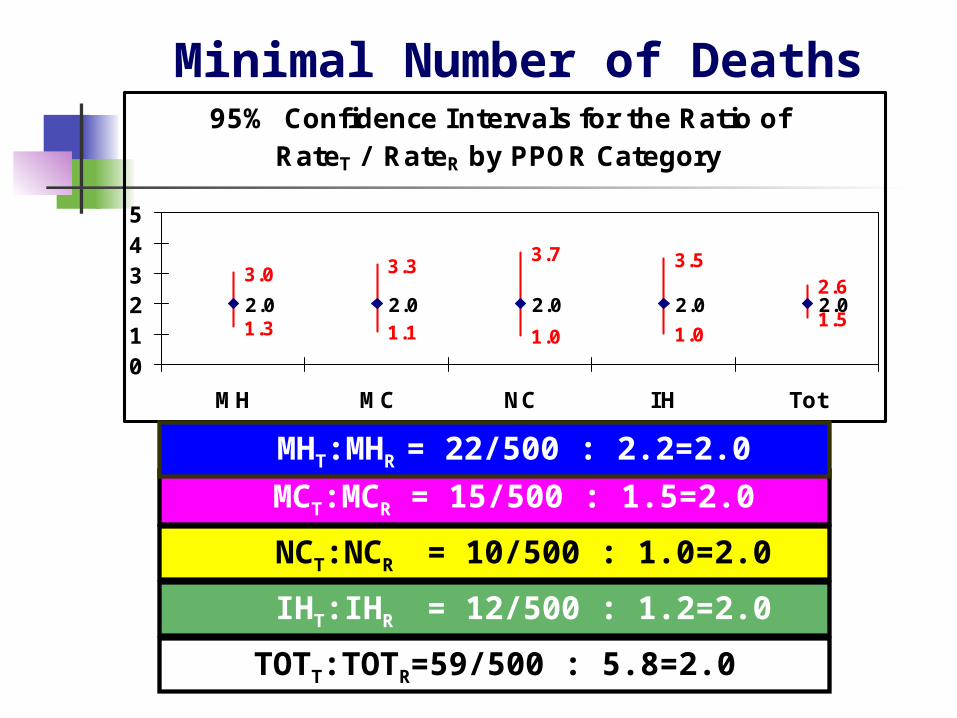
Minimal Number of Deaths
6
95% Confidence Intervals for the Ratio of RateT / RateR by PPOR Category
1.3 1.1 1.0 1.01.5
3.0 3.33.7 3.5
2.62.0 2.0 2.0 2.0 2.0
012345
MH MC NC IH Tot
NCT:NCR = 10/500 : 1.0=2.0
MCT:MCR = 15/500 : 1.5=2.0
MHT:MHR = 22/500 : 2.2=2.0
IHT:IHR = 12/500 : 1.2=2.0
TOTT:TOTR=59/500 : 5.8=2.0
“What to do if there are less than 60 deaths in the reference group?”
New PPOR User
Small Number In the Reference Group
Usually less deaths because of lower rates.
Usually more missing data because it requires more data elements.
For precise Excess rates, Reference rates need to be precise (narrow confidence limits).
Should We Use the Internal Reference Group Then?
Check your data quality. Check how different internal rates
are from external rates – large differences may be due to instability.
Measure variability using Confidence Intervals.
Bottom line – you can always use an external reference group.

“How many years should we combine?”
New PPOR User
Recommendations on the Number of Years to
Use No more than 5 years due to
changes in medical practice Need at least 60 deaths in every
population you want to study Phase 2 analyses require even more
deaths. Combine as many years as possible and appropriately.
Time trends can be studied separately.