Embed Size (px)
Citation preview

Persistence of Tertiary Structure in 7.9 M Guanidinium Chloride: The Case ofEndo-â-1,3-glucanase fromPyrococcus furiosus†
Roberta Chiaraluce,‡ John van der Oost,§ Joyce H. G. Lebbink,| Thijs Kaper,§ and Valerio Consalvi*,‡
Dipartimento di Scienze Biochimiche A Rossi Fanelli, UniVersita la Sapienza, Piazzale Aldo Moro 5, 00185 Rome, Italy,Laboratory of Microbiology, Wageningen UniVersity, H.Van Suchtelenweg 4, 6703 CT Wageningen, The Netherlands, and
Department of Molecular Carcinogenesis, Netherlands Cancer Institute, Plesmanlaan 121,1066 CX Amsterdam, The Netherlands
ReceiVed July 23, 2002; ReVised Manuscript ReceiVed October 7, 2002
ABSTRACT: ThePyrococcus furiosusendo-â-1,3-glucanase belongs to the subfamily of laminarinase, whichcan be classified as “allâ proteins” as confirmed by deconvolution of far-UV CD and FTIR spectra. Thepersistence of a significant amount of tertiary structure in 7.9 M GdmCl, as indicated by near-UV CDspectroscopy, accompanied by a red-shift of the maximum fluorescence emission wavelength is a peculiarproperty of this hyperthermophilic endoglucanase. The possibility to observe tertiary structure elementsunder extremely denaturing conditions is notable and is limited to only a few examples. The unusualresistance toward guanidinium chloride denaturation is paralleled by a notable stability at extremely lowpH and at high temperature. The analysis of the protein spectral properties indicates that the secondarystructure elements are preserved down to pH 1.0 and up to 90°C at pH 7.4 and pH 3.0. The study of theconditions that determine the persistence of residual structure at high denaturant concentration and theexamination of these structures are particularly interesting because these state(s) may be preliminary orcoincident with the coalescence of protein aggregates or to the formation of amyloid-like fibrils, and theymay serve as seeds of protein folding.
The most thermostable endo-â-1,3-glucanase (endoglu-canase)1 described so far is the secreted endoglucanase fromthe hyperthermophilic archaeonPyrococcus furiosus(1). Theextreme thermal resistance (half-life at 100°C is 16 h) andthe temperature optimum for catalysis at 100-105°C makethis enzyme an attractive target for stability studies and tomonitor the effect of temperature on its structure in solution.Thermal stability studies may lead to a better comprehensionof the structural determinants required for this outstandingmolecular adaptation at high temperature. In turn, theanalysis of the structural changes induced by temperaturemay offer clues to understand the thermal resistance or torecognize the transitions that are preliminary to irreversibleinactivation.
The P. furiosusendoglucanase belongs to the subfamilyof laminarinase in the glycosyl hydrolase family 16, accord-ing to a sequence-based classification (2). This type ofclassification reflects the structural features of the enzymessince the members of a family share a similar three-dimensional structure and a similar fold, despite important
differences in the region surrounding the conserved catalyticresidues (2, 3). These bacterial glucanases belong to the classof “all â proteins” (4) and fold like the concanavalin A-likelectins into a compact jellyroll-typeâ-sheet structure. Severalof these enzymes, independent of the thermophilic origin,are remarkably stable against thermal inactivation (3, 5).Moreover, a particular interest for this class of protein arisesfrom its potential biotechnological value (6, 7). The maininterest derives from the fact that the enzyme is able tohydrolyze complex glucose polymers into smaller oligomers.Its capability to resist against thermal and acid denaturationis advantageous in some industrial applications (3).
These premises led us to study the stability in solution ofthe endoglucanase fromP. furiosusat different pH valuesand at increasing temperatures and guanidinium chloride(GdmCl) concentration by the use of several spectroscopictechniques to follow the protein structural transitions inducedby solvent and temperature changes. In the course of studyingthe denaturation process, some interesting properties of thisenzyme were observed. In the presence of 7.9 M GdmCl,the spectral features indicative of the enzyme’s tertiarystructure are not completely abolished, and at extremely lowpH a significant amount of tertiary structure is also present.The possibility to observe the tertiary structure underextremely denaturing conditions is notable and is limited toonly a few examples (8, 9). The study of the conditions thatdetermine the persistence of residual structure at highdenaturant concentration and the examination of thesestructures are particularly interesting because these state(s)
† This research was supported by the Italian Ministero IstruzioneUniversita Ricerca (MIUR) and Contract BIO 4-CT96-0488 of theEuropean Union.
* Corresponding author e-mail: [email protected]; phone:+39 0649910939; fax: +39 064 440062.
‡ Universitala Sapienza.§ Wageningen University.| Netherlands Cancer Institute.1 Abbreviations: ANS, 8-anilinonaphthalene-1-sulfonic acid; endo-
glucanase, endo-â-1,3-glucanase; GdmCl, guanidinium chloride.
14624 Biochemistry2002,41, 14624-14632
10.1021/bi026498u CCC: $22.00 © 2002 American Chemical SocietyPublished on Web 11/14/2002
may be preliminary or coincident with the coalescence ofprotein aggregates or to the formation of amyloid-like fibrils(10, 11), and in turn, they may serve as seeds of proteinfolding (8, 9).
MATERIAL AND METHODS
Chemicals and Buffers.GdmCl, 8-anilinonaphthalene-1-sulfonic acid ammonium salt (ANS), DTT, EDTA, andlaminarin were from Fluka. 3′,5′-Dinitrosalicylic acid waspurchased from Sigma. Buffer solutions were filtered (0.22µm) and carefully degassed. All buffers and solutions wereprepared with ultra-high-quality water (ELGA UHQ, U.K.).
Enzyme Preparation and Assay. TheP. furiosusendoglu-canase was functionally produced inEscherichia coliBL21-(DE3) with pLUW530, as described before (1). Purificationof the enzyme was performed according to ref1 with anadditional size-exclusion chromatography step on Superdex75 (Amersham Pharmacia). The protein concentration wasdetermined at 280 nm usingε280 ) 82030 M-1 cm-1
calculated according to Gill and von Hippel (12). Endoglu-canase activity was determined by measuring the amount ofreducing sugars released upon enzyme incubation in thepresence of laminarin as described by Guegen et al. (1). Theenzyme was incubated in 0.1 M sodium phosphate buffer,pH 6.5, containing 0.5% (w/v) laminarin at 80°C for 10min. One unit of enzyme activity is defined as the amountof endoglucanase catalyzing the formation of 1µmol ofreducing sugars/min under the above-defined conditions;glucose was used as a standard.
Spectroscopic Techniques. Intrinsic fluorescence emissionand light-scattering measurements were carried out with aLS50B Perkin-Elmer spectrofluorimeter using a 1-cm pathlength quartz cuvette. Fluorescence emission spectra wererecorded at 300-450 nm (1-nm sampling interval) at 20°Cwith the excitation wavelength set at 290 nm. Light scatteringwas measured at 20°C with both excitation and emissionwavelengths set at 480 nm.
Far-UV (180-250 nm) and near-UV (250-310 nm) CDmeasurements were performed in 0.01-0.2- and 1.0-cm pathlength quartz cuvettes, respectively. CD spectra were re-corded on a Jasco J-720 spectropolarimeter. The results areexpressed as the mean residue ellipticity ([Θ]) assuming amean residue weight of 110 per amino acid residue. In allthe spectroscopic measurements at pH 7.4, 100µM EDTAwas present unless otherwise stated.
FTIR spectra were recorded on a Nicolet Magna 760spectrometer (Nicolet) equipped with a MCT detector.Solution ATR spectra were measured in a CIRCLE cell(Spectra Tech, Madison, WI) thermostated at 20°C. Proteinsamples (120µL) of a 8 mg/mL protein solution in 20 mMTris-HCl at pH 7.4 or pH 2.0 (10 mM HCl) were placed inthe CIRCLE cell with a Si crystal rod. A total of 512interferograms at 2 cm-1 resolution were collected for eachspectrum, with Mertz apodization and two levels of zerofilling. The sample chamber of the spectrometer wascontinuously purged with dry air to avoid water vaporinterference on the bands of interest. The background spectrawere collected immediately before the sample measurementsand under the same conditions with the cell filled witheverything but protein. At the end of the measurements, afterprolonged washing, a spectrum of the cell was recorded to
check for protein absorption on the Si crystal rod (13). Watervapor spectra were collected by reduction of the dry-air purgeof the clean cell.
Experiments with the fluorescent dye ANS were performedat 20 °C by incubating the protein and ANS at 1:5 molarratio. After 5 min, fluorescence emission spectra wererecorded at 400-600 nm with the excitation wavelength setat 390 nm. The maximum fluorescence emission wavelengthand the intensity of the hydrophobic probe ANS depend onthe environmental polarity (e.g., on the hydrophobicity ofthe accessible surface of the protein) (14).
GdmCl-Induced Unfolding and Refolding. For equilibriumtransition studies, the enzyme (final concentration 40-60µg/mL) was incubated at 20°C at increasing concentrationsof GdmCl (0-8 M) in 20 mM Tris-HCl, pH 7.4, in thepresence of 100µM DTT and 100µM EDTA or in 10 mMHCl (pH 2.0). After 24 h, equilibrium was reached andintrinsic fluorescence emission and far-UV CD spectra (0.2-cm cuvette) were recorded in parallel at 20°C. To test thereversibility of the unfolding, endoglucanase was unfoldedat 20°C in 7.8 M GdmCl at 0.8 mg/mL protein concentrationin 25 mM Tris-HCl, pH 7.4, in the presence of 100µM DTTand 100µM EDTA or in 10 mM HCl (pH 2.0). After 24 h,refolding was started by 20-fold dilution of the unfoldingmixture at 20°C into solutions of the same buffer used forunfolding containing decreasing GdmCl concentrations. Thefinal enzyme concentration was 40µg/mL. After 24 h,intrinsic fluorescence emission and far-UV CD spectra wererecorded at 20°C.
Acid-Induced Denaturation. P. furiosusendoglucanase wasincubated 2 h in HCl at pH3.0, 2.0, and 1.0. The pH of thesolution was measured with an InLab 422 electrode (Mettler-Toledo AG) connected to a Corning P 507 ion meter beforeand after the addition of the enzyme; pH adjustments werenot required.
Thermal Denaturation. For thermal scans, the proteinsamples (0.2 mg/mL) at pH 7.4, 3.0, and 2.0 were heatedfrom 10 to 95°C and subsequently cooled to 10°C with aheating/cooling rate ranging from 0.75 to 1.50 deg/mincontrolled by a Jasco programmable Peltier element in a0.1-cm cuvette. A scan rate of 1 deg/min was chosenin consideration of the observed independence of thermaltransitions on the heating/cooling rate. Far-UV CD spectrawere recorded every 5-2.5 °C, and the dichroic activityat 222 nm was continuously monitored every 0.5°Cwith 4-s averaging time. All the spectra were correctedfor solvent contribution at increasing temperature for allthe different pH values examined. The presence of aggre-gated particles at the end of the thermal transitions wascontrolled by 90° light-scattering and size-exclusion chro-matography.
The thermal transition at pH 2.0 were monitored by FTIRspectroscopy in the same CIRCLE cell used at 20°C. Acarefully degassed protein sample (8 mg/mL) was loadedby a Teflon tubing loop that was sealed before monitoringthe thermal transition. The cell was heated from 10 to 90°C and cooled to 20°C with a 10-deg interval at a heatingrate of 1 °C/min by a programmable Julabo FP50-HPcirculation water bath. The spectra were corrected for solventand water vapor contribution at each temperature interval.
Data Analysis. The changes in intrinsic fluorescenceemission spectra at increasing GdmCl concentrations were
Persistence of Tertiary Structure in 7.9 M GdmCl Biochemistry, Vol. 41, No. 49, 200214625

quantified as the intensity-averaged emission wavelength,λh,(15) calculated according to
where λi and I i are the emission wavelength and itscorresponding fluorescence intensity at that wavelength,respectively.
Far-UV CD spectra from GdmCl titration were analyzedby the singular value decomposition algorithm (SVD) (16-18) using the software MATLAB (MathWorks, South Natick,MA). SVD is useful to find the number of independentcomponents in a set of spectra and to remove the high-frequency noise and the low-frequency random error. CDspectra in the 210-250-nm region (0.2-nm sampling interval)were placed in a rectangular matrixA of n columns, onecolumn for each spectrum collected in the titration. TheAmatrix is decomposed by SVD into the product of threematrices: A ) U × S × VT whereU andV are orthogonalmatrices andS is a diagonal matrix. The columns ofU matrixcontain the basis spectra, and the columns of theV matrixcontain the denaturant dependence of each basis spectrum.Both U and V columns are arranged in terms of theirdecreasing order of the relative weight of information, asindicated by the magnitude of the singular values inS. ThediagonalS matrix contains the singular values that quantifythe relative importance of each vector inU and V. Animportant feature of SVD analysis is that the signal-to-noiseratio is very high in the earliest columns ofU and V andthat the random noise is mainly accumulated in the latestUandV columns. The wavelength-averaged spectral changesinduced by increasing denaturant concentrations are repre-sented by the columns of matrixV. Therefore, the plot ofthe columns ofV versus the denaturant concentrationprovides information about the observed transition.
The FTIR spectra were analyzed using GRAMS software(Galactic Industries Corp., Salem, NH). The water vaporcontribution was subtracted from each of the sample spectra.The essentially featureless region between 1700 and 1800cm-1 (where no protein bands are present) indicated thatwater vapor components are not responsible for the observedbands in the amide I region. The individual components inthe amide region were identified by second derivative andFourier self-deconvolution of the raw spectrum using GRAMS.Curve-fitting of the raw spectrum with a mixed Gaussian-Lorentzian function was then performed to determine thepeak positions and parameters of each individual component.The assignments of the component bands to secondarystructure elements were based on the literature (19-28), andthe area under each peak was used to calculate the percentageof secondary structure components.
GdmCl-induced equilibrium unfolding was analyzed byfitting baseline and transition region data to a two-state linearextrapolation model (29) according to
where∆Gunfolding is the free energy change for unfolding fora given denaturant concentration,∆GH2O is the free energychange for unfolding in the absence of denaturant,mg is aslope term that quantitates the change in∆Gunfolding per unitconcentration of denaturant,R is the gas constant,T is the
temperature, andKunfolding is the equilibrium constant forunfolding. The model expresses the signal as a function ofdenaturant concentration:
whereyi is the observed signal,yN andyD are the native anddenatured baseline intercepts,mN andmD are the native anddenatured baseline slopes, [X]i is the denaturant concentrationafter theith addition,∆GH2O is the extrapolated free energyof unfolding in the absence of denaturant,mg is the slope ofa ∆G unfolding versus [X] plot,R is the gas constant, andT is the temperature. [GdmCl]0.5 is the denaturant concentra-tion at the midpoint of the transition and, according to eq 2,is calculated as follows:
RESULTS
Equilibrium Transition Studies in GdmCl at pH 7.4.Incubation of endoglucanase at increasing GdmCl concentra-tions (0-8 M) in 25 mM Tris-HCl, pH 7.4, containing 200µM DTT and 100µM EDTA for 20 h at 20°C resulted ina progressive increase in intrinsic fluorescence emissionintensity. In the native state, endoglucanase exhibits afluorescence emission maximum at 342 nm when excited at290 nm. At the end of the transition, the intrinsic fluorescenceemission intensity was increased 2-fold as compared to thatof the native enzyme, and the maximum fluorescenceemission wavelength was shifted to 357 nm (Figure 1). Thered-shift of the intrinsic fluorescence emission was deter-mined by calculation of the intensity-averaged emissionwavelength (λh) according to eq 1. This quantity is an integralmeasurement, negligibly influenced by the noise, whichreflects changes in the shape and position of the emission
λh ) ∑(I iλi)/∑(I i) (1)
∆Gunfolding ) ∆GH2O + mg[GdmCl] ) -RT ln Kunfolding (2)
FIGURE 1: GdmCl-induced fluorescence changes ofP. furiosusendoglucanase. Fluorescence changes are reported asλh, calculatedaccording to eq 1. Continuous line is the nonlinear regression toeq 3 of the fluorescence data at varying denaturant concentrationas described in the text (see Materials and Methods). The revers-ibility points (empty symbols) were not included in the nonlinearregression analysis. The inset shows the spectra of the native(dashed line) and of the enzyme in 8 M GdmCl (solid line). Allthe spectra were recorded at 20°C after 24-h incubation.
yi )yN + mN[X] i + (yD + mD[X] i) exp[(-∆GH2O - mg[X] i)/RT]
1+ exp[(-∆GH2O - mg[X] i)/RT](3)
[GdmCl]0.5 ) ∆GH2O/mg (4)
14626 Biochemistry, Vol. 41, No. 49, 2002 Chiaraluce et al.

spectrum. A plot ofλh as a function of the GdmCl concentra-tion showed a sigmoidal denaturant dependence with atransition midpoint at 6.7( 0.05 M (Figure 1). The sigmoidaldenaturation curve shown in Figure 1 indicates that theprocess follows a two-state mechanism without any detect-able intermediates. The fluorescence changes were reversible,as indicated by the identity of the variations in the intensity-averaged emission wavelength (λh) monitored during thetransitions (Figure 1). The enzyme activity was fullyrecovered after dilution of the denaturant. The∆GH2O andmg values were 15.4 and 2.3 kcal mol-1 M-1, respectively,as calculated by nonlinear regression fitting of the datareported in Figure 1 according to eqs 3 and 4. The∆GH2O
value is at the upper limit for a folded globular protein (i.e.,5-15 kcal/mol (30)), indicating the extreme stability of theP. furiosusenzyme.
Far-UV CD spectra were unchanged upon the increase ofGdmCl concentration (data not shown). This result wasconfirmed by the reconstitution of the spectra after SVD dataanalysis and by the random variation in magnitude and signof the two most significant columns of theV matrix as afunction of denaturant concentration. The lack of anymeasurable change by far-UV CD spectroscopy after incuba-tion of the enzyme in 7.9 M GdmCl, despite the largemodification of its intrinsic fluorescence properties, led tostudy the tertiary structure arrangement by near-UV CD. Thenear-UV CD spectrum of endoglucanase monitored afterincubation at pH 7.4 in 7.9 M GdmCl (Figure 2) shows thatthe 295-nm negative band is almost completely suppressed,the amplitude of the negative ellipticity signal in the 260-270-nm region is significantly reduced, and the fine-structurefeatures of the 275-290-nm region are preserved with anincrease in positive ellipticity. These results indicate that in7.9 M GdmCl at pH 7.4 the tertiary structure arrangementis altered but not completely suppressed. Incubation ofP.furiosusendoglucanase at increasing urea concentrations (0-9.9 M) did not result in any change of the enzyme spectralproperties. A complete suppression of the tertiary structurerequires the incubation of endoglucanase in 7.9 M GdmClat pH 2.0 (10 mM HCl) (Figure 2).
Effect of pH on the Enzyme Structure.The far-UV CDspectrum of theP. furiosusendoglucanase at pH 7.4 showsa local minimum at 215 nm and a maximum near 194 nm,typical for a protein with a significant content ofâ structure(31, 32). The spectrum is generally unchanged after 2-hincubation, a time that was established to be sufficient toreach equilibrium, at pH 3.0, 2.0 and 1.0 at 20°C (Figure3A) whereas the near-UV CD (Figure 3B) and the intrinsicfluorescence emission (Figure 3C) spectra show differentprofiles depending on the pH. At pH 3.0, the positive 272-
FIGURE 2: Effect of GdmCl on the near-UV CD spectrum ofP.furiosusendoglucanase. Near-UV CD spectra were recorded at 20°C in a 1-cm quartz cuvette at 0.6 mg/mL protein concentrationafter 24-h incubation of the protein in 20 mM Tris-HCl at pH 7.4(s), 7.9 M GdmCl at pH 7.4 (- -), and 7.9 M GdmCl at pH 2.0(‚ ‚ ‚).
FIGURE 3: Effect of pH on the spectral properties ofP. furiosusendoglucanase. (A) Far-UV CD spectra were recorded in a 0.01-cm quartz cuvette at 1.0 mg/mL. (B) Near-UV CD spectra wererecorded in a 1-cm quartz cuvette at 0.6 mg/mL protein concentra-tion. (C) Fluorescence spectra were recorded at 40µg/mL proteinconcentration (290 nm excitation wavelength). All the spectra wererecorded at 20°C after 24-h incubation of the protein at pH 7.4(20 mM Tris-HCl, s), pH 3.0 (1.0 mM HCl,‚ ‚ ‚), pH 2.0 (10.0mM HCl, - ‚ -), and pH 1.0 (100.0 mM HCl,- ‚‚ -).
Persistence of Tertiary Structure in 7.9 M GdmCl Biochemistry, Vol. 41, No. 49, 200214627

284-nm region is modified in comparison with the enzymeat neutral pH. The same alteration is observed in the near-UV CD spectrum of the protein at pH 1.0, which in additionshows a significant reduction in the amplitude of the negativedichroic bands at 266-272 and 295 nm (Figure 3B). At pH2.0, the near-UV CD spectrum is comparable to that of theenzyme at pH 7.4 with a minor change centered around 284nm. The intrinsic fluorescence emission spectra of endoglu-canase at pH 2.0 and pH 3.0 are closely similar, and bothreveal a 2.8-fold decrease of the fluorescence intensityaccompanied by a blue-shift of the maximal emissionwavelength from 342 to 335 nm in comparison with theenzyme at pH 7.4 (Figure 3C). At pH 1.0, the maximalemission wavelength is the same as that at pH 7.4, but thefluorescence intensity is 1.7-fold decreased (Figure 3C). Thechanges in the intrinsic fluorescence emission spectra inducedby acidic pH confirm that the tertiary structure is perturbedlocally but not completely suppressed.
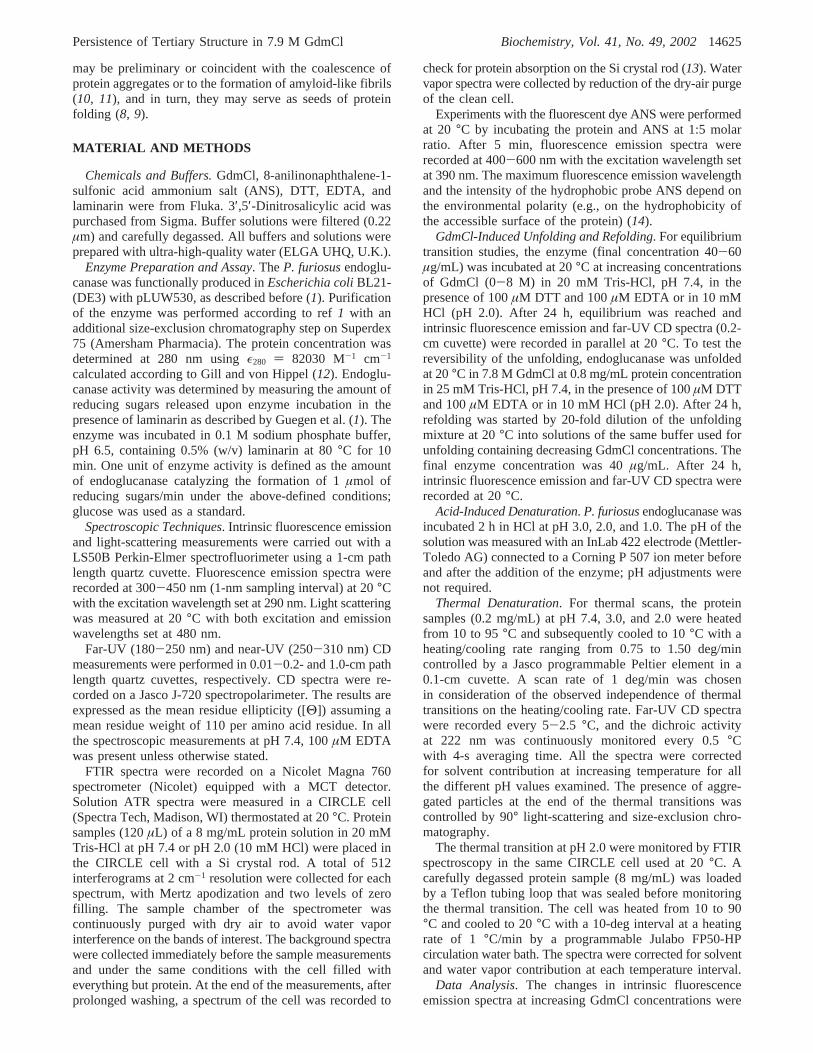
The accessibility of hydrophobic residues upon incubationof P. furiosusendoglucanase at pH 2.0 and pH 3.0 wasanalyzed by the fluorescent probe anilinonaphthalene-8-sulfonic acid (ANS). The fluorescence emission spectrumof ANS shows a notable increase in intensity and a blue-shift from 510 to 477 and 483 nm in the presence of theprotein at pH 2.0 and pH 3.0, respectively (Figure 4),suggesting that at pH 2.0, despite the presence of a nativelikenear-UV CD signal, the protein shows an increased exposureof hydrophobic surface area.
Estimation of the Enzyme Secondary Structure.Therelative content of the secondary structure elements insolution, estimated by SELCON 2 (33) on the far-UV CDspectra at pH 7.4, 3.0, 2.0, and 1.0 was at least 96% andranged over 5.8-8.4% R, 43.6-46.9% â, 20-26% turns,3.1-5% polyproline II, and 15.9-22.4% of other structures(Table 1). The relative amount ofR andâ structure was alsoconsistent with that determined by K2D program (34). Theseresults indicate that the endoglucanase relative secondarystructure composition is not significantly affected by a pHdecrease up to 1.0.
The relative secondary structure content was also analyzedby FTIR spectroscopy after deconvolution of the amide Iregion. At pH 7.4 seven individual peaks were observed,centered at 1689, 1680, 1670, 1664, 1653, 1632, and 1614cm-1 (Figure 5A). The main peak at 1632 cm-1 can beassigned toâ-sheets (23, 24) and corresponded to 53.0% ofthe total area of the amide I region (Table 2). The higherestimation of relativeâ-sheets content as compared to thatobtained by SELCON 2 on far-UV CD spectra (Table 1)may be attributed to the fact that in FTIR spectra thePolyProII band can overlap with the 1632 cm-1 band (35).The peak at 1653 cm-1, 28.0% of the amide I, is in a spectralregion whereR-helices and unordered structure can equallycontribute (21, 23, 24). The peak at 1689 was assigned toantiparallelâ-sheets and aggregated strands and correspondedto 2.1% of the total area of the amide I region (24, 26, 28).The peaks at 1680, 1670, and 1664 cm-1 were assigned toturns (22-25, 28) and corresponded to 16.9% of the totalarea of the amide I region. The peak at 1614 cm-1 can beassigned to the vibrations of the tyrosine ring (36). At pH2.0 the amide I region is closely similar to that at pH 7.4,and the deconvolution of the region showed only minorstructural changes localized in the 1690-1660-cm-1 region(Table 2) and a modest increase at 1614 cm-1(Figure 5B).The similarity in secondary structure elements at pH 7.4 andpH 2.0 is on line with the results obtained by far-UV CDspectroscopy. Secondary structure prediction, performedaccording to Rost (37), shows the presence of twoR-helicesin the regions corresponding to positions 82-88 and 243-249 and 14â-strands in the positions 48-54, 93-96, 99-104, 118-125, 129-133, 136-142, 152-156, 172-177,184-189, 217-224, 229-234, 237-239, 258-264, and284-297. This pattern is typical for family 16â-endoglu-canase (3).
Equilibrium Transition Studies in GdmCl at pH 2.0.AtpH 2.0, incubation of endoglucanase in the presence ofGdmCl induces structural changes, as indicated by thealterations of the far-UV CD and fluorescence spectra (Figure2). The far-UV CD spectra analyzed at 220 nm upon increaseof denaturant concentration show a decrease of the negativeellipticity above 4 M GdmCl with a small amplitudetransition (Figure 6A). The changes in the far-UV CD spectrainduced by GdmCl are reversible only above 4 M denaturantconcentration, below this concentration the enzyme does notregain its native dichroic activity (Figure 6A). The globalchanges in the spectral 213-250-nm region were analyzedby SVD, which indicates that only two spectral componentscontribute to the far-UV CD spectra. The most significantsingular values are 51.5, 8.4, and 2.8. All the other singularvalues are below 10% of the largest singular value andprogressively decrease approaching to zero. A plot of thefirst and the second columns of theV matrix (V1 andV2) asa function of GdmCl concentration (data not shown) shows
FIGURE 4: Relative accessibility of hydrophobic residues inP.furiosusendoglucanase monitored by the extrinsic fluorescence ofANS. ANS (7.5µM) was added to the protein (1.5µM) previouslyincubated 24 h at pH 7.4 (20 mM Tris-HCl, dashed line), pH 3.0(1.0 mM HCl, dotted line), and pH 2.0 (10.0 mM HCl, continuousline). Fluorescence emission spectra (390 nm excitation wavelength)were recorded at 20°C 10 min after the addition of ANS.
Table 1: Relative Content ofP. furiosusEndoglucanase SecondaryStructure Estimated by SELCON 2
pHR
(%)â
(%)turns(%)
PolyProII(%)
other(%)
total(%)
7.4 6.3 45.0 19.0 5.0 22.4 97.73.0 8.4 45.0 25.0 5.5 15.9 99.82.0 5.8 46.9 21.3 5.1 20.9 1001.0 8.3 43.6 23.4 3.1 17.6 96.0
14628 Biochemistry, Vol. 41, No. 49, 2002 Chiaraluce et al.

transition profiles comparable to those observed by monitor-ing the 220-nm ellipticity changes.
The changes in the fluorescence spectra at denaturantconcentration lower than 4 M are mainly due to the increasein fluorescence intensity (Figure 6B). Intrinsic fluorescenceemission intensity progressively increases up to 3.5-foldbetween 0 and 4 M GdmCl concomitantly with a first red-shift of the maximum fluorescence emission wavelength from335 to 345 nm (Figure 6C). Above 4 M denaturant, themaximum fluorescence emission wavelength abruptly shiftsto 360 nm with a sigmoidal profile whereas the intrinsicfluorescence emission intensity, after a 30% decrease be-tween 3.6 and 4.8 M GdmCl, increases up to 8.0 M
denaturant (Figure 6B,C). The total amplitude of the intrinsicfluorescence emission intensity changes during the transitioncorresponds to a 4.5-fold increase. Similarly to far-UV CDspectral properties, reversibility was observed only above 4M denaturant concentration (Figure 6B).
Thermal Unfolding.The enzyme did not show any far-UV CD spectral change upon heating from 10 to 95°C atpH 7.4 and pH 3.0 (data not shown). At pH 2.0, however,the thermal transition was characterized by remarkablechanges of the far-UV CD spectral properties, in the absenceof an isodichroic point (Figure 7). In particular, the progres-sive blue-shift of the zero intercept is accompanied by adecrease of the positive ellipticity at 194 nm and by a generalincrease of the negative ellipticity (Figure 7). At 90°C thespectrum is characterized by a minimum at 205 nm and bythe absence of positive ellipticity. The temperature-inducedellipticity changes at 208 and 198 nm, where the mainamplitude was observed, occur in comparable non-two-statetransitions, as shown in the inset of Figure 7. The nativeellipticity could be restored up to about 60°C during thecooling phase, below this temperature the thermal transitionwas irreversible (Figure 7, inset).
These results were paralleled by the data obtained fol-lowing the temperature-induced changes on the FTIR spectraof the enzyme at pH 2.0 after deconvolution of the amide Iregion. At 90°C, similarly to the spectrum deconvolutionat 20°C, six individual peaks were observed at 1689, 1680,1664, 1653, 1632, and 1614 cm-1, and only the peak centeredat 1670 cm-1 was absent. The main peak at 1632 cm-1 wasconsistently reduced to 32.9% of the total area of the amideI region (Table 2) whereas the peak at 1653 cm-1, which isin a spectral region whereR-helices and unordered structurecan equally contribute, was increased to 38.3%. The decreasein the amount of secondary structure elements at 90°C wasparalleled by an increased contribution of tyrosine ringvibrations at 1614 cm-1. The peaks assigned to turnsincreased to 26.5% of the total amide I area at 90°C, withthe prevalence of the peak at 1680 cm-1 over the others(Table 2). Reversibility was observed up to about 60°Cduring the cooling phase, similar to what was described forthe ellipticity changes induced by temperature at pH 2.0.
DISCUSSION
The P. furiosusendoglucanase exhibits an outstandingstability against chemical and physical denaturation. Theenzyme structure is in fact preserved under extreme condi-tions such as 95°C at pH 3.0 and 7.9 M GdmCl. The tertiarystructure perturbation induced by GdmCl and monitored byfluorescence changes is not accompanied by any measurable
FIGURE 5: Effect of pH on the amide spectra ofP. furiosusendoglucanase. Solution ATR-FTIR spectra of 8 mg/mL proteinwere measured in a CIRCLE cell with a Si crystal rod at 20°C in20 mM Tris-Cl at pH 7.4 (A) and at pH 2.0 (B). A total of 512interferograms at 2 cm-1 resolution were collected for eachspectrum. Deconvolution of the amide spectrum was used to identifythe individual components in the amide I region by curve-fittingof the raw spectrum. The panels show the second derivative of theraw spectra.
Table 2: Peak Position and Secondary Structure Assignment of theAmide I Bands ofP. furiosusEndoglucanase
area (%)
pH 2.0peak
position(cm-1)
pH7.4 20°C 90°C assignment
1689 2.1 3.8 2.3 antiparallelâ-sheets andaggregated strands
1680 7.9 5.7 24.7 turns1670 2.9 4.2 0.0 turns1664 6.1 5.3 1.8 turns1653 28.0 30.1 38.3 R-helices and unordered structure1632 53.0 50.9 32.9 â-sheets
Persistence of Tertiary Structure in 7.9 M GdmCl Biochemistry, Vol. 41, No. 49, 200214629

perturbation of the secondary structure elements. The dis-crepancy between the tertiary structure changes and thestability of the secondary structure elements is particularly
interesting because the far-UV CD signal during the titrationswith the denaturant is unchanged up to 8 M GdmCl. Theanalysis of the near-UV CD spectrum of the protein in 7.9M GdmCl indicates that the tertiary structure arrangementis altered but not suppressed because the disappearance ofthe 295-nm band of Trp is not paralleled by the loss of theasymmetric environment for all the aromatic residues thatstill contribute to the fine structure of the spectrum. Thesuppression of the 295 nm band and the concomitant red-shift of the intrinsic fluorescence maximum emission wave-length indicate that the change in the asymmetric environ-ment for Trp residues is accompanied, at least in part, bysolvent exposure. The reversible sigmoidal transition of thefluorescence changes upon denaturant addition suggests atwo-state process, which leads to the formation of a 7.9 MGmCl state with the same secondary structure elements ofthe native state and with a different tertiary arrangement.The presence of residual structural elements at high con-centration of GdmCl has been reported for different proteins(8, 38, 39). P. furiosusendoglucanase is, to the best of ourknowledge, the first protein that retains residual tertiarycontacts still locked in 7.9 M GdmCl.
Interestingly, the proteins containing residual structuralelements at high GdmCl concentrations are mostly character-ized byâ-structure, which may form hydrophobic clustersin antiparallelâ-sheet at high denaturant concentration (8,9, 40). The P. furiosusendoglucanase has indeed a highcontent of â structure, as indicated by the comparableestimation of its secondary structure elements by deconvo-lution of far-UV CD and FTIR spectra, which both indicatethe prevalence ofâ elements (about 50%) over othersecondary structure elements. A high content ofâ structure,as determined by far-UV CD spectroscopy, characterizes alsothe thermophilic family 16 endoglucanase fromRhodother-mus marinus(7). This is a common feature of family 16glycosyl hydrolases (2) to whichP. furiosusendoglucanasehas been assigned on the basis of its primary structure (1).
FIGURE 6: GdmCl-induced spectral changes ofP. furiosusendo-glucanase at pH 2.0. (A) Far-UV CD changes at 220 nm (b, O)monitored in a 0.2-cm quartz cuvette. (B) Intrinsic relative intensityfluorescence (b, O). (C) Maximum emission wavelengthλmax (9,0) changes. The dotted lines have the purpose to guide the eye ofthe reader and do not represent the fitting of the data. Reversibilitypoints are indicated by empty symbols. All the spectra wererecorded at 20°C after 24-h incubation at the indicated GdmClconcentrations at 40µg/mL protein concentration.
FIGURE 7: Thermal denaturation ofP. furiosusendoglucanase atpH 2.0. The far-UV CD spectra were monitored at 5°C intervalduring the heating cycle (10-95 °C). The spectra are reported afterremoval of the high-frequency noise and the low-frequency randomerror by SVD. The inset shows the molar ellipticity changes at 208nm (b, O) and at 198 nm (9, 0) during the heating cycle. Emptysymbols represent the molar ellipticity changes monitored duringthe cooling cycle.
14630 Biochemistry, Vol. 41, No. 49, 2002 Chiaraluce et al.

The presence of antiparallelâ-sheets and turns revealed bydeconvolution of the amide I region suggests also forP.furiosus endoglucanase a compact jellyroll-typeâ-sheetstructure according to the 3D structure analysis of family16 glycosyl hydrolases (2). These proteins share a similarfold usually characterized by 12-14 antiparallelâ-strandsarranged in two sheets that pack against each other (6). Theidentification in P. furiosusendoglucanase, by secondarystructure prediction (37), of 14 â-strands is in line with theassignment of this protein to the family 16 glycosyl hydro-lases. These proteins fold into a compact jellyroll-typeâ-sheet structure like the concanavalin A-like lectins, a familyof carbohydrate binding proteins with high values of con-formational stability mainly related to intersubunit interac-tions (41, 42). Notably, in P. furiosusendoglucanase theâ-strands corresponding to residues 217-224, 258-264, and284-297 are mainly composed of aromatic and hydrophobicamino acid residues with a very low relative solventaccessibility (37). These hydrophobic clusters may beinvolved in hydrophobic interactions possibly responsible forthe presence of residual structure in 7.9 M GdmCl, similarto what was reported for other proteins (8, 40).
The thermodynamic parameters derived from the fluores-cence changes upon increasing GdmCl are suggestive of thehigh intrinsic stability of the archaeal endoglucanase with a∆GH2O of 15.4 kcal/mol, a value at the upper limit of thestability for a globular protein, and a transition midpoint at6.7 M GdmCl. The presence of a significant residual structureat 7.9 M GdmCl clearly indicates that the∆G measurementmay not reflect the free energy difference between the uniquenative state and the denatured states. Hence the value of 15.4kcal/mol is almost surely a lower limit on the stability ofP.furiosusendoglucanase. The analysis of the effect of pH onthe protein spectral properties showed that the secondarystructure elements are preserved down to pH 1.0 whereasonly the protein at pH 2.0 shows a near-UV CD spectrumclosely similar to that at pH 7.4. This result indicates that atpH 2.0 the increased exposure of the hydrophobic residuesmay not significantly affect the tertiary structure arrangementand led us to study the combined effect of low pH anddenaturant on the protein structural stability. The analysisof the spectral changes induced by GdmCl at pH 2.0 indicatesa complex process. The identification, by SVD analysis ofthe far-UV CD data, of two spectral components that bothrespond in a concerted manner to GdmCl-induced changessuggests that the differences observed among the transitionprofiles monitored by ellipticity, intrinsic fluorescenceintensity, and maximum emission wavelength are not relatedto the presence of distinct partially folded forms withdifferent secondary structure arrangements. The increase innegative ellipticity observed between 0.5 and 3 M GdmClmay be ascribed to the different contribution of the 11 Trpresidues to the far-UV CD spectrum (43), which would bein agreement with the concomitant changes in intrinsicfluorescence intensity. The changes in secondary structure,indeed, occur between 3.0 and 5.0 M GdmCl and areparalleled by the exposure of Trp residues as indicated bythe red-shift of the fluorescence maximum emission wave-length.
The relevant stability ofP. furiosusendoglucanase is alsoshown by the lack of effect of temperature on the secondarystructure elements, which are all preserved up to 90°C at
pH 7.4 and pH 3.0. The far-UV CD spectral changesobserved during the thermal transition at pH 2.0 arecharacterized by a general increase of the negative ellipticityand may be tentatively ascribed to different contribution ofaromatic residues to the far-UV CD spectrum (43), to anincrease in turns (44), and/or to unordered structure (45). Acomparative analysis of the FTIR spectral changes observedat 90°C at pH 2.0 indicates that the secondary structure isaltered, mainly because of the relative increase ofâ turnsaccompanied by a decrease ofâ-sheets. The changes in therelative contributions of the different secondary structureelements clearly show that the secondary structure is reducedbut not abolished and suggest that the protein at 90°C andpH 2.0 is in a “partially denatured” state.
The residual structure present after thermal unfolding isin line with the results obtained in the presence of GdmCland points to a significant structural stability of this protein.The structured denatured states, observed inâ-proteins richin hydrophobic clusters, have been related with the hypoth-esis that they may serve as “seeds” to initiate the foldingprocess (8, 40). The specific regions ofP. furiosusendo-glucanase primary sequence rich in hydrophobic amino acidresidues with a very low solvent accessibility may formhydrophobic clusters responsible of the persistence of residualtertiary structure under extremely denaturing conditions. Theselection of specific sites for mutagenesis to identify the roleplayed by individual residues in the formation of highlyresistantâ strands should be supported by the resolution ofthe crystal structure. A relevant number of primary sequencesof family 16 enzymes is available; however, the crystalstructure is known only for a few mesophilic glycosylhydrolases (46) from this family, and three-dimensional datafrom hyperthermophilic sources are not available.
REFERENCES
1. Gueguen, Y., Voorhorst, W. G., van der Oost, J., and de Vos, W.M. (1997) Molecular and biochemical characterization of an endo-â-1,3-glucanase of the hyperthermophilic archaeonPyrococcusfuriosus, J. Biol. Chem. 272, 31258-31264.
2. Henrissat, B., and Coutinho, P. M. (2001) Classification ofglycoside hydrolases and glycosyltransferases from hyperthermo-philes,Methods Enzymol. 330, 183-201.
3. Planas, A. (2000) Bacterial 1,3-1,4-â-glucanases: structure, func-tion and protein engineering,Biochim. Biophys. Acta 1543, 361-382.
4. Murzin, A. G., Brenner, S. E., Hubbard, T., and Chothia, C. (1995)SCOP: a structural classification of proteins database for theinvestigation of sequences and structures,J. Mol. Biol. 247, 536-540.
5. Krah, M., Misselwitz, R., Politz, O., Thomsen, K. K., Welfle, H.,and Borriss, R. (1998) The laminarinase from thermophiliceubacteriumRhodothermus marinus. Conformation, stability, andidentification of active site carboxylic residues by site-directedmutagenesis,Eur. J. Biochem. 257, 101-111.
6. Otzen, D. E., Christiansen, L., and Schulein, M. (1999) Acomparative study of the unfolding of the endoglucanase Cel45from Humicola insolensin denaturant and surfactant,Protein Sci.8, 1878-1887.
7. Peumans, W. J., Barre, A., Derycke, V., Rouge, P., Zhang, W.,May, G. D., Delcour, J. A., Van Leuven, F., and Van Damme, E.J. (2000) Purification, characterization and structural analysis ofan abundantâ-1,3-glucanase from banana fruit,Eur. J. Biochem.267, 1188-1195.
8. Koepf, E. K., Petrassi, H. M., Sudol, M., and Kelly, J. W. (1999)WW: An isolated three-stranded antiparallelâ-sheet domain thatunfolds and refolds reversibly; evidence for a structured hydro-phobic cluster in urea and GdnHCl and a disordered thermalunfolded state,Protein Sci. 8, 841-853.
Persistence of Tertiary Structure in 7.9 M GdmCl Biochemistry, Vol. 41, No. 49, 200214631

9. Klein-Seetharaman, J., Oikawa, M., Grimshaw, S. B., Wirmer,J., Duchardt, E., Ueda, T., Imoto, T., Smith, L. J., Dobson, C.M., and Schwalbe, H. (2002) Long-range interactions within anonnative protein,Science 295, 1719-22.
10. Radford, S. E. (2000) Protein folding: progress made and promisesahead,Trends Biochem. Sci. 25, 611-618.
11. Yutani, K., Takayama, G., Goda, S., Yamagata, Y., Maki, S.,Namba, K., Tsunasawa, S., and Ogasahara, K. (2000) The processof amyloid-like fibril formation by methionine aminopeptidasefrom a hyperthermophile,Pyrococcus furiosus, Biochemistry 39,2769-2777.
12. Gill, S. C., and von Hippel, P. H. (1989) Calculation of proteinextinction coefficients from amino acid sequence data,Anal.Biochem. 182, 319-326.
13. Oberg, K. A., and Fink, A. L. (1998) A new attenuated totalreflectance Fourier transform infrared spectroscopy method forthe study of proteins in solution,Anal. Biochem. 256, 92-106.
14. Anderson, S., and Weber, G. (1966) The reversible acid dissocia-tion and hybridization of lactic dehydrogenase,Arch. Biochem.Biophys. 116, 207-223.
15. Royer, C. A., Mann, C. J., and Matthews, C. R. (1993) Resolutionof the fluorescence equilibrium unfolding profile of trp apore-pressor using single tryptophan mutants,Protein Sci. 2, 1844-1852.
16. Henry, E. R., and Hofrichter, J. (1992) Singular value decomposi-tion: application to analysis of experimental data,MethodsEnzymol. 210, 129-192.
17. Johnson, W. C., Jr. (1992) Analysis of circular dichroism spectra,Methods Enzymol. 210, 426-447.
18. Ionescu, R. M., Smith, V. F., O’Neill, J. C., Jr., and Matthews, C.R. (2000) Multistate equilibrium unfolding ofEscherichia colidihydrofolate reductase: thermodynamic and spectroscopic de-scription of the native, intermediate, and unfolded ensembles,Biochemistry 39, 9540-9550.
19. Clark, A. H., Saunderson, D. H., and Suggett, A. (1981) Infraredand laser-Raman spectroscopic studies of thermally inducedglobular protein gels,Int. J. Pept. Protein Res. 17, 353-364.
20. Susi, H., and Byler, D. M. (1983) Protein structure by Fouriertransform infrared spectroscopy: second derivative spectra,Bio-chem. Biophys. Res. Commun. 115, 391-397.
21. Casal, H. L., Kohler, U., and Mantsch, H. H. (1988) Structuraland conformational changes ofâ-lactoglobulin B: an infraredspectroscopic study of the effect of pH and temperature,Biochim.Biophys. Acta 957, 11-20.
22. Arrondo, J. L. R., Muga, A., Castresana, J., Bernabeu, C., andGoni, F. M. (1989) An infrared spectroscopic study ofâ-galac-tosidase structure in aqueous solution,FEBS Lett. 252, 118-120.
23. Arrondo, J. L., Castresana, J., Valpuesta, J. M., and Goni, F. M.(1994) Structure and thermal denaturation of crystalline andnoncrystalline cytochrome oxidase as studied by infrared spec-troscopy,Biochemistry 33, 11650-11655.
24. Jackson, M., and Mantsch H. H. (1995) The use and misuse ofFTIR spectroscopy in the determination of protein structure,Crit.ReV. Biochem. Mol. Biol. 30, 95-120.
25. Xie, L., Jing, G. Z., and Zhou, J. M. (1996) Reversible thermaldenaturation of staphylococcal nuclease: a Fourier transformedinfrared spectrum study,Arch. Biochem. Biophys. 328, 122-128.
26. Dong, A., Kery, V., Matsuura, J., Manning, M. C., Kraus, J. P.,and Carpenter, J. F. (1997) Secondary structure of recombinanthuman cystathionine beta-synthase in aqueous solution: effect ofligand binding and proteolytic truncation,Arch. Biochem. Biophys.344, 125-132.
27. Fabian, H., Falber, K., Gast, K., Reinstadler, D., Rogov, V. V.,Naumann, D., Zamyatkin, D. F., and Filimonov, V. V. (1999)Secondary structure and oligomerization behavior of equilibriumunfolding intermediates of theλ Cro repressor,Biochemistry 38,5633-5642.
28. Garcia-Garcia, J., Gomez-Fernandez, J. C., and Corbalan-Garcia,S. (2001) Structural characterization of the C2 domain of novelprotein kinase Cε, Eur. J. Biochem. 268, 1107-1117.
29. Santoro, M. M., and Bolen, D. W. (1988) Unfolding free energychanges determined by the linear extrapolation method. 1.Unfolding of phenylmethanesulfonyl alpha-chymotrypsin usingdifferent denaturants,Biochemistry 27, 8063-8068.
30. Pace, C. N. (1990) Conformational stability of globular proteins,Trends Biochem. Sci. 15, 14-17.
31. Woody, R. W. (1995) Circular dichroism,Methods Enzymol. 246,34-71.
32. Tilstra, L., and Mattice, W. L. (1996) Theâ sheet D coil transitionof polypeptides, as determined by circular dichroism, inCircularDichroism and the Conformational Analysis of Biomolecules(Fasman, G. D., Ed.) pp 261-283, Plenum Press, New York.
33. Deleage, G., and Geourjon, C. (1993) Dicroprot: An interactivegraphic program for calculating the secondary structures contentof proteins from circular dichroism spectrum,Comput. Appl.Biosci. 9, 197-199.
34. Greenfield, N. J. (1996) Methods to estimate the conformation ofproteins and polypeptides from circular dichroism data,Anal.Biochem. 235, 1-10.
35. Malin, E. L., Alaimo, M. H., Brown, E. M., Aramini, J. M.,Germann, M. W., Farrell, H. M., Jr., McSweeney, P. L., and Fox,P. F. (2001) Solution structures of casein peptides: NMR, FTIR,CD, and molecular modeling studies of alphas1-casein, 1-23, J.Protein Chem. 20, 391-404.
36. Barth, A. (2000) The infrared absorption of amino acid side chains,Prog. Biophys. Mol. Biol. 74, 141-73.
37. Rost, B. (1996) PHD: predicting one-dimensional protein structureby profile-based neural networks,Methods Enzymol. 266, 525-539.
38. Kuwajima, K., Yamaya, H., and Sugai, S. (1996) The burst-phaseintermediate in the refolding ofâ-lactoglobulin studied by stopped-flow circular dichroism and absorption spectroscopy,J. Mol. Biol.264, 806-822.
39. Shortle, D., and Ackerman, M. S. (2001) Persistence of native-like topology in a denatured protein in 8 M urea,Science 293,487-489.
40. Martensson, L. G., Jonsson, B. H., Freskgard, P. O., Kihlgren,A., Svensson, M., and Carlsson, U. (1993) Characterization offolding intermediates of human carbonic anhydrase II: probingsubstructure by chemical labeling of SH groups introduced bysite-directed mutagenesis,Biochemistry 32, 224-231.
41. Loris, R. (2002) Principles of structures of animal and plant lectins,Biochim. Biophys. Acta 1572, 198-208.
42. Mitra, N., Srinivas, V. R., Ramya, T. N., Ahmad, N., Reddy, G.B., and Surolia, A. (2002) Conformational stability of legumelectins reflect their different modes of quaternary association:solvent denaturation studies on concanavalin A and winged beanacidic agglutinin,Biochemistry 41, 9256-9263.
43. Woody, R. W. (1996) Aromatic and cystine side-chain circulardichroism proteins, inCircular Dichroism and the ConformationalAnalysis of Biomolecules(Fasman, G. D., Ed.) pp 109-157,Plenum Press, New York.
44. Perczel, A., and Hollosi, M. (1996) Turns, inCircular Dichroismand the Conformational Analysis of Biomolecules(Fasman, G.D., Ed.) pp 285-380, Plenum Press, New York.
45. Privalov, P. L., Tiktopulo, E. I., Venyaminov, S. Yu., Griko, Yu.V., Makhatadze, G. I., and Khechinashvili, N. N. (1989) Heatcapacity and conformation of proteins in the denatured state,J.Mol. Biol. 205, 737-750.
46. Coutinho, P. M., and Henrissat, B. (1999) Carbohydrate-ActiveEnzymes (http://afmb.cnrs-mrs.fr/∼pedro/CAZY/db.html).
BI026498U
14632 Biochemistry, Vol. 41, No. 49, 2002 Chiaraluce et al.