Embed Size (px)
Citation preview
PIM
Lokalizace a odstranění příčin pasivních intermodulací v anténních systémech a jejich okolí
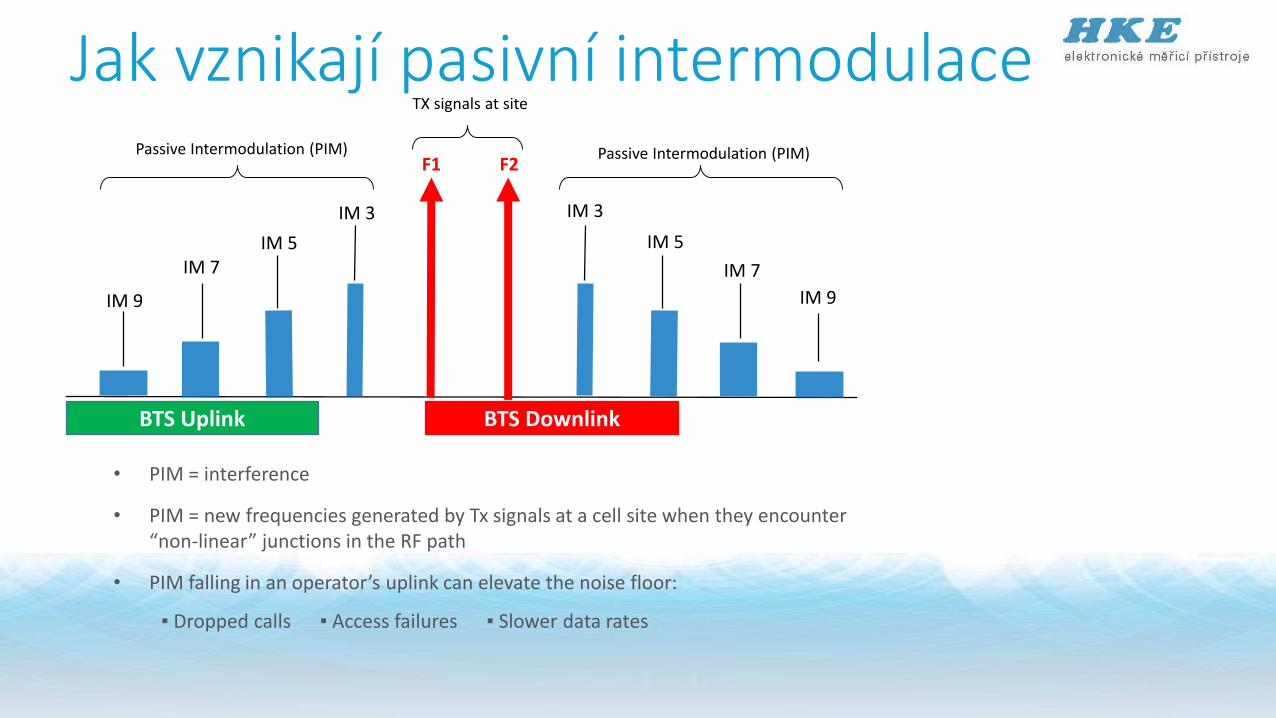
• PIM = interference
• PIM = new frequencies generated by Tx signals at a cell site when they encounter “non-linear” junctions in the RF path
• PIM falling in an operator’s uplink can elevate the noise floor:
▪ Dropped calls ▪ Access failures ▪ Slower data rates
F1 F2
IM 3
IM 5IM 7
IM 9
IM 3
IM 5
IM 7
IM 9
TX signals at site
Passive Intermodulation (PIM)Passive Intermodulation (PIM)
BTS DownlinkBTS Uplink
Jak vznikají pasivní intermodulace

Cu
rren
t
Voltage
Linear junctions
Non-Linear junctions
• Current increases linearly with applied voltage
• High pressure, metal-to-metal contacts
• Welded or soldered connections.
• Current does not increase linearly with voltage
• Low pressure, metal-to-metal contacts
• Oxide layers on metal surfaces
• Arcing across small air gaps or cracks
Co je nelinearita

Loose copper
Metal flakes
Metal folded on itself
Poor connector termination
Nelinearity v anténních systémech
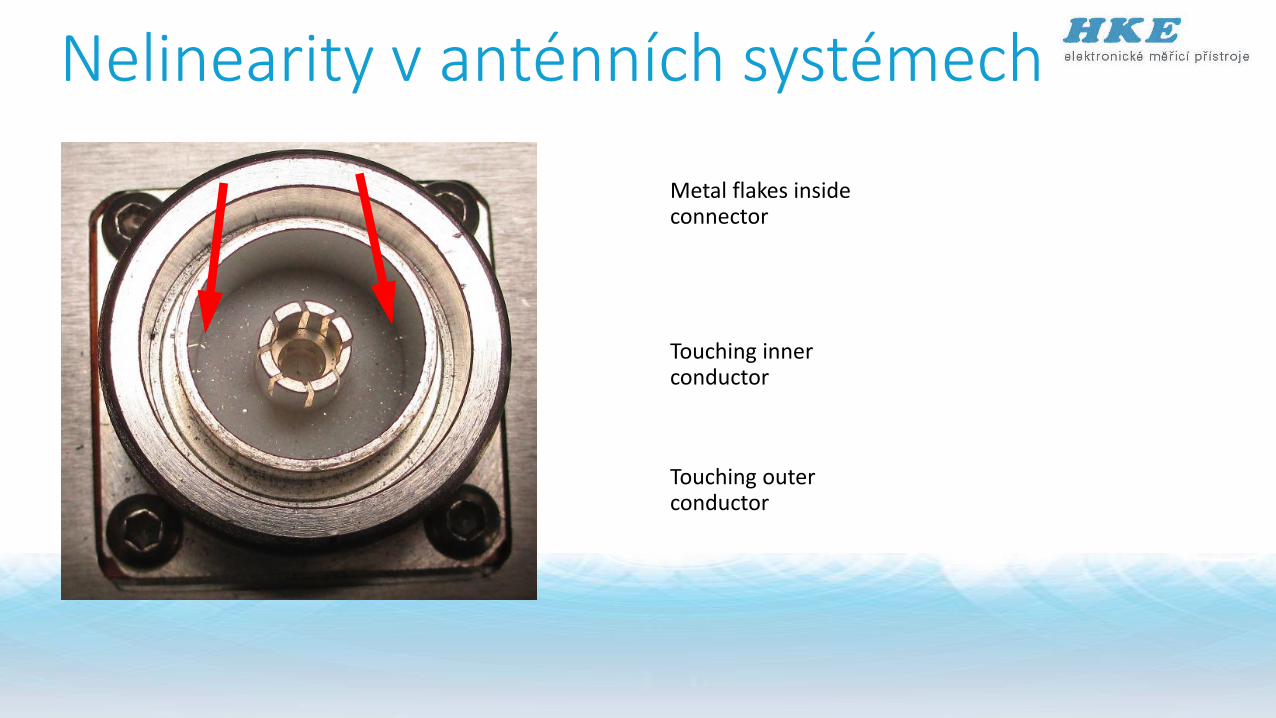
Touching outer conductor
Metal flakes inside connector
Touching inner conductor
Nelinearity v anténních systémech

Connectors only hand tightened
Must be torqued with at torque wrench
Nelinearity v anténních systémech

Rusty mounting brackets
Metal objects in front of antennas
Nelinearity v anténních systémech
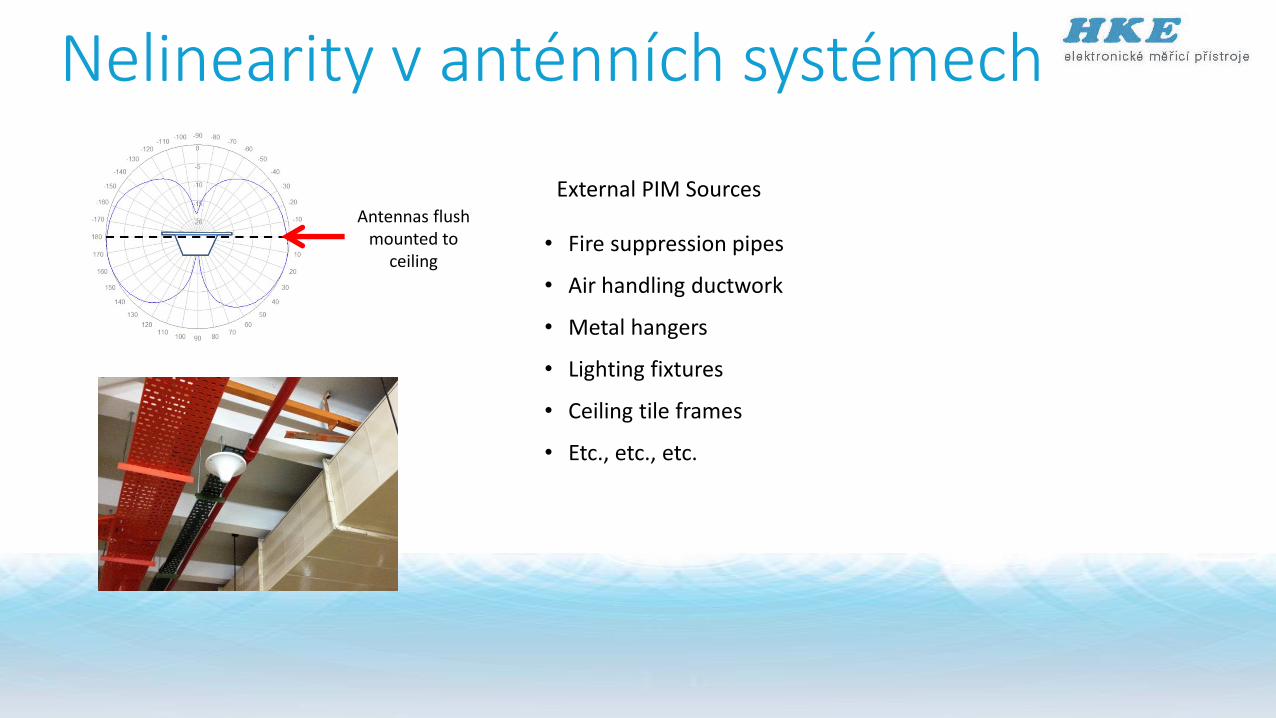
Antennas flush mounted to
ceiling
External PIM Sources
• Fire suppression pipes
• Air handling ductwork
• Metal hangers
• Lighting fixtures
• Ceiling tile frames
• Etc., etc., etc.
Nelinearity v anténních systémech

PIM
Mobile uplink signal
30 dB
Měření spektrálním analyzátorem

X
20 dB
15 dB
15 dB
• Low order IM products (IM3 & IM5) are higher magnitude than high order products (IM7, IM9, etc)
• Higher magnitude = more likely to cause interference
• Does not mean IM7, IM9, etc. are never a problem… just less likely
DownlinkUplink
“X” characterizes the linearity of the system
Amplituda PIM

F1 F2IM 3IM 5IM 7IM 9 IM 3 IM 5 IM 7 IM 9
200 KHz200 KHz
600 KHz
1 MHz
1.4 MHz
1.8 MHz
600 KHz
1 MHz
1.4 MHz
1.8 MHz
• PIM bandwidth increases as carrier bandwidth increases
• PIM bandwidth increase with PIM order
X
3X
5X
7X
9X
3X
5X
7X
9X
X
Šířka pásma PIM
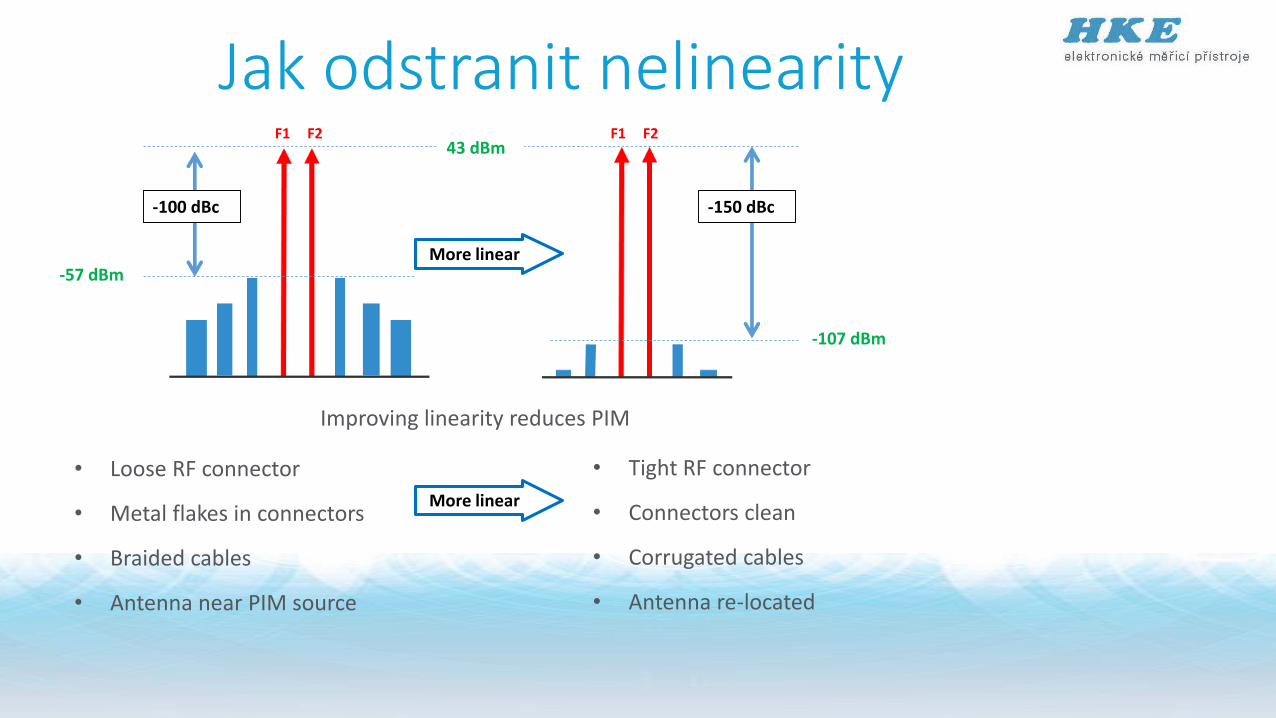
-57 dBm
-100 dBc -150 dBc
F1 F243 dBm
-107 dBm
F1 F2
More linear
• Loose RF connector
• Metal flakes in connectors
• Braided cables
• Antenna near PIM source
• Tight RF connector
• Connectors clean
• Corrugated cables
• Antenna re-located
More linear
Improving linearity reduces PIM
Jak odstranit nelinearity

• With a PIM tester!
• Inject two CW test signals at a known magnitude
• Measure 3rd order intermodulation product (IM3)
• IM3 “characterizes” the linearity of the system
• If IM3 is low = linearity is good
• If IM3 is high = linearity is poor
Load
IM products
F1, F2
F1, F2
AN
TEN
NAPIM
IM products
Test lead
PIM tester
Jak se nelinearita změří

• Take good care of your equipment
• Verify PIM performance daily before use
• Test equipment PIM must be 10 dB lower than the system you will test
Example: Customer spec: <-140 dBc (<-97 dBm)
Test equipment: <-150 dBc (<-107 dBm)
Load
IM products
F1, F2
F1, F2
AN
TEN
NA
IM products
Test lead
PIM tester
PIM
I analyzátor může generovat PIM
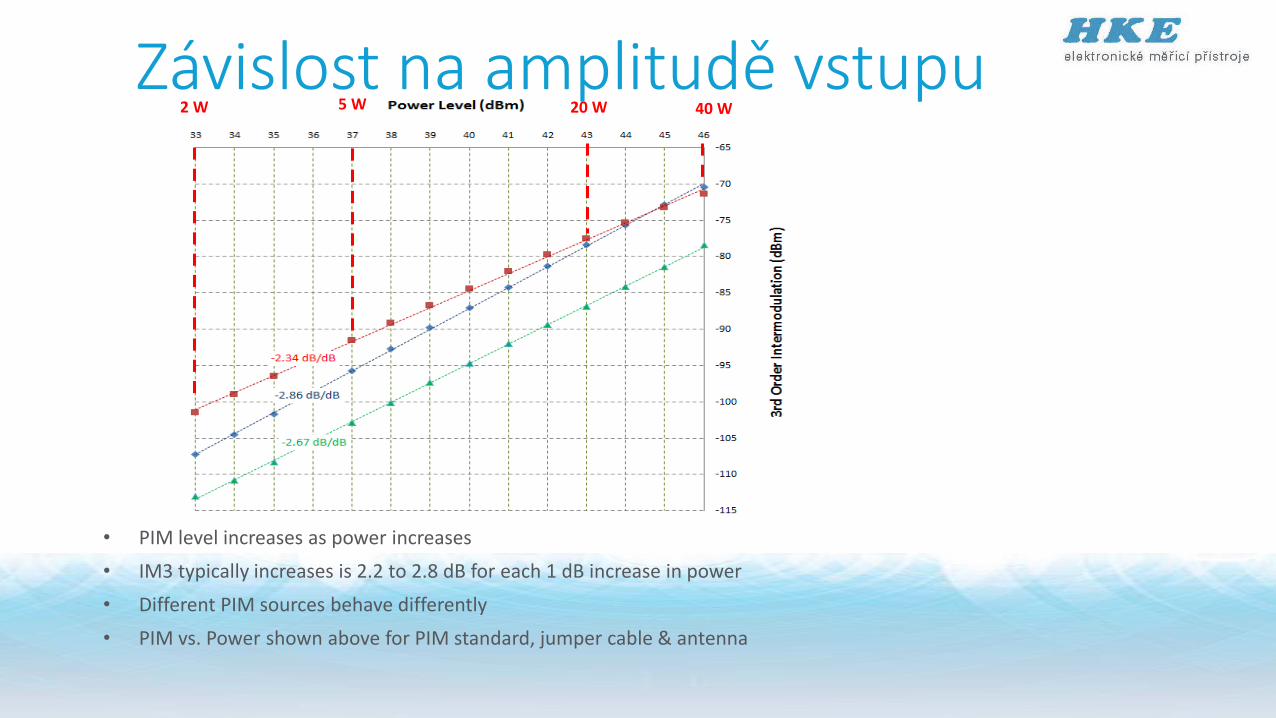
• PIM level increases as power increases
• IM3 typically increases is 2.2 to 2.8 dB for each 1 dB increase in power
• Different PIM sources behave differently
• PIM vs. Power shown above for PIM standard, jumper cable & antenna
2 W 20 W 40 W5 WZávislost na amplitudě vstupu

• Control PIM Master using web browser software on Wi-Fi enabled device (tablet, phone, laptop PC)
• Safari 6, Internet Explorer 10, Chrome 30, FireFox 23 (or later)
• Firmware v1.15 (or greater)
• ZyXEL MWR102 router (or equiv.)
• Range: >100m (328FT) line-of-site
See Application Note 11410-00784 for step-by-step instructions
PIM Master – wifi ovládání
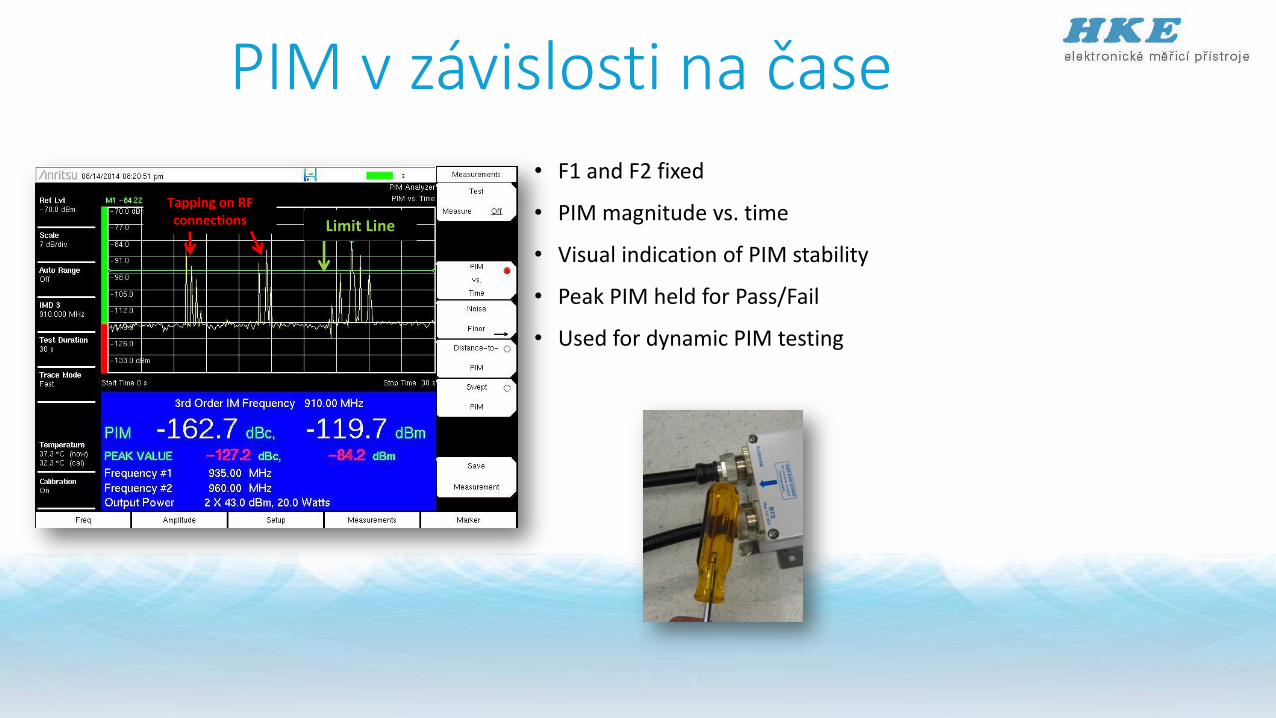
• F1 and F2 fixed
• PIM magnitude vs. time
• Visual indication of PIM stability
• Peak PIM held for Pass/Fail
• Used for dynamic PIM testing
Tapping on RF connections Limit Line
PIM v závislosti na čase

• Measures IM frequency with transmitters turned OFF
• Verify no external interference
• If interference:
• Turn off all cell phones
• Change test frequencies
External interference
Test tones OFF
Signal level at IM frequency vs. TIME
Šumové pozadí –první test

F1 F2
IM 3
F1 F2
IM 3
• F2 moved 6.5 MHz
• Noise reduced 60 dB
IM3 in guard bandNo mobile traffic
IM3 in uplinkHigh mobile traffic
6.5 MHz
BTS Downlink BTS UplinkBTS Uplink
Posun mimo oblast citlivosti

• F1 fixed, F2 swept
• F2 fixed, F1 swept
• PIM magnitude vs. frequency
• Shows worst case PIM level
• 30 dB variation due to phasing!
Multiple PIM signals on a line combining in and out of phase
45 dB
Rozmítané měření PIM

• F1 fixed, F2 swept
• PIM magnitude vs. distance
• The fastest way to locate PIM
• See PIM beyond the antenna
• 6 markers + marker table
PIM location
DTP – Distance to PIM

• Compare two DTP measurements
• Automatically displays distance between peaks
• Useful for:
• Showing “before” & “after” results
• Identifying PIM beyond the antenna
• Saving the measurement keeps both traces for reports
Relative distance
Active trace
Overlay trace
Překrytí DTP náměrů

• Green trace = DTP with steel wool on antenna radome• Yellow trace = DTP with steel wool removed
• Both peaks occur at the same location (∆ distance = 0 ft)• PIM source is at the antenna aperture• The antenna is bad
Steel wool as
“PIM marker”
Kovová vata jako marker

• Compare DTP to previously recorded DTF measurement
• PIM often occurs at RF connections
• DTF provides a “map” showing connector locations
• Use high resolution DTF to help identify PIM location.
DTP trace
DTF trace
Connector locations
DTP / DTP překrytí

Kalibrace přístroje
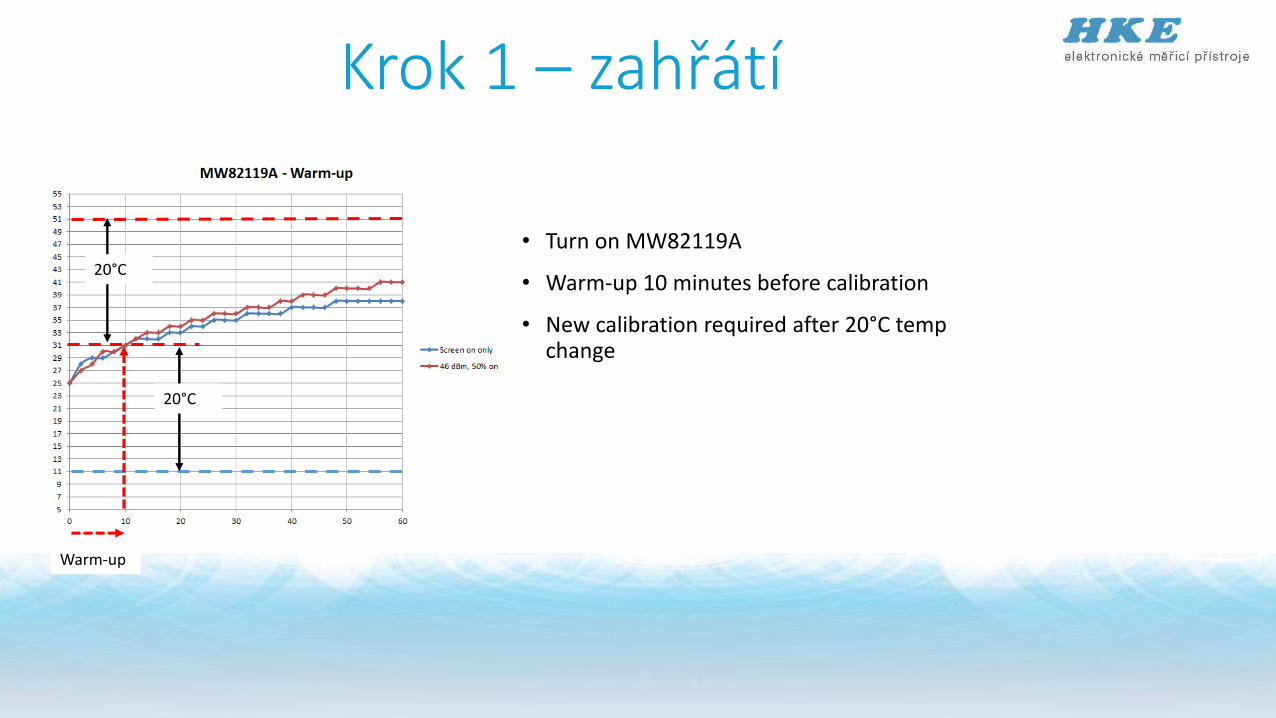
• Turn on MW82119A
• Warm-up 10 minutes before calibration
• New calibration required after 20°C temp change
20°C
20°C
Warm-up
Krok 1 – zahřátí
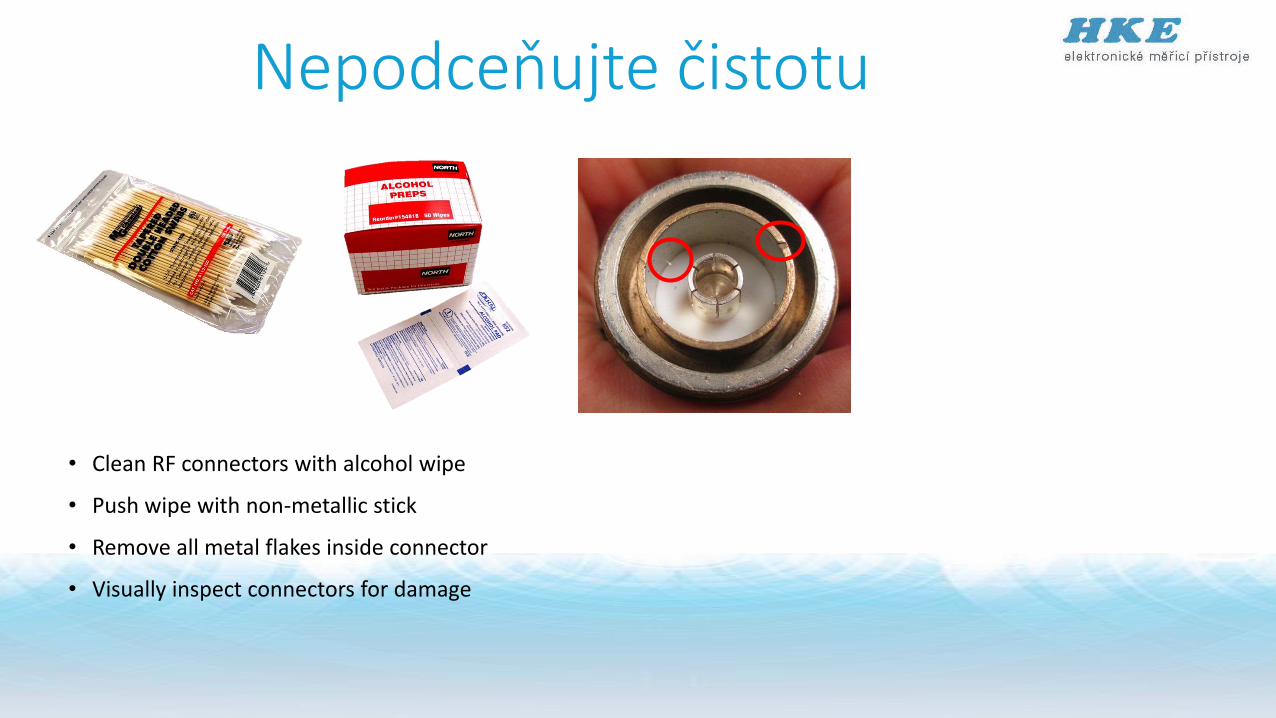
• Clean RF connectors with alcohol wipe
• Push wipe with non-metallic stick
• Remove all metal flakes inside connector
• Visually inspect connectors for damage
Nepodceňujte čistotu

• Previous test settings remain active until changed
• Set-up files can be saved / recalled to save time
SHIFT <6>
Kontrola nastavení
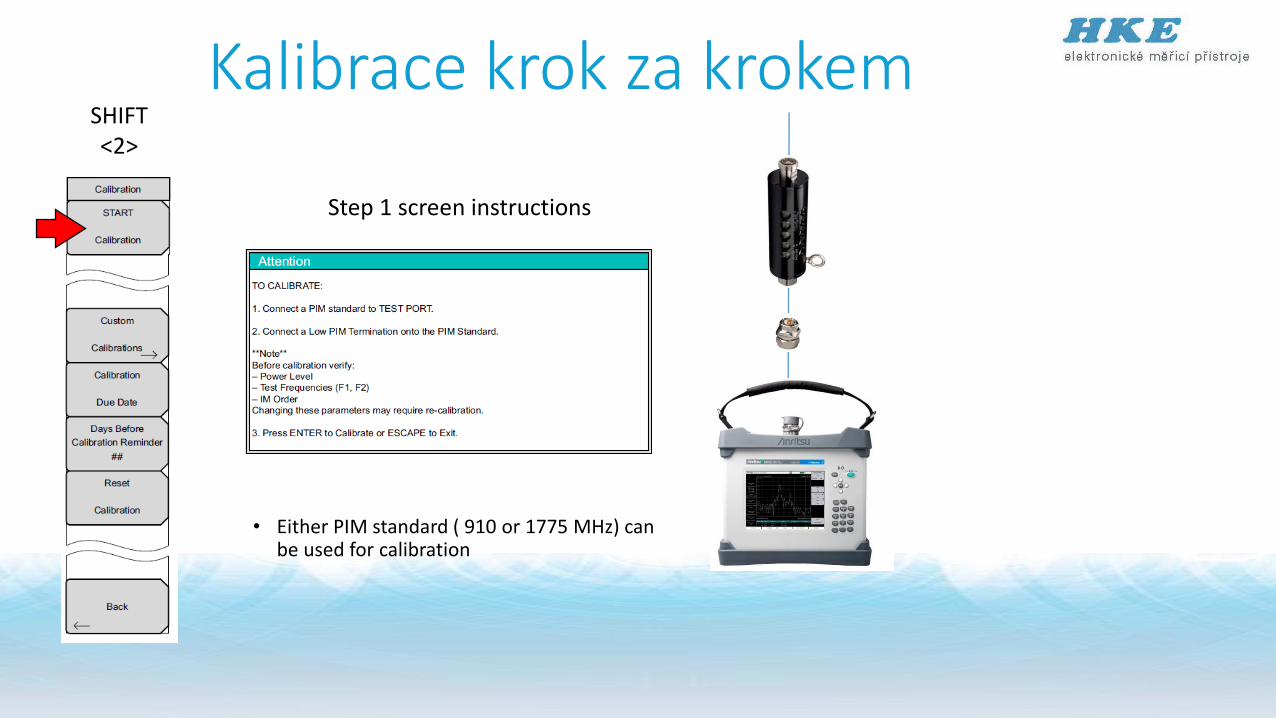
• Either PIM standard ( 910 or 1775 MHz) can be used for calibration
SHIFT <2>
Step 1 screen instructions
Kalibrace krok za krokem

• This step must be low PIM
• No metal flakes in connector during calibration
• Connectors must be tight for this step
Step 2 screen instructions
Kalibrace krok za krokem

• Measure PIM vs. TIME with low PIM termination attached to instrument
• Lightly tap termination with rubber end of wrench
• PIM must remain 10 dB lower than limit
Ověření vlastní PIM

• Measure PIM standard
• Verify measurement = expected value ± 3 dB
Ověření PIM standardem

• You test lead will eventually wear out!
• Attach test lead to instrument
• Attach low PIM termination to other end
• Lightly flex cable at connectors
• PIM must remain 10 dB lower than limit
• Save results
Ověření měřicího kabelu

DTP
END
Verify low Interference
Verify Test Equipment
Repair
START
Static PIM vs. TIME
Dynamic PIM vs. TIME
Repair
Final System Sweeps
DTF
Repair
Verify low Return LossPIM Master
Site Master
Stavový diagram měřicí procedury