Embed Size (px)
Citation preview
Prediction of Gastric Cancer Development by SerumPepsinogen Test and Helicobacter pylori Seropositivity inEastern Asians: A Systematic Review and Meta-AnalysisTeruhiko Terasawa1,2*, Hiroshi Nishida3, Katsuaki Kato4, Isao Miyashiro5, Takaki Yoshikawa6,
Reo Takaku7, Chisato Hamashima8
1 Section of General Internal Medicine, Department of Emergency and General Internal Medicine, Fujita Health University School of Medicine, Toyoake, Aichi, Japan,
2 Center for Clinical Evidence Synthesis, Institute for Clinical Research and Health Policy Studies, Tufts Medical Center, Boston, Massachusetts, United States of America,
3 Department of Health Information and Statistics, Panasonic Health Care Center, Osaka, Japan, 4 Cancer Detection Center, Miyagi Cancer Society, Sendai, Miyagi, Japan,
5 Department of Surgery, Osaka Medical Center for Cancer and Cardiovascular Diseases, Osaka, Japan, 6 Department of Gastrointestinal Surgery, Kanagawa Cancer Center,
Kanagawa, Japan, 7 Institute for Health Economics and Policy, Tokyo, Japan, 8 Cancer Screening Assessment and Management Division, Research Center for Cancer
Prevention and Screening, National Cancer Center, Tokyo, Japan
Abstract
Background: To identify high-risk groups for gastric cancer in presumptively healthy populations, several studies haveinvestigated the predictive ability of the pepsinogen test, H. Pylori antibodies, and a risk-prediction model based on thesetwo tests. To investigate whether these tests accurately predict gastric cancer development, we conducted a systematicreview and meta-analysis.
Methods: PubMed and other electronic databases were searched for cohort studies published in English or Japanese fromJanuary 1985 through December 2013. Six reviewers identified eligible studies, and at least two investigators extracted dataon population and study-design characteristics, quality items, and outcomes of interest. Meta-analyses were performed onnon-overlapping studies.
Results: Nine prospective cohorts from Eastern Asia reported in 12 publications, including 33,741 asymptomatic middle-aged participants of gastric cancer screening, were eligible. For discriminating between asymptomatic adults at high andlow risk of gastric cancer, the pepsinogen test (summary hazard ratio [HR], 3.5; 95% confidence interval [CI], 2.7–4.7; I2 = 0%)and H. pylori antibodies (summary HR, 3.2; 95% CI, 2.0–5.2; I2 = 0%) were statistically significant predictors as standalonetests. Although the risk-prediction model was in general moderately accurate in separating asymptomatic adults into fourrisk groups (summary c-statistic, 0.71; 95% CI: 0.68–0.73; I2 = 7%), calibration seemed to be poor. The study validity wasgenerally limited.
Conclusions: The serum pepsinogen test, H. pylori antibodies, and the four-risk-group model for predicting gastric cancerdevelopment seem to have the potential to stratify middle-aged presumptively healthy adults. Future research needs tofocus on comparative studies to evaluate the impact of screening programs adopting these tests. Also, validation, preferablywith model updating, is necessary to see whether the current model performance is transferable to different populations.
Citation: Terasawa T, Nishida H, Kato K, Miyashiro I, Yoshikawa T, et al. (2014) Prediction of Gastric Cancer Development by Serum Pepsinogen Test andHelicobacter pylori Seropositivity in Eastern Asians: A Systematic Review and Meta-Analysis. PLoS ONE 9(10): e109783. doi:10.1371/journal.pone.0109783
Editor: Hiromu Suzuki, Sapporo Medical University, Japan
Received July 15, 2014; Accepted September 3, 2014; Published October 14, 2014
Copyright: � 2014 Terasawa et al. This is an open-access article distributed under the terms of the Creative Commons Attribution License, which permitsunrestricted use, distribution, and reproduction in any medium, provided the original author and source are credited.
Data Availability: The authors confirm that all data underlying the findings are fully available without restriction. All relevant data are within the paper and itsSupporting Information files except for the exact search strategies for the original health technology assessment, which are described in detail in Ref #3. Thepertinent data (the interim results of a health technology assessment conducted by the literature review committee for the Japanese Guidelines for Gastric CancerScreening) has already been published online as Draft, the Japanese Guidelines for Gastric Cancer Screening 2013, available at http://canscreen.ncc.go.jp.
Funding: This study was supported solely by the Grant-in-Aid for H22-Third Term, Comprehensive Control Research for Cancer 022 from the Japanese Ministry ofHealth, Labour and Welfare. The funder had no role in study design, data collection and analysis, decision to publish, or preparation of the manuscript.
Competing Interests: All authors confirm that there are no conflicts of interest associated with this publication and there has been no significant financialsupport for this work that could have influenced its outcome. Dr. Hiroshi Nishida directs and performs endoscopic gastric cancer screening as a part of the annualworkplace health checkup for the employers of Panasonic Corporation at Panasonic Healthcare Center. Dr. Nishida did not receive any financial support from thecorporation for conducting the research and writing this paper. Panasonic Corporation and Panasonic Healthcare Center do not have a direct or indirectrelationship with any of the medical tests assessed in this paper, or any other related healthcare products in developed or already marketed. This does not alterthe authors’ adherence to PLOS ONE policies on sharing data and materials.
* Email: [email protected]
PLOS ONE | www.plosone.org 1 October 2014 | Volume 9 | Issue 10 | e109783
Introduction
Gastric cancer is the fourth most common cause of cancer death
worldwide [1], and is the most prevalent cancer in Eastern Asia
[2]. Because high cure rates can be expected for early stages of
gastric cancer, and non-randomized evidence suggests that
radiographic screening can decrease gastric-cancer-specific mor-
tality [3], several Asian countries have initiated cancer-screening
programs using upper gastrointestinal tract photofluorography or
gastric endoscopy [4]. However, recent nationwide gastric cancer
screening rates for the general population in Japan have been
unsatisfactorily low [5]; therefore, a major current focus is on
developing a risk-stratified screening program by efficiently
identifying high-risk populations.
Infection with Helicobacter pylori and its associated chronic
atrophic gastritis (CAG) are two major risk factors for gastric
cancer [6,7]. In addition to several candidate oncogenic mecha-
nisms [7,8], epidemiologic studies [9–12], have shown the
associations between these factors and gastric cancer. To predict
gastric cancer development in healthy populations, several cohort
studies have assessed the serum pepsinogen test and H. pyloriseropositivity, respectively, as surrogate markers for CAG and H.pylori infection, and a risk-prediction model based on the two tests.
However, these studies have small sample sizes and use
heterogeneous designs, making it difficult to interpret the
published data. Also, those studies that have assessed the
prediction model typically focus on relative risk estimates and fail
to assess the performance of the model [13]. Therefore, we
performed a systematic review to provide a comprehensive
summary of the predictive ability of these tests in presumptively
healthy adults. We also aimed to quantitatively explore the
calibration and discrimination of the prediction model based on
the reported data.
Materials and Methods
This work is an updated, in-depth systematic review and meta-
analysis based on a broad health technology assessment conducted
by the literature review committee for the Japanese Guidelines for
Gastric Cancer Screening [3], using a set of standardized
systematic review methods [14] and following a prespecified
protocol. There is no specific protocol for this focused, updated
review. The aim of the health technology assessment was twofold:
in an asymptomatic healthy population, to evaluate the existing
evidence on benefits and harms of conventional screening
strategies using photofluorography or gastrointestinal endoscopy,
and to evaluate ‘‘risk-stratified’’ screening strategies incorporating
the serum pepsinogen test, H. pylori antibodies, or a risk-
prediction model based on the two tests as the primary screening
modality before performing photofluorography or endoscopy. In
this paper, we focus on the predictive ability of the serum
pepsinogen test, H. pylori serology, and the prediction model to
predict gastric cancer development in asymptomatic populations.
Literature searchWe searched PubMed, Web of Science, Cochrane Central, and
the Japanese Medical Research Database (Igaku-Chuo-Zasshi)
using search terms like ‘‘stomach neoplasms’’, ‘‘gastric cancer’’,
‘‘endoscopy’’, ‘‘Helicobacter pylori’’, ‘‘pepsinogens’’, ‘‘atrophy’’,
‘‘diagnosis’’, ‘‘mass screening’’ and their synonyms. The searches
were limited to English- or Japanese-language publications, and
citations from Jan 1 1985 to July 10 2013. The exact search
strategy is reported in the guidelines [3]. The search was updated
to December 31 2013 to include only studies assessing the serum
pepsinogen test and/or H. pylori serology. The updated search
was then supplemented by examining the title and abstract of all
articles that cited at least one of the already included publications
found through the citation-tracking function of the ISI Web of
Knowledge database, Scopus, and Google Scholar. We also
perused the reference list of eligible studies and relevant review
articles, and consulted with experts in gastric cancer screening.
Study eligibilitySix reviewers in three pairs independently screened non-
overlapping sets of abstracts and independently examined the full
text of each potentially eligible study. Studies that assessed the
serum pepsinogen test and/or H. pylori seropositivity at enroll-
ment as predictors of gastric cancer development in asymptomatic
participants of gastric cancer screening programs were considered
eligible. We included both prospective cohort studies and
retrospective analyses of prospective cohorts of any sample size
that followed up all participants. We did not prespecify a
minimum follow-up period, how the studies followed up partic-
ipants, or how they verified gastric cancer development. We
accepted studies regardless of whether they included or excluded
participants with gastric cancer diagnosed at enrollment or shortly
after positive screening results for pepsinogen test and/or H. pyloriantibodies (endoscopy and biopsy were typically performed). We
excluded case-control studies and nested case-control or case-
cohort studies. We also excluded studies that assessed the detection
rates of gastric cancer based on the pepsinogen test and/or H.pylori antibodies without follow-up. Discrepancies regarding
inclusion were resolved by consensus between the assessors
including a third reviewer.
We took particular care to identify publications with at least
partially overlapping populations by comparing authors, centers,
recruitment periods, and patient demographic characteristics. In
the case of multiple publications from one study, we included only
the publication with the longest follow-up.
Table 1. Gastric cancer risk groups defined by the pepsinogen test and H. pylori antibody.
Pepsinogen test Negative Negative Positive Positive
H. pylori serology Negative Positive Positive Negative
4-risk group modela Group A Group B Group C Group D
3-risk group modelb Group A Group B Group C + Group D
aThe original model adopted in the primary studies.bAn alternative model used in our post-hoc sensitivity analysis.doi:10.1371/journal.pone.0109783.t001
Pepsinogen Test, H. pylori Antibody, and Gastric Cancer
PLOS ONE | www.plosone.org 2 October 2014 | Volume 9 | Issue 10 | e109783
Data extractionOne reviewer extracted descriptive data from each eligible
paper, which were confirmed by at least one other reviewer. We
extracted the following information: first author, year of publica-
tion, study location, study design and setting, inclusion and
exclusion criteria, baseline participant demographic characteris-
tics, follow-up period, methods used to ascertain gastric cancer
development, and technical specification of the pepsinogen test
and H. pylori antibodies. We also recorded the reported
performance of each test for diagnosing respective target clinical
conditions and their reference standard, if any, in the literature
(i.e., CAG by pepsinogen test and H. pylori infection status by
seropositivity).
One reviewer extracted numerical data regarding test results
and gastric cancer development from each study, which were
confirmed by at least one other reviewer. Specifically, for each risk
group defined we recorded the cumulative number of gastric
cancer cases identified through follow-up, the total number at risk,
and the hazard ratio (HR) estimates from the full statistical model
that adjusted for the largest number of potential confounders. Two
out of 150 (1%) extractions by the second reviewer for the
numerical data were inconsistent.
Any disagreements were resolved by consensus. A third
investigator adjudicated any unresolved discrepancies. We con-
tacted by email authors of studies for additional information when
it was not possible to extract numerical data from the publication.
Quality assessmentWe abstracted information on aspects of the design and conduct
of individual studies using a checklist specifically designed for
assessing studies of prognostic tests [15]. Items included study
design, selection of study participants, description of tested
population, inclusion and exclusion criteria, start point of follow-
up, description of test characteristics (assay methods and blinding
of test assessors to clinical outcomes and vice versa), description of
ascertainment of gastric cancer development, follow-up period,
and methods of data analysis (internal and external validation, and
whether appropriate statistical analyses including multivariable
adjustment taking account of other established risk factors had
been performed). We then judged the risk of bias for studies that
assessed the pepsinogen test or H. pylori antibodies as a standalone
test, using the Quality In Prognosis Studies (QUIPS-2) [16], and
rated the risk of bias and concerns about applicability for studies of
a risk-prediction model based on the two tests, using the Prediction
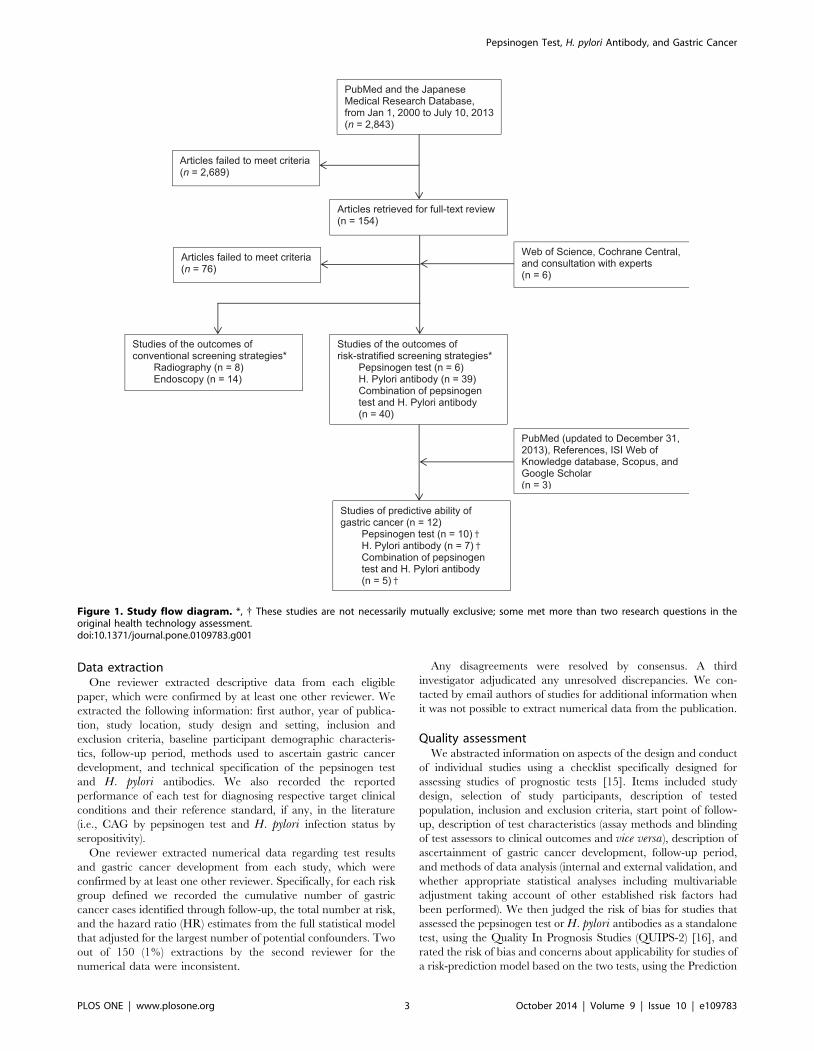
Figure 1. Study flow diagram. *, { These studies are not necessarily mutually exclusive; some met more than two research questions in theoriginal health technology assessment.doi:10.1371/journal.pone.0109783.g001
Pepsinogen Test, H. pylori Antibody, and Gastric Cancer
PLOS ONE | www.plosone.org 3 October 2014 | Volume 9 | Issue 10 | e109783
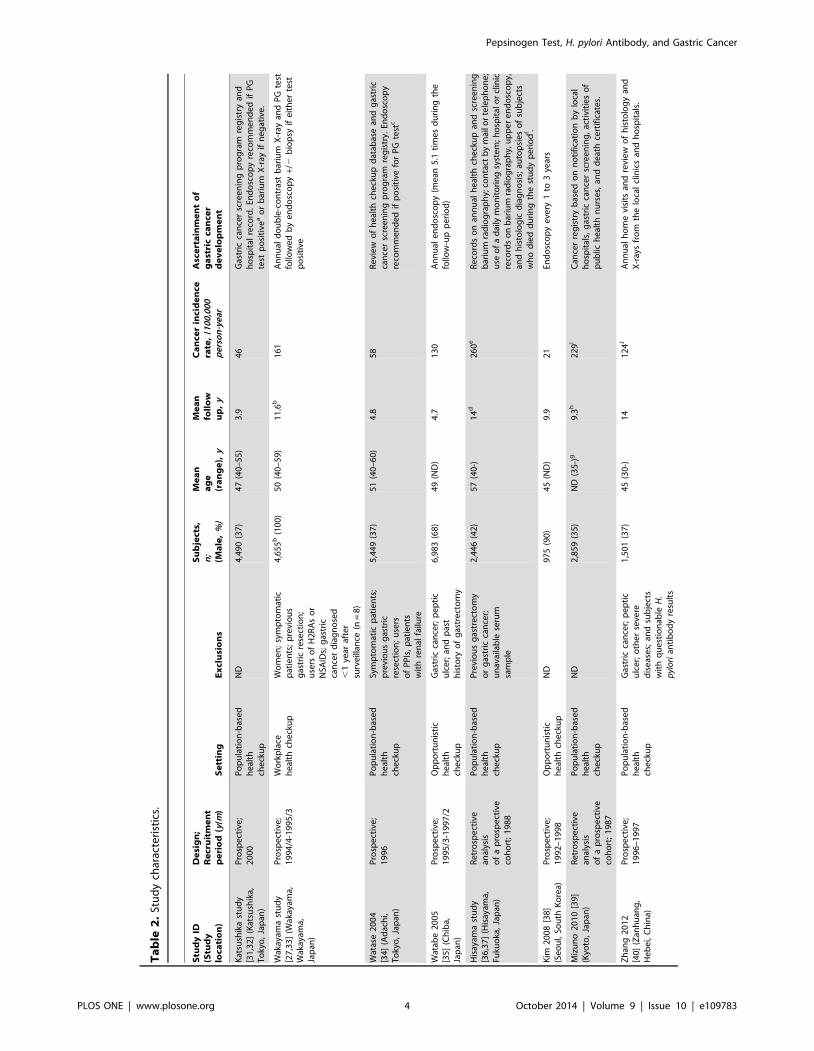
Ta
ble
2.
Stu
dy
char
acte
rist
ics.
Stu
dy
ID(S
tud
ylo
cati
on
)
De
sig
n;
Re
cru
itm
en
tp
eri
od
(y/m
)S
ett
ing
Ex
clu
sio
ns
Su
bje
cts,
n;
(Ma
le,
%)
Me
an
ag
e(r
an
ge
),y
Me
an
foll
ow
up
,y
Ca
nce
rin
cid
en
cera
te,
/10
0,0
00
pe
rso
n-y
ear
Asc
ert
ain
me
nt
of
ga
stri
cca
nce
rd
ev
elo
pm
en
t
Kat
sush
ika
stu
dy
[31
,32
](K
atsu
shik
a,T
oky
o,
Jap
an)
Pro
spe
ctiv
e;
20
00
Po
pu
lati
on
-bas
ed
he
alth
che
cku
p
ND
4,4
90
(37
)4
7(4
0–
55
)3
.94
6G
astr
icca
nce
rsc
ree
nin
gp
rog
ram
reg
istr
yan
dh
osp
ital
reco
rd.
End
osc
op
yre
com
me
nd
ed
ifP
Gte
stp
osi
tive
ao
rb
ariu
mX
-ray
ifn
eg
ativ
e.
Wak
ayam
ast
ud
y[2
7,3
3]
(Wak
ayam
a,W
akay
ama,
Jap
an)
Pro
spe
ctiv
e;
19
94
/4-1
99
5/3
Wo
rkp
lace
he
alth
che
cku
pW
om
en
;sy
mp
tom
atic
pat
ien
ts;
pre
vio
us
gas
tric
rese
ctio
n;
use
rso
fH
2R
As
or
NSA
IDs;
gas
tric
can
cer
dia
gn
ose
d,
1ye
araf
ter
surv
eill
ance
(n=
8)
4,6
55
b(1
00
)5
0(4
0–
59
)1
1.6
b1
61
An
nu
ald
ou
ble
-co
ntr
ast
bar
ium
X-r
ayan
dP
Gte
stfo
llow
ed
by
en
do
sco
py
+/2
bio
psy
ife
ith
er
test
po
siti
ve
Wat
ase
20
04
[34
](A
dac
hi,
To
kyo
,Ja
pan
)
Pro
spe
ctiv
e;
19
96
Po
pu
lati
on
-bas
ed
he
alth
che
cku
p
Sym
pto
mat
icp
atie
nts
;p
revi
ou
sg
astr
icre
sect
ion
;u
sers
of
PP
Is,
pat
ien
tsw
ith
ren
alfa
ilure
5,4
49
(37
)5
1(4
0–
60
)4
.85
8R
evi
ew
of
he
alth
che
cku
pd
atab
ase
and
gas
tric
can
cer
scre
en
ing
pro
gra
mre
gis
try.
End
osc
op
yre
com
me
nd
ed
ifp
osi
tive
for
PG
test
c
Wat
abe
20
05
[35
](C
hib
a,Ja
pan
)
Pro
spe
ctiv
e;
19
95
/3-1
99
7/2
Op
po
rtu
nis
tic
he
alth
che
cku
p
Gas
tric
can
cer;
pe
pti
cu
lce
r;an
dp
ast
his
tory
of
gas
tre
cto
my
6,9
83
(68
)4
9(N
D)
4.7
13
0A
nn
ual
en
do
sco
py
(me
an5
.1ti
me
sd
uri
ng
the
follo
w-u
pp
eri
od
)
His
ayam
ast
ud
y[3
6,3
7]
(His
ayam
a,Fu
kuo
ka,
Jap
an)
Re
tro
spe
ctiv
ean
alys
iso
fa
pro
spe
ctiv
eco
ho
rt;
19
88
Po
pu
lati
on
-bas
ed
he
alth
che
cku
p
Pre
vio
us
gas
tre
cto
my
or
gas
tric
can
cer;
un
avai
lab
lese
rum
sam
ple
2,4
46
(42
)5
7(4
0-)
14
d2
60
eR
eco
rds
on
ann
ual
he
alth
che
cku
pan
dsc
ree
nin
gb
ariu
mra
dio
gra
ph
y;co
nta
ctb
ym
ailo
rte
lep
ho
ne
;u
seo
fa
dai
lym
on
ito
rin
gsy
ste
m;h
osp
ital
or
clin
icre
cord
so
nb
ariu
mra
dio
gra
ph
y,u
pp
er
en
do
sco
py,
and
his
tolo
gic
dia
gn
osi
s;au
top
sie
so
fsu
bje
cts
wh
od
ied
du
rin
gth
est
ud
yp
eri
od
f .
Kim
20
08
[38
](S
eo
ul,
Sou
thK
ore
a)P
rosp
ect
ive
;1
99
2–
19
98
Op
po
rtu
nis
tic
he
alth
che
cku
pN
D9
75
(90
)4
5(N
D)
9.9
21
End
osc
op
ye
very
1to
3ye
ars
Miz
un
o2
01
0[3
9]
(Kyo
to,
Jap
an)
Re
tro
spe
ctiv
ean
alys
iso
fa
pro
spe
ctiv
eco
ho
rt;
19
87
Po
pu
lati
on
-bas
ed
he
alth
che
cku
p
ND
2,8
59
(35
)N
D(3
5-)
g9
.3h
22
9i
Can
cer
reg
istr
yb
ase
do
nn
oti
fica
tio
nb
ylo
cal
ho
spit
als,
gas
tric
can
cer
scre
en
ing
,ac
tivi
tie
so
fp
ub
lich
eal
thn
urs
es,
and
de
ath
cert
ific
ate
s.
Zh
ang
20
12
[40
](Z
anh
uan
g,
He
be
i,C
hin
a)
Pro
spe
ctiv
e;
19
96
–1
99
7P
op
ula
tio
n-b
ase
dh
eal
thch
eck
up
Gas
tric
can
cer;
pe
pti
cu
lce
r;o
the
rse
vere
dis
eas
es;
and
sub
ject
sw
ith
qu
est
ion
able
H.
pyl
ori
anti
bo
dy
resu
lts
1,5
01
(37
)4
5(3
0-)
14
12
4J
An
nu
alh
om
evi
sits
and
revi
ew
of
his
tolo
gy
and
X-r
ays
fro
mth
elo
cal
clin
ics
and
ho
spit
als.
Pepsinogen Test, H. pylori Antibody, and Gastric Cancer
PLOS ONE | www.plosone.org 4 October 2014 | Volume 9 | Issue 10 | e109783
Study Risk of Bias Assessment tool (PROBAST) [17]. One
reviewer assessed study quality, and the rating was confirmed by at
least one other reviewer. Three out of 64 (5%) quality ratings by
the second reviewer were inconsistent. Any discrepant results were
resolved by consensus.
Data synthesis and analysisThe predictive ability of the pepsinogen test and H. pylori
antibodies as standalone tests were analyzed using the DerSimo-
nian-Laird random effects model meta-analysis to obtain summary
HRs with their corresponding 95% confidence intervals (CIs) for
studies that reported time-to-event data in the main analysis and
the Mantel-Haenszel fixed-effects model meta-analysis for sensi-
tivity analyses. For studies that reported cumulative count data, we
performed the Mantel-Haenszel fixed-effects meta-analysis to
obtain summary odds ratios (ORs) with their corresponding
95% CIs in the main analysis because studies in general reported
the incidence rates of gastric cancer in the test-negative group to
be less than 1% with substantial imbalances between the test-
positive and -negative groups [18]. The Peto OR method and the
Mantel-Haenszel fixed-effects model for combining summary risk
differences were also used in sensitivity analyses. To supplement
the measures of predictive ability, we also obtained summary
estimates of sensitivity and specificity with their corresponding
95% CIs using bivariate random effects meta-analysis with the
exact binomial likelihood [19] and constructed summary receiver-
operating characteristic (ROC) curves and confidence regions for
summary sensitivity and specificity [20].
Studies that assessed the risk prediction model based on the
pepsinogen test and H. pylori serology consistently defined four
risk groups (Table 1). Suboptimal methodology and reporting of
model performance are common in prognostic model studies using
time-to-event data [21,22]. After perusal of the reported measures
of model performance, we determined to quantitatively synthesize
HRs across risk groups; no studies reported the recommended
standard measures of discrimination or calibration [22]. From four
risk strata, it is possible to form six pairwise comparisons. None of
the studies, however, assessed and reported all the logically
comparable contrasts but typically reported only three HRs of
gastric cancer development, comparing Groups B, C, and D with
Group A only. Therefore, in addition to conventional meta-
analysis of direct evidence on the reported contrasts, we performed
multivariate meta-analysis for predictive tests with three or more
risk strata with a Bayesian framework to combine the totality of
direct and indirect evidence in a single analysis, taking correlations
between the risk strata into account [23,24]. We calculated the
summary HRs and ORs (for cumulative count data) with their
corresponding 95% credible intervals (CrIs) using the fixed-effects
model in the main analysis and the random-effect model in
sensitivity analysis. Additionally, we calculated the probability for
each risk group that it would be ranked from best to worst among
the four risk strata. Finally, we repeated the multivariate meta-
analysis in a post-hoc set of sensitivity analyses by combining
Group C and Group D to form a 3-risk group model (Table 1).
To quantitatively explore model performance with reported
cumulative count data, we performed ‘‘descriptive’’ meta-analysis
of the discrimination and calibration using the DerSimonian-Laird
random-effects model [25], acknowledging not taking account of
potential effects of censoring. For each study, as the measure of
discrimination, we estimated the c-statistic and its corresponding
95% CIs [26]. To assess the calibration of the model, for each
study we calculated the expected over observed event ratio (E/O)
and its Poisson exact 95% CIs for each risk group and for all the
risk groups combined. Expected events were calculated by
Ta
ble
2.
Co
nt.
Stu
dy
ID(S
tud
ylo
cati
on
)
De
sig
n;
Re
cru
itm
en
tp
eri
od
(y/m
)S
ett
ing
Ex
clu
sio
ns
Su
bje
cts,
n;
(Ma
le,
%)
Me
an
ag
e(r
an
ge
),y
Me
an
foll
ow
up
,y
Ca
nce
rin
cid
en
cera
te,
/10
0,0
00
pe
rso
n-y
ear
Asc
ert
ain
me
nt
of
ga
stri
cca
nce
rd
ev
elo
pm
en
t
Oku
no
20
12
[41
](K
uro
be
,T
oya
ma,
Jap
an)
Pro
spe
ctiv
e;
19
95
Wo
rkp
lace
he
alth
che
cku
p
Ag
e$
60
;P
revi
ou
sg
astr
icca
nce
r;g
astr
icca
nce
r,
6m
on
ths
afte
rP
Gte
st(n
=3
);n
oP
Gte
stre
sult
s
4,3
83
(65
)4
5(3
5–
60
)1
2.3
11
1A
nn
ual
scre
en
ing
x-ra
yg
astr
og
rap
hy
and
/or
en
do
sco
pyk
.Se
lf-r
ep
ort
or
ph
ysic
ian
s’re
po
rto
fg
astr
icca
nce
rco
nfi
rme
dth
rou
gh
the
corr
esp
on
de
nce
sw
ith
the
test
ing
inst
itu
tio
ns.
aR
eco
mm
en
dat
ion
of
en
do
sco
py
wit
hb
ian
nu
alfo
llow
-up
con
tact
was
off
ere
dif
PG
test
po
siti
ve.
b5
,20
9su
bje
cts
wit
ha
me
anfo
llow
-up
of
9.7
year
sfo
rth
ean
alys
iso
fP
Gte
sto
nly
.cR
eco
mm
en
dat
ion
of
en
do
sco
py
was
off
ere
dan
nu
ally
for
two
year
s.d
10
year
sfo
rth
ean
alys
iso
fa
4-g
rou
pri
skm
od
el
bas
ed
on
bo
thP
Gte
stan
dH
.p
ylo
riin
fect
ion
stat
us.
eA
pp
roxi
mat
ely
est
imat
ed
bas
ed
on
89
gas
tric
can
cer
case
sid
en
tifi
ed
du
rin
gth
efo
llow
-up
pe
rio
do
f1
4ye
ars.
f Au
top
syw
asp
erf
orm
ed
75
%o
fal
ld
eat
hs
fro
man
yca
use
s.g
83
%o
fp
arti
cip
ants
we
re7
4ye
ars
of
age
or
you
ng
er.
hM
ed
ian
.i A
pp
roxi
mat
ely
est
imat
ed
bas
ed
on
61
gas
tric
can
cer
case
sid
en
tifi
ed
du
rin
gth
em
ed
ian
follo
w-u
pp
eri
od
of
9.3
year
s.j A
pp
roxi
mat
ely
est
imat
ed
bas
ed
on
26
gas
tric
can
cer
case
sid
en
tifi
ed
du
rin
gth
efo
llow
up
pe
rio
do
f1
4ye
ars.
kT
ota
lsc
ree
nin
gra
tes
by
x-ra
yg
astr
og
rap
hy
and
/or
en
do
sco
py
we
re7
8%
in1
99
5,
71
%in
19
99
,7
5%
in2
00
4,
and
82
%in
20
09
.FY
=fi
scal
year
;H
2R
As
=h
ista
min
ere
cep
tor
2an
tag
on
ist;
ND
=n
od
ata;
NSA
IDs
=n
on
-ste
roid
alan
ti-i
nfl
amm
ato
ryd
rug
s;P
G=
pe
psi
no
ge
n;
PP
I=p
roto
np
om
pin
hib
ito
r.d
oi:1
0.1
37
1/j
ou
rnal
.po
ne
.01
09
78
3.t
00
2
Pepsinogen Test, H. pylori Antibody, and Gastric Cancer
PLOS ONE | www.plosone.org 5 October 2014 | Volume 9 | Issue 10 | e109783
applying the proportionate cumulative gastric cancer incidence
estimates from long-term follow-up results of the first reported
study [27] to the corresponding four risk groups of the subsequent
studies assuming a constant incidence rate as reported [27]. E/O
statistics less than, equal to, and more than 1 respectively suggest
an under-, perfect-, and over-prediction of the model.
We quantified between-study heterogeneity with the I2 statistic
and considered I2 to be suggestive of intermediate or high
heterogeneity when .50% or .75%, respectively [28]. For each
model in the Bayesian multivariate meta-analysis we based results
on 3 different chains and 200,000 iterations after a burn-in of
10,000 iterations, and model convergence was assessed by Brooks-
Gelman-Rubin criteria [29]. We did not perform tests for funnel
plot asymmetry because there were fewer than ten eligible studies
[30]. Also, we did not perform subgroup or meta-regression
analyses due to the small number of studies. All analyses were
conducted using Stata SE, version 12.1 (Stata Corp, College
Station, TX, USA) and WinBUGS 1.4.3 (MRC Biostatistics Unit,
Cambridge, UK). P-values for all comparisons were 2-tailed, and
statistical significance was defined as a p-value less than 0.05.
Results
Literature flow and eligible studiesOur main literature searches identified 2843 citations, of which
154 were considered potentially eligible and reviewed in full
(Figure 1). Six additional citations were identified through
supplementary searches. We excluded 76 studies that did not
meet our inclusion criteria. The updated search found three
additional eligible studies. In the end, 9 independent cohorts
reported in 12 publications [27,31–41] were considered eligible.
Study and clinical characteristicsThe 9 eligible cohort studies (7 from Japan, 1 from Korea, and 1
from China) included 33,741 asymptomatic participants of gastric
cancer screening programs (Table 2). Five studies
[32,34,37,39,40] were conducted in communities, whereas two
[35,38] were opportunistic screening in clinical settings, and
another two [27,41] were workplace health checkups. Although all
studies prospectively enrolled participants, two studies [37,39]
reported that data were analyzed retrospectively. The mean age at
enrollment ranged between 45 and 57 years, and the mean follow-
up ranged between 3.9 and 14 years. During the study period, only
between 2 and 89 gastric cancer cases were detected per cohort,
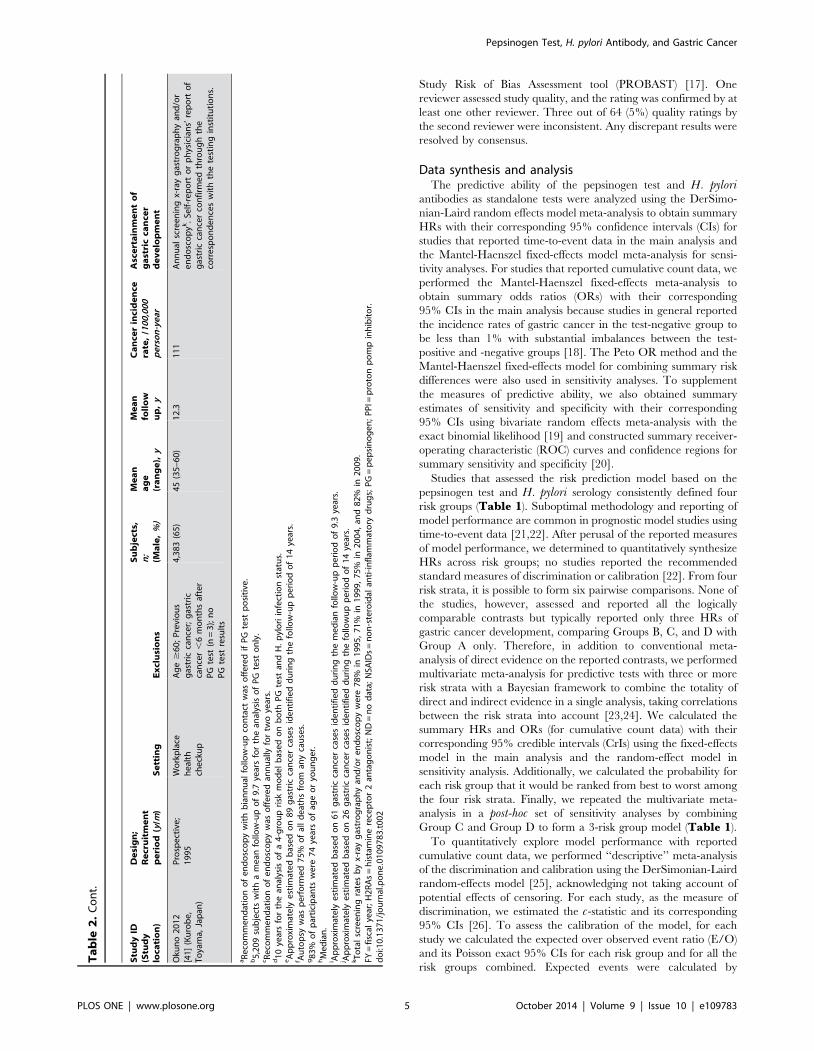
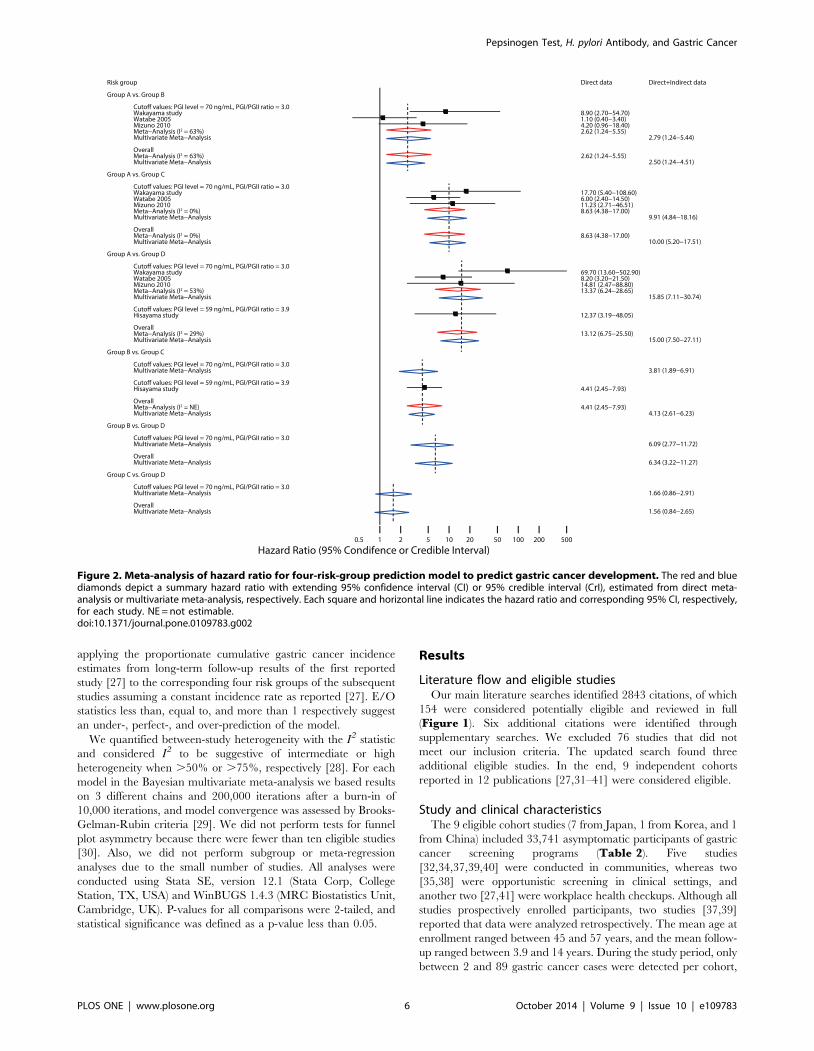
Figure 2. Meta-analysis of hazard ratio for four-risk-group prediction model to predict gastric cancer development. The red and bluediamonds depict a summary hazard ratio with extending 95% confidence interval (CI) or 95% credible interval (CrI), estimated from direct meta-analysis or multivariate meta-analysis, respectively. Each square and horizontal line indicates the hazard ratio and corresponding 95% CI, respectively,for each study. NE = not estimable.doi:10.1371/journal.pone.0109783.g002
Pepsinogen Test, H. pylori Antibody, and Gastric Cancer
PLOS ONE | www.plosone.org 6 October 2014 | Volume 9 | Issue 10 | e109783
which corresponded to heterogeneous cancer incidence rates of
between 21 and 260 cases per 100,000 person-years. Only did 2
cohorts [27,35] analyze gastric cancer incidence by histological
subtype (i.e., intestinal type or diffuse type). Two studies excluded
from the analysis cases of gastric cancer diagnosed early after
enrollment: 8 cases diagnosed within 1 year in one [27,33] and 3
cases diagnosed within 6 months in the other [41]. Review of the
registry data on annual health checkups with radiographic
screening and medical records was the most commonly adopted
method to ascertain gastric cancer cases. Only in two studies
[35,38] was periodic endoscopic screening performed to detect
gastric cancer.
Three studies [32,34,41] evaluated the serum pepsinogen test
alone, while a single study [38] exclusively assessed H. pyloriantibodies as a standalone risk factor (Table S1). Five studies
[27,35,37,39,40] evaluated both tests and the risk-prediction
model, consisting of four risk strata based on the two tests. Of
the seven studies that reported when samples were assayed, two
analyzed the stored serum 7 to 14 years after blood collection. All
seven studies that reported the method used to measure
pepsinogen concentrations used an identical assay with a set of
recommended cutoff values to diagnose CAG (pepsinogen I#
70 ng/mL and pepsinogen I/II#3.0) [42]. Two studies adopted
additional sets of cutoffs (Table S1). Various assays were used for
H. pylori antibodies and heterogeneous estimates of sensitivity and
specificity were reported (Table S1).
Assessment of study qualityFigure S1 shows the results of validity rating. No study
adequately reported all seven items relevant to study validity that
we assessed, that is, study design, selection of participants,
participant characteristics, start of follow-up, test characteristics,
methods of ascertainment of gastric cancer development, and
methods of data analysis (Table S2). Reporting was particularly
poor regarding blinding of interpreters of the two tests to clinical
outcomes, and blinding of outcome assessors to the test results.
Three studies [31,32,34,39] excluded more than 50% of all
potentially eligible participants, and a retrospective design was
adopted in 2 studies [36,37,39]. The follow-up period is shorter
than 5 years in three studies [31,32,34,35]. Four studies
[31,32,34,38,40] failed to adjust for any potential confounders in
analyzing risk estimates.
Pepsinogen test and H. pylori antibodiesFour studies, including 14,343 subjects [33,37,39,41], reported
HRs for the pepsinogen test to predict gastric cancer development.
All studies but one [37] adopted the recommended cutoff values
for this analysis. The random-effects meta-analysis showed that
subjects with a positive test had a higher risk of gastric cancer than
those with a negative test (summary HR, 3.5; 95% CI, 2.7–4.7;
p,0.001; I2 = 0%) (Figure S2-A). Cumulative count data were
available in 8 studies including 32,766 subjects [27,32,34–36,39–
41]: a positive test result was similarly significantly associated with
a higher risk of gastric cancer compared with a negative result
(fixed-effects OR, 3.9; 95% CI, 3.2–4.8; p,0.001; I2 = 37%)
(Figure S2-B). These studies had a summary sensitivity of 0.57
(95% CI, 0.49–0.65) and a summary specificity of 0.76 (95% CI,
0.69–0.81) (Figure S2-C).
For H. pylori antibodies, HR estimates were available from 3
studies including 9960 subjects [33,36,39]. The random-effects
meta-analysis showed that subjects positive for H. pylori antibodies
had a higher risk of gastric cancer than those with a negative test
(summary HR, 3.2; 95% CI, 2.0–5.2; p,0.001; I2 = 0%) (FigureS3-A). Six studies including 19,419 subjects [27,35,37–40]
reported cumulative count data for OR estimation, and the
fixed-effects meta-analysis found a similarly significant association
between positive H. pylori antibodies and a higher incidence of
gastric cancer (summary OR, 2.7; 95% CI, 2.0–3.8; p,0.001;
I2 = 10%) (Figure S3-B). Summary estimates of prognostic
accuracy were 0.87 (95% CI, 0.76–0.94) for sensitivity and 0.30
(95% CI, 0.23–0.39) for specificity (Figure S3-C).
In the preplanned sensitivity analyses for these two tests, the
summary estimates of the alternative models were not materially
different from those in the main analysis (data not shown).
Risk prediction modelPredictive ability of the risk-prediction model based on the
pepsinogen test and H. pylori antibodies was first reported in the
Wakayama study of 2004 [33], where the baseline gastric cancer
risk was estimated in a male population from a workplace health
checkup. Four subsequent studies evaluated the model in three
community-dwelling populations [35,37,40] and in a cohort of
participants in opportunistic health checkups [39], which we
considered validation cohorts.
Four studies (a total of 16,943 subjects) that reported HRs
[27,35,37,39] were included in the meta-analysis of predictive
ability. For predicting gastric cancer development, the 95% CrI of
the summary HRs for 5 out of 6 possible contrasts did not include
1, suggesting that in the pairwise contrasts, other than the
comparison between Group C and Group D, there was more than
95% probability that one of the two comparators had a higher risk
of gastric cancer than the other (Figure 2). Specifically, multi-
variate meta-analyses suggested that Group A had a lower risk
than Group B and Group C, and that compared with Group C
and Group D, Group B had a lower risk. There was no significant
difference in the risk of gastric cancer between Group C and
Group D (summary HR, 1.49; 95% CrI: 0.84–2.65). The ranking
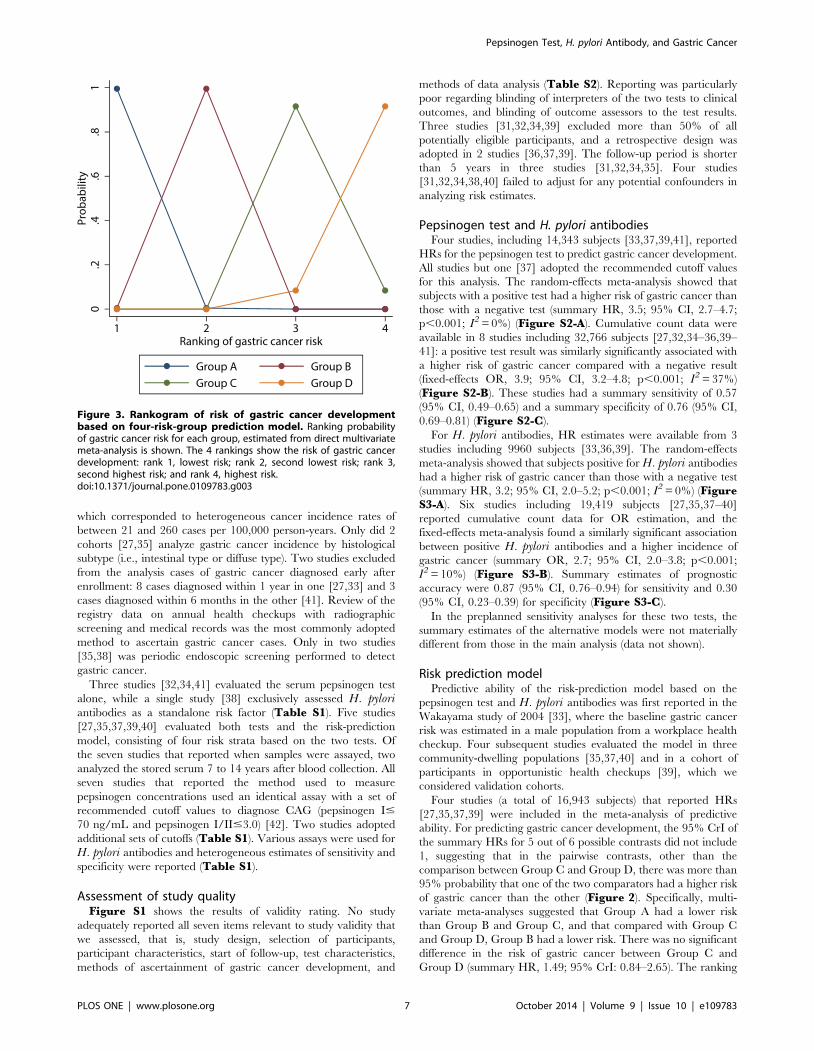
Figure 3. Rankogram of risk of gastric cancer developmentbased on four-risk-group prediction model. Ranking probabilityof gastric cancer risk for each group, estimated from direct multivariatemeta-analysis is shown. The 4 rankings show the risk of gastric cancerdevelopment: rank 1, lowest risk; rank 2, second lowest risk; rank 3,second highest risk; and rank 4, highest risk.doi:10.1371/journal.pone.0109783.g003
Pepsinogen Test, H. pylori Antibody, and Gastric Cancer
PLOS ONE | www.plosone.org 7 October 2014 | Volume 9 | Issue 10 | e109783
analysis showed that Groups A and B, respectively, had the lowest
and second-lowest risk of gastric cancer development (posterior
cumulative probability to rank the lowest and the second-lowest
risk groups was both .99%), whereas Groups C and D could be
the highest or second-highest risk groups (92% and 8%,
respectively, for being ranked as the second-highest group, and
8% and 92%, respectively, for the highest risk group) (Figure 3).
In sensitivity analyses using alternative models, and subgroup
analyses of only studies that adopted the recommended cutoff
values for the pepsinogen test, the summary HR estimates as well
as the results of the ranking analysis were similar to those of the
main analysis (Figure S4).
Five studies (a total of 18,444 subjects) with cumulative count
data [27,35,37,39,40] were included in the multivariate meta-
analysis of OR. The summary estimates were similar to the
findings in the meta-analysis of HR, and again, there was no
evidence of difference between Group C and Group D (summary
OR, 1.64; 95% CrI: 0.84–2.88) (Figure S5). The summary
estimates for sensitivity analyses were stable and the results were
not materially different from the main analysis (Figure S6). In the
post-hoc sensitivity analysis of 3-risk-strata model, the multivariate
meta-analysis and the ranking analysis showed that Group A had a
lower risk than Group B and combined Group C and Group D,
and compared with combined Group C and Group D, Group B
had a lower risk (Fig. S7–S9).
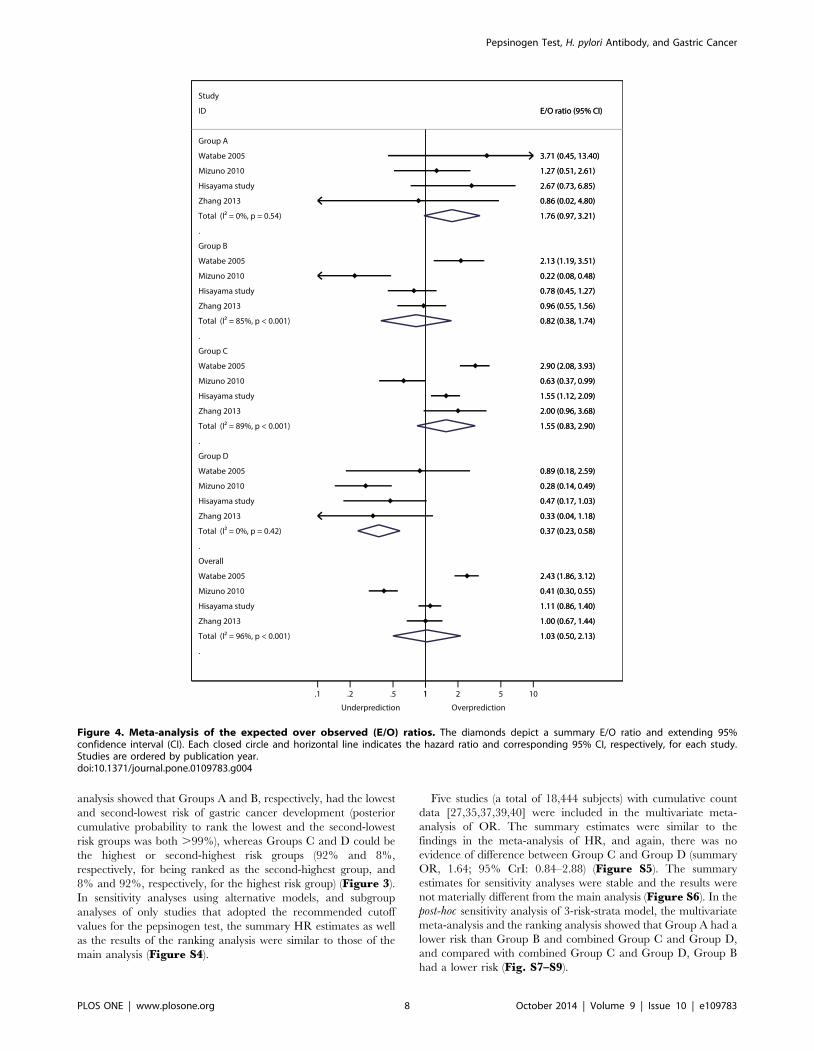
Figure 4. Meta-analysis of the expected over observed (E/O) ratios. The diamonds depict a summary E/O ratio and extending 95%confidence interval (CI). Each closed circle and horizontal line indicates the hazard ratio and corresponding 95% CI, respectively, for each study.Studies are ordered by publication year.doi:10.1371/journal.pone.0109783.g004
Pepsinogen Test, H. pylori Antibody, and Gastric Cancer
PLOS ONE | www.plosone.org 8 October 2014 | Volume 9 | Issue 10 | e109783
While two studies presented Kaplan-Meier plots of cumulative
gastric cancer incidence by risk group [27,35] and four studies
calculated p-values for differences in gastric cancer incidence
between the risk strata by Log-rank test [27,35,39] or Chi-squared
test [40], none reported recommended statistical measures or
graphical displays for assessing model performance of time-to-
event data [22]. Although the meta-analysis for overall study
population suggested that the calibration was generally good
across all risk strata (summary E/O ratio, 1.03; 95% CI: 0.50–
2.13; p = 0.94), high between-study heterogeneity was found
(I2 = 96%), suggesting that there were variations in the populations
assessed in the validation studies (Figure 4). Specifically, the E/O
ratio of one study showed an over-prediction (E/O, 2.43; 95% CI:
1.86–3.12; p,0.001), whereas an under-prediction was suggested
for another study (E/O, 0.41; 95% CI: 0.30–0.55; p,0.001). In
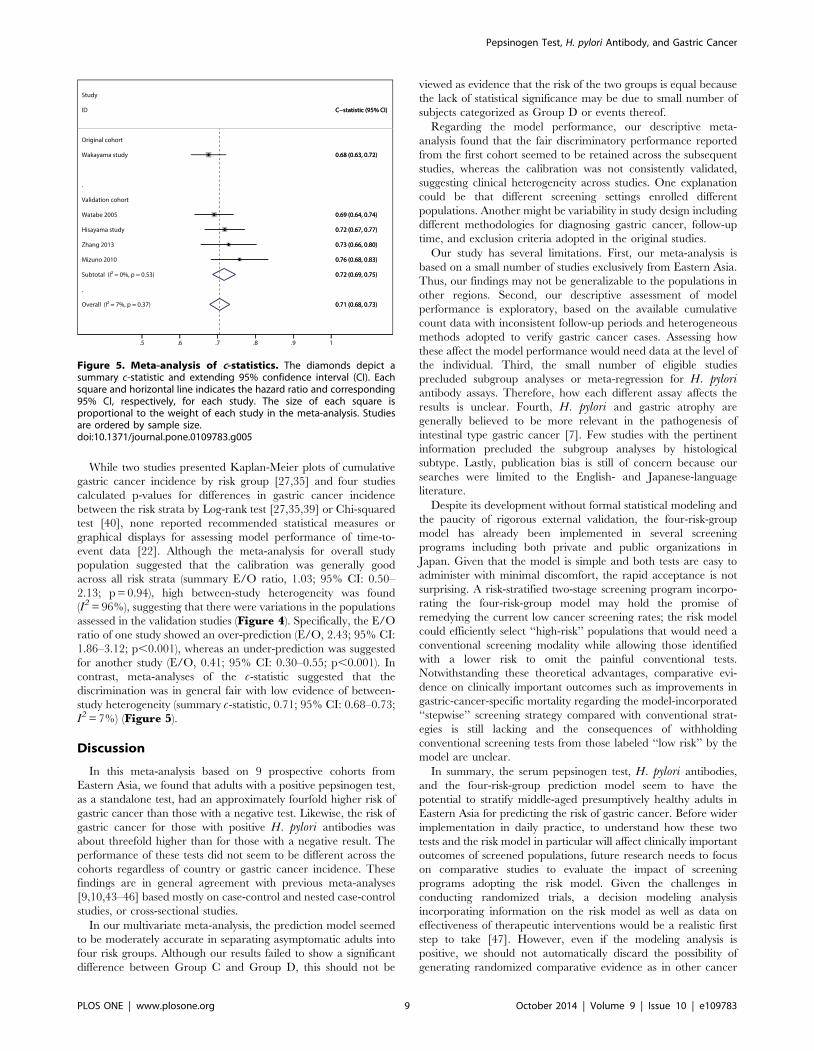
contrast, meta-analyses of the c-statistic suggested that the
discrimination was in general fair with low evidence of between-
study heterogeneity (summary c-statistic, 0.71; 95% CI: 0.68–0.73;
I2 = 7%) (Figure 5).
Discussion
In this meta-analysis based on 9 prospective cohorts from
Eastern Asia, we found that adults with a positive pepsinogen test,
as a standalone test, had an approximately fourfold higher risk of
gastric cancer than those with a negative test. Likewise, the risk of
gastric cancer for those with positive H. pylori antibodies was
about threefold higher than for those with a negative result. The
performance of these tests did not seem to be different across the
cohorts regardless of country or gastric cancer incidence. These
findings are in general agreement with previous meta-analyses
[9,10,43–46] based mostly on case-control and nested case-control
studies, or cross-sectional studies.
In our multivariate meta-analysis, the prediction model seemed
to be moderately accurate in separating asymptomatic adults into
four risk groups. Although our results failed to show a significant
difference between Group C and Group D, this should not be
viewed as evidence that the risk of the two groups is equal because
the lack of statistical significance may be due to small number of
subjects categorized as Group D or events thereof.
Regarding the model performance, our descriptive meta-
analysis found that the fair discriminatory performance reported
from the first cohort seemed to be retained across the subsequent
studies, whereas the calibration was not consistently validated,
suggesting clinical heterogeneity across studies. One explanation
could be that different screening settings enrolled different
populations. Another might be variability in study design including
different methodologies for diagnosing gastric cancer, follow-up
time, and exclusion criteria adopted in the original studies.
Our study has several limitations. First, our meta-analysis is
based on a small number of studies exclusively from Eastern Asia.
Thus, our findings may not be generalizable to the populations in
other regions. Second, our descriptive assessment of model
performance is exploratory, based on the available cumulative
count data with inconsistent follow-up periods and heterogeneous
methods adopted to verify gastric cancer cases. Assessing how
these affect the model performance would need data at the level of
the individual. Third, the small number of eligible studies
precluded subgroup analyses or meta-regression for H. pyloriantibody assays. Therefore, how each different assay affects the
results is unclear. Fourth, H. pylori and gastric atrophy are
generally believed to be more relevant in the pathogenesis of
intestinal type gastric cancer [7]. Few studies with the pertinent
information precluded the subgroup analyses by histological
subtype. Lastly, publication bias is still of concern because our
searches were limited to the English- and Japanese-language
literature.
Despite its development without formal statistical modeling and
the paucity of rigorous external validation, the four-risk-group
model has already been implemented in several screening
programs including both private and public organizations in
Japan. Given that the model is simple and both tests are easy to
administer with minimal discomfort, the rapid acceptance is not
surprising. A risk-stratified two-stage screening program incorpo-
rating the four-risk-group model may hold the promise of
remedying the current low cancer screening rates; the risk model
could efficiently select ‘‘high-risk’’ populations that would need a
conventional screening modality while allowing those identified
with a lower risk to omit the painful conventional tests.
Notwithstanding these theoretical advantages, comparative evi-
dence on clinically important outcomes such as improvements in
gastric-cancer-specific mortality regarding the model-incorporated
‘‘stepwise’’ screening strategy compared with conventional strat-
egies is still lacking and the consequences of withholding
conventional screening tests from those labeled ‘‘low risk’’ by the
model are unclear.
In summary, the serum pepsinogen test, H. pylori antibodies,
and the four-risk-group prediction model seem to have the
potential to stratify middle-aged presumptively healthy adults in
Eastern Asia for predicting the risk of gastric cancer. Before wider
implementation in daily practice, to understand how these two
tests and the risk model in particular will affect clinically important
outcomes of screened populations, future research needs to focus
on comparative studies to evaluate the impact of screening
programs adopting the risk model. Given the challenges in
conducting randomized trials, a decision modeling analysis
incorporating information on the risk model as well as data on
effectiveness of therapeutic interventions would be a realistic first
step to take [47]. However, even if the modeling analysis is
positive, we should not automatically discard the possibility of
generating randomized comparative evidence as in other cancer
Figure 5. Meta-analysis of c-statistics. The diamonds depict asummary c-statistic and extending 95% confidence interval (CI). Eachsquare and horizontal line indicates the hazard ratio and corresponding95% CI, respectively, for each study. The size of each square isproportional to the weight of each study in the meta-analysis. Studiesare ordered by sample size.doi:10.1371/journal.pone.0109783.g005
Pepsinogen Test, H. pylori Antibody, and Gastric Cancer
PLOS ONE | www.plosone.org 9 October 2014 | Volume 9 | Issue 10 | e109783
screening fields [48]. In addition, given the variable prevalence of
H. pylori infection across different generations and different
countries [49], and also the recent introduction of eradication
therapies, both of which are expected to affect the test results,
validation of the current model performance is still necessary [47].
Supporting Information
Figure S1 Quality assessment of studies included in themeta-analysis. The stacked bar charts illustrate quality rating
for risk of bias for predictive factor studies by the Quality In
Prognosis Studies (QUIPS-2) tool (A) [16], and risk of bias (B) and
concerns about applicability (C) for studies of both predictive
factor and risk prediction model by the Prediction Study Risk of
Bias Assessment tool (PROBAST) [17]. The percentages of studies
that met the given ratings for each domain are shown.
(EPS)
Figure S2 Meta-analysis of hazard ratio (A), odds ratio(B), and sensitivity and specificity (C) for the pepsinogentest to predict gastric cancer development. The diamonds
depict the summary hazard ratio (A) or odds ratio (B) and
extending 95% confidence interval (CI). Each square and
horizontal line indicates the hazard ratio and corresponding
95% CI, respectively, for each study. The size of the square is
proportional to the weight of each study in the meta-analysis.
Studies are ordered by sample size. Individual study estimates of
sensitivity and specificity are plotted in the receiver operating
characteristic (ROC) space (C). The size of each circle is
proportional to the sample size for each study (all study
participants). The dashed crescent boundary represents the 95%
confidence region for the summary sensitivity and specificity
(shown as the square). The solid line represents the summary ROC
curve.
(EPS)
Figure S3 Meta-analysis of hazard ratio (A), odds ratio(B), and sensitivity and specificity (C) for H. pyloriantibodies to predict gastric cancer development. The
diamonds depict the summary hazard ratio (A) or odds ratio (B)
and extending 95% confidence interval (CI). Each square and
horizontal line indicates the hazard ratio and corresponding 95%
CI, respectively, for each study. The size of the square is
proportional to the weight of each study in the meta-analysis.
Studies are ordered by sample size. Individual study estimates of
sensitivity and specificity are plotted in the receiver operating
characteristic (ROC) space (C). The size of each circle is
proportional to the sample size for each study (all study
participants). The dashed crescent boundary represents the 95%
confidence region for the summary sensitivity and specificity
(shown as the square). The solid line represents the summary ROC
curve.
(EPS)
Figure S4 Sensitivity analysis for multivariate meta-analysis of hazard ratio for the four-risk-group predic-tion model. The red and blue diamonds and horizontal lines
depict a summary hazard ratio and corresponding 95% credible
interval (CrI), estimated from the fixed- or random-effects
multivariate meta-analysis, respectively. Subgroup results for
studies that adopted the conventional cutoff for pepsinogen levels
are also shown.
(EPS)
Figure S5 Meta-analysis of odds ratio for four-risk-group prediction model to predict gastric cancer
development. The red and blue diamonds depict a summary
odds ratio with extending 95% confidence interval (CI) or 95%
credible interval (CrI), estimated from direct meta-analysis or
multivariate meta-analysis, respectively. Each square and hori-
zontal line indicates the odds ratio and corresponding 95% CI,
respectively, for each study.
(EPS)
Figure S6 Sensitivity analysis for multivariate meta-analysis of odds ratio for the four-risk-group predictionmodel. The red and blue diamonds and horizontal lines depict a
summary odds ratio and corresponding 95% credible interval
(CrI), estimated from the fixed- or random-effects multivariate
meta-analysis, respectively. Subgroup results for studies that
adopted the conventional cutoff for pepsinogen levels are also
shown.
(EPS)
Figure S7 Meta-analysis of odds ratio for three-risk-group prediction model to predict gastric cancerdevelopment. The red and blue diamonds depict a summary
odds ratio with extending 95% confidence interval (CI) or 95%
credible interval (CrI), estimated from direct meta-analysis or
multivariate meta-analysis, respectively. Each square and hori-
zontal line indicates the hazard ratio and corresponding 95% CI,
respectively, for each study.
(EPS)
Figure S8 Sensitivity analysis for multivariate meta-analysis of odds ratio for the three-risk-group predictionmodel. The red and blue diamonds and horizontal lines depict a
summary odds ratio and corresponding 95% credible interval
(CrI), estimated from the fixed- or random-effects multivariate
meta-analysis, respectively. Subgroup results for studies that
adopted the conventional cutoff for pepsinogen levels are also
shown.
(EPS)
Figure S9 Rankogram of risk of gastric cancer devel-opment based on three-risk-group prediction model.Ranking probability of gastric cancer risk for each group,
estimated from direct multivariate meta-analysis is shown. The 3
rankings show the risk of gastric cancer development: rank 1,
lowest risk; rank 2, second lowest risk; rank 3, highest risk.
(EPS)
Table S1 Test characteristics.(DOCX)
Table S2 Quality assessment of included studies.(DOCX)
Checklist S1 PRISMA Checklist.(DOC)
Acknowledgments
We thank Drs. Fumiko Ito and Yoshiyuki Watanabe for providing
unpublished data on their original work, and Dr. Robert Wolff of the
PROBAST steering group for providing an earlier version of the recently
developed PROBAST tool.
Author Contributions
Conceived and designed the experiments: TT CH. Performed the
experiments: TT HN KK IM TY RT CH. Analyzed the data: TT HN
KK CH. Contributed reagents/materials/analysis tools: TT. Contributed
to the writing of the manuscript: TT HN KK IM TY RT CH. Collection
of data: TT HN KK IM TY RT CH.
Pepsinogen Test, H. pylori Antibody, and Gastric Cancer
PLOS ONE | www.plosone.org 10 October 2014 | Volume 9 | Issue 10 | e109783
References
1. Ferlay J, Soerjomataram I, Ervik M, Dikshit R, Eser S, et al. (2013)
GLOBOCAN 2012 v1.0, Cancer Incidence and Mortality Worldwide: IARCCancerBase No. 11. Lyon, France: International Agency for Research on
Cancer. Available: http://globocan.iarc.fr/Default.aspx. Accessed 2013 Dec 29.2. Bray F, Ren JS, Masuyer E, Ferlay J (2013) Global estimates of cancer
prevalence for 27 sites in the adult population in 2008. Int J Cancer 132: 1133–
1145.3. The Steering Committee for the Development of Gastric Cancer Screening
Guidelines (2013) The Japanese Guidelines for Gastric Cancer Screening.Available: http://canscreen.ncc.go.jp/. Accessed 2013 Dec 29.
4. Leung WK, Wu MS, Kakugawa Y, Kim JJ, Yeoh KG, et al. (2008) Screening for
gastric cancer in Asia: current evidence and practice. Lancet Oncol 9: 279–287.5. Foundation for Promotion of Cancer Research. Cancer Statistics in Japan -
2013. Available: http://ganjoho.jp/data/professional/statistics/backnumber/2013/cancer_statistics_2013.pdf. Accessed 2013 Dec 29.
6. World Health Organization (2012) Biological agents. Volume 100 B. A review ofhuman carcinogens. IARC monographs on the evaluation of carcinogenic risks
to humans/World Health Organization, International Agency for Research on
Cancer 100: 1–441. Available: http://monographs.iarc.fr/ENG/Monographs/vol100B/mono100B-1.pdf. Accessed 2013 Dec 29.
7. Correa P, Piazuelo MB (2012) The gastric precancerous cascade. J Dig Dis 13:2–9.
8. Polk DB, Peek RM Jr (2010) Helicobacter pylori: gastric cancer and beyond. Nat
Rev Cancer 10: 403–414.9. Islami F, Sheikhattari P, Ren JS, Kamangar F (2011) Gastric atrophy and risk of
oesophageal cancer and gastric cardia adenocarcinoma–a systematic review andmeta-analysis. Ann Oncol 22: 754–760.
10. Dinis-Ribeiro M, Yamaki G, Miki K, Costa-Pereira A, Matsukawa M, et al.(2004) Meta-analysis on the validity of pepsinogen test for gastric carcinoma,
dysplasia or chronic atrophic gastritis screening. J Med Screen 11: 141–147.
11. Weck MN, Brenner H (2008) Association of Helicobacter pylori infection withchronic atrophic gastritis: Meta-analyses according to type of disease definition.
Int J Cancer 123: 874–881.12. Adamu MA, Weck MN, Gao L, Brenner H (2010) Incidence of chronic atrophic
gastritis: systematic review and meta-analysis of follow-up studies. Eur J Epide-
miol 25: 439–448.13. Moons KG, Royston P, Vergouwe Y, Grobbee DE, Altman DG (2009)
Prognosis and prognostic research: what, why, and how? BMJ 338: b375.14. Hamashima C, Saito H, Nakayama T, Sobue T (2008) The standardized
development method of the Japanese guidelines for cancer screening. Jpn J ClinOncol 38: 288–295.
15. Rector TS, Taylor BC, Wilt TJ (2012) Chapter 12: systematic review of
prognostic tests. J Gen Intern Med 27 Suppl 1: S94–101.16. Hayden JA, van der Windt DA, Cartwright JL, Cote P, Bombardier C (2013)
Assessing bias in studies of prognostic factors. Ann Intern Med 158: 280–286.17. PROBAST steering committee (2013) Prediction risk of bias assessment tool
(PROBAST). Available: http://colloquium.cochrane.org/fr/abstracts/
prediction-study-risk-bias-assessment-tool-probast. Accessed 2013 Dec 29.18. The Agency for Healthcare Research and Quality (2013) Methods Guide for
Effectiveness and Comparative Effectiveness Reviews. Rockville (MD). Avail-able: http://www.ncbi.nlm.nih.gov/pubmed/21433403. Accessed 2013 Dec 29.
19. Reitsma JB, Glas AS, Rutjes AW, Scholten RJ, Bossuyt PM, et al. (2005)Bivariate analysis of sensitivity and specificity produces informative summary
measures in diagnostic reviews. J Clin Epidemiol 58: 982–990.
20. Harbord RM, Deeks JJ, Egger M, Whiting P, Sterne JA (2007) A unification ofmodels for meta-analysis of diagnostic accuracy studies. Biostatistics 8: 239–251.
21. Mallett S, Royston P, Waters R, Dutton S, Altman DG (2010) Reportingperformance of prognostic models in cancer: a review. BMC Med 8: 21.
22. Royston P, Altman DG (2013) External validation of a Cox prognostic model:
principles and methods. BMC Med Res Methodol 13: 33.23. Lu G, Ades AE (2004) Combination of direct and indirect evidence in mixed
treatment comparisons. Stat Med 23: 3105–3124.24. Woods BS, Hawkins N, Scott DA (2010) Network meta-analysis on the log-
hazard scale, combining count and hazard ratio statistics accounting for multi-
arm trials: a tutorial. BMC Med Res Methodol 10: 54.25. Meads C, Ahmed I, Riley RD (2012) A systematic review of breast cancer
incidence risk prediction models with meta-analysis of their performance. BreastCancer Res Treat 132: 365–377.
26. DeLong ER, DeLong DM, Clarke-Pearson DL (1988) Comparing the areasunder two or more correlated receiver operating characteristic curves: a
nonparametric approach. Biometrics 44: 837–845.
27. Yoshida T, Kato J, Inoue I, Yoshimura N, Deguchi H, et al. (2013) Cancer
development based on chronic active gastritis and resulting gastric atrophy asassessed by serum levels of pepsinogen and Helicobacter pylori antibody titer.
Int J Cancer 134: 1445–1457.
28. Higgins JP, Thompson SG, Deeks JJ, Altman DG (2003) Measuringinconsistency in meta-analyses. BMJ 327: 557–560.
29. Brooks SP, Gelman A (1998) General methods for monitoring convergence of
iterative simulations. J Comput Graph Stat 7: 434–455.
30. Sterne JA, Sutton AJ, Ioannidis JP, Terrin N, Jones DR, et al. (2011)Recommendations for examining and interpreting funnel plot asymmetry in
meta-analyses of randomised controlled trials. BMJ 343: d4002.
31. Sugishita Y., Ito F, Seiko A (2003) [Evaluation of Two Steps Gastric CancerDetection Program Using Serum Pepsinogen Test Applied for Urban Residents
Living in Katsushika Ward of Tokyo from 2000 to 2001]. Nihon Gan KenshinShindan Gakkaishi: 10: 161–166. Japanese.
32. Ito F, Watanabe Y, Miki K (2007) [Effect of the Two-step Serum Pepsinogen
Test Method on Reducing Stomach Cancer Mortality among the UrbanResidents]. Nihon Gan Kenshin Shindan Gakkaishi 14: 156–160. Japanese.
33. Ohata H, Kitauchi S, Yoshimura N, Mugitani K, Iwane M, et al. (2004)
Progression of chronic atrophic gastritis associated with Helicobacter pyloriinfection increases risk of gastric cancer. Int J Cancer 109: 138–143.
34. Watase H, Inagaki T, Yoshikawa I, Furihata S, Watanabe Y, et al. (2004) [Five
years follow up study of gastric cancer screening using the pepsinogen testmethod in Adachi city]. Nihon Gan Kenshin Shindan Gakkaishi 11: 77–81.
Japanese.
35. Watabe H, Mitsushima T, Yamaji Y, Okamoto M, Wada R, et al. (2005)Predicting the development of gastric cancer from combining Helicobacter
pylori antibodies and serum pepsinogen status: a prospective endoscopic cohortstudy. Gut 54: 764–768.
36. Oishi Y, Kiyohara Y, Kubo M, Tanaka K, Tanizaki Y, et al. (2006) The serum
pepsinogen test as a predictor of gastric cancer: the Hisayama study.Am J Epidemiol 163: 629–637.
37. Shikata K, Kiyohara Y, Kubo M, Yonemoto K, Ninomiya T, et al. (2006) A
prospective study of dietary salt intake and gastric cancer incidence in a definedJapanese population: the Hisayama study. Int J Cancer 119: 196–201.
38. Kim N, Park RY, Cho SI, Lim SH, Lee KH, et al. (2008) Helicobacter pylori
infection and development of gastric cancer in Korea: long-term follow-up.J Clin Gastroenterol 42: 448–454.
39. Mizuno S, Miki I, Ishida T, Yoshida M, Onoyama M, et al. (2010) Prescreening
of a high-risk group for gastric cancer by serologically determined Helicobacterpylori infection and atrophic gastritis. Dig Dis Sci 55: 3132–3137.
40. Zhang X, Xue L, Xing L, Wang J, Cui J, et al. (2012) Low serum pepsinogen I
and pepsinogen I/II ratio and Helicobacter pylori infection are associated withincreased risk of gastric cancer: 14-year follow up result in a rural Chinese
community. Int J Cancer 130: 1614–1619.
41. Okuno T, Kido T, Sakurai M, Nakamura K, Morikawa Y, et al. (2012) A 15-year cohort study on the incidence of gastric cancer and the validity of testing
based on serum pepsinogen screening test. Journal of the Tsuruma Health
Science Society Kanazawa University 36: 15–23.
42. Miki K (2006) Gastric cancer screening using the serum pepsinogen test method.
Gastric Cancer 9: 245–253.
43. Xue FB, Xu YY, Wan Y, Pan BR, Ren J, et al. (2001) Association of H. pyloriinfection with gastric carcinoma: a Meta analysis. World J Gastroenterol 7: 801–
804.
44. Helicobacter and Cancer Collaborative Group (2001) Gastric cancer andHelicobacter pylori: a combined analysis of 12 case control studies nested within
prospective cohorts. Gut 49: 347–353.
45. Eslick GD, Lim LL, Byles JE, Xia HH, Talley NJ (1999) Association ofHelicobacter pylori infection with gastric carcinoma: a meta-analysis. Am J -
Gastroenterol 94: 2373–2379.
46. Huang JQ, Sridhar S, Chen Y, Hunt RH (1998) Meta-analysis of therelationship between Helicobacter pylori seropositivity and gastric cancer.
Gastroenterol 114: 1169–1179.
47. Moons KG, Kengne AP, Grobbee DE, Royston P, Vergouwe Y, et al. (2012)Risk prediction models: II. External validation, model updating, and impact
assessment. Heart 98: 691–698.
48. Bretthauer M, Hoff G (2012) Comparative effectiveness research in cancerscreening programmes. BMJ 344: e2864.
49. Brown LM (2000) Helicobacter pylori: epidemiology and routes of transmission.
Epidemiol Rev 22: 283–297.
Pepsinogen Test, H. pylori Antibody, and Gastric Cancer
PLOS ONE | www.plosone.org 11 October 2014 | Volume 9 | Issue 10 | e109783