Embed Size (px)
Citation preview

ARTICLE IN PRESS
1352-2310/$ - se
doi:10.1016/j.at
�Correspond16-52-01.
E-mail addr1Present addr
DK-1401 Cope
Atmospheric Environment 38 (2004) 6349–6359
www.elsevier.com/locate/atmosenv
Prediction of indoor concentration of 0.5–4 mm particles ofoutdoor origin in an uninhabited apartment
Thomas Schneidera,�, Keld Alstrup Jensena, Per A. Clausena, Alireza Afsharib,Lars Gunnarsenb, Peter Wahlinc, Marianne Glasiusc, Finn Palmgrenc,
Ole J. Nielsend, Christian L. Foghe,1
aNational Institute of Occupational Health, Lerso Parkalle 105, DK-2100 Copenhagen, DenmarkbDanish Building and Urban Research, P.O. Box 119, DK-2970 Horsholm, Denmark
cNational Environmental Research Institute, DK-4000, Roskilde, DenmarkdDepartment of Chemistry, University of Copenhagen, Universitetsparken 5, DK-2100 Copenhagen, Denmark
eRisoe National Laboratory, P.O. Box 49, DK-4000, Roskilde, Denmark
Received 5 February 2004; received in revised form 23 July 2004; accepted 4 August 2004
Abstract
Indoor and outdoor particle size distributions, indoor–outdoor pressure difference, indoor air-exchange rate, and
meteorological conditions were measured at an uninhabited apartment located in a busy street in Copenhagen during 1-
month long fall, winter and spring campaigns. Particle penetration was estimated from concentration rebound
measurements following HEPA filtering of the indoor air by fitting a simple deterministic model. The model included
measured air exchange rates and published surface deposition loss rates. This model was then used to predict indoor
particle concentration. The model predicted well the indoor concentration of coarse (1.2–4 mm) particles of outdoororigin for the fall and spring campaign. The model performed less well for the fine (0.5–1.2 mm) particle concentrationand the winter campaign. The association between the ratio measured/predicted indoor concentration and factors not
included in the deterministic model was analysed statistically and the result was used to determine a correction factor to
the model prediction. The correction factor was found to depend on wind velocity, outdoor relative humidity, and air
exchange rate. Including the correction factor reduced the ratio of the 95 percentile to the 5 percentile by an average of
26% for the fine particles and 12% for the coarse particles. The ratio measured/predicted concentration using the
correction factor was found to be the highest during periods where it was most likely that occupants were present in
other apartments. The results suggest that factors such as particle chemical composition, within building transport
patterns, and occupant behaviour in other apartments should be identified and quantified in future studies, and that
these factors need to be included in predictive models.
r 2004 Elsevier Ltd. All rights reserved.
Keywords: Air exchange; Humidity; Penetration; Temperature; Wind
e front matter r 2004 Elsevier Ltd. All rights reserve
mosenv.2004.08.002
ing author. Tel.: +45-39-16-52-95; fax: +45-39-
ess: [email protected] (T. Schneider).
ess: Danish Environmental Protection Agency,
nhagen, Denmark.
1. Introduction
Evidence is accumulating that health effects of
ambient air-pollution are related mainly to particles of
near- to sub-micrometer size (Kunzli et al., 2000;
d.

ARTICLE IN PRESS
Bedroom
Kitchen
Living room
Hall
Window with slitBA
Street
APS
Backyard
Window
T. Schneider et al. / Atmospheric Environment 38 (2004) 6349–63596350
Schwartz et al., 2002; Pope, III et al., 2002; Ibald-Mulli
et al., 2002). The health effects have been related to
emissions from combustion of fossil fuels, particularly
traffic exhaust. However, epidemiological studies have
relied strongly on urban background concentration
measurements where the contributions from local high-
traffic areas are highly diluted. In addition, people spend
most of their time indoors. The indoor concentration of
particles from street environments may thus be a key
determinant of city dwellers’ exposure to traffic-related
particulate air-pollution. An improved understanding of
the factors determining the indoor concentration of
these particles can lead to an improved assessment of the
quantitative health risks of urban air-pollution.
The indoor fraction of particles from the street
environment is determined by the rate of air exchange,
particle loss from the outdoor air during passage through
the building shell and the air handling system, by
evaporation and chemical processes, including decom-
position, and by deposition to room surfaces. Resuspen-
sion will generate airborne particles including particles of
outdoor origin having sizes modified by agglomeration
and fragmentation. Penetration (defined as the fraction of
particles not removed from the outdoor air as it moves
indoors) of particles through a building shell depends on
particle size, crack geometry and pressure drop and has a
maximum in the size range 0.1–1mm (Mosley et al., 2001;
Liu and Nazaroff, 2003). Also removal by the air
handling system is size dependent. Deposition to room
surfaces depends on particle size and on other factors,
e.g., air turbulence intensity and surface roughness, and
can exceed loss rates of 0.5 h�1 for particle sizes outside
the range 0.1–1mm, as reviewed by Lai (2002). Resuspen-sion (Thatcher and Layton, 1995) is very low for particles
below 1mm and increases rapidly for increasing sizes
above 1mm. Particle loss owing to decomposition of
outdoor ammonium nitrate aerosols into ammonia and
nitric acid gases upon entering low-humidity indoor
environments occurs at rates ranging from 0.3 to 18h�1
(Lunden et al., 2003). Thus, it is important to include the
time and size dependence of particle penetration and loss
in modelling the fraction of outdoor particles in indoor
air and in studies of health effects of particles of outdoor
and of indoor origin.
The objective of the present work was to develop and
validate a model for predicting the indoor concentration
of 0.5–4mm particles of outdoor origin in an unin-
habited apartment. This work is part of a long-term
study of health effects of ambient air-pollution including
pollution generated by local traffic.
BathExhaust ductStaircase
Fig. 1. Apartment. Measuring positions A and B of the APS
particle sizer, outdoor air intake slit, and exhaust fan. During
measurements, the kitchen and entrance doors were sealed.
2. Materials and experimental methods
Indoor and outdoor particle size distributions, in-
door–outdoor pressure difference, indoor air exchange
rates, and meteorological conditions were measured at
an uninhabited two-room 4th floor apartment (Fig. 1) in
a five-storey building in Copenhagen. The apartment
complex is located in a narrow two-way street canyon
with a traffic load of �26,000 vehicles (4–5% heavy duty
vehicles) each working day (Municipality of Copenha-
gen, 2002). The study was conducted in an uninhabited
apartment in order to limit interference from indoor
particle sources. To prevent contamination from the
measuring equipment all exhaust lines from pumps and
instruments were led to the kitchen, which was sealed off
from the rest of the apartment. The apartment door to
the front door staircase was not tight and was
consequently sealed prior to beginning the measure-
ments in order to limit infiltration of particles from the
stairway, which would contain a mixture of particles
originating from the street canyon and from other
apartments. The doors between the living room, bed-
room and the small hall were kept open and the air was
stirred in each room with a small fan. It was assumed
that this caused the airborne particles in the ‘‘study
space’’, consisting of the three rooms, to be well mixed
within a time scale of half an hour. In previous
comparable studies, particle deposition on fan blades
has been reported to be less than about 10% (Thatcher
et al., 2002) and 2% (Byrne et al., 1995) of the total
deposition, respectively, and was hence assumed
negligible.
The volume of the study space was 78.6m3. The
ceiling height was 2.7m, floor area was 29m2 and the
wall area was 95m2. Furniture and instrument racks,
tubes, etc., subtracted an estimated volume of 6.6m3 and
added an estimated horizontal area of 3.5m2 and
vertical area of 10m2. Floors were covered with wall-
to-wall carpets, and walls with wallpaper. The ceilings
were painted with acrylic paint.
Measurements were conducted during the fall, winter,
and spring campaign 2001–2002. Each campaign lasted
ARTICLE IN PRESST. Schneider et al. / Atmospheric Environment 38 (2004) 6349–6359 6351
between 4 and 5 weeks. Due to limitations in instrument
and apartment availability, measurements could not be
performed during a summer campaign. Since half-hour
averaging already was the standard reporting format for
outdoor measurements, all results in the present study
were calculated as half-hour averages.
Particles were sampled outdoors and in the living
room (pos A and B, Fig. 1) every alternating 6.5min
(and a 1min flushing time between each change) through
two 13mm ID copper tube sampling lines of identical
geometry using an aerosol particle sizer (APS) Model
3320 from TSI Inc. A computer-controlled valve was
used to switch between the indoor and outdoor sampling
line. The indoor sampling inlet was positioned 1.6m
from the wall, 1.5m above the floor. The outdoor
sampling inlet was positioned 0.25m from the wall,
facing down at an angle of 451. The sampling inlet was a
blunt-edged cylindrical nozzle with ID 1.5 cm. The APS
sampling flow rate was 5 lmin�1 resulting in an inlet
velocity of 47 cm s�1. A coarse wire mesh placed 3 cm
downstream prevented entrainment of large objects. It
was assumed that the aspiration efficiency of the
sampling nozzle for particles below 4mm was identical
for indoor and outdoor sampling conditions.
Particle mass was calculated from the APS data
assuming that the particles were spherical and had
density, r ¼ 1:0 g cm�3: The calibration of the APS 3320given by Armendariz and Leith (2002) was used for
correcting the particle counting efficiency. Prior to the
field campaigns, the APS size calibration was checked
using 5.1 mm latex spheres. Recent studies have shown
that when measuring sub-micrometer particles a small
fraction of small particles circulates back into the
sensing volume of the APS 3320 resulting in detection
of phantom particles larger than about 4mm (Armen-
dariz and Leith, 2002; Thatcher et al., 2002). This also
became evident in the present study, and for this reason
only particle sizes up to 4 mm were included for later
analysis. The appearance of phantom particles would
not affect diameter calibration using 5.1 mm particles.
The air exchange rate, l; in the study space was
maintained at a low (target 0.5 h�1) and a high (target
1.0 h�1) level, respectively, every alternating week by a
mechanical fan in the bathroom exhaust duct. The
exhaust volumetric flow rate was adjusted by varying the
slit opening in the exhaust air valve. Outdoor air was
supplied directly via a specially mounted air intake with
two standard ventilation slits (each of size 0.9� 30.5 cm
covered by a perforated plate screen) in the living room
window facing the street. One and two slits in the air
intake were open during periods with low and high l;respectively. l was determined by the constant concen-
tration method using SF6 as tracer gas, a multipoint
dosing and sampling system, and a photo-acoustic IR
detector (INNOVA Multipoint sampler and doser, type
1303, and INNOVA Gas Monitor, type 1312). Tracer
gas was injected and sampled in each of the three rooms
of the study space. Air exchange rate for the study space
was calculated from the total injection rate of tracer gas
and the effective volume of the study space. Air
exchange rate measurements showed several single
half-hour peaks that were likely due to instabilities
in the measurement procedure. These peaks were
smoothed using a five-point moving window median
method (Mathcad, 2002). A PFT multiple tracer gas
technique (Dietz et al., 1986) was used to estimate the
order of magnitude of within building air flow. The
airflows between the study space, the apartment
adjacent to the kitchen, hall and bathroom, and the
apartment below the study space were determined. One
measurement was made, lasting 12 days during the fall
campaign.
The pressure difference, Dp, across the outdoor air
intake slit was monitored taking simple precautions to
minimize dynamic pressure. The volumetric flow rate,
Qslit, through the slit was calculated from the measured
pressure difference using a laboratory calibration. The
calibration was obtained by measuring Qslit and Dp and
fitting a straight line to the points Qslit versusffiffiffiffiffiffiDp
p: This
gave the following relation:
Qslit ¼ 1:08ffiffiffiffiffiffiDp
pl s�1; one slit open;
Qslit ¼ 1:48ffiffiffiffiffiffiDp
pl s�1; two slits open; ð1Þ
where p is measured in Pa.
Air velocity (average and standard deviation) was
measured on a single occasion in the living room at 12
equally spaced positions in a plane 1m from the
outer wall, using a multidirectional air velocity probe
(B&K analyser, type 1213). The position-averaged air
velocity was 7.9 cm s�1 and standard deviation 3.5 cm
s�1. Free-stream wind velocity and direction were
measured at an urban background measuring site
(Kemp, 1993).
Penetration and deposition occurs simultaneously,
and it is difficult to decouple these effects when fitting a
model to measurement data obtained under natural
conditions. Thatcher et al. (2003) solved this problem by
manipulating the indoor environment by short periods
of resuspension activities or supply of HEPA filtered air
and measuring the decay or build-up, respectively, of
particle concentration. In the present study the HEPA
filter method was used during a short period of the fall
campaign. The filter unit was placed in the living room,
and was switched on, operated for 1 h, and switched off
by a timer. The starting time was set to coincide with
morning and with afternoon rush hours, where outdoor
concentrations were assumed to be the highest. The
procedure was repeated eight times.
Visits to the kitchen or study space for the purpose of
instrument supervision were recorded in a log-book.

ARTICLE IN PRESST. Schneider et al. / Atmospheric Environment 38 (2004) 6349–63596352
3. Model development
An instantaneously mixed single compartment model
was used to predict the concentration of outdoor
particles in the study space. The model used a time
resolution of 0.5 h and time-independent penetration, P,
and loss rate, kdep. The assumption of time indepen-
dence of kdep is justified because kdep is governed by air
turbulence, which was kept constant by the fans in the
study space. The consequences of assuming a time-
independent penetration are assessed in a later section.
The air exchange rate, l; is divided into two parts. One
part, lslit, is the air entering through the outdoor air
intake, given Dp40: The other part, l� lslit; is the airentering from outside via cracks in the outer walls and/
or from interior regions of the building through open-
ings and cracks in the interior building structure. When
Dpo0; the air passing through the slit becomes part of
the air leaving the study space. It was assumed that there
were no indoor particle sources. The indoor concentra-
tion, Cmod(Cout, P, l; lslit, kdep) was modelled using the
parameters:
Cout o
utdoor particle concentrationP p
enetration, assumed to be independent of time.For the fraction of outdoor particles entering
through the slit, penetration is one for all particle
diameters
l m
easured air exchange rate in the study spacelslit c
ontribution to air exchange by air enteringthrough the slit calculated by Eq. (1)
kdep s
urface deposition loss rate, assumed to beindependent of time.
All parameters, except l and lslit are diameter
dependent but the diameter variable is omitted in the
equations to follow.
The mass balance equation for the model is:
dCðtÞ
dt¼ ½ðlðtÞ � lslitðtÞÞP þ lslitðtÞ
�CoutðtÞ � ðlðtÞ þ kdepÞCðtÞ; ð2Þ
where C is the indoor concentration. This equation
assumes that the instant values of the time-dependent
parameters are known. In the present study only half-
hour average values were available. The mass balance
equation was thus modified using the approach given by
Switzer and Ott (1992) for piecewise constant inputs and
time averaged outputs. The modelling procedure was:
(1) Assume that the instantaneous outdoor concentra-
tion is equal to the piecewise constant function, defined
by the half-hour averages, Cout(ti) and similarly for land lslit: (2) Calculate the real-time indoor concentrationduring a half-hour period using Eq. (2). To do this, one
needs to know the initial condition, i.e. the instanta-
neous indoor concentration at the beginning of the time
period. This value was estimated as 0:5ðCi�1 þ CiÞ;where Ci�1 is the half-hour average for the preceding
time period and Ci the half-hour average for the actual
time period. (3) Calculate the average indoor concentra-
tion, Cmod, over the half-hour time period. The
equations for any time period ti were:
CmodðtiÞ ¼ Sðentering through slit during time
period tiÞ þ Bðentering by other
pathways during time period tiÞ
þ Rðfraction remaining
from previous time period ti�1Þ;
S ¼lslitðtiÞ � CoutðtiÞ
Dt � ðlðtiÞ þ kdepÞ2½Dt � ðlðtiÞ þ kdepÞ
þ expð�Dt � ðlðtiÞ þ kdepÞÞ � 1;
B ¼ðlðtiÞ � lslitðtiÞÞ � P � CoutðtiÞ
Dt � ðlðtiÞ þ kdepÞ2
½Dt � ðlðtiÞ þ kdepÞ
þ expð�Dt � ðlðtiÞ þ kdepÞÞ � 1;
R ¼0:5ðCðti�1Þ þ CðtiÞÞ
Dt � ðlðtiÞ þ kdepÞ
�½1� expð�Dt � ðlðtiÞ þ kdepÞÞ: ð3Þ
4. Results
4.1. Measurements
Some particle concentration data were lost due to
instrument malfunction. This created four gaps in the
concentration and air exchange time series and (not
coinciding) three gaps in the meteorology time series. In
total, there were eight peaks of 1/2 to 1 h duration in the
indoor concentration with peak to background ratios
exceeding 10 and showing no exponential decay and five
peaks in the outdoor concentration with peak to
background ratios exceeding 10, not mirrored indoors.
These peaks were considered to be outliers and were
replaced by the average of the reading before and after
the peak. Several site visits with entry into the sealed
study space had to be made. The site visit and HEPA
filtration intervention time periods were excluded from
the general data set used for model prediction. The total
number of half-hour data obtained and used for
prediction, respectively, is given in Table 1.
The number and volume weighted distributions
indoors and outdoors averaged over all campaigns are
shown in Fig. 2. The size distribution measured
with a custom built Vienna-type Differential Mobility
Analyser (Wahlin et al., 2002) is shown for comparison.
The DMA results indicate that the calibration by

ARTICLE IN PRESS
Table 1
Arithmetic, AM, and geometric, GM mean and geometric standard deviation, GSD for outdoor and indoor fine and coarse particle
concentrations and arithmetic mean of total background nitrate concentrations
Campaign N AM/GM/GSD AM/GM/GSD Npr Median
Outdoor concentration (mgm�3) Indoor concentration (mgm�3) Ratio M/Pcorr
Fine Coarse Nitrate (*) Fine Coarse Fine Coarse
Fall 1430 5.8/3.3 14.0/11.4 0.7 1.9/1.4 2.0/2.4 1311 0.86 0.95
3.0 2.0 2.1 1.8
Winter 1003 7.7/5.1 16.8/12.7 1.4 2.5/2.1 7.3/5.2 927 0.71 1.34
2.5 2.2 1.7 2.4
Spring 1775 5.4/3.2 8.9/7.6 0.9 1.7/1.4 2.0/1.7 1361 0.74 1.19
2.9 1.8 1.9 1.8
N: Number of half-hour data. Npr: Number of predicted half-hour values. (*) GM of whole-day sample data. Number of nitrate data
per campaign ranged between 31 and 36.
The median of the ratios M/Pcorr of the measured to predicted (corrected by Eq. (7)) particle concentration is also given.
0.01
0.1
1
10
100
1000
10000
0.1 1 10Diameter, µm
dN/d
(log(
Dia
)), c
m-3
1
10
100
dV/d
(log(
Dia
)),µ
m3 c
m-3
DMA number, in
Number, out
Volume, out
DMA volume, in
Volume, in
Number, in
Fig. 2. Particle number per cm3 and particle volume in
mm3 cm�3 averaged over all campaigns for particles measured
indoors in the living room (in) and outdoors (out). Results
obtained using a DMA (Wahlin et al., 2003) are shown for
comparison. Diameter is aerodynamic diameter for APS and
mobility diameter for DMA measurements.
T. Schneider et al. / Atmospheric Environment 38 (2004) 6349–6359 6353
Armendariz and Leith (2002) under-corrects the APS
results for particles smaller than 0.7 mm. This error onlyaffects absolute concentration measurements, and not
relative measures, such as penetration, given the likely
assumption that the error is linearly related to the true
concentration.
Fig. 2 shows that both outdoor and indoor particles
measured with the APS have two volume modes,
separated at 1.2mm. Thus, two mass fractions were
calculated: a coarse (1.2 mmoDaeo4mm) and a fine
(0.5 mmoDaeo1.2 mm) mass fraction. The averaged
outdoor and indoor concentrations for the fine and
coarse particle fraction are given in Table 1 for each
campaign. Results from 24 h filter sampling of total
suspended nitrate+nitric acid from a rural site close to
Great Copenhagen were available (Ellerman et al.,
2003). These data were used as an estimate of the urban
background values (Table 1) assuming that nitrates
constituted 85% of the total nitrate+nitric acid
concentration. No information was available on the
size distribution of the suspended nitrate.
Visual inspection of the average daily outdoor
concentration time profile revealed a minor peak during
morning and afternoon rush hours for the fine and
coarse mass concentration but only during the winter
and spring campaigns.
The meteorological conditions during the campaigns
are summarized in Table 2. The pressure difference
across the outdoor air-intake slit varied with wind
direction and had a maximum when the street fac-ade
was in the windward side and a minimum when in the
leeward side. There was a 1801 difference between the
directions for minimum and maximum pressure differ-
ence, but the direction for maximum pressure difference
was shifted 301 relative to the facade normal.
When the exhaust fan was set to the high air exchange
target value, the average measured air exchange rate was
1.1 h�1 and was 0.51 h�1at the low target value. The air
exchange rates fluctuated around the mean, but were
clearly separated by the value 0.81 h�1. Thus, measured
rates below, respectively, above 0.81 h�1 will be termed
low, respectively, high air exchange rates. The PFT
tracer gas measurements showed that about one tenth of
the total make-up air in the study space was supplied
from the two selected apartments.

ARTICLE IN PRESS
Table 2
Lower quartile, median and upper quartile of conditions prevailing during the HEPA experiments and during the three campaigns
Wind velocity (m s�1) Wind direction normal Tin�Tout (1C) RHout (%) RHin (%) Pressure difference (Pa)
HEPA, quartiles 4.2/5.6/6.5 �0.79/0.73/0.42 9/11/14 69/76/82 45/48/50 0.7/1.5/2.5
Fall, quartiles 3.3/4.4/6.1 �0.71/0.44/0.5 8/13/20 76/83/89 49/51/52 2.6/4.4/5.8
Winter, quartiles 3.6/4.6/5.8 0.22/0.34/0.42 13/15/19 83/89/93 30/34/36 5.1/6.1/7.1
Spring, quartiles 2.3/3.8/4.4 0.35/0.6/0.78 10/12/15 62/75/87 28/34/38 2.1/3.4/5.0
0.1
1
1
10
0.1 10
Diameter, µm
Sur
face
dep
ositi
on lo
ss r
ate,
h-1 Thatcher et al., 2002
Medium furnished, high kdepTh
Low carpeted, low kdepTh
kdepfit
Fig. 3. Surface deposition loss rate. Experimental data by
Thatcher et al. (2002) obtained for low-level turbulence/
carpeted floor (low kdepTh ), medium-level turbulence/furnished
(high kdepTh ), and average of these two, kdep
fit .
T. Schneider et al. / Atmospheric Environment 38 (2004) 6349–63596354
4.2. Model fitting
The HEPA filtering experiments were used to estimate
penetration. For this purpose the original time resolu-
tion of 6.5min of the particle concentration measure-
ments was used. Since indoor and outdoor
measurements were alternating, each indoor measure-
ment was taken to represent a 15min time period, and
for the outdoor concentration for that same period the
average of the measurement before and after a given
indoor measurement was used. Only data for the first
hour after HEPA filtering stopped were used. Consider-
ing the involved loss rate time constants, deposition
losses could not be entirely neglected. Thus, experi-
mental surface deposition loss rates determined by
Thatcher et al. (2002) were used in Eq. (3). Their
conditions were close to the present conditions. Their
experimental room was stirred with two small opposing
fans creating three turbulence levels (urms=2.2, 4.8, and
5.1 cm s�1, respectively). Their experiments were made
for bare floors, carpeted floors, and with furnishing and
particles were measured with an APS. In the present
study, urms was 3.5 cm s�1 and it was thus assumed that
the loss rates obtained by Thatcher et al. (2002) for
urms=2.2 cm s�1 and carpeted floor, and for
urms=4.8 cm s�1 and furnished room, respectively (in the
following termed low kdepTh and high kdep
Th , see also Fig. 3)
embraced the loss rates in the study space. The loss rates
kdepTh were corrected for difference in ceiling height (2.4m
compared with 2.7m in the present study) by multi-
plying their deposition rates with 2.4/2.7. This value was
used because as a first approximation, the loss rate for
super-micron particles is dominated by stirred gravita-
tional settling giving
kdep ffiparticle settling speed
ceiling height: (4)
No further correction was made for the difference in
surface-to-volume ratio (2.5m�1 versus 3.4m�1 in the
present study).
The penetration, P, was estimated by minimizing the
sum
SAEðPÞ ¼X
i
CðtiÞ � CmodðtiÞ�� ��
CðtiÞ(5)
for each diameter interval using the surface deposition
loss rate kdepfit =0.5 (low kdep
Th +high kdepTh ). Use of
absolute and not square deviation reduces the influence
of large deviations caused by short duration peaks. The
results for each HEPA experiments were limited to
Po1, since a value P41 would indicate that indoor
sources were active. One of the eight HEPA interven-
tions experiments resulted in a fitted penetration that
fluctuated with diameter much more than the penetra-
tion obtained from any of the other experiments and this
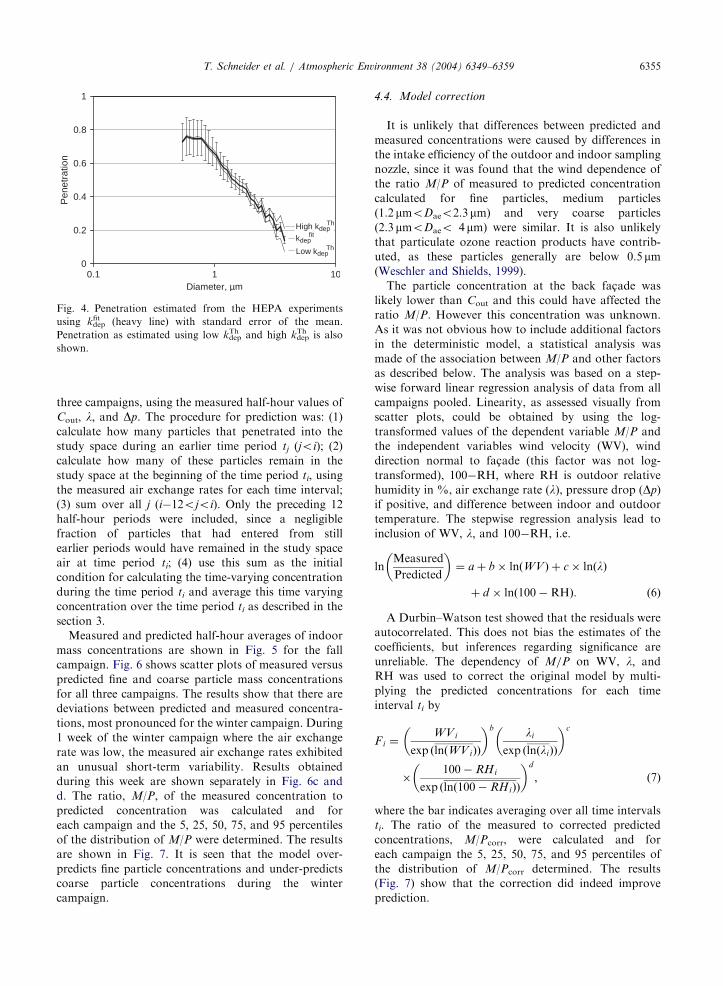
experiment was excluded. Penetration was also esti-
mated for low and high kdepTh to determine the sensitivity
of the fit to the loss rate, see Fig. 4. It is seen that P is
insensitive to the surface deposition loss rate for the fine
particles, but is sensitive to the choice of values for
coarse particles.
The conditions prevailing during the seven HEPA
experiments and the entire campaigns are compared in
Table 2. The air exchange rate was low for five and high
for two of the seven experiments.
4.3. Prediction
The model was used to predict the indoor average
concentration during the half-hour time periods ti for all
ARTICLE IN PRESS
0
0.2
0.4
0.6
0.8
1
0.1 101Diameter, µm
Pen
etra
tion
High kdepTh
kdepfit
Low kdepTh
Fig. 4. Penetration estimated from the HEPA experiments
using kdepfit (heavy line) with standard error of the mean.
Penetration as estimated using low kdepTh and high kdep
Th is also
shown.
T. Schneider et al. / Atmospheric Environment 38 (2004) 6349–6359 6355
three campaigns, using the measured half-hour values of
Cout, l; and Dp. The procedure for prediction was: (1)
calculate how many particles that penetrated into the
study space during an earlier time period tj (joi); (2)
calculate how many of these particles remain in the
study space at the beginning of the time period ti, using
the measured air exchange rates for each time interval;
(3) sum over all j (i�12ojoi). Only the preceding 12
half-hour periods were included, since a negligible
fraction of particles that had entered from still
earlier periods would have remained in the study space
air at time period ti; (4) use this sum as the initial
condition for calculating the time-varying concentration
during the time period ti and average this time varying
concentration over the time period ti as described in the
section 3.
Measured and predicted half-hour averages of indoor
mass concentrations are shown in Fig. 5 for the fall
campaign. Fig. 6 shows scatter plots of measured versus
predicted fine and coarse particle mass concentrations
for all three campaigns. The results show that there are
deviations between predicted and measured concentra-
tions, most pronounced for the winter campaign. During
1 week of the winter campaign where the air exchange
rate was low, the measured air exchange rates exhibited
an unusual short-term variability. Results obtained
during this week are shown separately in Fig. 6c and
d. The ratio, M/P, of the measured concentration to
predicted concentration was calculated and for
each campaign and the 5, 25, 50, 75, and 95 percentiles
of the distribution of M/P were determined. The results
are shown in Fig. 7. It is seen that the model over-
predicts fine particle concentrations and under-predicts
coarse particle concentrations during the winter
campaign.
4.4. Model correction
It is unlikely that differences between predicted and
measured concentrations were caused by differences in
the intake efficiency of the outdoor and indoor sampling
nozzle, since it was found that the wind dependence of
the ratio M/P of measured to predicted concentration
calculated for fine particles, medium particles
(1.2 mmoDaeo2.3mm) and very coarse particles
(2.3 mmoDaeo 4mm) were similar. It is also unlikely
that particulate ozone reaction products have contrib-
uted, as these particles generally are below 0.5 mm(Weschler and Shields, 1999).
The particle concentration at the back fac-ade was
likely lower than Cout and this could have affected the
ratio M/P. However this concentration was unknown.
As it was not obvious how to include additional factors
in the deterministic model, a statistical analysis was
made of the association between M/P and other factors
as described below. The analysis was based on a step-
wise forward linear regression analysis of data from all
campaigns pooled. Linearity, as assessed visually from
scatter plots, could be obtained by using the log-
transformed values of the dependent variable M/P and
the independent variables wind velocity (WV), wind
direction normal to fac-ade (this factor was not log-
transformed), 100�RH, where RH is outdoor relative
humidity in %, air exchange rate (l), pressure drop (Dp)
if positive, and difference between indoor and outdoor
temperature. The stepwise regression analysis lead to
inclusion of WV, l; and 100�RH, i.e.
lnMeasured
Predicted
� �¼ a þ b � lnðWV Þ þ c � lnðlÞ
þ d � lnð100�RHÞ: ð6Þ
A Durbin–Watson test showed that the residuals were
autocorrelated. This does not bias the estimates of the
coefficients, but inferences regarding significance are
unreliable. The dependency of M/P on WV, l; andRH was used to correct the original model by multi-
plying the predicted concentrations for each time
interval ti by
Fi ¼WVi
exp ðlnðWV iÞÞ
� �b li
exp ðlnðliÞÞ
� �c
�100� RHi
exp ðlnð100� RHiÞÞ
� �d
; ð7Þ
where the bar indicates averaging over all time intervals
ti. The ratio of the measured to corrected predicted
concentrations, M/Pcorr, were calculated and for
each campaign the 5, 25, 50, 75, and 95 percentiles of
the distribution of M/Pcorr determined. The results
(Fig. 7) show that the correction did indeed improve
prediction.

ARTICLE IN PRESS
0.1
1
10
100
05-10-01 10-10-01 15-10-01 20-10-01 25-10-01 30-10-01 04-11-01Date
Con
cent
ratio
n, µ
gm
-3
0.1
1
10
100
5.10.01 10.10.01 15.10.01 20.10.01 25.10.01 30.10.01 4.11.01
Date
Con
cent
ratio
n, µ
gm
-3
(a)
(b)
Fig. 5. Measured and predicted concentrations for the fall campaign. Circles: measured indoor concentration. Line: predicted indoor
concentrations. a: fine particle mass concentration: coarse particle mass concentration.
T. Schneider et al. / Atmospheric Environment 38 (2004) 6349–63596356
No relationship could be found between M/P and the
measured total suspended nitrate+nitric acid concen-
tration measured at the rural site. Since there was no
information on variations during a day, on particle size,
and on the concentration of nitrate, especially ammo-
nium nitrate, a possible influence of the nitrate fraction
of Cout on M/P could not be studied further.
The half-hour ratio M/Pcorr was averaged over a
campaign for each given half-hour. The averages
showed a daily pattern for the fine particle fraction,
both for work days and week ends for the fall campaign
(Fig. 8). The pattern was similar for the spring and less
pronounced for the winter campaign. For coarse
particles the patterns were much less pronounced.
5. Discussion
The penetration, Pfit, was found to be high for
particles below 1mm and decreased to about 0.1 at
4mm. This is in qualitative agreement with the findings
of Liu and Nazaroff (2003) and others.
For the fall and spring campaign the original model
predicted the measured coarse particle concentration
well. The median ratio of M/P was close to one, and the
ratio R95/5 of the 95 percentile to 5 percentile was 2.3 for
the fall and 2.6 for the spring campaign, respectively
(Fig. 7). The original model performed less well for all
other cases as seen from Fig. 7. Including the correction
(Eq. (7)) reduced R95/5 on average by 26% for the fine

ARTICLE IN PRESS
2:1
1:1
1:2
0.1
1
10
100
0.1(a) (b)
(c) (d)
1 10 100
Predicted, µg m-3
Mea
sure
d, µ
g m
-3
0.1
1
10
100
0.1 1 10 100
Predicted, µg m-3
Mea
sure
d, µ
g m
-3
2:1
1:1
1:2
0.1
1
10
100
0.1 1 10 100Predicted, µg m-3
Mea
sure
d, µ
g m
-3
2:11:1
1:2
0.1
1
10
100
0.1 1 10 100Predicted, µg m-3
Mea
sure
d, µ
g m
-3
2:11:1
1:2
Fig. 6. Scatter plot of predicted versus measured indoor mass concentrations. a, c: Fine fraction. b, d: Coarse fraction. a, b: Fall and
spring. c, d: Winter. Grey circles show results obtained during 1 week where the air exchange rate, which was low, showed unusually
large short-term variability.
T. Schneider et al. / Atmospheric Environment 38 (2004) 6349–6359 6357
particles and by12% for the coarse particles. For R75/25
the average reduction was 25% and 6%, respectively
(Fig. 7). It is noteworthy, that a major part of the
aberrant coarse particle results from the winter cam-
paign were obtained during a 1-week period where the
measured air exchange rates showed an unusually large
short-term variability (Fig. 6c and d). It is not known
what caused this instability and no explanation as to
why this appeared to influence the ratio M/P can be
given.
The wind velocity coefficient b (Eqs. (6) and (7)) was
positive and the air exchange rate coefficient c was
negative indicating that penetration increases with
increasing wind velocity and decreases with increasing
air exchange rate. An increase in penetration with
increasing air exchange rate could have been expected
since it has been found that penetration increases with
increasing pressure difference Dp (Mosley et al., 2001;
Liu and Nazaroff, 2003). On the other hand, a separate
effect of Dp or of wind direction was not identified in the
stepwise regression analysis. The outdoor air intake slit
was of a commonly used type. When the mechanical fan
provided a low air exchange rate (average 0.51 h�1), the
slit replaced 18% of the exhausted air, and the average
pressure difference was 4.0 Pa. At the high air exchange
rate (average 1.1 h�1), the average pressure difference
was 5.2 Pa and the slit only replaced 14% of the
exhausted air. Hence, a relatively larger fraction of

ARTICLE IN PRESS
0.1
1
10M
/P
M/P
corr
M/P
M/P
corr
M/P
M/P
corr
M/P
M/P
corr
M/P
M/P
corr
M/P
M/P
corr
Fall Winter Spring Fall Winter SpringFine Coarse
5, 2
5, 5
0, 7
5, 9
5 pe
rcen
tiles
Fig 7. The 5, 25, 50, 75, and 95 percentiles of the cumulative
distribution of the ratio M/P of the measured to predicted and
M/Pcorr of the measured to predicted (corrected by Eq. (7)) fine
and coarse particle concentration for fall, winter and spring
campaigns.
0
0.5
1
1.5
2
0 4 8 12 16 20 24Time of day
Mea
sure
d/P
redi
cted
WorkDay
WeekEnd
Fig. 8. Half-hour ratio M/Pcorr of the measured to predicted
(corrected by Eq. (7)) concentration for each half-hour
averaged over the fall campaign for work days and for week
ends, respectively. The error bars are the standard deviations
(only one-side shown).
T. Schneider et al. / Atmospheric Environment 38 (2004) 6349–63596358
make-up air penetrated through cracks at the high air-
exchange rate. Since the average pressure difference
across the front fac-ade only increased from 4.0 to 5.2 Pa
(when doubling the air exchange rate from 0.51 to
1.1 h�1), a larger part of this fraction must have entered
through the back fac-ade or from adjacent apartments.
The pressure drop across the outdoor air intake slit in
the front fac-ade varied with wind direction in agreement
with the expected pressure conditions in a street canyon
and this has the following implication. When the street
fac-ade is in the windward side, the ambient pressure is
increased and the concentration Cout at the street fac-ade
will be close to urban background. When the street fac-
ade is in the leeward side, the wind vortex within the
canyon transports street emissions up along the fac-ade.
However, the ambient pressure at the street fac-ade is
reduced thereby reducing direct penetration from this
fac-ade (Vardoulakis et al., 2003; Ni Riain et al., 2003).
The significance of this effect could not be assessed since
concentration at the back fac-ade was not measured and
simultaneous measurements of urban background for
particle sizes in the range 0.5–4 mm were not available. In
summary, the present findings suggest that both wind
velocity and air exchange rate affect the within-building
transport, and thus the amount of make-up air
originating from the interior of the building. It can also
be concluded that in future studies pressure differences
across all study space boundaries should be monitored.
The outdoor relative humidity coefficient d (Eqs. (6)
and (7)) was positive and larger for fine rather than for
coarse particles indicating that penetration increases
with increasing value of 100�RH, i.e. decreases with
increasing outdoor relative humidity. This could suggest
that there were losses due to evaporation. From Table 1
it is seen that outdoor nitrate concentrations can be
significant but it was not possible to estimate the
contribution of ammonium nitrate decomposition to
this loss. The results of Lunden et al. (2003) show that
the loss can be significant.
Fig. 8 shows a daily variation in M/Pcorr and the
highest values coincide with the time where occupants
are most likely to be present in other apartments. This
strongly indicates that occupant activities in adjacent
apartments influenced the concentration in the study
space. Opening doors and windows could facilitate
transport of outdoor particles into and within the
building and household activities are known to generate
airborne particles. The PFT measurements showed that
about one tenth of the make-up air originated from the
apartment adjacent to and the apartment below the
study space. Since the PFT measurement was made only
once and lasted 12 days, a daily variation of this air
transport could not be estimated and linked to wind
velocity and air exchange rate in the study space.
6. Conclusions
The simple dynamic model predicted well the indoor
concentration of coarse particles of outdoor origin for
the fall and spring campaign. The model performed less
well for the fine particle concentration and the winter
campaign.
The simple model could be improved by including a
correction factor obtained from a statistical model of the
association between the ratio measured to predicted

ARTICLE IN PRESST. Schneider et al. / Atmospheric Environment 38 (2004) 6349–6359 6359
indoor concentration and variation in wind velocity, air
exchange rate and outdoor relative humidity.
Indirect evidence indicated that there is transport of
particles to the study space from other apartments, and
that this transport depends on wind velocity, air
exchange rate and behaviour of occupants in other
apartments.
To improve prediction of the indoor fraction of
outdoor particles the role of particle chemical composi-
tion, penetration through all external walls, within
building transport, and occupant behaviour in other
apartments should be identified and quantified and
corresponding deterministic models be developed for
inclusion in exposure prediction models.
Acknowledgements
This work was part of Project C1 of the Centre for
Transport Research on Environmental and Health
Impacts and Policy, supported by the Danish Strategic
Environmental Research Program. Suggestions by Bill
Nazaroff during the initial phase of the project are
greatly appreciated.
References
Armendariz, A.J., Leith, D., 2002. Concentration measurement
and counting efficiency for the aerodynamic particle sizer
3320. Journal of Aerosol Science 33, 133–148.
Byrne, M.A., Goddard, A.J.H., Lange, C., Roed, J., 1995.
Stable tracer aerosol deposition measurements in a test
chamber. Journal of Aerosol Science 26, 645–653.
Dietz, R.N., Goodrich, R.W., Cote, E.A., Wieser, R.F., 1986.
Detailed desorption and performance of a passive perfluor-
ocarbone tracer system for building ventilation and air
exchange measurements. In: Trechsel, H.R., Lagus, P.L.
(Eds.), Measured Air Leakage of Buildings, ASTM STP
904. American Society for Testing and Materials, Philadel-
phia, pp. 203–264.
Ellerman, T., Hertel, O., Skjøth, C.A., Kemp, K., Monies, C.,
2003. Atmosfærisk deposition 2002. (Atmospheric deposi-
tion 2002, in Danish). Faglig rapport fra DMU, no. 466.
In: NOVA 2003. Danmarks Miljøundersøgelser. Roskilde,
Denmark, pp. 1–89.
Ibald-Mulli, A., Wichmann, H.E., Kreyling, W., Peters, A.,
2002. Epidemiological evidence on health effects of ultrafine
particles. Journal of Aerosol Medicine 15, 189–201.
Kemp K., 1993. Danish air quality monitoring network.
Technical Description, Report LMP-4/93. National Envir-
onmental Research Institute. Roskilde, Denmark.
Kunzli, N., Kaiser, R., Medina, S., Studnicka, M., Chanel, O.,
Filliger, P., Herry, M., Horak Jr., F., Puybonnieux-Texier,
V., Quenel, P., Schneider, J., Seethaler, R., Vergnaud, J.C.,
Sommer, H., 2000. Public-health impact of outdoor and
traffic-related air pollution: a European assessment. Lancet
356, 795–801.
Lai, A.C., 2002. Particle deposition indoors: a review. Indoor
Air 12, 211–214.
Liu, D.-L., Nazaroff, W.W., 2003. Particle penetration through
building cracks. Aerosol Science and Technology 37,
565–573.
Lunden, M.M., Revzan, K.L., Fischer, M.L., Thatcher, T.L.,
Littlejohn, D., Hering, S.V., Brown, N.J., 2003. The
transformation of outdoor ammonium nitrate aerosols in
the indoor environment. Atmospheric Environment 37,
5633–5644.
Mathcad, 2002. Mathcad 11. User’s Guide, Cambridge, MA,
USA. MathSoft, Inc.
Municipality of Copenhagen, 2002. Traffic census 1998–2002.
(in Danish), http://www.vejpark.kk.dk/byenstrafik/tal/
index.htm.
Mosley, R.B., Greenwell, D.J., Sparks, L.E., Guo, Z., Tucker,
W.G., Fortmann, R., Whitfield, C., 2001. Penetration of
ambient fine particles into the indoor environment. Aerosol
Science and Technology 34, 127–136.
Ni Riain, C.M., Mark, D., Davies, M., Harrison, R.M., Byrne,
M.A., 2003. Averaging periods for indoor-outdoor ratios of
pollution in naturally ventilated non-domestic buildings
near a busy road. Atmospheric Environment 37, 4121–4132.
Pope III., C.A., Burnett, R.T., Thun, M.J., Calle, E.E.,
Krewski, D., Ito, K., Thurston, G.D., 2002. Lung cancer,
cardiopulmonary mortality, and long-term exposure to fine
particulate air pollution. Journal of the American Medical
Association 287, 1132–1141.
Schwartz, J., Laden, F., Zanobetti, A., 2002. The concentra-
tion–response relation between PM (2.5) and daily deaths.
Environmental Health Perspectives 110, 1025–1029.
Switzer, P., Ott, W., 1992. Derivation of an indoor air
averaging time model from the mass balance equation for
the case of independent source inputs and fixed air exchange
rates. Journal of Exposure Analysis and Environmental
Epidemiology 2, 113–135.
Thatcher, T.L., Layton, D.W., 1995. Deposition, resuspension
and penetration of particles within a residence. Atmospheric
Environment 29, 1487–1497.
Thatcher, T.L., Lai, A.C., Moreno-Jackson, R., Sextro, R.G.,
Nazaroff, W.W., 2002. Effect of room furnishings and air
speed on particle deposition rates indoors. Atmospheric
Environment 36, 1811–1819.
Thatcher, T.L., Lunden, M.M., Revzan, K.L., Sextro, R.G.,
2003. A concentration rebound method for measuring
particle penetration and deposition in the indoor environ-
ment. Aerosol Science and Technology 37, 847–864.
Vardoulakis, S., Fisher, B.E.A., Pericleous, K., Gonzales-
Flesca, N., 2003. Modelling air quality in street canyons: a
review. Atmospheric Environment 37, 155–182.
Wahlin, P., Glasius, M., Palmgren, F., Afshari, A., Gunnarsen,
L., Bilde, M., Nielsen, O.J., Clausen, P.A., Jensen, P.A.,
Schneider, T., Fogh, C.L., 2002. Indoor and outdoor
particle measurements in a Street Canyon in Copenhagen.
The Economic and Environmental Consequences of Reg-
ulating Traffic, 2–3 February 2003, Denmark. Proceedings,
Centre for Transport Research on Environmental and
Health Impacts and Policy, Denmark.
Weschler, C.J., Shields, H.C., 1999. Indoor ozone/terpene
reactions as a source of indoor particles. Atmospheric
Environment 33, 2301–2312.