Embed Size (px)
DESCRIPTION
Presented by 李连硕,王婷婷 and 郝志伟 2013.04.19. Motivation. 1 genome. ?. Chromatin organization. Phenotypically diverse cells. Red blood cells. Fat (adipose) cells. Striated muscle cells. Stem cells. Paper’s content. - PowerPoint PPT Presentation
Citation preview

Presented by 李连硕,王婷婷 and 郝志伟2013.04.19

Motivation
1 genome
Red blood cells
Fat (adipose) cells
Striated muscle cells
Stem cells
Phenotypically diverse cells
?Chromatin
organization

Paper’s content
• Map of chromatin modificationsin various human cells, including in vivo cells
• Analysis and observations
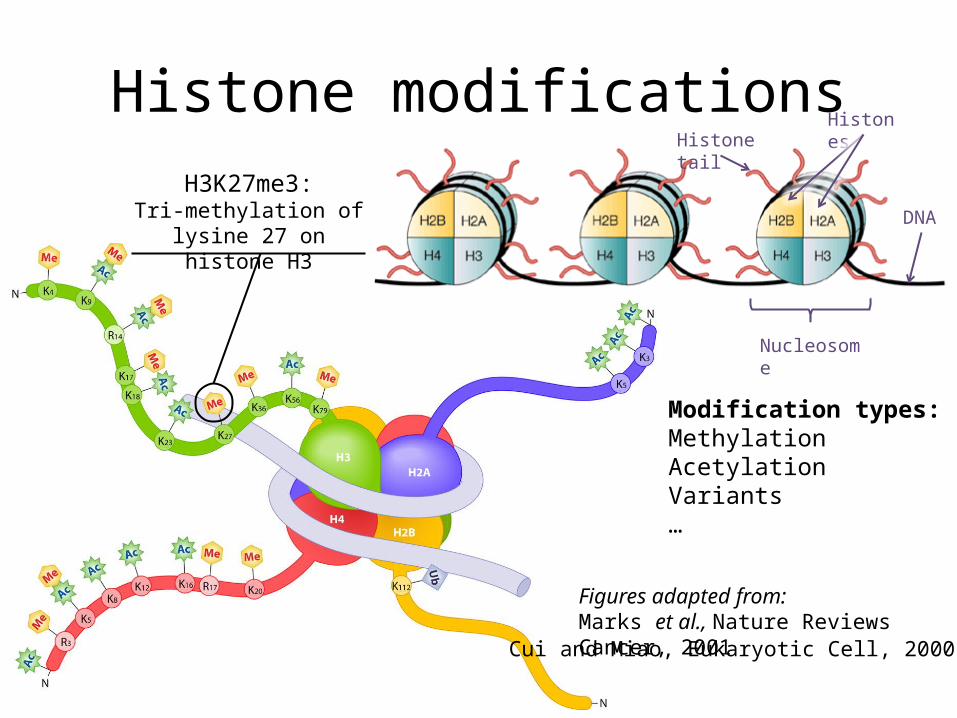
Histone modifications
Figures adapted from:Marks et al., Nature Reviews Cancer, 2001Cui and Miao, Eukaryotic Cell, 2000
H3K27me3:Tri-methylation of lysine 27
on histone H3
Modification types:MethylationAcetylationVariants…
DNA
Histones
Nucleosome
Histone tail

Histone modification associations
Repressor
• H3K27me3• H3K9me3
Enhancer
• H3K4me1• H3K27ac
Promoter
• H3K4me3• H3K9ac
Transcript
• H3K36me3
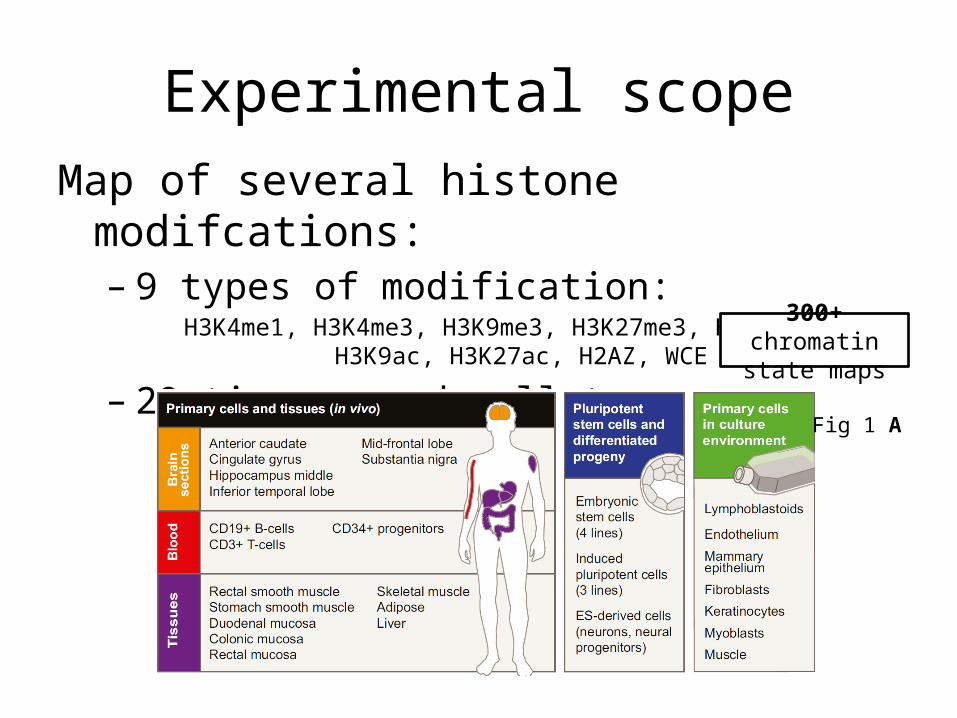
Experimental scopeMap of several histone modifcations:
– 9 types of modification:H3K4me1, H3K4me3, H3K9me3, H3K27me3, H3K36me3,
H3K9ac, H3K27ac, H2AZ, WCE
– 29 tissues and cell types:
Fig 1 A
300+ chromatin state maps

Experimental method
Shear DNA strands
Attach antibodies to target modification
High throughputSequencing
AGTTCTCATGCCTACACC
Map to reference genome& countPrecipitate
Chip-seq

Experiment results• Result: Density of each modification for each
sample along the whole genome (300 maps)
Tissue – Adipose
Brain – Mid-frontal lobe
Blood – CD19+ B-cells
Culture – Keratinocytes
Tissue – Adipose
Brain – Mid-frontal lobe
Blood – CD19+ B-cells
Culture – Keratinocytes
H3K27me3
H3K4me1
etc.http://www.broadinstitute.org/pubs/epigenomicsresource/browser

Paper’s content
1. Introduction to the chromatin state map2. De novo annotation of regulatory elements3. Observations during embryonic development4. Brain cells specificities5. Chromatin structure and nuclear architecture6. Artifacts introduced by cell culture7. Model for chromatin state transition

GENERAL VIEW ON THESE DATA

General view on these data
• Mapping reads to genome we can get reads count distribution.
• Totally we have 203 (7modifications 29 tissues) such distributions.
• Are these distributions specific to different modifications?
• MethodQuantific
ation Pairwise
correlation Heatmap 2D clustering

Measure and visualize differences between modifications
• The modifications organize into separate clusters.
• Modifications associated with
• Promoter: H3K4me3, H3K9ac
• Transcript: H3K36me3• Distal element:
H3K4me1, H3K27ac• Repressive marks:
H3K27me3, H3K9me3

Measure and visualize differences between cell types
• evident for modifications associated with regulatory activity (H3K4me1, H3K27ac), which distinguish five groups of phenotypically related tissue and cell types
• the marked separation of pluripotent stem cells from other cell and tissue types evident in the H3K27me3 and H3K4me1 projections portends a global reorganization that accompanies developmental specification

MODIFICATIONS RELATED TO ACTIVATORS

Enhancers and other distal regulatory elements have cell type specific patterns
• Annotate candidate regulatory elements by calling H3K4me1 peaks in 30 cell types
• ~377,000 putative distal regulatory elements, with a median size of 1.2 kb
• Clustering on H3K4me1 patterns revealed 23 major clusters of elements with related cell-type specificities
• each of the 23 clusters has significantly enriched motifs

Different patterns between stem cells and others

Further complexity

Global distributions of distal elements
• The proportion of the genome that lies within 50 kb of an 3K4me1+ element in each cell type– Stem cells: 85%– Others: ~50%
• Similar thing in H3K36me3– All are similar

MODIFICATIONS RELATED TO REPRESSORS


Pluripotent Cell Chromatin Is Refractory to Polycomb-Repressed State
The focal distribution of H3K27me3 in pluripotent cells could reflect reduced Polycomb activity. However, EZH2 and other Polycomb factors are highly expressed in ES cells.So they consider an alternate model and mapped H2A.Z.The conclusion is the title.

Developmental Specification Is Associated withProgressive Chromatin Restriction
DEVELOPMENTAL SPECIFICATION IS ASSOCIATED WITH PROGRESSIVE CHROMATIN RESTRICTION

• Object: the locations and characteristics of loci with H3K27me3 in the differentiated populations
Figure 4. Epigenetic States Relate to Context-Specific Genome Regulatory Programs(A) Chromatin states are depicted for a set of 100 kb loci with variable activity patterns.
distal elements
promoters
gene bodies
the number of loci
Promoter, gene, and distal element activities are largely concordant within a locus, but are correlate negatively with H3K27me3
Developmental Specification Is Associated with Progressive Chromatin Restriction

Object: whether chromatin restriction proceed under certain contexts
Figure 4. Epigenetic States Relate to Context-Specific Genome Regulatory Programs(B) Boxplots show H3K27me3 coverage of intergenic regions relative to gene bodies (left), and H3K4me1 peak density in intergenic regions relative to gene bodies (right).(C) Heatmap shows composite H3K4me1 profiles over genes and flanking regions (TSS ±25 kb and TES ±25 kb; all genes >15 kb) for each cell type (rows). (D) Heatmap (left) shows the distribution of highly conserved noncoding sequence elements over gene bodies and flanking regions (TSS ±25 kb and TES ±25 kb) for all genes >15 kb (rows).
Brain sections are notable for a high prevalence of repressive chromatin throughout intergenic regions and a relative confinement of H3K4me1 sites within genes
Brain sections display higher H3K4me1 signals in gene bodies
The top genes are strongly enriched for functional annotations related to brain physiology, including axon guidance and synapse
Developmental Specification Is Associated with Progressive Chromatin Restriction
Developmental Specification Is Associated with Progressive Chromatin Restriction
• Developmental specification is accompanied chromatin state transition regulated by polycomb repression.
• Chromatin restriction may also proceed significantly further in certain specialized cells

RELATING MACROSCALE CHROMATIN FEATURES TO NUCLEAR ARCHITECTURE

Figure 5. Macroscale Chromatin Features and Nuclear Architecture
Object: to investigate macroscale patterns of histone modification and the relationship between modification and nuclear architecture
Relating Macroscale Chromatin Features to Nuclear Architecture
four groups: (1) “active” loci with high H3K36me3 and H3K4me1 coverage, (2) “Polycomb-repressed” loci with high H3K27me3, (3) Heterochromatic loci with high H3K9me3, and (4) “Null” loci devoid of histone modification
intervals that occupy inactive nuclear compartments show enrichment for nuclear lamina contacts.
CULTURE ENVIRONMENTS TRIGGER MACROSCALE CHROMATIN STATE CHANGES

Culture Environments Trigger Macroscale Chromatin State Changes
Observation: H3K9me3 state varies markedly in its prevalence
Figure 6. Macroscale Chromatin Aberrations in Cultured Cells(A) H3K9me3 signal tracks for representative cell types are shown for a 3.5 Mb region of chromosome 16 that contains a culture-specific H3K9me3 domain.(B) Heatmap shows normalized H3K9me3 signals for 296 H3K9me3 domains (rows) in the indicated cell types (columns).
Preferential association of variable H3K9me3 domains with the culture environment

Culture Environments Trigger Macroscale Chromatin State Changes
Object: Why H3K9me3 state is rare in vivo models but 50-fold more prevalent in ∼cultured primary cells
serum growth stimuli
(E) Boxplot (left) shows expression levels of genes within culture-specific H3K9me3 domains (cluster II) in fibroblasts cultured in high or low serum. p value of Wilcoxon rank-sum test is shown. Median expression levels for these genes are also shown for lung adenocarcinoma cells undergoing TGF-β-mediated EMT
EMT and serum-exposure both lead to subtle increases in the median expression of genes underlying H3K9me3 domains

Culture Environments Trigger Macroscale Chromatin State Changes
Object: whether Suv39h1 mediates the culture-specific domains
(C) For each cluster in (B), heatmap shows H3K9me3 signals in lung fibroblasts after 4 or 10 days of Suv39h1 knockdown.(D) H3K9me3 signal tracks for two culture-specific domains are shown for lung fibroblasts after 4 or 10 days of Suv39h1 knockdown
Suv39h1 is required for the maintenance of H3K9me3 in the culture-specific domains
Suv39h1: H3K9 methyltransferase

DISCUSSION

DiscussionSpecification is accompanied by a stark transition in the epigenetic landscape from a uniquely accessible state to increasingly restrictive configurations

Contributions
• Provide a new dataset for chromatin landscape in in vivo cells
• Identified ~400,000 putative distal regulatory elements
• Updated model for chromatin reorganization during development
• Epigenomic landscape could shape the evolution of genome sequence(eg. conserved sequence in introns of genes with neuronal functions)
• Identified artifacts introduced by cell culture