Embed Size (px)
Citation preview

Pride and Prejudice: Evidence from the "Promised
Land"∗
Yona Rubinstein†and Dror Brenner‡
September 5, 2008
Abstract
There are large and persistent ethnic related disparities among Israeli born
Jews on many indicators of social welfare and economic success. We use the non
random sorting into interethnic marriage and the historical Sephardic-Ashkenazi
variations in persons’ surnames to evaluate the causal impact of Sephardic affilia-
tion on labor market outcomes. Using the Israeli Census of 1995 we estimate the
effect of a Sephardic affiliation by comparing the log hourly wages of Israeli Jews
born to Sephardic fathers and Ashkenazi mothers (SA), who are more likely to
carry a Sephardic surname, with the outcomes of Israeli Jews born to Ashkenazi
fathers and Sephardic mothers (AS). We find that SA workers earn significantly
less than their AS counterparts. SA have better educational achievements, they
perform better on cognitive achievement tests than their AS peers, their parents
achieve higher levels of education and have higher earnings than their mixed cou-
ple counterparts — suggesting that our estimates provide lower bounds for the
impact of ethnic affiliation on wages. We also find that Sephardic affiliation has
a much larger impact during early years in the labor market than in later years.
These findings are consistent with the interpretation that firms employ ethnic
stereotypes and statistically discriminate among equally productive workers in
the absence of perfect information on workers’ productivity.
∗This work benefited from comments of Rachel Friedberg, Oded Galor, Reuben Gronau, VictorLavy, Casey Mulligan, Omer Moav, Analia Schlosser and Yoram Weiss. We would like to thank GaryBecker, James Heckman, Steve Levitt and especially the late Sherwin Rosen, who encouraged us toexplore the links between human capital, stereotypes and prejudice and ethnic inequality within theIsraeli Jewish society.
†Brown University.‡Tel Aviv University.
1
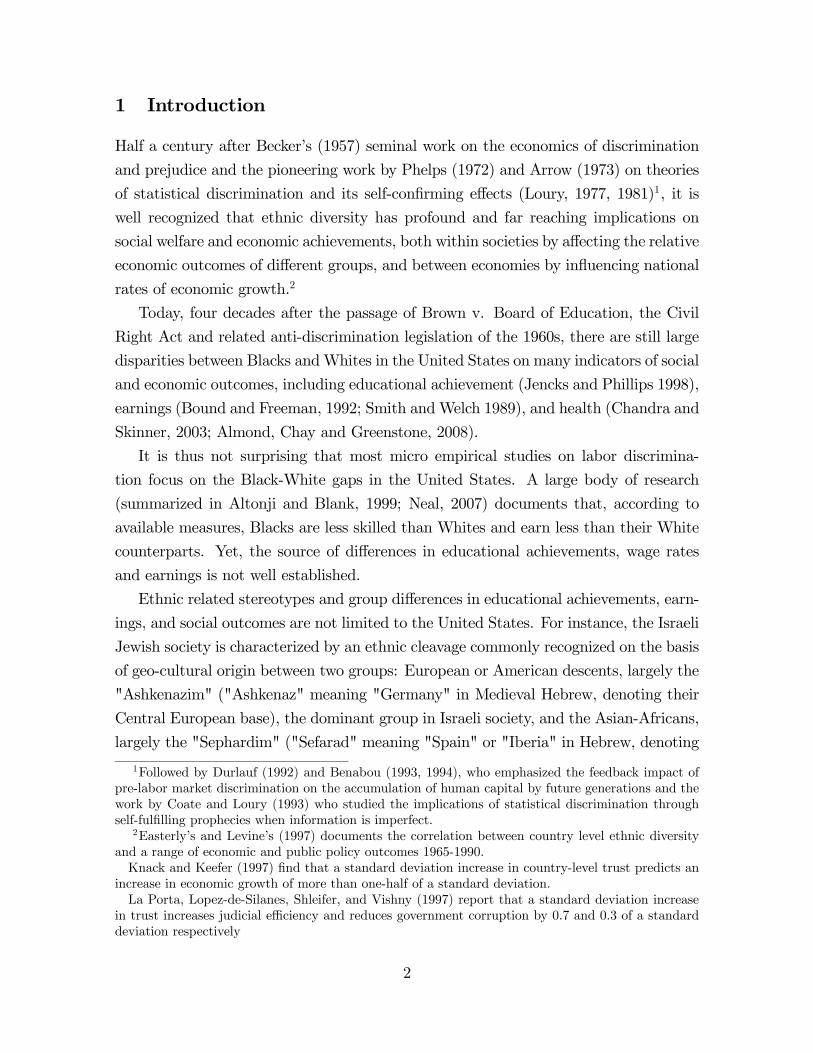
1 Introduction
Half a century after Becker’s (1957) seminal work on the economics of discrimination
and prejudice and the pioneering work by Phelps (1972) and Arrow (1973) on theories
of statistical discrimination and its self-confirming effects (Loury, 1977, 1981)1, it is
well recognized that ethnic diversity has profound and far reaching implications on
social welfare and economic achievements, both within societies by affecting the relative
economic outcomes of different groups, and between economies by influencing national
rates of economic growth.2
Today, four decades after the passage of Brown v. Board of Education, the Civil
Right Act and related anti-discrimination legislation of the 1960s, there are still large
disparities between Blacks andWhites in the United States on many indicators of social
and economic outcomes, including educational achievement (Jencks and Phillips 1998),
earnings (Bound and Freeman, 1992; Smith andWelch 1989), and health (Chandra and
Skinner, 2003; Almond, Chay and Greenstone, 2008).
It is thus not surprising that most micro empirical studies on labor discrimina-
tion focus on the Black-White gaps in the United States. A large body of research
(summarized in Altonji and Blank, 1999; Neal, 2007) documents that, according to
available measures, Blacks are less skilled than Whites and earn less than their White
counterparts. Yet, the source of differences in educational achievements, wage rates
and earnings is not well established.
Ethnic related stereotypes and group differences in educational achievements, earn-
ings, and social outcomes are not limited to the United States. For instance, the Israeli
Jewish society is characterized by an ethnic cleavage commonly recognized on the basis
of geo-cultural origin between two groups: European or American descents, largely the
"Ashkenazim" ("Ashkenaz" meaning "Germany" in Medieval Hebrew, denoting their
Central European base), the dominant group in Israeli society, and the Asian-Africans,
largely the "Sephardim" ("Sefarad" meaning "Spain" or "Iberia" in Hebrew, denoting
1Followed by Durlauf (1992) and Benabou (1993, 1994), who emphasized the feedback impact ofpre-labor market discrimination on the accumulation of human capital by future generations and thework by Coate and Loury (1993) who studied the implications of statistical discrimination throughself-fulfilling prophecies when information is imperfect.
2Easterly’s and Levine’s (1997) documents the correlation between country level ethnic diversityand a range of economic and public policy outcomes 1965-1990.Knack and Keefer (1997) find that a standard deviation increase in country-level trust predicts an
increase in economic growth of more than one-half of a standard deviation.La Porta, Lopez-de-Silanes, Shleifer, and Vishny (1997) report that a standard deviation increase
in trust increases judicial efficiency and reduces government corruption by 0.7 and 0.3 of a standarddeviation respectively
2

their Spanish and Portuguese base).3 In modern Israeli Hebrew, the term "Sephardim"
has come to denote Jews of Arabic or Persian descent whereas term "Ashkenazim" are
descendants of Jews from Germany, Poland and Austria and is often applied to all
Jews of European background living in Israel.4
Despite religious similarities, integration through the educational system, joint mil-
itary service and "collective consciousness", as well as genetic similarities between
Ashkenazi and Non-Ashkenazi Jews5, there are large and persistent ethnic related dis-
parities among Israeli-born Jews on many indicators of social welfare and economic
success including educational achievement, (Lewin-Epstein and Semyonov, 1993; Co-
hen and Haberfeld, 1998) earnings (Haberfeld and Cohen, 2006), juvenile delinquency
and adult criminal involvement (Fishman et al. , 1984; Ajzenstadt, 2005). By the
late 1990s, half a century after the establishment of the state of Israel, the "Sephardic-
Ashkenazi" wage gaps had become as large as the Black-White wage gaps in the United
States. According to the latest Israeli census data (1995), Israeli-born Jews whose fa-
thers were born in Asia or Africa, ("Sephardim"), earned only two thirds the wages of
their American-European ("Ashkenazim") counterparts and 10 percentage points less
after conditioning on education, potential experience, and region of residence (Table1). These figures are similar to the Black-White wage gaps in the United States duringthe mid 1990s as reported by Altonji and Blank (1999).6
3Ethnicity is a central dimension in Israel. In fact Israel (within the 1967 borders) can be describedmost succinctly as dual (see Lewin-Epstein and Semyonov, 1986) on two levels Israeli Jews versusIsraeli Arabs, and, within the Jewish population "Ashkenazim" and "Sephardim" as well as betweensecular and Orthodox Jews.
4For religious purposes, Jews of these communities are considered to be "Sephardim", meaning"Jews of the Spanish rite". In the same way, Ashkenazim, means for religious purposes, "Jews of theGerman rite", whether or not their families actually originate in Germany.
5The emerging genetic picture, based largely on recent body of research, using maternally inheritedmitochondrial DNA, points out to DNA similarities between Ashkenazi and Non-Ashkenazi Jews.See Behar, Metspalu, Kivisild, Achilli, Hadid, Tzur, Pereira, Amorim, Quintana-Murci, Majamaa,Herrnstadt, Howell, Balanovsky, Kutuev, Pshenichnov, Gurwitz, Bonne-Tamir, Torroni, Villems, andSkorecki. "The Matrilineal Ancestry of Ashkenazi Jewry: Portrait of a Recent Founder Event."American Journal of Human Genetics 78 (2006): 487-497. Genetic data also demonstrate the MiddleEastern origin of the Ashkenazim, who share specific alleles with other Middle Eastern Jewish and non-Jewish groups. Southern and Central European populations subsequently contributed other allelesto the Ashkenazim. For example, disequilibrium analysis of human leukocyte antigens DR and DQindicates that Ashkenazi Jews are most closely related to other Jews, next most closely to otherMediterranean populations, and less closely to Central Europeans, though carrying some CentralEuropean alleles. See Kelly Owens and Mary-Claire King. "Genomic Views of Human History",Science 286, 451 (1999).
6Altonji and Blank (1999) find that in 1995 black male workers earned about 20 percent lessthan white male workers if no controllers were included and 12 percent less once education, potentialexperience and region were controlled.
3

The large disparities in economic success are well reflected in the marriage market.7
Most marriages are within the “Ashkenazi” and the “Sephardic” groups (Goldschei-
der, 2002; Table 2a). Similar to the US the odds of interethnic union increase with
couples’ educational attainment (Qian 1997 for the US; Table 2b) whereas the ethnic
gaps in measures of educational achievement and economic success in the mixed cou-
ples’ population are much smaller. Throughout the last centuries the Ashkenazim and
Sephardim developed distinct cultural traditions, reflected in religious practice and the
use of different international “Jewish” languages (“Yiddish” and "Ladino" spoken by
Ashkenazi and Sephardic respectively).8
One of the most notable ethnic-cultural characteristics in modern Israel is a persons
family name. Family names have great importance in Judaism, as they often testify to
a person’s genealogy or place of birth. Sephardic and Ashkenazi Jews have different
and distinct surnames passed from father to son. Today, most Jewish family names in
Israel are either Sephardic or Ashkenazi. Although Israeli Jews of mixed background
are increasingly common, partly due to intermarriage between Ashkenazi and non-
Ashkenazi partners, persons’ last name is still a fair proxy of their ethnic affiliation as
the vast majority of unions are between individuals of the same origin. An illuminating
example of the popular association of ethnic-related surnames with economic outcomes
and social success, employed even by the Justice system, is the “Buzaglo test”. Buzaglo
- a well recognized typical Moroccan-Jewish last name - is a placeholder for a simple
lower-class citizen. The “Buzaglo test”, a coin termed by Aharon Barak in 1976, then
Attorney General and later Israeli Chief Justice, is used to determine whether public
figures, when accused or suspected of a crime, are treated in the same manner as
Buzaglo - a lower class Sephardic citizen - would have been treated.
The ethnic-origin-related genealogy of persons’ family names passed from father to
son and the non random sorting into interethnic unions within the Israeli Jewish society
provides an informative setting for studying the role of stereotypes and prejudice in
the labor markets. Using offspring born to mixed couples, we form treatment and
comparison groups that posses similar measures of cognitive achievements, educational
attainment and family background - however different ethnic surnames. Israeli Jews
born to Sephardic fathers and Ashkenazi mothers (SA) are more likely to carry a
7"Ethnicity", is one of the top 10 characteristics on the popular Jewish singles network JDate.com(Figure 1).
8The best-known of these differences relates to the holiday of Passover where Sephardic Jews mayeat legumes, rice, corn, peanuts and beans during this holiday, while Ashkenazi Jews prohibit thesefoods.
4

Sephardic surname and be perceived as Sephardic by the labor markets than Israeli
Jews born to Ashkenazi fathers and Sephardic mothers (AS). Comparing the labor
market outcomes of Israeli Jews born to Sephardic fathers and Ashkenazi mothers
(SA) with the labor market outcomes of their "Ashkenazi" counterparts (AS), we aim
to shed light on the impact of taste, prejudice and ethnic stereotypes on labor market
outcomes of equally productive members of a society.
Recent studies examined the impact of distinctively ethnic names on labor market
opportunities and life cycle outcomes. While field experimental studies, that use name
labels to manipulate perception, have found that resumes with traditional names are
substantially more likely to lead to job interviews than identical resumes with distinc-
tively minority-sounding names (Jowell and Prescott-Clarke, 1970; Brown and Gay,
1985; Bart et al., 1997; Bertrand and Mullainathan, 2004), Fryer and Levitt (2004)
recently found no evidence that proxies for pays are worse for those with ethnic names
after controlling for social background. As pointed out by Heckman (1998), it was
Becker’s (1957) insight that the impact of ethnic-related discrimination is determined
by prejudice and stereotypes at firms that employ ethnic workers, rather than by the
average levels of taste for discrimination. Hence, despite the mounting experimental
evidence suggesting that ethnic names serve as a hindrance in the labor market, the
presence of discriminatory employers may not be sufficiently large to affect job mar-
ket outcomes across the board. Since neither studies evaluate the impact of ethnic
names on labor market outcomes, the extent to which ethnic disparities in pays reflect
discrimination is yet to be conclusively determined.
Using the Israeli Census of 1995, the first to contain both fathers’ and mothers’
country of birth (for those born in Israel), we estimate the impact of ethnic affiliation
within the Israeli Jewish society on pays by comparing the log hourly wages of Israeli
Jews born to SA parents with the outcomes of Israeli Jews born to AS parents.
Sorting into interethnic marriages is neither exogenous to peoples’ human capital
nor to their labor market outcomes (Becker 1973, 1974, 1981). Assortative mating on
measures of economic success and human capital suggest that ethnic related differences
among those who choose to marry outside their ethnic group should be much smaller
than the measured ethnic gaps in the population. Consistent with the Becker’s theory
recent studies find the interracial marriage tends to be educationally homogenous (Qian
1997). This also holds in the Israeli Jewish society. We find that among interethnic
couples, gaps are remarkably smaller. Data on individuals educational achievements
and family backgrounds indicate that the contrast between those born to Sephardic fa-
5

thers and Ashkenazi mothers, the "treatment group", and their "Ashkenazi-Sephardic"
counterparts, the "comparison group", provides a natural variation for estimating the
causal effect of ethnic public identity, signaled by persons’ family name, on workers’
wages. Sephardic fathers and Ashkenazi mothers in mixed couples achieve higher lev-
els of education and earn more than their mixed couple counterparts. Offspring to
Sephardic fathers and Ashkenazi mothers have (slightly) better educational achieve-
ments and do better on cognitive achievement tests than their "Ashkenazi-Sephardic"
peers. Thus, it would be safe to conclude that the treatment-control contrast within
Israeli Jews born to interethnic unions truly reflects a lower bound for the impact of
ethnic affiliation on wages.
Hence it is the non random sorting into marriage - a corner stone of "marriage"
economic theory - that generates treatment (SA) and control (AS) groups. With this
experiment in mind we turn to the data. We find that full-time full-year Israeli male
workers born to Sephardic fathers and Ashkenazi mothers (SA) earn about 8 percent
less than their Ashkenazi counterparts (AS) which is about two thirds of the "unex-
plained" ethnic gap in pays between offspring born into intraethnic unions.
Ethnic discrimination might reflect both the outcome of a "taste for discrimination"
or the result of ethnic stereotypes. Fershtman and Gneezy (2001) estimate the effect
of Ashkenazi and Sephardic affiliation on behavior in the "trust game". In a set of
laboratory experiments run on Israeli undergraduate students, in which "Sephardic"
and "Ashkenazi" sounding-names were employed to signal persons’ ethnic backgrounds,
they found a systematic mistrust toward Sephardic Jews, a pattern perpetuated by
Sephardic Jews themselves.
Do Israeli employers statistically discriminate among young workers on the basis
of easily observable characteristics such as ethnic affiliation? If so, do they treat them
more equally as they learn about their productivity? If indeed the reduced-form impact
reflects stereotypes rather than prejudice the coefficients on the easily observed vari-
ables (by the employers) should fall over persons’ working cycle as firms reveal workers
productivity (Altonji and Pierret 2001). Hence, the impact of Sephardic affiliation
over the life cycle might shed light on the underlying reasons for unequal treatment of
Israeli Jews born to Sephardic fathers and Ashkenazi mothers in Israeli labor markets.
Employed with this insight in mind we turn back to the data. A first glance at the
underlying discrimination mechanism using direct measures of labor market outcomes
reveals that Sephardic affiliation has a much larger impact during the first years in the
labor market than in later years. These findings are consistent with the interpreta-
6

tion that firms, in the absence of perfect information on workers’ productivity, employ
ethnic stereotypes and statistically discriminate among equally educated workers.
The next section provides a brief overview of ethnic diversity within the Israeli
Jewish society and some background on Ashkenazi and Sephardic surnames. In sections
III and IV we describe the data sets we use and preview our rigorous analysis with a set
of stylized facts about the Sephardic-Ashkenazi wage gaps over time and generations.
The econometric framework for the empirical analysis is laid out in Section V. Section
VI provides evidence on family background, cognitive achievements and educational
attainments by parents’. In section VII we report the estimated impact of Sephardic
affiliation on wages and provide a glance for the underlying mechanism. The final
section concludes.
7

2 A Brief Background of the Ethnic Diversity within Israeli
Jewish society
Ethnicity is a central dimension of Israel’s society. Israel is a multi-ethnic society
with three levels: (i) Jews and non-Jews (mostly Arabs); (ii) Jews of European or
American origin (Ashkenazim), and Jews of Asian or African descent (Sephardim) and
(iii) secular and Orthodox Jews. In this paper we focus on the segmentation within
Israeli secular society between Jews of Asian or African origin and Jews of European
or American descent.
Ethnicity and migration to Israel
Ashkenazi Jews were the first Jewish settlers of Israel and came mainly from East
European countries. Most Sephardic Jews arrived after Israel achieved statehood and
came mainly from Muslim countries of the Middle East and North Africa. In May
1948 the newly established state of Israel had about 600,000 Jews, primarily foreign
born and of Ashkenazic origin. In the following 3 years the Israeli Jewish population
more than doubled itself, as survivors of the Jewish Holocaust in Europe and Jewish
residents of Arab countries in Asia and North Africa immigrated to the state of Israel
(Table A1). Since the late 1950s the two Jewish groups have been roughly equal in size.
During the 1990s, following the collapse of the "Iron Curtain", Israel experienced mass
migration from the former USSR. Since 1989, about one million Russian immigrants
have arrived to Israel, increasing its population by more than 15 percent during the
1990s. By the mid 1990s about half of the Israeli Jews aged 22 to 65 were born in
Israel (Figure 1a) the vast majority of them were born to parents who immigrated to
Israel (Figure 1b).
Economic and social ethnic gaps
The social, economic, and cultural assimilation of most Ashkenazi immigrants in Israeli
society was quick and comprehensive. By contrast, Sephardic immigrants, who arrived
during the mass migration, failed to close the socioeconomic gaps between them and the
other groups. For instance, in the-mid 1950s, less than a decade after the establishment
of the state of Israel, the average male Jew born in Asia or Africa earned less than 60
percent of the average male Jew born in Europe or America (Hanoch, 1961; Ben-Porath,
1986). While by the late 1970s and early 1980s the educational achievements and
earnings of Ashkenazi immigrants were no different from those of native-born Israelis
8

or settlers from the pre-state period (Boyd, Featherman and Matras 1980), immigrants
from Asia or Africa failed to achieve parity with their Ashkenazi counterparts. Unlike
cases in other immigrant societies (Borjas 1990), the gaps have not narrowed over
generations.
A large body of research documents the persistent ethnic-related gaps among Israeli-
born Jews on many indicators of social welfare, including educational achievement,
(Lewin-Epstein and Semyonov, 1993; Cohen and Haberfeld, 1998) earnings (Haberfeld
and Cohen, 2006), juvenile delinquency and adult criminal involvement (Fishman et al.
, 1984; Ajzenstadt, 2005). While the poor outcomes of first generation “Sephardim”
immigrants have often been attributed to low levels of economic development in source
countries (Eisenstadt, 1954, 1967; Shuval 1963; Semyonov and Lerhental, 1991) or lack
of personal ties with those who controlled resources (Semyonov and Tyree, 1981), the
socioeconomic gaps among the second generation (Amir, 1987; Yitchaki 1987; Mark
1989; 1994; 1996) are challenging and intriguing.
Ethnic segregation within the Israeli Jewish population is also reflected outside
of labor markets. As in the United States, the overlap of neighborhood and ethnic
origin is not limited to immigrant generations or their children, and most marriages
are within ethnic groups (Goldscheider, 2002). It is thus not surprising that Jewish
person’s “ethnicity”, is one of the top 10 characteristics on the popular Jewish singles
network JDate.com (Figure A1).
Surnames and ethnicity
Family names have great importance in Judaism, as they often testify to a person’s
genealogy or place of birth. Among Sephardic Jews, a surname may be derived from a
person’s home town, as Toledano (from Toledo), Alfasi (from Fez), Mizrahi (from the
east), or Levanti (from the Levant). They may also be derived from the name of an
important ancestor, or even refer to historic figures such as King David (Ibn Daoud is
son of David). A common prefix is Ibn, which means “son” in Arabic; thus, Ibn Malka
is “the son of Malka” (queen), and a person who carries the name Ibn Shaltiel is a
descendent of Shaltiel.
Most Ashkenazi last names are derived from three sources. The first source is ge-
nealogy: Aharonson is the son of Aharon, Abramson is son of Abram, and so on. The
second source is historical residence, such as Rotenberg (family from Rotenberg). The
third source is personal characteristics, such as Gross (Large), Klein (small), Weiss
(white). Personal characteristics also include professions historically common to the
9

family, e.g. Schneider (tailor). Generally speaking Sephardic and Ashkenazi Jews
have different and distinct names. The only exceptions are probably Cohen and Levi,
which are carried by persons of both groups. By the early 2000s, the vast major-
ity of common Jewish Family names in Israel were Sephardic (e.g. Mizrachi, Peretz,
Biton Dahan, Azulai, Gabai, Amar, Ochion, Chadad/Hadad, Ben-David, Adrei) and
Ashkenazi (Friedman, Katz, Levin) related.9
3 The Data
The data that we use in the study are taken from the 20 percent public-use micro
samples from the 1983 and 1995 Israeli censuses, the linked 1983-1995 sample and the
Life History Study of Israeli Men (LHSIM).
The Israeli Census Data
The census is the most comprehensive source of demographic and socioeconomic data
on Israel’s population10 The main sources of data used in this study are taken from
the 20 percent public use micro-files from the 1995 and 1983 Israeli censuses. The
long questionnaire is filled out by 20 percent of the population and consists of two
parts: (i) the household segment, which includes details on dwelling, living conditions,
appliances, family cars and household incomes; (ii) the personal questionnaire is filled
out by persons aged 15+ in those households and includes data on country of birth,
educational achievements, marriages, fertility, labor force characteristics and earnings11
Since army service is mandatory in Israel our main samples include individuals aged
22 to 65 (retirement age in Israel during this period). We exclude observations with
missing data on age, gender, country of birth and parents’ country of birth (for Israeli
born), educational attainments, place of residence and labor characteristics. We classify
the population into eight education categories and 9 type of locality categories. Our
wage sample exclude self-employed or observations with imputed wages. We focus on
full-time (more than 35 work hours per week) full year (12 month) workers (hereafter
FTFY) who worked the entire month for which salary is reported. We trimwage outliers
when calculating mean wages by excluding the bottom/top 1 %/99% of the salaried
9source: http://www.britam.org/jerusalem/jerusalem271to300.html10Include residents of dwellings inside the State of Israel and Jewish settlements in the occupied
territories11Documentation can be found at the Israel Social Sciences Data Center web site:
http://isdc.huji.ac.il/mainpage_e.html
10

Jewish male FTFY workers wage distribution. 12
With the 1983-1995 joint individual record, our sample matches observations from
the 20 percent public-use micro samples taken from the 1983 and the 1995 Israeli
censuses. As such, it end up covering approximately 4 percent of the Israeli population.
This unique data set provides a base for longitudinal study and the opportunity to link
young adults in 1995 to their parents in 1983 (and 1995).
Life History Study of Israeli Men
The Life History Study of Israeli Men is a systematic stratified national probability sam-
ple of Jewish Israeli men born in 1954 (Matras, Gila, and Bar Haim, 1984). The sample
consists of 2,144 men who were randomly selected from the draft list of the army and
lived in Israel in 1970. They were interviewed when they were approximately twenty-
six years old. The interviews consisted of these extensive sections: (i) retrospective
life-history questions regarding participation in various areas of life-course domains,
(ii) current family characteristics and labor market outcomes, (iii) family background,
including parental country of birth and education.
The interview data were merged with military, school and police records obtained
from the respective government agencies. The eighth grade school records (the SEKER
test scores) taken from Ministry of Education files were merged for 1,210 respondents.
The data set contains, in addition to standard socioeconomic and demographic indi-
cators, data on both father’s and mother’s country of birth.13 For all but 5 of the
1,210 respondents, military test scores were retrieved from the military files (Shavit,
1984; Featherman and Shavit, 1988). We use the revised version by Shavit (1994)
that includes scores of tests taken by the respondents before joining the IDF. These
include verbal and analytic test scores. Our main sample contains complete informa-
tion on 1141 observations after excluding those who are foreign born or have missing
demographics.
Ethnicity and country of birth in the data
We define a person’s ethnic origin by their country of birth or, for Israeli-born, by their
parents’ country of birth. Following previous studies, the foreign born are classified into
12Excluding recent (last 5 years) immigrants.13The file also contains data regarding history of schooling, the reasons for change in schools and
the men’s achievements in different life stages. Data on informal activities, occupations, salaried work,members of family and households are also included.
11

two categories: (i) Asia- Africa (the “Sephardim") and (ii) Europe-America (including
individuals born in Australia, New Zealand or the former USSR) (the “Ashkenazim").
Previous studies categorized Israelis born to “Sephardim" and “Ashkenazim" solely
by their fathers’ countries of birth (partly since other micro-data sets representing
the Israeli population, including previous census data, did not contain information
on mothers’ countries of birth for Israeli-born). This paper is the first to use both
father’s and mother’s country of birth using the 1995 censuses sample. Yet, since
the 1983 censuses sample does not provide data on mother’s country of birth and,
for comparability with previous studies, we use two indicators for Israeli-born origin:
first (i) the "inter-origin" classification, based on both father’s and mother’s country
of birth and, as in previous studies, (ii) the "intra-origin" classification based only on
father’s country of birth.
When we use both parents’ countries of birth we classify the Israeli-born population
into two main sub-groups: (i) those whose parents were both born outside of Israel and
(ii) others. Those born in Israel to parents who were both born outside of Israel are
classified into four groups: (i) both father and mother born in Europe or America
(hereafter AA), (ii) both parents born in Asia or Africa (hereafter SS), (iii) father born
in Europe or America and mother born in Asia or Africa (hereafter AS), (iv) father
born in Asia or Africa and mother born in Europe or America (hereafter SA).
When we use only fathers country of birth we classify Israeli-born Jews into three
categories by fathers’ origin: (i) father born in Asia or Africa (hereafter ISASAF), (ii)
father born in Europe or America (hereafter ISERAM) and (iii) father born in Israel
(hereafter ISIS). The 1983-1995 linked data provide the opportunity to disaggregate the
Israeli-born Jewish population also by their grandparents origin. We further classify
Israeli-born children in 1983 whose fathers were born in Israel (the ISIS) into three sub-
groups by their grandfathers’ origin: (i) grandfather born in Asia or Africa (hereafter
ISISASAF), (ii) grandfather born in Europe or America (hereafter ISISERAM) and
(iii) grandfather born in Israel (hereafter ISISIS).
4 A Glance at the Sephardic-Ashkenazi Social, Educational
and Wage Gaps
We use the 20 percent public-use micro samples from the 1983, the 1995 Israeli censuses
and the linked 1983-1995 sample to provide a brief overview of ethnic related disparities
in social outcomes and economic success within the Israeli Jewish society.
12
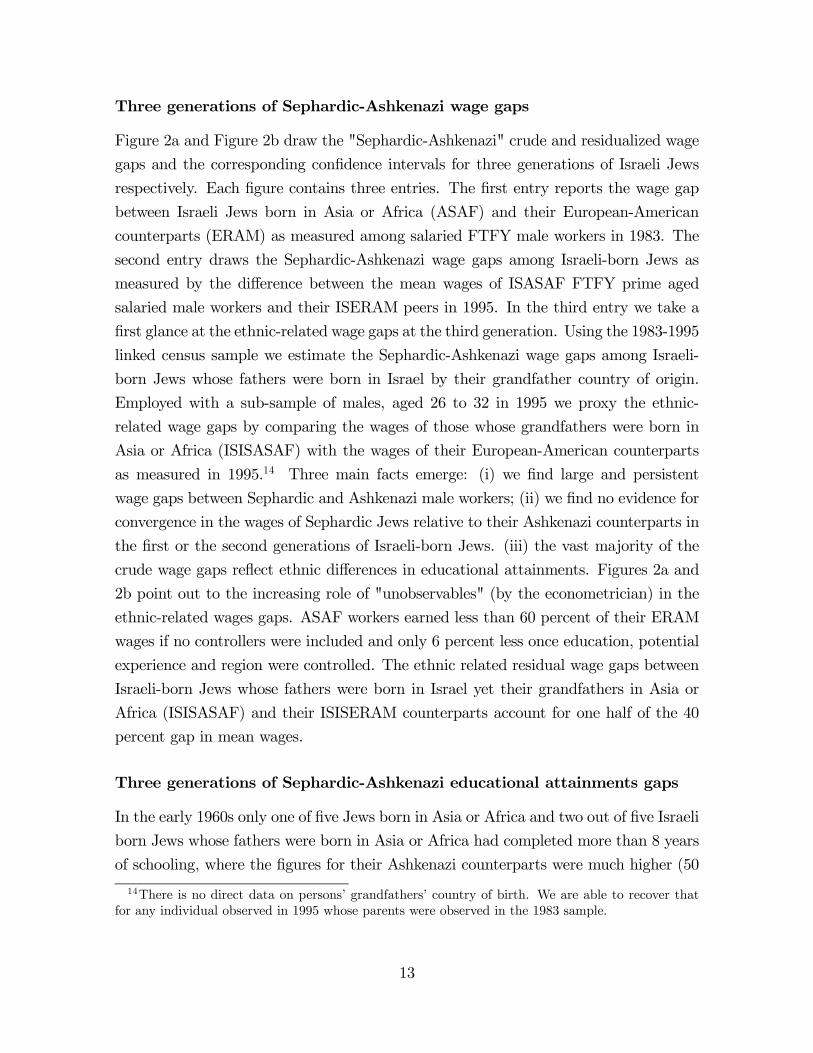
Three generations of Sephardic-Ashkenazi wage gaps
Figure 2a and Figure 2b draw the "Sephardic-Ashkenazi" crude and residualized wage
gaps and the corresponding confidence intervals for three generations of Israeli Jews
respectively. Each figure contains three entries. The first entry reports the wage gap
between Israeli Jews born in Asia or Africa (ASAF) and their European-American
counterparts (ERAM) as measured among salaried FTFY male workers in 1983. The
second entry draws the Sephardic-Ashkenazi wage gaps among Israeli-born Jews as
measured by the difference between the mean wages of ISASAF FTFY prime aged
salaried male workers and their ISERAM peers in 1995. In the third entry we take a
first glance at the ethnic-related wage gaps at the third generation. Using the 1983-1995
linked census sample we estimate the Sephardic-Ashkenazi wage gaps among Israeli-
born Jews whose fathers were born in Israel by their grandfather country of origin.
Employed with a sub-sample of males, aged 26 to 32 in 1995 we proxy the ethnic-
related wage gaps by comparing the wages of those whose grandfathers were born in
Asia or Africa (ISISASAF) with the wages of their European-American counterparts
as measured in 1995.14 Three main facts emerge: (i) we find large and persistent
wage gaps between Sephardic and Ashkenazi male workers; (ii) we find no evidence for
convergence in the wages of Sephardic Jews relative to their Ashkenazi counterparts in
the first or the second generations of Israeli-born Jews. (iii) the vast majority of the
crude wage gaps reflect ethnic differences in educational attainments. Figures 2a and
2b point out to the increasing role of "unobservables" (by the econometrician) in the
ethnic-related wages gaps. ASAF workers earned less than 60 percent of their ERAM
wages if no controllers were included and only 6 percent less once education, potential
experience and region were controlled. The ethnic related residual wage gaps between
Israeli-born Jews whose fathers were born in Israel yet their grandfathers in Asia or
Africa (ISISASAF) and their ISISERAM counterparts account for one half of the 40
percent gap in mean wages.
Three generations of Sephardic-Ashkenazi educational attainments gaps
In the early 1960s only one of five Jews born in Asia or Africa and two out of five Israeli
born Jews whose fathers were born in Asia or Africa had completed more than 8 years
of schooling, where the figures for their Ashkenazi counterparts were much higher (50
14There is no direct data on persons’ grandfathers’ country of birth. We are able to recover thatfor any individual observed in 1995 whose parents were observed in the 1983 sample.
13

and 80 percent).15 By the mid 1980s the Israeli-born Jews whose fathers were born in
Asia or Africa completed 12 years of schooling (measured among 22-25 years of age),
two years less than their European-American counterparts. A closer look at the data
reveals that most of the progress was accomplished at the low end of the educational
outcomes distribution. Employed with the census data we take a glance at educational
attainments ethnic related gaps, as measured among young adults just after the college
age. We measure the Sephardic-Ashkenazi gaps among three generations. We use three
outcomes: (i) years of schooling completed, (ii) matriculation eligibility (BAGRUT) 16
and (iii) academic degree rates among high school graduates with a BAGRUT title.
Table 2 summarizes our main findings. Two main facts emerge. While the gap in
completed years of schooling shrank we find no evidence for similar trends in the share
of high school graduates with a BAGRUT certificate and among BAGRUT certified
those with academic degrees.
Interethnic unions
Sephardic-Ashkenazi segregation within the Israeli Jewish population is well reflected
outside of the labor markets. Despite religious similarities; integration through the
educational system; military service and “collective consciousness” due to Israel’s se-
curity situation; and the genetic similarities between Ashkenazi and Non-Ashkenazi
Jews that dilute ethnic barriers; after three generations, by the late 1990s, about three
out of four unions among Jews in Israel were between members of the same ethnic
category (Table 3a). The educational attainments gaps and the persistent disparities
in pays suggest that the fact that Israeli-born Jews are much more likely to marry
within their ethnic groups might reflect sorting on skills rather than social preferences.
We take a glance at the economic and social factors by comparing the actual inter
marriage rates among recently married (last five years) Israeli-born Jews with the
likelihood to obtain an interethnic match in a "blind date". We do so by calculating
the probability of a random man and a random woman to match outside their group.
Using the 1995 census data we classify the recent married population of Israeli-born
Jews by their fathers origins into three main groups: (i) those whose fathers were born
15Source: Ben-Porath, (1986).16Matriculation eligibility (BAGRUT) is a certification ascertained by passing a series of national
exams in core and elective subjects beginning in tenth grade but with most taken during the eleventhand the twelfth grade. A minimum of twenty credit units is required to qualify for a matriculationcertificate. Students choose to be tested at various proficiency levels, each test awarding 1—5 creditunits per subject depending on difficulty.
14

in Asia or Africa (ISASAF), (ii) their European-American counterparts (ISERAM) and
(iii) those whose fathers were born in Israel (ISIS). We calculate the actual and the
"blind date rates" in the entire sub-population and by education levels. We report our
findings in Table 3b. Three main facts emerge: (i) the rate of intraethnic marriage
among Israeli-born Jews is 50 percent higher than the likelihood to randomly marry
within your ethnic group; (ii) the extra within group marriage drops with education; yet
(iii) we find that even among college graduates (at least BA degree) the within group
marriage rates are about 20 percent higher than the likelihood to form an intraethnic
union in a "blind date".
Hence, the lack of interethnic marriage within the Israeli Jewish society is mainly
associated with measures of economic success rather than social preferences. The
persistent gaps in educational attainments and the assortative mating on educational
attainments by Israeli-born Jews indicate that children born to Ashkenazi unions have
on average better educated parents who earn substantially more than their Sephardic
counterparts. Yet, our findings also suggest much smaller differences in the family
backgrounds of Israeli-born Jews by father origin in mixed unions.
In the next sections we take advantage of that to identify the reasons for the per-
sistent ethnic-related wage gaps in the Israeli Jewish society.
5 The Empirical Approach
Recent attempts to evaluate the impact of labor market discrimination against minori-
ties on wages (Neal and Johnson, 1996; Altonji and Pierret, 2001) aim at controlling
for workers’ market productivity by measures of cognitive achievement, which could be
affected by market discrimination (Heckman, Stixrud and Urzua, 2006). Indeed, the
wage gap between Israeli Jews born to Sepharadic fathers and their counterparts born
to Ashkenazi fathers might reflect factors other than discrimination based on family
name. Following Becker (1973, 1974, 1981) - as well as the common knowledge outside
of academic journals - we view sorting into interethnic marriages as neither exogenous
to peoples’ human capital nor to their labor market outcomes. Offspring to Ashkenazi
couples might have more labor market skills than their counterparts. For this reason
we focus on the sub-sample of Israeli Jews born to mixed couples. If Israeli Jews born
to Sephardic fathers and Ashkenazi mothers–who are more likely to possess Sephardic
name–have similar labor market skills, proxy by educational achievements, cognitive
test scores and family background as their “Ashkenazi-Sephardi” counterparts, then
15

it would be safe to conclude that the treatment-control contrast within Israeli Jews
born to interethnic unions truly reflects a lower bound of the impact of ethnicity on
wages. In the next sub-section we draw out a simple statistical model and our explicit
identifying assumptions
The statistical model
Let Yi denote the log hourly wage of person i. For the sake of simplicity let us assume
that people carry either a Sephardic or an Ashkenazi surname. Let Ni equal to 1 if
person i posses a Sephardic surname and 0 otherwise. outcomes are determined by
whether person i possesses a "Sephardic" surname (Ni = 1). For simplicity of illustra-
tion let us assume that wages are given by a linear-in-the-parameters specification:
Yi = δNi + βXi + εi, (1)
where X is a vector of observed controls, β is the vector of returns associated with
X and εi represents unobserved (by the econometrician) idiosyncratic person-specific
influences on the outcome of interest. The parameter of interest δ measures the causal
effect of a "Sephardic" surname on outcomes.
Family names have great importance in Judaism, as they often testify to a person’s
genealogy or place of birth. Jews from Asia or Africa were likely to posses a Sephardic
surname whereas Jews immigrating to Israel from Europe or America were more likely
to posses an Ashkenazi name. People choose whether to carry their father’s surname
in order to maximize their expected utility. If labor markets use surnames name as a
signal, then it might be costly to have a Sephardic name. Yet, it not be a "free lunch"
to abandon it either. Social interactions in one’s own ethnic community yield lower
utility for those who do not carry their family name, as it might signal to their peers
that they do not have an affinity to their community (see Fryer and Levitt 2004). Let
N∗ denote the net latent benefit associated with having a Sephardic surname, assuming
a linear-in-the-parameters specification:
N∗i = θFi + νi, (2)
where Fi is a binary variable that equals 1 if person i’s father was born in Asia or Africa
and 0 otherwise. θ stands for the utility associated with having a Sephardic surname
and the error term ν is such that ν F . Note that ε and ν might be correlated which
would mean that persons’ surnames are not randomly assigned within ethnic groups.
16

People posses a Sephardic surname if and only if the benefits exceed the costs, which
means:
Ni = 1 (N∗i > 0) , (3)
where N is a binary variable that equals 1 if person i possesses a Sephardic name
and 0 otherwise, and 1 is an indicator function, i.e. 1(A) = 1 if A is true and 1(A) = 0
otherwise. The reduced form relationship between person’s name and father’s country
of birth is:
Ni = γ (θ)Fi + i, (4)
where γ (θ) = Pr (Ni = 1 | θ, Fi = 1)− Pr (Ni = 1 | θ, Fi = 0) .
Assuming that F is not correlated with the person specific wage shocks in the
outcome’s of interest equation (1) the Wald estimator provides consistent estimates of
the "Sephardic" family name effect on wages:
δ =E (Yi | F = 1)−E (Yi | F = 0)E (Ni | F = 1)−E (Ni | F = 0)
. (5)
We do not observe persons’ names. Moreover, in reality not all surnames can
be classified as either "Sephardic" or "Ashkenazi". Yet, given the well established
association between surnames and person ethnic origin it will be fair to assume that
0 < γ ≤ 1. Employed with these identifying assumptions, we obtain a lower boundfor the causal impact of "Sephardic" family name on wages by estimating a reduced
form statistical model. Substituting (4) into (1) , the "reduced form" wage equation
exhibits the following linear-in-the-parameters specification:
Yi = ηFi + βXi + μi, (6)
where μi = δ i + εi and η stands for the reduced from impact of father’s origin on
wages. Assuming that parents’ origin has no direct effect on observed characteristics
then the OLS estimator in Equation (6) provides a lower bound for the causal impact
of "Sephardic" surname on wages:
p lim ηOLS = γδ ≤ δ. (7)
It is worth noticing that the OLS provides a consistent lower bound for the causal im-
pact of a Sephardic surname on labor market pays as long as X (F = 1) ≥ X (F = 0) .
17

6 Family Background, Cognitive Achievements and
Educational Attainments by Parents’ Origin
With our statistical model in mind we turn to the data. Using the 20 percent public-use
micro-files from the 1995 Israeli census we compare the background and outcomes of
Israeli Jews whose fathers were born in Asia or Africa (hereafter: ISFASAF (F = 1))
with the outcomes of Jews born in Israel to fathers born either in Europe or America
(hereafter: ISFERAM (F = 0)). The difference between the mean wages of ISFASAF
and the mean wages of ISFERAM provides a lower bound for the causal impact of a
Sephardic surname iff ISFASAFs are as skilled as their ISFERAM counterparts. There-
fore, we precede the wage gap estimation with a detailed look at the skill gap proxy
by individuals’ educational attainments, cognitive test scores and family backgrounds.
Educational Attainments
Figure 3a and Figure 3b display the educational achievements of Israeli Jews born in
Israel whose parents’ were born outside of Israel by their parents’ origin. We clas-
sify individuals into four sub-groups: (i) both father and mother born in Europe or in
America (AA), (ii) both parents born in Asia or Africa (SS), (iii) father born in Europe
or America and mother born in Asia or Africa (AS), (iv) father born in Asia or Africa
and mother born in Europe or America (SA). We use three measures to proxy educa-
tional attainments: (i) matriculation (BAGRUT) eligibility, (ii) college and advanced
degree and (iii) number of school years completed. Figure 3a and Figure 3b report
mean group outcomes relative to the average outcomes of the AS group. Two main
findings emerge. Clearly, there are large and significant differences between the educa-
tional outcomes of Israeli Jews born to interethnic unions. AA Israeli-born Jews have
higher levels of education than all other ethnic combinations, whereas SS Israeli-born
Jews are lagging behind all others. For instance, prime age AA (30 to 55) complete
about two more years of schooling than their SS counterparts and about one more year
of schooling than their interethnic counterparts. These differences are also reflected
in measures of education quality. Average matriculation-certificate eligibility of SS is
about 30 percent lower than that of AA and 15 percent below that of interethnic unions.
While we do find large disparities between AA, mixed union and SS groups’ outcomes,
we find almost no differences between offspring born to interethnic couples (defined by
their father and mother origin). The educational attainments of SA Israeli-born Jews
are statistically indistinguishable from the outcomes of their AS counterparts.
18

Family Background and Parents’ Origin
Years of schooling completed is a partial and an indirect measure of human capital.
While it is a proxy for time devoted to the accumulation of skills through formal
schooling, it might fail to account for children’s and young adults’ investment in human
capital. Different schools differ in curricula, and even within schools some children
receive better inputs than others. Informal schooling, e.g. parents’ inputs at early
stages of development, vary greatly among children within and between ethnic groups.
In the next subsections we take a glance at family background and test scores by
parents’ origin.
The Census data does not provide data on parents’ income or education. To proxy
family background we generate “synthetic parents” assuming that mothers were 20 to
35 years of age when they gave birth. For example the “synthetic mother” a person
aged 35 in 1995 has the characteristics of the average married women born between
1925 and 1940, by her continent of origin and her spouse origin. The "synthetic fathers"
have the characteristics of those actually married to the synthetic mothers. We use
four measures to proxy parental background: (i) years of schooling completed, (ii)
matriculation certificate, (iii) college education (or advanced degree) and (iv) log hourly
wages. We measure these both for men (fathers) and women (mothers). We present
our findings in Figures 4a and 4b. The benchmark group in all figures is men born in
Europe or America and women born in Asia or Africa.
We find large disparities between the family backgrounds of Jews born in Israel
by parents’ origin. Similar to individuals’ educational achievements, we find large
differences between AA and SS men and women who married within their respective
ethnic group. European-American men married to European-American women have
higher educational achievements and earn, on average, more than all other married
men. We also find that men born in Asia or Africa who married within their ethnic
group earn less and posses less schooling, on average, than all other married men.
This also holds for women’s outcomes (see Figure 4b). Yet, while we find almost no
differences between the education of AS and SA, we do find systematic differences
between their “synthetic parents”. As Figures 4a and 4b make clear, on average ASAF
males married to ERAM women achieve higher levels of education and earn more than
ASAF men married to ASAF women. This also holds for their spouses. ERAM women
married to ASAFmen earn more and have higher levels of education than ASAFwomen
married to ERAM men. Clearly the SA couples dominate their AS counterparts; they
are better educated and earn more. In fact, by some measures the outcomes of SA
19

couples are statistically indistinguishable from the outcomes of their AA counterparts.
Cognitive Test Scores by Parents’ Origin
Schooling and other forms of investment in human capital, particularly in the early
stages of children’s development, affect performance on cognitive tests (Shavit and
Featherman 1988). Early childhood environments are major predictors of cognitive
and non-cognitive abilities (Carneiro and Heckman, 2003) whereas early investment
in children yields the largest returns (Cunha et al 2007). There are many reasons
why persons with the same educational attainments and family backgrounds may have
significantly different skill sets. Neal (2007) finds substantial Black-White gaps in cog-
nitive test scores among children, teenagers and young adults, which remained constant
or increased in absolute value since the late 1980s. Both cognitive and non-cognitive
traits are important for skill formation and labor market outcomes (Heckman and
Rubinstein, 2001). Neal and Johnson (1996) find that it accounts for much of the
Black-White wage gap. The remarkable similarities between race gaps in academic
achievements in the United States and Israel, as well as the role of cognitive skills in
accounting for Black-White wage gaps, suggest that differences in cognitive achieve-
ments between Sephardic and Ashkenazi-born Jews are a major source of "unexplained"
ethnic wage gaps.
To address this question we take advantage of the Life History Study of Israeli Men
data set, a stratified sample of Jewish Israeli men selected from the army draft list
who were born in 1954 and lived in Israel in 1970. The dataset contains, in addition
to standard socioeconomic data and demographics, data on both father’s and mother’s
country of birth. It also includes verbal and analytic test scores of respondents before
they joined the IDF. We focus on the sample of Israeli-born Jews whose parents were
born outside of Israel. We use two classifications of ethnic groups: by (i) father’s origin
and by (ii) father’s and mother’s origin. We report our findings in Tables 4a and 4b.
Table 4a shows the test-scores of Israeli-born Jews by father’s origin. Clearly,
Israeli-born Jews whose fathers were born in Europe or America (ISAERAM) do bet-
ter than their Asian-African counterparts. These results hold even when we account
for years of schooling. Next, we take a closer look by father’s and mother’s origin. We
find that Israeli-born Jews whose both parents were born in Asia or Africa score signif-
icantly lower than all others, whereas their European-American counterparts achieve
higher scores than others (Table 4b). We also find that the offspring of SA parents do
slightly better than their AS counterparts. It is worth noting that, while AS achieve
20

significantly lower test scores than their AA counterparts, we find SA Israeli-born Jews
to be statistically indistinguishable from their AA counterparts.
Hence, individuals’ observed educational attainments, measures of family back-
ground and common proxies for cognitive skills indicate that Israeli-born Jews whose
fathers were born in Asia or Africa and mothers were born in Europe or America are
as least as skilled as their AS counterparts. Thus, it would be safe to conclude that the
treatment-control contrast within Israeli Jews born to interethnic unions truly reflects
a lower bound for the impact of ethnicity on wages.
7 The Impact of Sephardic Surname on Market Pays
Israeli Jews whose fathers were born in Europe or America have higher academic
achievements than their Asian-African counterparts. This suggests that the lower
earnings of Israeli-born Jews who carry a Sephardic surname reflect a skill gap rather
than labor market discrimination against Sephardic-affiliated Israeli-born Jews. Yet,
for the very same reason, Sephardic-Ashkenazi wage gaps between Israeli Jews born to
mixed couples should not be attributable to a lack of skills. With this identification
strategy in mind, we turn to the data.
Using data taken from the 20 percent public-use micro-files of the 1995 Israeli
census, we estimate the mean wages of FTFY Israeli-born Jews whose parents were
born outside of Israel, by father’s and mother’s origin. We report our findings in Table
5. The table reports the coefficients on three dummy variables representing the AA,
SA and the SS sub-groups. The benchmark group is Israeli-born Jews whose fathers
were born in Europe or America and whose mothers were born in Asia or Africa. One
major fact emerges: SA workers earn about 8 percentage points less than their AS
counterparts which is more than half the log hourly wage gap between AA and SS
FTFY workers.
As expected, SS FTFY workers earn less than all others. SS FTFY workers earn
about 13 percent less than their AA counterparts. This gap might reflect an unobserved
(to the econometrician) skills gap between these groups. It is thus surprising to find that
SA FTFY workers, who are statistically indistinguishable from their AA counterparts,
earn almost as low as their SS peers. This evidence indicates that, as of the mid 1990s,
much of the Sephardic-Ashkenazi wage gap reflects discrimination against Israeli-born
Jews with Sephardic affiliation, rather than disparities in human capital.
Ethnic discrimination might reflect a "taste for discrimination" or ethnic stereo-
21

types. Statistical discrimination is difficult to identify and past empirical studies have
been inconclusive. Altonji and Pierret (2001) argue that the coefficients on easily ob-
served variables (by the employers) should decrease over individuals’ working cycles
as firms reveal worker productivity (Altonji and Pierret 2001). Equipped with this
insight, we use variation in wages over the life cycle to shed light on underlying sources
of discrimination. It is worth noting that wages vary over the life cycle due to reasons
other than market learning. On-the-job training (Mincer, 1974; Heckman Lochner and
Todd, 2004; Rubinstein and Weiss, 2007) is a prime example. Stereotyping, which re-
duces the returns to investment in human capital (Coate and Loury, 1993), may cause
minorities to invest less in on-the-job training.
With this caveat in mind, we again turn to the data. We reevaluate the reduced-
form impact on FTFY workers aged 30 to 42 and on those aged 43 to 55. We report our
findings in Table 6. Two main facts emerge. We find that the wage differential between
AS and SA workers reflects the causal impact of fathers’ origin during individuals’ first
years working FTFY in the labor market. During these years, SA FTFY workers earn
about seven percentage points less than their AS counterparts. We find no differences
in wages between these groups later in life. Results indicate that the decline in the
SA-AS wage gap reflects the growing gap between AA and AS workers, rather than
better outcomes of the SA group relative to their AA counterparts.
22

8 Conclusion
The growing mobility of individuals across borders has been transforming relatively
homogenous populations into multi-ethnic economies, which suggests that economists
should strive to better understand the causes and consequences of cultural barriers. The
Israeli Jewish society provides an excellent quasi-experimental setting for studying the
impact of cultural-based prejudice on labor market outcomes and feedback effects.
The Israeli Jewish society is characterized by an ethnic cleavage on the basis of
two groups: those of European or American descents, the "Ashkenazim", and those
of Asian or African descent, the "Sephardim". A large body of research documents
vast and persistent disparities between ethnic groups among Israeli-born Jews on many
indicators of social welfare and economic success, including educational achievement.
By the late 1990s, the wage gap between Israeli-born Sephardic Jews and Israeli-born
Ashkenazi Jews had become as large as the Black-White wage gap in the United States.
Much of the wage gap reflects persistent differences in academic achievements; yet, as
in the United States, the source of differences in educational achievements, wage rates
and earnings has not been fully determined.
In this respect, Israel provides an illuminating setting for studying the role of stereo-
types and prejudice in the labor markets. In this study we take advantage of the (i) eth-
nic gaps in measures of human capital and educational achievements, (ii) origin-related
genealogy of persons’ family name and (iii) interethnic unions - unique attributes of
the Israeli Jewish society - to evaluate the impact of prejudice and ethnic stereotypes
on the labor market outcomes of equally productive workers.
Family names have great importance in Judaism, as they often testify to a person’s
genealogy or place of birth. Today, most common Jewish family names in Israel are
Sephardic or Ashkenazi. Using this common knowledge, we focuse on two sub-groups:
(i) Israeli Jews born to Sephardic fathers and Ashkenazi mothers who are more likely
to carry a Sephardic surname and, therefore, be treated in labor markets as Sephardic
and (ii) Israeli Jews born to Ashkenazi fathers and Sephardic mothers who carry an
Ashkenazi family name and are, therefore, more likely to be perceived as Ashkenazi
by labor markets. We estimate the reduced-form impact of Sephardic affiliation on
pays by comparing the log hourly wages of Israeli Jews born to Sephardic fathers and
Ashkenazi mothers with the outcomes of Israeli Jews born to Ashkenazi fathers and
Sephardic mothers.
Using the Israeli Census of 1995, the first to contain both fathers’ and mothers’
country of birth (for those born in Israel), we compare the log hourly wages of Israeli-
23

born Sephardic Jews (ISASAF) with the outcomes of their Ashkenazi counterparts
(ISERAM). We find that FTFY male ISASAF workers earn about 12 percent less
than their ISERAM counterparts - once education, potential experience and region
were controlled for. Next, we take a closer look at our "natural historical experiment"
sample. Comparing the log hourly wages of Israeli-born SA Jews with the outcomes
of their AS counterparts we, find that FTFY Israeli male workers born to Sephardic
fathers and Ashkenazi mothers earn about 8 percent less than those born to Ashkenazi
fathers and Sephardic mothers, which is approximately half of the gap between intra-
ethnic Israeli-born Jews.
SA have better educational achievements, they perform better on cognitive achieve-
ment tests than their AS peers, their parents achieve higher levels of education and
have higher earnings than their mixed couple counterparts. Thus they were expected
to earn more. Nevertheless they are being paid less. This contrast, summarized in
Figure 5a and Figure 5b, suggests that our estimates provide lower bounds for the
impact of ethnic based discrimination on wages.
Finally, we take a first glance at the underlying discrimination mechanism. Ethnic
discrimination might reflect both the outcome of a "taste for discrimination" or the re-
sult of ethnic stereotypes. Do Israeli employers statistically discriminate among young
workers on the basis of easily observable characteristics such as ethnic affiliation? If
so, do they treat them more equally as they learn about their productivity? Statisti-
cal discrimination is difficult to identify, perhaps since wages vary over the life cycle
due to reasons other than market learning. Stereotypes, which reduce the returns to
investment in human capital (Coate and Loury, 1993), may cause minorities to invest
less on the job. We reevaluate the reduced-form impact on wages of prime aged FTFY
workers over early and later stages of their FTFY careers. Our findings are consistent
with the interpretation that firms, in the absence of perfect information on workers’
productivity, employ ethnic stereotypes and statistically discriminate among equally
productive workers. Moreover, we find that the drop in the impact of Sephardic affil-
iation is due to a decline in the wages of AS workers rather than an increase in the
wages of SA workers; perhaps too late for the SA workers. These findings point toward
feedback effects of discrimination on workers’ investment, as well as to the importance
of future work on the dynamic consequences of statistical discrimination.
24

References
[1] Ajzenstadt, M. & Borowski, A. (2005) Setting things straight: Probation officers’
perspectives on the impacts of the introduction of public defenders on the juvenile
court in Israel. Qualitative Social Work: Research and Practice, 4(1), pp.33-50.
[2] Almond, D., Chay, K. & Greenstone, M. (Forthcoming) Civil Rights, the War on
Poverty, and Black-White Convergence in Infant Mortality in the Rural South and
Mississippi. American Economic Review.
[3] Altonji, J.G. & Blank, R.M.(1999) Race and gender in the labor market. In: Orley,
A., Card, D. eds., Handbook of Labor Economics. St. Louis, MO, Elsevier, vol. 3.
, pp. 3143—3259.
[4] Shmuel, A. (1987) Trends in Earnings Gaps among Jewish Men during the 70’s
by Country of Origin. Survey of Bank of Israel , No. 63, pp.43—64.
[5] Arrow, K.J. (1973) The Theory of Discrimination. In: Ashenfelter, O. & Rees, A.
eds., Discrimination in labor markets. Princeton, NJ, Princeton University Press,
pp. 3—33.
[6] –––––––. (1973) Higher education as a filter, Journal of Public Economics,2(3) July, pp.193—216.
[7] –––––––. (1998) What Has Economics to Say about Racial Discrimina-
tion?. Journal of Economic Perspectives. 12(2), Spring, pp.91—100.
[8] Becker, G.S. (1957)The Economics of Discrimination. Chicago, IL. The University
of Chicago Press.
[9] –––––––. (1973) A Theory of Marriage: Part I. The Journal of Political
Economy, 81(4), pp. 813-846.
[10] –––––––. (1974) A Theory of Marriage: Part II. The Journal of Political
Economy, 82(2), pp. S11-S26.
[11] Ben-Porath, Y. (1986) The Israeli Economy: Maturing Through Crises. Came-
bridge, MA. Harvard University Press.
25

[12] Bertrand, M. & Mullainathan, S. (2004) Are Emily and Greg More Employable
Than Lakisha and Jamal? A Field Experiment Evidence on Labor Market Dis-
crimination. The American Economic Review, 94(4), pp.991-1014.
[13] Brown, C. & Gay, P. (1985) Racial discrimination 17 years after the act. London,
Policy Studies Institute.
[14] Carneiro, J. & Heckman, J. (2003) What Role for Human Capital Policies?. In:
Heckman, J.J, Krueger, A.B. & Friedman, B. eds. Inequality in America. Cam-
bridge, MA, MIT Press, Ch. 2, pp. 77—237.
[15] Coate, S. & Loury, G. C. (1993) Will Affirmative-Action Policies Eliminate Neg-
ative Stereotypes? American Economic Review 83 (5), pp.1220—1240.
[16] Cohen, Y. & Haberfeld, Y. (1998) Second generation Jewish immigrants in Is-
rael: have the ethnic gaps in schooling and earnings declined?. Ethnic and Racial
Studies, 21(3), pp.507—528.
[17] F. Chuna et al. (2007) Interpreting the Evidence on Life Cycle Skill Formation. In:
Hanushek, E.A & Welch, F. eds. The Handbook of the Economics of Education,
Elsevier B.V., Vol 1, Ch. 12.
[18] Donohue, J. & Heckman, J.J. (1991) Continuous versus Episodic Change: The Im-
pact of Civil Rights Policy on the Economic Status of Blacks. Journal of Economic
Literature, 29(4), pp. 1603-43.
[19] Eisenstadt, S. (1985) The Transformation of Israeli Society: An Essay in Inter-
pretation, Boulder CO, Westview Press.
[20] Featherman, D.L. & Shavit Y. (1988) Schooling, Tracking, and Teenage Intelli-
gence. Sociology of Education, 61(1), pp. 42-51.
[21] Fershtman, C. & Gneezy, U. (2001) Discrimination in a segmented society: an
experimental approach. Quarterly Journal of Economics, 116(1), 351—377.
[22] Friedberg, Rachel M. (2001). The Impact of of Mass Migration on Israeli Labor
Market. Quarterly Journal of Economics, 66, 1373—1408.
[23] Fryer Roland G. Jr. and Steven D. Levitt (2004). Understanding the Black-White
Test Score Gap in the First Two Years of School. The Review of Economics and
Statistics, May, 86(2): 447—464.
26

[24] Fryer, R.G. Jr. & Levitt, S.D. (2004) Understanding the Black-White Test Score
Gap in the First Two Years of School. The Review of Economics and Statistics,
86(2), pp.447—464.
[25] Fryer, R.G. Jr. & Levitt, S.D (2004) The Causes and Consequences of Distinctively
Black Names. The Quarterly Journal of Economics, 119(3), pp. 767—805.
[26] Goldscheider, C. (2002). Israel’s Changing Society: Population, Ethnicity, and
Development. Boulder, CO. Westview Press Inc; 2Rev Ed edition.
[27] Haberfeld, Y. & Cohen, Y. (2007) Gender, ethnic, and national earnings gaps in
Israel: The role of rising inequality. Social Science Research, 36 (2), pp. 654—672.
[28] Hanoch, G. (1961) Income Differentials in Israel, in Fifth Report 1959 and 1960
(Hebrew and English).
[29] Heckman, J.J. (1995) Lessons from the Bell Curve. Journal of Political Economy,103(5), pp. 1091—1120.
[30] –––––––. (1998) Detecting Discrimination. Journal of Economic Perspec-
tives, 12(2), pp. 101—116.
[31] Heckman, J.J., Lochner, L. & Todd, P. (2004) Fifty Years of Mincer Earnings
Equations, NBER Working Papers 9732, National Bureau of Economic Research,
Inc.
[32] Heckman, J.J, Lyons ,T. & Todd,P. (2000) Understanding Black-White Wage
Differentials, 1960—1990. American Economic Review, 90(2), pp. 344—349.
[33] Heckman, J.J., Stixrud, J. & Urzua S. (2006). The Effects of Cognitive and
Noncognitive Abilities on Labor Market Outcomes and Social Behavior. Journal
of Labor Economics, 24(3), pp.411-482.
[34] Jencks, C., & Phillips, M. (1998). The black-white test score gap: An Introduction.
In: Jencks,C. & Phillips M. eds, The black-white test score gap. Washington, DC,
Brookings Institution, pp.1-51.
[35] Chinhui, J., Murphy, K. & Pierce, B. (1991) Accounting For the Slowdown in
Black-White Wage Convergence. In: Marvin H.K, ed.Workers and Their Wages:
Changing Patterns in the U.S. Washington D.C, AEI Press.
27

[36] Kaganoff, B.C. (1977)A Dictionary of Jewish Names and their History. New York,
Schocken Books.
[37] Lewin-Epstein, N. & Semyonov, M. (1986) Ethnic Group Mobility in the Israeli
labor Market. American Sociological Review, 51(3), pp.342—352.
[38] Lewin-Epstein, N., Semyonov, M. (1992) Local labor markets, ethnic segregation,
and income inequality. Social Forces 70(4), 1101—1119.
[39] Loury, G.C. (1981) Intergenerational Transfers and the Distribution of Earnings.
Econometrica, 49 (4), pp.843—867.
[40] Mark, N.(1994) Ethnic Gaps in Earning and Consumption in Israel. Economic
Quarterly, 41(1), pp.55—77.
[41] Matras J., Noam G. & Bar Haim I. (1984) Young Israelis at the Threshold: A
Study of the 1954 Cohort of Israeli Men. Final report (D102.84). Brookdale Insti-
tute.
[42] Neal, D., & William. R.J. (1996) The Role of Pre-market Factors in Black-
WhiteWage Differences, Journal of Political Economy, 104(5), pp.869—895.
[43] Phelps, E.S. (1972) The Statistical Theory of Racism and Sexism. American Eco-
nomic Review, 62(4), pp.659—661.
[44] Qian, Z. (1997). Breaking the Racial Barriers: Variations in Interracial Marriage
Between 1980 and 1990. Demography, 34(2), pp. 263-276.
[45] Rubinstein, Y & Brenner, D. (2003). The Origin Related Wage Gaps: Evidence
from the ‘Promised Land. Unpublished Manuscript. Sapir Center for Development,
Tel Aviv.
[46] Rubinstein, Y. & Weiss Y. (2007) Post School Earnings: Search versus Human
Capital. In: Hanushek, E.A & Welch, F. eds. The Handbook of the Economics of
Education, Elsevier B.V., Vol 1 Ch.1
[47] Haya, S. & Shavit Y. (1994) Age at Marriage, Sex-Ratios, and Ethnic Heterogamy.
European Sociological Review, 10(1), pp.79-87
[48] Semyonov, M. & Lerhental, T. (1991) Country of Origin, Gender, and the Attain-
ment of Economic Status: A Study of Stratification in the Jewish Population in
Israel. Research in Social Stratification and Mobility, 10, pp.325—343.
28

[49] Shavit, Y. (1984) Tracking and Ethnicity in Israeli Secondary Education. Ameri-
can Sociological Review, 49(2), pp. 210-220.
29

Table 1The Gap in Log of Hourly Wages Between Individuals Born in Israel by Family Origin (Asia/Africa or Europe/America) in 1995
Age
Variables 22-65 30-55
(i) (ii) (iii) (iv)
Born in Israel, ‐0.462 ‐0.106 ‐0.426 ‐0.122father born in Asia or Africa (0.007) (0.007) (0.008) (0.008)
Born in Israel, ‐0.231 ‐0.015 ‐0.139 ‐0.019father born in Israel (0.010) (0.009) (0.012) (0.011)
Controls YES YES
R-squared 0.119 0.399 0.114 0.329
N 32913 32913 23505 23505The table reports the coefficient on a dummy variable representing individuals who are second generation in Israel The interpretation of the coefficient is the mean wage gap in the second generation as measured in 1995, betweenthose from Asia/Africa origin relative to those from Europe/America origin. In all regressions odd numbered columns present the crude wage gap while even numbered columns present the wage gap conditional on potential experience, school years completed and area of residencePotential experience was calculated as age-school years completed-6 and we control for a quartic in experience.School years completed are represented by 8 dummy variables constructed from the highest diploma variable.We control for a full set of dummy variables for each area of residence in the year of the census.( ) Robust standard errors are reported in parethesis

Table 2Gaps in Educational Attainments for Three Generation of Immigrants to Israe Jewish MalesIsraeli Population Census of 1983 and 1995 and the linked 1983-1995 Sample
Panel A: Males aged 30 to 55
Generation in Israel
1st (ASAF/ERAM) 2nd (ISASAF/ISERAM) 3rd (ISISASAF/ISISERAM)
Ethnic School Years Bagrut Academic School Years Bagrut Academic School Years Bagrut Academic Group Completed Rate Degree Completed Rate Degree Completed Rate Degree
(i) (ii) (iii) (iv) (v) (vi) (vii) (viii) (ix)
Sephardi -3.3 -0.3 -0.2 -2.4 -0.3 -0.2 -2.3 -0.4 -0.3
(0.035) (0.004) (0.008) (0.028) (0.004) (0.007) (0.407) (0.077) (0.085)
Ashkenazi 13.7 0.5 0.5 14.0 0.6 0.6 14.0 0.7 0.5(0.085) (0.012) (0.023) (0.154) (0.020) (0.028) (0.465) (0.145) (0.167)
Panel B: Males aged 26 to 32
Generation in Israel
1st (ASAF/ERAM) 2nd (ISASAF/ISERAM) 3rd (ISISASAF/ISISERAM)
Ethnic School Years Bagrut Academic School Years Bagrut Academic School Years Bagrut Academic Group Completed Rate Degree Completed Rate Degree Completed Rate Degree
(i) (ii) (iii) (iv) (v) (vi) (vii) (viii) (ix)
Sephardi -2.0 -0.3 -0.1 -1.4 -0.3 -0.2 -2.3 -0.4 -0.3
(0.067) (0.010) (0.018) (0.043) (0.008) (0.011) (0.407) (0.077) (0.085)
Ashkenazi 12.3 0.5 0.3 13.2 0.6 0.4 14.0 0.7 0.5(0.096) (0.016) (0.026) (0.055) (0.011) (0.015) (0.465) (0.145) (0.167)

Table 3a Marriage Within/Between Groups of Origin by Decade of Marriage and School Years Completed
Hus -A Hus -A Hus -S Hus -S Same Mixed Fraction from AllDecade of Marriage Wf -A Wf -S Wf -A Wf -S Origin Origins Marriages in Decade
(1) (2) (3) (4) (5) (6) (7)All1970's 0.37 0.10 0.08 0.44 0.81 0.19 0.901980's 0.36 0.10 0.09 0.45 0.81 0.19 0.831990's 0.31 0.12 0.13 0.45 0.76 0.24 0.71
The table presents the fractions of marriages within/between groups of origin by decade of marriage and the number ofschool years completed by the husband and the wife. The figures in the table are NOT the fraction of couples that actually married in each decade but those who married in each decade and are still married at the time of the relevant census. We used the 1995 census to compute the fraction of marriages in the 1980sand the 1990s. We used the 1983 census to compute the fraction of marriages in the 1970sThe table focuses on couples whose exact origin is identified. If, for example, the husband's father was born in Israel weare not able to know if the husband origin is from Asia/Africa or Europe/ America. Therefore, in column 7 we present the fractionsof marriages for which we identified the origin for both husband and wife out of all lasting marriages in that decade

Table 3bAssortative Mating by Origin*: the Gap Between Randomly Matched and Actual Couples Using Data Taken from The Israeli 1995 Census on Recently Married Israeli-Born Jews
Panel A. Summary of Intra Group Marriages (Subsamples of Origin and Education of both Husband and Wife)
All At least Bagrut At least BA
Subsample ASHK/SPH ALL ASHK/SPH ALL ASHK/SPH ALL
(1) (2) (3) (4) (5) (6)
Actual Marriages 70.5 52.1 63.8 45.3 63.4 42.1
Random Assignment 53.9 37.1 50.0 33.5 53.8 35.0
Panel B. Fraction of Intra Group Marriages (All individuals and by Educationanl Achievenents of both Husband and Wife)
All At least Bagrut At least BA
Origin of Wife Origin of Wife Origin of Wife
ASHK SPH ISR ASHK SPH ISR ASHK SPH ISR
ASHK 10.9 9.1 7.9 14.6 9.9 11.4 17.6 8.3 15.3
7.6 13.5 6.8 12.2 12.6 11.0 16.5 9.2 15.5
SPH 9.1 32.6 7.9 9.1 18.8 7.5 7.3 9.4 7.1
13.5 24.0 12.0 12.0 12.4 10.9 9.5 5.3 8.9
ISR 7.2 6.8 8.6 10.4 6.4 11.9 15.2 4.7 15.2
6.1 10.9 5.5 9.8 10.1 8.9 14.1 7.8 13.2
The tables reports the fraction of actual marriages inside\outside one's origin group. It compares the actual figures to the figures produced by randomlymatching couples in the population taking into account the fraction of each origin's males and females in the population. The sample are individuals,, currently married, age 25-30 married for the first time, are married less than 5 years and are in israel mre than 5 years*ASHK -Ashkenazi (ERAM or ISR_FERAM).SPH -SPHARDI (ASAF or ISR_FASAF).ISR - (ISR_FIS)
Hus
ban

Table 4aOrigin Related Gaps in Analytic and Verbal Tests Administered to IDF Candidatesby Father's OriginMen History File, Israeli Born
Panel A: Absolute Scores
Variables Analytic Scores Verbal Scores
(i) (ii) (iii) (iv)
Fasaf -2.84 -1.25 -3.28 -1.71 (0.29) (0.26) (0.27) (0.23)Controlling forEducation No Yes No Yes
R-squared 0.08 0.34 0.12 0.40
Observations 1141 1141 1141 1141
Panel B: Standardized Scores
Analytic Scores Verbal Scores
(i) (ii) (iii) (iv)
Fasaf -0.56 -0.25 -0.70 -0.36 (0.06) (0.05) (0.06) (0.05)Controlling forEducation* No Yes No Yes
R-squared 0.08 0.34 0.12 0.40
Observations 1141 1141 1141 1141
Notes: Every Israeli man has to take a test prior to his manadatory service in the Israeli Defence Forces (IDF).This test is comprised of three sections: (i)Analytic (2) Verabl and (3) Non cognitive evaluation test. The table reports the results of the first two tests for a sample of Israeli born men for whom both father and mother's counrty of birth is known. The comparison group is individuals with a Ashkenazi fatheronly. In this sample the range of the analytic score is between 5-33 and the range for the verbal score is between 0-21. *Controls are dummies for 0-4, 5-8, 9-11, 12, Matriculation,13+ years of schooling.There are also two dummies indicating skipping/repeating a class
( ) Robust standard errors are reported in parethesis

Table 4bOrigin Related Gaps in Analytic and Verbal Tests Administered to IDF Candidatesby Father's and Mother's OriginMen History File, Israeli Born
Panel A: Absolute Scores
Variables Analytic Scores Verbal Scores
(i) (ii) (iii) (iv)
AA 2.37 1.12 2.61 1.32 (0.95) (0.82) (0.87) (0.73)
SA 2.66 2.25 1.65 1.18 (1.49) (1.27) (1.36) (1.13)
SS ‐0.69 ‐0.28 ‐0.89 ‐0.52 (0.94) (0.81) (0.86) (0.72)Controlling forEducation No Yes No Yes
R-squared 0.09 0.34 0.13 0.40
N 1141 1141 1141 1141
Panel B: Standardized Scores
Analytic Scores Verbal Scores
(i) (ii) (iii) (iv)
AA 0.47 0.22 0.56 0.28 (0.19) (0.16) (0.19) (0.15)
SA 0.53 0.45 0.35 0.25 (0.30) (0.25) (0.29) (0.24)
SS ‐0.14 ‐0.05 ‐0.19 ‐0.11 (0.19) (0.16) (0.18) (0.15)Controlling forEducation* No Yes No Yes
R-squared 0.09 0.34 0.13 0.40
N 1141 1141 1141 1141Notes: Every Israeli man has to take a test prior to his manadatory service in the Israeli Defence Forces (IDF).This test is comprised of three sections: (i)Analytic (2) Verabl and (3) Non cognitive evaluation test. The table reports the results of the first two tests for a sample of Israeli born men for whom both father and mother's counrty of birth is known. The comparison group is individuals with a Sepharadic father and Ashkenazi mother. In this sample the range of the analytic score is between 5-33 and the range for the verbal score is between 0-21. *Controls are dummies for 0-4, 5-8, 9-11, 12, Matriculation,13+ years of schooling. There are also two dummies indicating skipping/repeating a class
( ) Robust standard errors are reported in parethesis

Table 5The Gap in Log of Hourly Wages Between Individuals Born in Israel from the Second Genratio by Origin of Both Parents in 1995
Age
Variables 22-65 30-55
(i) (ii) (iii) (iv)
Father - Asia/Africa SA ‐0.099 ‐0.066 ‐0.070 ‐0.079Mother - Europe/America (0.033) (0.027) (0.042) (0.035)
Father - Europe/America AA 0.354 0.055 0.272 0.064Mother - Europe/America (0.021) (0.018) (0.025) (0.022)
Father - Asia/Africa SS ‐0.151 ‐0.061 ‐0.186 ‐0.067Mother - Asia/Africa (0.020) (0.017) (0.024) (0.022)
Controls YES YES
R-squared 0.147 0.383 0.133 0.321
Observations 30385 30385 22379 22379
The table reprots the coefficients on three dummy variables representing three different combinations of origins of fathers and mothers to Israeli born Individuals. The comparison group are individuals born in Israel whose father was born in Europe/America and whose mother was born in Asia/Africa.All individuals are jewish salaried males working full time full year in 1995. The regression were estimated for two age groups: (i) 22-65 and (ii) 30-55.In all regressions odd numbered columns present the crude wage gap while even numbered columns present the wage gap conditional on potential experience, school years completed and area of residence.Potential experience was calculated as age-school years completed-6 and we control for a quartic in potential experience. School years completed are represented by 8 dummy variables constructed from the highest diploma variable.We control for a full set of dummy variables for each area of residence in the year of the census.
( ) Robust standard errors are reported in parethesis

Table 6The Gap in Log of Hourly Wages Between Individuals Born in Israel from the Second Genratio by Origin of Both Parents Over Life Cycle (measured in 1995)
Aged 30 to 55
Variables All 30 to 42 43 to 55
(i) (ii) (iii) (iv) (v) (vi)
Father born in Asia/Africa SA ‐0.070 ‐0.079 ‐0.137 ‐0.102 ‐0.008 0.010Mother born in Europe/America (0.042) (0.035) (0.046) (0.040) (0.089) (0.078)
Father born in Europe/America AA 0.272 0.064 0.185 0.044 0.251 0.133Mother born in Europe/America (0.025) (0.022) (0.027) (0.024) (0.063) (0.060)
Father born in Asia/Africa SS ‐0.186 ‐0.067 ‐0.185 ‐0.078 ‐0.196 ‐0.002Mother born in Asia/Africa (0.024) (0.022) (0.026) (0.023) (0.064) (0.061)
Controls YES YES YES
R-squared 0.141 0.337 0.095 0.296 0.108 0.285
Observations 18659 18659 12462 12462 6197 6197
The table reprots the coefficients on three dummy variables representing three different combinations of origins of fathersand mothers to Israeli born Individuals. The comparison group are individuals born in Israel whose father was born inEurope/America and whose mother was born in Asia/Africa.All individuals are jewish salaried males working full time full year in 1995. The regression were estimated for two age groups: (i) 22-65 and (ii) 30-55In all regressions odd numbered columns present the crude wage gap while even numbered columns present the wage gap conditional on potential experience, school years completed and area of residencePotential experience was calculated as age-school years completed-6 and we control for a quartic in potential experience.School years completed are represented by 8 dummy variables constructed from the highest diploma variable.We control for a full set of dummy variables for each area of residence in the year of the census.
( ) Robust standard errors are reported in parethesis

The figure divides the Israeli Jewish population age 22‐65 in 1995 into three sub populations by continent of origin, namely, those born in: (i) Europe or America (ii) Asia or Africa and (iii) those born in Israel. For the first two sub groups we present the five main countries of origin. For the Israeli born population we present the main five countries where their father was born The rest of the countries of origin are presented under the categories 'Other'population we present the main five countries where their father was born. The rest of the countries of origin are presented under the categories Other Asia/Africa, Other Europe/America and Other Israel. The data is taken from the 1995 Census and included is all the jewish population including recent immigrants. The distinction within the former USSR was done by the Israeli Central Bureau of Statistics.
U ( th )Poland
Other Europe/America
Uk i
Romania
Ussr (other) Israel
Morocco
P l dEurope & America‐ 27.7%
Russia
Ukraine Poland
IraqYemen
p
Israeli Born ‐ 53.2%(by Father Country of Birth)
YemenOther Asia/Africa Other Israel
Asia & Africa‐ 19.1%
MoroccoIraq
IranTunisia
Figure 1aThe Composition of the Jewish Population in Israel , in 1995, by Continent and Five Main Countries of Origin

Father and Mother Born in Europe/America
Father Born in Asia/Africa Mother Born in Europe/America
The figure divides the Israeli born jewish population age 22‐65 in 1995 into three sub populations by parents' country of birth: (i) Both parents were born outside Israel ;(ii) At least one parent was born abroad; (iii) Both parents were born in Israel.Those whose parents were born outside of Israel are classified into four groups by parents ' continent of birth. The data is taken from the 1995 Census and included is all the jewish population including recent immigrants. The distinction within the former USSR was done by the Israeli Central Bureau of Statistics.
Either Parent Born in Israel ‐ 29% Parents Born Outside Israel ‐ 71%
Father Born in Europe/America Mother Born in Asia/Africa
Father and Mother Born in Asia/Africa
Israeli born Parents
Only One Parent is Israeli Born
Figure 1bThe Composition of the Israeli Born Jewish Population in Israel Age 22‐65, in 1995, by Parents Continent of Birth

The figure shows the Sephardic‐Ashkenazi wage gaps (and the corresponding confidence intervals) over three generations as measured among FTFY salaried male workers aged 30 to 55 either in 1983 or in 1995. In particular: (i) the gap between immigrants born in Asia/Africa relative to immigrants born in Europe/America (age 30‐55 ) in 1983(ii) the gap between individuals born in Israel whose parents were born in Asia/Africa relative to individuals born in Israel whose parents were born in Europe America ( 30 55 ) i 1995 d (iii) th b t i di id l b i I l h f th b i I l d th i t l df th b i A i /Af i l ti t
‐0.70
(age 30‐55 ) in 1995 and (iii) the gap between individuals born in Israel whose father was born in Israel and their paternal grandfather was born in Asia/Africa relative to their counterparts whose paternal grandfather was born in Europe/America (age26‐32) in 1995.
‐0.60
0 50‐0.50
‐0.40
‐0.30
‐0.20
0 10‐0.10
0.00
/ / /ASAF/ERAM ISASAF/ISERAM ISISASAF/ISISERAM
Figure 2aCrude Gaps in the Log of Hourly Wages for Three Generations of Immigrants to Israel at age 30‐55 Measured in 1995

The figure shows the Sephardic‐Ashkenazi residualized wage gaps (and the corresponding confidence intervals) over three generations as measured among FTFY salaried male workers aged 30 to 55 either in 1983 or in 1995. In particular: (i) the gap between immigrants born in Asia/Africa relative to immigrants born in Europe/America (age 30‐55 ) in 1983(ii) the gap between individuals born in Israel whose parents were born in Asia/Africa relative to individuals born in Israel whose parents were born in E A i ( 30 55 ) i 1995 d (iii) th b t i di id l b i I l h f th b i I l d th i t l df th b i
‐0.50
Europe America (age 30‐55 ) in 1995 and (iii) the gap between individuals born in Israel whose father was born in Israel and their paternal grandfather was born in Asia/Africa relative to their counterparts whose paternal grandfather was born in Europe/America (age26‐32) in 1995. All specifications control for potential experience, educational attainments dummies and dummies for area of residence.
‐0.40
‐0.30
‐0.20
‐0.10
0.00
0.10
ASAF/ERAM ISASAF/ISERAM ISISASAF/ISISERAM
Figure 2bGaps in the Residuals of Log of Hourly Wages for Three Generations of Immigrants to Israel at age 30‐55 Measured in 1995

Th fi h th f d ti l i 1995 b t i di id l b i I l t diff t i f t l i i 22 65 Ed ti lThe figure shows three measures of educational gaps,in 1995, between individuals born in Israel to different mixes of parental origin age 22‐65. Educationalgaps are presented relative to the comparison group of individuals born in Israel to a father who was born in Europe/America and a mother who was born in Asia/Africa (AS). The three measures of educational attainments are (i) highschool graduates with matriculation certificate (BAGRUT) (ii) College and advanced degrees and (iii) number of school years completed).
1
1.5
0.15
0.20
ee)
0.50.05
0.10
ompleted
vanced
Degre
‐0.5
0
‐0.05
0.00
hool Years Co
ulation, Adv
‐1‐0.15
‐0.10 Sch
ons (M
atricu
Fraction with College Education and Ad
Fraction With Matriculation Certificate
‐1.5‐0.20
Father‐A Mother‐A Fater‐ A Mother ‐ S Father‐S Mother‐A Father ‐ S Mother S
Fractio
School Years Completed
Figure 3aGaps in Educational Attainments by Parents Origin,age22‐65, Measured in 1995

The figure shows three measures of educational gaps,in 1995, between individuals born in Israel to different mixes of parental origin age 30‐55. Educational gaps are presented relative to the comparison group of individuals born in Israel to a father who was born in Europe/America and a mother who was born in Asia/Africa (AS). The three measures of educational attainments are (i) highschool graduates with matriculation certificate (BAGRUT)
1.50
0 20
0.25
(ii) College and advanced degrees and (iii) number of school years completed).
1.00
0 10
0.15
0.20
Degrees)
0 00
0.50
0 00
0.05
0.10
Completed
, Advan
ced D
‐0.50
0.00
0 10
‐0.05
0.00
Scho
ol Years
atriculation
,
F ti With M t i l ti C tifi t
‐1.00
0 20
‐0.15
‐0.10 S
ractions (M
a Fraction With Matriculation Certificate
Fraction with College Education and Ad
School Years Completed
‐1.50‐0.25
‐0.20
Father‐A Mother‐A Fater‐ A Mother ‐ S Father‐S Mother‐A Father ‐ S Mother S
Fr p
Figure 3bGaps in Educational Attainments between by Parents Origin,Age 30‐55, Measured in 1995

0
1
2
0.0
0.1
0.2
Com
plet
ed
Mat
ricul
atio
n an
d C
oleg
e)The figure presents wage (purple column ‐ third from the left) and educational attainments gaps in 1983 beteween jewish married males ,for whom we identify their wife ,by the origin mix of the couple. The comparison group which is ommited are men who were born in Europe/America and are married to women born in Asia/Africa.The husbands presented in the figure were born between 1920‐1945 and therefore (assuming they had their first child when they were at least 20 years old) comprise the cohorts of parents to individuals who were 30‐55 in 1995. There are three measures of educational attainment (i) school years completed (ii) fraction of highschool graduates with a matriculation certificate (BAGRUT) and (iii) Fraction with at least college education.
-4
-3
-2
-1
-0.3
-0.2
-0.1
Husband - A Wife - A Husband - A Wife - S Husband - S Wife - A Husband - S Wife - S
Scho
ol Y
ears
C
Hou
rly W
age
and
Frac
tions
(M
Figure 4aGaps in Educational Attainments and Hourly Wages Between Married Men
("Synthetic Fathers") by Husband and Wife Origin
High School Graduates with Matriculation
College Graduates (BA and Advanced Degree)
Log of Hourly Wage
School Years Completed

1
0
1
2
0 1
0
0.1
0.2
s Co
mpleted
cula
tion
and
Col
ege)
The figure presents wage (purple column ‐ third from the left) and educational attainments gaps in 1983 beteween jewish married females , for whom identified a husband by the origin mix of the couple. The comparison group which is ommited are women who were born in Asia/Afria and are married men born in Europe/America .The wives presented in the figure were born between 1920‐1945 and therefore (assuming they had their first child whenthey were at least 20 years old) comprise the cohorts of parents to individuals who were 30‐55 in 1995. There are three measures of educational attainment (i) school years completed (ii) fraction of highschool graduates with a matriculation certificate (BAGRUT) and (iii) Fraction with at least collegeducation
-4
-3
-2
-1
-0.4
-0.3
-0.2
-0.1
Husband - A Wife - A Husband - A Wife - S Husband - S Wife - A Husband - S Wife - S
Scho
ol Years
Hou
rly W
age
and
Frac
tions
(Mat
ric
Figure 4bGaps in Educational Attainments and Hourly Wages Between Married Women
("Synthetic Mothers") by Husband and Wife Origin
High School Graduates with Matriculation
College Graduates (BA and Advanced Degree)
Log of Hourly Wage
School Years Completed

The figure shows both "parents "and offsprings outcomes (wage and school years completed) for jewish male working full year full time in 1995. The comparison group that is ommited are individuals born in Israel whose father was born in Asia/Africa and their mother was born in Europe/America. These individuals were between 30-55 years old in 1995 The "parents" are individuals born between 1920-1945 and therefore (assuming their first child was born when they were at least 20 years old) are theyears old in 1995. The parents are individuals born between 1920 1945 and therefore (assuming their first child was born when they were at least 20 years old) are the cohorts of parents. for the 30-55 years old individuals. While this is not a parent-offspring matched sample , we picked for the parents sample only married individuals whom we identified as couples living together.
1
2
0.1
0.15
0
0
0.05
plet
ed
age
-2
-1
-0.05
0
YEar
s Co
mp
n H
ourl
y W
-3
2
-0.15
-0.1
Scho
ol Y
Gap
in Father's Hourly Wage Own Hourly Wage
-4-0.2
Father School Years Mother School Years
-5-0.25
Figure 5aOutcome of Parents and their Offsprings, Israeli Born Jewish Males in 1995, by mix of Parents Origin
Father-A Mother-A - AFather Mother - S Father-S Mother-A Father - -S Mother S

The figure shows educational outcomes gaps and hourly wage gaps for jewish males working full time full year in 1995 across originThe figure shows educational outcomes gaps and hourly wage gaps for jewish males working full time full year in 1995, across origin groups defined by father and mother continent of birth. The comparison group that is ommited are individuals born in Israel whose father was born in Asia/Africa and their mother was born in Europe/America. All educational results are coefficients on origin dummy from an ols regression conditioning on a ful set of dummies for age. The hourly wage series presents the coefficients on origin dummies from an ols regression controlling for a quartic in experience, dummies for educational attainments and location.
1.00
1.50
0.40
0.50
est S
cores Analytic Test Scores
Verbal Test Scores
College and Advanced Degree
0.50
1.00
0.20
0.30
mpleted
ractions) a
nd Te
HSG + Matriculation Certificate
Highschool Graduates
Own Hourly Wage
‐0.50
0.00
0.00
0.10
choo
l Years Com
Attainm
ents (Fr
School Years Completed
‐1.00
0.50
‐0.20
‐0.10
Sc
,Edu
cation
al A
‐1.50‐0.30
Father‐A Mother‐A Fater‐ A Mother ‐ S Father‐S Mother‐A Father ‐ S Mother S
in Horly W
age
Gap
Figure 5bOutcome of Israeli Born Jewish Males in 1995, by mix of Parents Origin

Sample Averages for Individuals Born in Israel to Parents of Mixed Origin, Age 30-55,Census of 1995
All Individuals (N=49,346) FTFY Sample (N=18,659)
AA AS SA SS AA AS SA SS
Distribution
Fractions 0.38 0.03 0.02 0.58 0.42 0.03 0.02 0.53Numbers 18530 1424 778 28614 7842 548 293 9976
Marital status
Married 0.88 0.84 0.84 0.85 0.91 0.88 0.91 0.91Divorced 0.05 0.05 0.05 0.04 0.04 0.04 0.02 0.02Widowed 0.00 0.00 0.00 0.00 0.00 0.00 0.00 0.00Single 0.07 0.10 0.10 0.11 0.05 0.08 0.06 0.07
Education
School Years 13.9 12.8 12.7 11.5 14.4 13.1 12.9 11.8HSD_0 0.00 0.00 0.00 0.01 0.00 0.00 0.00 0.00HSD_1_4 0.00 0.00 0.00 0.00 0.00 0.00 0.00 0.00HSD_5_8 0.03 0.05 0.07 0.12 0.02 0.03 0.06 0.09HSD_9_11 0.08 0.13 0.12 0.20 0.05 0.10 0.12 0.20HSG 0.21 0.32 0.30 0.35 0.20 0.31 0.33 0.37HSGBAG 0.12 0.15 0.15 0.10 0.11 0.15 0.10 0.10POSTSEC 0.19 0.16 0.15 0.13 0.21 0.18 0.16 0.14BA 0.22 0.13 0.14 0.06 0.24 0.16 0.13 0.07AD 0.14 0.06 0.07 0.02 0.16 0.07 0.09 0.02
* Individuals who were not self employed or salaried workers did not work or worked in cooperative, kibbutz or as unpaid family members

Sample Averages for Individuals Born in Israel to Parents of Mixed Origin, Age 30-55,Census of 1995(Cntnd.)
All Individuals (N=49,346) FTFY Sample (N=18,659)
AA AS SA SS AA AS SA SS
Labor Market
FTFY 0.68 0.63 0.63 0.57 1.00 1.00 1.00 1.00Self Employed* 0.18 0.18 0.20 0.17 0.00 0.00 0.00 0.00Salaried* 0.62 0.60 0.58 0.56 1.00 1.00 1.00 1.00Government 0.30 0.28 0.27 0.27 0.29 0.24 0.25 0.25Potential Experience 22.7 18.6 20.3 20.1 22.2 18.1 20.5 19.8Log of Hourly Earnings ------ ------ ------ ------ 3.65 3.38 3.31 3.19
Locality in 1995
Three Major Cities 0.24 0.23 0.23 0.17 0.24 0.22 0.24 0.17
Jerusalem 0.06 0.07 0.07 0.07 0.05 0.05 0.09 0.07Tel Aviv 0.10 0.10 0.10 0.07 0.09 0.10 0.08 0.07Haifa 0.08 0.06 0.06 0.03 0.10 0.07 0.06 0.03
Localities 2-199K 0.65 0.68 0.68 0.75 0.76 0.78 0.76 0.83
100-199K 0.26 0.31 0.30 0.29 0.28 0.35 0.33 0.3120-100K 0.29 0.25 0.29 0.32 0.35 0.28 0.32 0.372 -20k 0.11 0.11 0.09 0.14 0.12 0.14 0.11 0.16
Rural areas 0.06 0.05 0.05 0.06 ------ ------ ------ ------
Moshav 0.06 0.05 0.05 0.06 ------ ------ ------ ------Kibbutz 0.0 0.0 0.0 0.0 ------ ------ ------ ------
Other 0.04 0.04 0.03 0.03 ------ ------ ------ ------

Table A1. (Panel A)Main Waves of Immigration to Israel Before and After the Independence of Israel, By Country of Origin of the Immigrant (Absolute Numbers)
Time Period America Europe Africa Asia Unknown Total BeginningTime Period of Period
(i) (ii) (iii) (iv) (v) (vi) (vii)
Before 5.15.1948 7,754 377,381 4,041 40,895 52,786 482,857
After 5.15.1948
1948-1951 5,140 326,786 93,951 237,352 24,395 687,624 716,700
1952-1960 10,228 102,959 145,664 35,286 3,001 297,138 1,404,000
1961-1964 14,841 77,537 115,876 19,525 1,014 228,793 1,911,300
1965-1971 43,165 82,196 37,459 34,718 1,497 199,035 2,239,200
1972-1979 56,068 179,930 12,850 18,138 594 267,580 2,662,000
1980-1989 44,531 71,969 23,411 13,475 447 153,833 3,218,400
1990-1999 37,281 829,289 44,405 44,743 601 956,319 3,717,100
Total by the End of 1999 4,701,600The table reports the total number of immigrants to Israel by country of origin and period of immigration.The last two columns (columns 5 and 6) report the (i) total number of immigrants (the sum of the first five columns) and (ii) the size of the population in Israel at the beginning of the periodThe data is broadly divided into the periods Before/After 5.15.1948 (The foundation of the state of Israel).The source of the data is the Israeli Central Bureau of Statistics (CBS)1. Included in the table are potential immigrants and tourists who changed their status to immigrants. As of 1970 excluded from the table are: immigrating citizens2. Until 1995 the Asian republics of the USSR (former) were included in Europe. As of 1996 they are included in Asia.3. Included in the table are about 11,000 illegal immigrants and about 19,500 tourists who remained in Israel, and whose continent of residence and period of immigration are not known (Column 5 beore 5.15.1948)4. From 15.5.1948 till the end of 1969 also included in the Unknown Column are non-Jews. As of 1970 they are included according to last continent of residence.

Table A1 (Panel B)Main Waves of Immigration to Israel Before and After the Independence of Israel, By Country of Origin of the Immigrant (As a Fraction of the Total Number of Immigrants)
Time Period America Europe Africa Asia Unknown Total
(1) (2) (3) (4) (5) (6)
Before 5.15.1948 0.016 0.782 0.008 0.085 0.109 1.000
After 5.15.1948
1948-1951 0.007 0.475 0.137 0.345 0.035 1.000
1952-1960 0.034 0.347 0.490 0.119 0.010 1.000
1961-1964 0.065 0.339 0.506 0.085 0.004 1.000
1965-1971 0.217 0.413 0.188 0.174 0.008 1.000
1972-1979 0.210 0.672 0.048 0.068 0.002 1.000
1980-1989 0.289 0.468 0.152 0.088 0.003 1.000
1990-1997 0.039 0.867 0.046 0.047 0.001 1.000The columns of this table are calculated by dividing each column (1-5) in Table 1 panel A by the total number of immigrants The two main origins of immigration in each period are highlighted in bold.In the period 1990-1997 the immigration from Ethiopia (0.046) is highlighted as well.
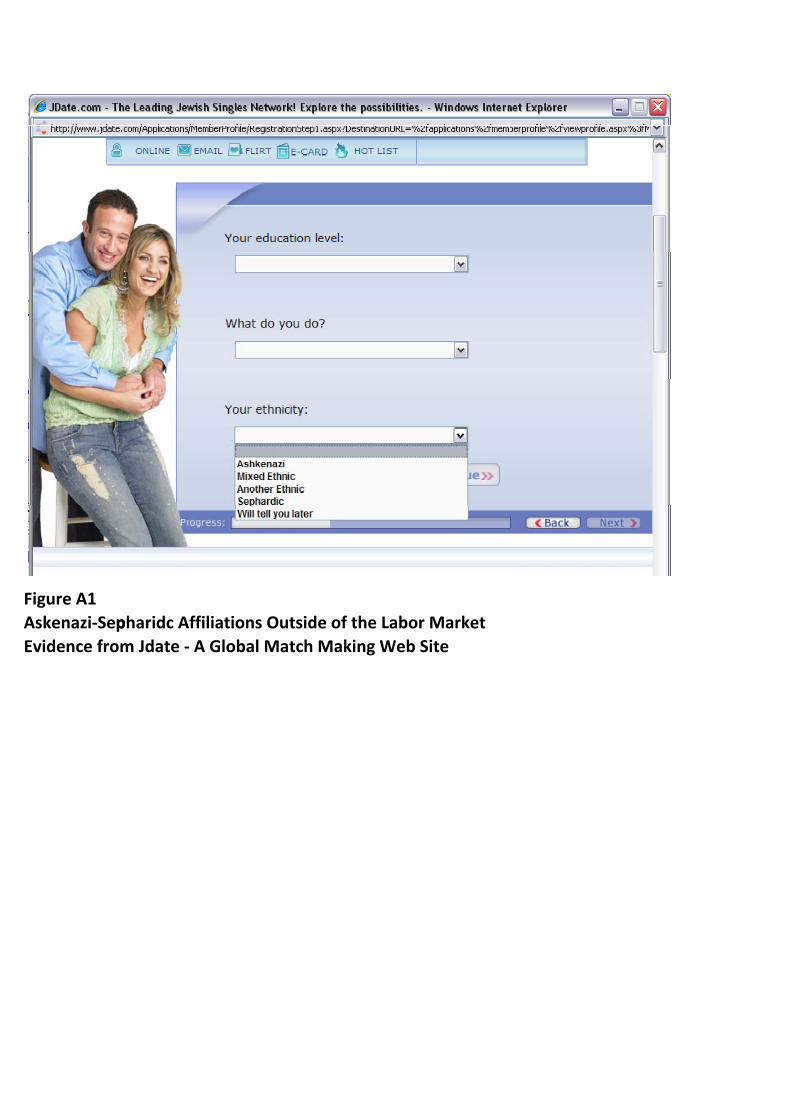
Figure A1Askenazi‐Sepharidc Affiliations Outside of the Labor MarketpEvidence from Jdate ‐ A Global Match Making Web Site

9 APPENDIX
Israeli Census Data
The 1983 and 1995 Censuses were conducted by the Central Bureau of Statistics in May
and June of 1983 and October-November of 1995. These were the fourth and fifth cen-
suses on Population and Housing in Israel. Both consist of two types of questionnaires:
(1) Short Questionnaire - distributed to 80% of dwellings, collecting information on
basic demographics for each household resident; (2) Long Questionnaire - distributed
in the remaining 20% of households, administered to individuals 15 or older, collect-
ing basic demographics, data regarding geographical mobility, marriage and fertility,
education and language use, work and income, commutes to work and living conditions.
After completion and collection of the questionnaires, two types of checks were
made: (i) procedural checks designed to determine the final frame of households and
persons (ii) subject matter checks that completed missing data by cross-checking it
with the population register and eliminating inconsistencies within households or in-
dividuals. About 16% of individual records and 5% of family records showed subject
matter deficiencies. Missing data that was not completed by subject matter correction
was completed through allocation procedures. The number of allocated records is rel-
atively small (e.g: 0.3% of gender data, 0.5% on year of birth, 0.3% on family status).
Data reported on the short questionnaire (also for individuals who completed it as part
of the long questionnaire) were checked for errors or missing values. Erroneous data
were then deleted, corrected, supplemented or imputed. Data were supplemented by
linking census data to those of the Population Register. In cases where data could
not be supplemented, the CBS imputed data values based on similar demographic and
geographic characteristics.
In this paper we use the 20 percent public-use micro-files from the 1995 and 1983
Israeli censuses. Subject matter checks were conducted for the long questionnaire. Re-
ports not classified as "acceptable response" were eliminated. The data were checked
for logical contradictions between responses to questions with similar subjects. Only
"definite contradictions" were handled. Inconsistencies classified as "confirmed incon-
sistency" were corrected using other reports taken either from the short questionnaire
or within subject matter.
After the above procedures were complete, non-acceptable data had been eliminated
the sample file, but cases of missing records remained. Finally, missing data were
imputed in the following way: (1) records of household were imputed using data from
53

similar households (2.2% of all households in the 1995 sample file), (2) individual
records were imputed using either information taken from other variables or available
data on persons with similar demographic and geographic characteristics.
Missing income of salaried individuals was not imputed for 1983. In 1995 missing
income data were filled by data from Social Security. Extreme values were either
corrected by data from Social Security reports or by statistical imputations.
Country of birth was defined according to country borders at the time of the census.
In 1995 this rule took into account changes in national borders resulting from war and
other political changes. For example, residents born in the former Czechoslovakia
were asked to indicate whether they were born in the Czech Republic or in Slovakia.
Countries were classified into continents as one unit, even if located on two continents.
For example all of Turkey is included in Asia. Since many persons born in the former
Soviet Union as well as Israeli-born individuals whose parents were born in the former
Soviet Union do not usually specify the republic of their (or their parents’) birth, or
simply use the term Russia, there is no way to distinguish between the Asian and
European Republics; thus, they were all classified under Europe. Unlike the 1983
census, the 1995 “both parents” country of birth is reported for Israeli-born Jews.
Income from salaried work was reported as income received for working as an em-
ployee (those who were also self-employed were asked to report their income from
self-employment in a separate question). Individuals reported gross income before in-
come tax, social security, payments to retirements funds and any other deductibles.
[Missing income data were filled by data from Social Security](already said multiple
times). Extreme values were either corrected for by data from Social Security reports
or statistical imputations.
Our sample begins with the 20% sample census after all aforementioned deletions,
corrections, supplementation and imputations have been made. We keep only Jewish
males from ordinary households with valid demographic data who are between 22-65
years old at the time of the survey. We further keep individuals who are not currently
in school and we report school years completed between 0 and 25. Our wage sample
includes individuals who were employed as part of the civilian labor force in the prior
week or 12 months prior to the survey. We exclude observations with missing or
imputed wages, as well as the self-employed. We focus on full time (more than 35 work
hours per week) full year (12 month) workers.
54