Embed Size (px)
Citation preview
Primary Care Reimbursement Service
Statistical Analysis of Claims and Payments
Feidhmeannacht na Seirbhíse SláinteSeirbhís Aisíoca Príomhchúraim
Bealach amach 5 an M50
An Bóthar Thuaidh
Fionnghlas
Baile Átha Cliath 11
D11 XKF3
Guthán: (01) 864 7100
Facs: (01) 834 3589
Ríomhphost: [email protected]
Láithreán Gréasáin: www.hse.ie
Health Service ExecutivePrimary Care Reimbursement Service
Exit 5 M50
North Road
Finglas
Dublin 11
D11 XKF3
Ph: (01) 864 7100
Fax: (01) 834 3589
Email: [email protected]
Website: www.hse.ie
Primary Care Reimbursement Service
STATISTICAL ANALYSIS OF CLAIMS AND PAYMENTS
2016
2
Contents Summary of Statistical Analysis
4 Introduction
SCHEMES OVERVIEW
6 Schemes – Claim Reimbursement
and Payment Arrangements
9 Summary Statement of Activity – 2016
10 Total Payments and Reimbursements – 2016
12 Number of Agreements with Contractor Groups
13 Number of Agreements with Contractor
Groups by CHO
14 Number of Eligible Persons – 2016
15 Number of Eligible Persons by CHO
16 Average Cost per Eligible Person per
Scheme 2016
17 1 Number of Agreements with Contractor Groups
20 2 GMS: Summary of Statistical Information
for 2012 – 2016
21 3 LTI/DP Schemes: Summary of Statistical
Information for 2012 – 2016
22 4 High Tech Wholesaler and Manufacturer
Payments 2016
CARDHOLDER SECTION
24 5 GMS Medical Cards: Number of Eligible
Persons by CHO
25 6 GMS GP Visit Cards: Number of Eligible
Persons by CHO
26 7 GMS Medical Cards: Number of Eligible Persons
by CHO, Gender and Age Group
32 8 GMS GP Visit Cards: Number of Eligible Persons
by CHO, Gender and Age Group
38 9 Average Cost per Eligible Person per Scheme
by CHO
41 10 GMS: Average Pharmacy Cost by CHO, Gender
and Age Group based on the number of
MC holders
47 11 DPS: Statistical Data by CHO
50 12 LTI: Statistical Data by CHO
GENERAL PRACTITIONER SECTION
54 Fees and Allowances under Capitation
Agreement as at 31st December 2016
56 Fees and Allowances under the Fee-Per-Item
Agreement and Fees under the Immunisation
Scheme, Health (Amendment) Act 1996,
Methadone Treatment Scheme and Heartwatch
Programme as at 31st December 2016
58 Payments to General Practitioners 2016
59 Payments to General Practitioners 2016
by CHO
60 Number of Claims by General Practitioners
61 Number of Claims by General Practitioners
by CHO
64 13 GMS: Payments to General Practitioners
65 14 GMS: Payments to GPs by CHO
68 15 GMS: Average Payment to GPs in Panel
Ranges by CHO
71 16 GMS: Number of GPs in Payment Ranges
by CHO
74 17 GMS: GP Panel Size by CHO
77 18 GMS: Number of Special Type Consultation
Claims by CHO
80 19 GMS: Cost of Special Type Consultation Claims
by CHO
83 20 GMS: Number of Dispensing Doctors*
and Persons for Whom They Dispense by CHO
86 21 GMS: Number and Cost of Special Items of
Service Reimbursed to GPs
87 22 GMS: Number and Cost of Special Items of
Service Claims by CHO
92 23 GMS: Investment in General Practice
Development by CHO
PHARMACY SECTION
96 Scale of Fees Payable to Participating Pharmacists
as at 31st December 2016
97 Payments to Pharmacists: Claims
Reimbursed 2016
98 Payments to Pharmacists: Claims Reimbursed
2016 by CHO
101 Number of Items Claimed by Pharmacists
102 Number of Items Claimed by Pharmacists
by CHO
105 24 GMS: Reimbursement Cost of Prescriptions
by CHO
108 25 GMS: Payments to Pharmacists for Prescriptions
by CHO
111 26 GMS: Number of Prescription Forms and Items
by CHO
114 27 GMS: Reimbursement Cost of Stock Order
Forms by CHO
117 28 GMS: Number of Stock Order Forms and
Items by CHO
Page PageTable Table Page Table
3
Contents Summary of Statistical Analysis
120 29 GMS: Number of Items per Prescription Form
121 30 DPS: Number of Items per Claim Form
122 31 LTI: Number of Items per Claim Form
123 32 EEA: Number and Cost of Pharmacists Claims
by CHO
126 33 GMS: Number of Pharmacists in Dispensing Fee
Ranges by CHO
129 34 DPS: Number of Pharmacists in Dispensing Fee
Ranges by CHO
132 35 LTI: Number of Pharmacists in Dispensing Fee
Ranges by CHO
DISPENSING DATA SECTION
136 GMS: Major Therapeutic Classifi cation of Drugs,
Medicines and Appliances
137 DPS: Major Therapeutic Classifi cation of Drugs,
Medicines and Appliances
138 LTI: Major Therapeutic Classifi cation of Drugs,
Medicines and Appliances
139 36 Notes on commonly prescribed categories
(see tables 37 - 40) where the MMP has
issued guidance.
140 37 GMS: Top 20 Medicines and Appliances
(ATC level 4) by Highest Expenditure 2016
145 38 DPS: Top 20 Medicines and Appliances
(ATC level 4) by Highest Expenditure 2016
150 39 LTI: Top 20 Medicines and Appliances
(ATC level 4) by Highest Expenditure 2016
154 40 HT: Top 20 Medicines and Appliances
(ATC level 4) by Highest Expenditure 2016
158 41 GMS: Notes on Some of the More Commonly
Prescribed Products
159 42 GMS: The Top 100 Most Commonly Prescribed
Products in the Order of their Prescribing
Frequency
162 43 GMS: The Top 100 Products by Ingredient Cost
165 44 DPS: The Top 100 Most Commonly Prescribed
Products in the Order of their Prescribing
Frequency
168 45 DPS: The Top 100 Products by Ingredient Cost
171 46 LTI: The Top 100 Most Commonly Prescribed
Products in the Order of their Prescribing
Frequency
174 47 LTI: The Top 100 Products by Ingredient Cost
177 48 HT: The Top 100 Most Commonly Prescribed
Products in the Order of their Prescribing
Frequency
180 49 HT: The Top 100 Products by Ingredient Cost
183 50 GMS: Distribution of Medicines and Appliances
by Anatomical Therapeutic Chemical
Classifi cation
188 51 DPS: Distribution of Medicines and Appliances by
Anatomical Therapeutic Chemical Classifi cation
193 52 LTI: Distribution of Medicines and Appliances by
Anatomical Therapeutic Chemical Classifi cation
198 53 HT: Distribution of Medicines and Appliances by
Anatomical Therapeutic Chemical Classifi cation
DENTAL SECTION
202 Scale of Fees Payable under the Dental
Treatment Services Scheme as at 31st
December 2016
203 Payments to Dentists: Claims Reimbursed 2016
204 Payments to Dentists: Claims Reimbursed 2016
by CHO
205 Number of Dental Treatments Claimed 2016
206 Number of Dental Treatments Claimed 2016
by CHO
207 54 DTSS: Payments to Dentists
210 55 DTSS: Number of Treatments
213 56 DTSS: Number of Dentists with DTSS Contracts
by Payment Range
OPTICAL SECTION
218 Scale of Fees Payable under the Health
Service Executive Community Ophthalmic
Services Scheme
220 Payments to Optometrists/Ophthalmologists:
Claims Reimbursed 2016
221 Payments to Optometrists/Ophthalmologists:
Claims Reimbursed 2016 by CHO
222 Number of Treatments by Optometrists/
Ophthalmologists
223 Number of Treatments by Optometrists/
Ophthalmologists by CHO
226 57 HSE – Community Ophthalmic Services Scheme:
Number of Treatments and Cost of Claims
229 58 HSE – Community Ophthalmic Services Scheme:
Number of Optometrists/Ophthalmologists
by Payment Range
Page Table Page Table Page Table
4
Introduction
The HSE’s Primary Care Reimbursement Service
(PCRS) supports the delivery of a wide range of primary
care services to the general public through over 7,168
primary care contractors across a range of community
health schemes. These schemes form the infrastructure
through which the Irish Health System delivers a
signifi cant proportion of Primary Care to the public.
HSE PCRS made total payments and reimbursements
of €2.7 billion in 2016 under the GMS (Medical Card),
Drugs Payment, Dental Treatment, Long Term Illness
and Community Ophthalmic Schemes.
Eligibility for Medical Cards (including GP Visit Cards)
has increased by 86% since January 2005. Almost 2.2
million people or 45% of the population is covered by
a Medical Card or a GP Visit Card compared with 28%
in 2005. While there was a reduction in medical card
eligibility in 2016 of 2.94% compared to 2015, there was
a 9.09% increase in GP Visit Card eligibility over the
same period.
During 2016, 3.7 million people were registered for
Community Scheme services provided by General
Practitioners, Pharmacists, Dentists and Optometrists or
Ophthalmologists.
On behalf of the HSE, I would like to thank all of our
clients and contractors for their co-operation throughout
2016, and we look forward to working with you to
continue to improve all of the services that we provide to
the public into the future.
I would also like to take this opportunity to thank
the staff in the Primary Care Reimbursement Service
involved in the continued delivery of day to day services,
for their contribution and commitment to the delivery of
these vital support services to the public and to primary
care contractors throughout the year.
John Hennessy
National Director Primary Care

O V E R V I E W

6
Schemes – Claim Reimbursement and Payment Arrangements
During 2016, HSE Primary Care Reimbursement Service reimbursed claims and made payments to General Practitioners (GPs), Community Pharmacists, Dentists and Optometrists/Ophthalmologists totalling €2,700m, in respect of medical card and national primary care schemes.
Claim data is processed and reimbursements are made by the Primary Care Reimbursement Service under the following Schemes:
General Medical Services (GMS)
Persons who are unable without undue hardship to arrange general practitioner medical and surgical services for themselves and their dependants are eligible for the GMS Scheme. Drugs, medicines and appliances approved under the Scheme are provided through Community Pharmacists. In most cases the GP gives a completed prescription form to an eligible person, who takes it to any Pharmacy that has an agreement with the Health Service Executive to dispense drugs, medicines and appliances on presentation of GMS prescription forms. In rural areas a small number of GPs hold contracts to dispense drugs and medications to GMS cardholders who opt to have their medicines dispensed by him/her directly.
All GMS claims are processed and paid by the Primary Care Reimbursement Service. Since the 1st October 2010, an eligible person who is supplied a drug, medicine or medical or surgical appliance on the prescription of a Registered Medical Practitioner, Registered Dentist or Registered Nurse Prescriber, is charged a prescription charge by the Community Pharmacy Contractor, currently €2.50 per item subject to a limit of €25 per family per month (effective 1st December 2013). The prescription charge is recouped by the HSE from the Pharmacist.
Drugs Payment Scheme (DPS)
The Drugs Payment Scheme (DPS) provides for payment to the Pharmacist for the supply of medicines to individuals and families where the threshold of €144, effective from 1st January 2013, has been exceeded in a calendar month. In order to avail of the Drugs Payment Scheme a person or family must register for the Scheme with the HSE PCRS. Drugs, medicines and appliances currently reimbursable under the Scheme are listed on the HSE website. Other items which were reimbursable under the Drug Cost Subsidisation Scheme and Refund of Drugs Scheme continue, in certain circumstances, to be reimbursable under the Drugs Payment Scheme.
Long Term Illness Scheme (LTI)
On approval by the Health Service Executive, persons who suffer from one or more of a schedule of illnesses are entitled to obtain, without charge, irrespective of income, necessary drugs/medicines and/or appliances under the LTI Scheme.
Dental Treatment Services Scheme (DTSS)
Under the Dental Treatment Services Scheme GMS eligible adults have access to a range of treatments and clinical procedures comprised of Routine Treatments and Full Upper and Lower Dentures. Routine Treatments are available for all eligible persons. Dentists may also prescribe a range of medicines, as part of their treatment, to eligible persons.
European Economic Area (EEA)
Residents from one of the other states of the European Economic Area, with established eligibility, who require emergency general practitioner services while on a temporary visit to the State are entitled to receive from a General Practitioner a GMS prescription form for necessary medication and to have such medication dispensed in a Pharmacy that has entered into an agreement with the Health Service Executive within the State.
7
Schemes – Claim Reimbursement and Payment Arrangements continued
High Tech Arrangements (HT)
Arrangements are in place for the supply and dispensing of High Tech medicines through Community Pharmacists. Such medicines are generally only prescribed or initiated in hospital and would include items such as anti-rejection drugs for transplant patients or medicines used in conjunction with chemotherapy or hormonal therapy. The medicines are purchased by the Health Service Executive and supplied through Community Pharmacists for which Pharmacists are paid a patient care fee. The cost of the medicines and patient care fees are paid by the Primary Care Reimbursement Service.
Primary Childhood Immunisation Scheme
A National Primary Childhood Immunisation Scheme provides for immunisation of the total child population with the aim of eliminating, as far as possible, such conditions as Diphtheria, Polio, Measles, Mumps, Rubella and more recently Meningococcal C Meningitis. Payments to GPs under this Scheme are made by the Primary Care Reimbursement Service.
Health (Amendment) Act 1996
Under the Health (Amendment) Act 1996 certain health services are made available without charge to persons who have contracted Hepatitis C directly or indirectly from the use of Human Immunoglobulin - Anti D or the receipt within the State of another blood product or blood transfusion. GP services, pharmaceutical services, dental services and optometric/ophthalmic services provided under the Act are paid for by the Primary Care Reimbursement Service.
Methadone Treatment Scheme
Methadone is prescribed by Doctors and dispensed by Pharmacists for approved clients under the Methadone Treatment Scheme - capitation fees payable to participating GPs and Community Pharmacists and claims by Pharmacists for the ingredient cost of the Methadone dispensed and the associated dispensing fees are processed and paid by the Primary Care Reimbursement Service.
HSE Community Ophthalmic Services Scheme (HSE-COSS)
Under the Health Service Executive Community Ophthalmic Services Scheme, adult medical card holders and their dependants are entitled, free of charge, to eye examinations and necessary spectacles/appliances. Claims by Optometrists/Ophthalmologists are paid by the Primary Care Reimbursement Service. Claims for spectacles provided under the Children’s Scheme are also paid by the Primary Care Reimbursement Service.
Immunisations for GMS Eligible Persons
Agreement was reached between the Department of Health and the Irish Medical Organisation on fee rates to be applied to certain immunisations for GMS eligible persons. The immunisations encompassed by the agreement are - Pneumococcal, Infl uenza, Hepatitis B and the combined Pneumococcal /Infl uenza.
General Practitioner Visit Card (GPVC)
The GP Visit Card was introduced for people in Ireland who are not eligible for a GMS medical card, to obtain GP services free of charge. GP Visit Cards are provided to eligible individuals and families who meet the qualifying criteria. All applications for GP Visit Cards and associated GP claims are processed and reimbursed by the Primary Care Reimbursement Service. From 1st July 2015, all children under 6 years of age were eligible to obtain GP services free of charge. From 5th August 2015, all persons over 70 years of age were eligible to obtain GP services free of charge.
8
Schemes – Claim Reimbursement and Payment Arrangements continued
Discretionary Hardship Arrangements
Medical Card patients, for whom Non GMS reimbursable items have been prescribed, may make application to the HSE Community Healthcare Organisation (CHO) for approval to have such items dispensed by a Community Pharmacist. Previously, the CHO reimbursed Community Pharmacists directly in respect of such prescribed items. In July 2009 reimbursement for these items transferred to the Primary Care Reimbursement Service.
Centralised reimbursement of selected high cost drugs administered or dispensed to patients in hospitals
The HSE commenced the centralised reimbursement of selected Oncology and Hepatitis C drugs.
The National Cancer Control Programme (NCCP) established the National Cancer Drug Management Programme to develop and improve the care provided to patients receiving treatment with oncology drugs. A national management system for cancer drugs was set up within the PCRS to facilitate centralised reimbursement and data capture of selected high-cost oncology drugs. This allows national oversight of the expenditure on high-cost oncology drugs in line with approved indications, improved service planning and budgetary projections and a national approach to provision of oncology drugs.
The Hepatitis C drugs are dispensed to patients in the designated adult hepatology units.
Centralised reimbursement of Outpatient Parenteral Antimicrobial Therapy (OPAT)
The HSE commenced the centralised reimbursement of Outpatient Parenteral Antimicrobial Therapy (OPAT) drugs, medicines and appliances administered by healthcare professionals or self-administered by patients in the community.
Redress for Women Resident in Certain Institutions
Under the Redress for Women Resident in Certain Institutions Act 2015, it was provided that the Health Service Executive (HSE) would make available specifi ed services to women eligible for the Restorative Justice Scheme, administered by the Department of Justice and Equality. Services include General Practitioner services, drugs, medicines and medical and surgical appliances, dental, ophthalmic and aural services, home nursing service, home support service, chiropody services, physiotherapy services, and a counselling service. Card holders are not required to pay any prescription fees.
9
Summary Statement of Activity - 2016
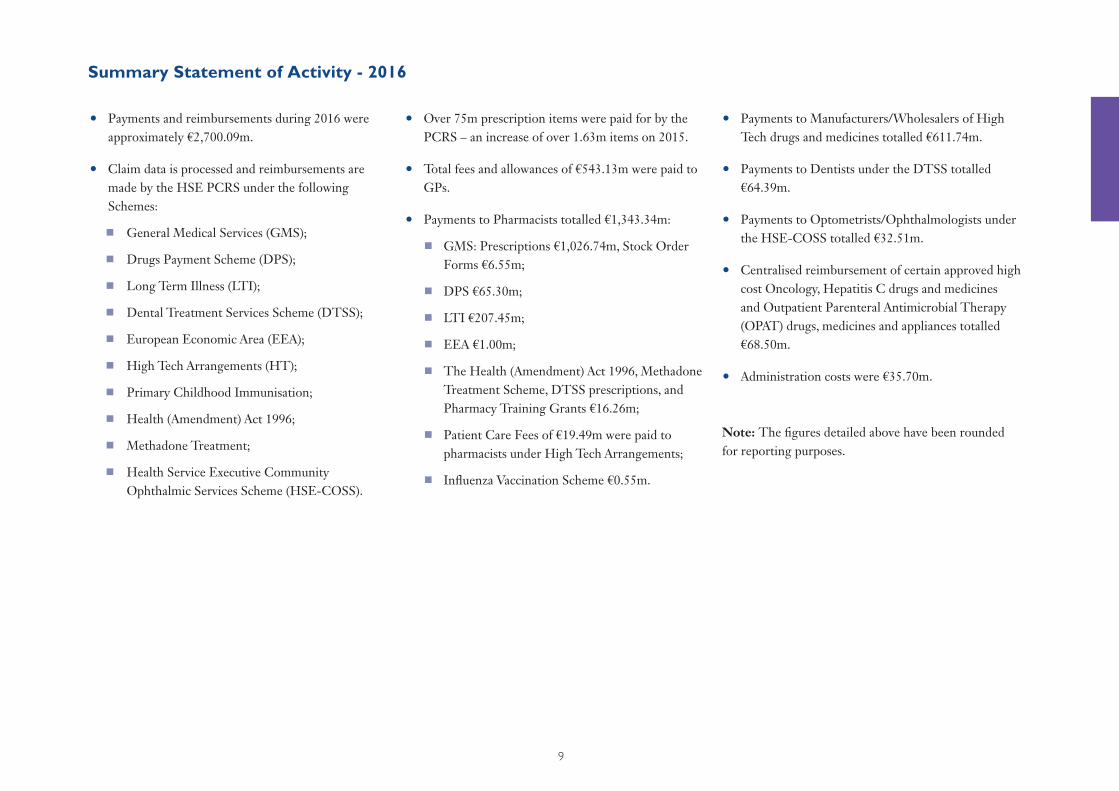
• Payments and reimbursements during 2016 were approximately €2,700.09m.
• Claim data is processed and reimbursements are made by the HSE PCRS under the following Schemes:
General Medical Services (GMS);
Drugs Payment Scheme (DPS);
Long Term Illness (LTI);
Dental Treatment Services Scheme (DTSS);
European Economic Area (EEA);
High Tech Arrangements (HT);
Primary Childhood Immunisation;
Health (Amendment) Act 1996;
Methadone Treatment;
Health Service Executive Community Ophthalmic Services Scheme (HSE-COSS).
• Over 75m prescription items were paid for by the PCRS – an increase of over 1.63m items on 2015.
• Total fees and allowances of €543.13m were paid to GPs.
• Payments to Pharmacists totalled €1,343.34m:
GMS: Prescriptions €1,026.74m, Stock Order Forms €6.55m;
DPS €65.30m;
LTI €207.45m;
EEA €1.00m;
The Health (Amendment) Act 1996, Methadone Treatment Scheme, DTSS prescriptions, and Pharmacy Training Grants €16.26m;
Patient Care Fees of €19.49m were paid to pharmacists under High Tech Arrangements;
Infl uenza Vaccination Scheme €0.55m.
• Payments to Manufacturers/Wholesalers of High Tech drugs and medicines totalled €611.74m.
• Payments to Dentists under the DTSS totalled €64.39m.
• Payments to Optometrists/Ophthalmologists under the HSE-COSS totalled €32.51m.
• Centralised reimbursement of certain approved high cost Oncology, Hepatitis C drugs and medicines and Outpatient Parenteral Antimicrobial Therapy (OPAT) drugs, medicines and appliances totalled €68.50m.
• Administration costs were €35.70m.
Note: The fi gures detailed above have been rounded for reporting purposes.
10
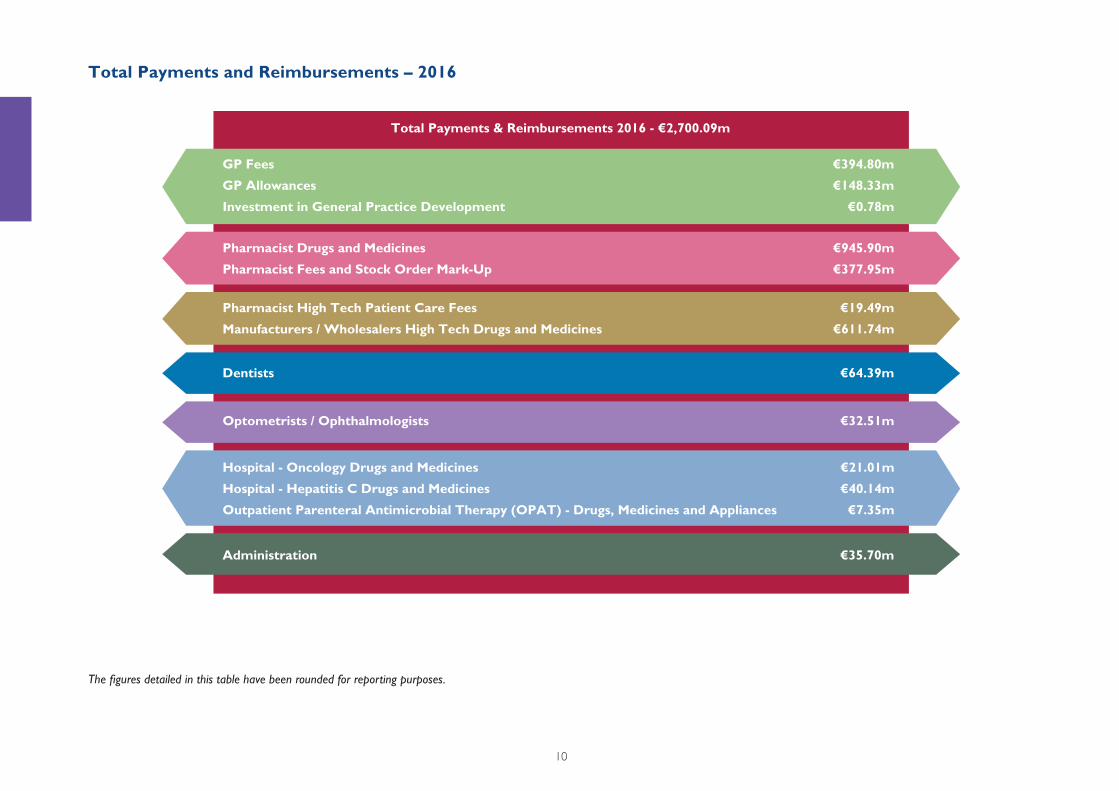
Total Payments and Reimbursements – 2016
Total Payments & Reimbursements 2016 - €2,700.09m
GP Fees €394.80m
GP Allowances €148.33m
Investment in General Practice Development €0.78m
Pharmacist Drugs and Medicines €945.90m
Pharmacist Fees and Stock Order Mark-Up €377.95m
Pharmacist High Tech Patient Care Fees €19.49m
Manufacturers / Wholesalers High Tech Drugs and Medicines €611.74m
Dentists €64.39m
Optometrists / Ophthalmologists €32.51m
Hospital - Oncology Drugs and Medicines €21.01m
Hospital - Hepatitis C Drugs and Medicines €40.14m
Outpatient Parenteral Antimicrobial Therapy (OPAT) - Drugs, Medicines and Appliances €7.35m
Administration €35.70m
The fi gures detailed in this table have been rounded for reporting purposes.
11
Total Payments and Reimbursements – 2016 continued
• Fees paid to GPs include €6.93m in respect of the Primary Childhood Immunisation Scheme, €0.19m in respect of the Health (Amendment) Act 1996 and €7.73m in respect of the Methadone Treatment Scheme.
• Payments to Pharmacists include €1.40m in respect of drugs/medicines dispensed under the Health (Amendment) Act 1996, €13.54m in respect of the cost of Methadone dispensed under the Methadone Treatment Scheme, €0.41m in respect of Pharmacy Training Grants, €0.91m in respect of DTSS prescriptions and €0.55m in respect of the Infl uenza Vaccination Scheme.
• Fees paid to Pharmacists include €93.08m in respect of the phased dispensing of a reimbursable item based on one of the reasons specifi ed under the agreement between the Department of Health and Children and the Irish Pharmaceutical Union.
• Payments to Dentists include €0.07m in respect of treatments under the Health (Amendment) Act 1996.
• Payments to Optometrists/Ophthalmologists include €2.13m in respect of Optical Services for Children, €0.46m in respect of Optical Services for Teenagers and €0.12m in respect of treatments under the Health (Amendment) Act 1996.
• The corresponding fi gures for 2015 are:
Total payments and reimbursements €2,558.46m.
GP Fees €348.03m and GP Allowances €141.66m.
Phased Fees €92.98m.
Investment in General Practice Development €0.62m.
Pharmacy Drugs and Medicines €956.75m, Fees and Stock Order Mark-Up €371.64m.
Payments to Dentists under the DTSS €66.51m.
Payments to Optometrists/Ophthalmologists under the COSS €31.74m.
High Tech Arrangements – Payment to wholesalers €544.19m which includes a deduction related to returned stock and patient care fees paid to pharmacists of €18.10m.
Hospital Oncology Drugs €13.33m.
Hospital Hepatitis C Drugs €24.19m.
Outpatient Parenteral Antimicrobial Therapy (OPAT) €7.02m.
Administration costs were €34.68m.
The fi gures detailed in this table have been rounded for reporting purposes.
12
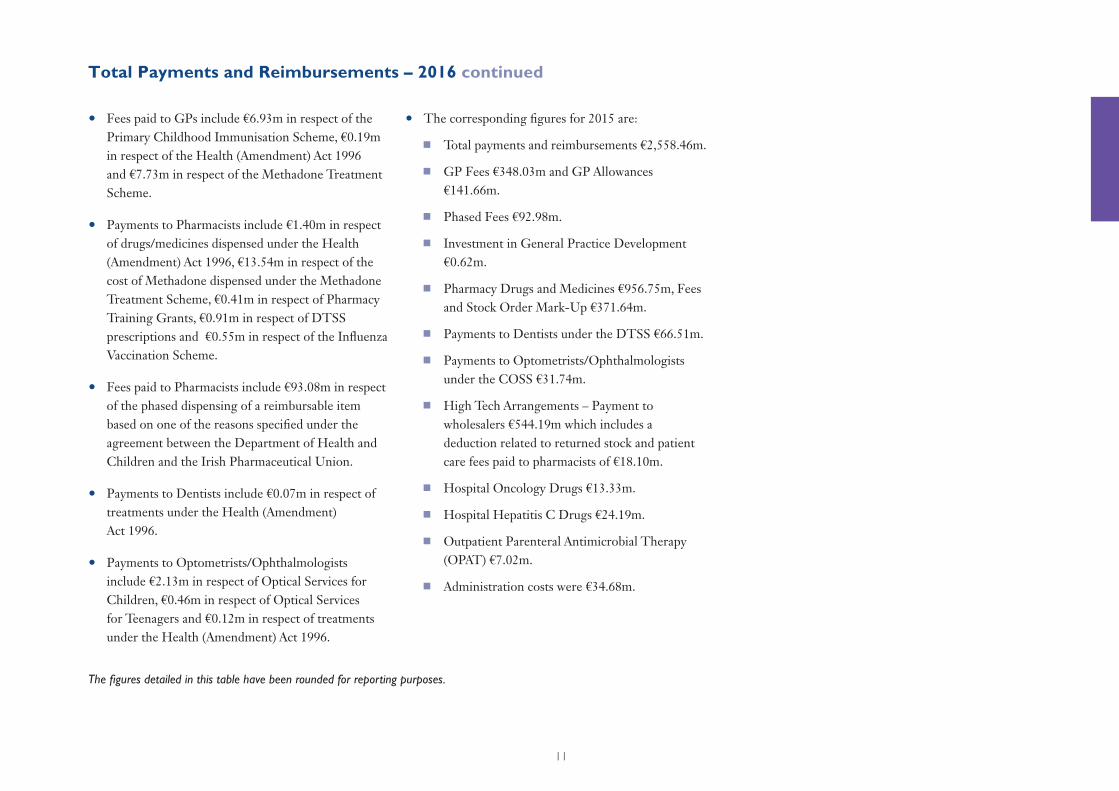
Number of Agreements as at 31st December 2016
Community Healthcare Organisation
CHO Area 1 227 163 143 61
CHO Area 2 310 187 225 70
CHO Area 3 246 157 126 44
CHO Area 4 488 267 375 82
CHO Area 5 280 212 194 64
CHO Area 6 281 156 138 52
CHO Area 7 388 246 247 82
CHO Area 8 331 235 178 80
CHO Area 9 363 207 205 58
National 2,914 1,830 1,831 593
Corresponding fi gures for 2015 2,889 1,801 1,847 587
GeneralPractitioners
Pharmacists Dentists Optometrists
Number of Agreements with Contractor Groups
General Practitioners 2,914 Pharmacists 1,830 Dentists 1,831 Optometrists 593
The number of agreements between the Health Service Executive and General Practitioners for the provision of services to GMS cardholders refl ects the policy position agreed between the Department of Health and the Irish Medical Organisation on entry to the GMS Scheme. At December 2016 there were 2,914 agreements.
Note: Included in the table above are the following:
(i) 441 GPs not contracted to the GMS Scheme who are registered to provide services under the Primary Childhood Immunisation Scheme, the Health
(Amendment) Act 1996, Heartwatch, Methadone Treatment Scheme and National Cancer Screening Service.
(ii) 12 Pharmacists who are registered to provide services under non GMS Schemes.
(iii) 167 Dentists employed by the HSE who provide services under the Dental Treatment Services Scheme.

13
Number of Agreements with Contractor Groups by CHO
Donegal 93 64 55 20
Sligo/Leitrim/West Cavan 64 44 29 16
Cavan/Monaghan 70 55 59 25
Total 227 163 143 61
Wicklow 77 49 55 17
Dun Laoghaire 113 70 36 18
Dublin South East 91 37 47 17
Total 281 156 138 52
Galway 187 110 158 32
Roscommon 33 21 21 11
Mayo 90 56 46 27
Total 310 187 225 70
Kildare/West Wicklow 106 80 69 30
Dublin West 64 25 61 9
Dublin South City 116 77 62 29
Dublin South West 102 64 55 14
Total 388 246 247 82
Laois/Offaly 78 55 40 22
Longford/Westmeath 90 59 66 19
Louth 82 63 39 18
Meath 81 58 33 21
Total 331 235 178 80
Dublin North 138 88 92 22
Dublin North Central 117 70 66 22
Dublin North West 108 49 47 14
Total 363 207 205 58
Clare 54 40 28 13
Limerick 141 79 67 21
North Tipperary/
East Limerick 51 38 31 10
Total 246 157 126 44
Kerry 103 64 62 27
North Cork 61 38 48 17
North Lee 129 68 124 18
South Lee 149 73 114 18
West Cork 46 24 27 2
Total 488 267 375 82
South Tipperary 55 45 29 14
Carlow/Kilkenny 79 61 59 21
Waterford 72 50 58 9
Wexford 74 56 48 20
Total 280 212 194 64
CHO Area 1 GeneralPractitioners
Pharmacists Dentists Optometrists CHO Area 6 GeneralPractitioners
Pharmacists Dentists Optometrists
CHO Area 7 GeneralPractitioners
Pharmacists Dentists Optometrists
CHO Area 8 GeneralPractitioners
Pharmacists Dentists Optometrists
CHO Area 9 GeneralPractitioners
Pharmacists Dentists Optometrists
CHO Area 2 GeneralPractitioners
Pharmacists Dentists Optometrists
CHO Area 3 GeneralPractitioners
Pharmacists Dentists Optometrists
CHO Area 4 GeneralPractitioners
Pharmacists Dentists Optometrists
CHO Area 5 GeneralPractitioners
Pharmacists Dentists OptometristsNote: Included in the table above are the following:
(i) 441 GPs not contracted to the GMS Scheme who are registered to provide services
under the Primary Childhood Immunisation Scheme, the Health (Amendment) Act
1996, Heartwatch, Methadone Treatment Scheme and National Cancer Screening
Service.
(ii) 12 Pharmacists who are registered to provide services under non GMS Schemes.
(iii) 167 Dentists employed by the HSE who provide services under the Dental Treatment
Services Scheme.
14
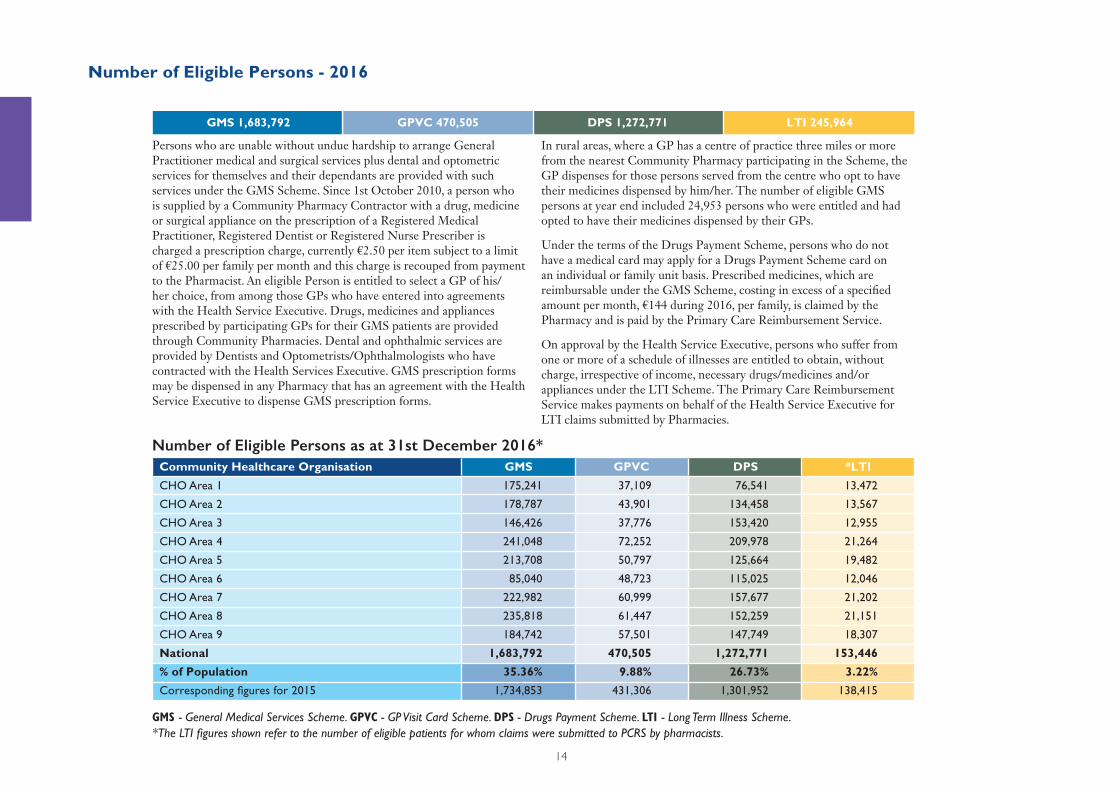
Number of Eligible Persons as at 31st December 2016* Community Healthcare Organisation GMS GPVC DPS *LTI
CHO Area 1 175,241 37,109 76,541 13,472
CHO Area 2 178,787 43,901 134,458 13,567
CHO Area 3 146,426 37,776 153,420 12,955
CHO Area 4 241,048 72,252 209,978 21,264
CHO Area 5 213,708 50,797 125,664 19,482
CHO Area 6 85,040 48,723 115,025 12,046
CHO Area 7 222,982 60,999 157,677 21,202
CHO Area 8 235,818 61,447 152,259 21,151
CHO Area 9 184,742 57,501 147,749 18,307
National 1,683,792 470,505 1,272,771 153,446
% of Population 35.36% 9.88% 26.73% 3.22%
Corresponding fi gures for 2015 1,734,853 431,306 1,301,952 138,415
Number of Eligible Persons - 2016
GMS 1,683,792 GPVC 470,505 DPS 1,272,771 LTI 245,964
GMS - General Medical Services Scheme. GPVC - GP Visit Card Scheme. DPS - Drugs Payment Scheme. LTI - Long Term Illness Scheme.*The LTI fi gures shown refer to the number of eligible patients for whom claims were submitted to PCRS by pharmacists.
Persons who are unable without undue hardship to arrange General Practitioner medical and surgical services plus dental and optometric services for themselves and their dependants are provided with such services under the GMS Scheme. Since 1st October 2010, a person who is supplied by a Community Pharmacy Contractor with a drug, medicine or surgical appliance on the prescription of a Registered Medical Practitioner, Registered Dentist or Registered Nurse Prescriber is charged a prescription charge, currently €2.50 per item subject to a limit of €25.00 per family per month and this charge is recouped from payment to the Pharmacist. An eligible Person is entitled to select a GP of his/her choice, from among those GPs who have entered into agreements with the Health Service Executive. Drugs, medicines and appliances prescribed by participating GPs for their GMS patients are provided through Community Pharmacies. Dental and ophthalmic services are provided by Dentists and Optometrists/Ophthalmologists who have contracted with the Health Services Executive. GMS prescription forms may be dispensed in any Pharmacy that has an agreement with the Health Service Executive to dispense GMS prescription forms.
In rural areas, where a GP has a centre of practice three miles or more from the nearest Community Pharmacy participating in the Scheme, the GP dispenses for those persons served from the centre who opt to have their medicines dispensed by him/her. The number of eligible GMS persons at year end included 24,953 persons who were entitled and had opted to have their medicines dispensed by their GPs.
Under the terms of the Drugs Payment Scheme, persons who do not have a medical card may apply for a Drugs Payment Scheme card on an individual or family unit basis. Prescribed medicines, which are reimbursable under the GMS Scheme, costing in excess of a specifi ed amount per month, €144 during 2016, per family, is claimed by the Pharmacy and is paid by the Primary Care Reimbursement Service.
On approval by the Health Service Executive, persons who suffer from one or more of a schedule of illnesses are entitled to obtain, without charge, irrespective of income, necessary drugs/medicines and/or appliances under the LTI Scheme. The Primary Care Reimbursement Service makes payments on behalf of the Health Service Executive for LTI claims submitted by Pharmacies.
15
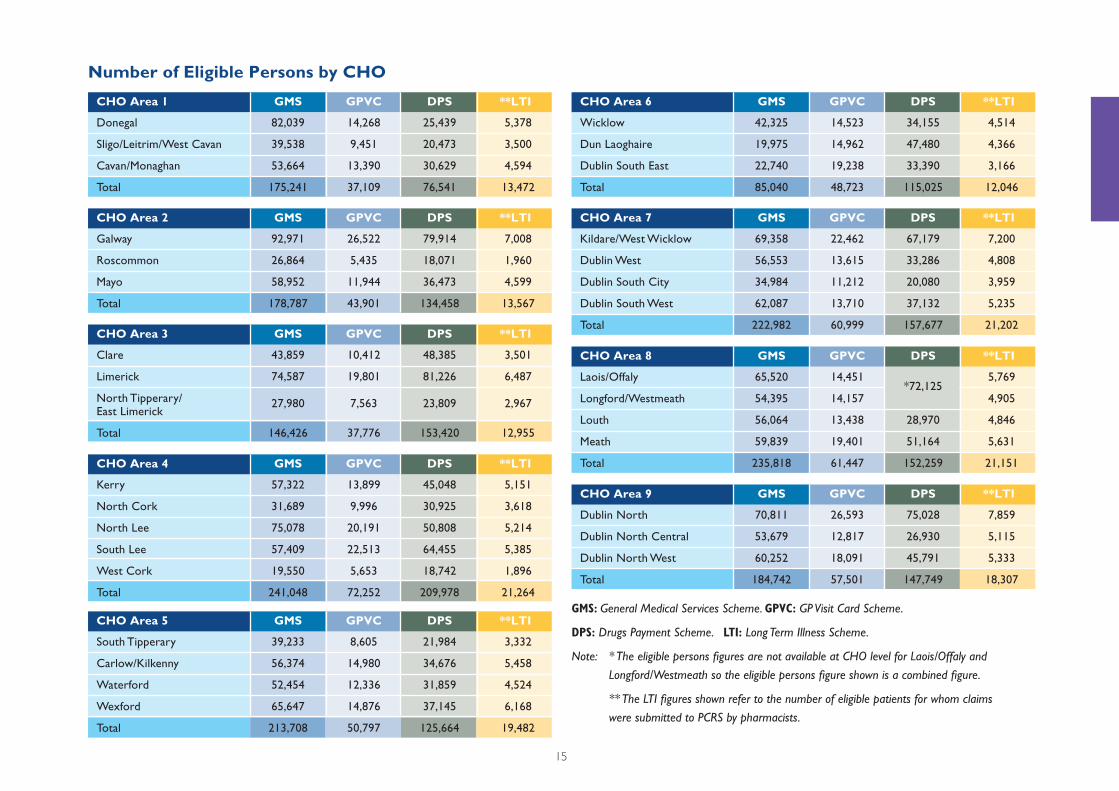
Number of Eligible Persons by CHO
Donegal 82,039 14,268 25,439 5,378
Sligo/Leitrim/West Cavan 39,538 9,451 20,473 3,500
Cavan/Monaghan 53,664 13,390 30,629 4,594
Total 175,241 37,109 76,541 13,472
Galway 92,971 26,522 79,914 7,008
Roscommon 26,864 5,435 18,071 1,960
Mayo 58,952 11,944 36,473 4,599
Total 178,787 43,901 134,458 13,567
South Tipperary 39,233 8,605 21,984 3,332
Carlow/Kilkenny 56,374 14,980 34,676 5,458
Waterford 52,454 12,336 31,859 4,524
Wexford 65,647 14,876 37,145 6,168
Total 213,708 50,797 125,664 19,482
Kerry 57,322 13,899 45,048 5,151
North Cork 31,689 9,996 30,925 3,618
North Lee 75,078 20,191 50,808 5,214
South Lee 57,409 22,513 64,455 5,385
West Cork 19,550 5,653 18,742 1,896
Total 241,048 72,252 209,978 21,264
Clare 43,859 10,412 48,385 3,501
Limerick 74,587 19,801 81,226 6,487
North Tipperary/East Limerick
27,980 7,563 23,809 2,967
Total 146,426 37,776 153,420 12,955
CHO Area 1 CHO Area 6
CHO Area 9
CHO Area 2 CHO Area 7
CHO Area 8
CHO Area 5
CHO Area 4
CHO Area 3
GMS GMS
GMS
GMS GMS
GMS
GMS
GMS
GMS
GPVC GPVC
GPVC
GPVC GPVC
GPVC
GPVC
GPVC
GPVC
DPS DPS
DPS
DPS DPS
DPS
DPS
DPS
DPS
**LTI **LTI
**LTI
**LTI **LTI
**LTI
**LTI
**LTI
**LTI
GMS: General Medical Services Scheme. GPVC: GP Visit Card Scheme.
DPS: Drugs Payment Scheme. LTI: Long Term Illness Scheme.
Note: * The eligible persons fi gures are not available at CHO level for Laois/Offaly and
Longford/Westmeath so the eligible persons fi gure shown is a combined fi gure.
** The LTI fi gures shown refer to the number of eligible patients for whom claims
were submitted to PCRS by pharmacists.
Wicklow 42,325 14,523 34,155 4,514
Dun Laoghaire 19,975 14,962 47,480 4,366
Dublin South East 22,740 19,238 33,390 3,166
Total 85,040 48,723 115,025 12,046
Dublin North 70,811 26,593 75,028 7,859
Dublin North Central 53,679 12,817 26,930 5,115
Dublin North West 60,252 18,091 45,791 5,333
Total 184,742 57,501 147,749 18,307
Kildare/West Wicklow 69,358 22,462 67,179 7,200
Dublin West 56,553 13,615 33,286 4,808
Dublin South City 34,984 11,212 20,080 3,959
Dublin South West 62,087 13,710 37,132 5,235
Total 222,982 60,999 157,677 21,202
Laois/Offaly 65,520 14,451 *72,125
5,769
Longford/Westmeath 54,395 14,157 4,905
Louth 56,064 13,438 28,970 4,846
Meath 59,839 19,401 51,164 5,631
Total 235,818 61,447 152,259 21,151
16
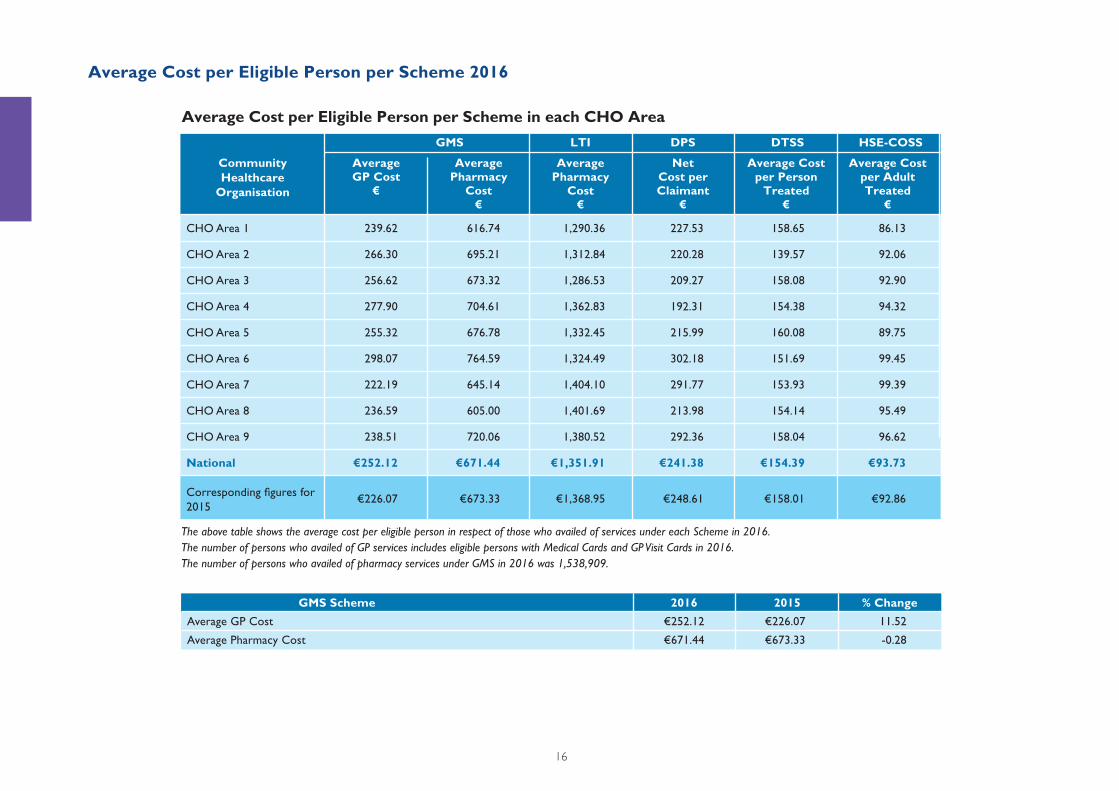
Average Cost per Eligible Person per Scheme in each CHO Area
GMS Scheme 2016 2015 % Change
Average GP Cost €252.12 €226.07 11.52
Average Pharmacy Cost €671.44 €673.33 -0.28
Average Cost per Eligible Person per Scheme 2016
CommunityHealthcare
Organisation
AveragePharmacy
Cost€
AverageGP Cost
€
GMS
NetCost perClaimant
€
DPSLTI DTSS
Average Costper Person
Treated€
Average Costper AdultTreated
€
HSE-COSS
AveragePharmacy
Cost€
The above table shows the average cost per eligible person in respect of those who availed of services under each Scheme in 2016.The number of persons who availed of GP services includes eligible persons with Medical Cards and GP Visit Cards in 2016.The number of persons who availed of pharmacy services under GMS in 2016 was 1,538,909.
CHO Area 1 239.62 616.74 1,290.36 227.53 158.65 86.13
CHO Area 2 266.30 695.21 1,312.84 220.28 139.57 92.06
CHO Area 3 256.62 673.32 1,286.53 209.27 158.08 92.90
CHO Area 4 277.90 704.61 1,362.83 192.31 154.38 94.32
CHO Area 5 255.32 676.78 1,332.45 215.99 160.08 89.75
CHO Area 6 298.07 764.59 1,324.49 302.18 151.69 99.45
CHO Area 7 222.19 645.14 1,404.10 291.77 153.93 99.39
CHO Area 8 236.59 605.00 1,401.69 213.98 154.14 95.49
CHO Area 9 238.51 720.06 1,380.52 292.36 158.04 96.62
National €252.12 €671.44 €1,351.91 €241.38 €154.39 €93.73
Corresponding fi gures for
2015 €226.07 €673.33 €1,368.95 €248.61 €158.01 €92.86
17
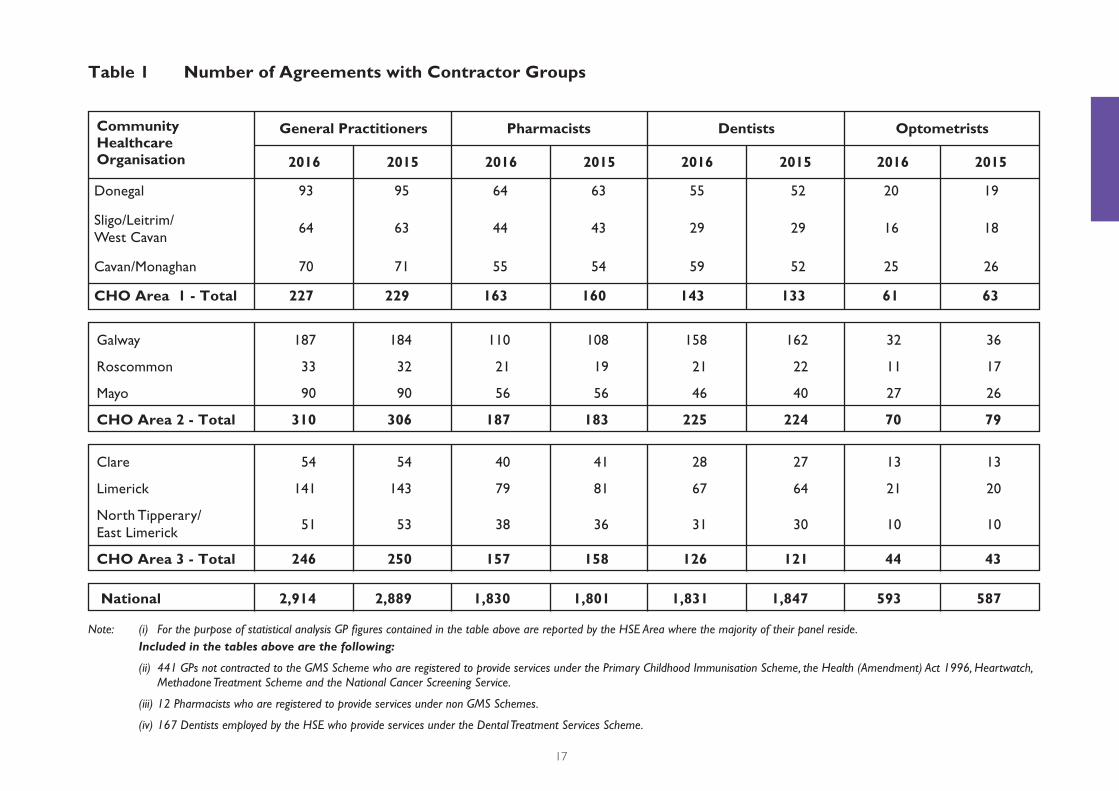
Table 1 Number of Agreements with Contractor Groups
CommunityHealthcare Organisation 2016 2016 2016 20162015 2015 2015 2015
OptometristsDentistsPharmacistsGeneral Practitioners
Donegal 93 95 64 63 55 52 20 19
Sligo/Leitrim/
West Cavan 64 63 44 43 29 29 16 18
Cavan/Monaghan 70 71 55 54 59 52 25 26
CHO Area 1 - Total 227 229 163 160 143 133 61 63
Galway 187 184 110 108 158 162 32 36
Roscommon 33 32 21 19 21 22 11 17
Mayo 90 90 56 56 46 40 27 26
CHO Area 2 - Total 310 306 187 183 225 224 70 79
Clare 54 54 40 41 28 27 13 13
Limerick 141 143 79 81 67 64 21 20
North Tipperary/
East Limerick 51 53 38 36 31 30 10 10
CHO Area 3 - Total 246 250 157 158 126 121 44 43
National 2,914 2,889 1,830 1,801 1,831 1,847 593 587
Note: (i) For the purpose of statistical analysis GP fi gures contained in the table above are reported by the HSE Area where the majority of their panel reside. Included in the tables above are the following:
(ii) 441 GPs not contracted to the GMS Scheme who are registered to provide services under the Primary Childhood Immunisation Scheme, the Health (Amendment) Act 1996, Heartwatch, Methadone Treatment Scheme and the National Cancer Screening Service.
(iii) 12 Pharmacists who are registered to provide services under non GMS Schemes.
(iv) 167 Dentists employed by the HSE who provide services under the Dental Treatment Services Scheme.
18
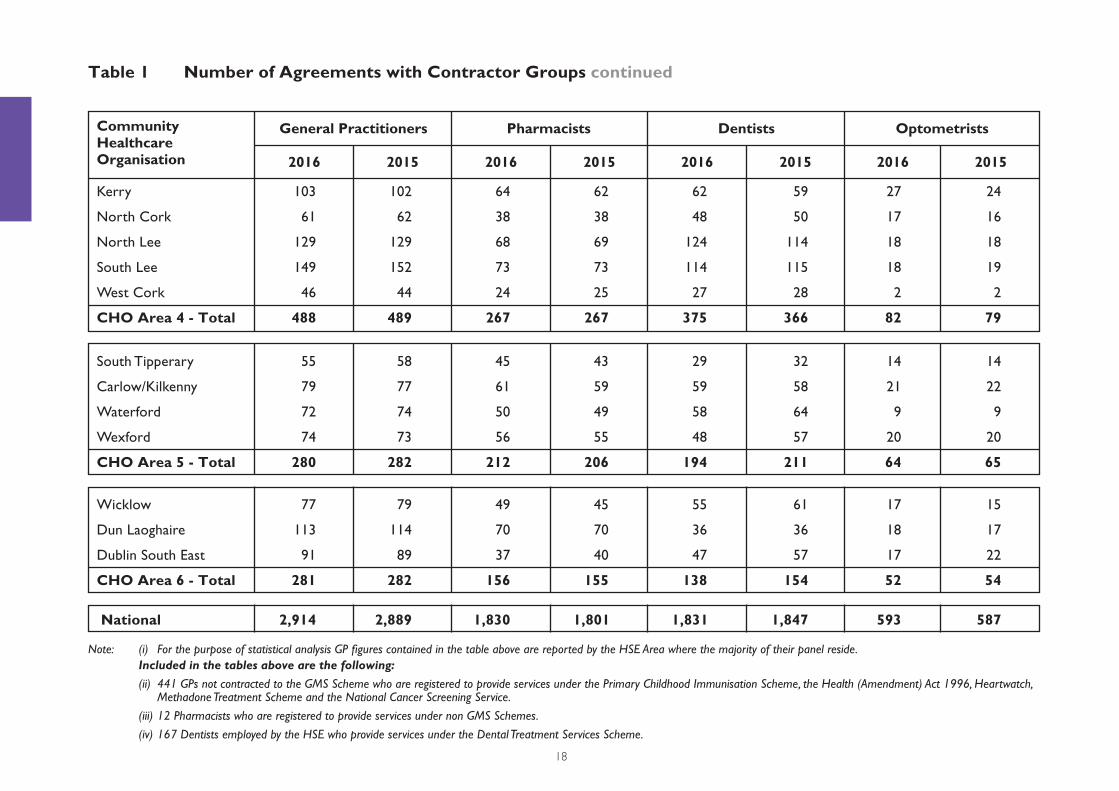
Table 1 Number of Agreements with Contractor Groups continued
CommunityHealthcare Organisation 2016 2016 2016 20162015 2015 2015 2015
OptometristsDentistsPharmacistsGeneral Practitioners
Kerry 103 102 64 62 62 59 27 24
North Cork 61 62 38 38 48 50 17 16
North Lee 129 129 68 69 124 114 18 18
South Lee 149 152 73 73 114 115 18 19
West Cork 46 44 24 25 27 28 2 2
CHO Area 4 - Total 488 489 267 267 375 366 82 79
Wicklow 77 79 49 45 55 61 17 15
Dun Laoghaire 113 114 70 70 36 36 18 17
Dublin South East 91 89 37 40 47 57 17 22
CHO Area 6 - Total 281 282 156 155 138 154 52 54
South Tipperary 55 58 45 43 29 32 14 14
Carlow/Kilkenny 79 77 61 59 59 58 21 22
Waterford 72 74 50 49 58 64 9 9
Wexford 74 73 56 55 48 57 20 20
CHO Area 5 - Total 280 282 212 206 194 211 64 65
National 2,914 2,889 1,830 1,801 1,831 1,847 593 587
Note: (i) For the purpose of statistical analysis GP fi gures contained in the table above are reported by the HSE Area where the majority of their panel reside. Included in the tables above are the following:
(ii) 441 GPs not contracted to the GMS Scheme who are registered to provide services under the Primary Childhood Immunisation Scheme, the Health (Amendment) Act 1996, Heartwatch, Methadone Treatment Scheme and the National Cancer Screening Service.
(iii) 12 Pharmacists who are registered to provide services under non GMS Schemes.
(iv) 167 Dentists employed by the HSE who provide services under the Dental Treatment Services Scheme.
19
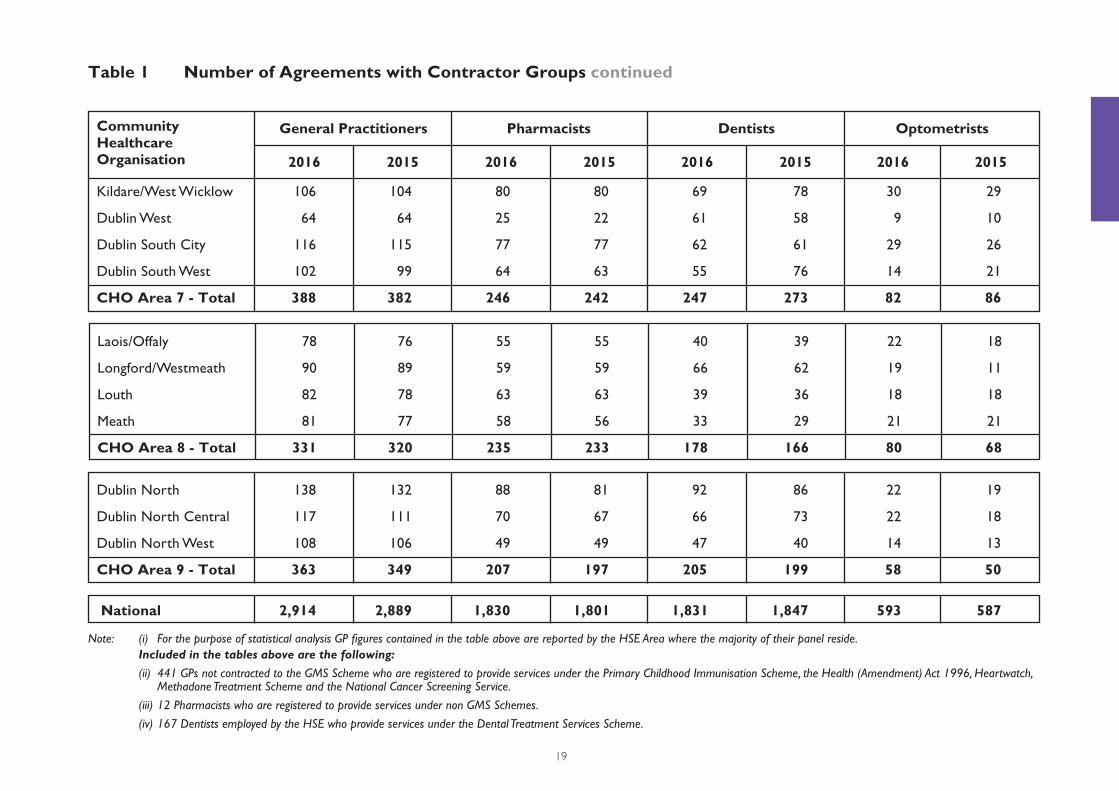
Table 1 Number of Agreements with Contractor Groups continued
CommunityHealthcare Organisation 2016 2016 2016 20162015 2015 2015 2015
OptometristsDentistsPharmacistsGeneral Practitioners
Kildare/West Wicklow 106 104 80 80 69 78 30 29
Dublin West 64 64 25 22 61 58 9 10
Dublin South City 116 115 77 77 62 61 29 26
Dublin South West 102 99 64 63 55 76 14 21
CHO Area 7 - Total 388 382 246 242 247 273 82 86
Dublin North 138 132 88 81 92 86 22 19
Dublin North Central 117 111 70 67 66 73 22 18
Dublin North West 108 106 49 49 47 40 14 13
CHO Area 9 - Total 363 349 207 197 205 199 58 50
Laois/Offaly 78 76 55 55 40 39 22 18
Longford/Westmeath 90 89 59 59 66 62 19 11
Louth 82 78 63 63 39 36 18 18
Meath 81 77 58 56 33 29 21 21
CHO Area 8 - Total 331 320 235 233 178 166 80 68
National 2,914 2,889 1,830 1,801 1,831 1,847 593 587
Note: (i) For the purpose of statistical analysis GP fi gures contained in the table above are reported by the HSE Area where the majority of their panel reside. Included in the tables above are the following:
(ii) 441 GPs not contracted to the GMS Scheme who are registered to provide services under the Primary Childhood Immunisation Scheme, the Health (Amendment) Act 1996, Heartwatch, Methadone Treatment Scheme and the National Cancer Screening Service.
(iii) 12 Pharmacists who are registered to provide services under non GMS Schemes.
(iv) 167 Dentists employed by the HSE who provide services under the Dental Treatment Services Scheme.
20
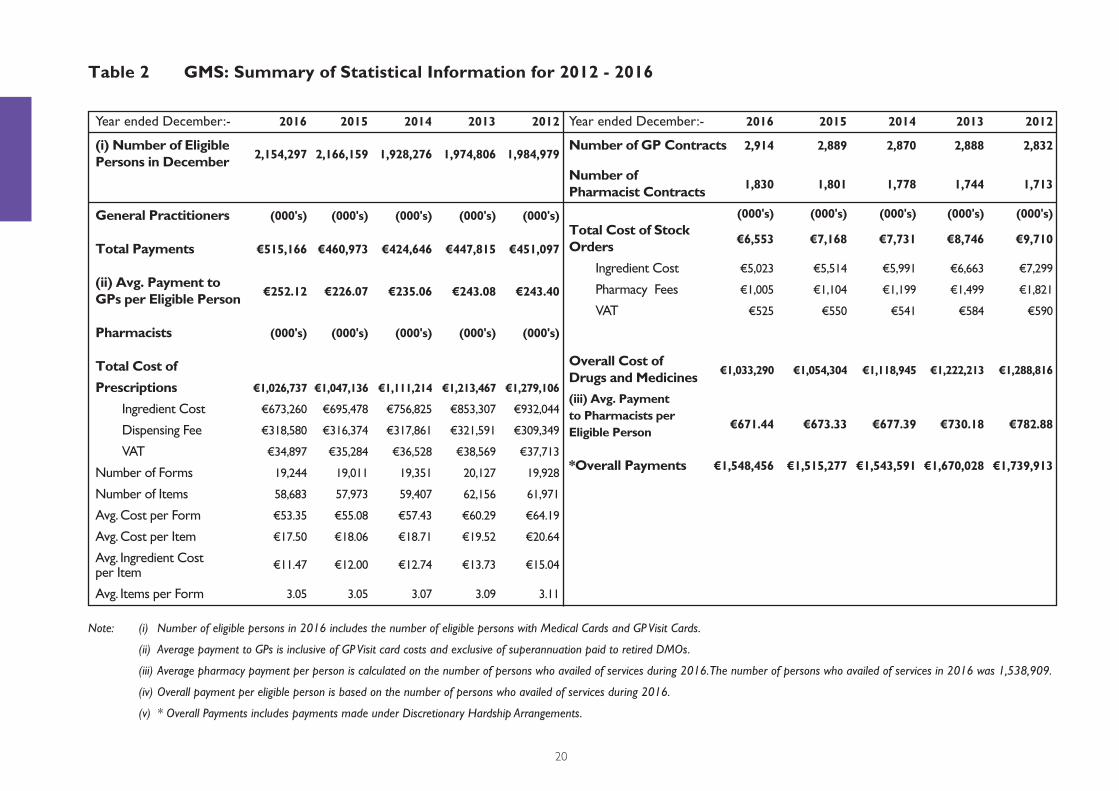
Table 2 GMS: Summary of Statistical Information for 2012 - 2016
Year ended December:- 2016 2015 2014 2013 2012 Year ended December:- 2016 2015 2014 2013 2012
(i) Number of EligiblePersons in December
2,154,297 2,166,159 1,928,276 1,974,806 1,984,979
General Practitioners (000's) (000's) (000's) (000's) (000's) Total Payments €515,166 €460,973 €424,646 €447,815 €451,097 (ii) Avg. Payment to GPs per Eligible Person
€252.12 €226.07 €235.06 €243.08 €243.40
Pharmacists (000's) (000's) (000's) (000's) (000's)
Total Cost of
Prescriptions €1,026,737 €1,047,136 €1,111,214 €1,213,467 €1,279,106
Ingredient Cost €673,260 €695,478 €756,825 €853,307 €932,044
Dispensing Fee €318,580 €316,374 €317,861 €321,591 €309,349
VAT €34,897 €35,284 €36,528 €38,569 €37,713
Number of Forms 19,244 19,011 19,351 20,127 19,928
Number of Items 58,683 57,973 59,407 62,156 61,971
Avg. Cost per Form €53.35 €55.08 €57.43 €60.29 €64.19
Avg. Cost per Item €17.50 €18.06 €18.71 €19.52 €20.64
Avg. Ingredient Cost per Item
€11.47 €12.00 €12.74 €13.73 €15.04
Avg. Items per Form 3.05 3.05 3.07 3.09 3.11
Number of GP Contracts 2,914 2,889 2,870 2,888 2,832
Number of Pharmacist Contracts
1,830 1,801 1,778 1,744 1,713
(000's) (000's) (000's) (000's) (000's)Total Cost of StockOrders
€6,553 €7,168 €7,731 €8,746 €9,710
Ingredient Cost €5,023 €5,514 €5,991 €6,663 €7,299
Pharmacy Fees €1,005 €1,104 €1,199 €1,499 €1,821
VAT €525 €550 €541 €584 €590
Overall Cost of Drugs and Medicines
€1,033,290 €1,054,304 €1,118,945 €1,222,213 €1,288,816
(iii) Avg. Payment to Pharmacists per Eligible Person
€671.44 €673.33 €677.39 €730.18 €782.88
*Overall Payments €1,548,456 €1,515,277 €1,543,591 €1,670,028 €1,739,913
Note: (i) Number of eligible persons in 2016 includes the number of eligible persons with Medical Cards and GP Visit Cards.
(ii) Average payment to GPs is inclusive of GP Visit card costs and exclusive of superannuation paid to retired DMOs.
(iii) Average pharmacy payment per person is calculated on the number of persons who availed of services during 2016. The number of persons who availed of services in 2016 was 1,538,909.
(iv) Overall payment per eligible person is based on the number of persons who availed of services during 2016.
(v) * Overall Payments includes payments made under Discretionary Hardship Arrangements.

21
Table 3 LTI / DP Schemes: Summary of Statistical Information for 2012 - 2016
Year ended December:- 2016 2015 2014 2013 2012 Year ended December:- 2016 2015 2014 2013 2012
LTI Scheme
* Number of Claimants 153,446 138,415 111,940 71,926 69,513
(000's) (000's) (000's) (000's) (000's)
Number of Items 7,594 6,759 4,697 3,030 2,944
Total Cost €207,445 €189,484 €139,191 €106,510 €117,102
Avg. Cost per Item €27.32 €28.03 €29.64 €35.15 €39.77
* Avg. Cost
per Claimant €1,351.91 €1,368.95 €1,243.45 €1,480.83 €1,684.60
DP Scheme
Number of Eligible Persons in
December 1,272,771 1,301,952 1,332,816 1,399,208 1,463,388
* Number of Claimants 270,525 269,930 278,227 308,357 370,791
(000's) (000's) (000's) (000's) (000's)
Number of Items 7,204 7,159 7,007 7,629 9,334
Gross Cost €153,670 €155,869 €156,272 €189,428 €254,512
** Net Cost €65,300 €67,109 €67,534 €84,046 €125,691
Avg. Gross Cost per Item €21.33 €21.77 €22.30 €24.83 €27.27
* Avg. Net Cost per Claimant
€241.38 €248.61 €242.73 €272.56 €338.98
Note: (i) *These fi gures are based on the number of eligible persons who availed of services under each Scheme.
(ii) **The Net Cost is inclusive of claims below the monthly co-payment of €144 (2016) payable to the Pharmacy by an individual or family.
22
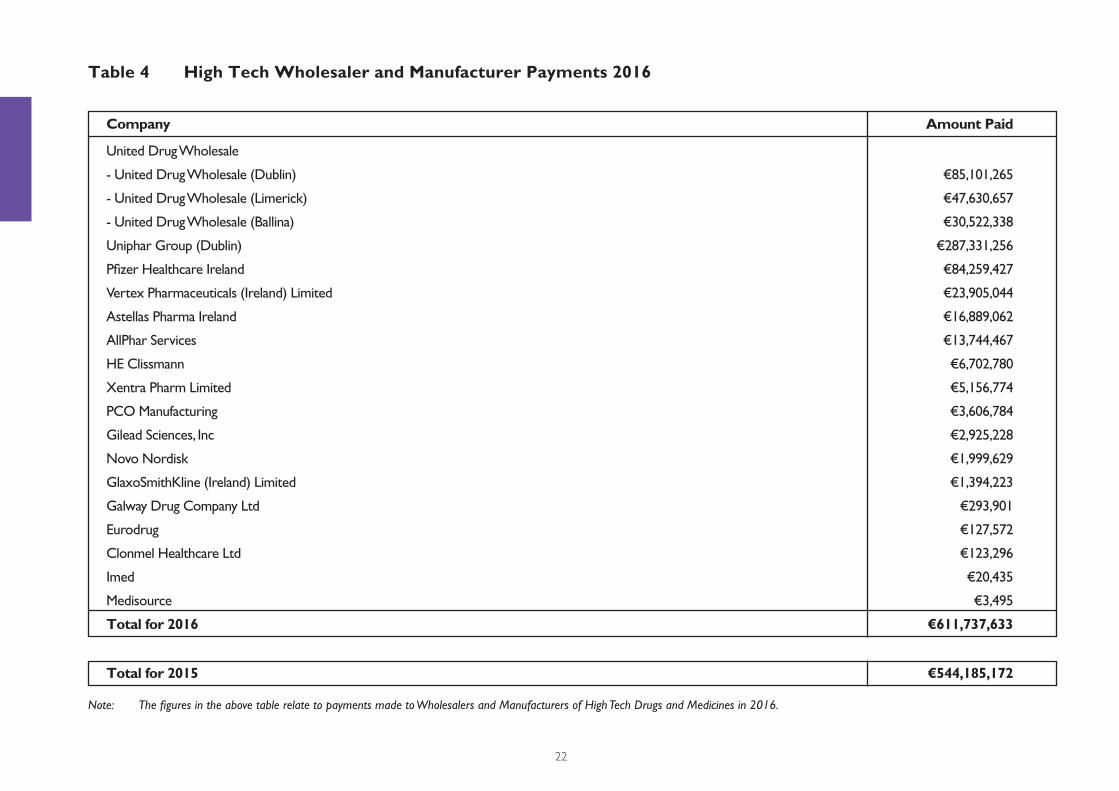
Note: The fi gures in the above table relate to payments made to Wholesalers and Manufacturers of High Tech Drugs and Medicines in 2016.
Table 4 High Tech Wholesaler and Manufacturer Payments 2016
Company Amount Paid
United Drug Wholesale
- United Drug Wholesale (Dublin) €85,101,265
- United Drug Wholesale (Limerick) €47,630,657
- United Drug Wholesale (Ballina) €30,522,338
Uniphar Group (Dublin) €287,331,256
Pfi zer Healthcare Ireland €84,259,427
Vertex Pharmaceuticals (Ireland) Limited €23,905,044
Astellas Pharma Ireland €16,889,062
AllPhar Services €13,744,467
HE Clissmann €6,702,780
Xentra Pharm Limited €5,156,774
PCO Manufacturing €3,606,784
Gilead Sciences, Inc €2,925,228
Novo Nordisk €1,999,629
GlaxoSmithKline (Ireland) Limited €1,394,223
Galway Drug Company Ltd €293,901
Eurodrug €127,572
Clonmel Healthcare Ltd €123,296
Imed €20,435
Medisource €3,495
Total for 2016 €611,737,633
Total for 2015 €544,185,172
S E C T I O N
24
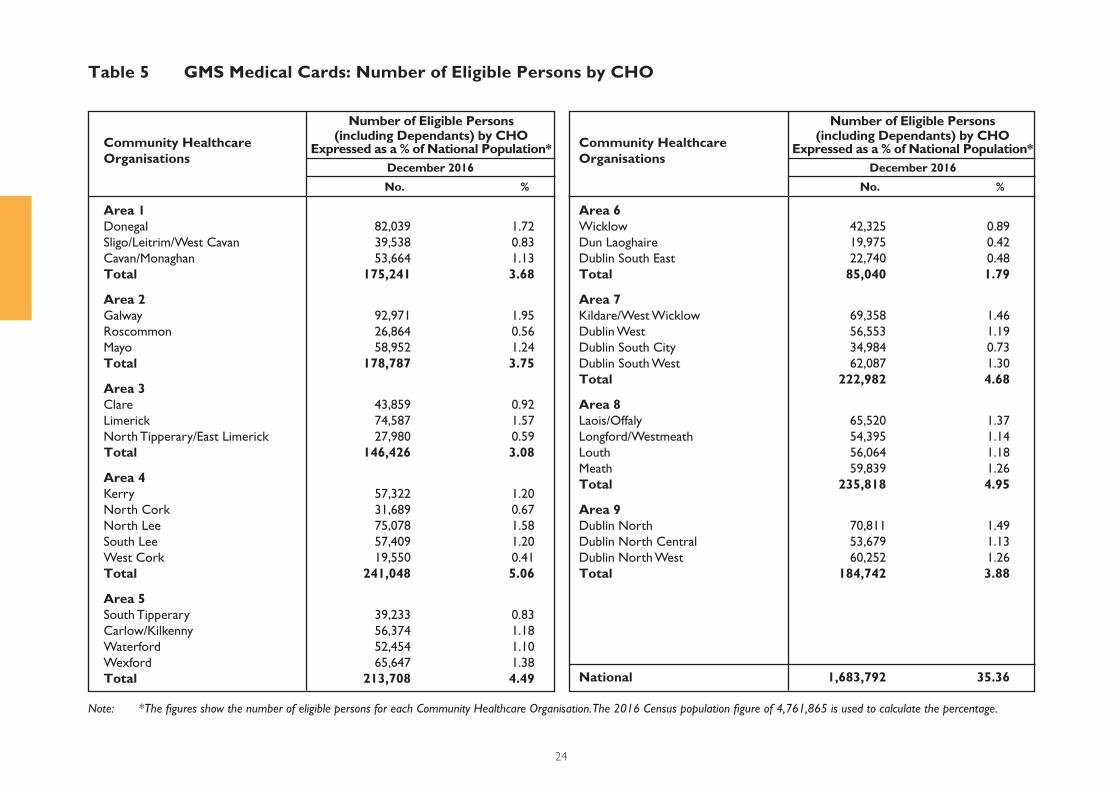
Note: *The fi gures show the number of eligible persons for each Community Healthcare Organisation. The 2016 Census population fi gure of 4,761,865 is used to calculate the percentage.
Table 5 GMS Medical Cards: Number of Eligible Persons by CHO
Area 1Donegal 82,039 1.72
Sligo/Leitrim/West Cavan 39,538 0.83
Cavan/Monaghan 53,664 1.13
Total 175,241 3.68
Area 2Galway 92,971 1.95
Roscommon 26,864 0.56
Mayo 58,952 1.24
Total 178,787 3.75
Area 3Clare 43,859 0.92
Limerick 74,587 1.57
North Tipperary/East Limerick 27,980 0.59
Total 146,426 3.08
Area 4Kerry 57,322 1.20
North Cork 31,689 0.67
North Lee 75,078 1.58
South Lee 57,409 1.20
West Cork 19,550 0.41
Total 241,048 5.06
Area 5South Tipperary 39,233 0.83
Carlow/Kilkenny 56,374 1.18
Waterford 52,454 1.10
Wexford 65,647 1.38
Total 213,708 4.49
Area 6Wicklow 42,325 0.89
Dun Laoghaire 19,975 0.42
Dublin South East 22,740 0.48
Total 85,040 1.79
Area 7Kildare/West Wicklow 69,358 1.46
Dublin West 56,553 1.19
Dublin South City 34,984 0.73
Dublin South West 62,087 1.30
Total 222,982 4.68
Area 8Laois/Offaly 65,520 1.37
Longford/Westmeath 54,395 1.14
Louth 56,064 1.18
Meath 59,839 1.26
Total 235,818 4.95
Area 9Dublin North 70,811 1.49
Dublin North Central 53,679 1.13
Dublin North West 60,252 1.26
Total 184,742 3.88
National 1,683,792 35.36
Community HealthcareOrganisations
Community HealthcareOrganisations
Number of Eligible Persons(including Dependants) by CHO
Expressed as a % of National Population*December 2016
No. % No. %
Number of Eligible Persons(including Dependants) by CHO
Expressed as a % of National Population*December 2016
25
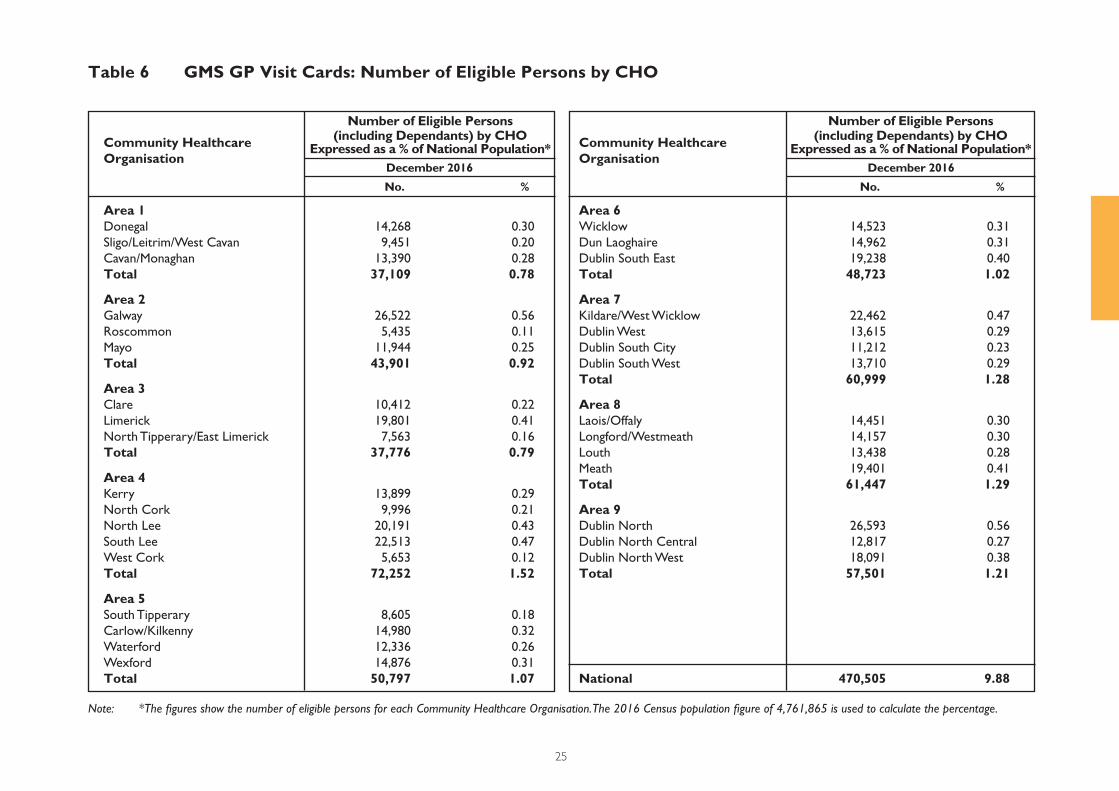
Note: *The fi gures show the number of eligible persons for each Community Healthcare Organisation. The 2016 Census population fi gure of 4,761,865 is used to calculate the percentage.
Table 6 GMS GP Visit Cards: Number of Eligible Persons by CHO
Area 1Donegal 14,268 0.30
Sligo/Leitrim/West Cavan 9,451 0.20
Cavan/Monaghan 13,390 0.28
Total 37,109 0.78
Area 2Galway 26,522 0.56
Roscommon 5,435 0.11
Mayo 11,944 0.25
Total 43,901 0.92
Area 3
Clare 10,412 0.22
Limerick 19,801 0.41
North Tipperary/East Limerick 7,563 0.16
Total 37,776 0.79
Area 4Kerry 13,899 0.29
North Cork 9,996 0.21
North Lee 20,191 0.43
South Lee 22,513 0.47
West Cork 5,653 0.12
Total 72,252 1.52
Area 5South Tipperary 8,605 0.18
Carlow/Kilkenny 14,980 0.32
Waterford 12,336 0.26
Wexford 14,876 0.31
Total 50,797 1.07
Area 6Wicklow 14,523 0.31
Dun Laoghaire 14,962 0.31
Dublin South East 19,238 0.40
Total 48,723 1.02
Area 7Kildare/West Wicklow 22,462 0.47
Dublin West 13,615 0.29
Dublin South City 11,212 0.23
Dublin South West 13,710 0.29
Total 60,999 1.28
Area 8Laois/Offaly 14,451 0.30
Longford/Westmeath 14,157 0.30
Louth 13,438 0.28
Meath 19,401 0.41
Total 61,447 1.29
Area 9
Dublin North 26,593 0.56
Dublin North Central 12,817 0.27
Dublin North West 18,091 0.38
Total 57,501 1.21
National 470,505 9.88
Community HealthcareOrganisation
Community HealthcareOrganisation
Number of Eligible Persons(including Dependants) by CHO
Expressed as a % of National Population*December 2016
No. % No. %
Number of Eligible Persons(including Dependants) by CHO
Expressed as a % of National Population*December 2016
26
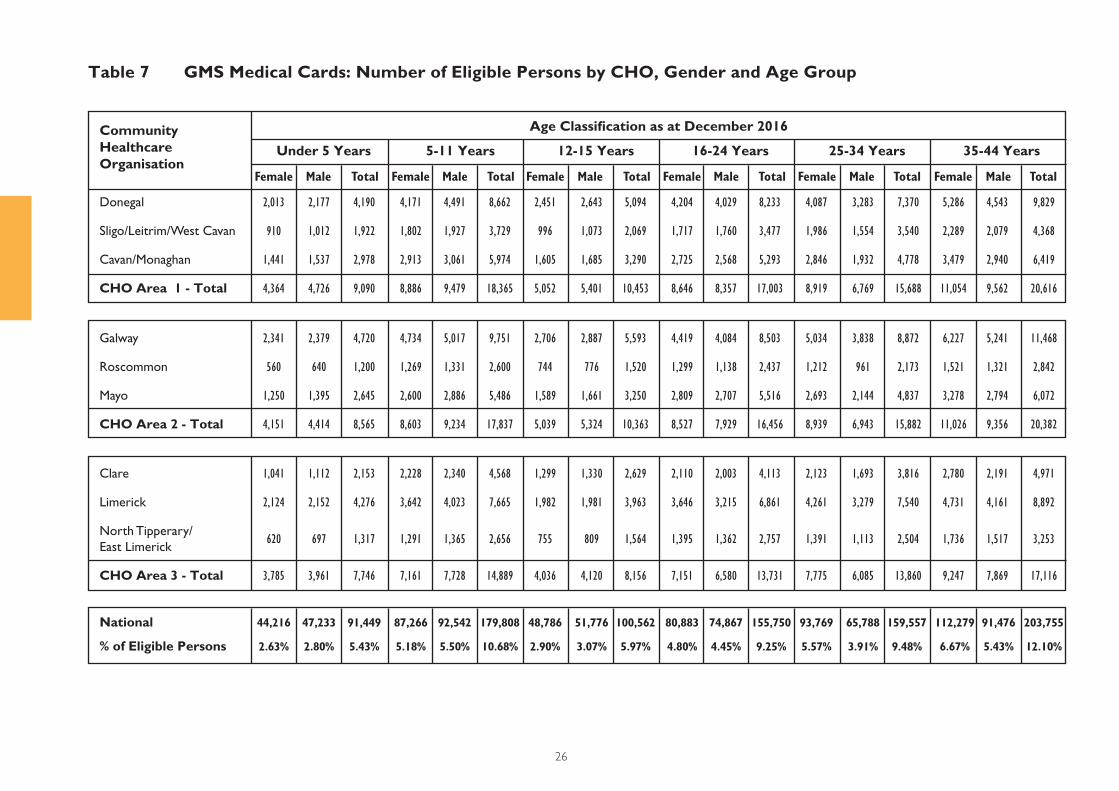
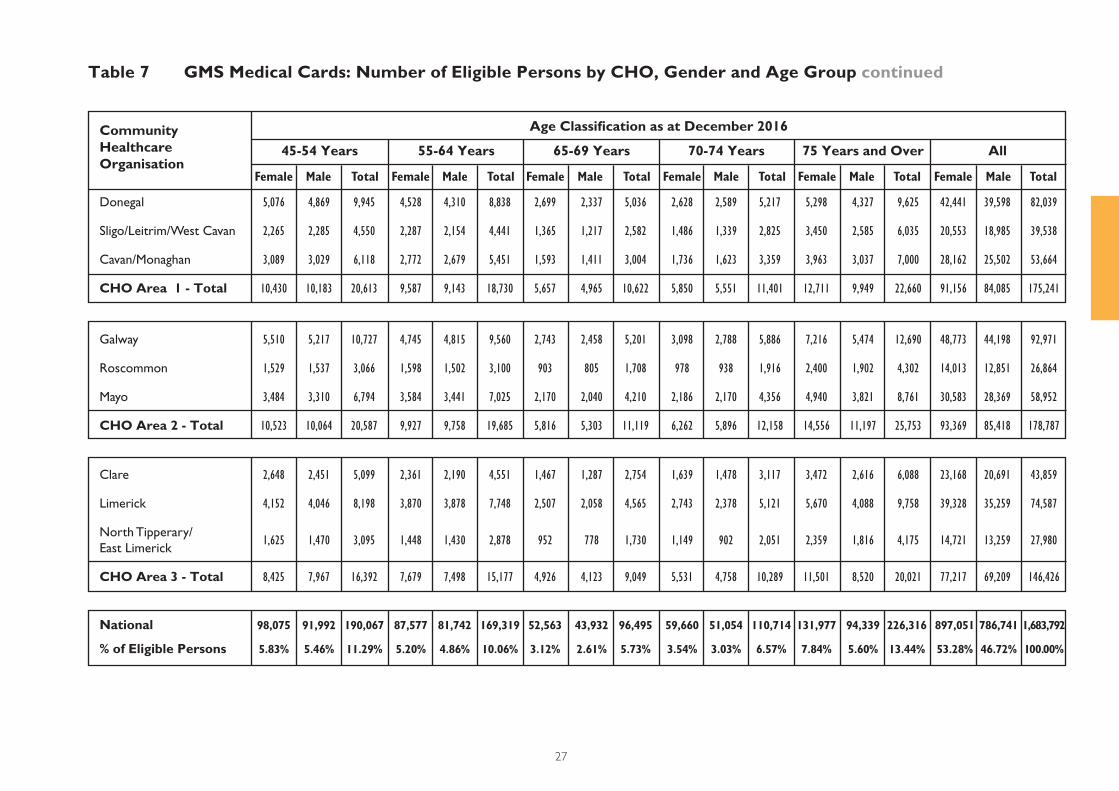
Table 7 GMS Medical Cards: Number of Eligible Persons by CHO, Gender and Age Group
Donegal 2,013 2,177 4,190 4,171 4,491 8,662 2,451 2,643 5,094 4,204 4,029 8,233 4,087 3,283 7,370 5,286 4,543 9,829
Sligo/Leitrim/West Cavan 910 1,012 1,922 1,802 1,927 3,729 996 1,073 2,069 1,717 1,760 3,477 1,986 1,554 3,540 2,289 2,079 4,368
Cavan/Monaghan 1,441 1,537 2,978 2,913 3,061 5,974 1,605 1,685 3,290 2,725 2,568 5,293 2,846 1,932 4,778 3,479 2,940 6,419
CHO Area 1 - Total 4,364 4,726 9,090 8,886 9,479 18,365 5,052 5,401 10,453 8,646 8,357 17,003 8,919 6,769 15,688 11,054 9,562 20,616
Galway 2,341 2,379 4,720 4,734 5,017 9,751 2,706 2,887 5,593 4,419 4,084 8,503 5,034 3,838 8,872 6,227 5,241 11,468
Roscommon 560 640 1,200 1,269 1,331 2,600 744 776 1,520 1,299 1,138 2,437 1,212 961 2,173 1,521 1,321 2,842
Mayo 1,250 1,395 2,645 2,600 2,886 5,486 1,589 1,661 3,250 2,809 2,707 5,516 2,693 2,144 4,837 3,278 2,794 6,072
CHO Area 2 - Total 4,151 4,414 8,565 8,603 9,234 17,837 5,039 5,324 10,363 8,527 7,929 16,456 8,939 6,943 15,882 11,026 9,356 20,382
National 44,216 47,233 91,449 87,266 92,542 179,808 48,786 51,776 100,562 80,883 74,867 155,750 93,769 65,788 159,557 112,279 91,476 203,755
% of Eligible Persons 2.63% 2.80% 5.43% 5.18% 5.50% 10.68% 2.90% 3.07% 5.97% 4.80% 4.45% 9.25% 5.57% 3.91% 9.48% 6.67% 5.43% 12.10%
Clare 1,041 1,112 2,153 2,228 2,340 4,568 1,299 1,330 2,629 2,110 2,003 4,113 2,123 1,693 3,816 2,780 2,191 4,971
Limerick 2,124 2,152 4,276 3,642 4,023 7,665 1,982 1,981 3,963 3,646 3,215 6,861 4,261 3,279 7,540 4,731 4,161 8,892
North Tipperary/
East Limerick 620 697 1,317 1,291 1,365 2,656 755 809 1,564 1,395 1,362 2,757 1,391 1,113 2,504 1,736 1,517 3,253
CHO Area 3 - Total 3,785 3,961 7,746 7,161 7,728 14,889 4,036 4,120 8,156 7,151 6,580 13,731 7,775 6,085 13,860 9,247 7,869 17,116
CommunityHealthcare Organisation
Age Classifi cation as at December 2016
Female Male Total Female Male Total Female Male Total Female Male Total Female Male Total Female Male Total
Under 5 Years 5-11 Years 16-24 Years 35-44 Years12-15 Years 25-34 Years
27
Table 7 GMS Medical Cards: Number of Eligible Persons by CHO, Gender and Age Group continued
Donegal 5,076 4,869 9,945 4,528 4,310 8,838 2,699 2,337 5,036 2,628 2,589 5,217 5,298 4,327 9,625 42,441 39,598 82,039
Sligo/Leitrim/West Cavan 2,265 2,285 4,550 2,287 2,154 4,441 1,365 1,217 2,582 1,486 1,339 2,825 3,450 2,585 6,035 20,553 18,985 39,538
Cavan/Monaghan 3,089 3,029 6,118 2,772 2,679 5,451 1,593 1,411 3,004 1,736 1,623 3,359 3,963 3,037 7,000 28,162 25,502 53,664
CHO Area 1 - Total 10,430 10,183 20,613 9,587 9,143 18,730 5,657 4,965 10,622 5,850 5,551 11,401 12,711 9,949 22,660 91,156 84,085 175,241
Galway 5,510 5,217 10,727 4,745 4,815 9,560 2,743 2,458 5,201 3,098 2,788 5,886 7,216 5,474 12,690 48,773 44,198 92,971
Roscommon 1,529 1,537 3,066 1,598 1,502 3,100 903 805 1,708 978 938 1,916 2,400 1,902 4,302 14,013 12,851 26,864
Mayo 3,484 3,310 6,794 3,584 3,441 7,025 2,170 2,040 4,210 2,186 2,170 4,356 4,940 3,821 8,761 30,583 28,369 58,952
CHO Area 2 - Total 10,523 10,064 20,587 9,927 9,758 19,685 5,816 5,303 11,119 6,262 5,896 12,158 14,556 11,197 25,753 93,369 85,418 178,787
National 98,075 91,992 190,067 87,577 81,742 169,319 52,563 43,932 96,495 59,660 51,054 110,714 131,977 94,339 226,316 897,051 786,741 1,683,792
% of Eligible Persons 5.83% 5.46% 11.29% 5.20% 4.86% 10.06% 3.12% 2.61% 5.73% 3.54% 3.03% 6.57% 7.84% 5.60% 13.44% 53.28% 46.72% 100.00%
Clare 2,648 2,451 5,099 2,361 2,190 4,551 1,467 1,287 2,754 1,639 1,478 3,117 3,472 2,616 6,088 23,168 20,691 43,859
Limerick 4,152 4,046 8,198 3,870 3,878 7,748 2,507 2,058 4,565 2,743 2,378 5,121 5,670 4,088 9,758 39,328 35,259 74,587
North Tipperary/
East Limerick 1,625 1,470 3,095 1,448 1,430 2,878 952 778 1,730 1,149 902 2,051 2,359 1,816 4,175 14,721 13,259 27,980
CHO Area 3 - Total 8,425 7,967 16,392 7,679 7,498 15,177 4,926 4,123 9,049 5,531 4,758 10,289 11,501 8,520 20,021 77,217 69,209 146,426
CommunityHealthcare Organisation
Age Classifi cation as at December 2016
45-54 Years
Female Male Total Female Male Total Female Male Total Female Male Total Female Male Total Female Male Total
55-64 Years 70-74 Years All65-69 Years 75 Years and Over
28
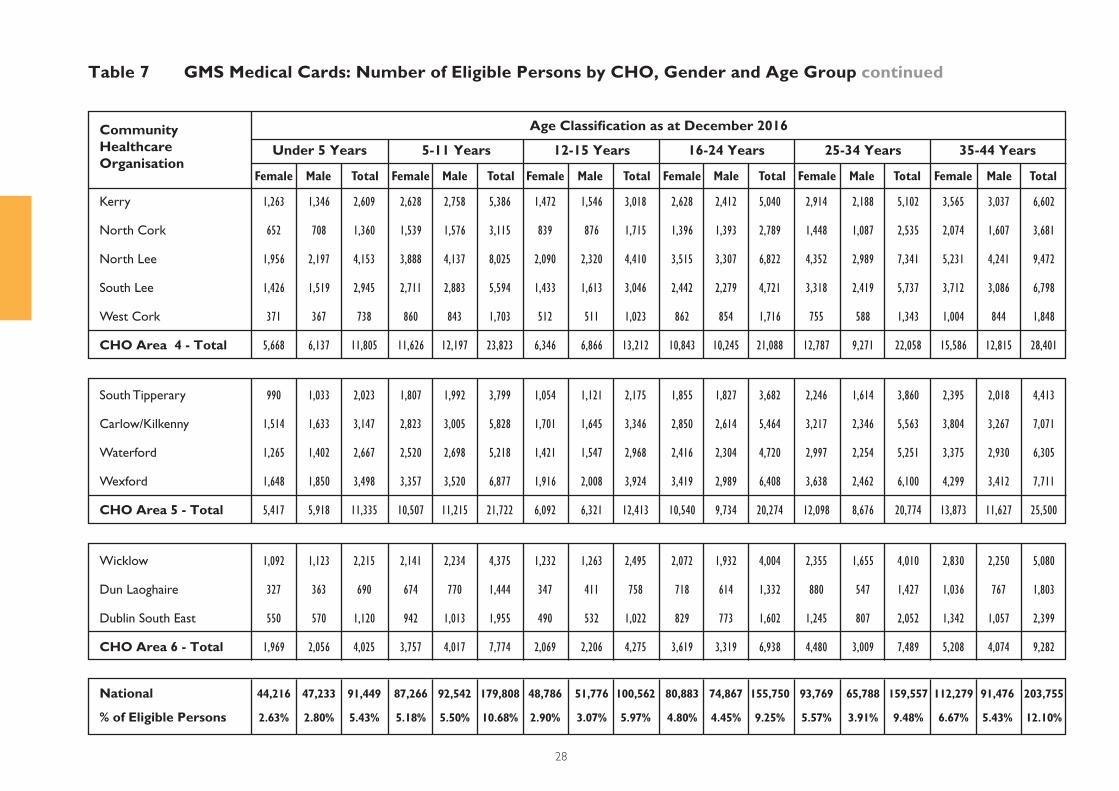
Table 7 GMS Medical Cards: Number of Eligible Persons by CHO, Gender and Age Group continued
Kerry 1,263 1,346 2,609 2,628 2,758 5,386 1,472 1,546 3,018 2,628 2,412 5,040 2,914 2,188 5,102 3,565 3,037 6,602
North Cork 652 708 1,360 1,539 1,576 3,115 839 876 1,715 1,396 1,393 2,789 1,448 1,087 2,535 2,074 1,607 3,681
North Lee 1,956 2,197 4,153 3,888 4,137 8,025 2,090 2,320 4,410 3,515 3,307 6,822 4,352 2,989 7,341 5,231 4,241 9,472
South Lee 1,426 1,519 2,945 2,711 2,883 5,594 1,433 1,613 3,046 2,442 2,279 4,721 3,318 2,419 5,737 3,712 3,086 6,798
West Cork 371 367 738 860 843 1,703 512 511 1,023 862 854 1,716 755 588 1,343 1,004 844 1,848
CHO Area 4 - Total 5,668 6,137 11,805 11,626 12,197 23,823 6,346 6,866 13,212 10,843 10,245 21,088 12,787 9,271 22,058 15,586 12,815 28,401
Wicklow 1,092 1,123 2,215 2,141 2,234 4,375 1,232 1,263 2,495 2,072 1,932 4,004 2,355 1,655 4,010 2,830 2,250 5,080
Dun Laoghaire 327 363 690 674 770 1,444 347 411 758 718 614 1,332 880 547 1,427 1,036 767 1,803
Dublin South East 550 570 1,120 942 1,013 1,955 490 532 1,022 829 773 1,602 1,245 807 2,052 1,342 1,057 2,399
CHO Area 6 - Total 1,969 2,056 4,025 3,757 4,017 7,774 2,069 2,206 4,275 3,619 3,319 6,938 4,480 3,009 7,489 5,208 4,074 9,282
National 44,216 47,233 91,449 87,266 92,542 179,808 48,786 51,776 100,562 80,883 74,867 155,750 93,769 65,788 159,557 112,279 91,476 203,755
% of Eligible Persons 2.63% 2.80% 5.43% 5.18% 5.50% 10.68% 2.90% 3.07% 5.97% 4.80% 4.45% 9.25% 5.57% 3.91% 9.48% 6.67% 5.43% 12.10%
South Tipperary 990 1,033 2,023 1,807 1,992 3,799 1,054 1,121 2,175 1,855 1,827 3,682 2,246 1,614 3,860 2,395 2,018 4,413
Carlow/Kilkenny 1,514 1,633 3,147 2,823 3,005 5,828 1,701 1,645 3,346 2,850 2,614 5,464 3,217 2,346 5,563 3,804 3,267 7,071
Waterford 1,265 1,402 2,667 2,520 2,698 5,218 1,421 1,547 2,968 2,416 2,304 4,720 2,997 2,254 5,251 3,375 2,930 6,305
Wexford 1,648 1,850 3,498 3,357 3,520 6,877 1,916 2,008 3,924 3,419 2,989 6,408 3,638 2,462 6,100 4,299 3,412 7,711
CHO Area 5 - Total 5,417 5,918 11,335 10,507 11,215 21,722 6,092 6,321 12,413 10,540 9,734 20,274 12,098 8,676 20,774 13,873 11,627 25,500
CommunityHealthcare Organisation
Age Classifi cation as at December 2016
Under 5 Years
Female Male Total Female Male Total Female Male Total Female Male Total Female Male Total Female Male Total
5-11 Years 16-24 Years 35-44 Years12-15 Years 25-34 Years
29
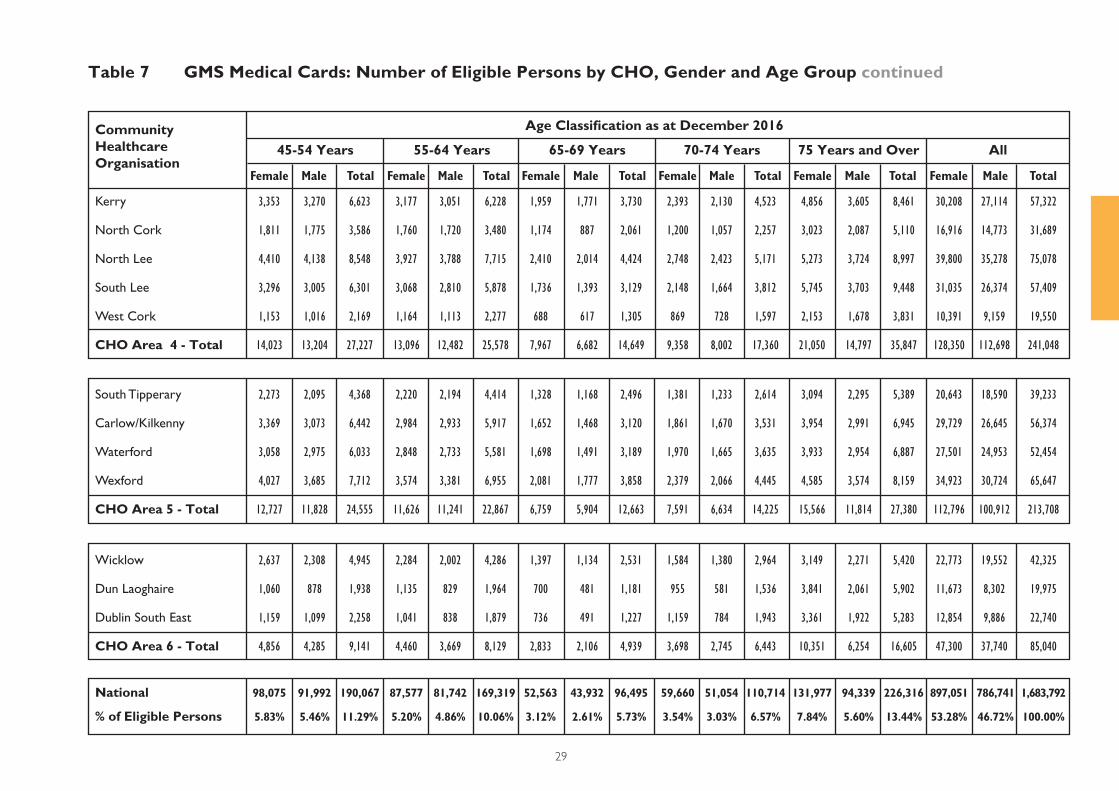
Table 7 GMS Medical Cards: Number of Eligible Persons by CHO, Gender and Age Group continued
Kerry 3,353 3,270 6,623 3,177 3,051 6,228 1,959 1,771 3,730 2,393 2,130 4,523 4,856 3,605 8,461 30,208 27,114 57,322
North Cork 1,811 1,775 3,586 1,760 1,720 3,480 1,174 887 2,061 1,200 1,057 2,257 3,023 2,087 5,110 16,916 14,773 31,689
North Lee 4,410 4,138 8,548 3,927 3,788 7,715 2,410 2,014 4,424 2,748 2,423 5,171 5,273 3,724 8,997 39,800 35,278 75,078
South Lee 3,296 3,005 6,301 3,068 2,810 5,878 1,736 1,393 3,129 2,148 1,664 3,812 5,745 3,703 9,448 31,035 26,374 57,409
West Cork 1,153 1,016 2,169 1,164 1,113 2,277 688 617 1,305 869 728 1,597 2,153 1,678 3,831 10,391 9,159 19,550
CHO Area 4 - Total 14,023 13,204 27,227 13,096 12,482 25,578 7,967 6,682 14,649 9,358 8,002 17,360 21,050 14,797 35,847 128,350 112,698 241,048
Wicklow 2,637 2,308 4,945 2,284 2,002 4,286 1,397 1,134 2,531 1,584 1,380 2,964 3,149 2,271 5,420 22,773 19,552 42,325
Dun Laoghaire 1,060 878 1,938 1,135 829 1,964 700 481 1,181 955 581 1,536 3,841 2,061 5,902 11,673 8,302 19,975
Dublin South East 1,159 1,099 2,258 1,041 838 1,879 736 491 1,227 1,159 784 1,943 3,361 1,922 5,283 12,854 9,886 22,740
CHO Area 6 - Total 4,856 4,285 9,141 4,460 3,669 8,129 2,833 2,106 4,939 3,698 2,745 6,443 10,351 6,254 16,605 47,300 37,740 85,040
National 98,075 91,992 190,067 87,577 81,742 169,319 52,563 43,932 96,495 59,660 51,054 110,714 131,977 94,339 226,316 897,051 786,741 1,683,792
% of Eligible Persons 5.83% 5.46% 11.29% 5.20% 4.86% 10.06% 3.12% 2.61% 5.73% 3.54% 3.03% 6.57% 7.84% 5.60% 13.44% 53.28% 46.72% 100.00%
South Tipperary 2,273 2,095 4,368 2,220 2,194 4,414 1,328 1,168 2,496 1,381 1,233 2,614 3,094 2,295 5,389 20,643 18,590 39,233
Carlow/Kilkenny 3,369 3,073 6,442 2,984 2,933 5,917 1,652 1,468 3,120 1,861 1,670 3,531 3,954 2,991 6,945 29,729 26,645 56,374
Waterford 3,058 2,975 6,033 2,848 2,733 5,581 1,698 1,491 3,189 1,970 1,665 3,635 3,933 2,954 6,887 27,501 24,953 52,454
Wexford 4,027 3,685 7,712 3,574 3,381 6,955 2,081 1,777 3,858 2,379 2,066 4,445 4,585 3,574 8,159 34,923 30,724 65,647
CHO Area 5 - Total 12,727 11,828 24,555 11,626 11,241 22,867 6,759 5,904 12,663 7,591 6,634 14,225 15,566 11,814 27,380 112,796 100,912 213,708
CommunityHealthcare Organisation
Age Classifi cation as at December 2016
Female Male Total Female Male Total Female Male Total Female Male Total Female Male Total Female Male Total
45-54 Years 55-64 Years 70-74 Years All65-69 Years 75 Years and Over
30
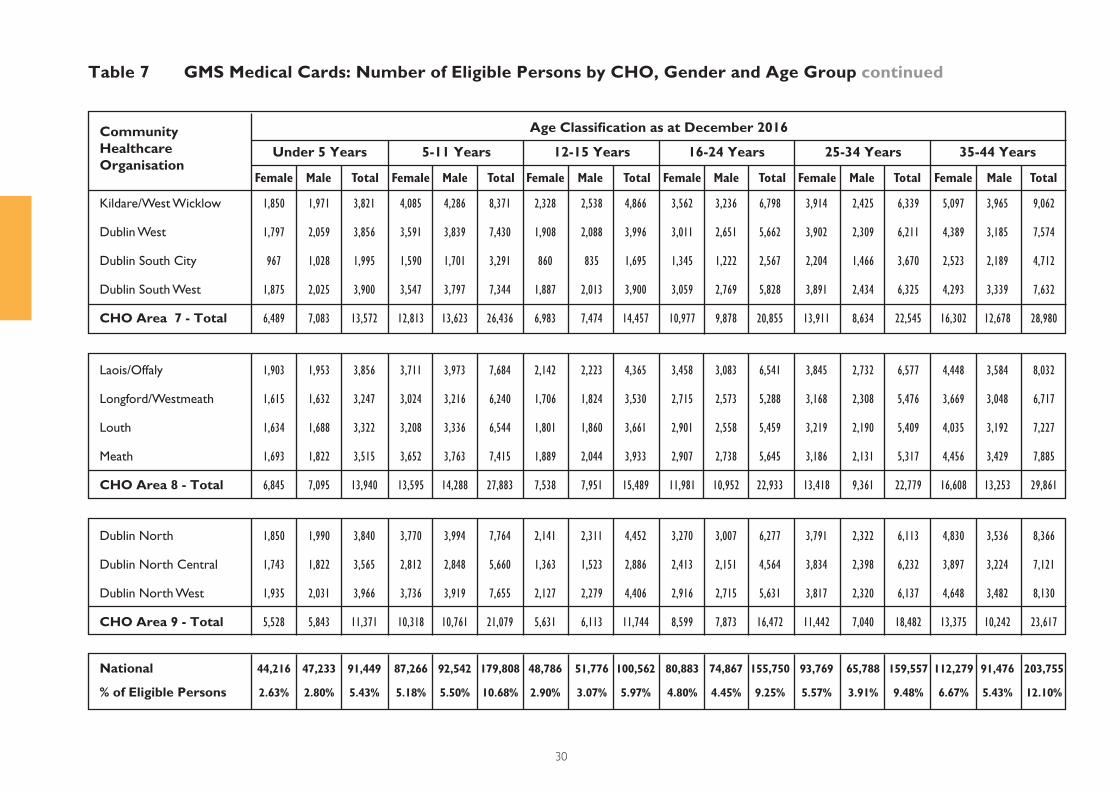
Table 7 GMS Medical Cards: Number of Eligible Persons by CHO, Gender and Age Group continued
Kildare/West Wicklow 1,850 1,971 3,821 4,085 4,286 8,371 2,328 2,538 4,866 3,562 3,236 6,798 3,914 2,425 6,339 5,097 3,965 9,062
Dublin West 1,797 2,059 3,856 3,591 3,839 7,430 1,908 2,088 3,996 3,011 2,651 5,662 3,902 2,309 6,211 4,389 3,185 7,574
Dublin South City 967 1,028 1,995 1,590 1,701 3,291 860 835 1,695 1,345 1,222 2,567 2,204 1,466 3,670 2,523 2,189 4,712
Dublin South West 1,875 2,025 3,900 3,547 3,797 7,344 1,887 2,013 3,900 3,059 2,769 5,828 3,891 2,434 6,325 4,293 3,339 7,632
CHO Area 7 - Total 6,489 7,083 13,572 12,813 13,623 26,436 6,983 7,474 14,457 10,977 9,878 20,855 13,911 8,634 22,545 16,302 12,678 28,980
Dublin North 1,850 1,990 3,840 3,770 3,994 7,764 2,141 2,311 4,452 3,270 3,007 6,277 3,791 2,322 6,113 4,830 3,536 8,366
Dublin North Central 1,743 1,822 3,565 2,812 2,848 5,660 1,363 1,523 2,886 2,413 2,151 4,564 3,834 2,398 6,232 3,897 3,224 7,121
Dublin North West 1,935 2,031 3,966 3,736 3,919 7,655 2,127 2,279 4,406 2,916 2,715 5,631 3,817 2,320 6,137 4,648 3,482 8,130
CHO Area 9 - Total 5,528 5,843 11,371 10,318 10,761 21,079 5,631 6,113 11,744 8,599 7,873 16,472 11,442 7,040 18,482 13,375 10,242 23,617
National 44,216 47,233 91,449 87,266 92,542 179,808 48,786 51,776 100,562 80,883 74,867 155,750 93,769 65,788 159,557 112,279 91,476 203,755
% of Eligible Persons 2.63% 2.80% 5.43% 5.18% 5.50% 10.68% 2.90% 3.07% 5.97% 4.80% 4.45% 9.25% 5.57% 3.91% 9.48% 6.67% 5.43% 12.10%
Laois/Offaly 1,903 1,953 3,856 3,711 3,973 7,684 2,142 2,223 4,365 3,458 3,083 6,541 3,845 2,732 6,577 4,448 3,584 8,032
Longford/Westmeath 1,615 1,632 3,247 3,024 3,216 6,240 1,706 1,824 3,530 2,715 2,573 5,288 3,168 2,308 5,476 3,669 3,048 6,717
Louth 1,634 1,688 3,322 3,208 3,336 6,544 1,801 1,860 3,661 2,901 2,558 5,459 3,219 2,190 5,409 4,035 3,192 7,227
Meath 1,693 1,822 3,515 3,652 3,763 7,415 1,889 2,044 3,933 2,907 2,738 5,645 3,186 2,131 5,317 4,456 3,429 7,885
CHO Area 8 - Total 6,845 7,095 13,940 13,595 14,288 27,883 7,538 7,951 15,489 11,981 10,952 22,933 13,418 9,361 22,779 16,608 13,253 29,861
CommunityHealthcare Organisation
Age Classifi cation as at December 2016
Under 5 Years
Female Male Total Female Male Total Female Male Total Female Male Total Female Male Total Female Male Total
5-11 Years 16-24 Years 35-44 Years12-15 Years 25-34 Years

31
Table 7 GMS Medical Cards: Number of Eligible Persons by CHO, Gender and Age Group continued
Kildare/West Wicklow 4,129 3,819 7,948 3,398 3,032 6,430 2,069 1,694 3,763 2,305 2,067 4,372 4,322 3,266 7,588 37,059 32,299 69,358
Dublin West 3,282 2,787 6,069 2,918 2,391 5,309 1,635 1,309 2,944 1,455 1,199 2,654 2,942 1,906 4,848 30,830 25,723 56,553
Dublin South City 1,888 2,132 4,020 1,806 1,878 3,684 1,046 866 1,912 1,217 971 2,188 3,248 2,002 5,250 18,694 16,290 34,984
Dublin South West 3,269 2,822 6,091 3,333 2,621 5,954 2,101 1,582 3,683 2,154 1,703 3,857 4,521 3,052 7,573 33,930 28,157 62,087
CHO Area 7 - Total 12,568 11,560 24,128 11,455 9,922 21,377 6,851 5,451 12,302 7,131 5,940 13,071 15,033 10,226 25,259 120,513 102,469 222,982
Dublin North 4,392 3,700 8,092 3,230 2,546 5,776 2,139 1,499 3,638 3,134 2,327 5,461 6,589 4,443 11,032 39,136 31,675 70,811
Dublin North Central 2,876 2,862 5,738 2,396 2,345 4,741 1,294 1,104 2,398 1,772 1,414 3,186 4,734 2,854 7,588 29,134 24,545 53,679
Dublin North West 3,492 3,140 6,632 2,721 2,309 5,030 1,528 1,163 2,691 1,688 1,244 2,932 4,395 2,647 7,042 33,003 27,249 60,252
CHO Area 9 - Total 10,760 9,702 20,462 8,347 7,200 15,547 4,961 3,766 8,727 6,594 4,985 11,579 15,718 9,944 25,662 101,273 83,469 184,742
National 98,075 91,992 190,067 87,577 81,742 169,319 52,563 43,932 96,495 59,660 51,054 110,714 131,977 94,339 226,316 897,051 786,741 1,683,792
% of Eligible Persons 5.83% 5.46% 11.29% 5.20% 4.86% 10.06% 3.12% 2.61% 5.73% 3.54% 3.03% 6.57% 7.84% 5.60% 13.44% 53.28% 46.72% 100.00%
Laois/Offaly 3,766 3,583 7,349 3,195 3,080 6,275 1,885 1,592 3,477 2,076 1,750 3,826 4,211 3,327 7,538 34,640 30,880 65,520
Longford/Westmeath 3,249 3,071 6,320 2,681 2,565 5,246 1,558 1,286 2,844 1,704 1,505 3,209 3,599 2,679 6,278 28,688 25,707 54,395
Louth 3,245 3,271 6,516 2,640 2,652 5,292 1,629 1,305 2,934 1,795 1,534 3,329 3,764 2,607 6,371 29,871 26,193 56,064
Meath 3,503 3,274 6,777 2,884 2,532 5,416 1,721 1,449 3,170 2,070 1,754 3,824 3,917 3,025 6,942 31,878 27,961 59,839
CHO Area 8 - Total 13,763 13,199 26,962 11,400 10,829 22,229 6,793 5,632 12,425 7,645 6,543 14,188 15,491 11,638 27,129 125,077 110,741 235,818
CommunityHealthcare Organisation
Age Classifi cation as at December 2016
Female Male Total Female Male Total Female Male Total Female Male Total Female Male Total Female Male Total
45-54 Years 55-64 Years 70-74 Years All65-69 Years 75 Years and Over
32
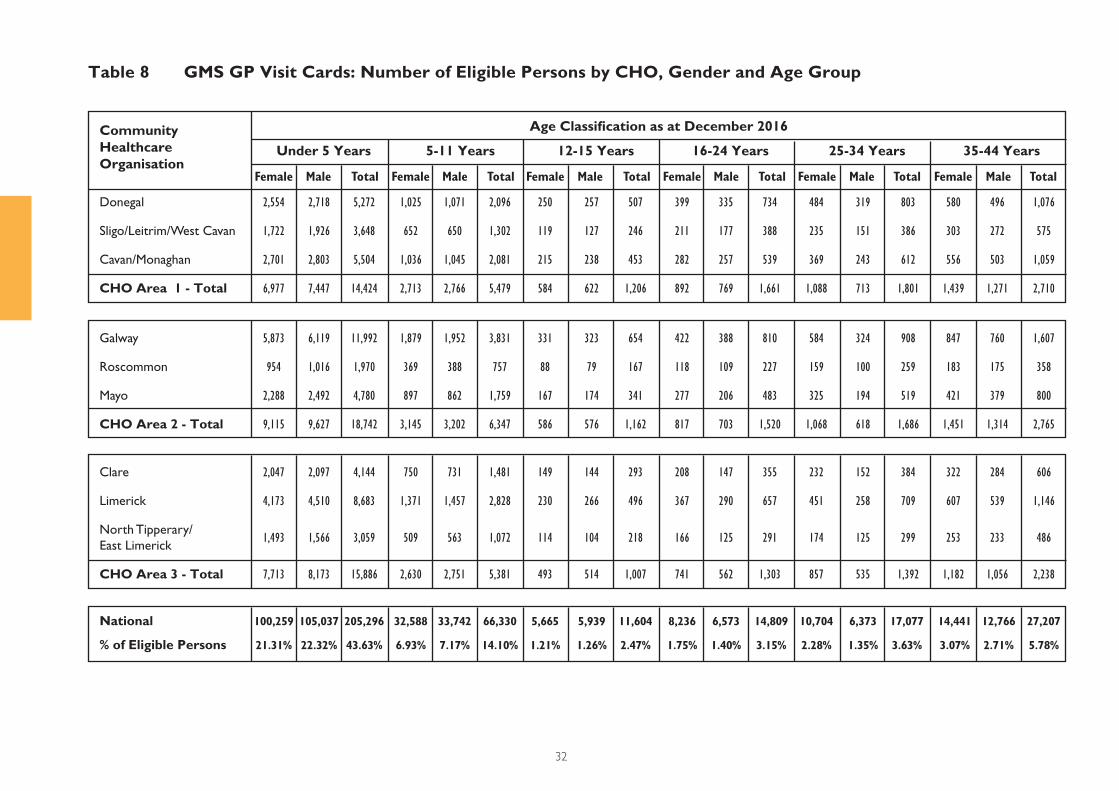
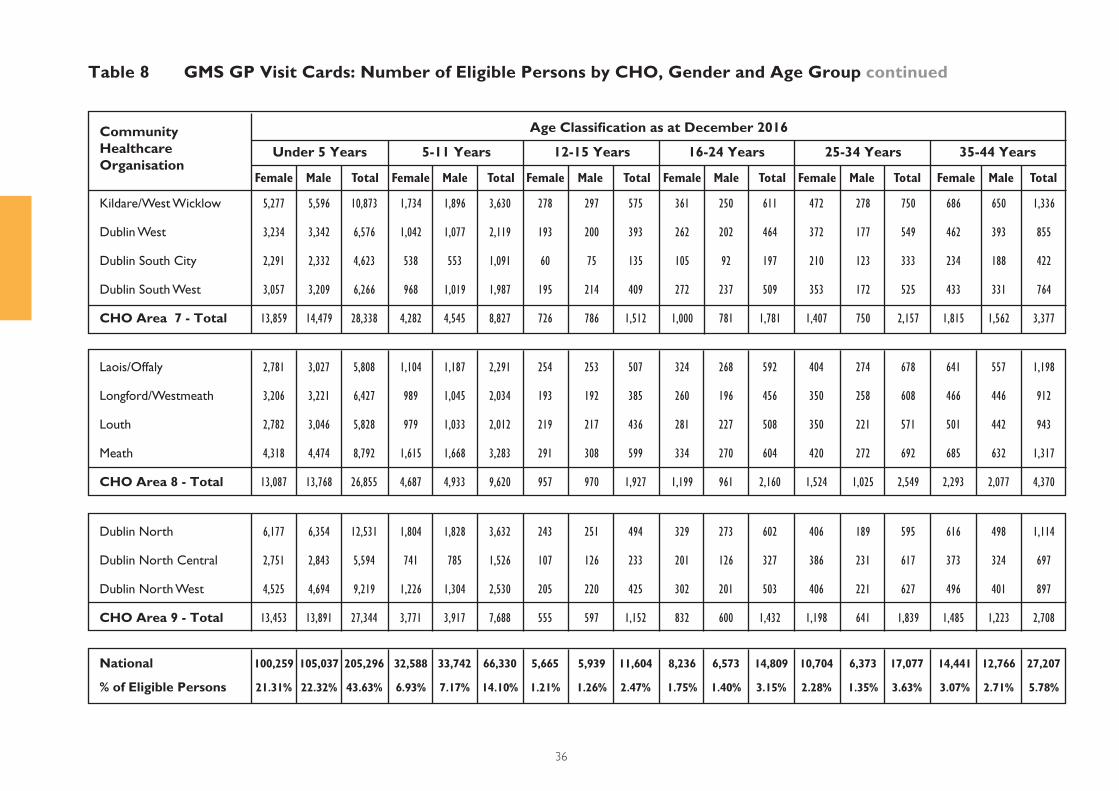
Table 8 GMS GP Visit Cards: Number of Eligible Persons by CHO, Gender and Age Group
Donegal 2,554 2,718 5,272 1,025 1,071 2,096 250 257 507 399 335 734 484 319 803 580 496 1,076
Sligo/Leitrim/West Cavan 1,722 1,926 3,648 652 650 1,302 119 127 246 211 177 388 235 151 386 303 272 575
Cavan/Monaghan 2,701 2,803 5,504 1,036 1,045 2,081 215 238 453 282 257 539 369 243 612 556 503 1,059
CHO Area 1 - Total 6,977 7,447 14,424 2,713 2,766 5,479 584 622 1,206 892 769 1,661 1,088 713 1,801 1,439 1,271 2,710
Galway 5,873 6,119 11,992 1,879 1,952 3,831 331 323 654 422 388 810 584 324 908 847 760 1,607
Roscommon 954 1,016 1,970 369 388 757 88 79 167 118 109 227 159 100 259 183 175 358
Mayo 2,288 2,492 4,780 897 862 1,759 167 174 341 277 206 483 325 194 519 421 379 800
CHO Area 2 - Total 9,115 9,627 18,742 3,145 3,202 6,347 586 576 1,162 817 703 1,520 1,068 618 1,686 1,451 1,314 2,765
National 100,259 105,037 205,296 32,588 33,742 66,330 5,665 5,939 11,604 8,236 6,573 14,809 10,704 6,373 17,077 14,441 12,766 27,207
% of Eligible Persons 21.31% 22.32% 43.63% 6.93% 7.17% 14.10% 1.21% 1.26% 2.47% 1.75% 1.40% 3.15% 2.28% 1.35% 3.63% 3.07% 2.71% 5.78%
Clare 2,047 2,097 4,144 750 731 1,481 149 144 293 208 147 355 232 152 384 322 284 606
Limerick 4,173 4,510 8,683 1,371 1,457 2,828 230 266 496 367 290 657 451 258 709 607 539 1,146
North Tipperary/
East Limerick 1,493 1,566 3,059 509 563 1,072 114 104 218 166 125 291 174 125 299 253 233 486
CHO Area 3 - Total 7,713 8,173 15,886 2,630 2,751 5,381 493 514 1,007 741 562 1,303 857 535 1,392 1,182 1,056 2,238
CommunityHealthcare Organisation
Age Classifi cation as at December 2016
Female Male Total Female Male Total Female Male Total Female Male Total Female Male Total Female Male Total
Under 5 Years 5-11 Years 16-24 Years 35-44 Years12-15 Years 25-34 Years
33
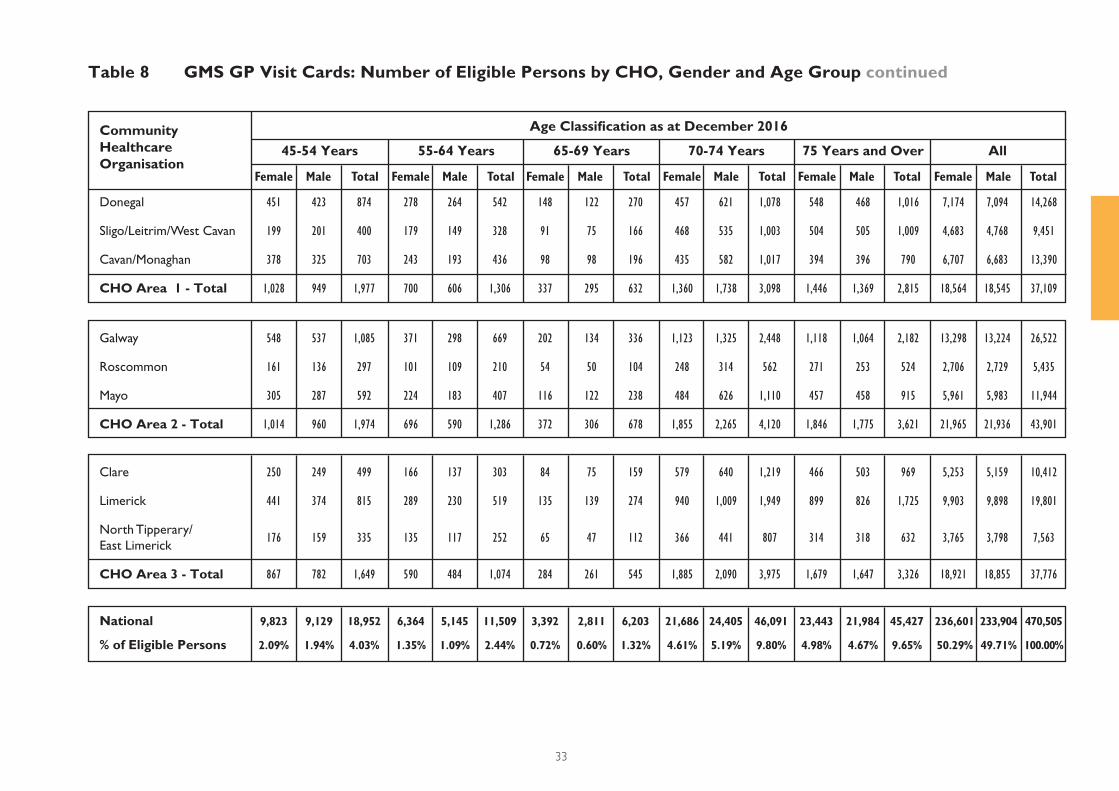
Table 8 GMS GP Visit Cards: Number of Eligible Persons by CHO, Gender and Age Group continued
Donegal 451 423 874 278 264 542 148 122 270 457 621 1,078 548 468 1,016 7,174 7,094 14,268
Sligo/Leitrim/West Cavan 199 201 400 179 149 328 91 75 166 468 535 1,003 504 505 1,009 4,683 4,768 9,451
Cavan/Monaghan 378 325 703 243 193 436 98 98 196 435 582 1,017 394 396 790 6,707 6,683 13,390
CHO Area 1 - Total 1,028 949 1,977 700 606 1,306 337 295 632 1,360 1,738 3,098 1,446 1,369 2,815 18,564 18,545 37,109
Galway 548 537 1,085 371 298 669 202 134 336 1,123 1,325 2,448 1,118 1,064 2,182 13,298 13,224 26,522
Roscommon 161 136 297 101 109 210 54 50 104 248 314 562 271 253 524 2,706 2,729 5,435
Mayo 305 287 592 224 183 407 116 122 238 484 626 1,110 457 458 915 5,961 5,983 11,944
CHO Area 2 - Total 1,014 960 1,974 696 590 1,286 372 306 678 1,855 2,265 4,120 1,846 1,775 3,621 21,965 21,936 43,901
National 9,823 9,129 18,952 6,364 5,145 11,509 3,392 2,811 6,203 21,686 24,405 46,091 23,443 21,984 45,427 236,601 233,904 470,505
% of Eligible Persons 2.09% 1.94% 4.03% 1.35% 1.09% 2.44% 0.72% 0.60% 1.32% 4.61% 5.19% 9.80% 4.98% 4.67% 9.65% 50.29% 49.71% 100.00%
Clare 250 249 499 166 137 303 84 75 159 579 640 1,219 466 503 969 5,253 5,159 10,412
Limerick 441 374 815 289 230 519 135 139 274 940 1,009 1,949 899 826 1,725 9,903 9,898 19,801
North Tipperary/
East Limerick 176 159 335 135 117 252 65 47 112 366 441 807 314 318 632 3,765 3,798 7,563
CHO Area 3 - Total 867 782 1,649 590 484 1,074 284 261 545 1,885 2,090 3,975 1,679 1,647 3,326 18,921 18,855 37,776
CommunityHealthcare Organisation
Age Classifi cation as at December 2016
45-54 Years
Female Male Total Female Male Total Female Male Total Female Male Total Female Male Total Female Male Total
55-64 Years 70-74 Years All65-69 Years 75 Years and Over
34
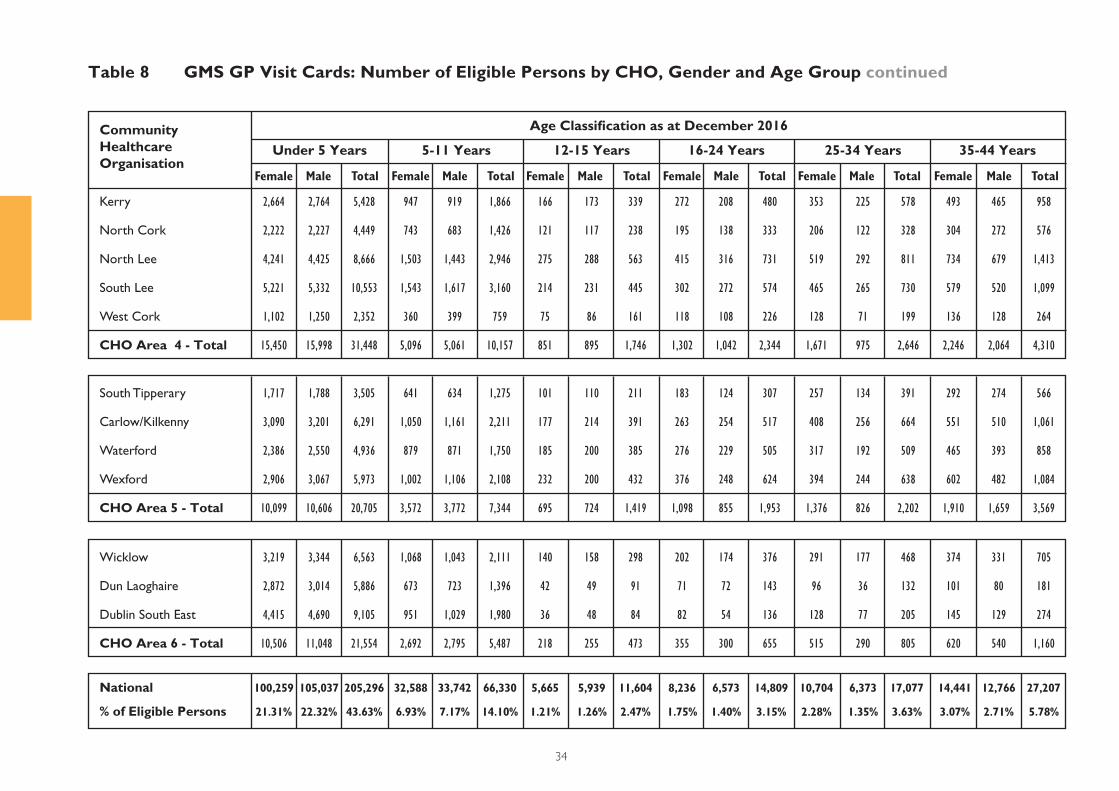
Table 8 GMS GP Visit Cards: Number of Eligible Persons by CHO, Gender and Age Group continued
Kerry 2,664 2,764 5,428 947 919 1,866 166 173 339 272 208 480 353 225 578 493 465 958
North Cork 2,222 2,227 4,449 743 683 1,426 121 117 238 195 138 333 206 122 328 304 272 576
North Lee 4,241 4,425 8,666 1,503 1,443 2,946 275 288 563 415 316 731 519 292 811 734 679 1,413
South Lee 5,221 5,332 10,553 1,543 1,617 3,160 214 231 445 302 272 574 465 265 730 579 520 1,099
West Cork 1,102 1,250 2,352 360 399 759 75 86 161 118 108 226 128 71 199 136 128 264
CHO Area 4 - Total 15,450 15,998 31,448 5,096 5,061 10,157 851 895 1,746 1,302 1,042 2,344 1,671 975 2,646 2,246 2,064 4,310
Wicklow 3,219 3,344 6,563 1,068 1,043 2,111 140 158 298 202 174 376 291 177 468 374 331 705
Dun Laoghaire 2,872 3,014 5,886 673 723 1,396 42 49 91 71 72 143 96 36 132 101 80 181
Dublin South East 4,415 4,690 9,105 951 1,029 1,980 36 48 84 82 54 136 128 77 205 145 129 274
CHO Area 6 - Total 10,506 11,048 21,554 2,692 2,795 5,487 218 255 473 355 300 655 515 290 805 620 540 1,160
National 100,259 105,037 205,296 32,588 33,742 66,330 5,665 5,939 11,604 8,236 6,573 14,809 10,704 6,373 17,077 14,441 12,766 27,207
% of Eligible Persons 21.31% 22.32% 43.63% 6.93% 7.17% 14.10% 1.21% 1.26% 2.47% 1.75% 1.40% 3.15% 2.28% 1.35% 3.63% 3.07% 2.71% 5.78%
South Tipperary 1,717 1,788 3,505 641 634 1,275 101 110 211 183 124 307 257 134 391 292 274 566
Carlow/Kilkenny 3,090 3,201 6,291 1,050 1,161 2,211 177 214 391 263 254 517 408 256 664 551 510 1,061
Waterford 2,386 2,550 4,936 879 871 1,750 185 200 385 276 229 505 317 192 509 465 393 858
Wexford 2,906 3,067 5,973 1,002 1,106 2,108 232 200 432 376 248 624 394 244 638 602 482 1,084
CHO Area 5 - Total 10,099 10,606 20,705 3,572 3,772 7,344 695 724 1,419 1,098 855 1,953 1,376 826 2,202 1,910 1,659 3,569
CommunityHealthcare Organisation
Age Classifi cation as at December 2016
Under 5 Years
Female Male Total Female Male Total Female Male Total Female Male Total Female Male Total Female Male Total
5-11 Years 16-24 Years 35-44 Years12-15 Years 25-34 Years
35
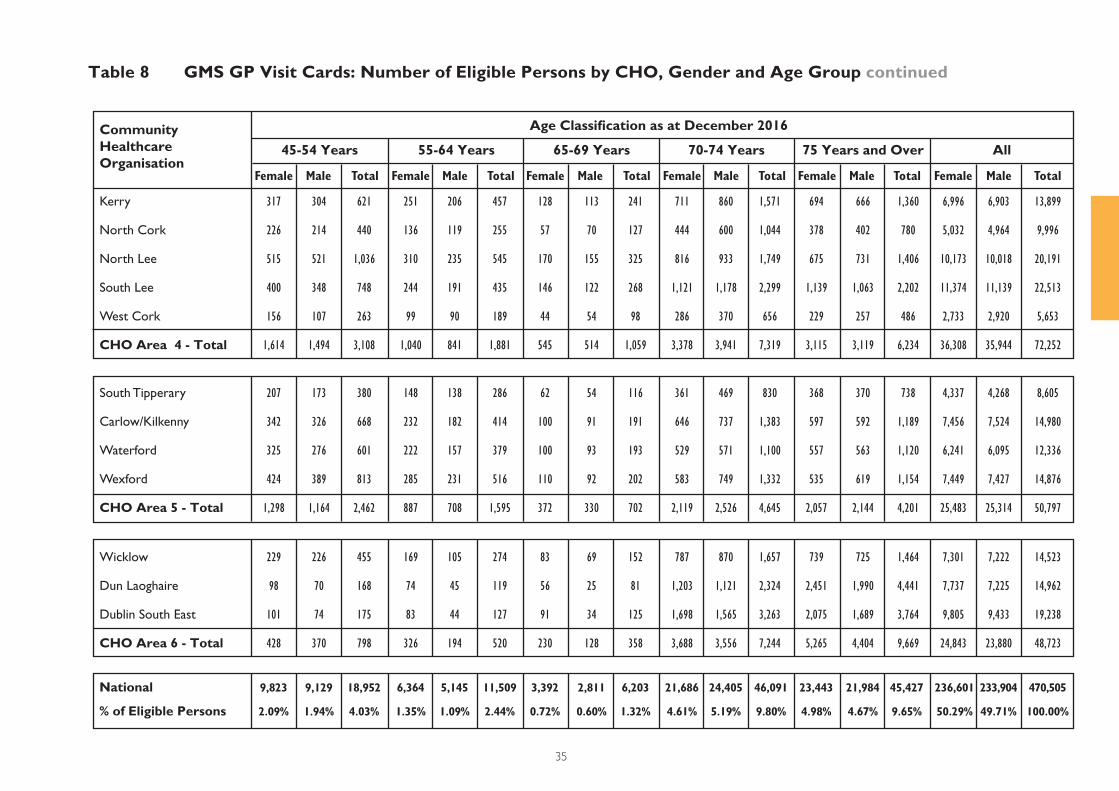
Table 8 GMS GP Visit Cards: Number of Eligible Persons by CHO, Gender and Age Group continued
Kerry 317 304 621 251 206 457 128 113 241 711 860 1,571 694 666 1,360 6,996 6,903 13,899
North Cork 226 214 440 136 119 255 57 70 127 444 600 1,044 378 402 780 5,032 4,964 9,996
North Lee 515 521 1,036 310 235 545 170 155 325 816 933 1,749 675 731 1,406 10,173 10,018 20,191
South Lee 400 348 748 244 191 435 146 122 268 1,121 1,178 2,299 1,139 1,063 2,202 11,374 11,139 22,513
West Cork 156 107 263 99 90 189 44 54 98 286 370 656 229 257 486 2,733 2,920 5,653
CHO Area 4 - Total 1,614 1,494 3,108 1,040 841 1,881 545 514 1,059 3,378 3,941 7,319 3,115 3,119 6,234 36,308 35,944 72,252
Wicklow 229 226 455 169 105 274 83 69 152 787 870 1,657 739 725 1,464 7,301 7,222 14,523
Dun Laoghaire 98 70 168 74 45 119 56 25 81 1,203 1,121 2,324 2,451 1,990 4,441 7,737 7,225 14,962
Dublin South East 101 74 175 83 44 127 91 34 125 1,698 1,565 3,263 2,075 1,689 3,764 9,805 9,433 19,238
CHO Area 6 - Total 428 370 798 326 194 520 230 128 358 3,688 3,556 7,244 5,265 4,404 9,669 24,843 23,880 48,723
National 9,823 9,129 18,952 6,364 5,145 11,509 3,392 2,811 6,203 21,686 24,405 46,091 23,443 21,984 45,427 236,601 233,904 470,505
% of Eligible Persons 2.09% 1.94% 4.03% 1.35% 1.09% 2.44% 0.72% 0.60% 1.32% 4.61% 5.19% 9.80% 4.98% 4.67% 9.65% 50.29% 49.71% 100.00%
South Tipperary 207 173 380 148 138 286 62 54 116 361 469 830 368 370 738 4,337 4,268 8,605
Carlow/Kilkenny 342 326 668 232 182 414 100 91 191 646 737 1,383 597 592 1,189 7,456 7,524 14,980
Waterford 325 276 601 222 157 379 100 93 193 529 571 1,100 557 563 1,120 6,241 6,095 12,336
Wexford 424 389 813 285 231 516 110 92 202 583 749 1,332 535 619 1,154 7,449 7,427 14,876
CHO Area 5 - Total 1,298 1,164 2,462 887 708 1,595 372 330 702 2,119 2,526 4,645 2,057 2,144 4,201 25,483 25,314 50,797
CommunityHealthcare Organisation
Age Classifi cation as at December 2016
Female Male Total Female Male Total Female Male Total Female Male Total Female Male Total Female Male Total
45-54 Years 55-64 Years 70-74 Years All65-69 Years 75 Years and Over
36
Table 8 GMS GP Visit Cards: Number of Eligible Persons by CHO, Gender and Age Group continued
Kildare/West Wicklow 5,277 5,596 10,873 1,734 1,896 3,630 278 297 575 361 250 611 472 278 750 686 650 1,336
Dublin West 3,234 3,342 6,576 1,042 1,077 2,119 193 200 393 262 202 464 372 177 549 462 393 855
Dublin South City 2,291 2,332 4,623 538 553 1,091 60 75 135 105 92 197 210 123 333 234 188 422
Dublin South West 3,057 3,209 6,266 968 1,019 1,987 195 214 409 272 237 509 353 172 525 433 331 764
CHO Area 7 - Total 13,859 14,479 28,338 4,282 4,545 8,827 726 786 1,512 1,000 781 1,781 1,407 750 2,157 1,815 1,562 3,377
Dublin North 6,177 6,354 12,531 1,804 1,828 3,632 243 251 494 329 273 602 406 189 595 616 498 1,114
Dublin North Central 2,751 2,843 5,594 741 785 1,526 107 126 233 201 126 327 386 231 617 373 324 697
Dublin North West 4,525 4,694 9,219 1,226 1,304 2,530 205 220 425 302 201 503 406 221 627 496 401 897
CHO Area 9 - Total 13,453 13,891 27,344 3,771 3,917 7,688 555 597 1,152 832 600 1,432 1,198 641 1,839 1,485 1,223 2,708
National 100,259 105,037 205,296 32,588 33,742 66,330 5,665 5,939 11,604 8,236 6,573 14,809 10,704 6,373 17,077 14,441 12,766 27,207
% of Eligible Persons 21.31% 22.32% 43.63% 6.93% 7.17% 14.10% 1.21% 1.26% 2.47% 1.75% 1.40% 3.15% 2.28% 1.35% 3.63% 3.07% 2.71% 5.78%
Laois/Offaly 2,781 3,027 5,808 1,104 1,187 2,291 254 253 507 324 268 592 404 274 678 641 557 1,198
Longford/Westmeath 3,206 3,221 6,427 989 1,045 2,034 193 192 385 260 196 456 350 258 608 466 446 912
Louth 2,782 3,046 5,828 979 1,033 2,012 219 217 436 281 227 508 350 221 571 501 442 943
Meath 4,318 4,474 8,792 1,615 1,668 3,283 291 308 599 334 270 604 420 272 692 685 632 1,317
CHO Area 8 - Total 13,087 13,768 26,855 4,687 4,933 9,620 957 970 1,927 1,199 961 2,160 1,524 1,025 2,549 2,293 2,077 4,370
CommunityHealthcare Organisation
Age Classifi cation as at December 2016
Under 5 Years
Female Male Total Female Male Total Female Male Total Female Male Total Female Male Total Female Male Total
5-11 Years 16-24 Years 35-44 Years12-15 Years 25-34 Years
37
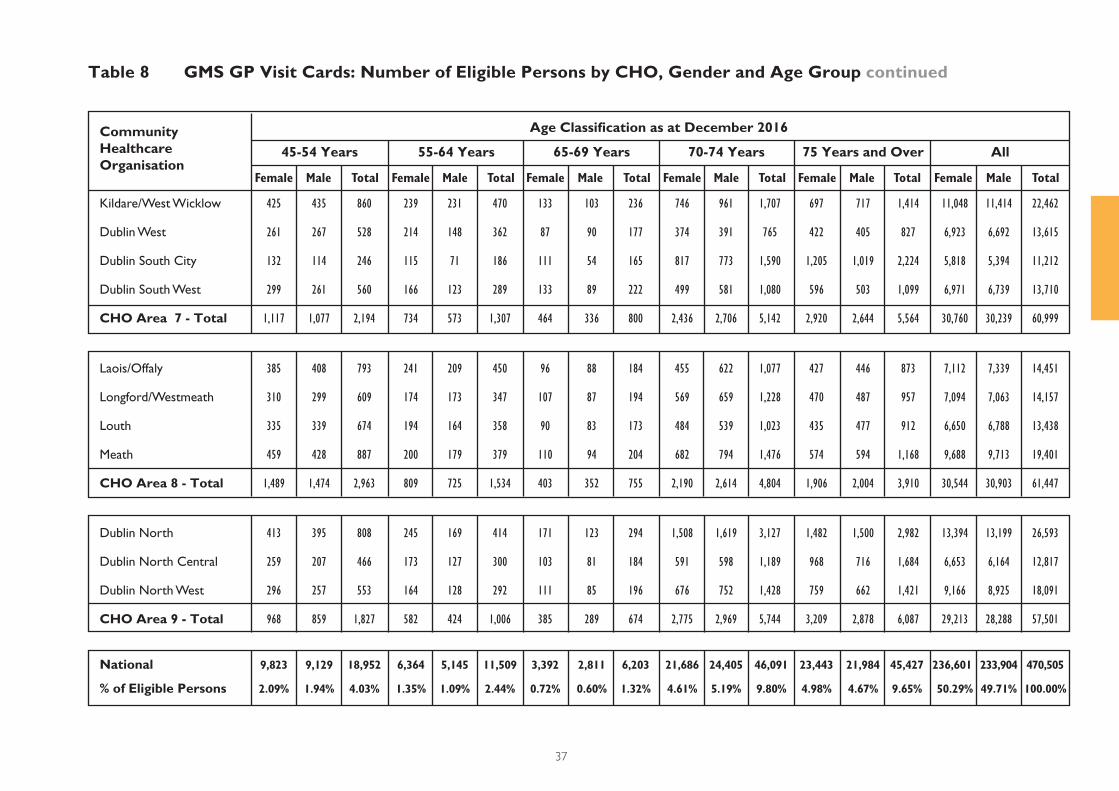
Table 8 GMS GP Visit Cards: Number of Eligible Persons by CHO, Gender and Age Group continued
Kildare/West Wicklow 425 435 860 239 231 470 133 103 236 746 961 1,707 697 717 1,414 11,048 11,414 22,462
Dublin West 261 267 528 214 148 362 87 90 177 374 391 765 422 405 827 6,923 6,692 13,615
Dublin South City 132 114 246 115 71 186 111 54 165 817 773 1,590 1,205 1,019 2,224 5,818 5,394 11,212
Dublin South West 299 261 560 166 123 289 133 89 222 499 581 1,080 596 503 1,099 6,971 6,739 13,710
CHO Area 7 - Total 1,117 1,077 2,194 734 573 1,307 464 336 800 2,436 2,706 5,142 2,920 2,644 5,564 30,760 30,239 60,999
Dublin North 413 395 808 245 169 414 171 123 294 1,508 1,619 3,127 1,482 1,500 2,982 13,394 13,199 26,593
Dublin North Central 259 207 466 173 127 300 103 81 184 591 598 1,189 968 716 1,684 6,653 6,164 12,817
Dublin North West 296 257 553 164 128 292 111 85 196 676 752 1,428 759 662 1,421 9,166 8,925 18,091
CHO Area 9 - Total 968 859 1,827 582 424 1,006 385 289 674 2,775 2,969 5,744 3,209 2,878 6,087 29,213 28,288 57,501
National 9,823 9,129 18,952 6,364 5,145 11,509 3,392 2,811 6,203 21,686 24,405 46,091 23,443 21,984 45,427 236,601 233,904 470,505
% of Eligible Persons 2.09% 1.94% 4.03% 1.35% 1.09% 2.44% 0.72% 0.60% 1.32% 4.61% 5.19% 9.80% 4.98% 4.67% 9.65% 50.29% 49.71% 100.00%
Laois/Offaly 385 408 793 241 209 450 96 88 184 455 622 1,077 427 446 873 7,112 7,339 14,451
Longford/Westmeath 310 299 609 174 173 347 107 87 194 569 659 1,228 470 487 957 7,094 7,063 14,157
Louth 335 339 674 194 164 358 90 83 173 484 539 1,023 435 477 912 6,650 6,788 13,438
Meath 459 428 887 200 179 379 110 94 204 682 794 1,476 574 594 1,168 9,688 9,713 19,401
CHO Area 8 - Total 1,489 1,474 2,963 809 725 1,534 403 352 755 2,190 2,614 4,804 1,906 2,004 3,910 30,544 30,903 61,447
CommunityHealthcare Organisation
Age Classifi cation as at December 2016
Female Male Total Female Male Total Female Male Total Female Male Total Female Male Total Female Male Total
45-54 Years 55-64 Years 70-74 Years All65-69 Years 75 Years and Over
38
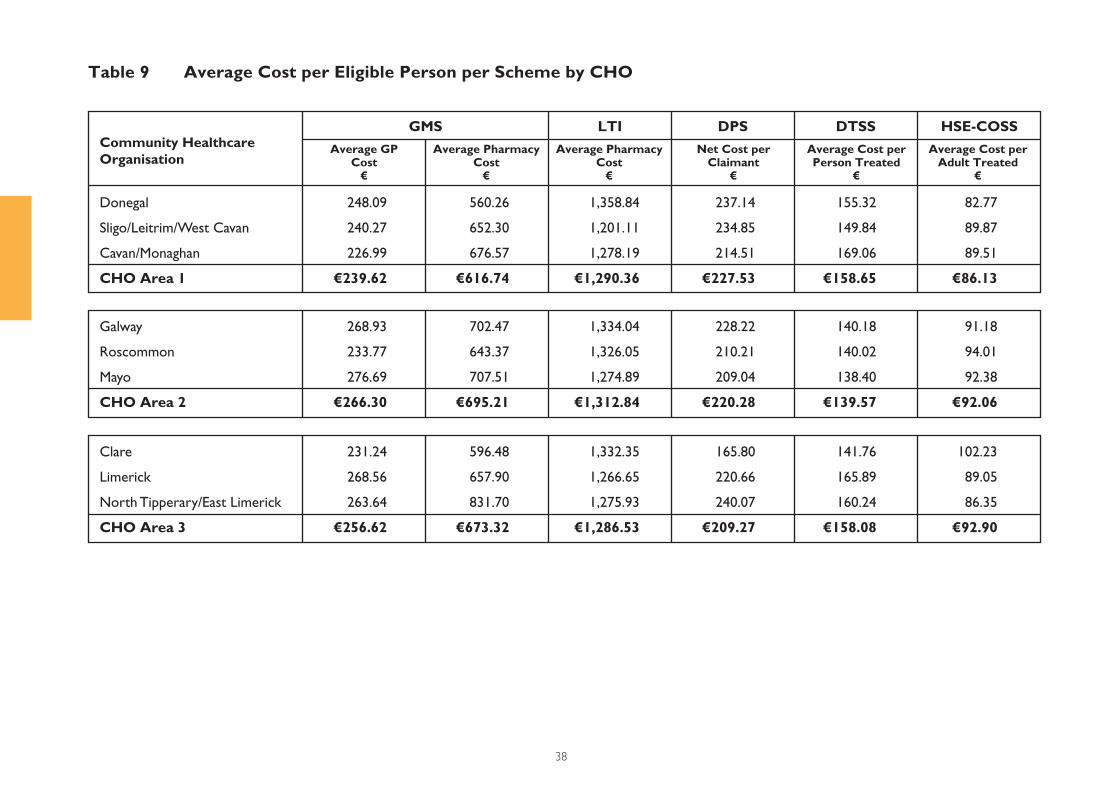
Table 9 Average Cost per Eligible Person per Scheme by CHO
Donegal 248.09 560.26 1,358.84 237.14 155.32 82.77
Sligo/Leitrim/West Cavan 240.27 652.30 1,201.11 234.85 149.84 89.87
Cavan/Monaghan 226.99 676.57 1,278.19 214.51 169.06 89.51
CHO Area 1 €239.62 €616.74 €1,290.36 €227.53 €158.65 €86.13
Community Healthcare Organisation
GMS LTI DPS DTSS HSE-COSS
Average GP Cost
€
Average Pharmacy Cost
€
Average Pharmacy Cost
€
Net Cost perClaimant
€
Average Cost per Person Treated
€
Average Cost per Adult Treated
€
Galway 268.93 702.47 1,334.04 228.22 140.18 91.18
Roscommon 233.77 643.37 1,326.05 210.21 140.02 94.01
Mayo 276.69 707.51 1,274.89 209.04 138.40 92.38
CHO Area 2 €266.30 €695.21 €1,312.84 €220.28 €139.57 €92.06
Clare 231.24 596.48 1,332.35 165.80 141.76 102.23
Limerick 268.56 657.90 1,266.65 220.66 165.89 89.05
North Tipperary/East Limerick 263.64 831.70 1,275.93 240.07 160.24 86.35
CHO Area 3 €256.62 €673.32 €1,286.53 €209.27 €158.08 €92.90
39
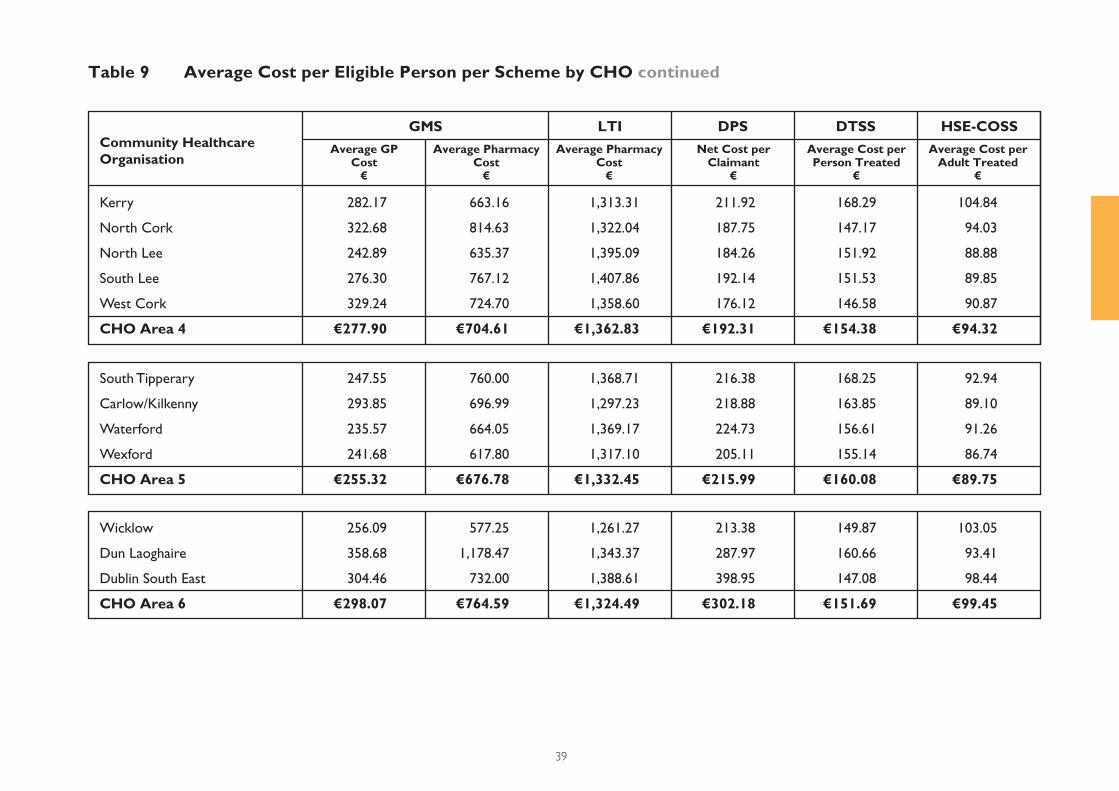
Table 9 Average Cost per Eligible Person per Scheme by CHO continued
Kerry 282.17 663.16 1,313.31 211.92 168.29 104.84
North Cork 322.68 814.63 1,322.04 187.75 147.17 94.03
North Lee 242.89 635.37 1,395.09 184.26 151.92 88.88
South Lee 276.30 767.12 1,407.86 192.14 151.53 89.85
West Cork 329.24 724.70 1,358.60 176.12 146.58 90.87
CHO Area 4 €277.90 €704.61 €1,362.83 €192.31 €154.38 €94.32
Community Healthcare Organisation
GMS LTI DPS DTSS HSE-COSS
Average GP Cost
€
Average Pharmacy Cost
€
Average Pharmacy Cost
€
Net Cost perClaimant
€
Average Cost per Person Treated
€
Average Cost per Adult Treated
€
South Tipperary 247.55 760.00 1,368.71 216.38 168.25 92.94
Carlow/Kilkenny 293.85 696.99 1,297.23 218.88 163.85 89.10
Waterford 235.57 664.05 1,369.17 224.73 156.61 91.26
Wexford 241.68 617.80 1,317.10 205.11 155.14 86.74
CHO Area 5 €255.32 €676.78 €1,332.45 €215.99 €160.08 €89.75
Wicklow 256.09 577.25 1,261.27 213.38 149.87 103.05
Dun Laoghaire 358.68 1,178.47 1,343.37 287.97 160.66 93.41
Dublin South East 304.46 732.00 1,388.61 398.95 147.08 98.44
CHO Area 6 €298.07 €764.59 €1,324.49 €302.18 €151.69 €99.45
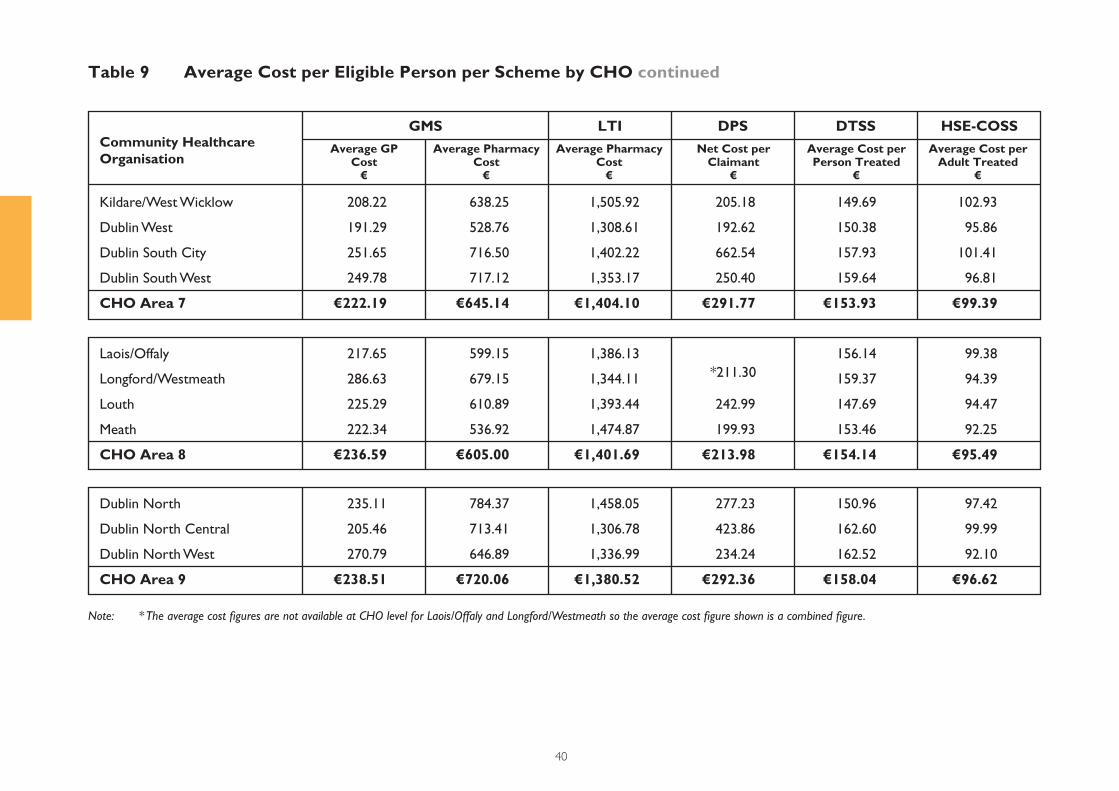
40
Table 9 Average Cost per Eligible Person per Scheme by CHO continued
Note: * The average cost fi gures are not available at CHO level for Laois/Offaly and Longford/Westmeath so the average cost fi gure shown is a combined fi gure.
*211.30
Kildare/West Wicklow 208.22 638.25 1,505.92 205.18 149.69 102.93
Dublin West 191.29 528.76 1,308.61 192.62 150.38 95.86
Dublin South City 251.65 716.50 1,402.22 662.54 157.93 101.41
Dublin South West 249.78 717.12 1,353.17 250.40 159.64 96.81
CHO Area 7 €222.19 €645.14 €1,404.10 €291.77 €153.93 €99.39
Community Healthcare Organisation
GMS LTI DPS DTSS HSE-COSS
Average GP Cost
€
Average Pharmacy Cost
€
Average Pharmacy Cost
€
Net Cost perClaimant
€
Average Cost per Person Treated
€
Average Cost per Adult Treated
€
Laois/Offaly 217.65 599.15 1,386.13 156.14 99.38
Longford/Westmeath 286.63 679.15 1,344.11 159.37 94.39
Louth 225.29 610.89 1,393.44 242.99 147.69 94.47
Meath 222.34 536.92 1,474.87 199.93 153.46 92.25
CHO Area 8 €236.59 €605.00 €1,401.69 €213.98 €154.14 €95.49
Dublin North 235.11 784.37 1,458.05 277.23 150.96 97.42
Dublin North Central 205.46 713.41 1,306.78 423.86 162.60 99.99
Dublin North West 270.79 646.89 1,336.99 234.24 162.52 92.10
CHO Area 9 €238.51 €720.06 €1,380.52 €292.36 €158.04 €96.62
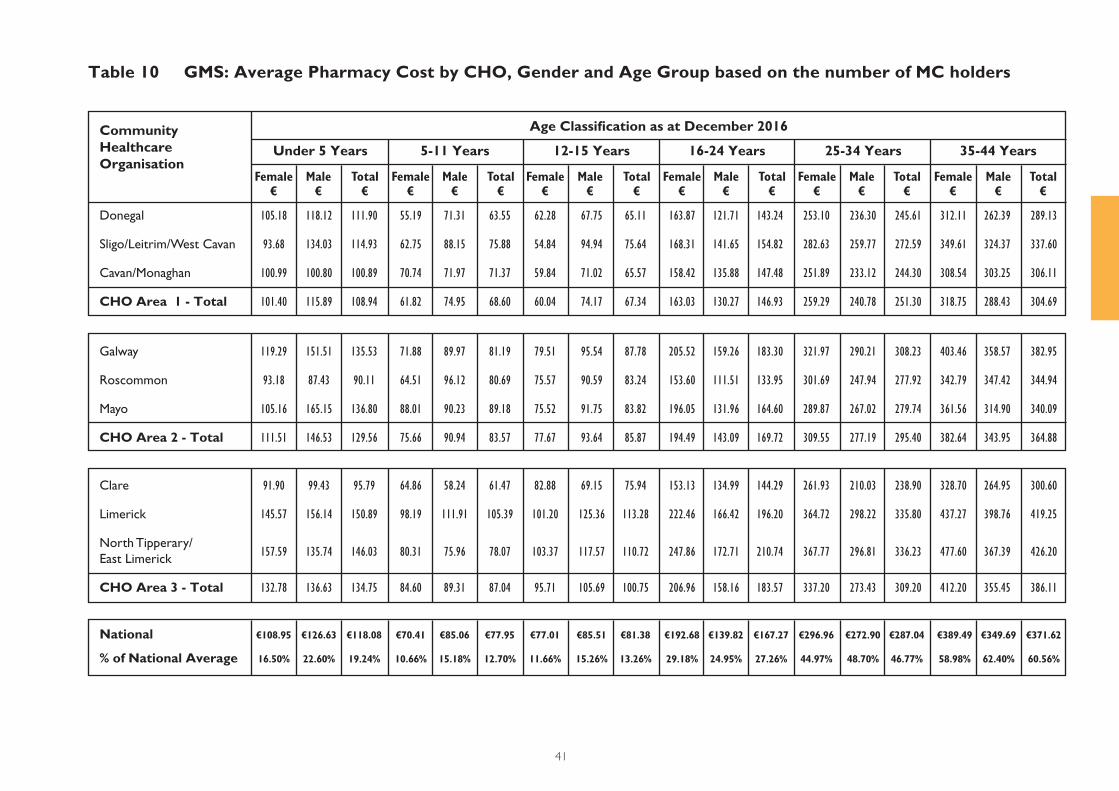
41
Table 10 GMS: Average Pharmacy Cost by CHO, Gender and Age Group based on the number of MC holders
Donegal 105.18 118.12 111.90 55.19 71.31 63.55 62.28 67.75 65.11 163.87 121.71 143.24 253.10 236.30 245.61 312.11 262.39 289.13
Sligo/Leitrim/West Cavan 93.68 134.03 114.93 62.75 88.15 75.88 54.84 94.94 75.64 168.31 141.65 154.82 282.63 259.77 272.59 349.61 324.37 337.60
Cavan/Monaghan 100.99 100.80 100.89 70.74 71.97 71.37 59.84 71.02 65.57 158.42 135.88 147.48 251.89 233.12 244.30 308.54 303.25 306.11
CHO Area 1 - Total 101.40 115.89 108.94 61.82 74.95 68.60 60.04 74.17 67.34 163.03 130.27 146.93 259.29 240.78 251.30 318.75 288.43 304.69
Galway 119.29 151.51 135.53 71.88 89.97 81.19 79.51 95.54 87.78 205.52 159.26 183.30 321.97 290.21 308.23 403.46 358.57 382.95
Roscommon 93.18 87.43 90.11 64.51 96.12 80.69 75.57 90.59 83.24 153.60 111.51 133.95 301.69 247.94 277.92 342.79 347.42 344.94
Mayo 105.16 165.15 136.80 88.01 90.23 89.18 75.52 91.75 83.82 196.05 131.96 164.60 289.87 267.02 279.74 361.56 314.90 340.09
CHO Area 2 - Total 111.51 146.53 129.56 75.66 90.94 83.57 77.67 93.64 85.87 194.49 143.09 169.72 309.55 277.19 295.40 382.64 343.95 364.88
National €108.95 €126.63 €118.08 €70.41 €85.06 €77.95 €77.01 €85.51 €81.38 €192.68 €139.82 €167.27 €296.96 €272.90 €287.04 €389.49 €349.69 €371.62
% of National Average 16.50% 22.60% 19.24% 10.66% 15.18% 12.70% 11.66% 15.26% 13.26% 29.18% 24.95% 27.26% 44.97% 48.70% 46.77% 58.98% 62.40% 60.56%
Clare 91.90 99.43 95.79 64.86 58.24 61.47 82.88 69.15 75.94 153.13 134.99 144.29 261.93 210.03 238.90 328.70 264.95 300.60
Limerick 145.57 156.14 150.89 98.19 111.91 105.39 101.20 125.36 113.28 222.46 166.42 196.20 364.72 298.22 335.80 437.27 398.76 419.25
North Tipperary/
East Limerick
CHO Area 3 - Total 132.78 136.63 134.75 84.60 89.31 87.04 95.71 105.69 100.75 206.96 158.16 183.57 337.20 273.43 309.20 412.20 355.45 386.11
CommunityHealthcare Organisation
Age Classifi cation as at December 2016
Female€
Male€
Total€
Female€
Male€
Total€
Female€
Male€
Total€
Female€
Male€
Total€
Female€
Male€
Total€
Female€
Male€
Total€
Under 5 Years 5-11 Years 16-24 Years 35-44 Years12-15 Years 25-34 Years
157.59 135.74 146.03 80.31 75.96 78.07 103.37 117.57 110.72 247.86 172.71 210.74 367.77 296.81 336.23 477.60 367.39 426.20

42
Table 10 GMS: Average Pharmacy Cost by CHO, Gender and Age Group based on the number of MC holders continued
CommunityHealthcare Organisation
Age Classifi cation as at December 2016
45-54 Years
Female€
Male€
Total€
Female€
Male€
Total€
Female€
Male€
Total€
Female€
Male€
Total€
Female€
Male€
Total€
Female€
Male€
Total€
55-64 Years 70-74 Years All65-69 Years 75 Years and Over
701.21 632.80 668.72 1,051.04 862.38 957.30 1,218.71 1,193.98 1,207.59 1,211.25 1,222.15 1,216.04 1,880.95 1,692.52 1,798.99 789.10 655.00 725.55
Donegal 460.08 369.65 415.81 692.30 637.75 665.70 898.10 832.20 867.52 1,045.59 973.81 1,009.97 1,489.66 1,377.49 1,439.23 530.19 459.36 496.00
Sligo/Leitrim/West Cavan 509.15 456.44 482.68 756.73 712.38 735.22 924.00 930.79 927.20 1,028.86 1,071.81 1,049.22 1,577.53 1,353.30 1,481.49 633.48 546.66 591.79
Cavan/Monaghan 525.31 438.00 482.08 810.59 785.16 798.09 970.41 996.88 982.85 1,161.36 1,062.91 1,113.79 1,657.48 1,591.60 1,628.90 591.93 532.56 563.71
CHO Area 1 - Total 490.05 409.46 450.24 741.87 698.52 720.71 924.71 903.17 914.64 1,075.69 1,023.50 1,050.28 1,565.83 1,436.56 1,509.08 572.55 501.27 538.35
Galway 602.09 505.90 555.31 885.32 831.49 858.21 1,070.77 1,055.62 1,063.61 1,253.94 1,182.78 1,220.23 1,868.53 1,692.28 1,792.50 690.95 600.25 647.83
Roscommon 518.20 436.46 477.22 857.27 692.26 777.32 849.80 859.46 854.35 977.79 900.53 939.96 1,371.32 1,302.60 1,340.94 603.29 529.38 567.93
Mayo 509.55 471.88 491.20 878.37 701.26 791.62 994.99 951.81 974.07 1,162.85 1,101.66 1,132.37 1,707.02 1,528.00 1,628.94 688.42 585.09 638.70
CHO Area 2 - Total 559.26 484.10 522.52 878.30 764.14 821.71 1,008.19 985.91 997.56 1,179.01 1,108.02 1,144.58 1,731.74 1,570.03 1,661.43 676.96 584.55 632.81
National €613.61 €515.66 €566.20 €942.77 €838.12 €892.25 €1,089.07 €1,057.29 €1,074.60 €1,206.16 €1,126.72 €1,169.52 €1,656.12 €1,508.23 €1,594.47 €660.38 €560.40 €613.67
% of National Average 92.92% 92.02% 92.27% 142.76% 149.56% 145.40% 164.91% 188.67% 175.11% 182.64% 201.05% 190.58% 250.78% 269.13% 259.83% 100.00% 100.00% 100.00%
Clare 442.96 398.96 421.81 730.12 709.47 720.18 869.84 847.05 859.19 897.55 967.93 930.92 1,303.89 1,225.77 1,270.32 531.41 473.84 504.25
Limerick 713.99 570.78 643.31 998.27 859.16 928.64 1,163.26 1,094.30 1,132.17 1,280.33 1,199.57 1,242.83 1,764.50 1,531.22 1,666.77 726.25 601.61 667.33
North Tipperary/
East Limerick
CHO Area 3 - Total 626.34 529.36 579.21 925.77 816.05 871.57 1,086.60 1,035.93 1,063.51 1,152.55 1,131.89 1,143.00 1,649.33 1,471.81 1,573.79 679.77 573.64 629.61
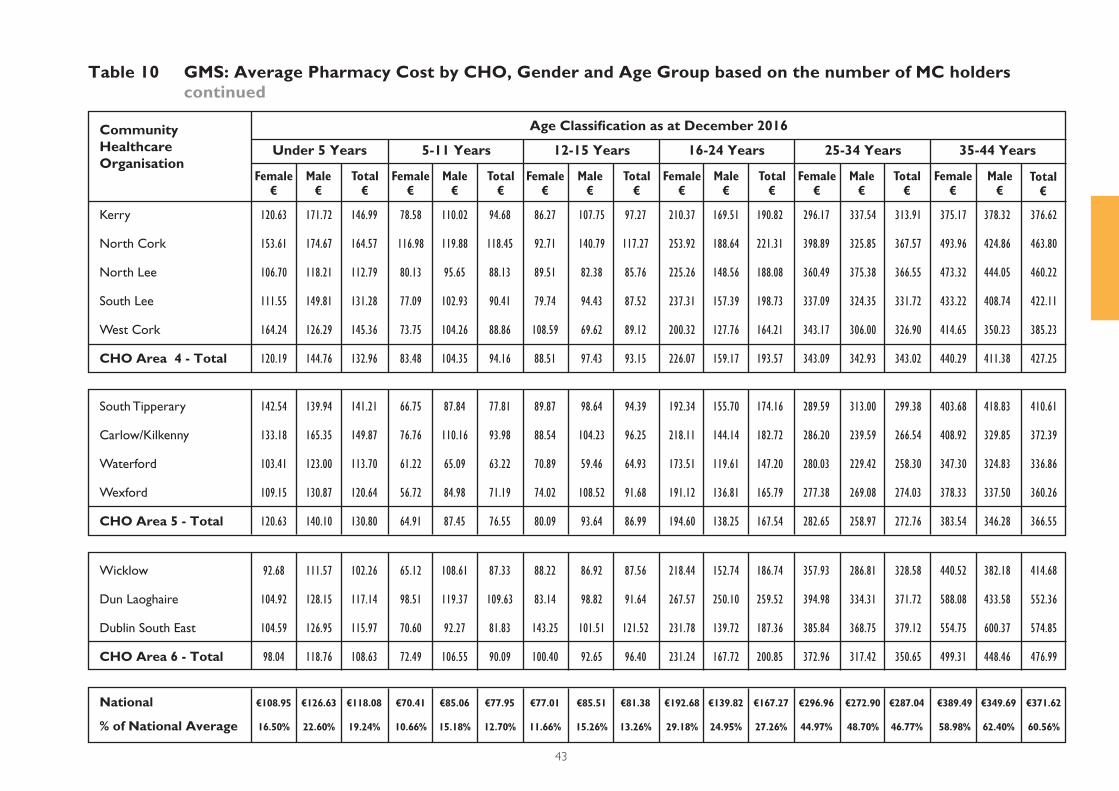
43
Table 10 GMS: Average Pharmacy Cost by CHO, Gender and Age Group based on the number of MC holders continued
Total€
CommunityHealthcare Organisation
Age Classifi cation as at December 2016
Under 5 Years
Female€
Male€
Total€
Female€
Male€
Total€
Female€
Male€
Total€
Female€
Male€
Total€
Female€
Male€
Total€
Female€
Male€
5-11 Years 16-24 Years 35-44 Years12-15 Years 25-34 Years
Kerry 120.63 171.72 146.99 78.58 110.02 94.68 86.27 107.75 97.27 210.37 169.51 190.82 296.17 337.54 313.91 375.17 378.32 376.62
North Cork 153.61 174.67 164.57 116.98 119.88 118.45 92.71 140.79 117.27 253.92 188.64 221.31 398.89 325.85 367.57 493.96 424.86 463.80
North Lee 106.70 118.21 112.79 80.13 95.65 88.13 89.51 82.38 85.76 225.26 148.56 188.08 360.49 375.38 366.55 473.32 444.05 460.22
South Lee 111.55 149.81 131.28 77.09 102.93 90.41 79.74 94.43 87.52 237.31 157.39 198.73 337.09 324.35 331.72 433.22 408.74 422.11
West Cork 164.24 126.29 145.36 73.75 104.26 88.86 108.59 69.62 89.12 200.32 127.76 164.21 343.17 306.00 326.90 414.65 350.23 385.23
CHO Area 4 - Total 120.19 144.76 132.96 83.48 104.35 94.16 88.51 97.43 93.15 226.07 159.17 193.57 343.09 342.93 343.02 440.29 411.38 427.25
Wicklow 92.68 111.57 102.26 65.12 108.61 87.33 88.22 86.92 87.56 218.44 152.74 186.74 357.93 286.81 328.58 440.52 382.18 414.68
Dun Laoghaire 104.92 128.15 117.14 98.51 119.37 109.63 83.14 98.82 91.64 267.57 250.10 259.52 394.98 334.31 371.72 588.08 433.58 552.36
Dublin South East 104.59 126.95 115.97 70.60 92.27 81.83 143.25 101.51 121.52 231.78 139.72 187.36 385.84 368.75 379.12 554.75 600.37 574.85
CHO Area 6 - Total 98.04 118.76 108.63 72.49 106.55 90.09 100.40 92.65 96.40 231.24 167.72 200.85 372.96 317.42 350.65 499.31 448.46 476.99
National €108.95 €126.63 €118.08 €70.41 €85.06 €77.95 €77.01 €85.51 €81.38 €192.68 €139.82 €167.27 €296.96 €272.90 €287.04 €389.49 €349.69 €371.62
% of National Average 16.50% 22.60% 19.24% 10.66% 15.18% 12.70% 11.66% 15.26% 13.26% 29.18% 24.95% 27.26% 44.97% 48.70% 46.77% 58.98% 62.40% 60.56%
South Tipperary 142.54 139.94 141.21 66.75 87.84 77.81 89.87 98.64 94.39 192.34 155.70 174.16 289.59 313.00 299.38 403.68 418.83 410.61
Carlow/Kilkenny 133.18 165.35 149.87 76.76 110.16 93.98 88.54 104.23 96.25 218.11 144.14 182.72 286.20 239.59 266.54 408.92 329.85 372.39
Waterford 103.41 123.00 113.70 61.22 65.09 63.22 70.89 59.46 64.93 173.51 119.61 147.20 280.03 229.42 258.30 347.30 324.83 336.86
Wexford 109.15 130.87 120.64 56.72 84.98 71.19 74.02 108.52 91.68 191.12 136.81 165.79 277.38 269.08 274.03 378.33 337.50 360.26
CHO Area 5 - Total 120.63 140.10 130.80 64.91 87.45 76.55 80.09 93.64 86.99 194.60 138.25 167.54 282.65 258.97 272.76 383.54 346.28 366.55

44
Table 10 GMS: Average Pharmacy Cost by CHO, Gender and Age Group based on the number of MC holders continued
Kerry 603.69 502.38 553.67 844.21 765.05 805.43 1,023.64 976.35 1,001.18 1,055.52 1,012.56 1,035.29 1,462.28 1,420.36 1,444.42 648.09 589.39 620.32
North Cork 756.61 594.98 676.61 1,069.04 954.45 1,012.40 1,220.75 1,304.83 1,256.94 1,353.15 1,256.54 1,307.90 1,834.75 1,700.08 1,779.75 837.65 708.52 777.45
North Lee 724.73 628.41 678.11 1,032.50 912.86 973.76 1,146.58 1,102.96 1,126.72 1,182.29 1,051.34 1,120.93 1,595.54 1,433.55 1,528.49 683.92 581.34 635.72
South Lee 687.09 619.35 654.78 1,079.11 964.97 1,024.54 1,164.48 1,083.04 1,128.22 1,325.70 1,188.85 1,265.97 1,535.46 1,435.61 1,496.33 742.84 623.99 688.24
West Cork 527.46 474.73 502.76 860.44 817.90 839.65 980.38 1,018.24 998.28 1,150.81 1,167.29 1,158.32 1,569.87 1,458.31 1,521.01 740.28 662.97 704.06
CHO Area 4 - Total 674.84 578.32 628.27 987.36 885.73 937.76 1,116.83 1,084.23 1,101.96 1,201.78 1,107.27 1,158.21 1,580.13 1,471.25 1,535.19 714.56 616.56 668.74
Wicklow 653.10 561.39 610.30 941.19 823.46 886.20 1,014.81 1,073.39 1,041.06 1,156.55 1,157.34 1,156.92 1,664.20 1,545.24 1,614.36 669.81 581.79 629.15
Dun Laoghaire 859.62 743.93 807.21 1,097.11 1,075.40 1,087.95 1,277.76 1,156.82 1,228.50 1,582.39 1,331.73 1,487.58 1,716.27 1,626.91 1,685.06 1,065.08 852.32 976.65
Dublin South East 761.17 710.12 736.32 1,306.15 1,239.76 1,276.54 1,323.48 1,540.32 1,410.25 1,293.64 1,412.48 1,341.59 1,866.73 1,744.67 1,822.32 980.29 739.20 918.95
CHO Area 6 - Total 723.98 636.94 683.18 1,066.05 975.47 1,025.17 1,159.97 1,201.31 1,177.60 1,309.49 1,267.12 1,291.44 1,749.28 1,633.45 1,705.65 851.73 708.73 788.27
National €613.61 €515.66 €566.20 €942.77 €838.12 €892.25 €1,089.07 €1,057.29 €1,074.60 €1,206.16 €1,126.72 €1,169.52 €1,656.12 €1,508.23 €1,594.47 €660.38 €560.40 €613.67
% of National Average 92.92% 92.02% 92.27% 142.76% 149.56% 145.40% 164.91% 188.67% 175.11% 182.64% 201.05% 190.58% 250.78% 269.13% 259.83% 100.00% 100.00% 100.00%
South Tipperary 737.39 585.97 664.77 1,059.69 894.05 977.35 1,264.34 1,176.91 1,223.43 1,386.99 1,222.60 1,309.45 1,714.29 1,658.95 1,690.72 739.12 642.47 693.32
Carlow/Kilkenny 663.85 528.00 599.05 980.15 870.53 925.81 1,166.46 1,117.82 1,143.58 1,335.34 1,196.03 1,269.45 1,840.45 1,651.62 1,759.13 690.14 583.34 639.66
Waterford 520.40 480.57 500.76 849.30 733.61 792.65 953.65 999.00 974.85 1,082.74 1,036.16 1,061.40 1,511.03 1,399.91 1,463.37 600.77 519.75 562.23
Wexford 566.35 488.46 529.13 884.57 787.84 837.55 1,022.61 1,017.91 1,020.44 1,145.58 1,023.10 1,088.65 1,522.81 1,407.03 1,472.09 603.58 533.69 570.87
CHO Area 5 - Total 611.67 514.02 564.63 933.90 816.96 876.41 1,087.94 1,069.43 1,079.31 1,219.71 1,106.99 1,167.14 1,638.58 1,516.11 1,585.74 650.51 563.39 609.37
CommunityHealthcare Organisation
Age Classifi cation as at December 2016
Female€
Male€
Total€
Female€
Male€
Total€
Female€
Male€
Total€
Female€
Male€
Total€
Female€
Male€
Total€
Female€
Male€
Total€
45-54 Years 55-64 Years 70-74 Years All65-69 Years 75 Years and Over
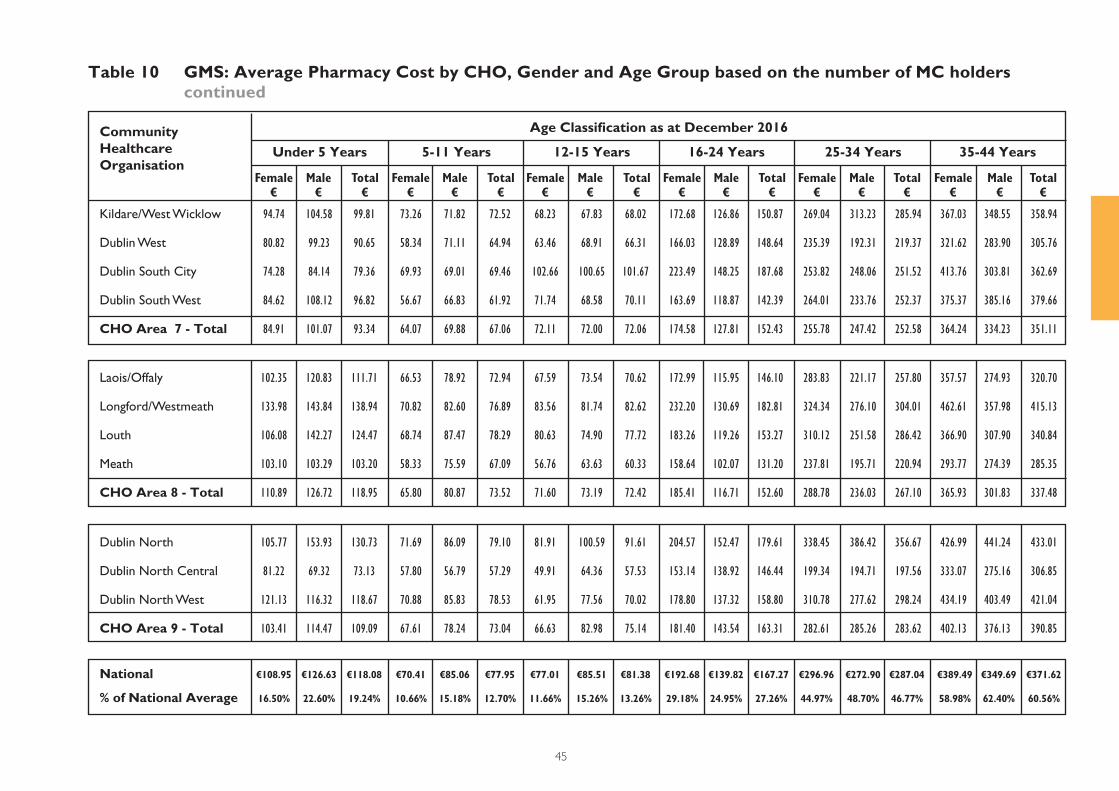
45
Table 10 GMS: Average Pharmacy Cost by CHO, Gender and Age Group based on the number of MC holders continued
CommunityHealthcare Organisation
Under 5 Years
Female€
Male€
Total€
Female€
Male€
Total€
Female€
Male€
Total€
Female€
Male€
Total€
Female€
Male€
Total€
Female€
5-11 Years 16-24 Years 35-44 Years12-15 Years 25-34 Years
Total€
Male€
Kildare/West Wicklow 94.74 104.58 99.81 73.26 71.82 72.52 68.23 67.83 68.02 172.68 126.86 150.87 269.04 313.23 285.94 367.03 348.55 358.94
Dublin West 80.82 99.23 90.65 58.34 71.11 64.94 63.46 68.91 66.31 166.03 128.89 148.64 235.39 192.31 219.37 321.62 283.90 305.76
Dublin South City 74.28 84.14 79.36 69.93 69.01 69.46 102.66 100.65 101.67 223.49 148.25 187.68 253.82 248.06 251.52 413.76 303.81 362.69
Dublin South West 84.62 108.12 96.82 56.67 66.83 61.92 71.74 68.58 70.11 163.69 118.87 142.39 264.01 233.76 252.37 375.37 385.16 379.66
CHO Area 7 - Total 84.91 101.07 93.34 64.07 69.88 67.06 72.11 72.00 72.06 174.58 127.81 152.43 255.78 247.42 252.58 364.24 334.23 351.11
Dublin North 105.77 153.93 130.73 71.69 86.09 79.10 81.91 100.59 91.61 204.57 152.47 179.61 338.45 386.42 356.67 426.99 441.24 433.01
Dublin North Central 81.22 69.32 73.13 57.80 56.79 57.29 49.91 64.36 57.53 153.14 138.92 146.44 199.34 194.71 197.56 333.07 275.16 306.85
Dublin North West 121.13 116.32 118.67 70.88 85.83 78.53 61.95 77.56 70.02 178.80 137.32 158.80 310.78 277.62 298.24 434.19 403.49 421.04
CHO Area 9 - Total 103.41 114.47 109.09 67.61 78.24 73.04 66.63 82.98 75.14 181.40 143.54 163.31 282.61 285.26 283.62 402.13 376.13 390.85
National €108.95 €126.63 €118.08 €70.41 €85.06 €77.95 €77.01 €85.51 €81.38 €192.68 €139.82 €167.27 €296.96 €272.90 €287.04 €389.49 €349.69 €371.62
% of National Average 16.50% 22.60% 19.24% 10.66% 15.18% 12.70% 11.66% 15.26% 13.26% 29.18% 24.95% 27.26% 44.97% 48.70% 46.77% 58.98% 62.40% 60.56%
Laois/Offaly 102.35 120.83 111.71 66.53 78.92 72.94 67.59 73.54 70.62 172.99 115.95 146.10 283.83 221.17 257.80 357.57 274.93 320.70
Longford/Westmeath 133.98 143.84 138.94 70.82 82.60 76.89 83.56 81.74 82.62 232.20 130.69 182.81 324.34 276.10 304.01 462.61 357.98 415.13
Louth 106.08 142.27 124.47 68.74 87.47 78.29 80.63 74.90 77.72 183.26 119.26 153.27 310.12 251.58 286.42 366.90 307.90 340.84
Meath 103.10 103.29 103.20 58.33 75.59 67.09 56.76 63.63 60.33 158.64 102.07 131.20 237.81 195.71 220.94 293.77 274.39 285.35
CHO Area 8 - Total 110.89 126.72 118.95 65.80 80.87 73.52 71.60 73.19 72.42 185.41 116.71 152.60 288.78 236.03 267.10 365.93 301.83 337.48
Age Classifi cation as at December 2016
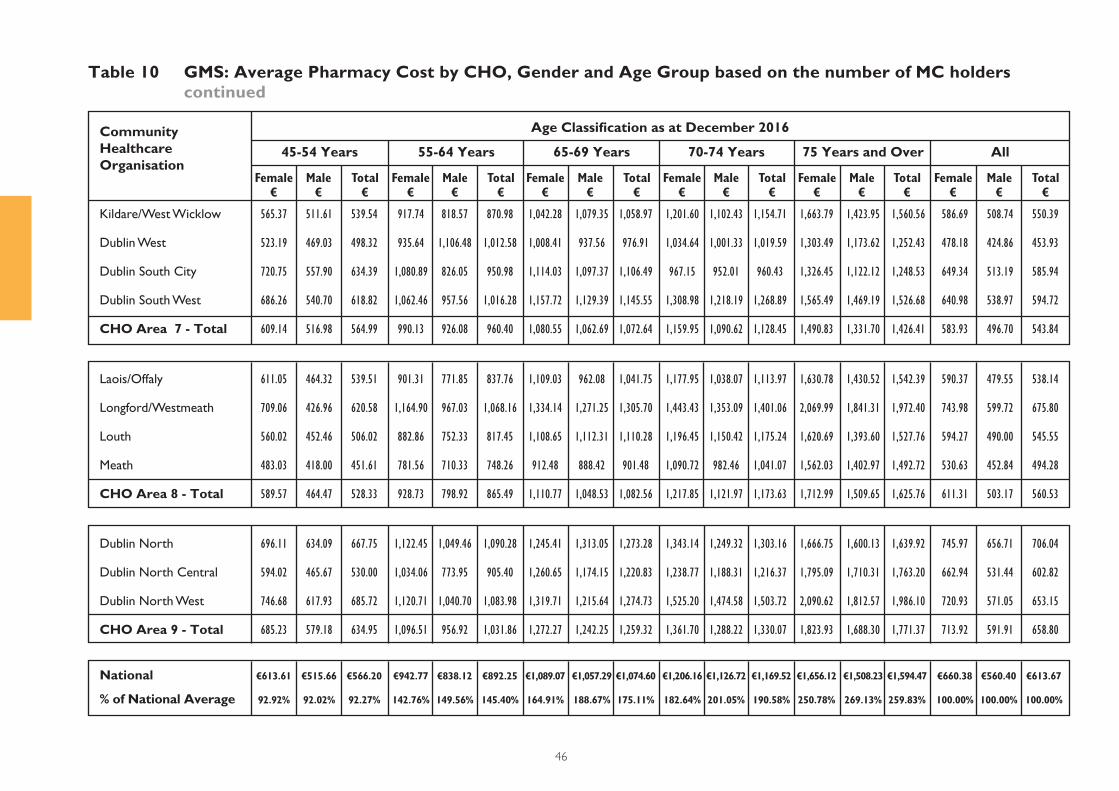
46
Table 10 GMS: Average Pharmacy Cost by CHO, Gender and Age Group based on the number of MC holders continued
CommunityHealthcare Organisation
Age Classifi cation as at December 2016
Female€
Male€
Total€
Female€
Male€
Total€
Female€
Male€
Total€
Female€
Male€
Total€
Female€
Male€
Total€
Female€
Male€
Total€
45-54 Years 55-64 Years 70-74 Years All65-69 Years 75 Years and Over
Kildare/West Wicklow 565.37 511.61 539.54 917.74 818.57 870.98 1,042.28 1,079.35 1,058.97 1,201.60 1,102.43 1,154.71 1,663.79 1,423.95 1,560.56 586.69 508.74 550.39
Dublin West 523.19 469.03 498.32 935.64 1,106.48 1,012.58 1,008.41 937.56 976.91 1,034.64 1,001.33 1,019.59 1,303.49 1,173.62 1,252.43 478.18 424.86 453.93
Dublin South City 720.75 557.90 634.39 1,080.89 826.05 950.98 1,114.03 1,097.37 1,106.49 967.15 952.01 960.43 1,326.45 1,122.12 1,248.53 649.34 513.19 585.94
Dublin South West 686.26 540.70 618.82 1,062.46 957.56 1,016.28 1,157.72 1,129.39 1,145.55 1,308.98 1,218.19 1,268.89 1,565.49 1,469.19 1,526.68 640.98 538.97 594.72
CHO Area 7 - Total 609.14 516.98 564.99 990.13 926.08 960.40 1,080.55 1,062.69 1,072.64 1,159.95 1,090.62 1,128.45 1,490.83 1,331.70 1,426.41 583.93 496.70 543.84
Dublin North 696.11 634.09 667.75 1,122.45 1,049.46 1,090.28 1,245.41 1,313.05 1,273.28 1,343.14 1,249.32 1,303.16 1,666.75 1,600.13 1,639.92 745.97 656.71 706.04
Dublin North Central 594.02 465.67 530.00 1,034.06 773.95 905.40 1,260.65 1,174.15 1,220.83 1,238.77 1,188.31 1,216.37 1,795.09 1,710.31 1,763.20 662.94 531.44 602.82
Dublin North West 746.68 617.93 685.72 1,120.71 1,040.70 1,083.98 1,319.71 1,215.64 1,274.73 1,525.20 1,474.58 1,503.72 2,090.62 1,812.57 1,986.10 720.93 571.05 653.15
CHO Area 9 - Total 685.23 579.18 634.95 1,096.51 956.92 1,031.86 1,272.27 1,242.25 1,259.32 1,361.70 1,288.22 1,330.07 1,823.93 1,688.30 1,771.37 713.92 591.91 658.80
National €613.61 €515.66 €566.20 €942.77 €838.12 €892.25 €1,089.07 €1,057.29 €1,074.60 €1,206.16 €1,126.72 €1,169.52 €1,656.12 €1,508.23 €1,594.47 €660.38 €560.40 €613.67
% of National Average 92.92% 92.02% 92.27% 142.76% 149.56% 145.40% 164.91% 188.67% 175.11% 182.64% 201.05% 190.58% 250.78% 269.13% 259.83% 100.00% 100.00% 100.00%
Laois/Offaly 611.05 464.32 539.51 901.31 771.85 837.76 1,109.03 962.08 1,041.75 1,177.95 1,038.07 1,113.97 1,630.78 1,430.52 1,542.39 590.37 479.55 538.14
Longford/Westmeath 709.06 426.96 620.58 1,164.90 967.03 1,068.16 1,334.14 1,271.25 1,305.70 1,443.43 1,353.09 1,401.06 2,069.99 1,841.31 1,972.40 743.98 599.72 675.80
Louth 560.02 452.46 506.02 882.86 752.33 817.45 1,108.65 1,112.31 1,110.28 1,196.45 1,150.42 1,175.24 1,620.69 1,393.60 1,527.76 594.27 490.00 545.55
Meath 483.03 418.00 451.61 781.56 710.33 748.26 912.48 888.42 901.48 1,090.72 982.46 1,041.07 1,562.03 1,402.97 1,492.72 530.63 452.84 494.28
CHO Area 8 - Total 589.57 464.47 528.33 928.73 798.92 865.49 1,110.77 1,048.53 1,082.56 1,217.85 1,121.97 1,173.63 1,712.99 1,509.65 1,625.76 611.31 503.17 560.53
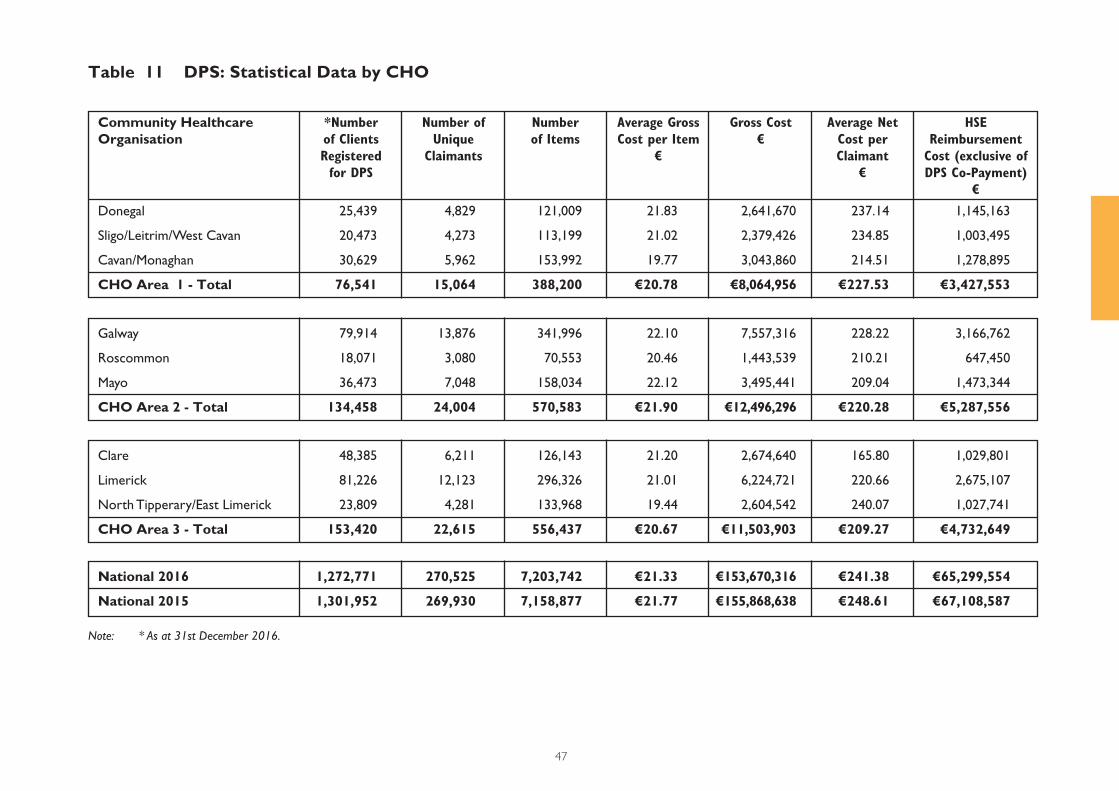
47
Table 11 DPS: Statistical Data by CHO
Community Healthcare Organisation
*Number
of Clients
Registered
for DPS
Number of
Unique
Claimants
Gross Cost
€
Number
of Items
Average Net
Cost per
Claimant
€
Average Gross
Cost per Item
€
HSE
Reimbursement
Cost (exclusive of
DPS Co-Payment)
€
Donegal 25,439 4,829 121,009 21.83 2,641,670 237.14 1,145,163
Sligo/Leitrim/West Cavan 20,473 4,273 113,199 21.02 2,379,426 234.85 1,003,495
Cavan/Monaghan 30,629 5,962 153,992 19.77 3,043,860 214.51 1,278,895
CHO Area 1 - Total 76,541 15,064 388,200 €20.78 €8,064,956 €227.53 €3,427,553
Galway 79,914 13,876 341,996 22.10 7,557,316 228.22 3,166,762
Roscommon 18,071 3,080 70,553 20.46 1,443,539 210.21 647,450
Mayo 36,473 7,048 158,034 22.12 3,495,441 209.04 1,473,344
CHO Area 2 - Total 134,458 24,004 570,583 €21.90 €12,496,296 €220.28 €5,287,556
Clare 48,385 6,211 126,143 21.20 2,674,640 165.80 1,029,801
Limerick 81,226 12,123 296,326 21.01 6,224,721 220.66 2,675,107
North Tipperary/East Limerick 23,809 4,281 133,968 19.44 2,604,542 240.07 1,027,741
CHO Area 3 - Total 153,420 22,615 556,437 €20.67 €11,503,903 €209.27 €4,732,649
National 2016 1,272,771 270,525 7,203,742 €21.33 €153,670,316 €241.38 €65,299,554
National 2015 1,301,952 269,930 7,158,877 €21.77 €155,868,638 €248.61 €67,108,587
Note: * As at 31st December 2016.

48
Table 11 DPS: Statistical Data by CHO continued
Community Healthcare Organisation
*Number
of Clients
Registered
for DPS
Number of
Unique
Claimants
Gross Cost
€
Number
of Items
Average Net
Cost per
Claimant
€
Average Gross
Cost per Item
€
HSE
Reimbursement
Cost (exclusive of
DPS Co-Payment)
€
Kerry 45,048 9,130 227,089 21.01 4,771,179 211.92 1,934,862
North Cork 30,925 5,539 142,851 19.96 2,851,286 187.75 1,039,964
North Lee 50,808 11,833 266,674 20.88 5,567,420 184.26 2,180,321
South Lee 64,455 18,310 463,684 19.98 9,263,650 192.14 3,518,083
West Cork 18,742 3,436 79,274 20.24 1,604,575 176.12 605,149
CHO Area 4 - Total 209,978 48,248 1,179,572 €20.40 €24,058,110 €192.31 €9,278,379
South Tipperary 21,984 5,696 143,182 20.48 2,931,826 216.38 1,232,521
Carlow/Kilkenny 34,676 8,323 228,685 19.99 4,571,239 218.88 1,821,725
Waterford 31,859 6,191 155,855 21.15 3,295,791 224.73 1,391,280
Wexford 37,145 7,394 191,300 19.80 3,788,339 205.11 1,516,596
CHO Area 5 - Total 125,664 27,604 719,022 €20.29 €14,587,195 €215.99 €5,962,122
Wicklow 34,155 7,449 182,222 21.10 3,845,431 213.38 1,589,460
Dun Laoghaire 47,480 13,130 403,124 21.53 8,679,772 287.97 3,781,044
Dublin South East 33,390 8,763 289,129 25.30 7,314,237 398.95 3,495,999
CHO Area 6 - Total 115,025 29,342 874,475 €22.69 €19,839,440 €302.18 €8,866,503
National 2016 1,272,771 270,525 7,203,742 €21.33 €153,670,316 €241.38 €65,299,554
National 2015 1,301,952 269,930 7,158,877 €21.77 €155,868,638 €248.61 €67,108,587
Note: * As at 31st December 2016.
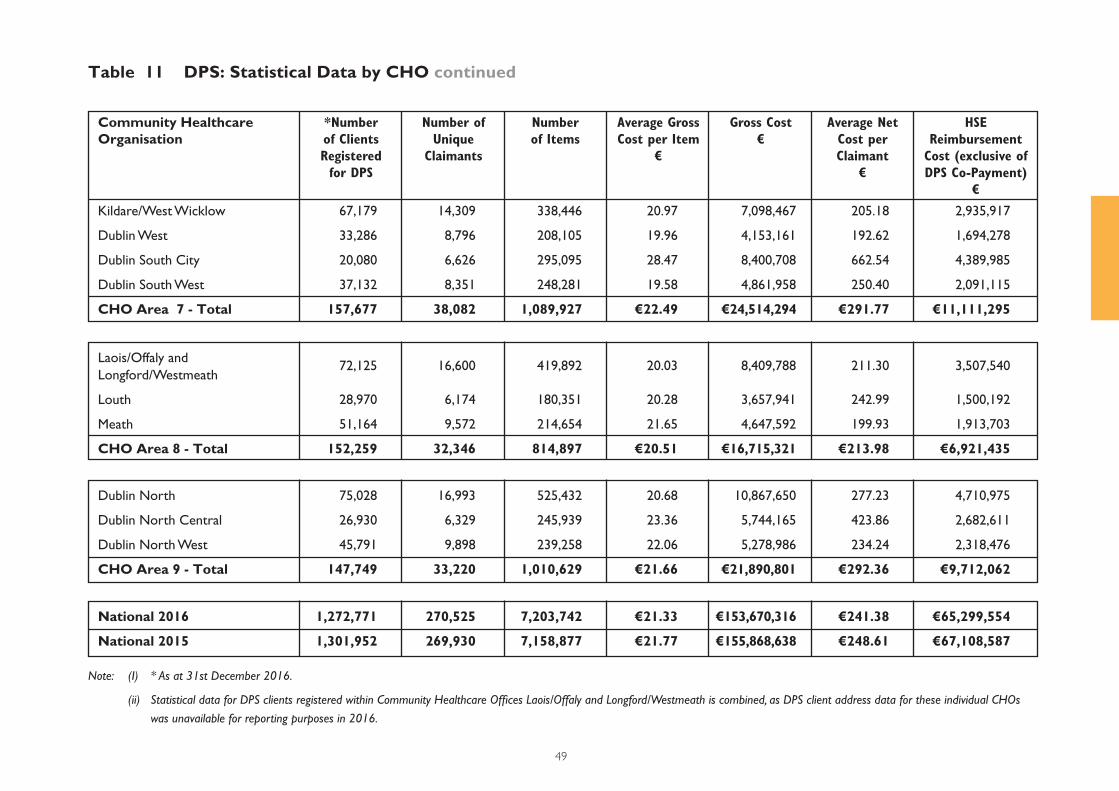
49
Table 11 DPS: Statistical Data by CHO continued
Community Healthcare Organisation
*Number
of Clients
Registered
for DPS
Number of
Unique
Claimants
Gross Cost
€
Number
of Items
Average Net
Cost per
Claimant
€
Average Gross
Cost per Item
€
HSE
Reimbursement
Cost (exclusive of
DPS Co-Payment)
€
Kildare/West Wicklow 67,179 14,309 338,446 20.97 7,098,467 205.18 2,935,917
Dublin West 33,286 8,796 208,105 19.96 4,153,161 192.62 1,694,278
Dublin South City 20,080 6,626 295,095 28.47 8,400,708 662.54 4,389,985
Dublin South West 37,132 8,351 248,281 19.58 4,861,958 250.40 2,091,115
CHO Area 7 - Total 157,677 38,082 1,089,927 €22.49 €24,514,294 €291.77 €11,111,295
Dublin North 75,028 16,993 525,432 20.68 10,867,650 277.23 4,710,975
Dublin North Central 26,930 6,329 245,939 23.36 5,744,165 423.86 2,682,611
Dublin North West 45,791 9,898 239,258 22.06 5,278,986 234.24 2,318,476
CHO Area 9 - Total 147,749 33,220 1,010,629 €21.66 €21,890,801 €292.36 €9,712,062
Laois/Offaly and
Longford/Westmeath 72,125 16,600 419,892 20.03 8,409,788 211.30 3,507,540
Louth 28,970 6,174 180,351 20.28 3,657,941 242.99 1,500,192
Meath 51,164 9,572 214,654 21.65 4,647,592 199.93 1,913,703
CHO Area 8 - Total 152,259 32,346 814,897 €20.51 €16,715,321 €213.98 €6,921,435
National 2016 1,272,771 270,525 7,203,742 €21.33 €153,670,316 €241.38 €65,299,554
National 2015 1,301,952 269,930 7,158,877 €21.77 €155,868,638 €248.61 €67,108,587
Note: (I) * As at 31st December 2016.
(ii) Statistical data for DPS clients registered within Community Healthcare Offi ces Laois/Offaly and Longford/Westmeath is combined, as DPS client address data for these individual CHOs
was unavailable for reporting purposes in 2016.
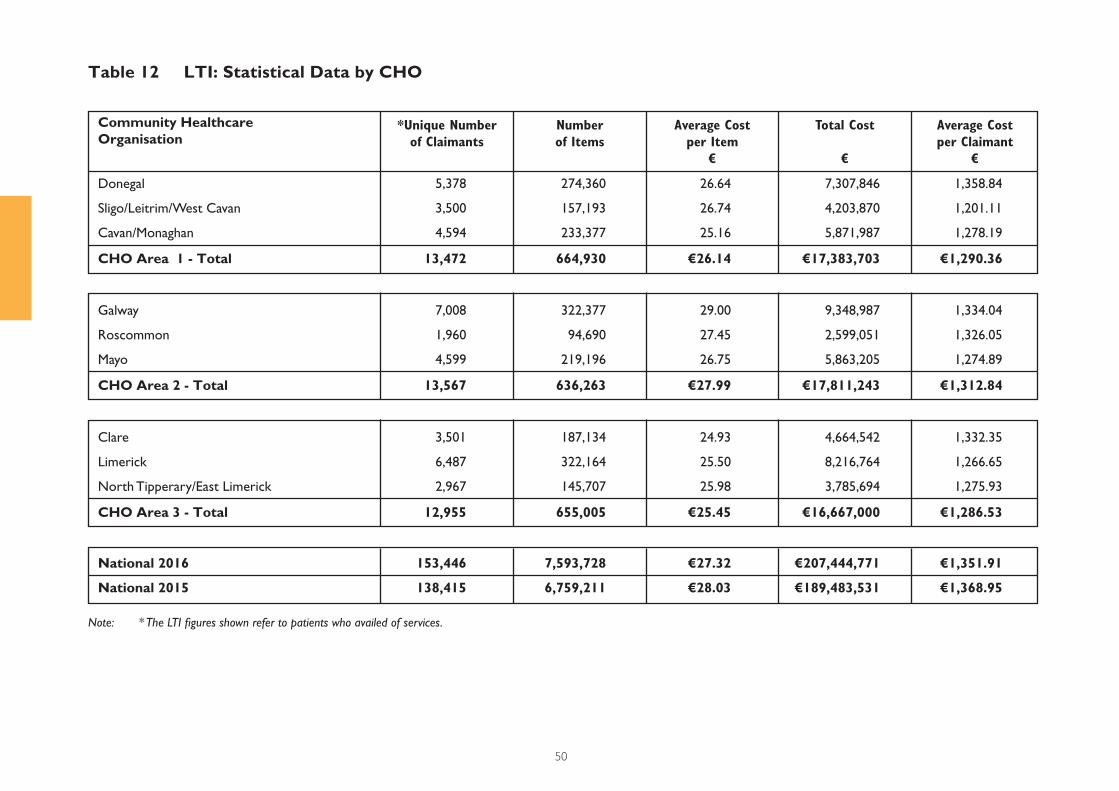
50
Table 12 LTI: Statistical Data by CHO
Community Healthcare Organisation
*Unique Number
of Claimants
Number
of Items
Total Cost
€
Average Cost
per Claimant
€
Average Cost
per Item
€
Donegal 5,378 274,360 26.64 7,307,846 1,358.84
Sligo/Leitrim/West Cavan 3,500 157,193 26.74 4,203,870 1,201.11
Cavan/Monaghan 4,594 233,377 25.16 5,871,987 1,278.19
CHO Area 1 - Total 13,472 664,930 €26.14 €17,383,703 €1,290.36
Galway 7,008 322,377 29.00 9,348,987 1,334.04
Roscommon 1,960 94,690 27.45 2,599,051 1,326.05
Mayo 4,599 219,196 26.75 5,863,205 1,274.89
CHO Area 2 - Total 13,567 636,263 €27.99 €17,811,243 €1,312.84
Clare 3,501 187,134 24.93 4,664,542 1,332.35
Limerick 6,487 322,164 25.50 8,216,764 1,266.65
North Tipperary/East Limerick 2,967 145,707 25.98 3,785,694 1,275.93
CHO Area 3 - Total 12,955 655,005 €25.45 €16,667,000 €1,286.53
National 2016 153,446 7,593,728 €27.32 €207,444,771 €1,351.91
National 2015 138,415 6,759,211 €28.03 €189,483,531 €1,368.95
Note: * The LTI fi gures shown refer to patients who availed of services.
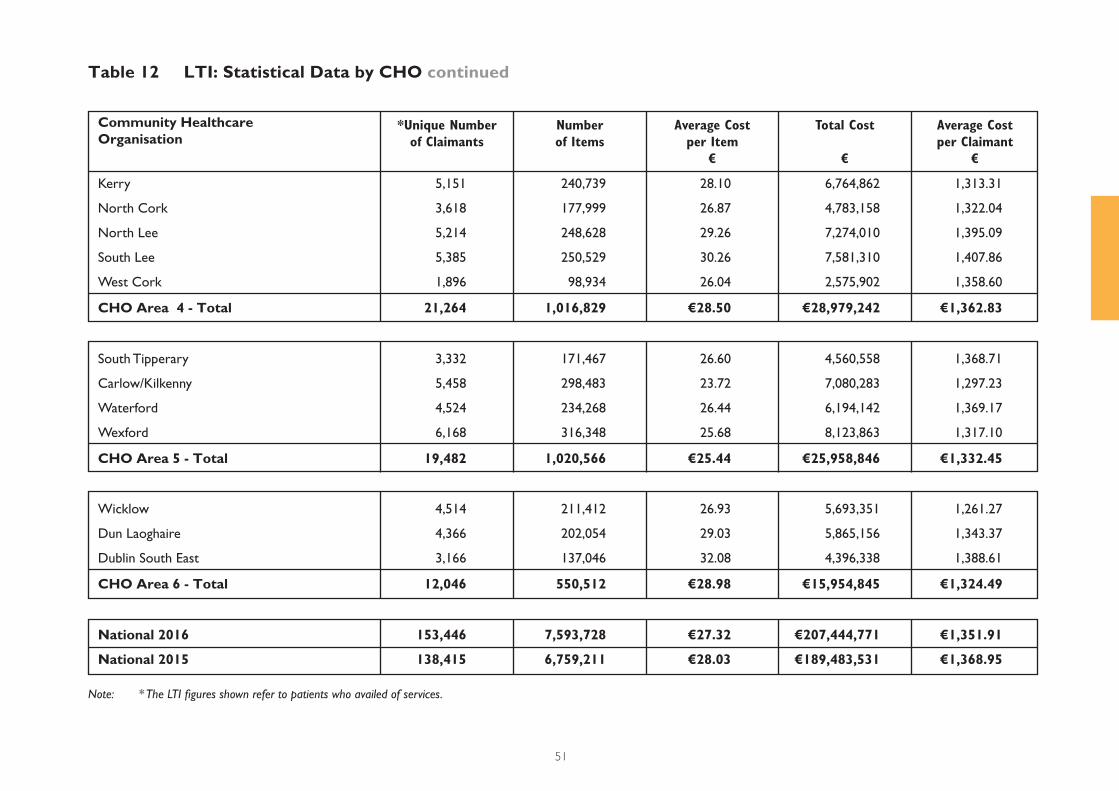
51
Table 12 LTI: Statistical Data by CHO continued
Community Healthcare Organisation
*Unique Number
of Claimants
Number
of Items
Total Cost
€
Average Cost
per Claimant
€
Average Cost
per Item
€
Kerry 5,151 240,739 28.10 6,764,862 1,313.31
North Cork 3,618 177,999 26.87 4,783,158 1,322.04
North Lee 5,214 248,628 29.26 7,274,010 1,395.09
South Lee 5,385 250,529 30.26 7,581,310 1,407.86
West Cork 1,896 98,934 26.04 2,575,902 1,358.60
CHO Area 4 - Total 21,264 1,016,829 €28.50 €28,979,242 €1,362.83
South Tipperary 3,332 171,467 26.60 4,560,558 1,368.71
Carlow/Kilkenny 5,458 298,483 23.72 7,080,283 1,297.23
Waterford 4,524 234,268 26.44 6,194,142 1,369.17
Wexford 6,168 316,348 25.68 8,123,863 1,317.10
CHO Area 5 - Total 19,482 1,020,566 €25.44 €25,958,846 €1,332.45
Wicklow 4,514 211,412 26.93 5,693,351 1,261.27
Dun Laoghaire 4,366 202,054 29.03 5,865,156 1,343.37
Dublin South East 3,166 137,046 32.08 4,396,338 1,388.61
CHO Area 6 - Total 12,046 550,512 €28.98 €15,954,845 €1,324.49
National 2016 153,446 7,593,728 €27.32 €207,444,771 €1,351.91
National 2015 138,415 6,759,211 €28.03 €189,483,531 €1,368.95
Note: * The LTI fi gures shown refer to patients who availed of services.
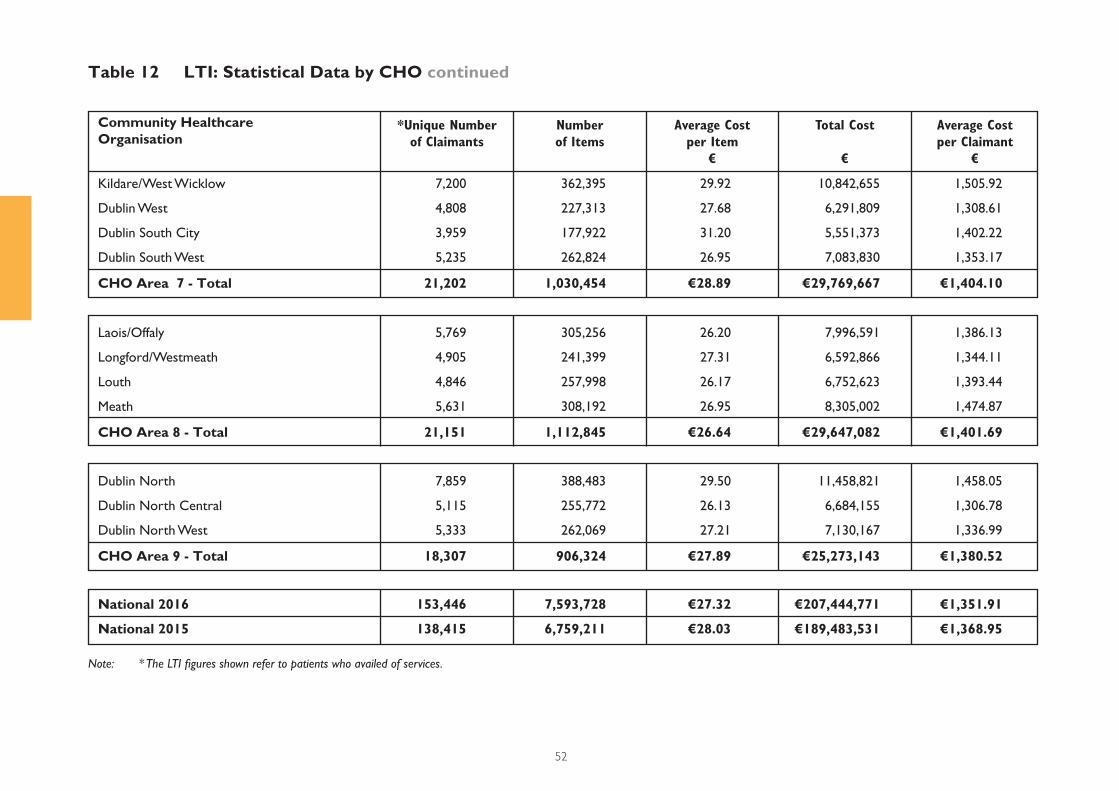
52
Table 12 LTI: Statistical Data by CHO continued
Community Healthcare Organisation
*Unique Number
of Claimants
Number
of Items
Total Cost
€
Average Cost
per Claimant
€
Average Cost
per Item
€
Kildare/West Wicklow 7,200 362,395 29.92 10,842,655 1,505.92
Dublin West 4,808 227,313 27.68 6,291,809 1,308.61
Dublin South City 3,959 177,922 31.20 5,551,373 1,402.22
Dublin South West 5,235 262,824 26.95 7,083,830 1,353.17
CHO Area 7 - Total 21,202 1,030,454 €28.89 €29,769,667 €1,404.10
Laois/Offaly 5,769 305,256 26.20 7,996,591 1,386.13
Longford/Westmeath 4,905 241,399 27.31 6,592,866 1,344.11
Louth 4,846 257,998 26.17 6,752,623 1,393.44
Meath 5,631 308,192 26.95 8,305,002 1,474.87
CHO Area 8 - Total 21,151 1,112,845 €26.64 €29,647,082 €1,401.69
Dublin North 7,859 388,483 29.50 11,458,821 1,458.05
Dublin North Central 5,115 255,772 26.13 6,684,155 1,306.78
Dublin North West 5,333 262,069 27.21 7,130,167 1,336.99
CHO Area 9 - Total 18,307 906,324 €27.89 €25,273,143 €1,380.52
National 2016 153,446 7,593,728 €27.32 €207,444,771 €1,351.91
National 2015 138,415 6,759,211 €28.03 €189,483,531 €1,368.95
Note: * The LTI fi gures shown refer to patients who availed of services.

S E C T I O N
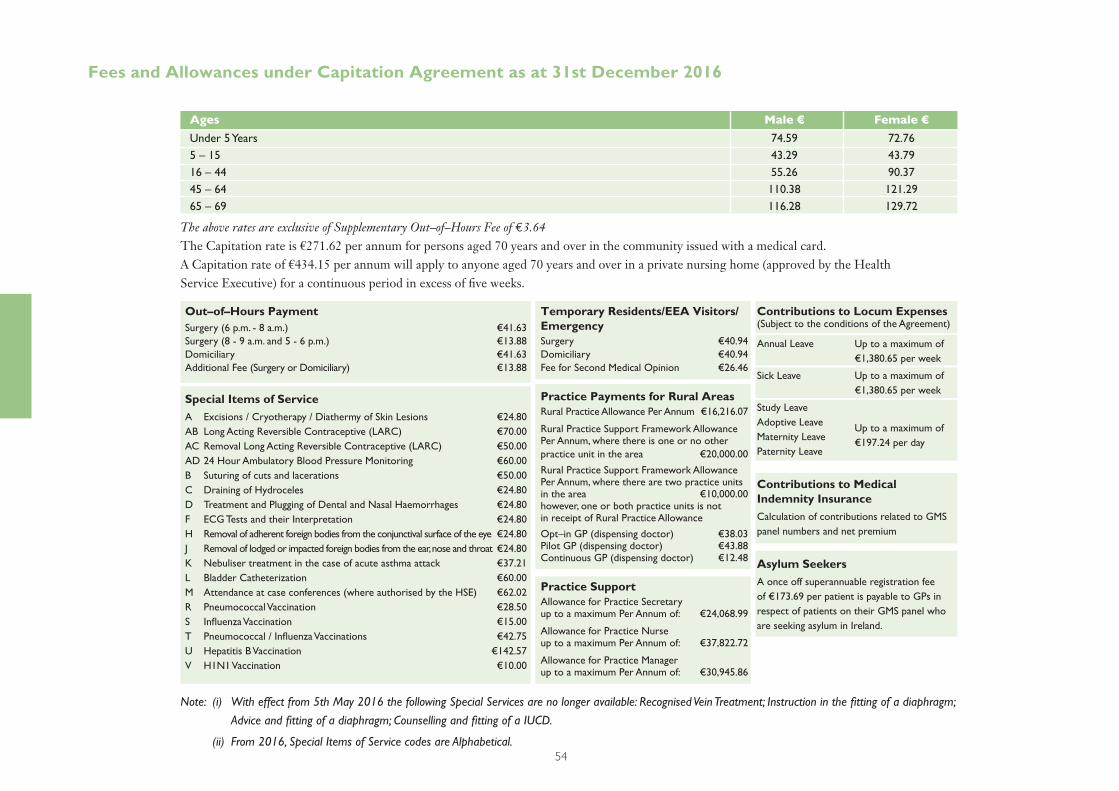
54
The above rates are exclusive of Supplementary Out–of–Hours Fee of €3.64The Capitation rate is €271.62 per annum for persons aged 70 years and over in the community issued with a medical card.A Capitation rate of €434.15 per annum will apply to anyone aged 70 years and over in a private nursing home (approved by the Health Service Executive) for a continuous period in excess of fi ve weeks.
Ages Male € Female € Under 5 Years 74.59 72.765 – 15 43.29 43.7916 – 44 55.26 90.3745 – 64 110.38 121.2965 – 69 116.28 129.72
Out–of–Hours PaymentSurgery (6 p.m. - 8 a.m.) €41.63Surgery (8 - 9 a.m. and 5 - 6 p.m.) €13.88Domiciliary €41.63Additional Fee (Surgery or Domiciliary) €13.88
Special Items of ServiceA Excisions / Cryotherapy / Diathermy of Skin Lesions €24.80AB Long Acting Reversible Contraceptive (LARC) €70.00AC Removal Long Acting Reversible Contraceptive (LARC) €50.00AD 24 Hour Ambulatory Blood Pressure Monitoring €60.00B Suturing of cuts and lacerations €50.00C Draining of Hydroceles €24.80D Treatment and Plugging of Dental and Nasal Haemorrhages €24.80F ECG Tests and their Interpretation €24.80H Removal of adherent foreign bodies from the conjunctival surface of the eye €24.80J Removal of lodged or impacted foreign bodies from the ear, nose and throat €24.80K Nebuliser treatment in the case of acute asthma attack €37.21L Bladder Catheterization €60.00M Attendance at case conferences (where authorised by the HSE) €62.02R Pneumococcal Vaccination €28.50S Infl uenza Vaccination €15.00T Pneumococcal / Infl uenza Vaccinations €42.75U Hepatitis B Vaccination €142.57V H1N1 Vaccination €10.00
Temporary Residents/EEA Visitors/EmergencySurgery €40.94Domiciliary €40.94Fee for Second Medical Opinion €26.46
Practice Payments for Rural AreasRural Practice Allowance Per Annum €16,216.07
Rural Practice Support Framework Allowance Per Annum, where there is one or no otherpractice unit in the area €20,000.00
Rural Practice Support Framework Allowance Per Annum, where there are two practice units in the area €10,000.00however, one or both practice units is not in receipt of Rural Practice Allowance
Opt–in GP (dispensing doctor) €38.03Pilot GP (dispensing doctor) €43.88Continuous GP (dispensing doctor) €12.48
Practice SupportAllowance for Practice Secretary up to a maximum Per Annum of: €24,068.99
Allowance for Practice Nurse up to a maximum Per Annum of: €37,822.72
Allowance for Practice Manager up to a maximum Per Annum of: €30,945.86
Contributions to Locum Expenses(Subject to the conditions of the Agreement)
Annual Leave
Sick Leave
Study LeaveAdoptive Leave Maternity Leave Paternity Leave
Contributions to Medical Indemnity InsuranceCalculation of contributions related to GMSpanel numbers and net premium
Asylum SeekersA once off superannuable registration fee of €173.69 per patient is payable to GPs in respect of patients on their GMS panel who are seeking asylum in Ireland.
Note: (i) With effect from 5th May 2016 the following Special Services are no longer available: Recognised Vein Treatment; Instruction in the fi tting of a diaphragm;
Advice and fi tting of a diaphragm; Counselling and fi tting of a IUCD.
(ii) From 2016, Special Items of Service codes are Alphabetical.
Up to a maximum of €1,380.65 per week
Up to a maximum of€1,380.65 per week
Up to a maximum of€197.24 per day
Fees and Allowances under Capitation Agreement as at 31st December 2016
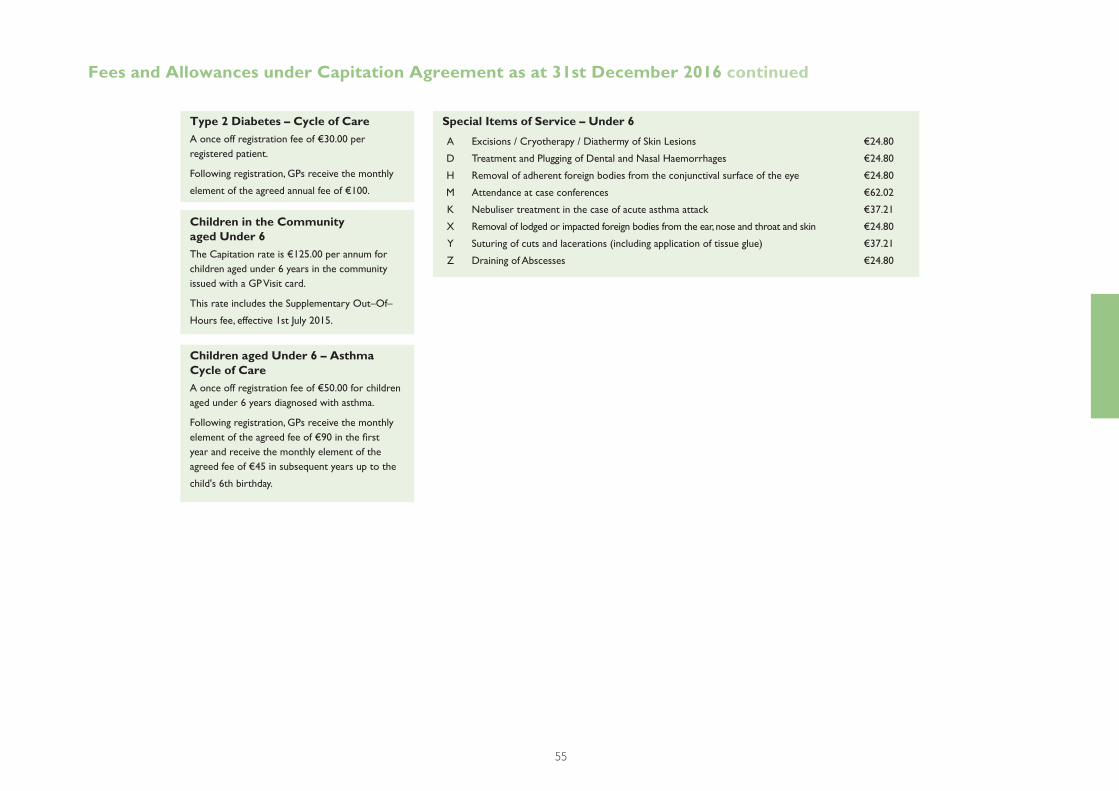
55
Type 2 Diabetes – Cycle of CareA once off registration fee of €30.00 per registered patient.
Following registration, GPs receive the monthly
element of the agreed annual fee of €100.
Children in the Community aged Under 6The Capitation rate is €125.00 per annum for children aged under 6 years in the community issued with a GP Visit card.
This rate includes the Supplementary Out–Of–
Hours fee, effective 1st July 2015.
Children aged Under 6 – AsthmaCycle of CareA once off registration fee of €50.00 for children aged under 6 years diagnosed with asthma.
Following registration, GPs receive the monthly element of the agreed fee of €90 in the fi rst year and receive the monthly element of the agreed fee of €45 in subsequent years up to the
child's 6th birthday.
Special Items of Service – Under 6
A Excisions / Cryotherapy / Diathermy of Skin Lesions €24.80
D Treatment and Plugging of Dental and Nasal Haemorrhages €24.80
H Removal of adherent foreign bodies from the conjunctival surface of the eye €24.80
M Attendance at case conferences €62.02
K Nebuliser treatment in the case of acute asthma attack €37.21
X Removal of lodged or impacted foreign bodies from the ear, nose and throat and skin €24.80
Y Suturing of cuts and lacerations (including application of tissue glue) €37.21
Z Draining of Abscesses €24.80
Fees and Allowances under Capitation Agreement as at 31st December 2016 continued

56
GP Surgery ConsultationsDay Normal Hours €11.87
Late Outside Normal Hours other than (Night) €16.88
Night Midnight to 8:00 a.m. €33.38
Domiciliary ConsultationsDay €17.51
Late €22.93
Night €44.96
Temporary Residents/EEA Visitors/EmergencySurgery €40.94
Domiciliary €40.94
Rural Practitioner's AllowancePer Annum €7,042.91
Locum and Practice Expense AllowancePer Annum €1,371.06
Sessional Rate – Homes for the AgedPer 3 Hour Session €73.18
Special Items of ServiceF Suturing of cuts and lacerations €22.43
G Treatment and Plugging of Dental and Nasal Haemorrhages €22.43
H Draining of Hydroceles €22.43
J Recognized Vein Treatment €22.43
K Excisions / Cryotherapy / Diathermy of Skin Lesions €22.43
M ECG Tests and their Interpretation €22.43
N Instruction in the fi tting of a diaphragm €22.43
R Pneumococcal Vaccination €28.50
S Infl uenza Vaccination €15.00
T Pneumococcal / Infl uenza Vaccinations €42.75
U Hepatitis B Vaccination €142.57
V H1N1 Vaccination €10.00
Immunisation FeesRegistration of child with a GP €37.78
6 in one Vaccine €206.31
95% uptake bonus €60.63
Health (Amendment) Act 1996Surgery Fee €30.53
Domiciliary Fee €40.27
Methadone Treatment SchemeLevel 1 Contractor €159.97
Level 2 Contractor €176.43
Heartwatch Programme €39.31
Fees and Allowances under the Fee–Per–Item Agreement and Fees under the Immunisation Scheme,Health (Amendment) Act 1996, Methadone Treatment Scheme and Heartwatch Programme as at 31st December 2016
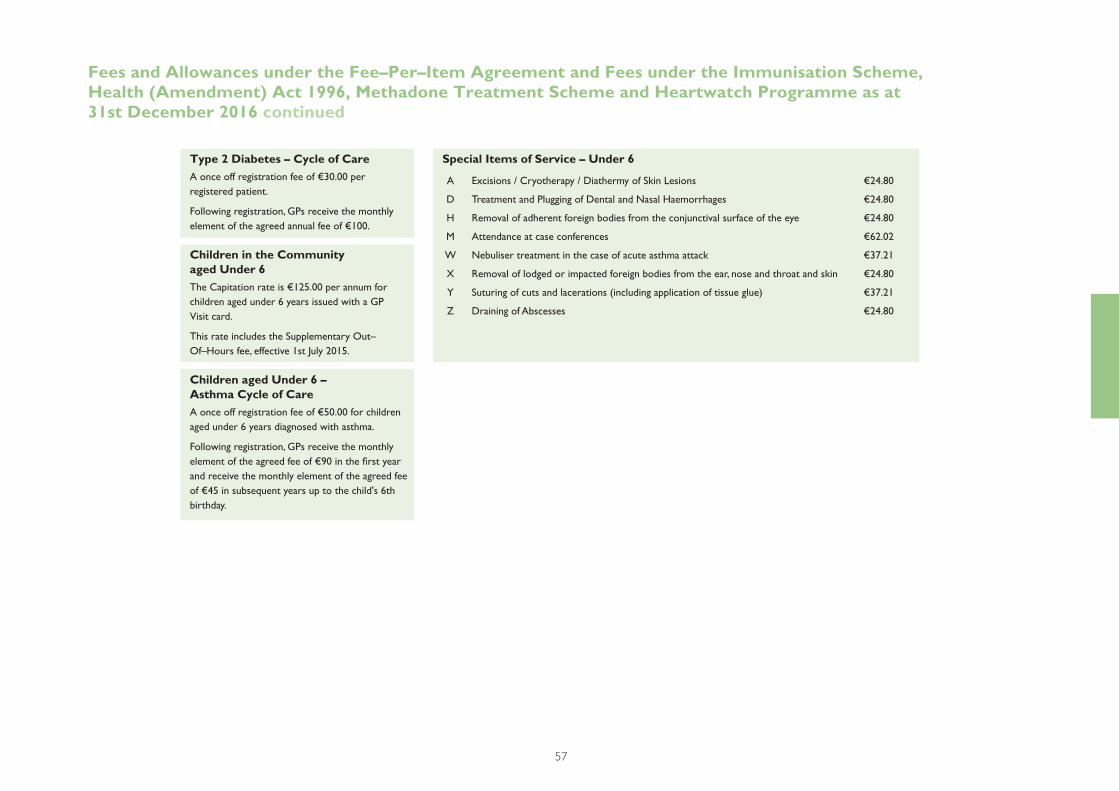
57
Type 2 Diabetes – Cycle of CareA once off registration fee of €30.00 per registered patient.
Following registration, GPs receive the monthly element of the agreed annual fee of €100.
Children in the Community aged Under 6The Capitation rate is €125.00 per annum for children aged under 6 years issued with a GP Visit card.
This rate includes the Supplementary Out–Of–Hours fee, effective 1st July 2015.
Children aged Under 6 – Asthma Cycle of CareA once off registration fee of €50.00 for children aged under 6 years diagnosed with asthma.
Following registration, GPs receive the monthly element of the agreed fee of €90 in the fi rst year and receive the monthly element of the agreed fee of €45 in subsequent years up to the child's 6th birthday.
Special Items of Service – Under 6
A Excisions / Cryotherapy / Diathermy of Skin Lesions €24.80
D Treatment and Plugging of Dental and Nasal Haemorrhages €24.80
H Removal of adherent foreign bodies from the conjunctival surface of the eye €24.80
M Attendance at case conferences €62.02
W Nebuliser treatment in the case of acute asthma attack €37.21
X Removal of lodged or impacted foreign bodies from the ear, nose and throat and skin €24.80
Y Suturing of cuts and lacerations (including application of tissue glue) €37.21
Z Draining of Abscesses €24.80
Fees and Allowances under the Fee–Per–Item Agreement and Fees under the Immunisation Scheme,Health (Amendment) Act 1996, Methadone Treatment Scheme and Heartwatch Programme as at 31st December 2016 continued
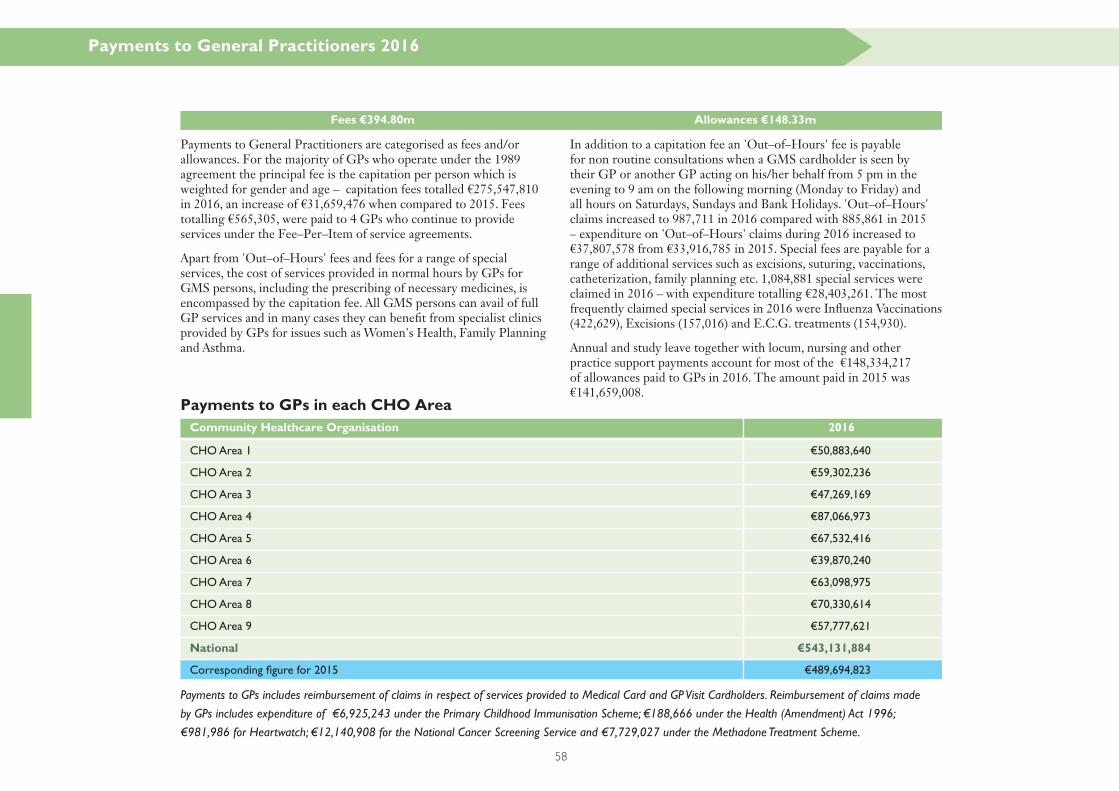
58
Payments to General Practitioners are categorised as fees and/or allowances. For the majority of GPs who operate under the 1989 agreement the principal fee is the capitation per person which is weighted for gender and age – capitation fees totalled €275,547,810 in 2016, an increase of €31,659,476 when compared to 2015. Fees totalling €565,305, were paid to 4 GPs who continue to provide services under the Fee–Per–Item of service agreements.
Apart from 'Out–of–Hours' fees and fees for a range of special services, the cost of services provided in normal hours by GPs for GMS persons, including the prescribing of necessary medicines, is encompassed by the capitation fee. All GMS persons can avail of full GP services and in many cases they can benefi t from specialist clinics provided by GPs for issues such as Women's Health, Family Planning and Asthma.
In addition to a capitation fee an 'Out–of–Hours' fee is payable for non routine consultations when a GMS cardholder is seen by their GP or another GP acting on his/her behalf from 5 pm in the evening to 9 am on the following morning (Monday to Friday) and all hours on Saturdays, Sundays and Bank Holidays. 'Out–of–Hours' claims increased to 987,711 in 2016 compared with 885,861 in 2015 – expenditure on 'Out–of–Hours' claims during 2016 increased to €37,807,578 from €33,916,785 in 2015. Special fees are payable for a range of additional services such as excisions, suturing, vaccinations, catheterization, family planning etc. 1,084,881 special services were claimed in 2016 – with expenditure totalling €28,403,261. The most frequently claimed special services in 2016 were Infl uenza Vaccinations (422,629), Excisions (157,016) and E.C.G. treatments (154,930).
Annual and study leave together with locum, nursing and other practice support payments account for most of the €148,334,217 of allowances paid to GPs in 2016. The amount paid in 2015 was €141,659,008.
Payments to GPs in each CHO Area
Payments to General Practitioners 2016
Payments to GPs includes reimbursement of claims in respect of services provided to Medical Card and GP Visit Cardholders. Reimbursement of claims made
by GPs includes expenditure of €6,925,243 under the Primary Childhood Immunisation Scheme; €188,666 under the Health (Amendment) Act 1996;
€981,986 for Heartwatch; €12,140,908 for the National Cancer Screening Service and €7,729,027 under the Methadone Treatment Scheme.
CHO Area 1 €50,883,640
CHO Area 2 €59,302,236
CHO Area 3 €47,269,169
CHO Area 4 €87,066,973
CHO Area 5 €67,532,416
CHO Area 6 €39,870,240
CHO Area 7 €63,098,975
CHO Area 8 €70,330,614
CHO Area 9 €57,777,621
National €543,131,884
Corresponding fi gure for 2015 €489,694,823
Community Healthcare Organisation 2016
Fees €394.80m Allowances €148.33m
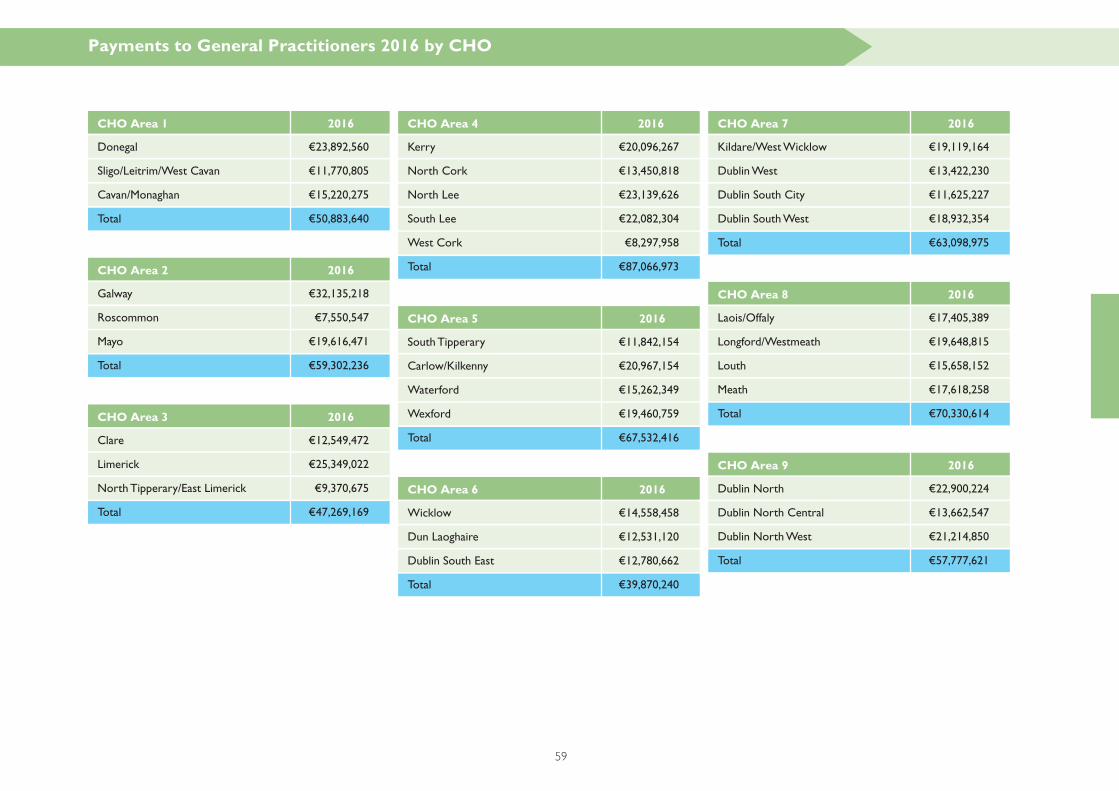
59
South Tipperary €11,842,154
Carlow/Kilkenny €20,967,154
Waterford €15,262,349
Wexford €19,460,759
Total €67,532,416
Wicklow €14,558,458
Dun Laoghaire €12,531,120
Dublin South East €12,780,662
Total €39,870,240
CHO Area 5 2016
CHO Area 6 2016
Payments to General Practitioners 2016 by CHO
Donegal €23,892,560
Sligo/Leitrim/West Cavan €11,770,805
Cavan/Monaghan €15,220,275
Total €50,883,640
Galway €32,135,218
Roscommon €7,550,547
Mayo €19,616,471
Total €59,302,236
Clare €12,549,472
Limerick €25,349,022
North Tipperary/East Limerick €9,370,675
Total €47,269,169
Kerry €20,096,267
North Cork €13,450,818
North Lee €23,139,626
South Lee €22,082,304
West Cork €8,297,958
Total €87,066,973
Kildare/West Wicklow €19,119,164
Dublin West €13,422,230
Dublin South City €11,625,227
Dublin South West €18,932,354
Total €63,098,975
Laois/Offaly €17,405,389
Longford/Westmeath €19,648,815
Louth €15,658,152
Meath €17,618,258
Total €70,330,614
Dublin North €22,900,224
Dublin North Central €13,662,547
Dublin North West €21,214,850
Total €57,777,621
CHO Area 1 2016
CHO Area 2 2016
CHO Area 3 2016
CHO Area 4 2016 CHO Area 7 2016
CHO Area 8 2016
CHO Area 9 2016
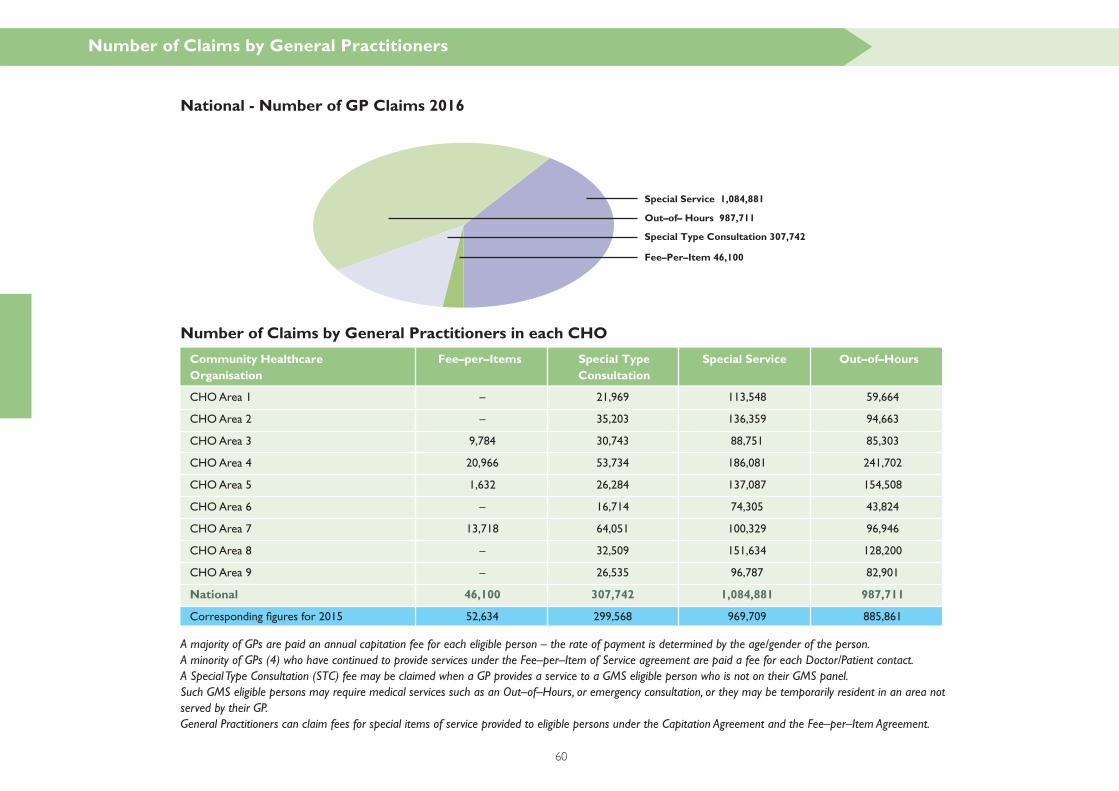
60
National - Number of GP Claims 2016
Number of Claims by General Practitioners in each CHO
Number of Claims by General Practitioners
A majority of GPs are paid an annual capitation fee for each eligible person – the rate of payment is determined by the age/gender of the person.A minority of GPs (4) who have continued to provide services under the Fee–per–Item of Service agreement are paid a fee for each Doctor/Patient contact. A Special Type Consultation (STC) fee may be claimed when a GP provides a service to a GMS eligible person who is not on their GMS panel. Such GMS eligible persons may require medical services such as an Out–of–Hours, or emergency consultation, or they may be temporarily resident in an area not served by their GP.General Practitioners can claim fees for special items of service provided to eligible persons under the Capitation Agreement and the Fee–per–Item Agreement.
CHO Area 1 – 21,969 113,548 59,664
CHO Area 2 – 35,203 136,359 94,663
CHO Area 3 9,784 30,743 88,751 85,303
CHO Area 4 20,966 53,734 186,081 241,702
CHO Area 5 1,632 26,284 137,087 154,508
CHO Area 6 – 16,714 74,305 43,824
CHO Area 7 13,718 64,051 100,329 96,946
CHO Area 8 – 32,509 151,634 128,200
CHO Area 9 – 26,535 96,787 82,901
National 46,100 307,742 1,084,881 987,711
Corresponding fi gures for 2015 52,634 299,568 969,709 885,861
Community Healthcare Fee–per–Items Special Type Special Service Out–of–HoursOrganisation Consultation
Fee–Per–Item 46,100
Special Service 1,084,881
Special Type Consultation 307,742
Out–of– Hours 987,711

61
CHO Area 1
CHO Area 2
CHO Area 3
Fee–per–Item Special ServiceSpecial TypeConsultation Out–of–Hours
Fee–per–Item Special ServiceSpecial TypeConsultation Out–of–Hours
Fee–per–Item Special ServiceSpecial TypeConsultation Out–of–Hours
Number of Claims by General Practitioners by CHO
Donegal – 12,752 55,629 43,670
Sligo/Leitrim/West Cavan – 4,956 28,447 11,135
Cavan/Monaghan – 4,261 29,472 4,859
Total – 21,969 113,548 59,664
Galway – 21,511 62,922 47,055
Roscommon – 3,041 23,326 10,404
Mayo – 10,651 50,111 37,204
Total – 35,203 136,359 94,663
Clare – 6,372 27,283 17,454
Limerick 9,784 21,472 45,042 52,265
North Tipperary/East Limerick – 2,899 16,426 15,584
Total 9,784 30,743 88,751 85,303

62
CHO Area 4
CHO Area 5
CHO Area 6
Fee–per–Item Special ServiceSpecial TypeConsultation Out–of–Hours
Fee–per–Item Special ServiceSpecial TypeConsultation Out–of–Hours
Fee–per–Item Special ServiceSpecial TypeConsultation Out–of–Hours
Number of Claims by General Practitioners by CHO continued
Kerry – 14,362 42,525 64,790
North Cork – 9,192 29,591 39,828
North Lee – 11,398 44,435 51,447
South Lee 20,966 13,204 51,594 62,581
West Cork – 5,578 17,936 23,056
Total 20,966 53,734 186,081 241,702
South Tipperary – 2,824 25,879 18,929
Carlow/Kilkenny – 11,271 34,992 94,567
Waterford 1,632 6,834 34,616 14,681
Wexford – 5,355 41,600 26,331
Total 1,632 26,284 137,087 154,508
Wicklow – 5,484 27,596 16,386
Dun Laoghaire – 4,532 24,328 13,275
Dublin South East – 6,698 22,381 14,163
Total – 16,714 74,305 43,824
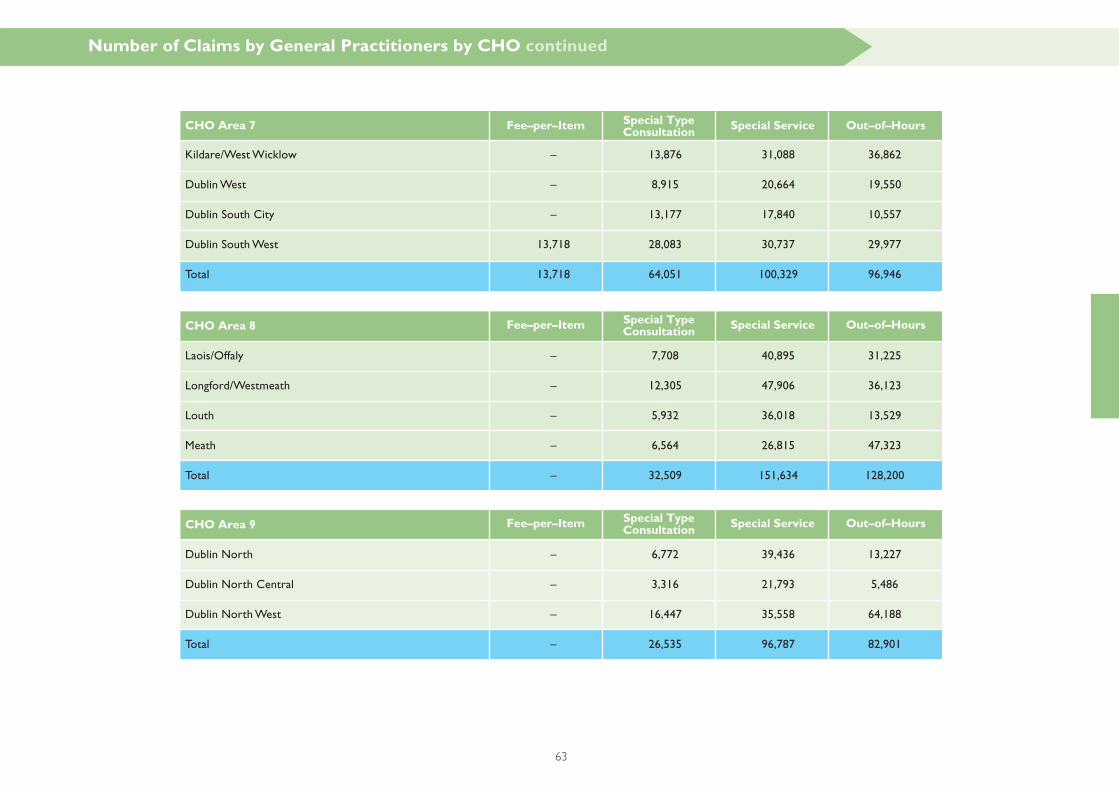
63
CHO Area 7
CHO Area 8
CHO Area 9
Fee–per–Item Special ServiceSpecial TypeConsultation Out–of–Hours
Fee–per–Item Special ServiceSpecial TypeConsultation Out–of–Hours
Fee–per–Item Special ServiceSpecial TypeConsultation Out–of–Hours
Number of Claims by General Practitioners by CHO continued
Kildare/West Wicklow – 13,876 31,088 36,862
Dublin West – 8,915 20,664 19,550
Dublin South City – 13,177 17,840 10,557
Dublin South West 13,718 28,083 30,737 29,977
Total 13,718 64,051 100,329 96,946
Laois/Offaly – 7,708 40,895 31,225
Longford/Westmeath – 12,305 47,906 36,123
Louth – 5,932 36,018 13,529
Meath – 6,564 26,815 47,323
Total – 32,509 151,634 128,200
Dublin North – 6,772 39,436 13,227
Dublin North Central – 3,316 21,793 5,486
Dublin North West – 16,447 35,558 64,188
Total – 26,535 96,787 82,901

64
€ €
FEES – Capitation 275,547,810 243,888,334
– Special Claims/Services 33,418,043 28,162,713
– Out–of–Hours 37,807,578 33,916,785
– Dispensing 1,167,766 1,292,149
– Item of Service Contract 565,305 660,304
– Asylum Seekers 374,649 340,085
– Vaccinations 7,579,123 6,665,493
– Asthma Registration 481,350 939,950
– Asthma Capitation 1,624,891 469,545
– Contribution for GP Height Measure and Self Zeroing Scales 73,248 –
– Diabetes Capitation 7,430,644 1,202,883
– Diabetes Registration 761,430 1,776,210
ALLOWANCES – Secretarial/Nursing 85,307,443 81,573,574
– Annual Leave 10,148,270 10,046,789
– Rostering/Out–of–Hours 5,964,666 8,759,311
– Medical Indemnity Insurance 7,168,851 5,472,172
– Rural Practice 3,985,547 2,741,048
– Study Leave 2,116,141 2,577,798
– Sick Leave 1,358,424 1,453,415
– Maternity Leave/Paternity Leave 1,593,718 1,830,462
– Locum and Practice Expenses 5,484 5,827
SALARIES – Benefi ts to retired DMOs and their dependants 3,000,931 3,306,369
– Former District Medical Offi cers 1,341,918 1,341,918
SUPERANNUATION FUND – Contribution 29,343,755 25,856,694
TOTAL €518,166,985 €464,279,828
2016 2015
Table 13 GMS: Payments to General Practitioners
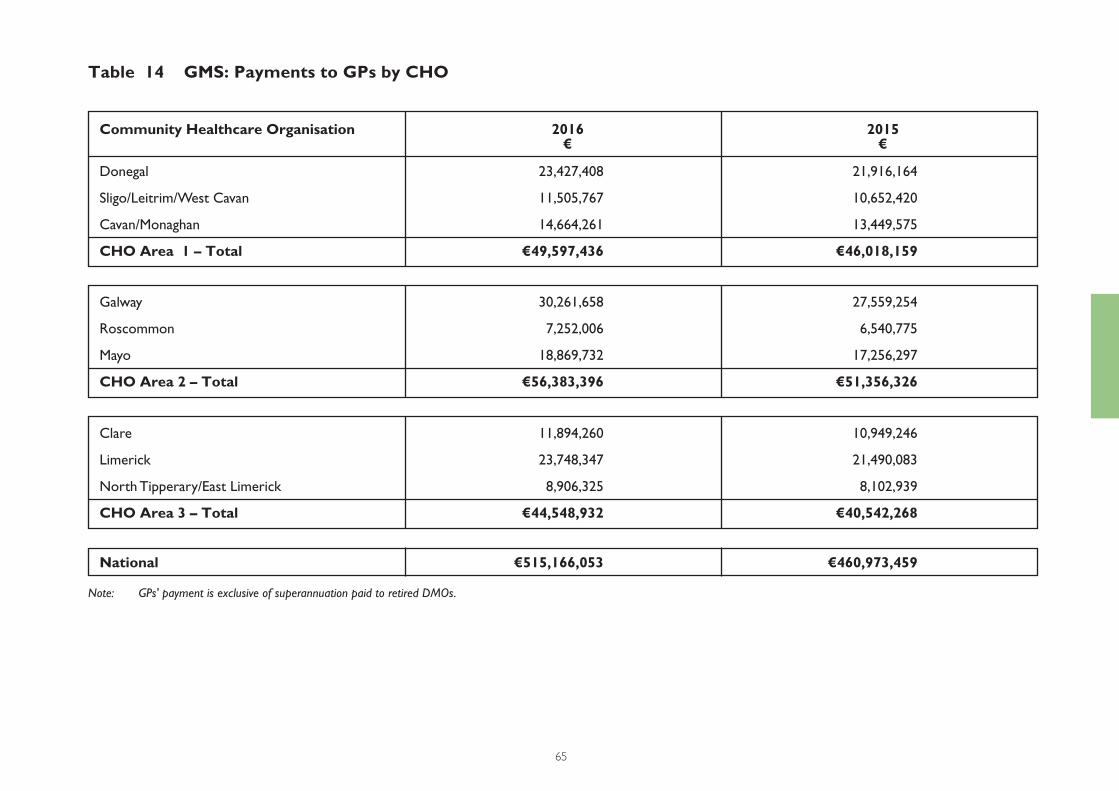
65
Note: GPs' payment is exclusive of superannuation paid to retired DMOs.
Donegal 23,427,408 21,916,164
Sligo/Leitrim/West Cavan 11,505,767 10,652,420
Cavan/Monaghan 14,664,261 13,449,575
CHO Area 1 – Total €49,597,436 €46,018,159
Galway 30,261,658 27,559,254
Roscommon 7,252,006 6,540,775
Mayo 18,869,732 17,256,297
CHO Area 2 – Total €56,383,396 €51,356,326
Clare 11,894,260 10,949,246
Limerick 23,748,347 21,490,083
North Tipperary/East Limerick 8,906,325 8,102,939
CHO Area 3 – Total €44,548,932 €40,542,268
National €515,166,053 €460,973,459
Community Healthcare Organisation 2016 2015 € €
Table 14 GMS: Payments to GPs by CHO
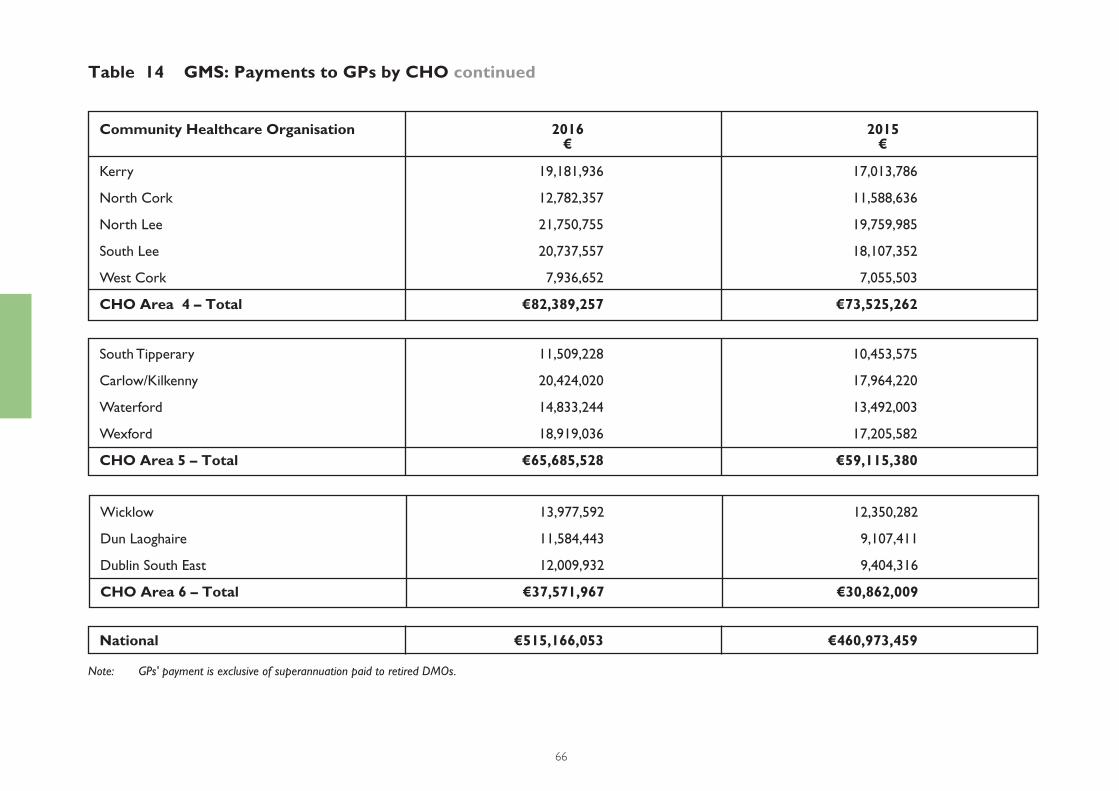
66
Note: GPs' payment is exclusive of superannuation paid to retired DMOs.
Wicklow 13,977,592 12,350,282
Dun Laoghaire 11,584,443 9,107,411
Dublin South East 12,009,932 9,404,316
CHO Area 6 – Total €37,571,967 €30,862,009
Kerry 19,181,936 17,013,786
North Cork 12,782,357 11,588,636
North Lee 21,750,755 19,759,985
South Lee 20,737,557 18,107,352
West Cork 7,936,652 7,055,503
CHO Area 4 – Total €82,389,257 €73,525,262
South Tipperary 11,509,228 10,453,575
Carlow/Kilkenny 20,424,020 17,964,220
Waterford 14,833,244 13,492,003
Wexford 18,919,036 17,205,582
CHO Area 5 – Total €65,685,528 €59,115,380
National €515,166,053 €460,973,459
Community Healthcare Organisation 2016 2015 € €
Table 14 GMS: Payments to GPs by CHO continued
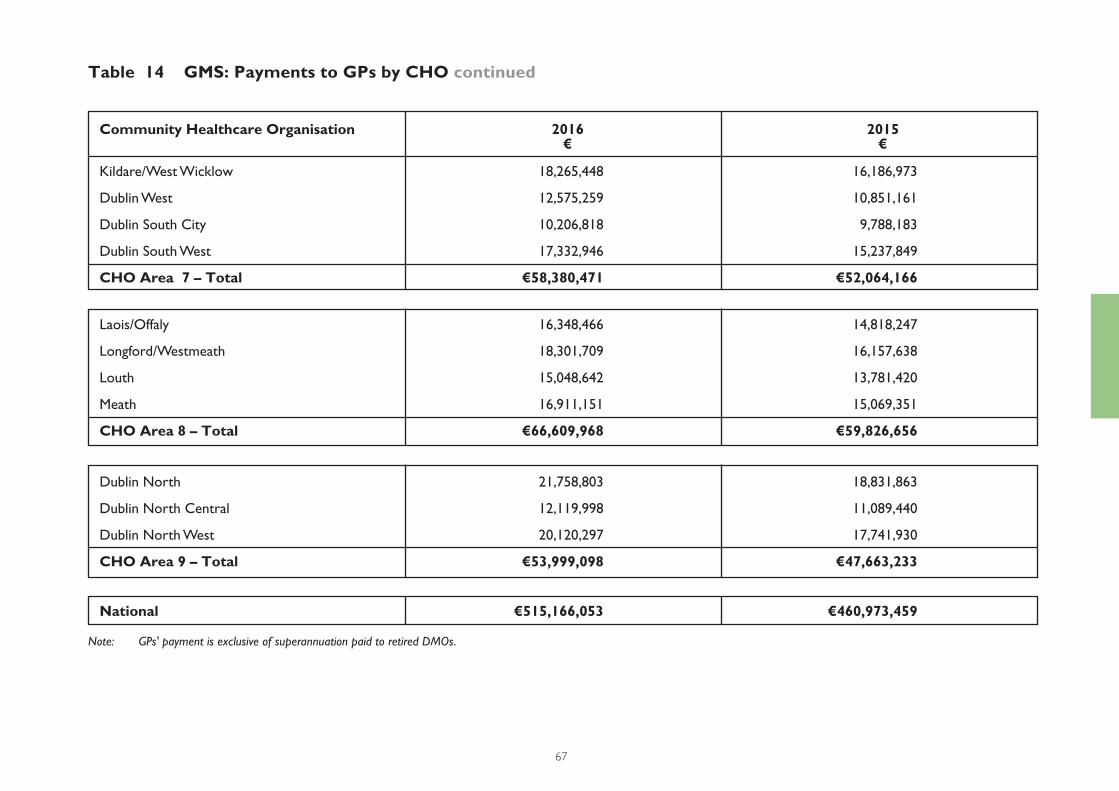
67
Note: GPs' payment is exclusive of superannuation paid to retired DMOs.
Kildare/West Wicklow 18,265,448 16,186,973
Dublin West 12,575,259 10,851,161
Dublin South City 10,206,818 9,788,183
Dublin South West 17,332,946 15,237,849
CHO Area 7 – Total €58,380,471 €52,064,166
Dublin North 21,758,803 18,831,863
Dublin North Central 12,119,998 11,089,440
Dublin North West 20,120,297 17,741,930
CHO Area 9 – Total €53,999,098 €47,663,233
Laois/Offaly 16,348,466 14,818,247
Longford/Westmeath 18,301,709 16,157,638
Louth 15,048,642 13,781,420
Meath 16,911,151 15,069,351
CHO Area 8 – Total €66,609,968 €59,826,656
National €515,166,053 €460,973,459
Community Healthcare Organisation 2016 2015 € €
Table 14 GMS: Payments to GPs by CHO continued
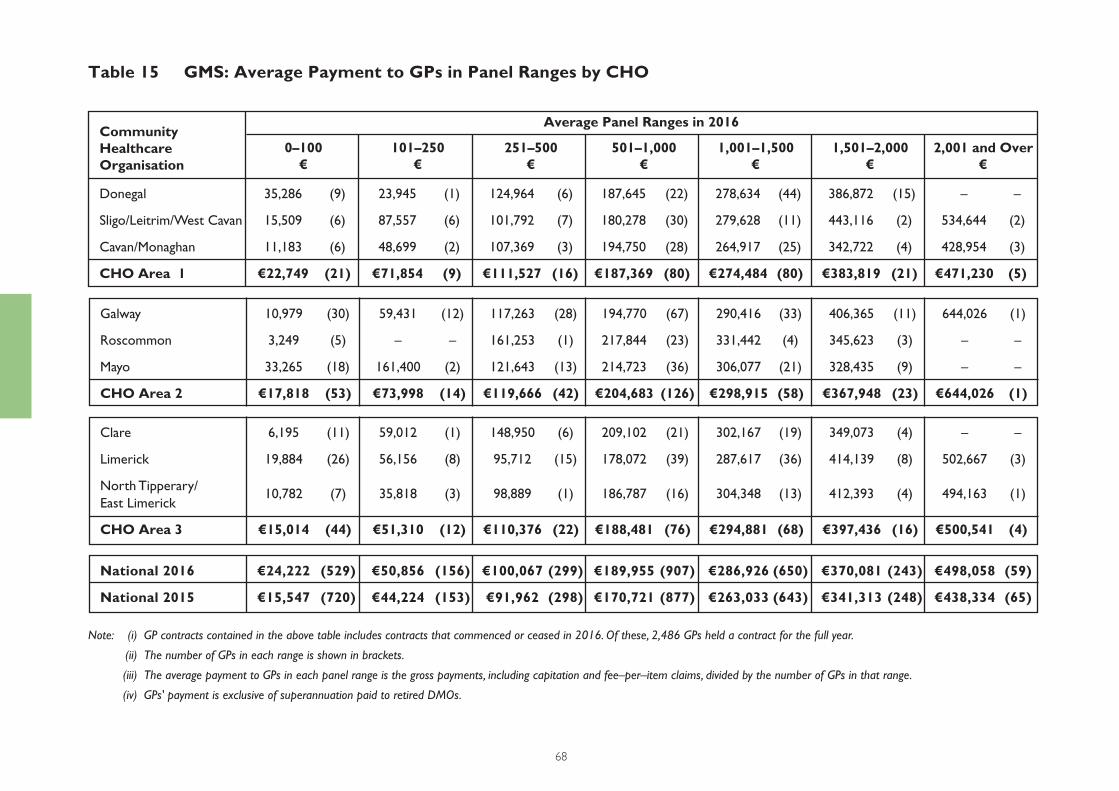
68
Note: (i) GP contracts contained in the above table includes contracts that commenced or ceased in 2016. Of these, 2,486 GPs held a contract for the full year.
(ii) The number of GPs in each range is shown in brackets.
(iii) The average payment to GPs in each panel range is the gross payments, including capitation and fee–per–item claims, divided by the number of GPs in that range.
(iv) GPs' payment is exclusive of superannuation paid to retired DMOs.
Table 15 GMS: Average Payment to GPs in Panel Ranges by CHO
Average Panel Ranges in 2016
Donegal 35,286 (9) 23,945 (1) 124,964 (6) 187,645 (22) 278,634 (44) 386,872 (15) – –
Sligo/Leitrim/West Cavan 15,509 (6) 87,557 (6) 101,792 (7) 180,278 (30) 279,628 (11) 443,116 (2) 534,644 (2)
Cavan/Monaghan 11,183 (6) 48,699 (2) 107,369 (3) 194,750 (28) 264,917 (25) 342,722 (4) 428,954 (3)
CHO Area 1 €22,749 (21) €71,854 (9) €111,527 (16) €187,369 (80) €274,484 (80) €383,819 (21) €471,230 (5)
0–100 101–250 251–500 501–1,000 1,001–1,500 1,501–2,000 2,001 and Over € € € € € € €
CommunityHealthcareOrganisation
National 2016 €24,222 (529) €50,856 (156) €100,067 (299) €189,955 (907) €286,926 (650) €370,081 (243) €498,058 (59)
National 2015 €15,547 (720) €44,224 (153) €91,962 (298) €170,721 (877) €263,033 (643) €341,313 (248) €438,334 (65)
Galway 10,979 (30) 59,431 (12) 117,263 (28) 194,770 (67) 290,416 (33) 406,365 (11) 644,026 (1)
Roscommon 3,249 (5) – – 161,253 (1) 217,844 (23) 331,442 (4) 345,623 (3) – –
Mayo 33,265 (18) 161,400 (2) 121,643 (13) 214,723 (36) 306,077 (21) 328,435 (9) – –
CHO Area 2 €17,818 (53) €73,998 (14) €119,666 (42) €204,683 (126) €298,915 (58) €367,948 (23) €644,026 (1)
Clare 6,195 (11) 59,012 (1) 148,950 (6) 209,102 (21) 302,167 (19) 349,073 (4) – –
Limerick 19,884 (26) 56,156 (8) 95,712 (15) 178,072 (39) 287,617 (36) 414,139 (8) 502,667 (3)
North Tipperary/
East Limerick 10,782 (7) 35,818 (3) 98,889 (1) 186,787 (16) 304,348 (13) 412,393 (4) 494,163 (1)
CHO Area 3 €15,014 (44) €51,310 (12) €110,376 (22) €188,481 (76) €294,881 (68) €397,436 (16) €500,541 (4)
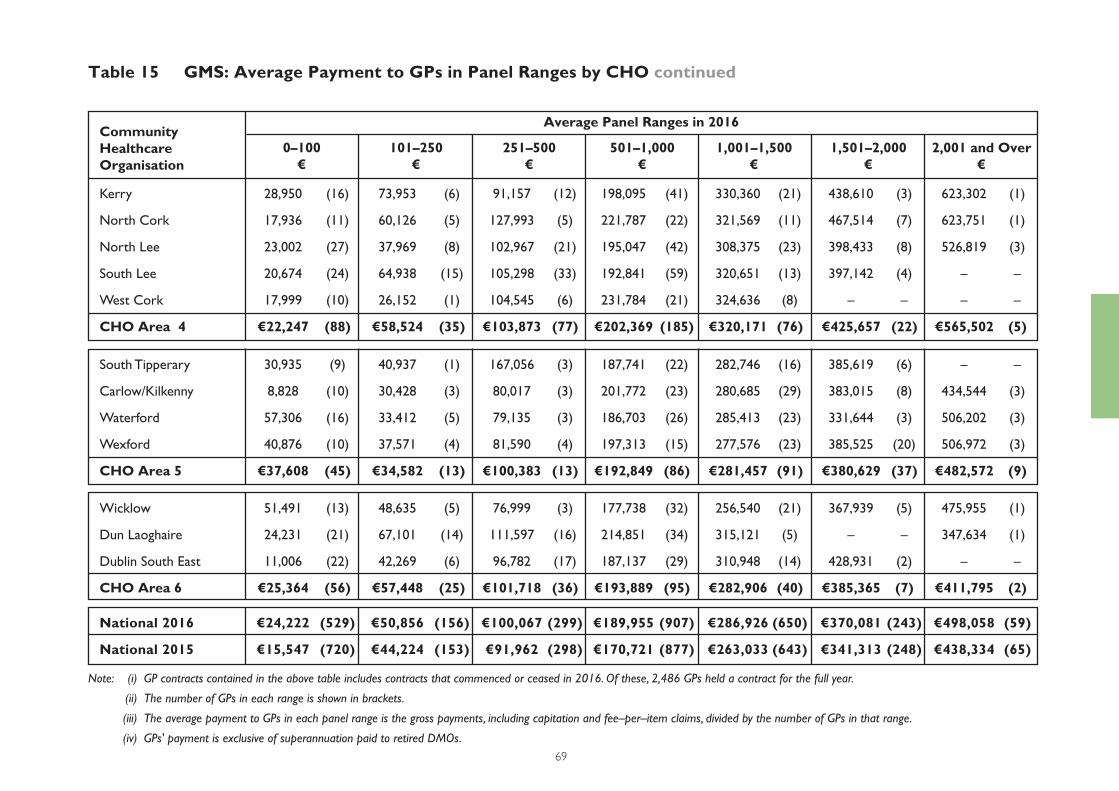
69
Note: (i) GP contracts contained in the above table includes contracts that commenced or ceased in 2016. Of these, 2,486 GPs held a contract for the full year.
(ii) The number of GPs in each range is shown in brackets.
(iii) The average payment to GPs in each panel range is the gross payments, including capitation and fee–per–item claims, divided by the number of GPs in that range.
(iv) GPs' payment is exclusive of superannuation paid to retired DMOs.
Average Panel Ranges in 2016
Table 15 GMS: Average Payment to GPs in Panel Ranges by CHO continued
Kerry 28,950 (16) 73,953 (6) 91,157 (12) 198,095 (41) 330,360 (21) 438,610 (3) 623,302 (1)
North Cork 17,936 (11) 60,126 (5) 127,993 (5) 221,787 (22) 321,569 (11) 467,514 (7) 623,751 (1)
North Lee 23,002 (27) 37,969 (8) 102,967 (21) 195,047 (42) 308,375 (23) 398,433 (8) 526,819 (3)
South Lee 20,674 (24) 64,938 (15) 105,298 (33) 192,841 (59) 320,651 (13) 397,142 (4) – –
West Cork 17,999 (10) 26,152 (1) 104,545 (6) 231,784 (21) 324,636 (8) – – – –
CHO Area 4 €22,247 (88) €58,524 (35) €103,873 (77) €202,369 (185) €320,171 (76) €425,657 (22) €565,502 (5)
National 2016 €24,222 (529) €50,856 (156) €100,067 (299) €189,955 (907) €286,926 (650) €370,081 (243) €498,058 (59)
National 2015 €15,547 (720) €44,224 (153) €91,962 (298) €170,721 (877) €263,033 (643) €341,313 (248) €438,334 (65)
South Tipperary 30,935 (9) 40,937 (1) 167,056 (3) 187,741 (22) 282,746 (16) 385,619 (6) – –
Carlow/Kilkenny 8,828 (10) 30,428 (3) 80,017 (3) 201,772 (23) 280,685 (29) 383,015 (8) 434,544 (3)
Waterford 57,306 (16) 33,412 (5) 79,135 (3) 186,703 (26) 285,413 (23) 331,644 (3) 506,202 (3)
Wexford 40,876 (10) 37,571 (4) 81,590 (4) 197,313 (15) 277,576 (23) 385,525 (20) 506,972 (3)
CHO Area 5 €37,608 (45) €34,582 (13) €100,383 (13) €192,849 (86) €281,457 (91) €380,629 (37) €482,572 (9)
Wicklow 51,491 (13) 48,635 (5) 76,999 (3) 177,738 (32) 256,540 (21) 367,939 (5) 475,955 (1)
Dun Laoghaire 24,231 (21) 67,101 (14) 111,597 (16) 214,851 (34) 315,121 (5) – – 347,634 (1)
Dublin South East 11,006 (22) 42,269 (6) 96,782 (17) 187,137 (29) 310,948 (14) 428,931 (2) – –
CHO Area 6 €25,364 (56) €57,448 (25) €101,718 (36) €193,889 (95) €282,906 (40) €385,365 (7) €411,795 (2)
0–100 101–250 251–500 501–1,000 1,001–1,500 1,501–2,000 2,001 and Over € € € € € € €
CommunityHealthcareOrganisation
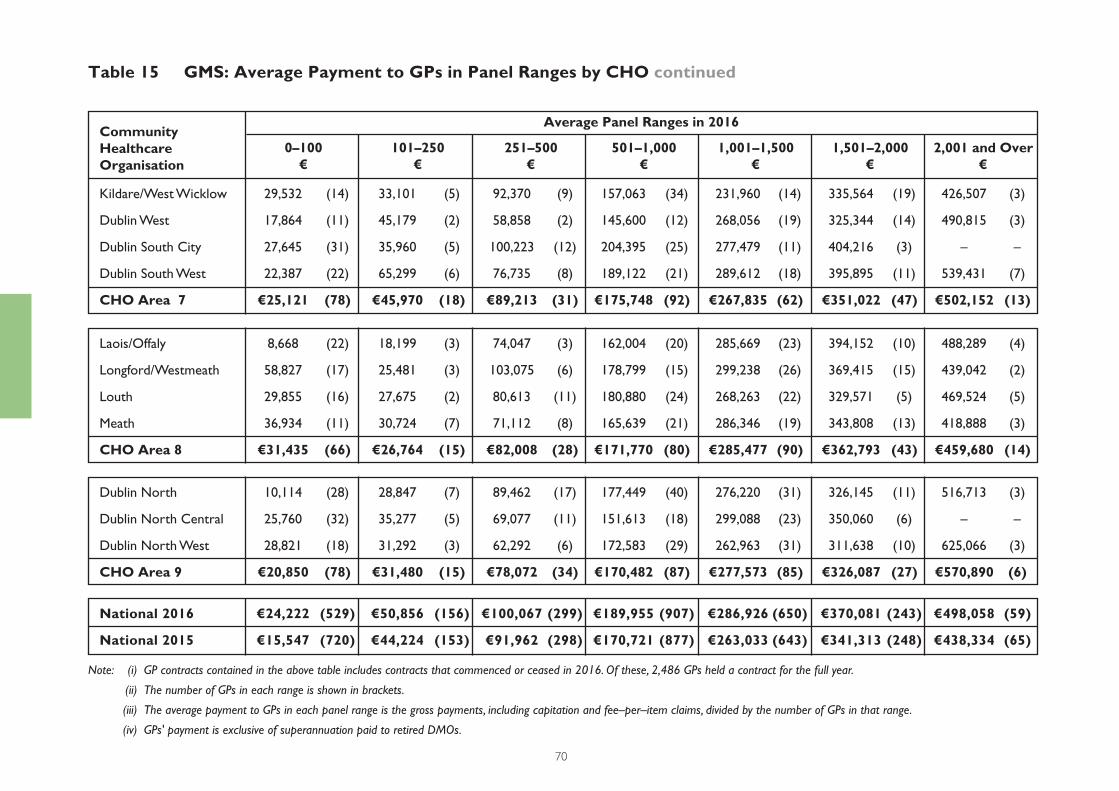
70
Note: (i) GP contracts contained in the above table includes contracts that commenced or ceased in 2016. Of these, 2,486 GPs held a contract for the full year.
(ii) The number of GPs in each range is shown in brackets.
(iii) The average payment to GPs in each panel range is the gross payments, including capitation and fee–per–item claims, divided by the number of GPs in that range.
(iv) GPs' payment is exclusive of superannuation paid to retired DMOs.
Average Panel Ranges in 2016
Table 15 GMS: Average Payment to GPs in Panel Ranges by CHO continued
Kildare/West Wicklow 29,532 (14) 33,101 (5) 92,370 (9) 157,063 (34) 231,960 (14) 335,564 (19) 426,507 (3)
Dublin West 17,864 (11) 45,179 (2) 58,858 (2) 145,600 (12) 268,056 (19) 325,344 (14) 490,815 (3)
Dublin South City 27,645 (31) 35,960 (5) 100,223 (12) 204,395 (25) 277,479 (11) 404,216 (3) – –
Dublin South West 22,387 (22) 65,299 (6) 76,735 (8) 189,122 (21) 289,612 (18) 395,895 (11) 539,431 (7)
CHO Area 7 €25,121 (78) €45,970 (18) €89,213 (31) €175,748 (92) €267,835 (62) €351,022 (47) €502,152 (13)
National 2016 €24,222 (529) €50,856 (156) €100,067 (299) €189,955 (907) €286,926 (650) €370,081 (243) €498,058 (59)
National 2015 €15,547 (720) €44,224 (153) €91,962 (298) €170,721 (877) €263,033 (643) €341,313 (248) €438,334 (65)
Laois/Offaly 8,668 (22) 18,199 (3) 74,047 (3) 162,004 (20) 285,669 (23) 394,152 (10) 488,289 (4)
Longford/Westmeath 58,827 (17) 25,481 (3) 103,075 (6) 178,799 (15) 299,238 (26) 369,415 (15) 439,042 (2)
Louth 29,855 (16) 27,675 (2) 80,613 (11) 180,880 (24) 268,263 (22) 329,571 (5) 469,524 (5)
Meath 36,934 (11) 30,724 (7) 71,112 (8) 165,639 (21) 286,346 (19) 343,808 (13) 418,888 (3)
CHO Area 8 €31,435 (66) €26,764 (15) €82,008 (28) €171,770 (80) €285,477 (90) €362,793 (43) €459,680 (14)
Dublin North 10,114 (28) 28,847 (7) 89,462 (17) 177,449 (40) 276,220 (31) 326,145 (11) 516,713 (3)
Dublin North Central 25,760 (32) 35,277 (5) 69,077 (11) 151,613 (18) 299,088 (23) 350,060 (6) – –
Dublin North West 28,821 (18) 31,292 (3) 62,292 (6) 172,583 (29) 262,963 (31) 311,638 (10) 625,066 (3)
CHO Area 9 €20,850 (78) €31,480 (15) €78,072 (34) €170,482 (87) €277,573 (85) €326,087 (27) €570,890 (6)
0–100 101–250 251–500 501–1,000 1,001–1,500 1,501–2,000 2,001 and Over € € € € € € €
CommunityHealthcareOrganisation
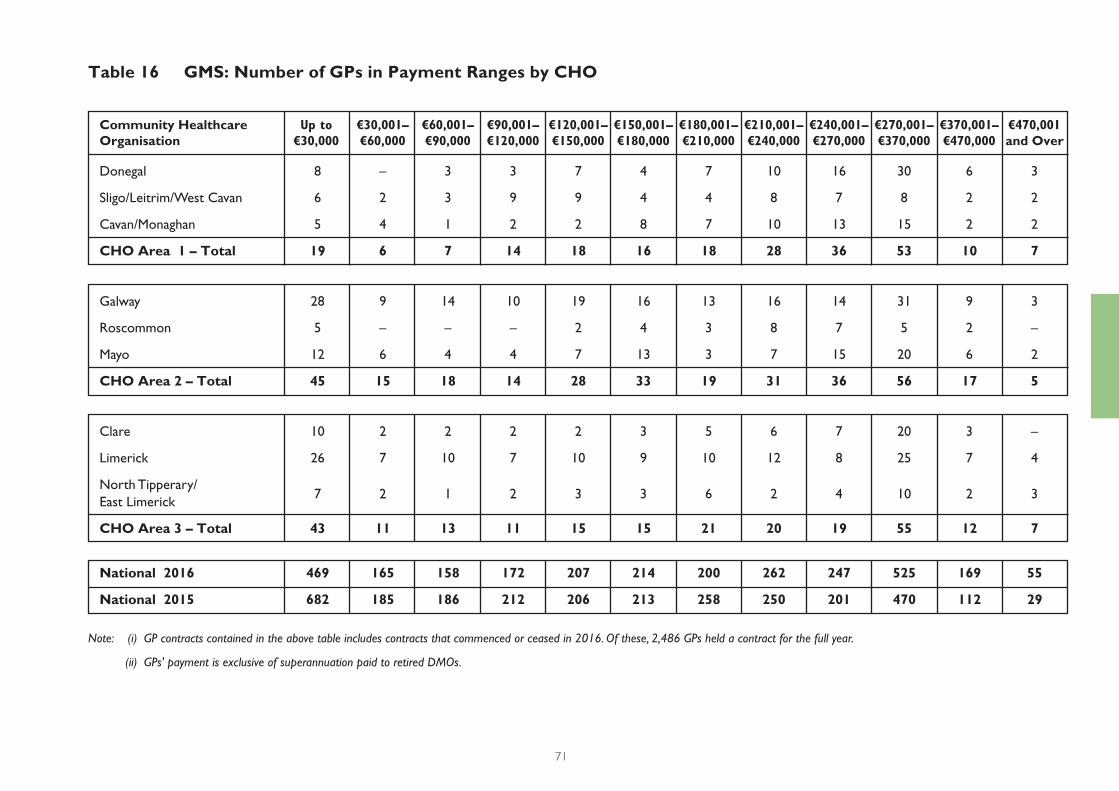
71
Note: (i) GP contracts contained in the above table includes contracts that commenced or ceased in 2016. Of these, 2,486 GPs held a contract for the full year.
(ii) GPs' payment is exclusive of superannuation paid to retired DMOs.
Table 16 GMS: Number of GPs in Payment Ranges by CHO
Donegal 8 – 3 3 7 4 7 10 16 30 6 3
Sligo/Leitrim/West Cavan 6 2 3 9 9 4 4 8 7 8 2 2
Cavan/Monaghan 5 4 1 2 2 8 7 10 13 15 2 2
CHO Area 1 – Total 19 6 7 14 18 16 18 28 36 53 10 7
Galway 28 9 14 10 19 16 13 16 14 31 9 3
Roscommon 5 – – – 2 4 3 8 7 5 2 –
Mayo 12 6 4 4 7 13 3 7 15 20 6 2
CHO Area 2 – Total 45 15 18 14 28 33 19 31 36 56 17 5
National 2016 469 165 158 172 207 214 200 262 247 525 169 55
National 2015 682 185 186 212 206 213 258 250 201 470 112 29
Clare 10 2 2 2 2 3 5 6 7 20 3 –
Limerick 26 7 10 7 10 9 10 12 8 25 7 4
North Tipperary/
East Limerick 7 2 1 2 3 3 6 2 4 10 2 3
CHO Area 3 – Total 43 11 13 11 15 15 21 20 19 55 12 7
Community Healthcare Up to €30,001– €60,001– €90,001– €120,001– €150,001– €180,001– €210,001– €240,001– €270,001– €370,001– €470,001
Organisation €30,000 €60,000 €90,000 €120,000 €150,000 €180,000 €210,000 €240,000 €270,000 €370,000 €470,000 and Over
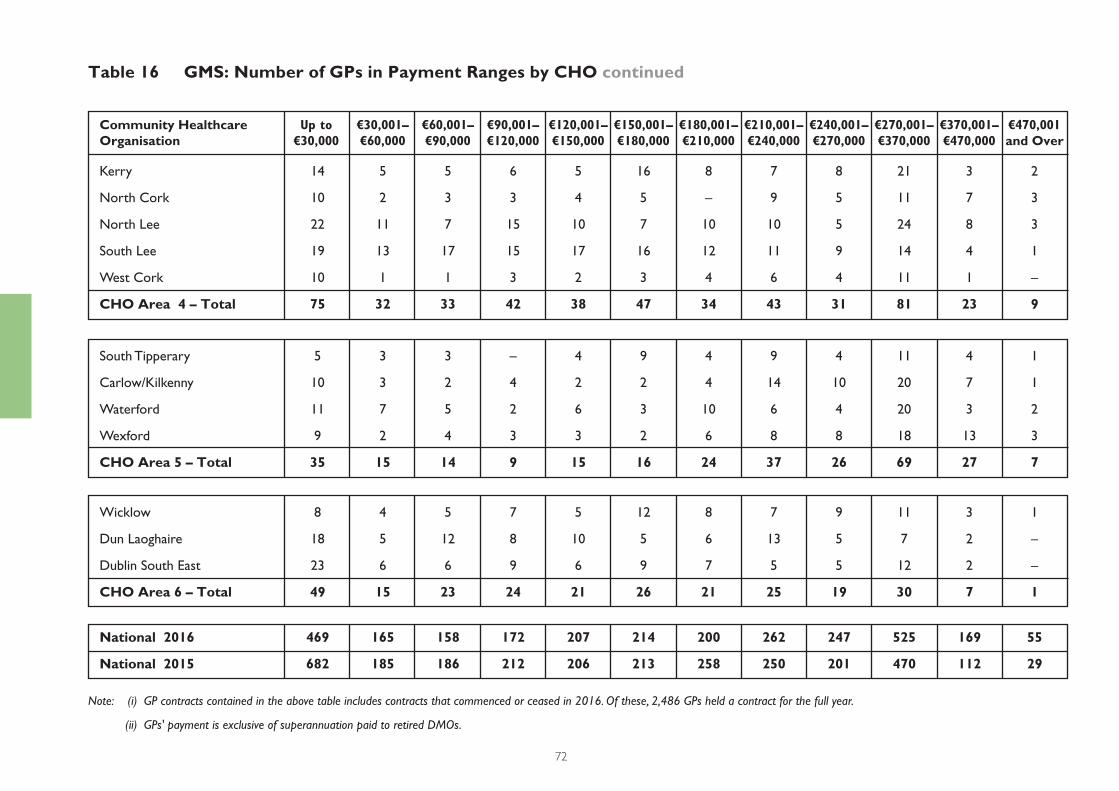
72
Note: (i) GP contracts contained in the above table includes contracts that commenced or ceased in 2016. Of these, 2,486 GPs held a contract for the full year.
(ii) GPs' payment is exclusive of superannuation paid to retired DMOs.
Wicklow 8 4 5 7 5 12 8 7 9 11 3 1
Dun Laoghaire 18 5 12 8 10 5 6 13 5 7 2 –
Dublin South East 23 6 6 9 6 9 7 5 5 12 2 –
CHO Area 6 – Total 49 15 23 24 21 26 21 25 19 30 7 1
Table 16 GMS: Number of GPs in Payment Ranges by CHO continued
Kerry 14 5 5 6 5 16 8 7 8 21 3 2
North Cork 10 2 3 3 4 5 – 9 5 11 7 3
North Lee 22 11 7 15 10 7 10 10 5 24 8 3
South Lee 19 13 17 15 17 16 12 11 9 14 4 1
West Cork 10 1 1 3 2 3 4 6 4 11 1 –
CHO Area 4 – Total 75 32 33 42 38 47 34 43 31 81 23 9
South Tipperary 5 3 3 – 4 9 4 9 4 11 4 1
Carlow/Kilkenny 10 3 2 4 2 2 4 14 10 20 7 1
Waterford 11 7 5 2 6 3 10 6 4 20 3 2
Wexford 9 2 4 3 3 2 6 8 8 18 13 3
CHO Area 5 – Total 35 15 14 9 15 16 24 37 26 69 27 7
National 2016 469 165 158 172 207 214 200 262 247 525 169 55
National 2015 682 185 186 212 206 213 258 250 201 470 112 29
Community Healthcare Up to €30,001– €60,001– €90,001– €120,001– €150,001– €180,001– €210,001– €240,001– €270,001– €370,001– €470,001
Organisation €30,000 €60,000 €90,000 €120,000 €150,000 €180,000 €210,000 €240,000 €270,000 €370,000 €470,000 and Over
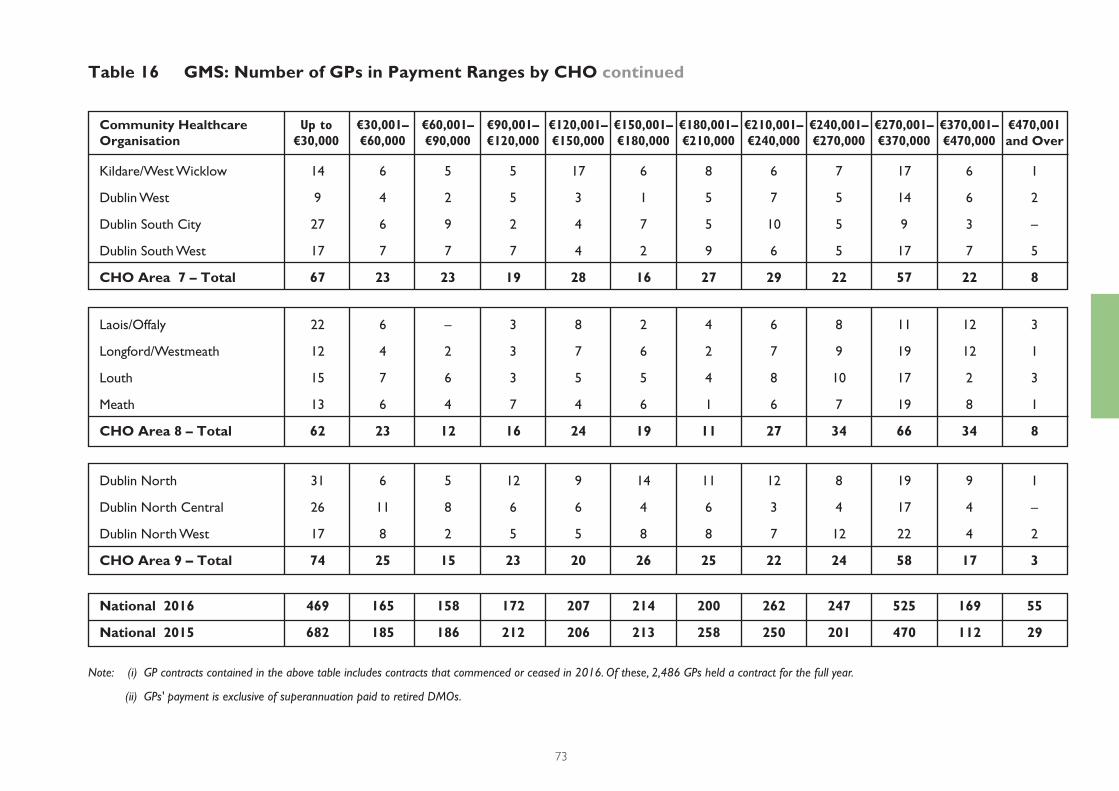
73
Note: (i) GP contracts contained in the above table includes contracts that commenced or ceased in 2016. Of these, 2,486 GPs held a contract for the full year.
(ii) GPs' payment is exclusive of superannuation paid to retired DMOs.
Laois/Offaly 22 6 – 3 8 2 4 6 8 11 12 3
Longford/Westmeath 12 4 2 3 7 6 2 7 9 19 12 1
Louth 15 7 6 3 5 5 4 8 10 17 2 3
Meath 13 6 4 7 4 6 1 6 7 19 8 1
CHO Area 8 – Total 62 23 12 16 24 19 11 27 34 66 34 8
Table 16 GMS: Number of GPs in Payment Ranges by CHO continued
Dublin North 31 6 5 12 9 14 11 12 8 19 9 1
Dublin North Central 26 11 8 6 6 4 6 3 4 17 4 –
Dublin North West 17 8 2 5 5 8 8 7 12 22 4 2
CHO Area 9 – Total 74 25 15 23 20 26 25 22 24 58 17 3
Community Healthcare Up to €30,001– €60,001– €90,001– €120,001– €150,001– €180,001– €210,001– €240,001– €270,001– €370,001– €470,001
Organisation €30,000 €60,000 €90,000 €120,000 €150,000 €180,000 €210,000 €240,000 €270,000 €370,000 €470,000 and Over
Kildare/West Wicklow 14 6 5 5 17 6 8 6 7 17 6 1
Dublin West 9 4 2 5 3 1 5 7 5 14 6 2
Dublin South City 27 6 9 2 4 7 5 10 5 9 3 –
Dublin South West 17 7 7 7 4 2 9 6 5 17 7 5
CHO Area 7 – Total 67 23 23 19 28 16 27 29 22 57 22 8
National 2016 469 165 158 172 207 214 200 262 247 525 169 55
National 2015 682 185 186 212 206 213 258 250 201 470 112 29
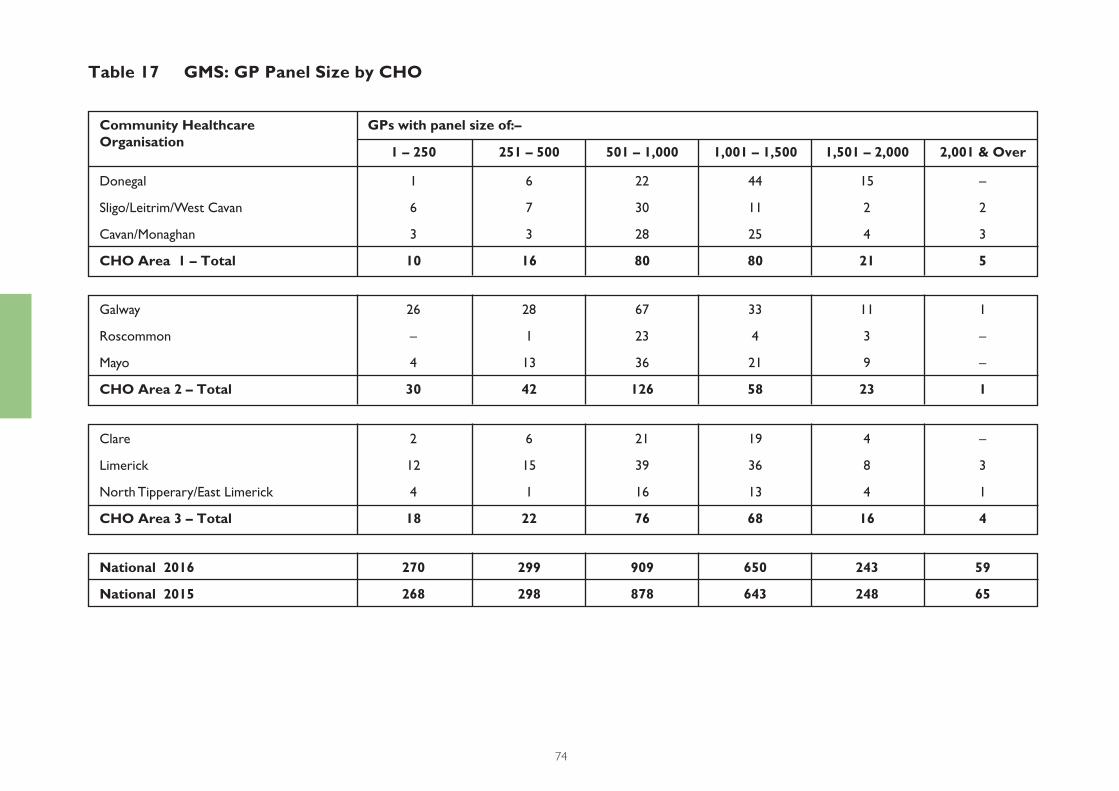
74
Table 17 GMS: GP Panel Size by CHO
Donegal 1 6 22 44 15 –
Sligo/Leitrim/West Cavan 6 7 30 11 2 2
Cavan/Monaghan 3 3 28 25 4 3
CHO Area 1 – Total 10 16 80 80 21 5
Galway 26 28 67 33 11 1
Roscommon – 1 23 4 3 –
Mayo 4 13 36 21 9 –
CHO Area 2 – Total 30 42 126 58 23 1
Clare 2 6 21 19 4 –
Limerick 12 15 39 36 8 3
North Tipperary/East Limerick 4 1 16 13 4 1
CHO Area 3 – Total 18 22 76 68 16 4
National 2016 270 299 909 650 243 59
National 2015 268 298 878 643 248 65
1 – 250 251 – 500 501 – 1,000 1,001 – 1,500 1,501 – 2,000 2,001 & Over
Community HealthcareOrganisation
GPs with panel size of:–

75
Table 17 GMS: GP Panel Size by CHO continued
Kerry 9 12 42 21 3 1
North Cork 8 5 22 11 7 1
North Lee 17 21 42 23 8 3
South Lee 23 33 59 13 4 –
West Cork 4 6 21 8 – –
CHO Area 4 – Total 61 77 186 76 22 5
South Tipperary 1 3 22 16 6 –
Carlow/Kilkenny 6 3 23 29 8 3
Waterford 6 3 26 23 3 3
Wexford 4 4 15 23 20 3
CHO Area 5 – Total 17 13 86 91 37 9
Wicklow 8 3 32 21 5 1
Dun Laoghaire 16 16 34 5 – 1
Dublin South East 10 17 29 14 2 –
CHO Area 6 – Total 34 36 95 40 7 2
1 – 250 251 – 500 501 – 1,000 1,001 – 1,500 1,501 – 2,000 2,001 & Over
Community HealthcareOrganisation
GPs with panel size of:–
National 2016 270 299 909 650 243 59
National 2015 268 298 878 643 248 65
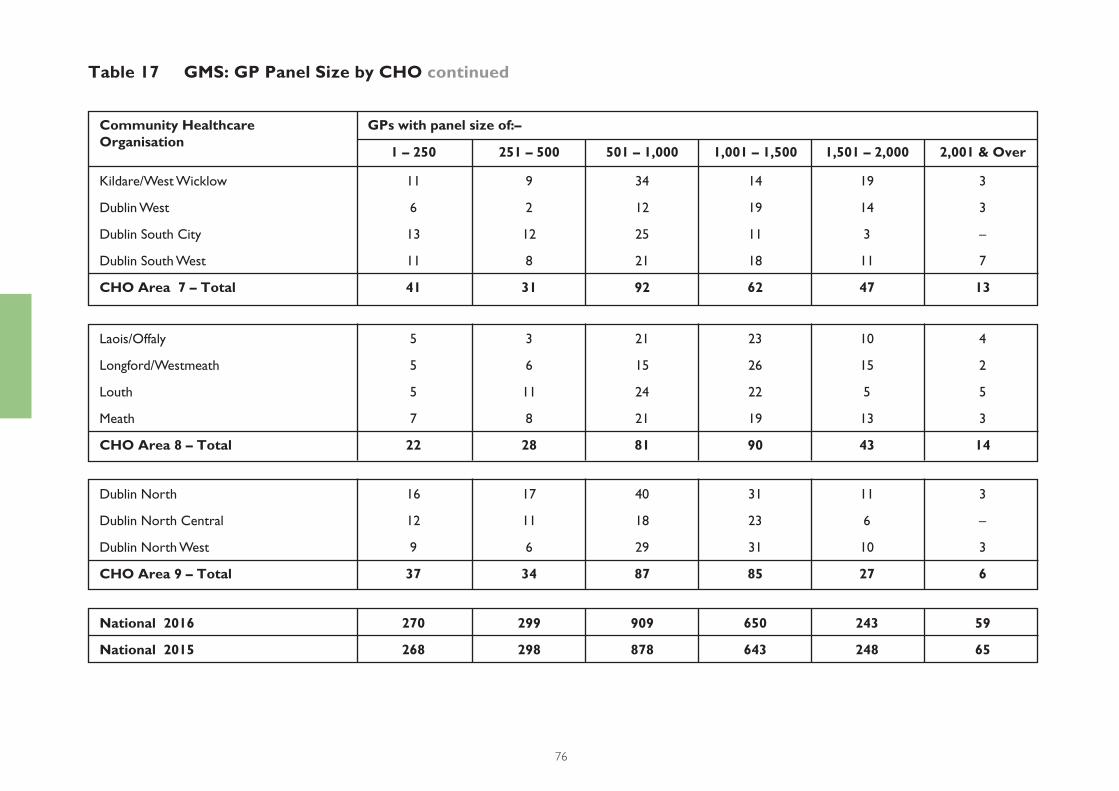
76
Table 17 GMS: GP Panel Size by CHO continued
Kildare/West Wicklow 11 9 34 14 19 3
Dublin West 6 2 12 19 14 3
Dublin South City 13 12 25 11 3 –
Dublin South West 11 8 21 18 11 7
CHO Area 7 – Total 41 31 92 62 47 13
Laois/Offaly 5 3 21 23 10 4
Longford/Westmeath 5 6 15 26 15 2
Louth 5 11 24 22 5 5
Meath 7 8 21 19 13 3
CHO Area 8 – Total 22 28 81 90 43 14
Dublin North 16 17 40 31 11 3
Dublin North Central 12 11 18 23 6 –
Dublin North West 9 6 29 31 10 3
CHO Area 9 – Total 37 34 87 85 27 6
1 – 250 251 – 500 501 – 1,000 1,001 – 1,500 1,501 – 2,000 2,001 & Over
Community HealthcareOrganisation
GPs with panel size of:–
National 2016 270 299 909 650 243 59
National 2015 268 298 878 643 248 65
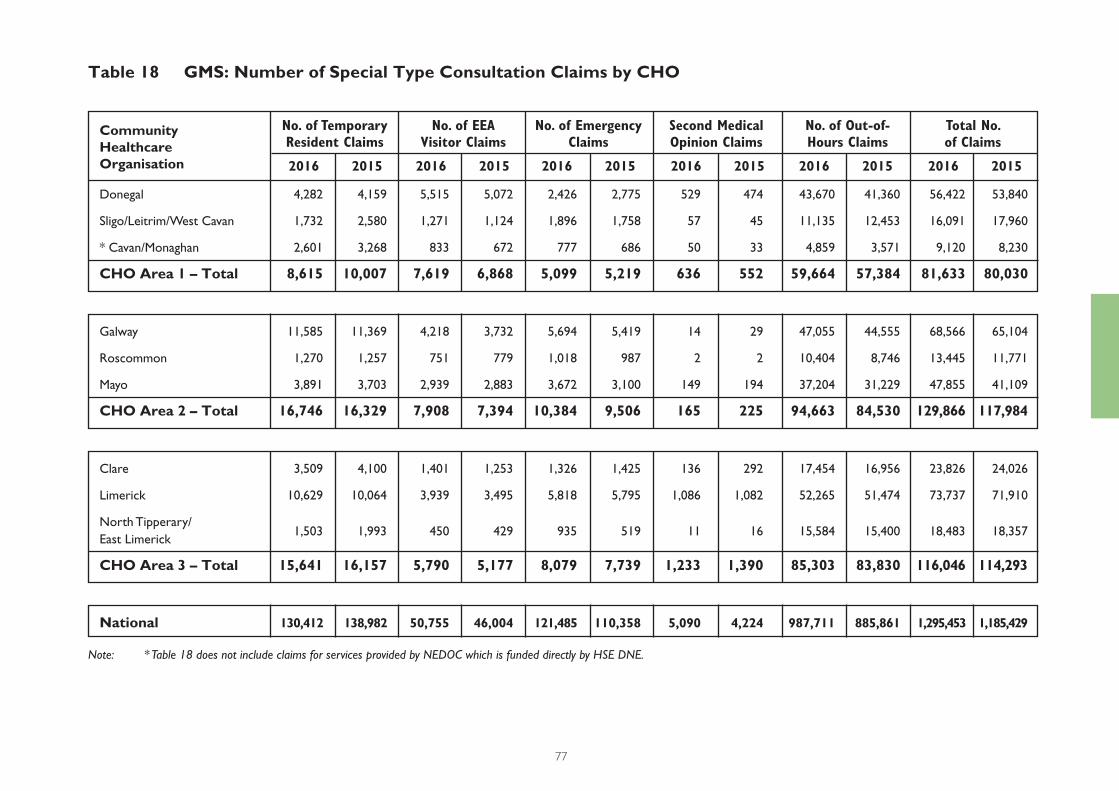
77
Table 18 GMS: Number of Special Type Consultation Claims by CHO
Donegal 4,282 4,159 5,515 5,072 2,426 2,775 529 474 43,670 41,360 56,422 53,840
Sligo/Leitrim/West Cavan 1,732 2,580 1,271 1,124 1,896 1,758 57 45 11,135 12,453 16,091 17,960
* Cavan/Monaghan 2,601 3,268 833 672 777 686 50 33 4,859 3,571 9,120 8,230
CHO Area 1 – Total 8,615 10,007 7,619 6,868 5,099 5,219 636 552 59,664 57,384 81,633 80,030
Galway 11,585 11,369 4,218 3,732 5,694 5,419 14 29 47,055 44,555 68,566 65,104
Roscommon 1,270 1,257 751 779 1,018 987 2 2 10,404 8,746 13,445 11,771
Mayo 3,891 3,703 2,939 2,883 3,672 3,100 149 194 37,204 31,229 47,855 41,109
CHO Area 2 – Total 16,746 16,329 7,908 7,394 10,384 9,506 165 225 94,663 84,530 129,866 117,984
Clare 3,509 4,100 1,401 1,253 1,326 1,425 136 292 17,454 16,956 23,826 24,026
Limerick 10,629 10,064 3,939 3,495 5,818 5,795 1,086 1,082 52,265 51,474 73,737 71,910
North Tipperary/
East Limerick 1,503 1,993 450 429 935 519 11 16 15,584 15,400 18,483 18,357
CHO Area 3 – Total 15,641 16,157 5,790 5,177 8,079 7,739 1,233 1,390 85,303 83,830 116,046 114,293
National 130,412 138,982 50,755 46,004 121,485 110,358 5,090 4,224 987,711 885,861 1,295,453 1,185,429
Community HealthcareOrganisation
No. of Temporary
Resident Claims
No. of EEA
Visitor Claims
No. of Emergency
Claims
Second Medical
Opinion Claims
No. of Out-of-
Hours Claims
Total No.
of Claims
2016 2015 2016 2015 2016 2015 2016 20152016 2015 2016 2015
Note: * Table 18 does not include claims for services provided by NEDOC which is funded directly by HSE DNE.
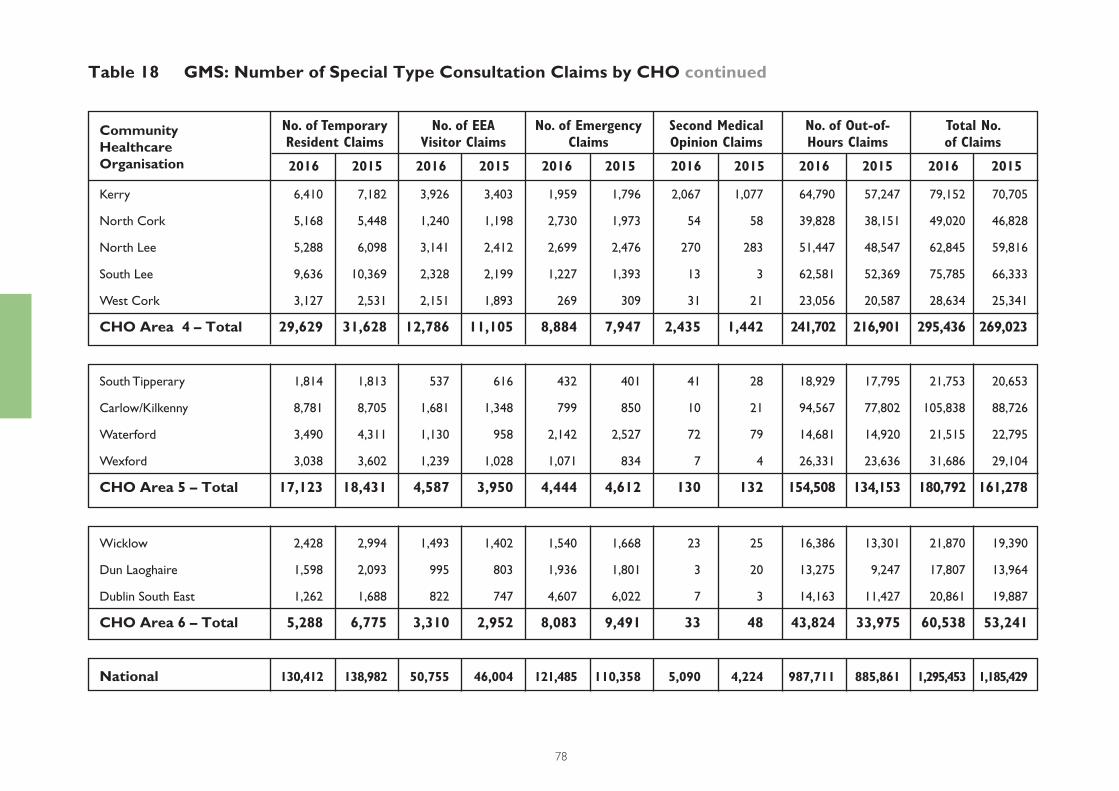
78
South Tipperary 1,814 1,813 537 616 432 401 41 28 18,929 17,795 21,753 20,653
Carlow/Kilkenny 8,781 8,705 1,681 1,348 799 850 10 21 94,567 77,802 105,838 88,726
Waterford 3,490 4,311 1,130 958 2,142 2,527 72 79 14,681 14,920 21,515 22,795
Wexford 3,038 3,602 1,239 1,028 1,071 834 7 4 26,331 23,636 31,686 29,104
CHO Area 5 – Total 17,123 18,431 4,587 3,950 4,444 4,612 130 132 154,508 134,153 180,792 161,278
Table 18 GMS: Number of Special Type Consultation Claims by CHO continued
Community HealthcareOrganisation
No. of Temporary
Resident Claims
No. of EEA
Visitor Claims
No. of Emergency
Claims
Second Medical
Opinion Claims
No. of Out-of-
Hours Claims
Total No.
of Claims
2016 2015 2016 2015 2016 2015 2016 20152016 2015 2016 2015
National 130,412 138,982 50,755 46,004 121,485 110,358 5,090 4,224 987,711 885,861 1,295,453 1,185,429
Kerry 6,410 7,182 3,926 3,403 1,959 1,796 2,067 1,077 64,790 57,247 79,152 70,705
North Cork 5,168 5,448 1,240 1,198 2,730 1,973 54 58 39,828 38,151 49,020 46,828
North Lee 5,288 6,098 3,141 2,412 2,699 2,476 270 283 51,447 48,547 62,845 59,816
South Lee 9,636 10,369 2,328 2,199 1,227 1,393 13 3 62,581 52,369 75,785 66,333
West Cork 3,127 2,531 2,151 1,893 269 309 31 21 23,056 20,587 28,634 25,341
CHO Area 4 – Total 29,629 31,628 12,786 11,105 8,884 7,947 2,435 1,442 241,702 216,901 295,436 269,023
Wicklow 2,428 2,994 1,493 1,402 1,540 1,668 23 25 16,386 13,301 21,870 19,390
Dun Laoghaire 1,598 2,093 995 803 1,936 1,801 3 20 13,275 9,247 17,807 13,964
Dublin South East 1,262 1,688 822 747 4,607 6,022 7 3 14,163 11,427 20,861 19,887
CHO Area 6 – Total 5,288 6,775 3,310 2,952 8,083 9,491 33 48 43,824 33,975 60,538 53,241
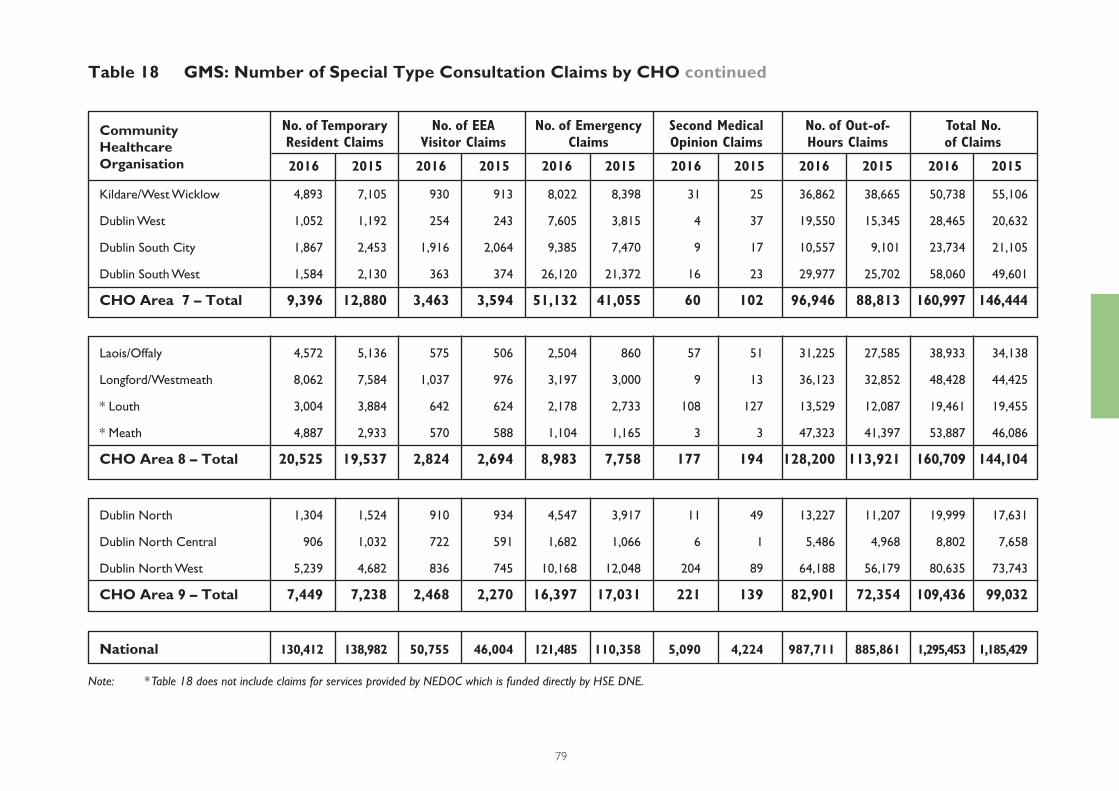
79
Dublin North 1,304 1,524 910 934 4,547 3,917 11 49 13,227 11,207 19,999 17,631
Dublin North Central 906 1,032 722 591 1,682 1,066 6 1 5,486 4,968 8,802 7,658
Dublin North West 5,239 4,682 836 745 10,168 12,048 204 89 64,188 56,179 80,635 73,743
CHO Area 9 – Total 7,449 7,238 2,468 2,270 16,397 17,031 221 139 82,901 72,354 109,436 99,032
Table 18 GMS: Number of Special Type Consultation Claims by CHO continued
Kildare/West Wicklow 4,893 7,105 930 913 8,022 8,398 31 25 36,862 38,665 50,738 55,106
Dublin West 1,052 1,192 254 243 7,605 3,815 4 37 19,550 15,345 28,465 20,632
Dublin South City 1,867 2,453 1,916 2,064 9,385 7,470 9 17 10,557 9,101 23,734 21,105
Dublin South West 1,584 2,130 363 374 26,120 21,372 16 23 29,977 25,702 58,060 49,601
CHO Area 7 – Total 9,396 12,880 3,463 3,594 51,132 41,055 60 102 96,946 88,813 160,997 146,444
National 130,412 138,982 50,755 46,004 121,485 110,358 5,090 4,224 987,711 885,861 1,295,453 1,185,429
Community HealthcareOrganisation
No. of Temporary
Resident Claims
No. of EEA
Visitor Claims
No. of Emergency
Claims
Second Medical
Opinion Claims
No. of Out-of-
Hours Claims
Total No.
of Claims
2016 2015 2016 2015 2016 2015 2016 20152016 2015 2016 2015
Note: * Table 18 does not include claims for services provided by NEDOC which is funded directly by HSE DNE.
Laois/Offaly 4,572 5,136 575 506 2,504 860 57 51 31,225 27,585 38,933 34,138
Longford/Westmeath 8,062 7,584 1,037 976 3,197 3,000 9 13 36,123 32,852 48,428 44,425
* Louth 3,004 3,884 642 624 2,178 2,733 108 127 13,529 12,087 19,461 19,455
* Meath 4,887 2,933 570 588 1,104 1,165 3 3 47,323 41,397 53,887 46,086
CHO Area 8 – Total 20,525 19,537 2,824 2,694 8,983 7,758 177 194 128,200 113,921 160,709 144,104
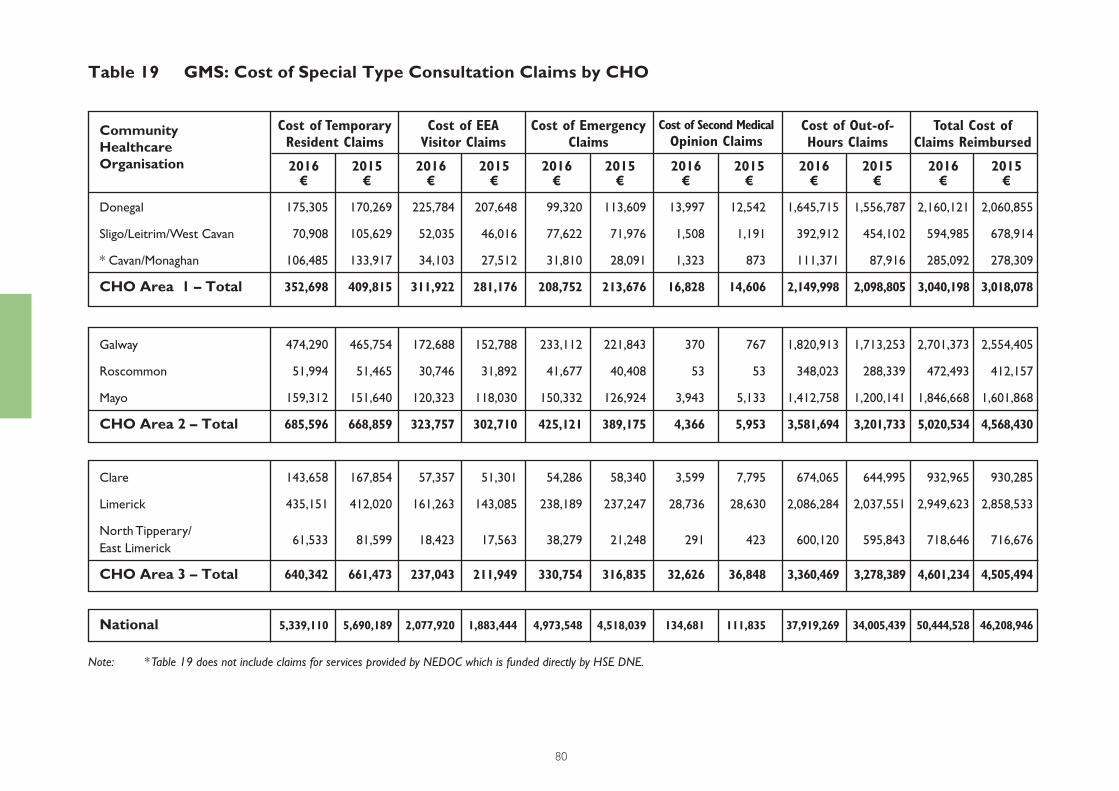
80
Table 19 GMS: Cost of Special Type Consultation Claims by CHO
Donegal 175,305 170,269 225,784 207,648 99,320 113,609 13,997 12,542 1,645,715 1,556,787 2,160,121 2,060,855
Sligo/Leitrim/West Cavan 70,908 105,629 52,035 46,016 77,622 71,976 1,508 1,191 392,912 454,102 594,985 678,914
* Cavan/Monaghan 106,485 133,917 34,103 27,512 31,810 28,091 1,323 873 111,371 87,916 285,092 278,309
CHO Area 1 – Total 352,698 409,815 311,922 281,176 208,752 213,676 16,828 14,606 2,149,998 2,098,805 3,040,198 3,018,078
Galway 474,290 465,754 172,688 152,788 233,112 221,843 370 767 1,820,913 1,713,253 2,701,373 2,554,405
Roscommon 51,994 51,465 30,746 31,892 41,677 40,408 53 53 348,023 288,339 472,493 412,157
Mayo 159,312 151,640 120,323 118,030 150,332 126,924 3,943 5,133 1,412,758 1,200,141 1,846,668 1,601,868
CHO Area 2 – Total 685,596 668,859 323,757 302,710 425,121 389,175 4,366 5,953 3,581,694 3,201,733 5,020,534 4,568,430
Clare 143,658 167,854 57,357 51,301 54,286 58,340 3,599 7,795 674,065 644,995 932,965 930,285
Limerick 435,151 412,020 161,263 143,085 238,189 237,247 28,736 28,630 2,086,284 2,037,551 2,949,623 2,858,533
North Tipperary/
East Limerick 61,533 81,599 18,423 17,563 38,279 21,248 291 423 600,120 595,843 718,646 716,676
CHO Area 3 – Total 640,342 661,473 237,043 211,949 330,754 316,835 32,626 36,848 3,360,469 3,278,389 4,601,234 4,505,494
National 5,339,110 5,690,189 2,077,920 1,883,444 4,973,548 4,518,039 134,681 111,835 37,919,269 34,005,439 50,444,528 46,208,946
Community HealthcareOrganisation
Cost of Temporary
Resident Claims
Cost of EEA
Visitor Claims
Cost of Emergency
Claims
Cost of Second Medical
Opinion ClaimsCost of Out-of-
Hours Claims
Total Cost of
Claims Reimbursed
2016€
2015€
2016€
2015€
2016€
2015€
2016€
2015€
2016€
2015€
2016€
2015€
Note: * Table 19 does not include claims for services provided by NEDOC which is funded directly by HSE DNE.
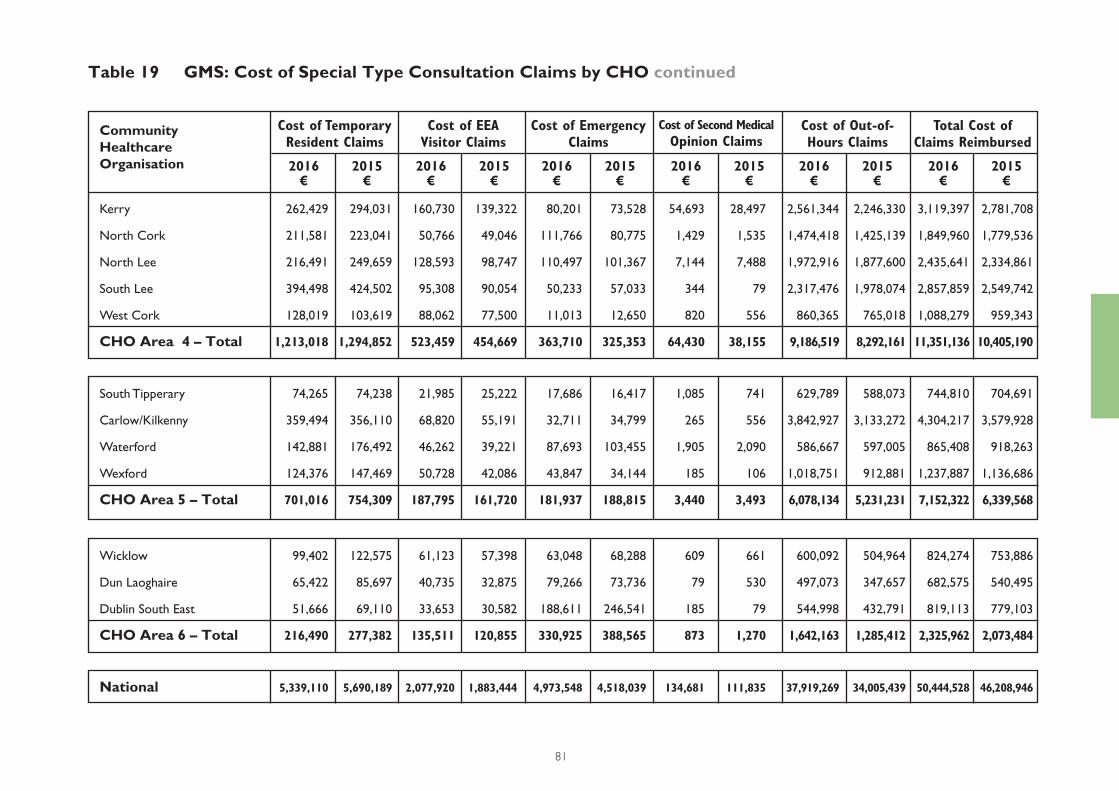
81
South Tipperary 74,265 74,238 21,985 25,222 17,686 16,417 1,085 741 629,789 588,073 744,810 704,691
Carlow/Kilkenny 359,494 356,110 68,820 55,191 32,711 34,799 265 556 3,842,927 3,133,272 4,304,217 3,579,928
Waterford 142,881 176,492 46,262 39,221 87,693 103,455 1,905 2,090 586,667 597,005 865,408 918,263
Wexford 124,376 147,469 50,728 42,086 43,847 34,144 185 106 1,018,751 912,881 1,237,887 1,136,686
CHO Area 5 – Total 701,016 754,309 187,795 161,720 181,937 188,815 3,440 3,493 6,078,134 5,231,231 7,152,322 6,339,568
Community HealthcareOrganisation 2016
€2015
€2016
€2015
€2016
€2015
€2016
€2015
€2016
€2015
€2016
€2015
€
National 5,339,110 5,690,189 2,077,920 1,883,444 4,973,548 4,518,039 134,681 111,835 37,919,269 34,005,439 50,444,528 46,208,946
Table 19 GMS: Cost of Special Type Consultation Claims by CHO continued
Cost of Temporary
Resident Claims
Cost of EEA
Visitor Claims
Cost of Emergency
Claims
Cost of Second Medical
Opinion ClaimsCost of Out-of-
Hours Claims
Total Cost of
Claims Reimbursed
Kerry 262,429 294,031 160,730 139,322 80,201 73,528 54,693 28,497 2,561,344 2,246,330 3,119,397 2,781,708
North Cork 211,581 223,041 50,766 49,046 111,766 80,775 1,429 1,535 1,474,418 1,425,139 1,849,960 1,779,536
North Lee 216,491 249,659 128,593 98,747 110,497 101,367 7,144 7,488 1,972,916 1,877,600 2,435,641 2,334,861
South Lee 394,498 424,502 95,308 90,054 50,233 57,033 344 79 2,317,476 1,978,074 2,857,859 2,549,742
West Cork 128,019 103,619 88,062 77,500 11,013 12,650 820 556 860,365 765,018 1,088,279 959,343
CHO Area 4 – Total 1,213,018 1,294,852 523,459 454,669 363,710 325,353 64,430 38,155 9,186,519 8,292,161 11,351,136 10,405,190
Wicklow 99,402 122,575 61,123 57,398 63,048 68,288 609 661 600,092 504,964 824,274 753,886
Dun Laoghaire 65,422 85,697 40,735 32,875 79,266 73,736 79 530 497,073 347,657 682,575 540,495
Dublin South East 51,666 69,110 33,653 30,582 188,611 246,541 185 79 544,998 432,791 819,113 779,103
CHO Area 6 – Total 216,490 277,382 135,511 120,855 330,925 388,565 873 1,270 1,642,163 1,285,412 2,325,962 2,073,484
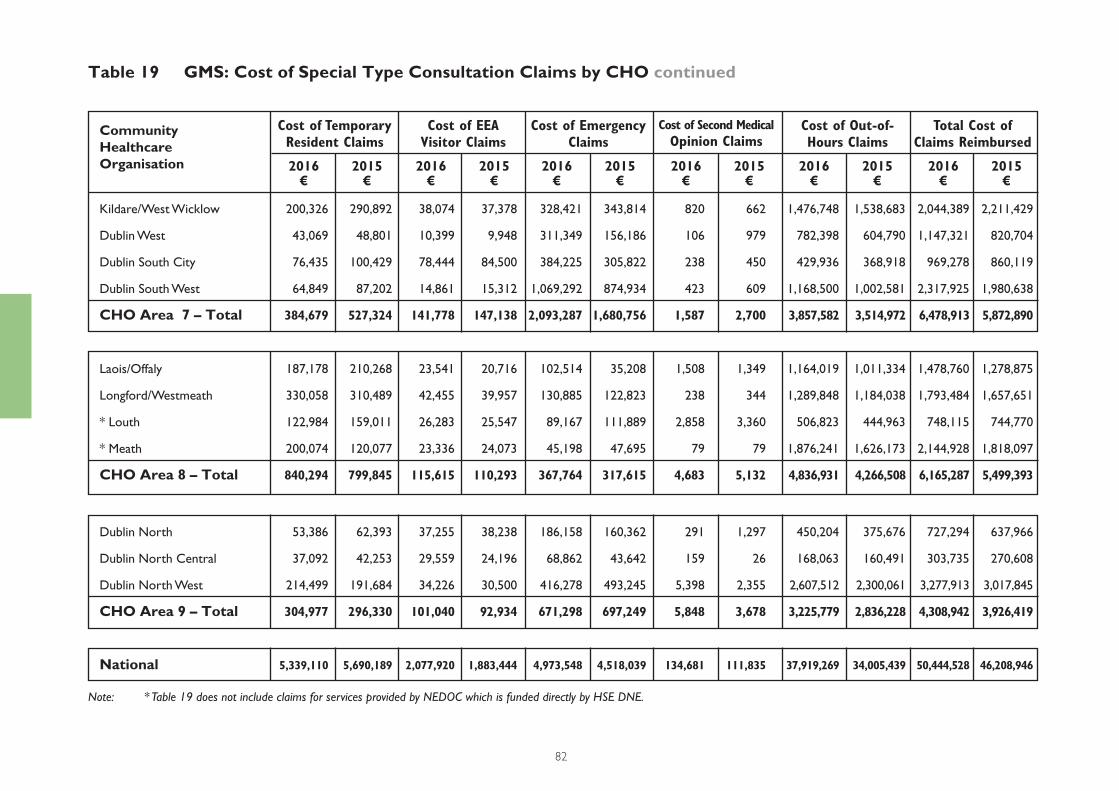
82
Community HealthcareOrganisation 2016
€2015
€2016
€2015
€2016
€2015
€2016
€2015
€2016
€2015
€2016
€2015
€
Table 19 GMS: Cost of Special Type Consultation Claims by CHO continued
Cost of Temporary
Resident Claims
Cost of EEA
Visitor Claims
Cost of Emergency
Claims
Cost of Second Medical
Opinion ClaimsCost of Out-of-
Hours Claims
Total Cost of
Claims Reimbursed
Kildare/West Wicklow 200,326 290,892 38,074 37,378 328,421 343,814 820 662 1,476,748 1,538,683 2,044,389 2,211,429
Dublin West 43,069 48,801 10,399 9,948 311,349 156,186 106 979 782,398 604,790 1,147,321 820,704
Dublin South City 76,435 100,429 78,444 84,500 384,225 305,822 238 450 429,936 368,918 969,278 860,119
Dublin South West 64,849 87,202 14,861 15,312 1,069,292 874,934 423 609 1,168,500 1,002,581 2,317,925 1,980,638
CHO Area 7 – Total 384,679 527,324 141,778 147,138 2,093,287 1,680,756 1,587 2,700 3,857,582 3,514,972 6,478,913 5,872,890
Dublin North 53,386 62,393 37,255 38,238 186,158 160,362 291 1,297 450,204 375,676 727,294 637,966
Dublin North Central 37,092 42,253 29,559 24,196 68,862 43,642 159 26 168,063 160,491 303,735 270,608
Dublin North West 214,499 191,684 34,226 30,500 416,278 493,245 5,398 2,355 2,607,512 2,300,061 3,277,913 3,017,845
CHO Area 9 – Total 304,977 296,330 101,040 92,934 671,298 697,249 5,848 3,678 3,225,779 2,836,228 4,308,942 3,926,419
National 5,339,110 5,690,189 2,077,920 1,883,444 4,973,548 4,518,039 134,681 111,835 37,919,269 34,005,439 50,444,528 46,208,946
Laois/Offaly 187,178 210,268 23,541 20,716 102,514 35,208 1,508 1,349 1,164,019 1,011,334 1,478,760 1,278,875
Longford/Westmeath 330,058 310,489 42,455 39,957 130,885 122,823 238 344 1,289,848 1,184,038 1,793,484 1,657,651
* Louth 122,984 159,011 26,283 25,547 89,167 111,889 2,858 3,360 506,823 444,963 748,115 744,770
* Meath 200,074 120,077 23,336 24,073 45,198 47,695 79 79 1,876,241 1,626,173 2,144,928 1,818,097
CHO Area 8 – Total 840,294 799,845 115,615 110,293 367,764 317,615 4,683 5,132 4,836,931 4,266,508 6,165,287 5,499,393
Note: * Table 19 does not include claims for services provided by NEDOC which is funded directly by HSE DNE.
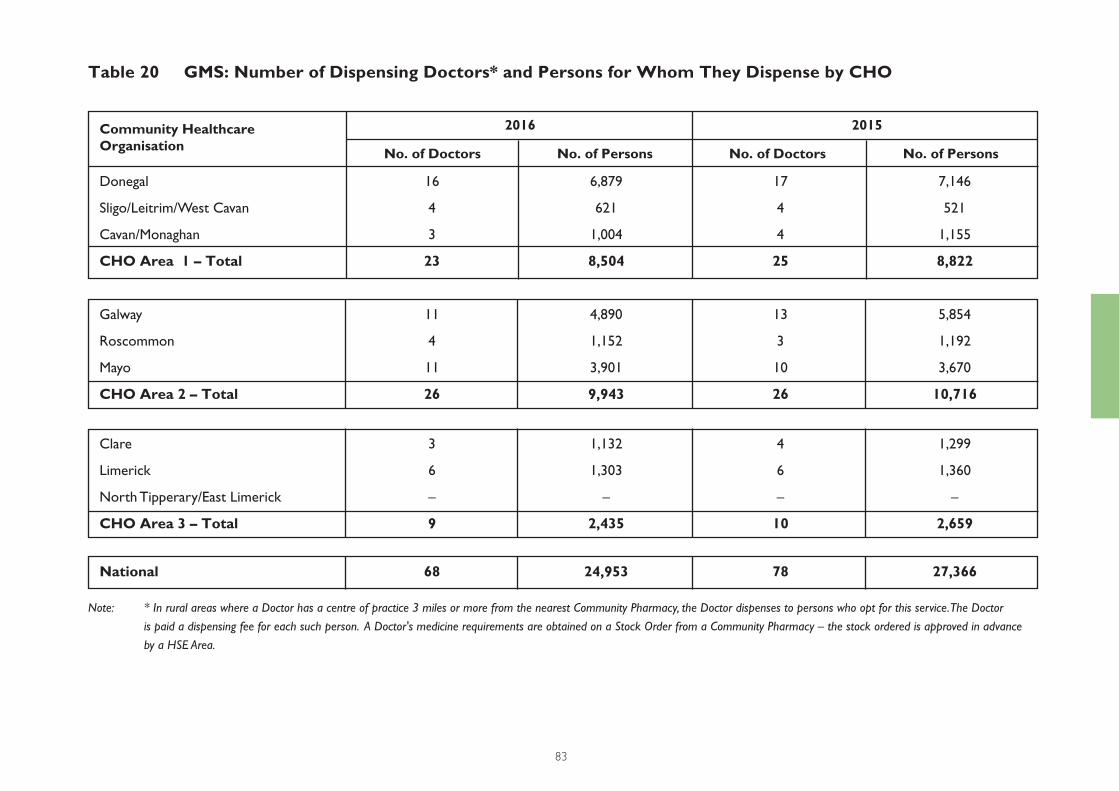
83
Table 20 GMS: Number of Dispensing Doctors* and Persons for Whom They Dispense by CHO
Donegal 16 6,879 17 7,146
Sligo/Leitrim/West Cavan 4 621 4 521
Cavan/Monaghan 3 1,004 4 1,155
CHO Area 1 – Total 23 8,504 25 8,822
Galway 11 4,890 13 5,854
Roscommon 4 1,152 3 1,192
Mayo 11 3,901 10 3,670
CHO Area 2 – Total 26 9,943 26 10,716
Clare 3 1,132 4 1,299
Limerick 6 1,303 6 1,360
North Tipperary/East Limerick – – – –
CHO Area 3 – Total 9 2,435 10 2,659
National 68 24,953 78 27,366
Community HealthcareOrganisation
2016
No. of Doctors No. of DoctorsNo. of Persons No. of Persons
2015
Note: * In rural areas where a Doctor has a centre of practice 3 miles or more from the nearest Community Pharmacy, the Doctor dispenses to persons who opt for this service. The Doctor
is paid a dispensing fee for each such person. A Doctor's medicine requirements are obtained on a Stock Order from a Community Pharmacy – the stock ordered is approved in advance
by a HSE Area.
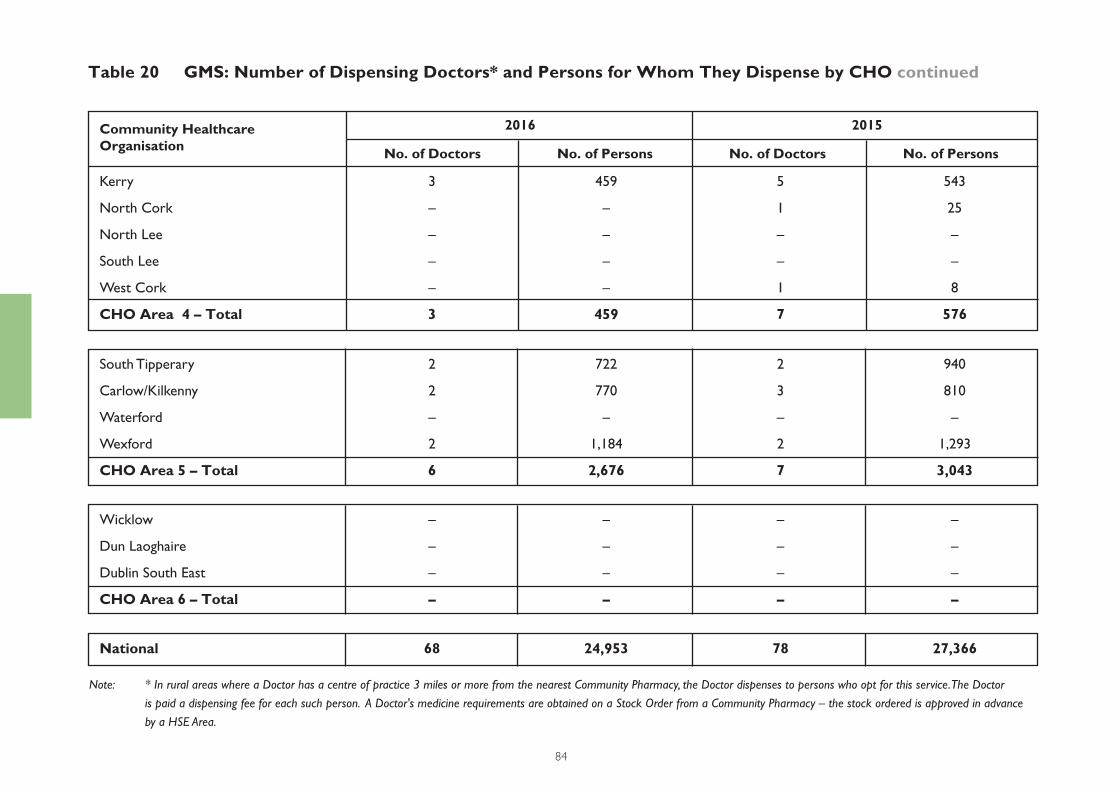
84
Community HealthcareOrganisation
2016
No. of Doctors No. of DoctorsNo. of Persons No. of Persons
2015
Table 20 GMS: Number of Dispensing Doctors* and Persons for Whom They Dispense by CHO continued
Note: * In rural areas where a Doctor has a centre of practice 3 miles or more from the nearest Community Pharmacy, the Doctor dispenses to persons who opt for this service. The Doctor
is paid a dispensing fee for each such person. A Doctor's medicine requirements are obtained on a Stock Order from a Community Pharmacy – the stock ordered is approved in advance
by a HSE Area.
Kerry 3 459 5 543
North Cork – – 1 25
North Lee – – – –
South Lee – – – –
West Cork – – 1 8
CHO Area 4 – Total 3 459 7 576
South Tipperary 2 722 2 940
Carlow/Kilkenny 2 770 3 810
Waterford – – – –
Wexford 2 1,184 2 1,293
CHO Area 5 – Total 6 2,676 7 3,043
Wicklow – – – –
Dun Laoghaire – – – –
Dublin South East – – – –
CHO Area 6 – Total – – – –
National 68 24,953 78 27,366
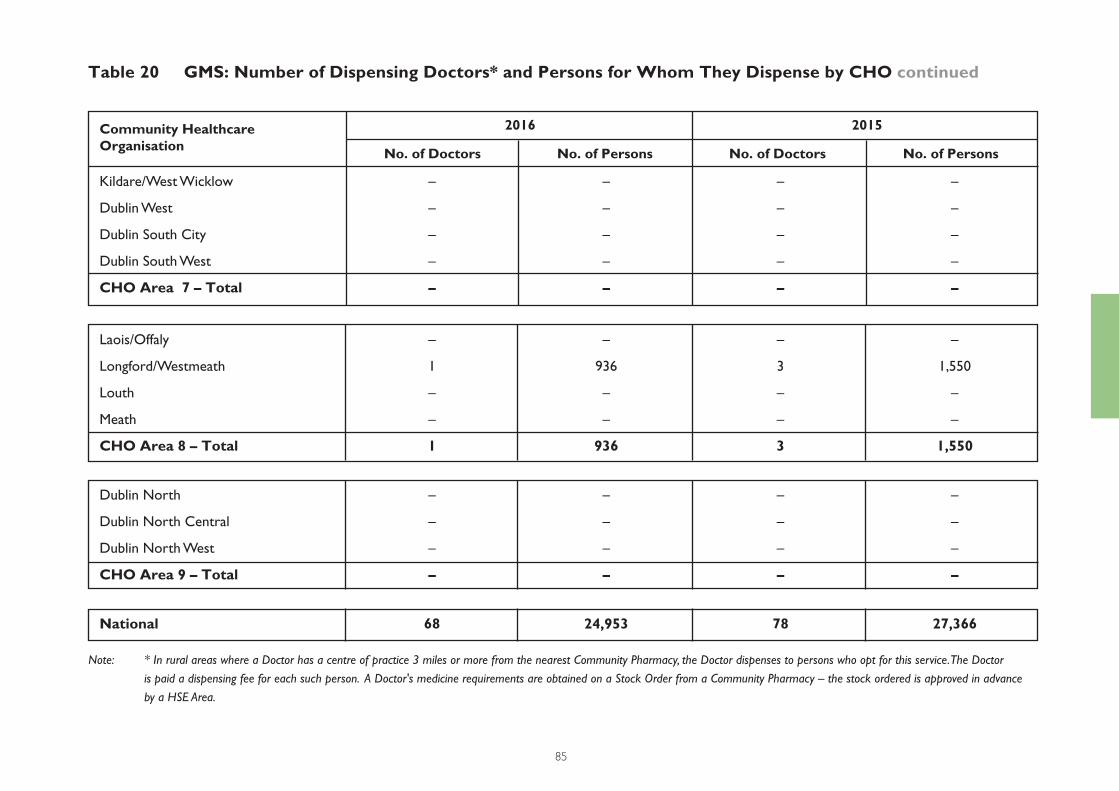
85
Laois/Offaly – – – –
Longford/Westmeath 1 936 3 1,550
Louth – – – –
Meath – – – –
CHO Area 8 – Total 1 936 3 1,550
Dublin North – – – –
Dublin North Central – – – –
Dublin North West – – – –
CHO Area 9 – Total – – – –
Table 20 GMS: Number of Dispensing Doctors* and Persons for Whom They Dispense by CHO continued
Kildare/West Wicklow – – – –
Dublin West – – – –
Dublin South City – – – –
Dublin South West – – – –
CHO Area 7 – Total – – – –
National 68 24,953 78 27,366
Community HealthcareOrganisation
2016
No. of Doctors No. of DoctorsNo. of Persons No. of Persons
2015
Note: * In rural areas where a Doctor has a centre of practice 3 miles or more from the nearest Community Pharmacy, the Doctor dispenses to persons who opt for this service. The Doctor
is paid a dispensing fee for each such person. A Doctor's medicine requirements are obtained on a Stock Order from a Community Pharmacy – the stock ordered is approved in advance
by a HSE Area.
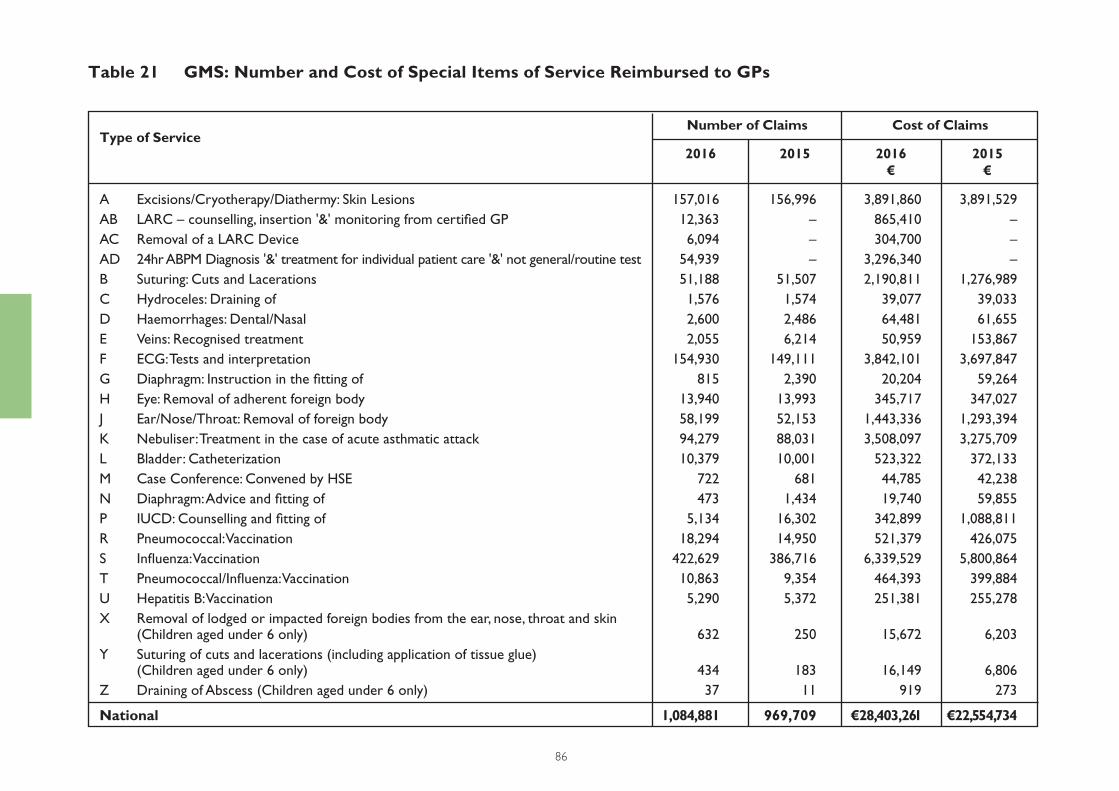
86
Type of Service2016 2016
€2015 2015
€
Cost of ClaimsNumber of Claims
Table 21 GMS: Number and Cost of Special Items of Service Reimbursed to GPs
A Excisions/Cryotherapy/Diathermy: Skin Lesions 157,016 156,996 3,891,860 3,891,529
AB LARC – counselling, insertion '&' monitoring from certifi ed GP 12,363 – 865,410 –
AC Removal of a LARC Device 6,094 – 304,700 –
AD 24hr ABPM Diagnosis '&' treatment for individual patient care '&' not general/routine test 54,939 – 3,296,340 –
B Suturing: Cuts and Lacerations 51,188 51,507 2,190,811 1,276,989
C Hydroceles: Draining of 1,576 1,574 39,077 39,033
D Haemorrhages: Dental/Nasal 2,600 2,486 64,481 61,655
E Veins: Recognised treatment 2,055 6,214 50,959 153,867
F ECG: Tests and interpretation 154,930 149,111 3,842,101 3,697,847
G Diaphragm: Instruction in the fi tting of 815 2,390 20,204 59,264
H Eye: Removal of adherent foreign body 13,940 13,993 345,717 347,027
J Ear/Nose/Throat: Removal of foreign body 58,199 52,153 1,443,336 1,293,394
K Nebuliser: Treatment in the case of acute asthmatic attack 94,279 88,031 3,508,097 3,275,709
L Bladder: Catheterization 10,379 10,001 523,322 372,133
M Case Conference: Convened by HSE 722 681 44,785 42,238
N Diaphragm: Advice and fi tting of 473 1,434 19,740 59,855
P IUCD: Counselling and fi tting of 5,134 16,302 342,899 1,088,811
R Pneumococcal: Vaccination 18,294 14,950 521,379 426,075
S Infl uenza: Vaccination 422,629 386,716 6,339,529 5,800,864
T Pneumococcal/Infl uenza: Vaccination 10,863 9,354 464,393 399,884
U Hepatitis B: Vaccination 5,290 5,372 251,381 255,278
X Removal of lodged or impacted foreign bodies from the ear, nose, throat and skin (Children aged under 6 only) 632 250 15,672 6,203
Y Suturing of cuts and lacerations (including application of tissue glue) (Children aged under 6 only) 434 183 16,149 6,806
Z Draining of Abscess (Children aged under 6 only) 37 11 919 273
National 1,084,881 969,709 €28,403,261 €22,554,734
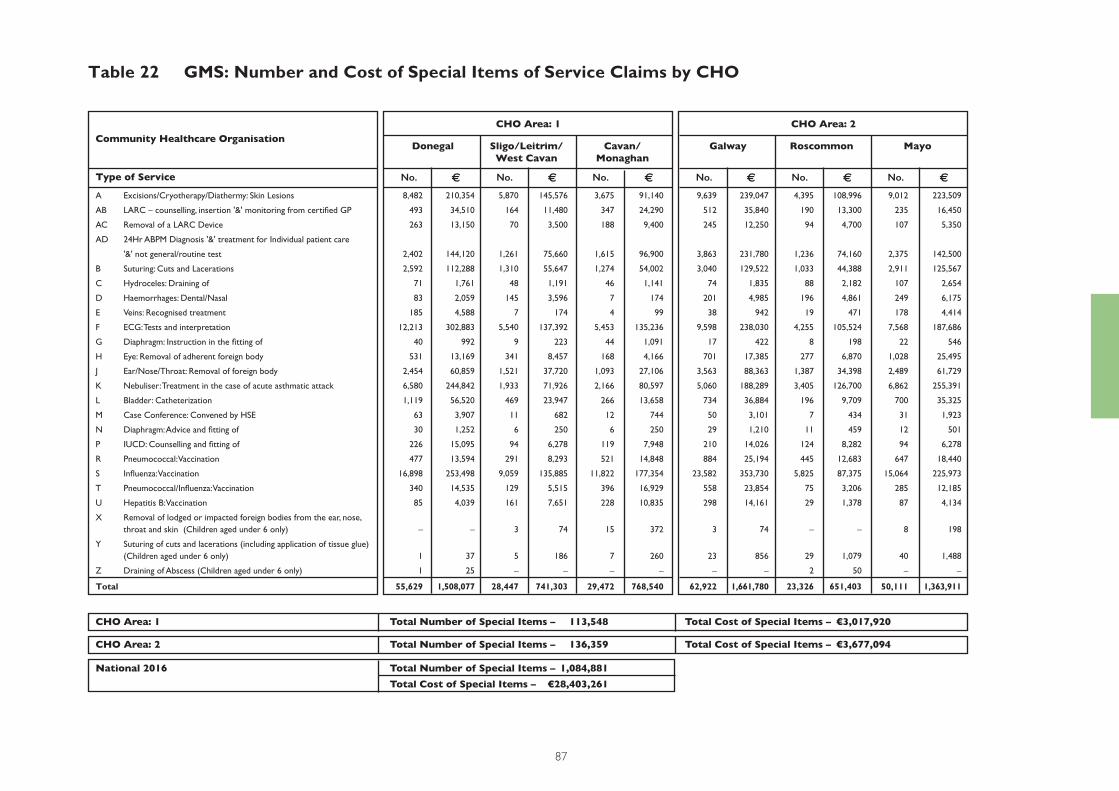
87
Type of Service No. No.No. No.No. No.€ €€ €€ €
Table 22 GMS: Number and Cost of Special Items of Service Claims by CHO
Community Healthcare OrganisationCHO Area: 1 CHO Area: 2
Donegal GalwaySligo/Leitrim/ West Cavan
RoscommonCavan/Monaghan
Mayo
A Excisions/Cryotherapy/Diathermy: Skin Lesions 8,482 210,354 5,870 145,576 3,675 91,140 9,639 239,047 4,395 108,996 9,012 223,509
AB LARC – counselling, insertion '&' monitoring from certifi ed GP 493 34,510 164 11,480 347 24,290 512 35,840 190 13,300 235 16,450
AC Removal of a LARC Device 263 13,150 70 3,500 188 9,400 245 12,250 94 4,700 107 5,350
AD 24Hr ABPM Diagnosis '&' treatment for Individual patient care
'&' not general/routine test 2,402 144,120 1,261 75,660 1,615 96,900 3,863 231,780 1,236 74,160 2,375 142,500
B Suturing: Cuts and Lacerations 2,592 112,288 1,310 55,647 1,274 54,002 3,040 129,522 1,033 44,388 2,911 125,567
C Hydroceles: Draining of 71 1,761 48 1,191 46 1,141 74 1,835 88 2,182 107 2,654
D Haemorrhages: Dental/Nasal 83 2,059 145 3,596 7 174 201 4,985 196 4,861 249 6,175
E Veins: Recognised treatment 185 4,588 7 174 4 99 38 942 19 471 178 4,414
F ECG: Tests and interpretation 12,213 302,883 5,540 137,392 5,453 135,236 9,598 238,030 4,255 105,524 7,568 187,686
G Diaphragm: Instruction in the fi tting of 40 992 9 223 44 1,091 17 422 8 198 22 546
H Eye: Removal of adherent foreign body 531 13,169 341 8,457 168 4,166 701 17,385 277 6,870 1,028 25,495
J Ear/Nose/Throat: Removal of foreign body 2,454 60,859 1,521 37,720 1,093 27,106 3,563 88,363 1,387 34,398 2,489 61,729
K Nebuliser: Treatment in the case of acute asthmatic attack 6,580 244,842 1,933 71,926 2,166 80,597 5,060 188,289 3,405 126,700 6,862 255,391
L Bladder: Catheterization 1,119 56,520 469 23,947 266 13,658 734 36,884 196 9,709 700 35,325
M Case Conference: Convened by HSE 63 3,907 11 682 12 744 50 3,101 7 434 31 1,923
N Diaphragm: Advice and fi tting of 30 1,252 6 250 6 250 29 1,210 11 459 12 501
P IUCD: Counselling and fi tting of 226 15,095 94 6,278 119 7,948 210 14,026 124 8,282 94 6,278
R Pneumococcal: Vaccination 477 13,594 291 8,293 521 14,848 884 25,194 445 12,683 647 18,440
S Infl uenza: Vaccination 16,898 253,498 9,059 135,885 11,822 177,354 23,582 353,730 5,825 87,375 15,064 225,973
T Pneumococcal/Infl uenza: Vaccination 340 14,535 129 5,515 396 16,929 558 23,854 75 3,206 285 12,185
U Hepatitis B: Vaccination 85 4,039 161 7,651 228 10,835 298 14,161 29 1,378 87 4,134
X Removal of lodged or impacted foreign bodies from the ear, nose, throat and skin (Children aged under 6 only) – – 3 74 15 372 3 74 – – 8 198
Y Suturing of cuts and lacerations (including application of tissue glue) (Children aged under 6 only) 1 37 5 186 7 260 23 856 29 1,079 40 1,488
Z Draining of Abscess (Children aged under 6 only) 1 25 – – – – – – 2 50 – –
Total 55,629 1,508,077 28,447 741,303 29,472 768,540 62,922 1,661,780 23,326 651,403 50,111 1,363,911
CHO Area: 1 Total Number of Special Items – 113,548 Total Cost of Special Items – €3,017,920
CHO Area: 2 Total Number of Special Items – 136,359 Total Cost of Special Items – €3,677,094
National 2016 Total Number of Special Items – 1,084,881 Total Cost of Special Items – €28,403,261
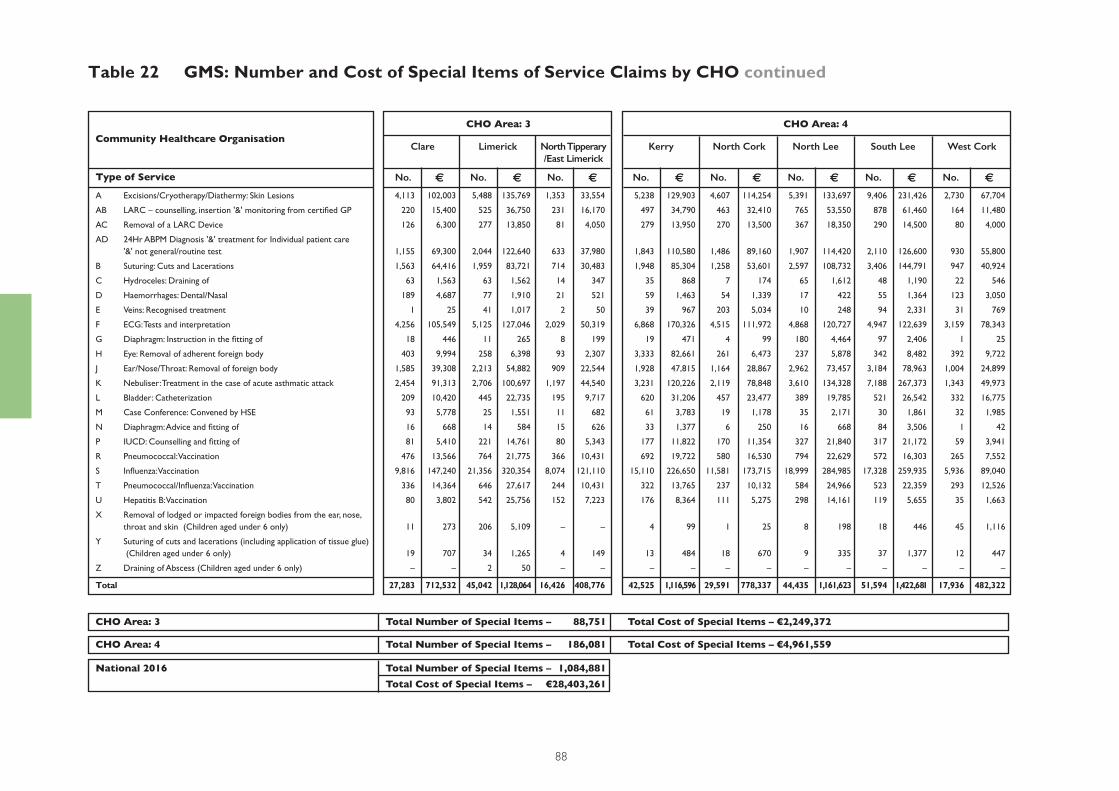
88
Community Healthcare OrganisationCHO Area: 3
Type of Service
CHO Area: 3 Total Number of Special Items – 88,751 Total Cost of Special Items – €2,249,372
CHO Area: 4 Total Number of Special Items – 186,081 Total Cost of Special Items – €4,961,559
National 2016 Total Number of Special Items – 1,084,881 Total Cost of Special Items – €28,403,261
Table 22 GMS: Number and Cost of Special Items of Service Claims by CHO continued
A Excisions/Cryotherapy/Diathermy: Skin Lesions 4,113 102,003 5,488 135,769 1,353 33,554 5,238 129,903 4,607 114,254 5,391 133,697 9,406 231,426 2,730 67,704
AB LARC – counselling, insertion '&' monitoring from certifi ed GP 220 15,400 525 36,750 231 16,170 497 34,790 463 32,410 765 53,550 878 61,460 164 11,480
AC Removal of a LARC Device 126 6,300 277 13,850 81 4,050 279 13,950 270 13,500 367 18,350 290 14,500 80 4,000
AD 24Hr ABPM Diagnosis '&' treatment for Individual patient care '&' not general/routine test 1,155 69,300 2,044 122,640 633 37,980 1,843 110,580 1,486 89,160 1,907 114,420 2,110 126,600 930 55,800
B Suturing: Cuts and Lacerations 1,563 64,416 1,959 83,721 714 30,483 1,948 85,304 1,258 53,601 2,597 108,732 3,406 144,791 947 40,924
C Hydroceles: Draining of 63 1,563 63 1,562 14 347 35 868 7 174 65 1,612 48 1,190 22 546
D Haemorrhages: Dental/Nasal 189 4,687 77 1,910 21 521 59 1,463 54 1,339 17 422 55 1,364 123 3,050
E Veins: Recognised treatment 1 25 41 1,017 2 50 39 967 203 5,034 10 248 94 2,331 31 769
F ECG: Tests and interpretation 4,256 105,549 5,125 127,046 2,029 50,319 6,868 170,326 4,515 111,972 4,868 120,727 4,947 122,639 3,159 78,343
G Diaphragm: Instruction in the fi tting of 18 446 11 265 8 199 19 471 4 99 180 4,464 97 2,406 1 25
H Eye: Removal of adherent foreign body 403 9,994 258 6,398 93 2,307 3,333 82,661 261 6,473 237 5,878 342 8,482 392 9,722
J Ear/Nose/Throat: Removal of foreign body 1,585 39,308 2,213 54,882 909 22,544 1,928 47,815 1,164 28,867 2,962 73,457 3,184 78,963 1,004 24,899
K Nebuliser: Treatment in the case of acute asthmatic attack 2,454 91,313 2,706 100,697 1,197 44,540 3,231 120,226 2,119 78,848 3,610 134,328 7,188 267,373 1,343 49,973
L Bladder: Catheterization 209 10,420 445 22,735 195 9,717 620 31,206 457 23,477 389 19,785 521 26,542 332 16,775
M Case Conference: Convened by HSE 93 5,778 25 1,551 11 682 61 3,783 19 1,178 35 2,171 30 1,861 32 1,985
N Diaphragm: Advice and fi tting of 16 668 14 584 15 626 33 1,377 6 250 16 668 84 3,506 1 42
P IUCD: Counselling and fi tting of 81 5,410 221 14,761 80 5,343 177 11,822 170 11,354 327 21,840 317 21,172 59 3,941
R Pneumococcal: Vaccination 476 13,566 764 21,775 366 10,431 692 19,722 580 16,530 794 22,629 572 16,303 265 7,552
S Infl uenza: Vaccination 9,816 147,240 21,356 320,354 8,074 121,110 15,110 226,650 11,581 173,715 18,999 284,985 17,328 259,935 5,936 89,040
T Pneumococcal/Infl uenza: Vaccination 336 14,364 646 27,617 244 10,431 322 13,765 237 10,132 584 24,966 523 22,359 293 12,526
U Hepatitis B: Vaccination 80 3,802 542 25,756 152 7,223 176 8,364 111 5,275 298 14,161 119 5,655 35 1,663
X Removal of lodged or impacted foreign bodies from the ear, nose, throat and skin (Children aged under 6 only) 11 273 206 5,109 – – 4 99 1 25 8 198 18 446 45 1,116
Y Suturing of cuts and lacerations (including application of tissue glue) (Children aged under 6 only) 19 707 34 1,265 4 149 13 484 18 670 9 335 37 1,377 12 447
Z Draining of Abscess (Children aged under 6 only) – – 2 50 – – – – – – – – – – – –
Total 27,283 712,532 45,042 1,128,064 16,426 408,776 42,525 1,116,596 29,591 778,337 44,435 1,161,623 51,594 1,422,681 17,936 482,322
CHO Area: 4
Kerry North Cork North Lee South Lee West Cork
No. No.No. No. No.€ €€ € €
Clare
No.No.No. €€€
Limerick North Tipperary/East Limerick
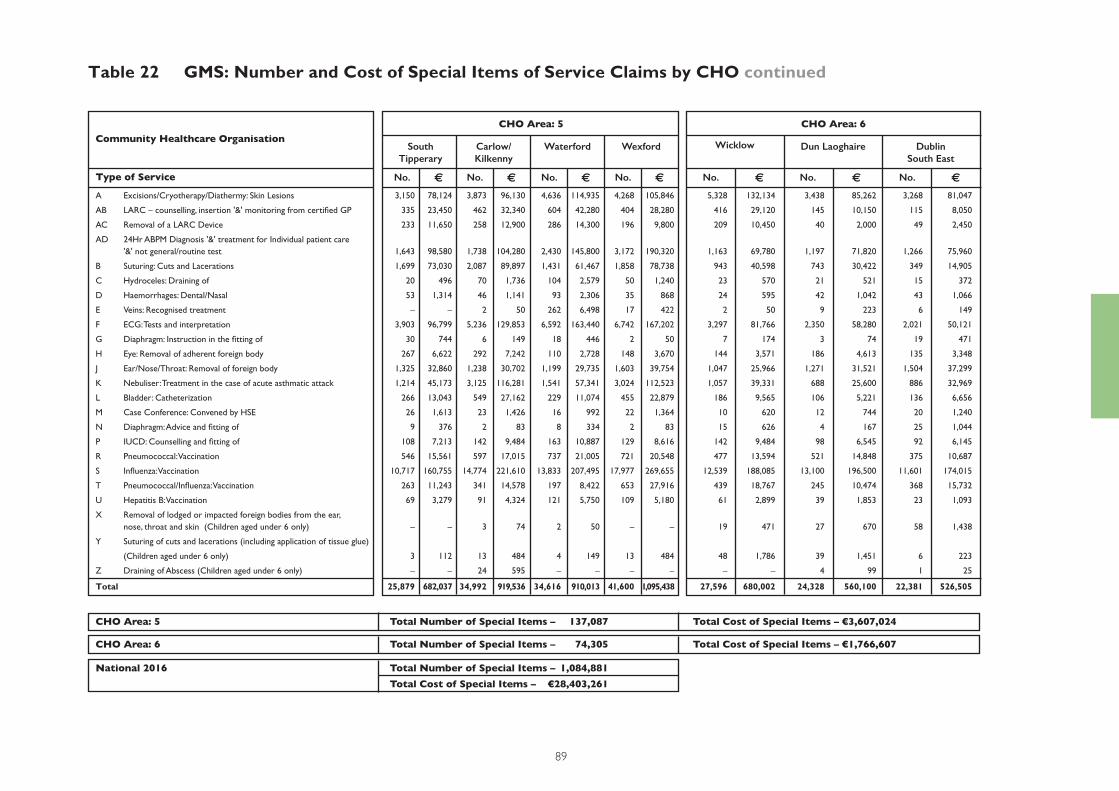
89
Table 22 GMS: Number and Cost of Special Items of Service Claims by CHO continued
A Excisions/Cryotherapy/Diathermy: Skin Lesions 3,150 78,124 3,873 96,130 4,636 114,935 4,268 105,846 5,328 132,134 3,438 85,262 3,268 81,047
AB LARC – counselling, insertion '&' monitoring from certifi ed GP 335 23,450 462 32,340 604 42,280 404 28,280 416 29,120 145 10,150 115 8,050
AC Removal of a LARC Device 233 11,650 258 12,900 286 14,300 196 9,800 209 10,450 40 2,000 49 2,450
AD 24Hr ABPM Diagnosis '&' treatment for Individual patient care '&' not general/routine test 1,643 98,580 1,738 104,280 2,430 145,800 3,172 190,320 1,163 69,780 1,197 71,820 1,266 75,960
B Suturing: Cuts and Lacerations 1,699 73,030 2,087 89,897 1,431 61,467 1,858 78,738 943 40,598 743 30,422 349 14,905
C Hydroceles: Draining of 20 496 70 1,736 104 2,579 50 1,240 23 570 21 521 15 372
D Haemorrhages: Dental/Nasal 53 1,314 46 1,141 93 2,306 35 868 24 595 42 1,042 43 1,066
E Veins: Recognised treatment – – 2 50 262 6,498 17 422 2 50 9 223 6 149
F ECG: Tests and interpretation 3,903 96,799 5,236 129,853 6,592 163,440 6,742 167,202 3,297 81,766 2,350 58,280 2,021 50,121
G Diaphragm: Instruction in the fi tting of 30 744 6 149 18 446 2 50 7 174 3 74 19 471
H Eye: Removal of adherent foreign body 267 6,622 292 7,242 110 2,728 148 3,670 144 3,571 186 4,613 135 3,348
J Ear/Nose/Throat: Removal of foreign body 1,325 32,860 1,238 30,702 1,199 29,735 1,603 39,754 1,047 25,966 1,271 31,521 1,504 37,299
K Nebuliser: Treatment in the case of acute asthmatic attack 1,214 45,173 3,125 116,281 1,541 57,341 3,024 112,523 1,057 39,331 688 25,600 886 32,969
L Bladder: Catheterization 266 13,043 549 27,162 229 11,074 455 22,879 186 9,565 106 5,221 136 6,656
M Case Conference: Convened by HSE 26 1,613 23 1,426 16 992 22 1,364 10 620 12 744 20 1,240
N Diaphragm: Advice and fi tting of 9 376 2 83 8 334 2 83 15 626 4 167 25 1,044
P IUCD: Counselling and fi tting of 108 7,213 142 9,484 163 10,887 129 8,616 142 9,484 98 6,545 92 6,145
R Pneumococcal: Vaccination 546 15,561 597 17,015 737 21,005 721 20,548 477 13,594 521 14,848 375 10,687
S Infl uenza: Vaccination 10,717 160,755 14,774 221,610 13,833 207,495 17,977 269,655 12,539 188,085 13,100 196,500 11,601 174,015
T Pneumococcal/Infl uenza: Vaccination 263 11,243 341 14,578 197 8,422 653 27,916 439 18,767 245 10,474 368 15,732
U Hepatitis B: Vaccination 69 3,279 91 4,324 121 5,750 109 5,180 61 2,899 39 1,853 23 1,093
X Removal of lodged or impacted foreign bodies from the ear, nose, throat and skin (Children aged under 6 only) – – 3 74 2 50 – – 19 471 27 670 58 1,438
Y Suturing of cuts and lacerations (including application of tissue glue)
(Children aged under 6 only) 3 112 13 484 4 149 13 484 48 1,786 39 1,451 6 223
Z Draining of Abscess (Children aged under 6 only) – – 24 595 – – – – – – 4 99 1 25
Total 25,879 682,037 34,992 919,536 34,616 910,013 41,600 1,095,438 27,596 680,002 24,328 560,100 22,381 526,505
SouthTipperary
Waterford
No. € No. € No. € No. €
Carlow/Kilkenny
CHO Area: 5 CHO Area: 6
No. € No. € No. €
Wexford Wicklow Dun Laoghaire DublinSouth East
Community Healthcare Organisation
Type of Service
CHO Area: 5 Total Number of Special Items – 137,087 Total Cost of Special Items – €3,607,024
CHO Area: 6 Total Number of Special Items – 74,305 Total Cost of Special Items – €1,766,607
National 2016 Total Number of Special Items – 1,084,881 Total Cost of Special Items – €28,403,261
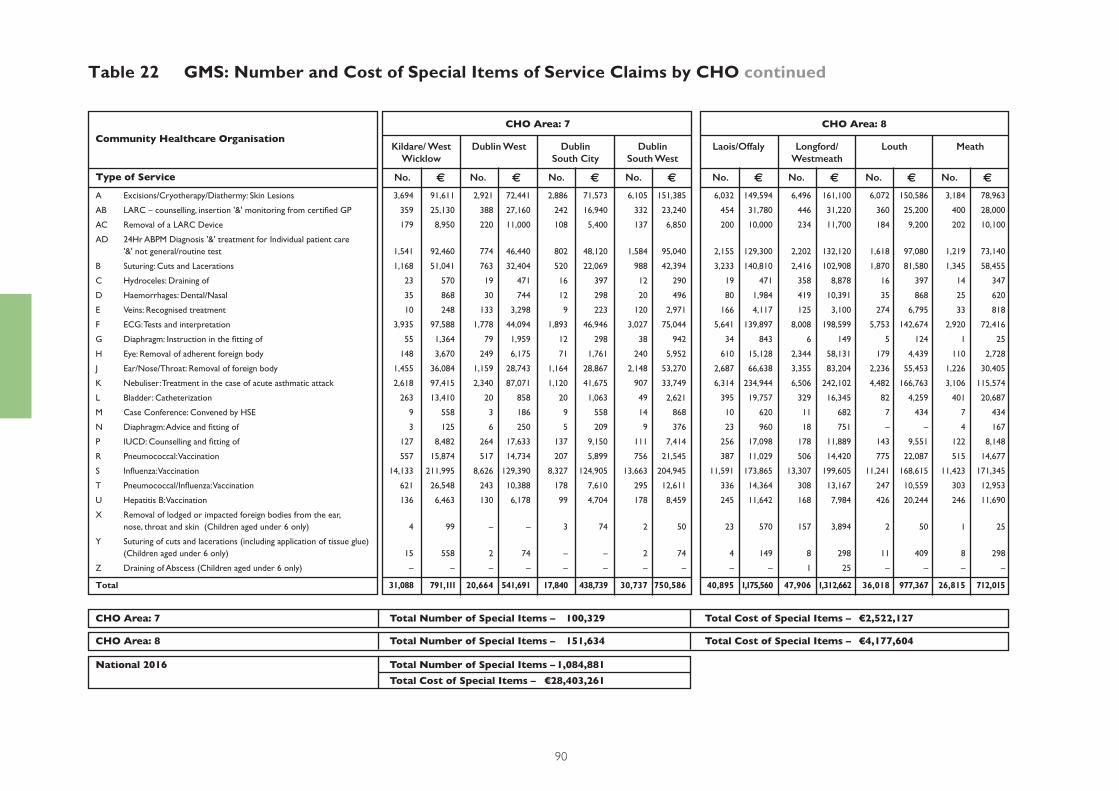
90
Community Healthcare Organisation
Type of Service
CHO Area: 7 Total Number of Special Items – 100,329 Total Cost of Special Items – €2,522,127
CHO Area: 8 Total Number of Special Items – 151,634 Total Cost of Special Items – €4,177,604
National 2016 Total Number of Special Items – 1,084,881 Total Cost of Special Items – €28,403,261
Table 22 GMS: Number and Cost of Special Items of Service Claims by CHO continued
A Excisions/Cryotherapy/Diathermy: Skin Lesions 3,694 91,611 2,921 72,441 2,886 71,573 6,105 151,385 6,032 149,594 6,496 161,100 6,072 150,586 3,184 78,963
AB LARC – counselling, insertion '&' monitoring from certifi ed GP 359 25,130 388 27,160 242 16,940 332 23,240 454 31,780 446 31,220 360 25,200 400 28,000
AC Removal of a LARC Device 179 8,950 220 11,000 108 5,400 137 6,850 200 10,000 234 11,700 184 9,200 202 10,100
AD 24Hr ABPM Diagnosis '&' treatment for Individual patient care '&' not general/routine test 1,541 92,460 774 46,440 802 48,120 1,584 95,040 2,155 129,300 2,202 132,120 1,618 97,080 1,219 73,140
B Suturing: Cuts and Lacerations 1,168 51,041 763 32,404 520 22,069 988 42,394 3,233 140,810 2,416 102,908 1,870 81,580 1,345 58,455
C Hydroceles: Draining of 23 570 19 471 16 397 12 290 19 471 358 8,878 16 397 14 347
D Haemorrhages: Dental/Nasal 35 868 30 744 12 298 20 496 80 1,984 419 10,391 35 868 25 620
E Veins: Recognised treatment 10 248 133 3,298 9 223 120 2,971 166 4,117 125 3,100 274 6,795 33 818
F ECG: Tests and interpretation 3,935 97,588 1,778 44,094 1,893 46,946 3,027 75,044 5,641 139,897 8,008 198,599 5,753 142,674 2,920 72,416
G Diaphragm: Instruction in the fi tting of 55 1,364 79 1,959 12 298 38 942 34 843 6 149 5 124 1 25
H Eye: Removal of adherent foreign body 148 3,670 249 6,175 71 1,761 240 5,952 610 15,128 2,344 58,131 179 4,439 110 2,728
J Ear/Nose/Throat: Removal of foreign body 1,455 36,084 1,159 28,743 1,164 28,867 2,148 53,270 2,687 66,638 3,355 83,204 2,236 55,453 1,226 30,405
K Nebuliser: Treatment in the case of acute asthmatic attack 2,618 97,415 2,340 87,071 1,120 41,675 907 33,749 6,314 234,944 6,506 242,102 4,482 166,763 3,106 115,574
L Bladder: Catheterization 263 13,410 20 858 20 1,063 49 2,621 395 19,757 329 16,345 82 4,259 401 20,687
M Case Conference: Convened by HSE 9 558 3 186 9 558 14 868 10 620 11 682 7 434 7 434
N Diaphragm: Advice and fi tting of 3 125 6 250 5 209 9 376 23 960 18 751 – – 4 167
P IUCD: Counselling and fi tting of 127 8,482 264 17,633 137 9,150 111 7,414 256 17,098 178 11,889 143 9,551 122 8,148
R Pneumococcal: Vaccination 557 15,874 517 14,734 207 5,899 756 21,545 387 11,029 506 14,420 775 22,087 515 14,677
S Infl uenza: Vaccination 14,133 211,995 8,626 129,390 8,327 124,905 13,663 204,945 11,591 173,865 13,307 199,605 11,241 168,615 11,423 171,345
T Pneumococcal/Infl uenza: Vaccination 621 26,548 243 10,388 178 7,610 295 12,611 336 14,364 308 13,167 247 10,559 303 12,953
U Hepatitis B: Vaccination 136 6,463 130 6,178 99 4,704 178 8,459 245 11,642 168 7,984 426 20,244 246 11,690
X Removal of lodged or impacted foreign bodies from the ear, nose, throat and skin (Children aged under 6 only) 4 99 – – 3 74 2 50 23 570 157 3,894 2 50 1 25
Y Suturing of cuts and lacerations (including application of tissue glue) (Children aged under 6 only) 15 558 2 74 – – 2 74 4 149 8 298 11 409 8 298
Z Draining of Abscess (Children aged under 6 only) – – – – – – – – – – 1 25 – – – –
Total 31,088 791,111 20,664 541,691 17,840 438,739 30,737 750,586 40,895 1,175,560 47,906 1,312,662 36,018 977,367 26,815 712,015
CHO Area: 7 CHO Area: 8
Dublin West Longford/ Westmeath
DublinSouth West
MeathKildare/ West Wicklow
Laois/OffalyDublinSouth City
Louth
No. € No. €No. € No. € No. € No. €No. € No. €
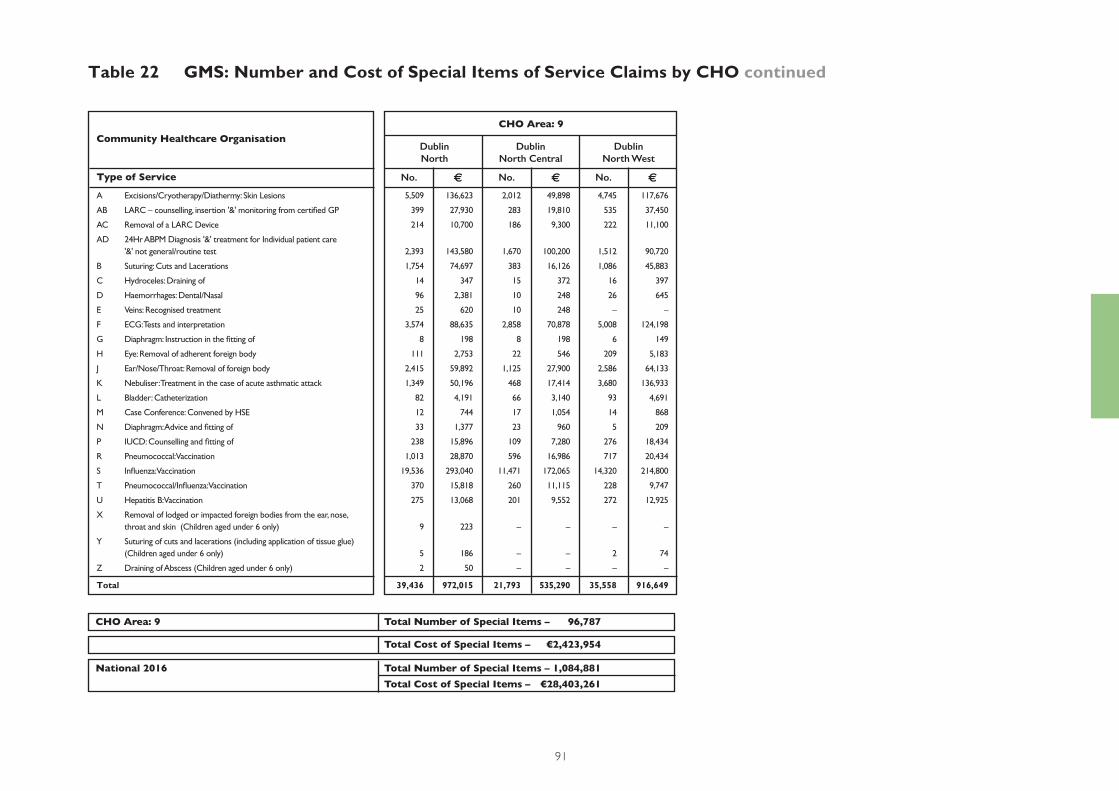
91
Community Healthcare OrganisationCHO Area: 9
Type of Service
CHO Area: 9 Total Number of Special Items – 96,787
Total Cost of Special Items – €2,423,954
National 2016 Total Number of Special Items – 1,084,881 Total Cost of Special Items – €28,403,261
Table 22 GMS: Number and Cost of Special Items of Service Claims by CHO continued
A Excisions/Cryotherapy/Diathermy: Skin Lesions 5,509 136,623 2,012 49,898 4,745 117,676
AB LARC – counselling, insertion '&' monitoring from certifi ed GP 399 27,930 283 19,810 535 37,450
AC Removal of a LARC Device 214 10,700 186 9,300 222 11,100
AD 24Hr ABPM Diagnosis '&' treatment for Individual patient care '&' not general/routine test 2,393 143,580 1,670 100,200 1,512 90,720
B Suturing: Cuts and Lacerations 1,754 74,697 383 16,126 1,086 45,883
C Hydroceles: Draining of 14 347 15 372 16 397
D Haemorrhages: Dental/Nasal 96 2,381 10 248 26 645
E Veins: Recognised treatment 25 620 10 248 – –
F ECG: Tests and interpretation 3,574 88,635 2,858 70,878 5,008 124,198
G Diaphragm: Instruction in the fi tting of 8 198 8 198 6 149
H Eye: Removal of adherent foreign body 111 2,753 22 546 209 5,183
J Ear/Nose/Throat: Removal of foreign body 2,415 59,892 1,125 27,900 2,586 64,133
K Nebuliser: Treatment in the case of acute asthmatic attack 1,349 50,196 468 17,414 3,680 136,933
L Bladder: Catheterization 82 4,191 66 3,140 93 4,691
M Case Conference: Convened by HSE 12 744 17 1,054 14 868
N Diaphragm: Advice and fi tting of 33 1,377 23 960 5 209
P IUCD: Counselling and fi tting of 238 15,896 109 7,280 276 18,434
R Pneumococcal: Vaccination 1,013 28,870 596 16,986 717 20,434
S Infl uenza: Vaccination 19,536 293,040 11,471 172,065 14,320 214,800
T Pneumococcal/Infl uenza: Vaccination 370 15,818 260 11,115 228 9,747
U Hepatitis B: Vaccination 275 13,068 201 9,552 272 12,925
X Removal of lodged or impacted foreign bodies from the ear, nose, throat and skin (Children aged under 6 only) 9 223 – – – –
Y Suturing of cuts and lacerations (including application of tissue glue) (Children aged under 6 only) 5 186 – – 2 74
Z Draining of Abscess (Children aged under 6 only) 2 50 – – – –
Total 39,436 972,015 21,793 535,290 35,558 916,649
DublinNorth
No. No. No.€ € €
DublinNorth Central
DublinNorth West
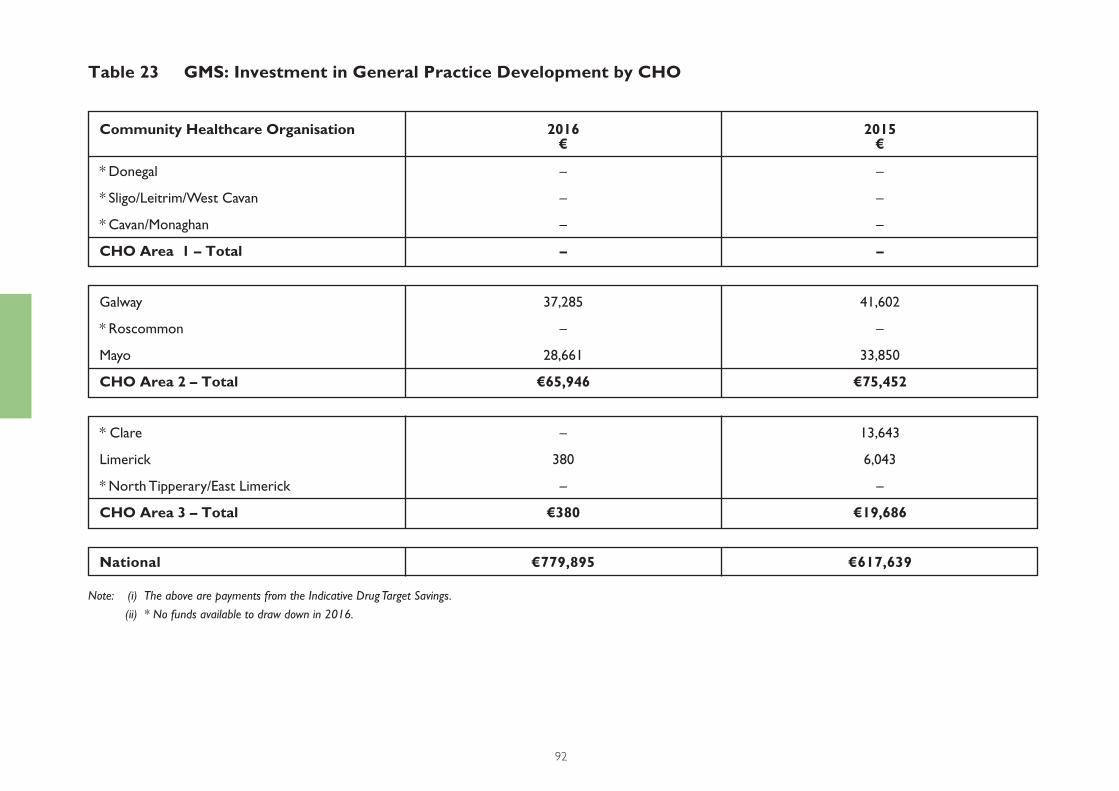
92
Note: (i) The above are payments from the Indicative Drug Target Savings.
(ii) * No funds available to draw down in 2016.
Table 23 GMS: Investment in General Practice Development by CHO
* Donegal – –
* Sligo/Leitrim/West Cavan – –
* Cavan/Monaghan – –
CHO Area 1 – Total – –
Galway 37,285 41,602
* Roscommon – –
Mayo 28,661 33,850
CHO Area 2 – Total €65,946 €75,452
* Clare – 13,643
Limerick 380 6,043
* North Tipperary/East Limerick – –
CHO Area 3 – Total €380 €19,686
National €779,895 €617,639
Community Healthcare Organisation 2016 2015 € €
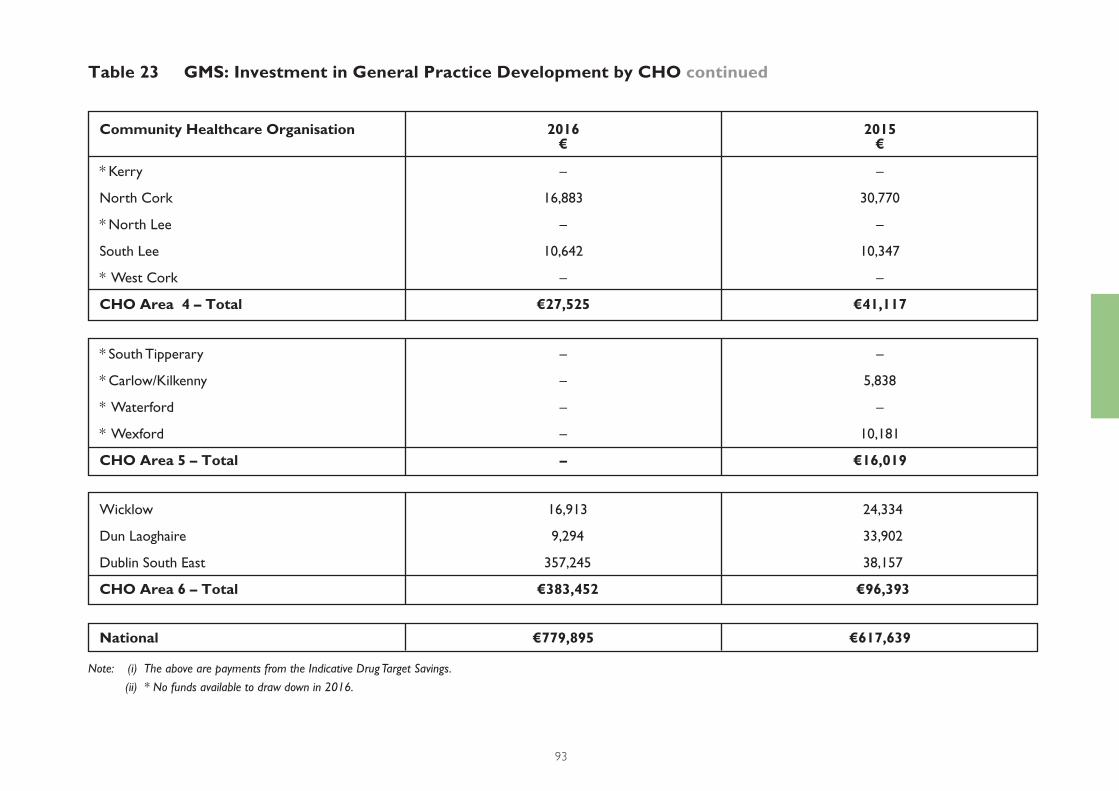
93
Note: (i) The above are payments from the Indicative Drug Target Savings.
(ii) * No funds available to draw down in 2016.
Wicklow 16,913 24,334
Dun Laoghaire 9,294 33,902
Dublin South East 357,245 38,157
CHO Area 6 – Total €383,452 €96,393
* Kerry – –
North Cork 16,883 30,770
* North Lee – –
South Lee 10,642 10,347
* West Cork – –
CHO Area 4 – Total €27,525 €41,117
* South Tipperary – –
* Carlow/Kilkenny – 5,838
* Waterford – –
* Wexford – 10,181
CHO Area 5 – Total – €16,019
National €779,895 €617,639
Community Healthcare Organisation 2016 2015 € €
Table 23 GMS: Investment in General Practice Development by CHO continued
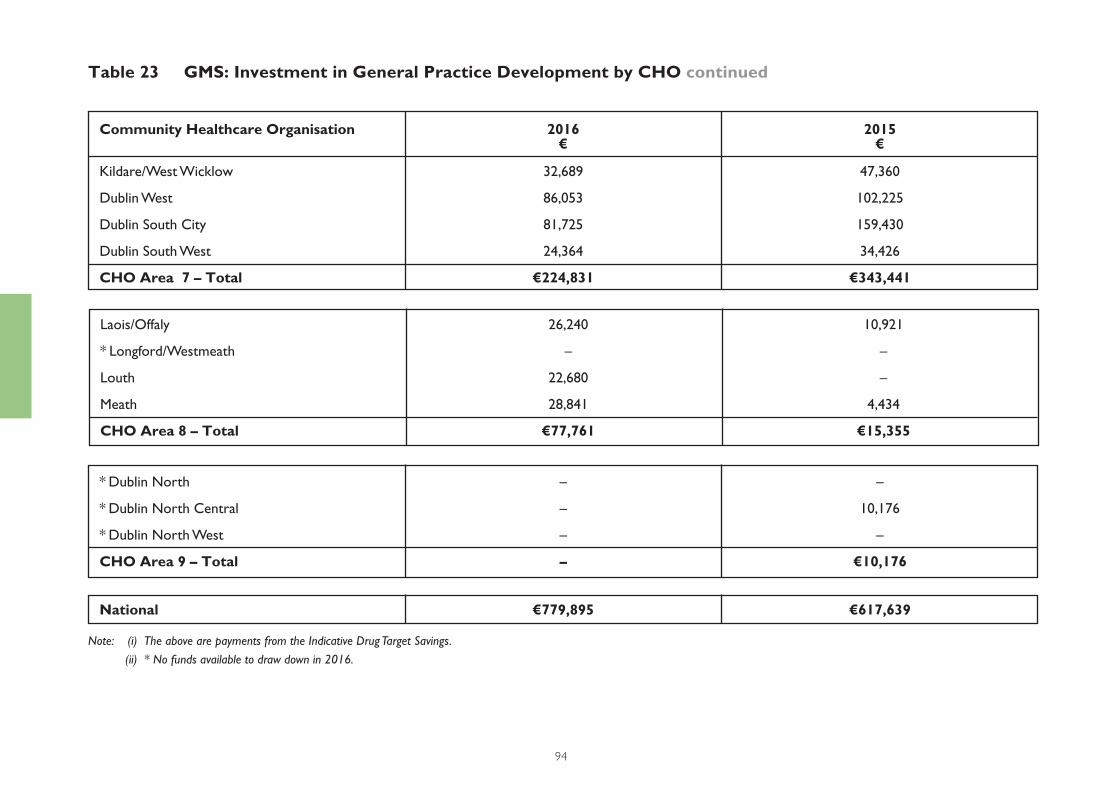
94
Note: (i) The above are payments from the Indicative Drug Target Savings.
(ii) * No funds available to draw down in 2016.
Table 23 GMS: Investment in General Practice Development by CHO continued
Kildare/West Wicklow 32,689 47,360
Dublin West 86,053 102,225
Dublin South City 81,725 159,430
Dublin South West 24,364 34,426
CHO Area 7 – Total €224,831 €343,441
* Dublin North – –
* Dublin North Central – 10,176
* Dublin North West – –
CHO Area 9 – Total – €10,176
Laois/Offaly 26,240 10,921
* Longford/Westmeath – –
Louth 22,680 –
Meath 28,841 4,434
CHO Area 8 – Total €77,761 €15,355
National €779,895 €617,639
Community Healthcare Organisation 2016 2015 € €
S E C T I O N
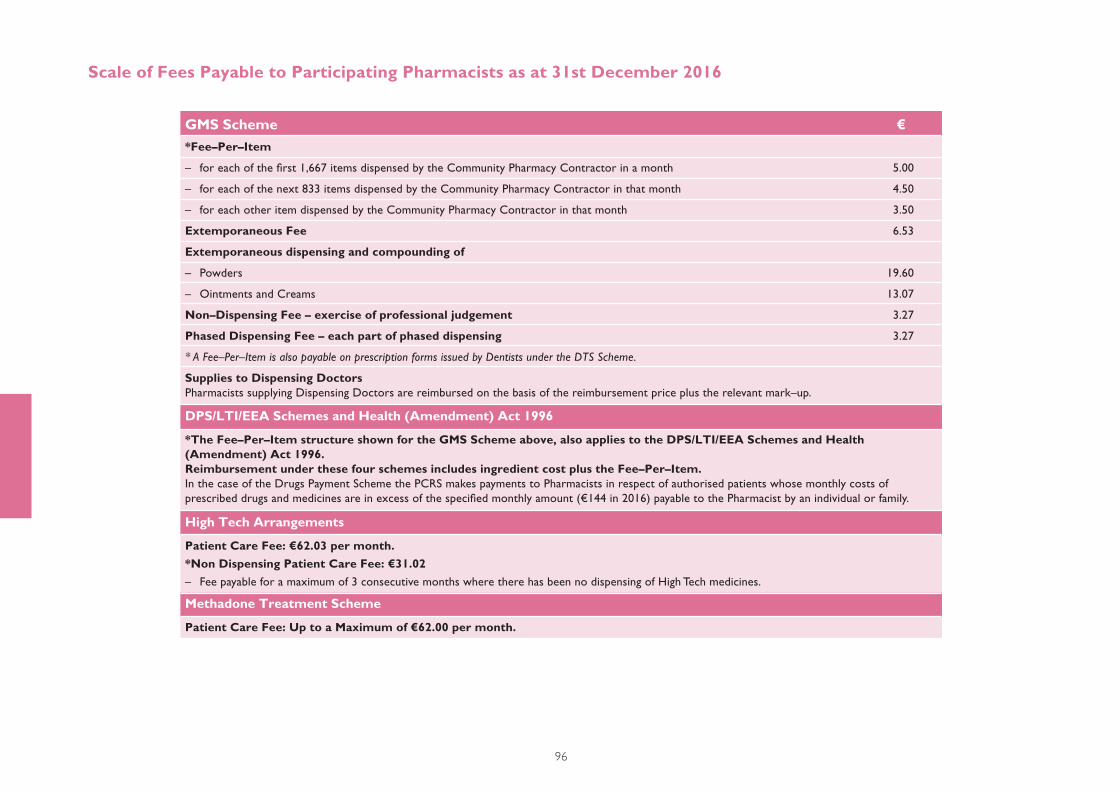
96
Scale of Fees Payable to Participating Pharmacists as at 31st December 2016
GMS Scheme €
DPS/LTI/EEA Schemes and Health (Amendment) Act 1996
High Tech Arrangements
Methadone Treatment Scheme
*Fee–Per–Item
– for each of the fi rst 1,667 items dispensed by the Community Pharmacy Contractor in a month 5.00
– for each of the next 833 items dispensed by the Community Pharmacy Contractor in that month 4.50
– for each other item dispensed by the Community Pharmacy Contractor in that month 3.50
Extemporaneous Fee 6.53
Extemporaneous dispensing and compounding of
– Powders 19.60
– Ointments and Creams 13.07
Non–Dispensing Fee – exercise of professional judgement 3.27
Phased Dispensing Fee – each part of phased dispensing 3.27
* A Fee–Per–Item is also payable on prescription forms issued by Dentists under the DTS Scheme.
Supplies to Dispensing DoctorsPharmacists supplying Dispensing Doctors are reimbursed on the basis of the reimbursement price plus the relevant mark–up.
*The Fee–Per–Item structure shown for the GMS Scheme above, also applies to the DPS/LTI/EEA Schemes and Health (Amendment) Act 1996.Reimbursement under these four schemes includes ingredient cost plus the Fee–Per–Item. In the case of the Drugs Payment Scheme the PCRS makes payments to Pharmacists in respect of authorised patients whose monthly costs of
prescribed drugs and medicines are in excess of the specifi ed monthly amount (€144 in 2016) payable to the Pharmacist by an individual or family.
Patient Care Fee: €62.03 per month.
*Non Dispensing Patient Care Fee: €31.02
– Fee payable for a maximum of 3 consecutive months where there has been no dispensing of High Tech medicines.
Patient Care Fee: Up to a Maximum of €62.00 per month.
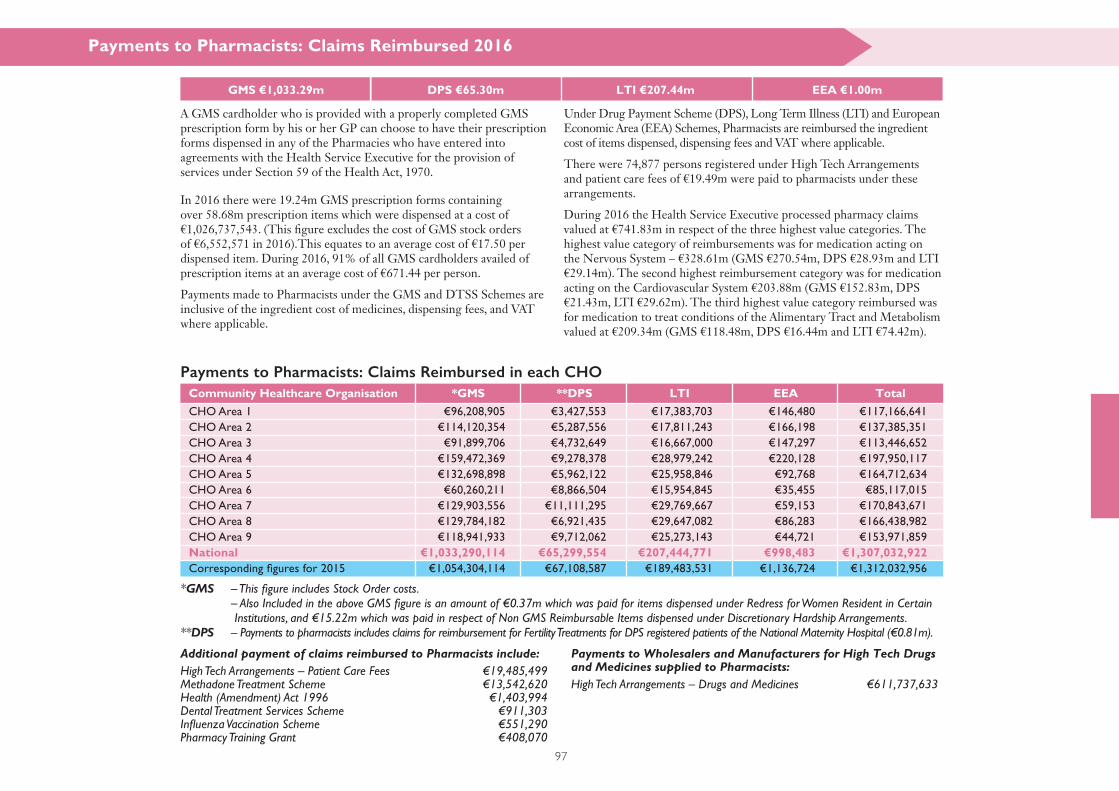
97
Payments to Pharmacists: Claims Reimbursed 2016
GMS €1,033.29m DPS €65.30m LTI €207.44m EEA €1.00m
Payments to Pharmacists: Claims Reimbursed in each CHO
CHO Area 1 €96,208,905 €3,427,553 €17,383,703 €146,480 €117,166,641
CHO Area 2 €114,120,354 €5,287,556 €17,811,243 €166,198 €137,385,351
CHO Area 3 €91,899,706 €4,732,649 €16,667,000 €147,297 €113,446,652
CHO Area 4 €159,472,369 €9,278,378 €28,979,242 €220,128 €197,950,117
CHO Area 5 €132,698,898 €5,962,122 €25,958,846 €92,768 €164,712,634
CHO Area 6 €60,260,211 €8,866,504 €15,954,845 €35,455 €85,117,015
CHO Area 7 €129,903,556 €11,111,295 €29,769,667 €59,153 €170,843,671
CHO Area 8 €129,784,182 €6,921,435 €29,647,082 €86,283 €166,438,982
CHO Area 9 €118,941,933 €9,712,062 €25,273,143 €44,721 €153,971,859
National €1,033,290,114 €65,299,554 €207,444,771 €998,483 €1,307,032,922Corresponding fi gures for 2015 €1,054,304,114 €67,108,587 €189,483,531 €1,136,724 €1,312,032,956
*GMS – This fi gure includes Stock Order costs. – Also Included in the above GMS fi gure is an amount of €0.37m which was paid for items dispensed under Redress for Women Resident in Certain Institutions, and €15.22m which was paid in respect of Non GMS Reimbursable Items dispensed under Discretionary Hardship Arrangements.**DPS – Payments to pharmacists includes claims for reimbursement for Fertility Treatments for DPS registered patients of the National Maternity Hospital (€0.81m).
Additional payment of claims reimbursed to Pharmacists include:High Tech Arrangements – Patient Care Fees €19,485,499Methadone Treatment Scheme €13,542,620Health (Amendment) Act 1996 €1,403,994Dental Treatment Services Scheme €911,303Infl uenza Vaccination Scheme €551,290Pharmacy Training Grant €408,070
Payments to Wholesalers and Manufacturers for High Tech Drugs and Medicines supplied to Pharmacists:High Tech Arrangements – Drugs and Medicines €611,737,633
Community Healthcare Organisation *GMS LTI **DPS EEA Total
A GMS cardholder who is provided with a properly completed GMS prescription form by his or her GP can choose to have their prescription forms dispensed in any of the Pharmacies who have entered into agreements with the Health Service Executive for the provision of services under Section 59 of the Health Act, 1970.
In 2016 there were 19.24m GMS prescription forms containing over 58.68m prescription items which were dispensed at a cost of €1,026,737,543. (This fi gure excludes the cost of GMS stock orders of €6,552,571 in 2016).This equates to an average cost of €17.50 per dispensed item. During 2016, 91% of all GMS cardholders availed of prescription items at an average cost of €671.44 per person.
Payments made to Pharmacists under the GMS and DTSS Schemes are inclusive of the ingredient cost of medicines, dispensing fees, and VAT where applicable.
Under Drug Payment Scheme (DPS), Long Term Illness (LTI) and European Economic Area (EEA) Schemes, Pharmacists are reimbursed the ingredient cost of items dispensed, dispensing fees and VAT where applicable.
There were 74,877 persons registered under High Tech Arrangements and patient care fees of €19.49m were paid to pharmacists under these arrangements.
During 2016 the Health Service Executive processed pharmacy claims valued at €741.83m in respect of the three highest value categories. The highest value category of reimbursements was for medication acting on the Nervous System – €328.61m (GMS €270.54m, DPS €28.93m and LTI €29.14m). The second highest reimbursement category was for medication acting on the Cardiovascular System €203.88m (GMS €152.83m, DPS €21.43m, LTI €29.62m). The third highest value category reimbursed was for medication to treat conditions of the Alimentary Tract and Metabolism valued at €209.34m (GMS €118.48m, DPS €16.44m and LTI €74.42m).
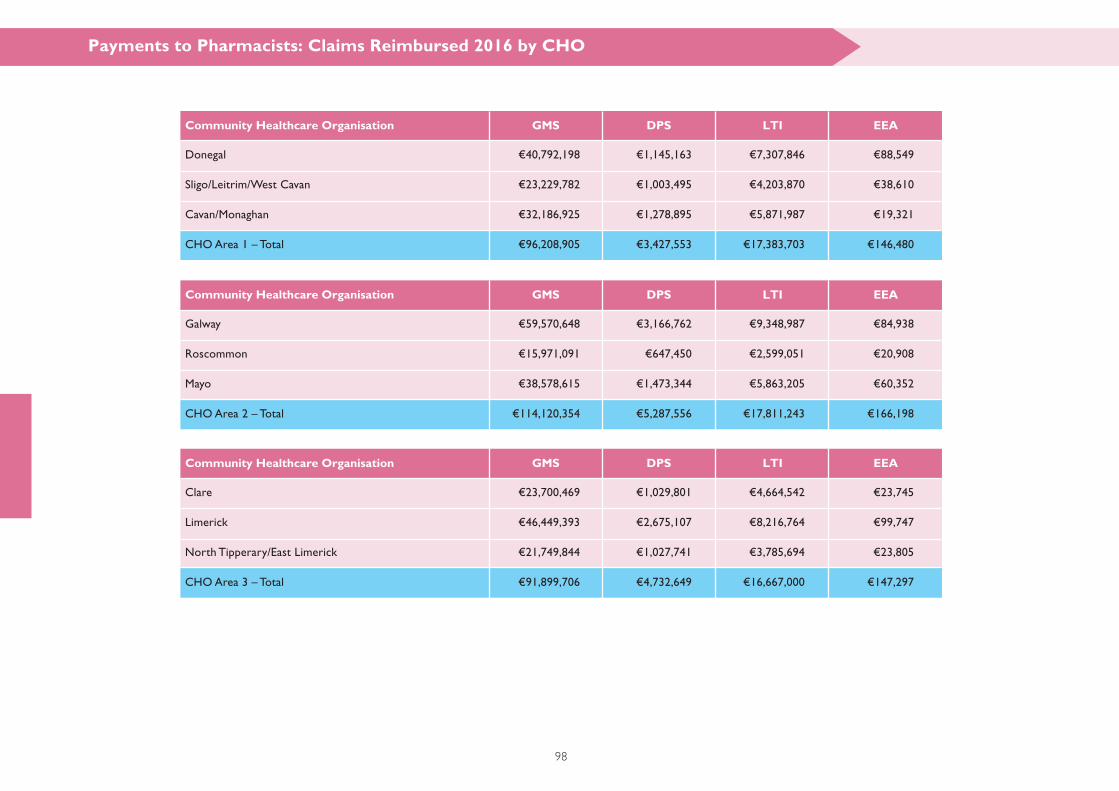
98
Payments to Pharmacists: Claims Reimbursed 2016 by CHO
Community Healthcare Organisation
Community Healthcare Organisation
Community Healthcare Organisation
GMS
GMS
GMS
LTI
LTI
LTI
DPS
DPS
DPS
EEA
EEA
EEA
Donegal €40,792,198 €1,145,163 €7,307,846 €88,549
Sligo/Leitrim/West Cavan €23,229,782 €1,003,495 €4,203,870 €38,610
Cavan/Monaghan €32,186,925 €1,278,895 €5,871,987 €19,321
CHO Area 1 – Total €96,208,905 €3,427,553 €17,383,703 €146,480
Galway €59,570,648 €3,166,762 €9,348,987 €84,938
Roscommon €15,971,091 €647,450 €2,599,051 €20,908
Mayo €38,578,615 €1,473,344 €5,863,205 €60,352
CHO Area 2 – Total €114,120,354 €5,287,556 €17,811,243 €166,198
Clare €23,700,469 €1,029,801 €4,664,542 €23,745
Limerick €46,449,393 €2,675,107 €8,216,764 €99,747
North Tipperary/East Limerick €21,749,844 €1,027,741 €3,785,694 €23,805
CHO Area 3 – Total €91,899,706 €4,732,649 €16,667,000 €147,297
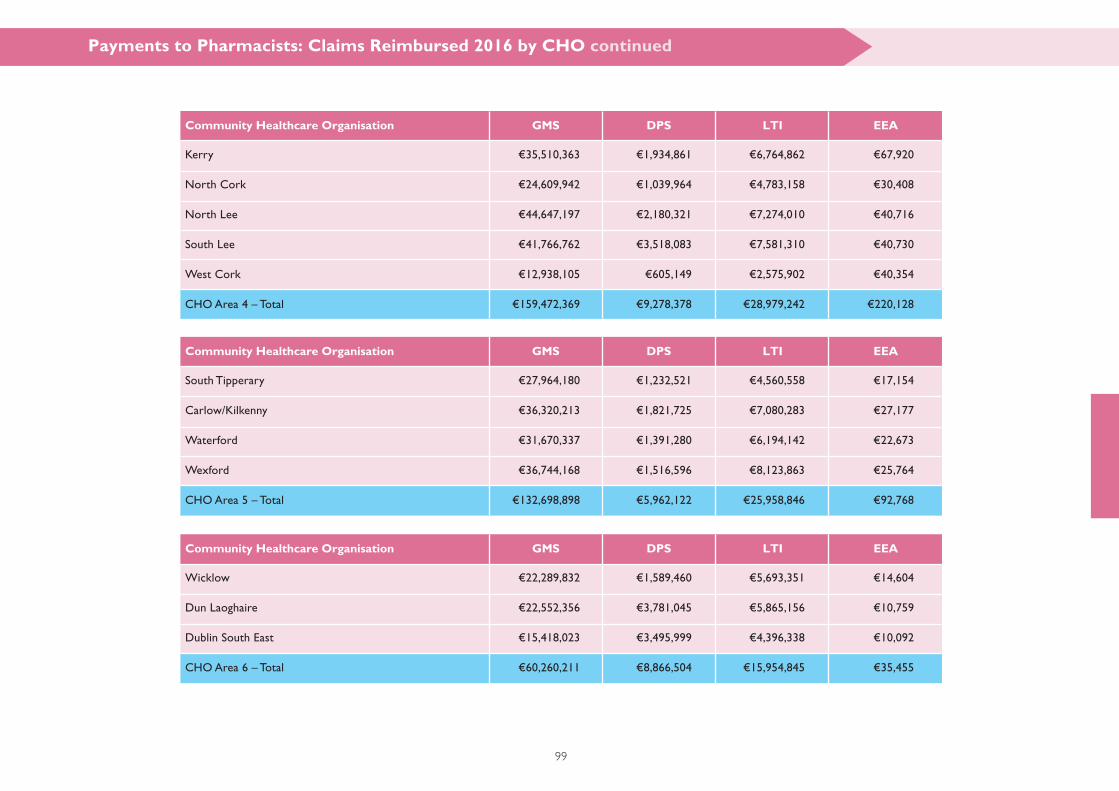
99
Payments to Pharmacists: Claims Reimbursed 2016 by CHO continued
Community Healthcare Organisation GMS LTI DPS EEA
Wicklow €22,289,832 €1,589,460 €5,693,351 €14,604
Dun Laoghaire €22,552,356 €3,781,045 €5,865,156 €10,759
Dublin South East €15,418,023 €3,495,999 €4,396,338 €10,092
CHO Area 6 – Total €60,260,211 €8,866,504 €15,954,845 €35,455
Community Healthcare Organisation
Community Healthcare Organisation
GMS
GMS
LTI
LTI
DPS
DPS
EEA
EEA
South Tipperary €27,964,180 €1,232,521 €4,560,558 €17,154
Carlow/Kilkenny €36,320,213 €1,821,725 €7,080,283 €27,177
Waterford €31,670,337 €1,391,280 €6,194,142 €22,673
Wexford €36,744,168 €1,516,596 €8,123,863 €25,764
CHO Area 5 – Total €132,698,898 €5,962,122 €25,958,846 €92,768
Kerry €35,510,363 €1,934,861 €6,764,862 €67,920
North Cork €24,609,942 €1,039,964 €4,783,158 €30,408
North Lee €44,647,197 €2,180,321 €7,274,010 €40,716
South Lee €41,766,762 €3,518,083 €7,581,310 €40,730
West Cork €12,938,105 €605,149 €2,575,902 €40,354
CHO Area 4 – Total €159,472,369 €9,278,378 €28,979,242 €220,128
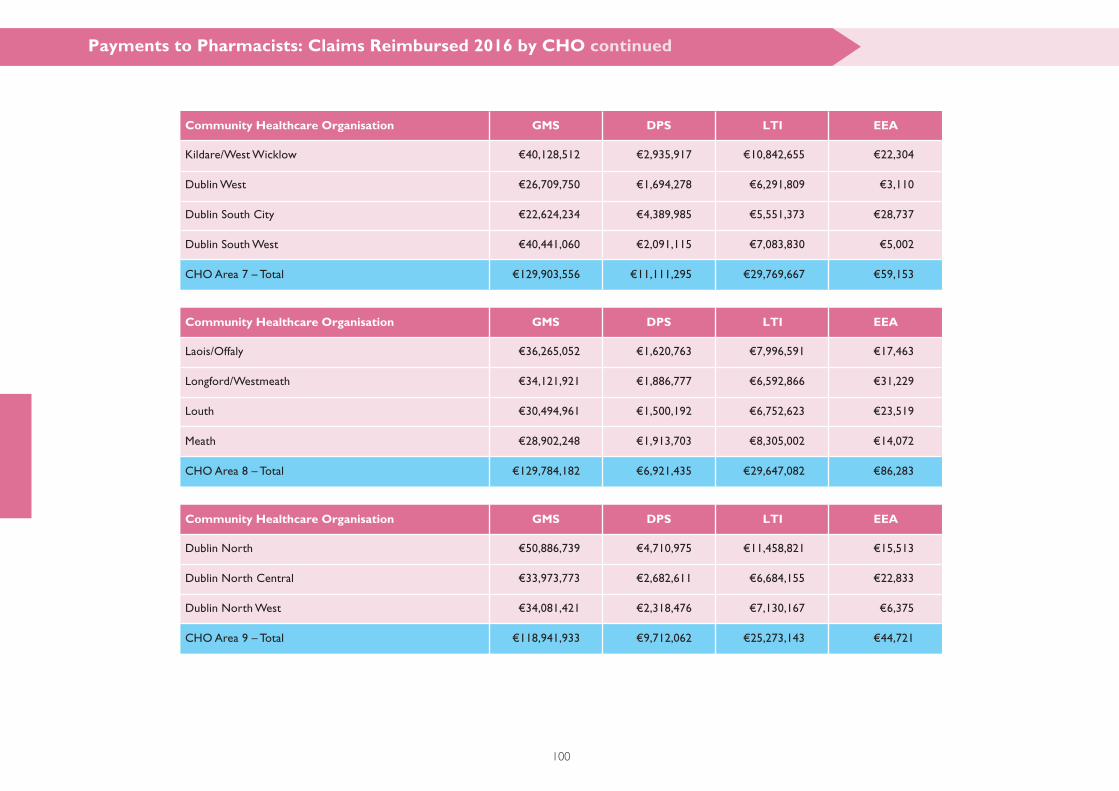
100
Payments to Pharmacists: Claims Reimbursed 2016 by CHO continued
Community Healthcare Organisation GMS LTI DPS EEA
Dublin North €50,886,739 €4,710,975 €11,458,821 €15,513
Dublin North Central €33,973,773 €2,682,611 €6,684,155 €22,833
Dublin North West €34,081,421 €2,318,476 €7,130,167 €6,375
CHO Area 9 – Total €118,941,933 €9,712,062 €25,273,143 €44,721
Community Healthcare Organisation
Community Healthcare Organisation
GMS
GMS
LTI
LTI
DPS
DPS
EEA
EEA
Kildare/West Wicklow €40,128,512 €2,935,917 €10,842,655 €22,304
Dublin West €26,709,750 €1,694,278 €6,291,809 €3,110
Dublin South City €22,624,234 €4,389,985 €5,551,373 €28,737
Dublin South West €40,441,060 €2,091,115 €7,083,830 €5,002
CHO Area 7 – Total €129,903,556 €11,111,295 €29,769,667 €59,153
Laois/Offaly €36,265,052 €1,620,763 €7,996,591 €17,463
Longford/Westmeath €34,121,921 €1,886,777 €6,592,866 €31,229
Louth €30,494,961 €1,500,192 €6,752,623 €23,519
Meath €28,902,248 €1,913,703 €8,305,002 €14,072
CHO Area 8 – Total €129,784,182 €6,921,435 €29,647,082 €86,283
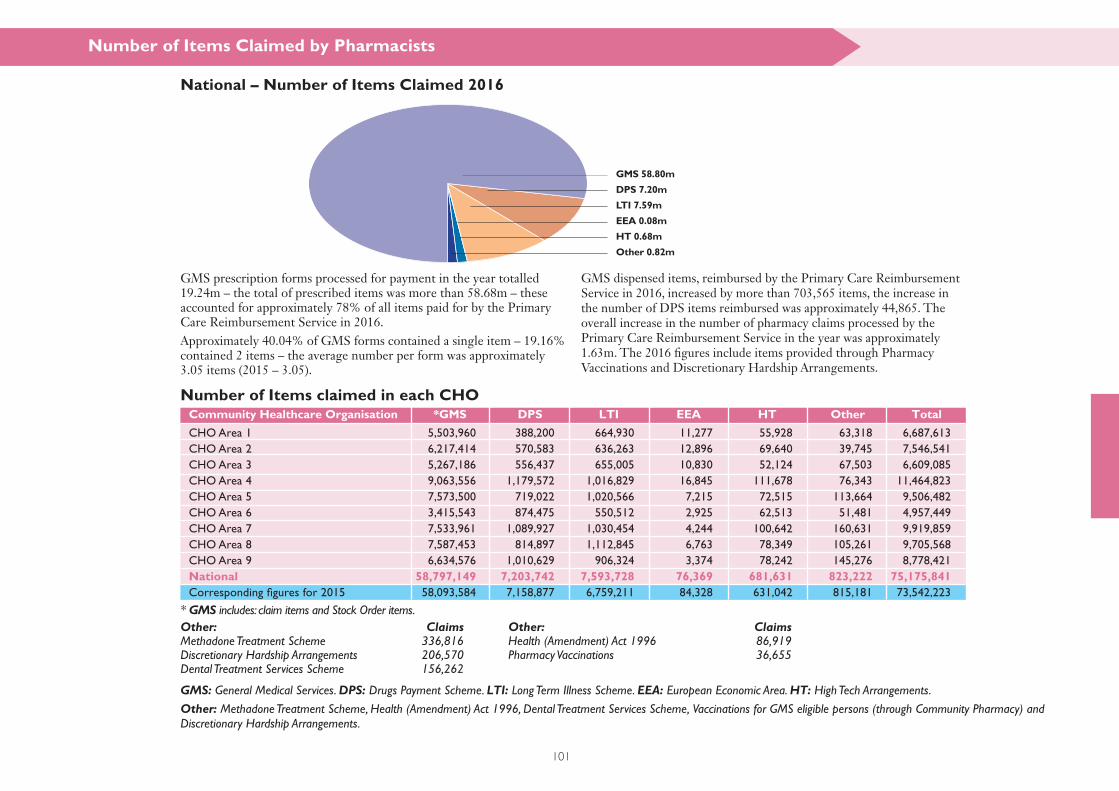
GMS prescription forms processed for payment in the year totalled 19.24m – the total of prescribed items was more than 58.68m – these accounted for approximately 78% of all items paid for by the Primary Care Reimbursement Service in 2016.Approximately 40.04% of GMS forms contained a single item – 19.16% contained 2 items – the average number per form was approximately 3.05 items (2015 – 3.05).
GMS dispensed items, reimbursed by the Primary Care Reimbursement Service in 2016, increased by more than 703,565 items, the increase in the number of DPS items reimbursed was approximately 44,865. The overall increase in the number of pharmacy claims processed by the Primary Care Reimbursement Service in the year was approximately 1.63m. The 2016 fi gures include items provided through Pharmacy Vaccinations and Discretionary Hardship Arrangements.
GMS: General Medical Services. DPS: Drugs Payment Scheme. LTI: Long Term Illness Scheme. EEA: European Economic Area. HT: High Tech Arrangements.
Other: Methadone Treatment Scheme, Health (Amendment) Act 1996, Dental Treatment Services Scheme, Vaccinations for GMS eligible persons (through Community Pharmacy) and Discretionary Hardship Arrangements.
* GMS includes: claim items and Stock Order items. Other: ClaimsMethadone Treatment Scheme 336,816Discretionary Hardship Arrangements 206,570Dental Treatment Services Scheme 156,262
Other: ClaimsHealth (Amendment) Act 1996 86,919Pharmacy Vaccinations 36,655
EEA 0.08m
HT 0.68m
Other 0.82m
LTI 7.59m
DPS 7.20m
GMS 58.80m
101
Number of Items claimed in each CHO
National – Number of Items Claimed 2016
Community Healthcare Organisation *GMS LTI DPS EEA HT Other Total
Number of Items Claimed by Pharmacists
CHO Area 1 5,503,960 388,200 664,930 11,277 55,928 63,318 6,687,613
CHO Area 2 6,217,414 570,583 636,263 12,896 69,640 39,745 7,546,541
CHO Area 3 5,267,186 556,437 655,005 10,830 52,124 67,503 6,609,085
CHO Area 4 9,063,556 1,179,572 1,016,829 16,845 111,678 76,343 11,464,823
CHO Area 5 7,573,500 719,022 1,020,566 7,215 72,515 113,664 9,506,482
CHO Area 6 3,415,543 874,475 550,512 2,925 62,513 51,481 4,957,449
CHO Area 7 7,533,961 1,089,927 1,030,454 4,244 100,642 160,631 9,919,859
CHO Area 8 7,587,453 814,897 1,112,845 6,763 78,349 105,261 9,705,568
CHO Area 9 6,634,576 1,010,629 906,324 3,374 78,242 145,276 8,778,421
National 58,797,149 7,203,742 7,593,728 76,369 681,631 823,222 75,175,841Corresponding fi gures for 2015 58,093,584 7,158,877 6,759,211 84,328 631,042 815,181 73,542,223
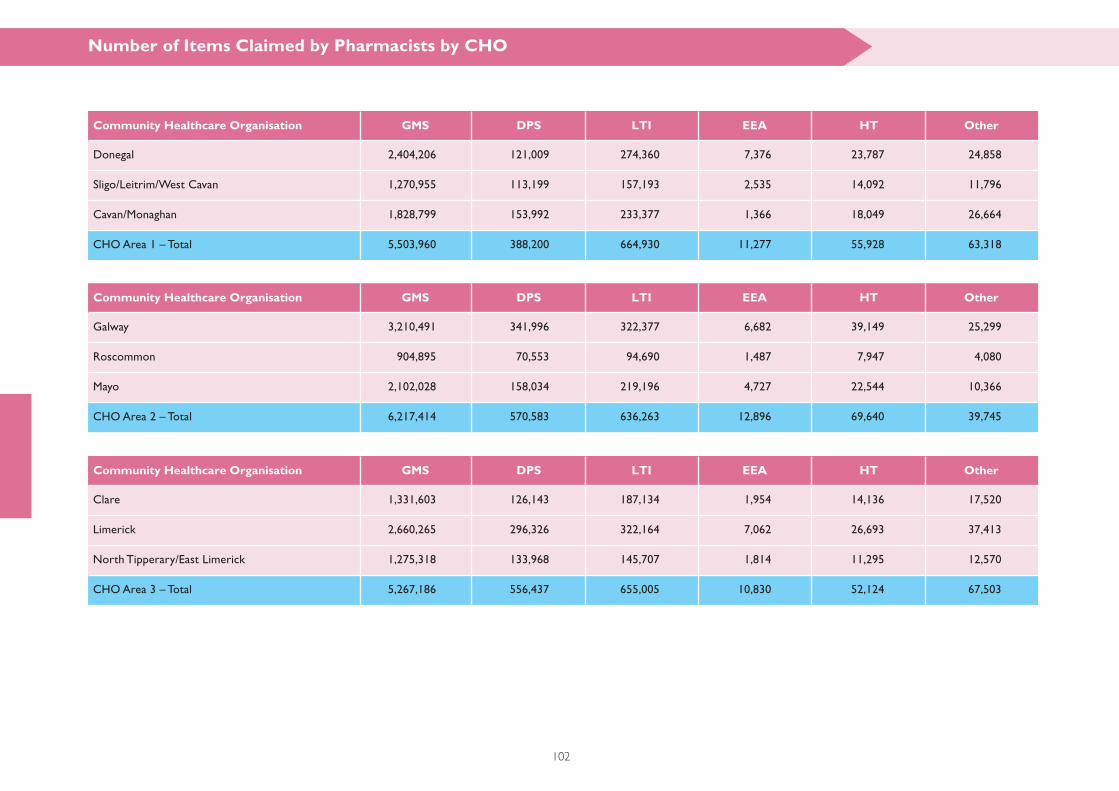
102
Number of Items Claimed by Pharmacists by CHO
Community Healthcare Organisation
Community Healthcare Organisation
Community Healthcare Organisation
GMS
GMS
GMS
LTI
LTI
LTI
DPS
DPS
DPS
EEA
EEA
EEA
HT
HT
HT
Other
Other
Other
Donegal 2,404,206 121,009 274,360 7,376 23,787 24,858
Sligo/Leitrim/West Cavan 1,270,955 113,199 157,193 2,535 14,092 11,796
Cavan/Monaghan 1,828,799 153,992 233,377 1,366 18,049 26,664
CHO Area 1 – Total 5,503,960 388,200 664,930 11,277 55,928 63,318
Galway 3,210,491 341,996 322,377 6,682 39,149 25,299
Roscommon 904,895 70,553 94,690 1,487 7,947 4,080
Mayo 2,102,028 158,034 219,196 4,727 22,544 10,366
CHO Area 2 – Total 6,217,414 570,583 636,263 12,896 69,640 39,745
Clare 1,331,603 126,143 187,134 1,954 14,136 17,520
Limerick 2,660,265 296,326 322,164 7,062 26,693 37,413
North Tipperary/East Limerick 1,275,318 133,968 145,707 1,814 11,295 12,570
CHO Area 3 – Total 5,267,186 556,437 655,005 10,830 52,124 67,503

103
Community Healthcare Organisation
Community Healthcare Organisation
Community Healthcare Organisation
GMS
GMS
GMS
LTI
LTI
LTI
DPS
DPS
DPS
EEA
EEA
EEA
HT
HT
HT
Other
Other
Other
Wicklow 1,293,605 182,222 211,412 1,156 15,654 17,409
Dun Laoghaire 1,271,667 403,124 202,054 995 19,889 18,875
Dublin South East 850,271 289,129 137,046 774 26,970 15,197
CHO Area 6 – Total 3,415,543 874,475 550,512 2,925 62,513 51,481
Kerry 2,009,986 227,089 240,739 5,062 23,388 14,810
North Cork 1,430,945 142,851 177,999 2,285 16,036 9,905
North Lee 2,523,351 266,674 248,628 3,241 29,676 28,337
South Lee 2,334,764 463,684 250,529 3,142 33,110 19,238
West Cork 764,510 79,274 98,934 3,115 9,468 4,053
CHO Area 4 – Total 9,063,556 1,179,572 1,016,829 16,845 111,678 76,343
South Tipperary 1,541,309 143,182 171,467 1,261 14,596 23,729
Carlow/Kilkenny 2,058,199 228,685 298,483 2,186 18,477 30,086
Waterford 1,825,920 155,855 234,268 1,695 18,751 31,762
Wexford 2,148,072 191,300 316,348 2,073 20,691 28,087
CHO Area 5 – Total 7,573,500 719,022 1,020,566 7,215 72,515 113,664
Number of Items Claimed by Pharmacists continued
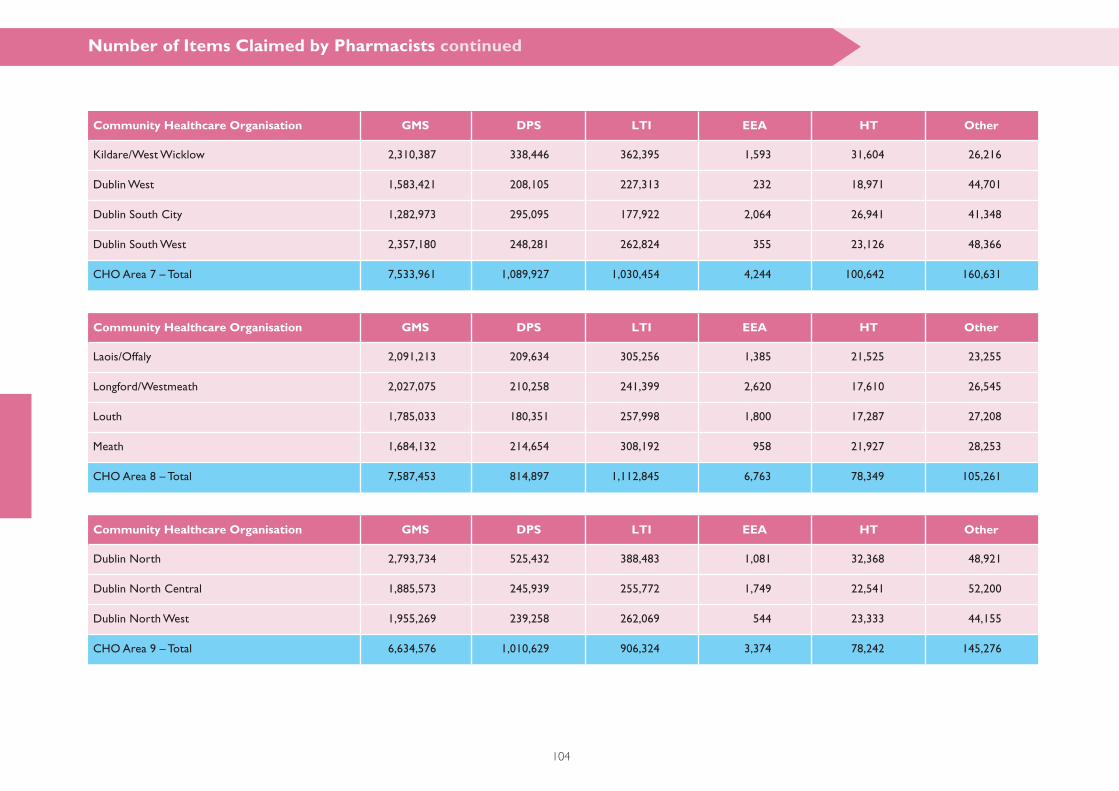
104
Number of Items Claimed by Pharmacists continued
Community Healthcare Organisation
Community Healthcare Organisation
Community Healthcare Organisation
GMS
GMS
GMS
LTI
LTI
LTI
DPS
DPS
DPS
EEA
EEA
EEA
HT
HT
HT
Other
Other
Other
Dublin North 2,793,734 525,432 388,483 1,081 32,368 48,921
Dublin North Central 1,885,573 245,939 255,772 1,749 22,541 52,200
Dublin North West 1,955,269 239,258 262,069 544 23,333 44,155
CHO Area 9 – Total 6,634,576 1,010,629 906,324 3,374 78,242 145,276
Kildare/West Wicklow 2,310,387 338,446 362,395 1,593 31,604 26,216
Dublin West 1,583,421 208,105 227,313 232 18,971 44,701
Dublin South City 1,282,973 295,095 177,922 2,064 26,941 41,348
Dublin South West 2,357,180 248,281 262,824 355 23,126 48,366
CHO Area 7 – Total 7,533,961 1,089,927 1,030,454 4,244 100,642 160,631
Laois/Offaly 2,091,213 209,634 305,256 1,385 21,525 23,255
Longford/Westmeath 2,027,075 210,258 241,399 2,620 17,610 26,545
Louth 1,785,033 180,351 257,998 1,800 17,287 27,208
Meath 1,684,132 214,654 308,192 958 21,927 28,253
CHO Area 8 – Total 7,587,453 814,897 1,112,845 6,763 78,349 105,261
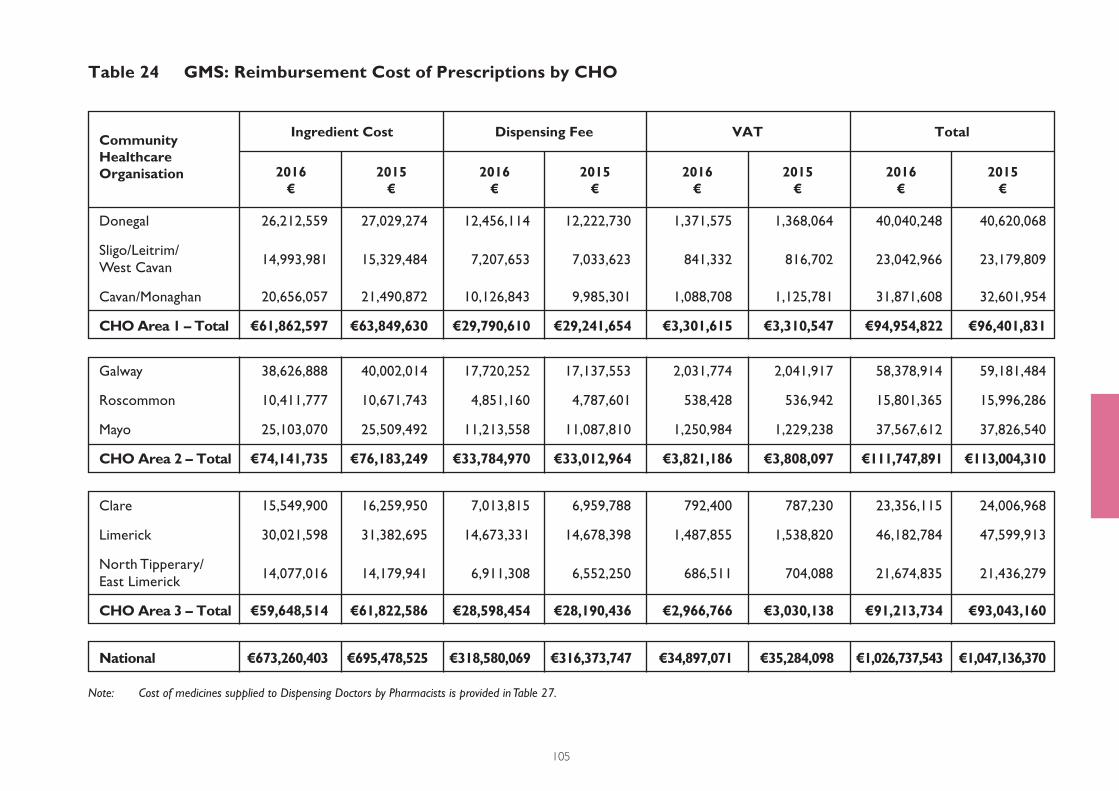
Table 24 GMS: Reimbursement Cost of Prescriptions by CHO
105
CommunityHealthcare Organisation
Ingredient Cost
2016€
2016€
2016€
2016€
2015€
2015€
2015€
2015€
VAT TotalDispensing Fee
Donegal 26,212,559 27,029,274 12,456,114 12,222,730 1,371,575 1,368,064 40,040,248 40,620,068
Sligo/Leitrim/
West Cavan 14,993,981 15,329,484 7,207,653 7,033,623 841,332 816,702 23,042,966 23,179,809
Cavan/Monaghan 20,656,057 21,490,872 10,126,843 9,985,301 1,088,708 1,125,781 31,871,608 32,601,954
CHO Area 1 – Total €61,862,597 €63,849,630 €29,790,610 €29,241,654 €3,301,615 €3,310,547 €94,954,822 €96,401,831
Galway 38,626,888 40,002,014 17,720,252 17,137,553 2,031,774 2,041,917 58,378,914 59,181,484
Roscommon 10,411,777 10,671,743 4,851,160 4,787,601 538,428 536,942 15,801,365 15,996,286
Mayo 25,103,070 25,509,492 11,213,558 11,087,810 1,250,984 1,229,238 37,567,612 37,826,540
CHO Area 2 – Total €74,141,735 €76,183,249 €33,784,970 €33,012,964 €3,821,186 €3,808,097 €111,747,891 €113,004,310
Clare 15,549,900 16,259,950 7,013,815 6,959,788 792,400 787,230 23,356,115 24,006,968
Limerick 30,021,598 31,382,695 14,673,331 14,678,398 1,487,855 1,538,820 46,182,784 47,599,913
North Tipperary/
East Limerick 14,077,016 14,179,941 6,911,308 6,552,250 686,511 704,088 21,674,835 21,436,279
CHO Area 3 – Total €59,648,514 €61,822,586 €28,598,454 €28,190,436 €2,966,766 €3,030,138 €91,213,734 €93,043,160
National €673,260,403 €695,478,525 €318,580,069 €316,373,747 €34,897,071 €35,284,098 €1,026,737,543 €1,047,136,370
Note: Cost of medicines supplied to Dispensing Doctors by Pharmacists is provided in Table 27.
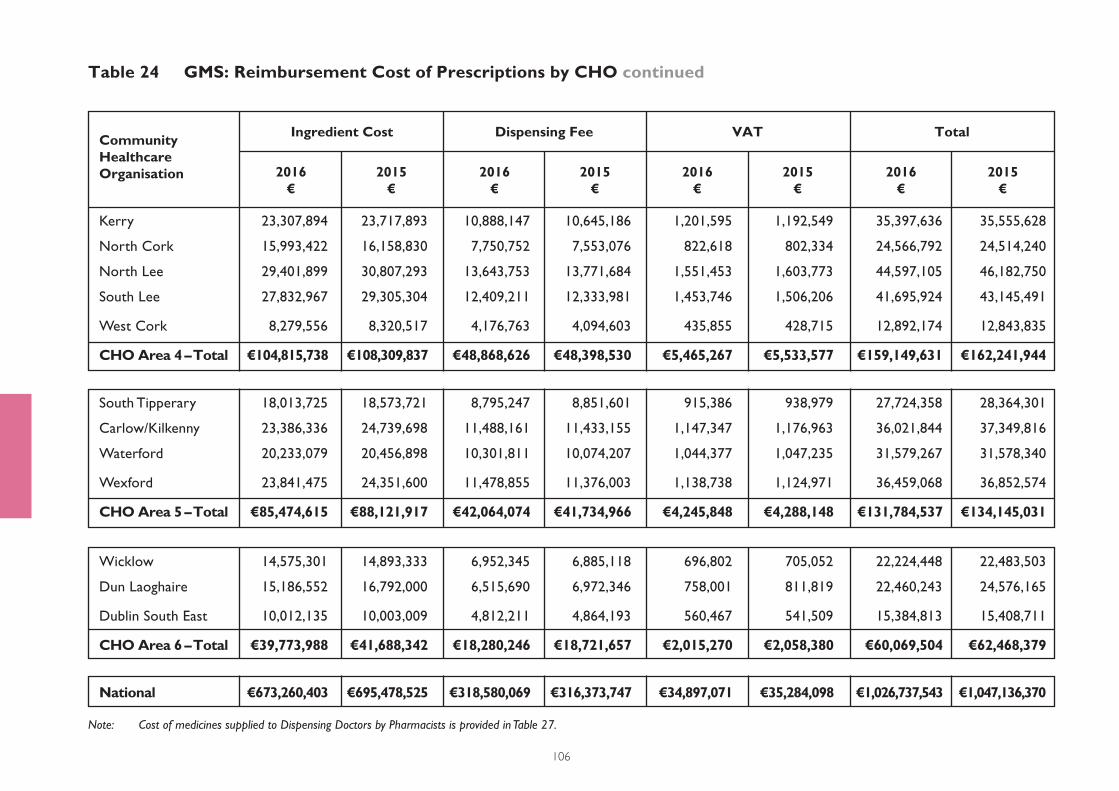
Table 24 GMS: Reimbursement Cost of Prescriptions by CHO continued
106
CommunityHealthcare Organisation
Ingredient Cost
2016€
2016€
2016€
2016€
2015€
2015€
2015€
2015€
VAT TotalDispensing Fee
Kerry 23,307,894 23,717,893 10,888,147 10,645,186 1,201,595 1,192,549 35,397,636 35,555,628
North Cork 15,993,422 16,158,830 7,750,752 7,553,076 822,618 802,334 24,566,792 24,514,240
North Lee 29,401,899 30,807,293 13,643,753 13,771,684 1,551,453 1,603,773 44,597,105 46,182,750
South Lee 27,832,967 29,305,304 12,409,211 12,333,981 1,453,746 1,506,206 41,695,924 43,145,491
West Cork 8,279,556 8,320,517 4,176,763 4,094,603 435,855 428,715 12,892,174 12,843,835
CHO Area 4 – Total €104,815,738 €108,309,837 €48,868,626 €48,398,530 €5,465,267 €5,533,577 €159,149,631 €162,241,944
Wicklow 14,575,301 14,893,333 6,952,345 6,885,118 696,802 705,052 22,224,448 22,483,503
Dun Laoghaire 15,186,552 16,792,000 6,515,690 6,972,346 758,001 811,819 22,460,243 24,576,165
Dublin South East 10,012,135 10,003,009 4,812,211 4,864,193 560,467 541,509 15,384,813 15,408,711
CHO Area 6 – Total €39,773,988 €41,688,342 €18,280,246 €18,721,657 €2,015,270 €2,058,380 €60,069,504 €62,468,379
South Tipperary 18,013,725 18,573,721 8,795,247 8,851,601 915,386 938,979 27,724,358 28,364,301
Carlow/Kilkenny 23,386,336 24,739,698 11,488,161 11,433,155 1,147,347 1,176,963 36,021,844 37,349,816
Waterford 20,233,079 20,456,898 10,301,811 10,074,207 1,044,377 1,047,235 31,579,267 31,578,340
Wexford 23,841,475 24,351,600 11,478,855 11,376,003 1,138,738 1,124,971 36,459,068 36,852,574
CHO Area 5 – Total €85,474,615 €88,121,917 €42,064,074 €41,734,966 €4,245,848 €4,288,148 €131,784,537 €134,145,031
National €673,260,403 €695,478,525 €318,580,069 €316,373,747 €34,897,071 €35,284,098 €1,026,737,543 €1,047,136,370
Note: Cost of medicines supplied to Dispensing Doctors by Pharmacists is provided in Table 27.
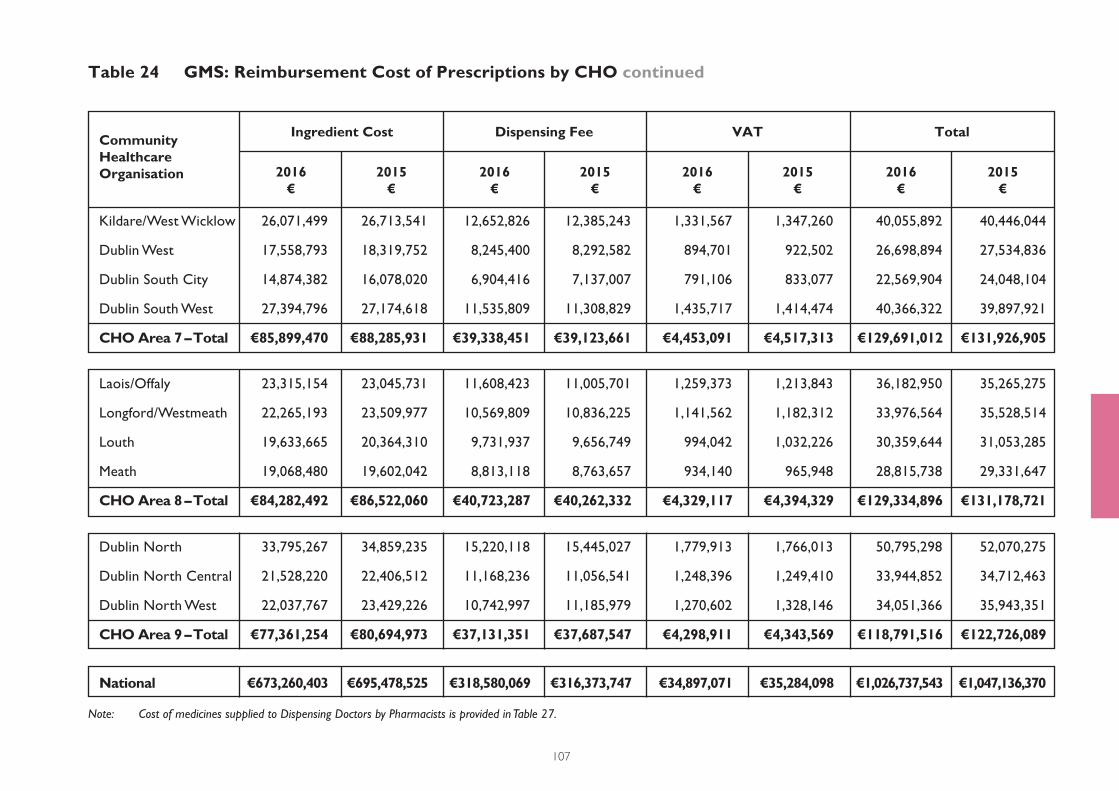
Table 24 GMS: Reimbursement Cost of Prescriptions by CHO continued
107
CommunityHealthcare Organisation
Ingredient Cost
2016€
2016€
2016€
2016€
2015€
2015€
2015€
2015€
VAT TotalDispensing Fee
Kildare/West Wicklow 26,071,499 26,713,541 12,652,826 12,385,243 1,331,567 1,347,260 40,055,892 40,446,044
Dublin West 17,558,793 18,319,752 8,245,400 8,292,582 894,701 922,502 26,698,894 27,534,836
Dublin South City 14,874,382 16,078,020 6,904,416 7,137,007 791,106 833,077 22,569,904 24,048,104
Dublin South West 27,394,796 27,174,618 11,535,809 11,308,829 1,435,717 1,414,474 40,366,322 39,897,921
CHO Area 7 – Total €85,899,470 €88,285,931 €39,338,451 €39,123,661 €4,453,091 €4,517,313 €129,691,012 €131,926,905
Dublin North 33,795,267 34,859,235 15,220,118 15,445,027 1,779,913 1,766,013 50,795,298 52,070,275
Dublin North Central 21,528,220 22,406,512 11,168,236 11,056,541 1,248,396 1,249,410 33,944,852 34,712,463
Dublin North West 22,037,767 23,429,226 10,742,997 11,185,979 1,270,602 1,328,146 34,051,366 35,943,351
CHO Area 9 – Total €77,361,254 €80,694,973 €37,131,351 €37,687,547 €4,298,911 €4,343,569 €118,791,516 €122,726,089
Laois/Offaly 23,315,154 23,045,731 11,608,423 11,005,701 1,259,373 1,213,843 36,182,950 35,265,275
Longford/Westmeath 22,265,193 23,509,977 10,569,809 10,836,225 1,141,562 1,182,312 33,976,564 35,528,514
Louth 19,633,665 20,364,310 9,731,937 9,656,749 994,042 1,032,226 30,359,644 31,053,285
Meath 19,068,480 19,602,042 8,813,118 8,763,657 934,140 965,948 28,815,738 29,331,647
CHO Area 8 – Total €84,282,492 €86,522,060 €40,723,287 €40,262,332 €4,329,117 €4,394,329 €129,334,896 €131,178,721
National €673,260,403 €695,478,525 €318,580,069 €316,373,747 €34,897,071 €35,284,098 €1,026,737,543 €1,047,136,370
Note: Cost of medicines supplied to Dispensing Doctors by Pharmacists is provided in Table 27.
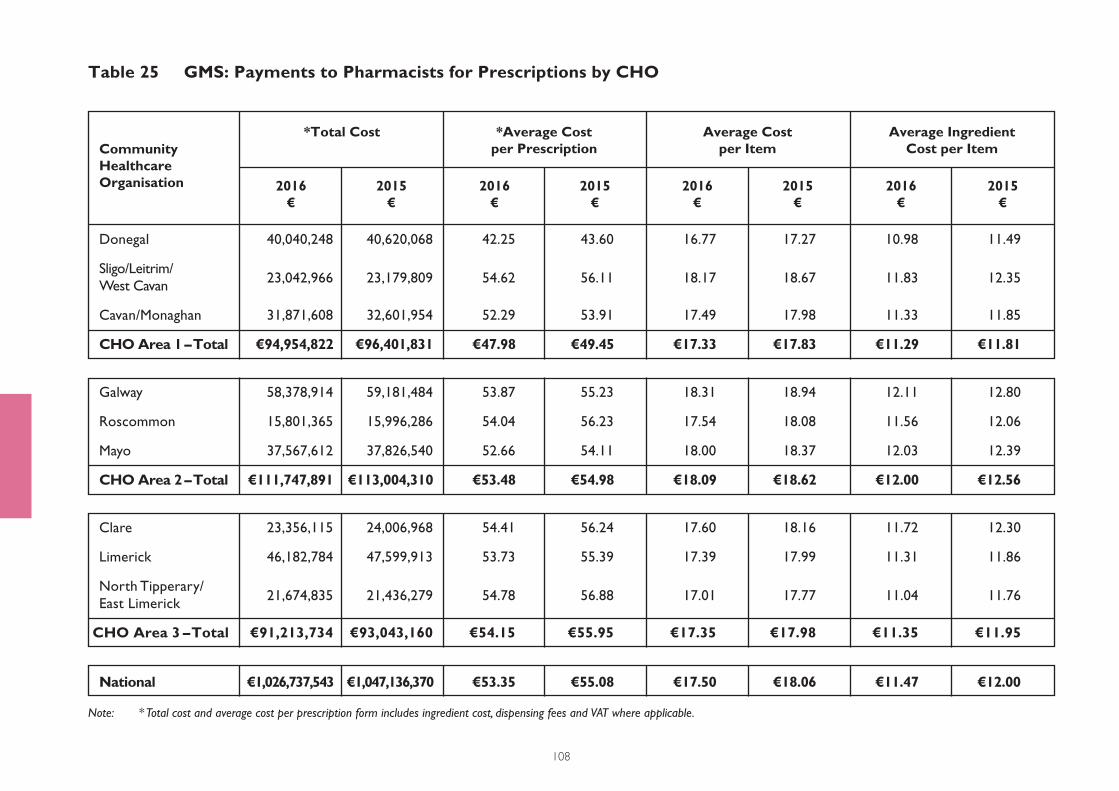
Table 25 GMS: Payments to Pharmacists for Prescriptions by CHO
108
CommunityHealthcare Organisation
*Total Cost
2016€
2016€
2016€
2016€
2015€
2015€
2015€
2015€
Average Costper Item
Average IngredientCost per Item
*Average Costper Prescription
Donegal 40,040,248 40,620,068 42.25 43.60 16.77 17.27 10.98 11.49
Sligo/Leitrim/
West Cavan 23,042,966 23,179,809 54.62 56.11 18.17 18.67 11.83 12.35
Cavan/Monaghan 31,871,608 32,601,954 52.29 53.91 17.49 17.98 11.33 11.85
CHO Area 1 – Total €94,954,822 €96,401,831 €47.98 €49.45 €17.33 €17.83 €11.29 €11.81
Galway 58,378,914 59,181,484 53.87 55.23 18.31 18.94 12.11 12.80
Roscommon 15,801,365 15,996,286 54.04 56.23 17.54 18.08 11.56 12.06
Mayo 37,567,612 37,826,540 52.66 54.11 18.00 18.37 12.03 12.39
CHO Area 2 – Total €111,747,891 €113,004,310 €53.48 €54.98 €18.09 €18.62 €12.00 €12.56
Clare 23,356,115 24,006,968 54.41 56.24 17.60 18.16 11.72 12.30
Limerick 46,182,784 47,599,913 53.73 55.39 17.39 17.99 11.31 11.86
North Tipperary/
East Limerick 21,674,835 21,436,279 54.78 56.88 17.01 17.77 11.04 11.76
CHO Area 3 – Total €91,213,734 €93,043,160 €54.15 €55.95 €17.35 €17.98 €11.35 €11.95
National €1,026,737,543 €1,047,136,370 €53.35 €55.08 €17.50 €18.06 €11.47 €12.00
Note: * Total cost and average cost per prescription form includes ingredient cost, dispensing fees and VAT where applicable.

Table 25 GMS: Payments to Pharmacists for Prescriptions by CHO continued
CommunityHealthcare Organisation
*Total Cost
2016€
2016€
2016€
2016€
2015€
2015€
2015€
2015€
Average Costper Item
Average IngredientCost per Item
*Average Costper Prescription
109
Wicklow 22,224,448 22,483,503 50.60 52.67 17.19 17.67 11.28 11.71
Dun Laoghaire 22,460,243 24,576,165 60.36 63.24 17.68 18.19 11.95 12.43
Dublin South East 15,384,813 15,408,711 61.62 63.82 18.11 18.59 11.78 12.07
CHO Area 6 – Total €60,069,504 €62,468,379 €56.62 €59.10 €17.60 €18.09 €11.65 €12.08
South Tipperary 27,724,358 28,364,301 57.68 59.00 18.03 18.44 11.72 12.08
Carlow/Kilkenny 36,021,844 37,349,816 52.89 55.57 17.54 18.28 11.39 12.11
Waterford 31,579,267 31,578,340 52.62 53.69 17.31 17.57 11.09 11.39
Wexford 36,459,068 36,852,574 49.42 50.74 17.01 17.47 11.12 11.54
CHO Area 5 – Total €131,784,537 €134,145,031 €52.72 €54.37 €17.43 €17.92 €11.31 €11.77
National €1,026,737,543 €1,047,136,370 €53.35 €55.08 €17.50 €18.06 €11.47 €12.00
Note: * Total cost and average cost per prescription form includes ingredient cost, dispensing fees and VAT where applicable.
Kerry 35,397,636 35,555,628 54.53 55.85 17.63 18.09 11.61 12.07
North Cork 24,566,792 24,514,240 50.88 52.37 17.18 17.77 11.18 11.72
North Lee 44,597,105 46,182,750 53.93 55.73 17.68 18.27 11.66 12.19
South Lee 41,695,924 43,145,491 57.32 59.38 17.87 18.46 11.93 12.54
West Cork 12,892,174 12,843,835 49.43 50.45 16.88 17.09 10.84 11.07
CHO Area 4 – Total €159,149,631 €162,241,944 €54.00 €55.67 €17.57 €18.11 €11.57 €12.09
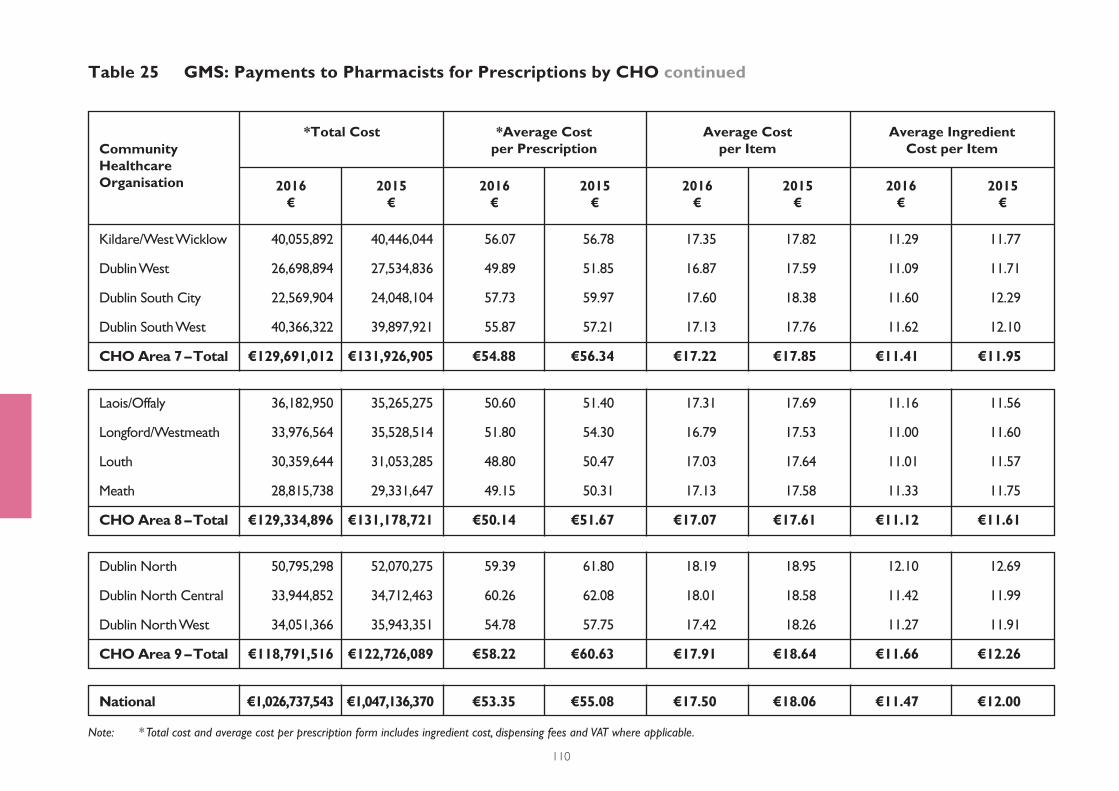
Table 25 GMS: Payments to Pharmacists for Prescriptions by CHO continued
110
CommunityHealthcare Organisation
*Total Cost
2016€
2016€
2016€
2016€
2015€
2015€
2015€
2015€
Average Costper Item
Average IngredientCost per Item
*Average Costper Prescription
Kildare/West Wicklow 40,055,892 40,446,044 56.07 56.78 17.35 17.82 11.29 11.77
Dublin West 26,698,894 27,534,836 49.89 51.85 16.87 17.59 11.09 11.71
Dublin South City 22,569,904 24,048,104 57.73 59.97 17.60 18.38 11.60 12.29
Dublin South West 40,366,322 39,897,921 55.87 57.21 17.13 17.76 11.62 12.10
CHO Area 7 – Total €129,691,012 €131,926,905 €54.88 €56.34 €17.22 €17.85 €11.41 €11.95
Dublin North 50,795,298 52,070,275 59.39 61.80 18.19 18.95 12.10 12.69
Dublin North Central 33,944,852 34,712,463 60.26 62.08 18.01 18.58 11.42 11.99
Dublin North West 34,051,366 35,943,351 54.78 57.75 17.42 18.26 11.27 11.91
CHO Area 9 – Total €118,791,516 €122,726,089 €58.22 €60.63 €17.91 €18.64 €11.66 €12.26
Laois/Offaly 36,182,950 35,265,275 50.60 51.40 17.31 17.69 11.16 11.56
Longford/Westmeath 33,976,564 35,528,514 51.80 54.30 16.79 17.53 11.00 11.60
Louth 30,359,644 31,053,285 48.80 50.47 17.03 17.64 11.01 11.57
Meath 28,815,738 29,331,647 49.15 50.31 17.13 17.58 11.33 11.75
CHO Area 8 – Total €129,334,896 €131,178,721 €50.14 €51.67 €17.07 €17.61 €11.12 €11.61
National €1,026,737,543 €1,047,136,370 €53.35 €55.08 €17.50 €18.06 €11.47 €12.00
Note: * Total cost and average cost per prescription form includes ingredient cost, dispensing fees and VAT where applicable.
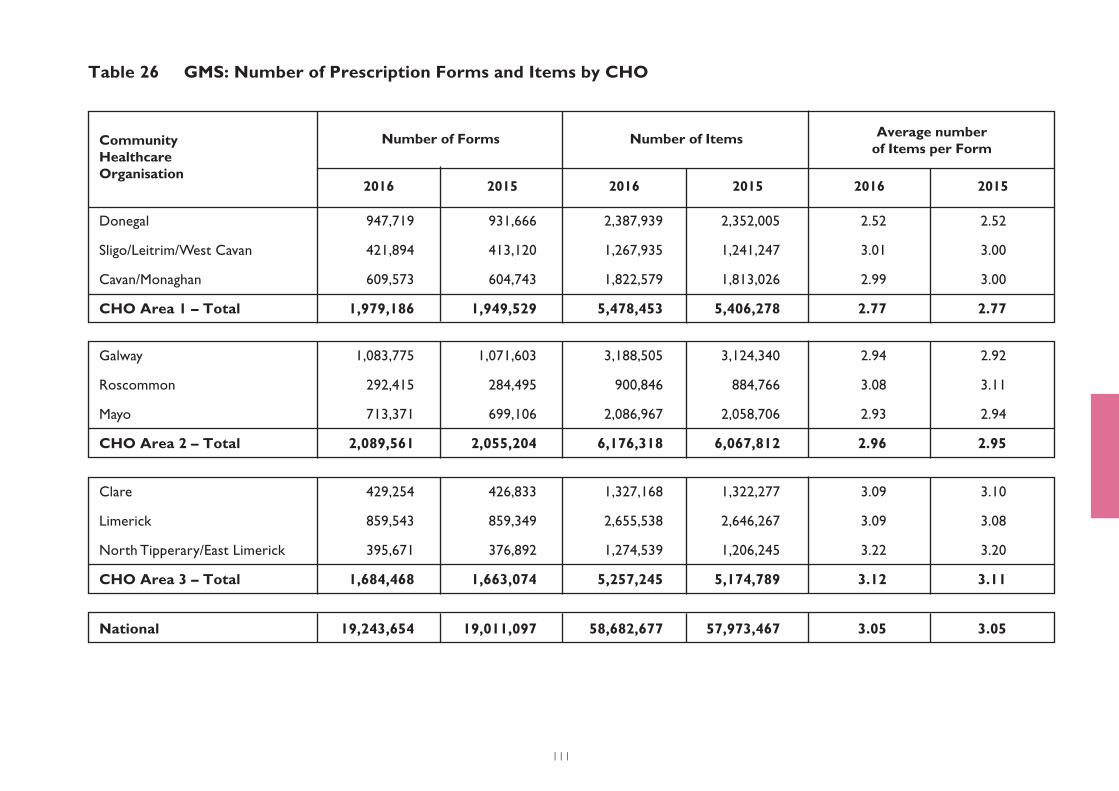
Table 26 GMS: Number of Prescription Forms and Items by CHO
111
CommunityHealthcare Organisation
Number of Forms
2016 2016 20162015 2015 2015
Average numberof Items per Form
Number of Items
Donegal 947,719 931,666 2,387,939 2,352,005 2.52 2.52
Sligo/Leitrim/West Cavan 421,894 413,120 1,267,935 1,241,247 3.01 3.00
Cavan/Monaghan 609,573 604,743 1,822,579 1,813,026 2.99 3.00
CHO Area 1 – Total 1,979,186 1,949,529 5,478,453 5,406,278 2.77 2.77
Galway 1,083,775 1,071,603 3,188,505 3,124,340 2.94 2.92
Roscommon 292,415 284,495 900,846 884,766 3.08 3.11
Mayo 713,371 699,106 2,086,967 2,058,706 2.93 2.94
CHO Area 2 – Total 2,089,561 2,055,204 6,176,318 6,067,812 2.96 2.95
Clare 429,254 426,833 1,327,168 1,322,277 3.09 3.10
Limerick 859,543 859,349 2,655,538 2,646,267 3.09 3.08
North Tipperary/East Limerick 395,671 376,892 1,274,539 1,206,245 3.22 3.20
CHO Area 3 – Total 1,684,468 1,663,074 5,257,245 5,174,789 3.12 3.11
National 19,243,654 19,011,097 58,682,677 57,973,467 3.05 3.05

Table 26 GMS: Number of Prescription Forms and Items by CHO continued
112
CommunityHealthcare Organisation
Number of Forms
2016 2016 20162015 2015 2015
Average numberof Items per Form
Number of Items
Kerry 649,143 636,620 2,007,700 1,965,718 3.09 3.09
North Cork 482,827 468,104 1,430,164 1,379,233 2.96 2.95
North Lee 826,952 828,643 2,521,984 2,527,206 3.05 3.05
South Lee 727,438 726,558 2,333,272 2,336,677 3.21 3.22
West Cork 260,837 254,581 763,780 751,703 2.93 2.95
CHO Area 4 – Total 2,947,197 2,914,506 9,056,900 8,960,537 3.07 3.07
Wicklow 439,211 426,859 1,292,541 1,272,320 2.94 2.98
Dun Laoghaire 372,085 388,616 1,270,537 1,351,426 3.41 3.48
Dublin South East 249,666 241,434 849,636 828,681 3.40 3.43
CHO Area 6 – Total 1,060,962 1,056,909 3,412,714 3,452,427 3.22 3.27
South Tipperary 480,697 480,743 1,537,461 1,538,050 3.20 3.20
Carlow/Kilkenny 681,038 672,082 2,053,834 2,042,840 3.02 3.04
Waterford 600,119 588,157 1,824,405 1,796,796 3.04 3.05
Wexford 737,789 726,296 2,143,129 2,109,657 2.90 2.90
CHO Area 5 – Total 2,499,643 2,467,278 7,558,829 7,487,343 3.02 3.03
National 19,243,654 19,011,097 58,682,677 57,973,467 3.05 3.05
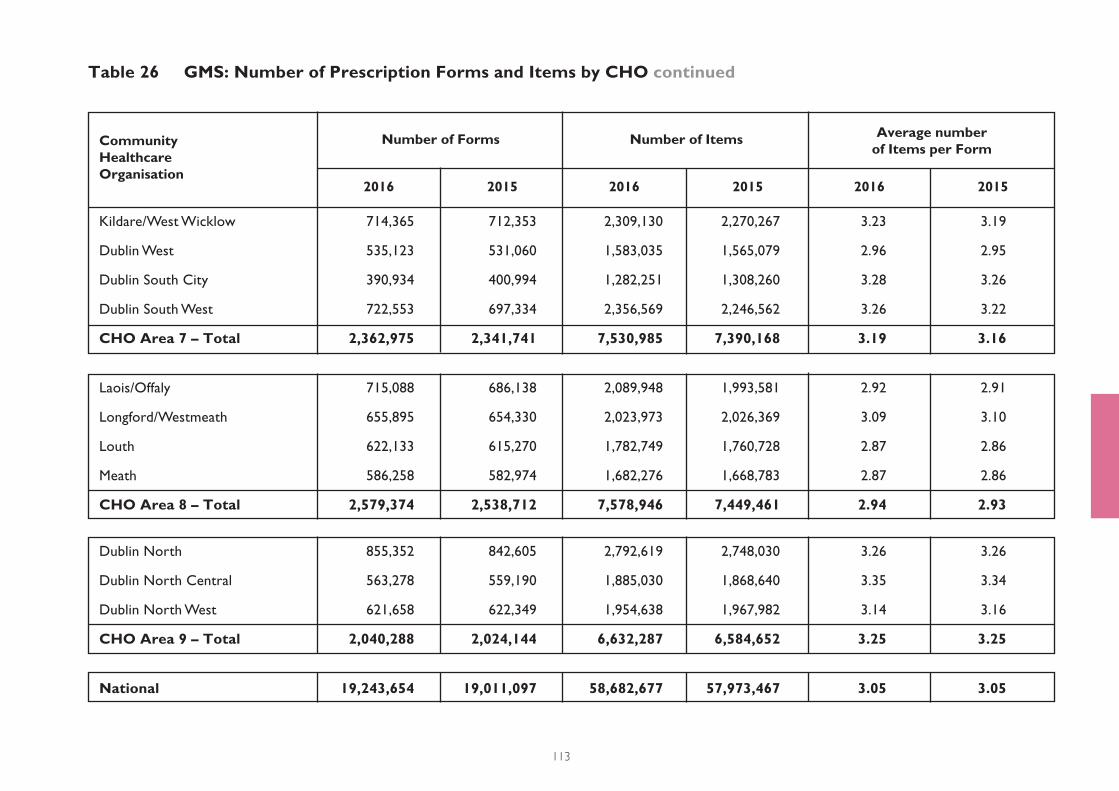
Table 26 GMS: Number of Prescription Forms and Items by CHO continued
113
CommunityHealthcare Organisation
Number of Forms
2016 2016 20162015 2015 2015
Average numberof Items per Form
Number of Items
Kildare/West Wicklow 714,365 712,353 2,309,130 2,270,267 3.23 3.19
Dublin West 535,123 531,060 1,583,035 1,565,079 2.96 2.95
Dublin South City 390,934 400,994 1,282,251 1,308,260 3.28 3.26
Dublin South West 722,553 697,334 2,356,569 2,246,562 3.26 3.22
CHO Area 7 – Total 2,362,975 2,341,741 7,530,985 7,390,168 3.19 3.16
Dublin North 855,352 842,605 2,792,619 2,748,030 3.26 3.26
Dublin North Central 563,278 559,190 1,885,030 1,868,640 3.35 3.34
Dublin North West 621,658 622,349 1,954,638 1,967,982 3.14 3.16
CHO Area 9 – Total 2,040,288 2,024,144 6,632,287 6,584,652 3.25 3.25
Laois/Offaly 715,088 686,138 2,089,948 1,993,581 2.92 2.91
Longford/Westmeath 655,895 654,330 2,023,973 2,026,369 3.09 3.10
Louth 622,133 615,270 1,782,749 1,760,728 2.87 2.86
Meath 586,258 582,974 1,682,276 1,668,783 2.87 2.86
CHO Area 8 – Total 2,579,374 2,538,712 7,578,946 7,449,461 2.94 2.93
National 19,243,654 19,011,097 58,682,677 57,973,467 3.05 3.05
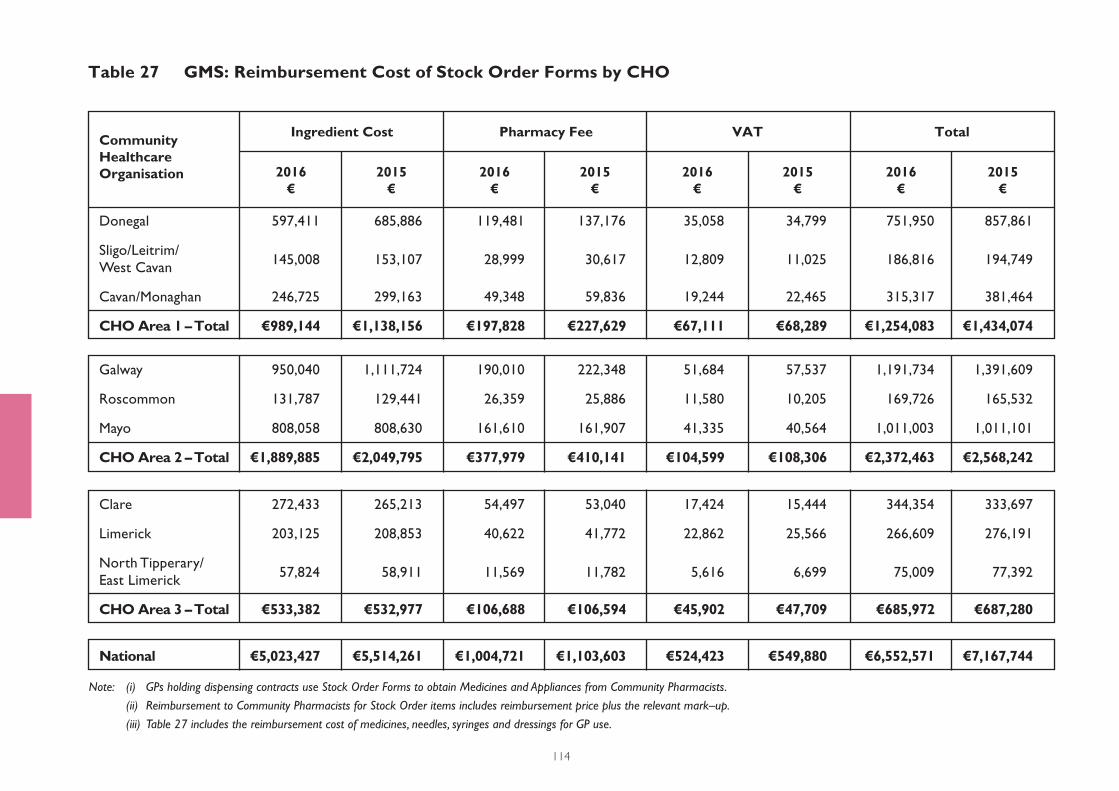
Table 27 GMS: Reimbursement Cost of Stock Order Forms by CHO
114
CommunityHealthcare Organisation
Ingredient Cost
2016€
2016€
2016€
2016€
2015€
2015€
2015€
2015€
VAT Total Pharmacy Fee
Donegal 597,411 685,886 119,481 137,176 35,058 34,799 751,950 857,861
Sligo/Leitrim/
West Cavan 145,008 153,107 28,999 30,617 12,809 11,025 186,816 194,749
Cavan/Monaghan 246,725 299,163 49,348 59,836 19,244 22,465 315,317 381,464
CHO Area 1 – Total €989,144 €1,138,156 €197,828 €227,629 €67,111 €68,289 €1,254,083 €1,434,074
Galway 950,040 1,111,724 190,010 222,348 51,684 57,537 1,191,734 1,391,609
Roscommon 131,787 129,441 26,359 25,886 11,580 10,205 169,726 165,532
Mayo 808,058 808,630 161,610 161,907 41,335 40,564 1,011,003 1,011,101
CHO Area 2 – Total €1,889,885 €2,049,795 €377,979 €410,141 €104,599 €108,306 €2,372,463 €2,568,242
Clare 272,433 265,213 54,497 53,040 17,424 15,444 344,354 333,697
Limerick 203,125 208,853 40,622 41,772 22,862 25,566 266,609 276,191
North Tipperary/
East Limerick 57,824 58,911 11,569 11,782 5,616 6,699 75,009 77,392
CHO Area 3 – Total €533,382 €532,977 €106,688 €106,594 €45,902 €47,709 €685,972 €687,280
National €5,023,427 €5,514,261 €1,004,721 €1,103,603 €524,423 €549,880 €6,552,571 €7,167,744
Note: (i) GPs holding dispensing contracts use Stock Order Forms to obtain Medicines and Appliances from Community Pharmacists.
(ii) Reimbursement to Community Pharmacists for Stock Order items includes reimbursement price plus the relevant mark–up.
(iii) Table 27 includes the reimbursement cost of medicines, needles, syringes and dressings for GP use.
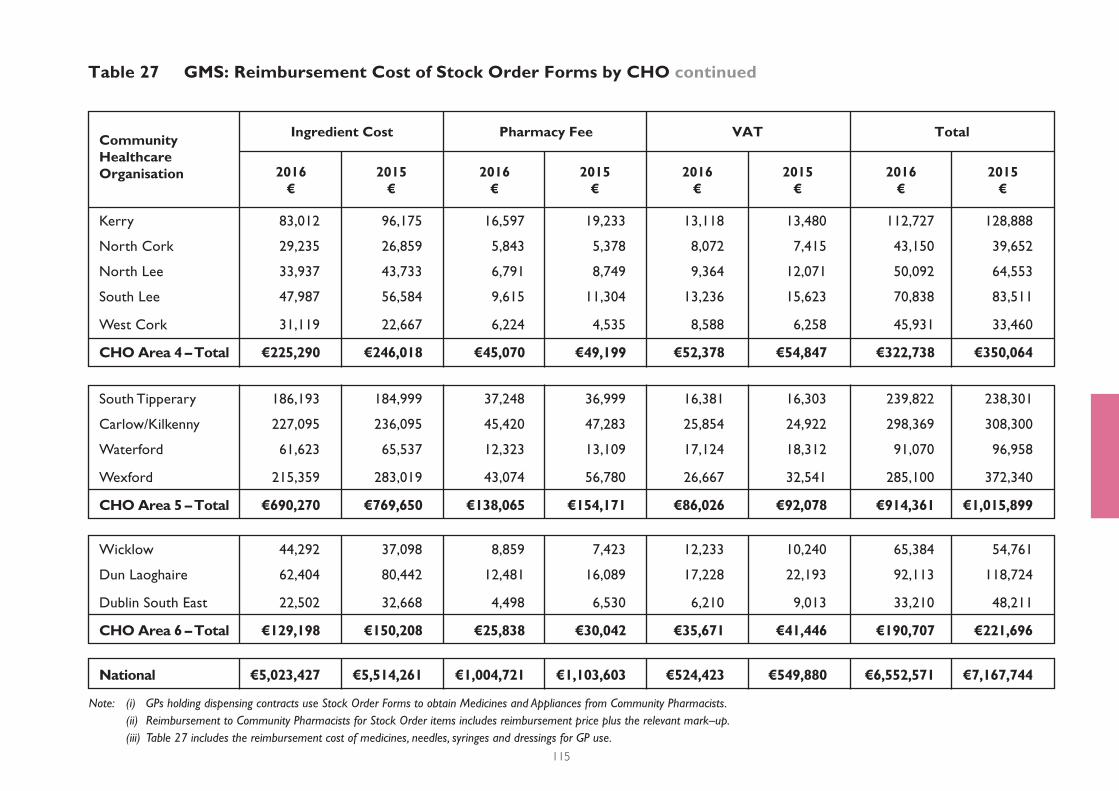
Table 27 GMS: Reimbursement Cost of Stock Order Forms by CHO continued
115
National €5,023,427 €5,514,261 €1,004,721 €1,103,603 €524,423 €549,880 €6,552,571 €7,167,744
Note: (i) GPs holding dispensing contracts use Stock Order Forms to obtain Medicines and Appliances from Community Pharmacists. (ii) Reimbursement to Community Pharmacists for Stock Order items includes reimbursement price plus the relevant mark–up. (iii) Table 27 includes the reimbursement cost of medicines, needles, syringes and dressings for GP use.
CommunityHealthcare Organisation
Ingredient Cost
2016€
2016€
2016€
2016€
2015€
2015€
2015€
2015€
VAT Total Pharmacy Fee
Kerry 83,012 96,175 16,597 19,233 13,118 13,480 112,727 128,888
North Cork 29,235 26,859 5,843 5,378 8,072 7,415 43,150 39,652
North Lee 33,937 43,733 6,791 8,749 9,364 12,071 50,092 64,553
South Lee 47,987 56,584 9,615 11,304 13,236 15,623 70,838 83,511
West Cork 31,119 22,667 6,224 4,535 8,588 6,258 45,931 33,460
CHO Area 4 – Total €225,290 €246,018 €45,070 €49,199 €52,378 €54,847 €322,738 €350,064
Wicklow 44,292 37,098 8,859 7,423 12,233 10,240 65,384 54,761
Dun Laoghaire 62,404 80,442 12,481 16,089 17,228 22,193 92,113 118,724
Dublin South East 22,502 32,668 4,498 6,530 6,210 9,013 33,210 48,211
CHO Area 6 – Total €129,198 €150,208 €25,838 €30,042 €35,671 €41,446 €190,707 €221,696
South Tipperary 186,193 184,999 37,248 36,999 16,381 16,303 239,822 238,301
Carlow/Kilkenny 227,095 236,095 45,420 47,283 25,854 24,922 298,369 308,300
Waterford 61,623 65,537 12,323 13,109 17,124 18,312 91,070 96,958
Wexford 215,359 283,019 43,074 56,780 26,667 32,541 285,100 372,340
CHO Area 5 – Total €690,270 €769,650 €138,065 €154,171 €86,026 €92,078 €914,361 €1,015,899
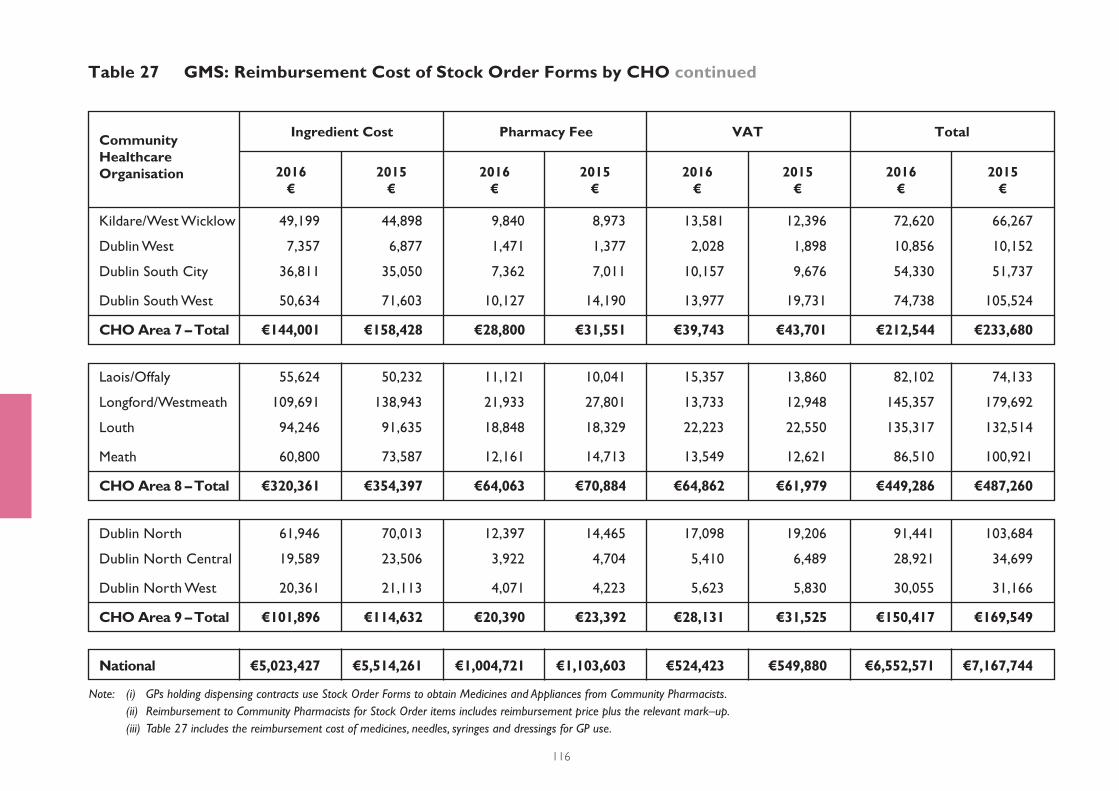
Table 27 GMS: Reimbursement Cost of Stock Order Forms by CHO continued
116
CommunityHealthcare Organisation
Ingredient Cost
2016€
2016€
2016€
2016€
2015€
2015€
2015€
2015€
VAT Total Pharmacy Fee
Kildare/West Wicklow 49,199 44,898 9,840 8,973 13,581 12,396 72,620 66,267
Dublin West 7,357 6,877 1,471 1,377 2,028 1,898 10,856 10,152
Dublin South City 36,811 35,050 7,362 7,011 10,157 9,676 54,330 51,737
Dublin South West 50,634 71,603 10,127 14,190 13,977 19,731 74,738 105,524
CHO Area 7 – Total €144,001 €158,428 €28,800 €31,551 €39,743 €43,701 €212,544 €233,680
Dublin North 61,946 70,013 12,397 14,465 17,098 19,206 91,441 103,684
Dublin North Central 19,589 23,506 3,922 4,704 5,410 6,489 28,921 34,699
Dublin North West 20,361 21,113 4,071 4,223 5,623 5,830 30,055 31,166
CHO Area 9 – Total €101,896 €114,632 €20,390 €23,392 €28,131 €31,525 €150,417 €169,549
Laois/Offaly 55,624 50,232 11,121 10,041 15,357 13,860 82,102 74,133
Longford/Westmeath 109,691 138,943 21,933 27,801 13,733 12,948 145,357 179,692
Louth 94,246 91,635 18,848 18,329 22,223 22,550 135,317 132,514
Meath 60,800 73,587 12,161 14,713 13,549 12,621 86,510 100,921
CHO Area 8 – Total €320,361 €354,397 €64,063 €70,884 €64,862 €61,979 €449,286 €487,260
National €5,023,427 €5,514,261 €1,004,721 €1,103,603 €524,423 €549,880 €6,552,571 €7,167,744
Note: (i) GPs holding dispensing contracts use Stock Order Forms to obtain Medicines and Appliances from Community Pharmacists. (ii) Reimbursement to Community Pharmacists for Stock Order items includes reimbursement price plus the relevant mark–up. (iii) Table 27 includes the reimbursement cost of medicines, needles, syringes and dressings for GP use.
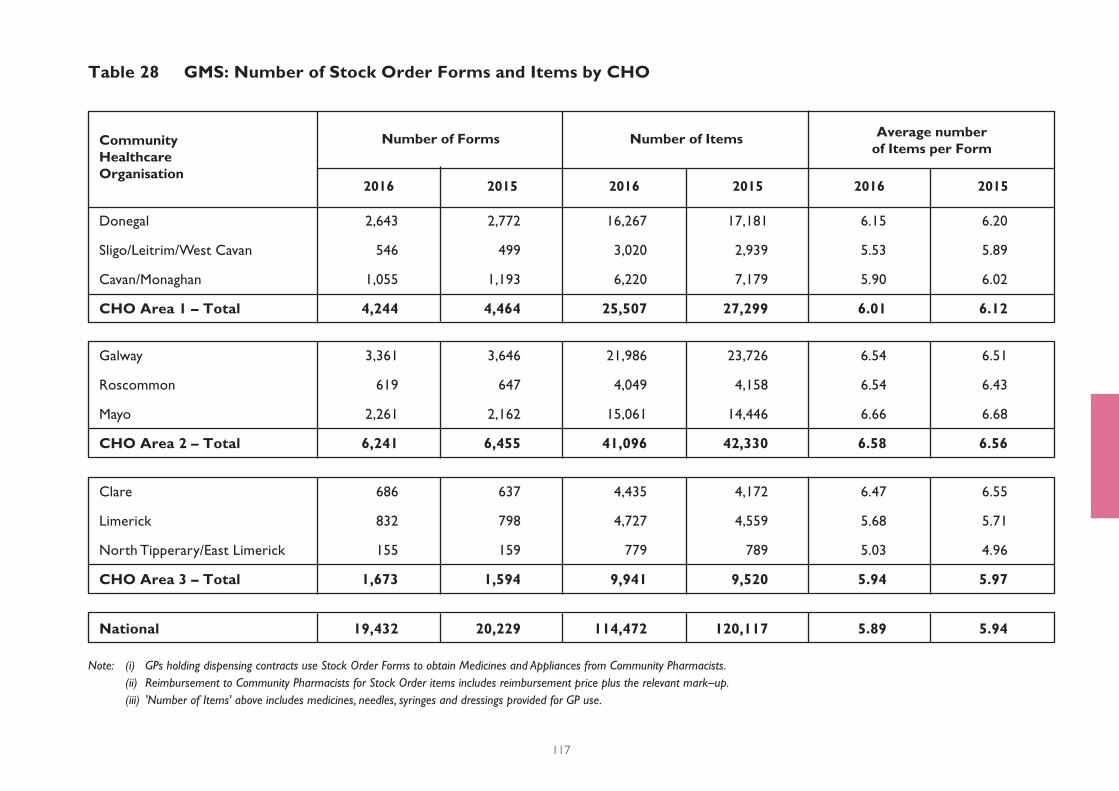
Table 28 GMS: Number of Stock Order Forms and Items by CHO
117
CommunityHealthcare Organisation
Number of Forms
2016 2016 20162015 2015 2015
Average numberof Items per Form
Number of Items
Note: (i) GPs holding dispensing contracts use Stock Order Forms to obtain Medicines and Appliances from Community Pharmacists. (ii) Reimbursement to Community Pharmacists for Stock Order items includes reimbursement price plus the relevant mark–up. (iii) 'Number of Items' above includes medicines, needles, syringes and dressings provided for GP use.
Donegal 2,643 2,772 16,267 17,181 6.15 6.20
Sligo/Leitrim/West Cavan 546 499 3,020 2,939 5.53 5.89
Cavan/Monaghan 1,055 1,193 6,220 7,179 5.90 6.02
CHO Area 1 – Total 4,244 4,464 25,507 27,299 6.01 6.12
Galway 3,361 3,646 21,986 23,726 6.54 6.51
Roscommon 619 647 4,049 4,158 6.54 6.43
Mayo 2,261 2,162 15,061 14,446 6.66 6.68
CHO Area 2 – Total 6,241 6,455 41,096 42,330 6.58 6.56
Clare 686 637 4,435 4,172 6.47 6.55
Limerick 832 798 4,727 4,559 5.68 5.71
North Tipperary/East Limerick 155 159 779 789 5.03 4.96
CHO Area 3 – Total 1,673 1,594 9,941 9,520 5.94 5.97
National 19,432 20,229 114,472 120,117 5.89 5.94
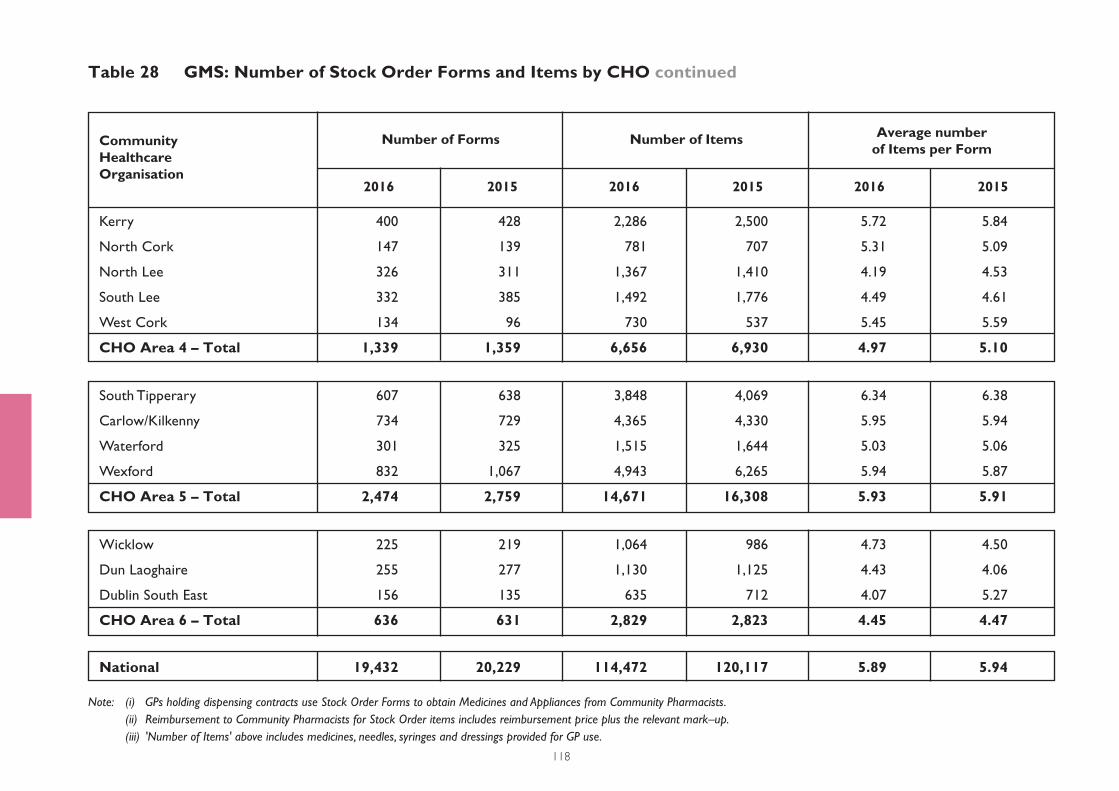
Table 28 GMS: Number of Stock Order Forms and Items by CHO continued
118
CommunityHealthcare Organisation
Number of Forms
2016 2016 20162015 2015 2015
Average numberof Items per Form
Number of Items
Note: (i) GPs holding dispensing contracts use Stock Order Forms to obtain Medicines and Appliances from Community Pharmacists. (ii) Reimbursement to Community Pharmacists for Stock Order items includes reimbursement price plus the relevant mark–up. (iii) 'Number of Items' above includes medicines, needles, syringes and dressings provided for GP use.
Kerry 400 428 2,286 2,500 5.72 5.84
North Cork 147 139 781 707 5.31 5.09
North Lee 326 311 1,367 1,410 4.19 4.53
South Lee 332 385 1,492 1,776 4.49 4.61
West Cork 134 96 730 537 5.45 5.59
CHO Area 4 – Total 1,339 1,359 6,656 6,930 4.97 5.10
South Tipperary 607 638 3,848 4,069 6.34 6.38
Carlow/Kilkenny 734 729 4,365 4,330 5.95 5.94
Waterford 301 325 1,515 1,644 5.03 5.06
Wexford 832 1,067 4,943 6,265 5.94 5.87
CHO Area 5 – Total 2,474 2,759 14,671 16,308 5.93 5.91
Wicklow 225 219 1,064 986 4.73 4.50
Dun Laoghaire 255 277 1,130 1,125 4.43 4.06
Dublin South East 156 135 635 712 4.07 5.27
CHO Area 6 – Total 636 631 2,829 2,823 4.45 4.47
National 19,432 20,229 114,472 120,117 5.89 5.94
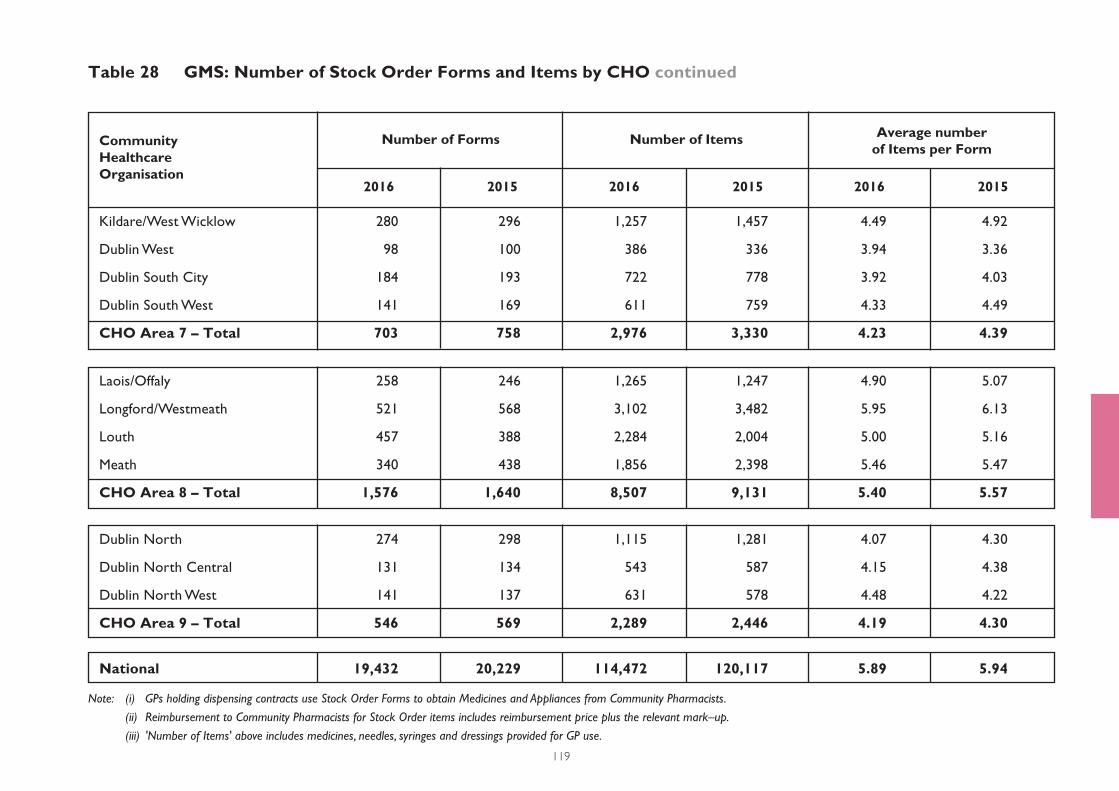
Table 28 GMS: Number of Stock Order Forms and Items by CHO continued
119
CommunityHealthcare Organisation
Number of Forms
2016 2016 20162015 2015 2015
Average numberof Items per Form
Number of Items
Note: (i) GPs holding dispensing contracts use Stock Order Forms to obtain Medicines and Appliances from Community Pharmacists.
(ii) Reimbursement to Community Pharmacists for Stock Order items includes reimbursement price plus the relevant mark–up.
(iii) 'Number of Items' above includes medicines, needles, syringes and dressings provided for GP use.
Kildare/West Wicklow 280 296 1,257 1,457 4.49 4.92
Dublin West 98 100 386 336 3.94 3.36
Dublin South City 184 193 722 778 3.92 4.03
Dublin South West 141 169 611 759 4.33 4.49
CHO Area 7 – Total 703 758 2,976 3,330 4.23 4.39
Laois/Offaly 258 246 1,265 1,247 4.90 5.07
Longford/Westmeath 521 568 3,102 3,482 5.95 6.13
Louth 457 388 2,284 2,004 5.00 5.16
Meath 340 438 1,856 2,398 5.46 5.47
CHO Area 8 – Total 1,576 1,640 8,507 9,131 5.40 5.57
Dublin North 274 298 1,115 1,281 4.07 4.30
Dublin North Central 131 134 543 587 4.15 4.38
Dublin North West 141 137 631 578 4.48 4.22
CHO Area 9 – Total 546 569 2,289 2,446 4.19 4.30
National 19,432 20,229 114,472 120,117 5.89 5.94
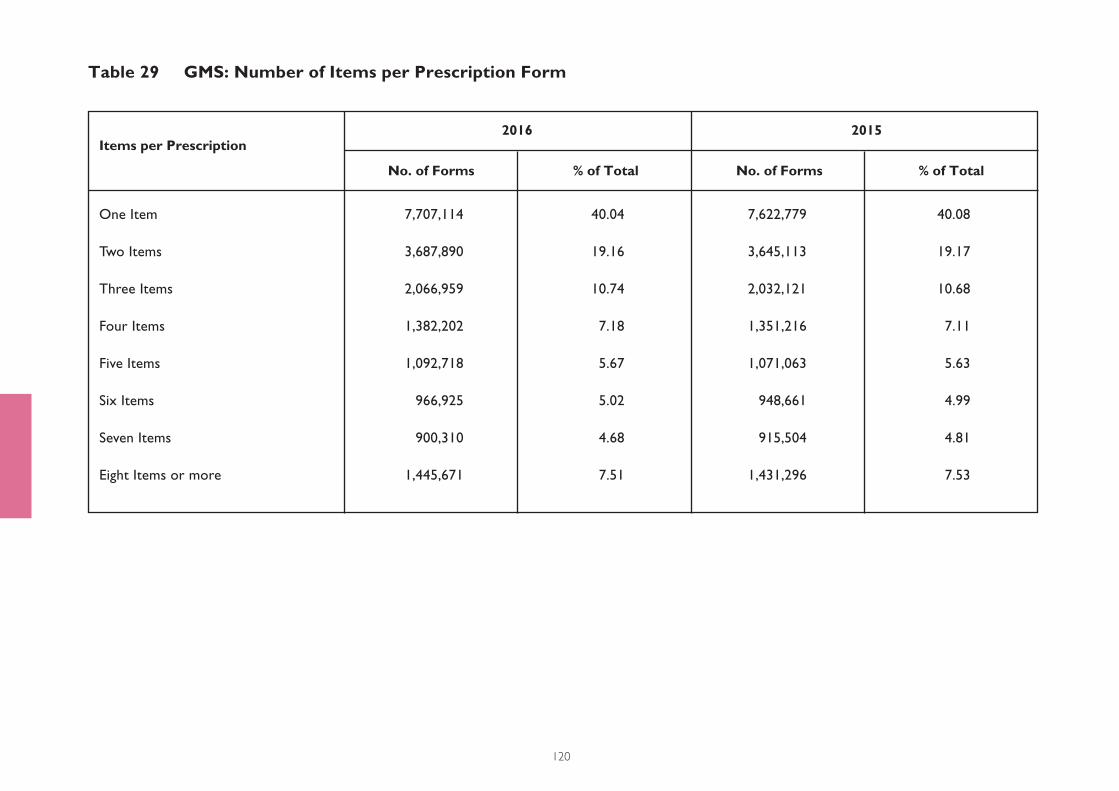
Table 29 GMS: Number of Items per Prescription Form
120
Items per Prescription
No. of Forms No. of Forms% of Total % of Total
2016 2015
One Item 7,707,114 40.04 7,622,779 40.08
Two Items 3,687,890 19.16 3,645,113 19.17
Three Items 2,066,959 10.74 2,032,121 10.68
Four Items 1,382,202 7.18 1,351,216 7.11
Five Items 1,092,718 5.67 1,071,063 5.63
Six Items 966,925 5.02 948,661 4.99
Seven Items 900,310 4.68 915,504 4.81
Eight Items or more 1,445,671 7.51 1,431,296 7.53
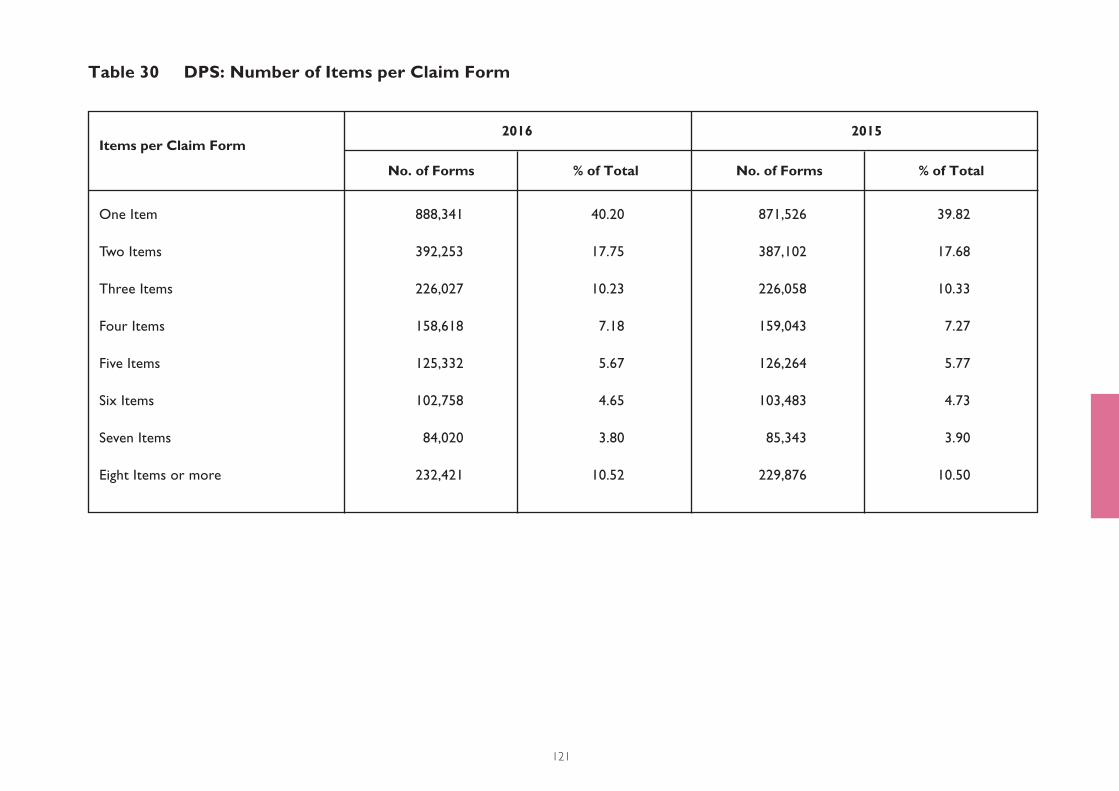
Table 30 DPS: Number of Items per Claim Form
121
Items per Claim Form
No. of Forms No. of Forms% of Total % of Total
One Item 888,341 40.20 871,526 39.82
Two Items 392,253 17.75 387,102 17.68
Three Items 226,027 10.23 226,058 10.33
Four Items 158,618 7.18 159,043 7.27
Five Items 125,332 5.67 126,264 5.77
Six Items 102,758 4.65 103,483 4.73
Seven Items 84,020 3.80 85,343 3.90
Eight Items or more 232,421 10.52 229,876 10.50
2016 2015

Table 31 LTI: Number of Items per Claim Form
122
Items per Claim Form
No. of Forms No. of Forms% of Total % of Total
2016 2015
One Item 630,198 29.24 546,362 28.79
Two Items 330,096 15.32 290,479 15.31
Three Items 258,462 11.99 224,844 11.85
Four Items 245,888 11.41 214,690 11.32
Five Items 221,256 10.27 196,145 10.34
Six Items 178,323 8.27 161,073 8.49
Seven Items 124,969 5.80 111,829 5.89
Eight Items or more 166,017 7.70 152,003 8.01
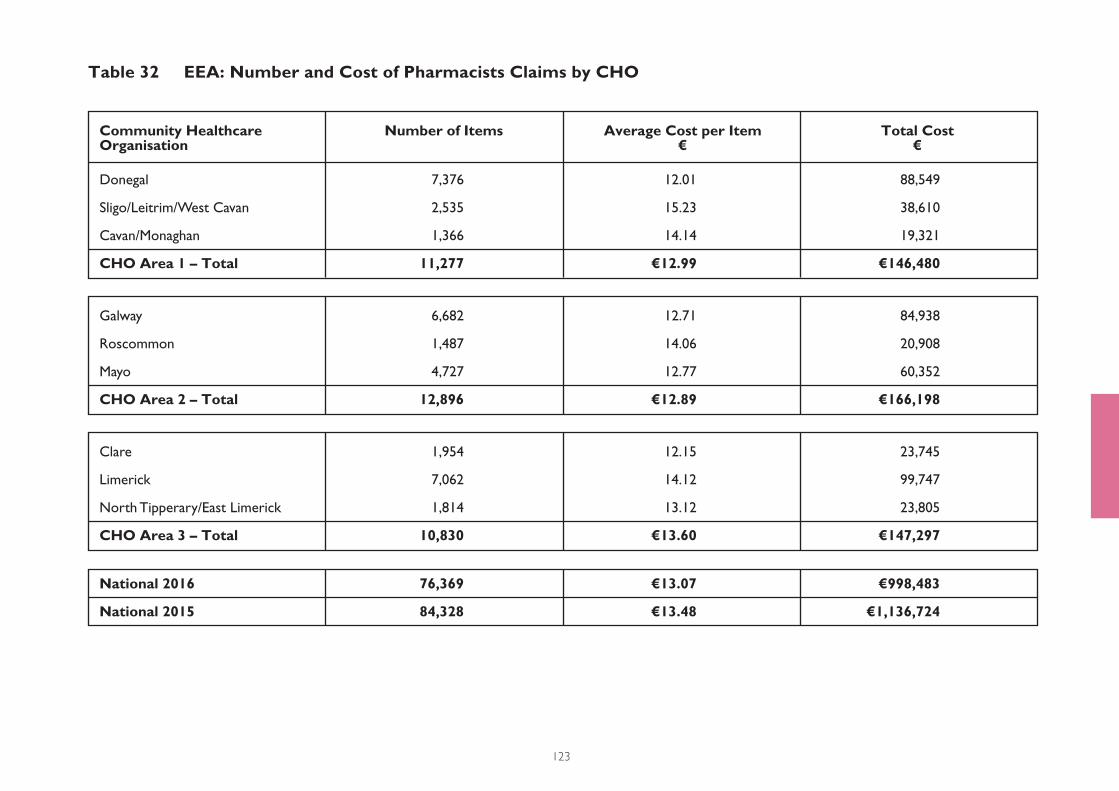
Table 32 EEA: Number and Cost of Pharmacists Claims by CHO
123
Donegal 7,376 12.01 88,549
Sligo/Leitrim/West Cavan 2,535 15.23 38,610
Cavan/Monaghan 1,366 14.14 19,321
CHO Area 1 – Total 11,277 €12.99 €146,480
Galway 6,682 12.71 84,938
Roscommon 1,487 14.06 20,908
Mayo 4,727 12.77 60,352
CHO Area 2 – Total 12,896 €12.89 €166,198
Clare 1,954 12.15 23,745
Limerick 7,062 14.12 99,747
North Tipperary/East Limerick 1,814 13.12 23,805
CHO Area 3 – Total 10,830 €13.60 €147,297
Community HealthcareOrganisation
Number of Items Average Cost per Item €
Total Cost€
National 2016 76,369 €13.07 €998,483
National 2015 84,328 €13.48 €1,136,724
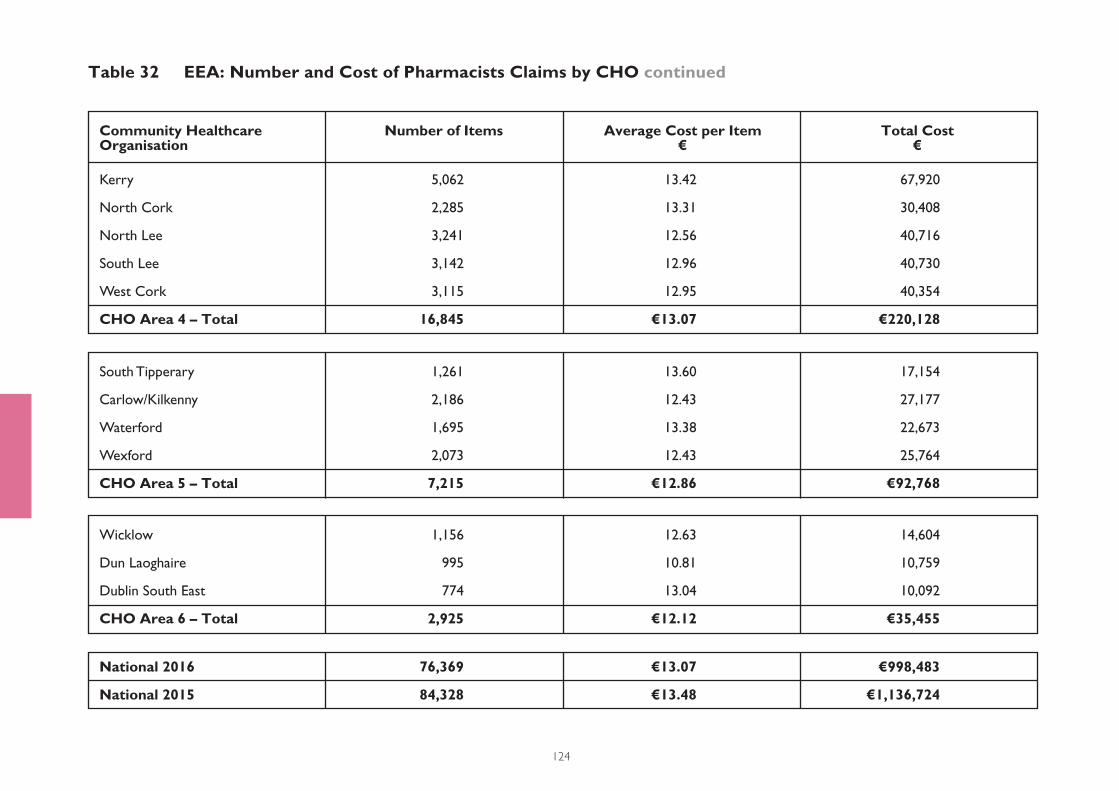
Table 32 EEA: Number and Cost of Pharmacists Claims by CHO continued
124
Kerry 5,062 13.42 67,920
North Cork 2,285 13.31 30,408
North Lee 3,241 12.56 40,716
South Lee 3,142 12.96 40,730
West Cork 3,115 12.95 40,354
CHO Area 4 – Total 16,845 €13.07 €220,128
Wicklow 1,156 12.63 14,604
Dun Laoghaire 995 10.81 10,759
Dublin South East 774 13.04 10,092
CHO Area 6 – Total 2,925 €12.12 €35,455
South Tipperary 1,261 13.60 17,154
Carlow/Kilkenny 2,186 12.43 27,177
Waterford 1,695 13.38 22,673
Wexford 2,073 12.43 25,764
CHO Area 5 – Total 7,215 €12.86 €92,768
Community HealthcareOrganisation
Number of Items Average Cost per Item €
Total Cost€
National 2016 76,369 €13.07 €998,483
National 2015 84,328 €13.48 €1,136,724
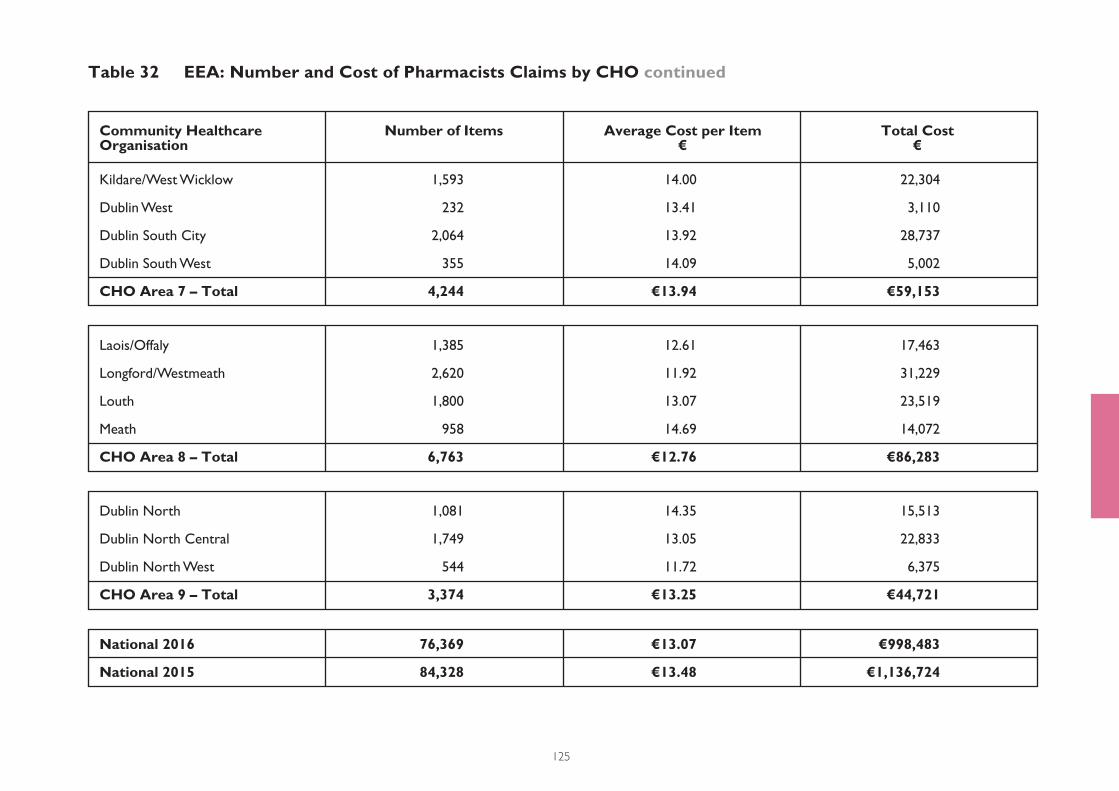
Table 32 EEA: Number and Cost of Pharmacists Claims by CHO continued
125
Kildare/West Wicklow 1,593 14.00 22,304
Dublin West 232 13.41 3,110
Dublin South City 2,064 13.92 28,737
Dublin South West 355 14.09 5,002
CHO Area 7 – Total 4,244 €13.94 €59,153
Dublin North 1,081 14.35 15,513
Dublin North Central 1,749 13.05 22,833
Dublin North West 544 11.72 6,375
CHO Area 9 – Total 3,374 €13.25 €44,721
Laois/Offaly 1,385 12.61 17,463
Longford/Westmeath 2,620 11.92 31,229
Louth 1,800 13.07 23,519
Meath 958 14.69 14,072
CHO Area 8 – Total 6,763 €12.76 €86,283
Community HealthcareOrganisation
Number of Items Average Cost per Item €
Total Cost€
National 2016 76,369 €13.07 €998,483
National 2015 84,328 €13.48 €1,136,724
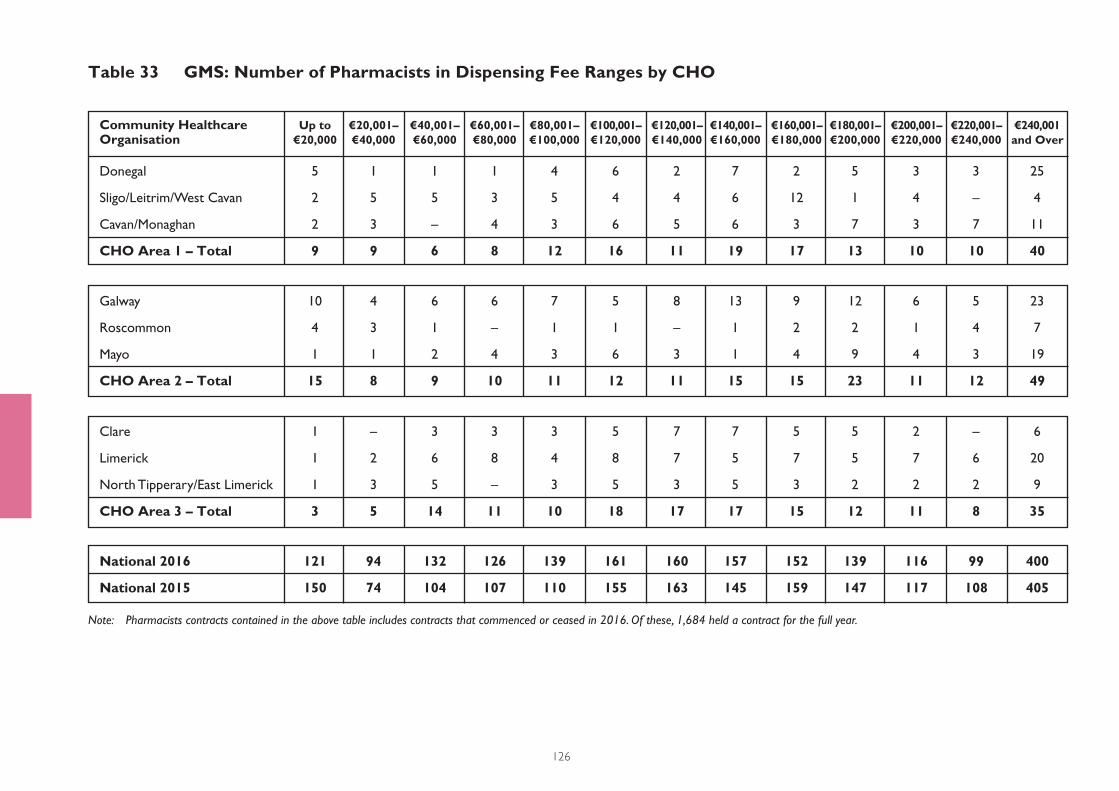
Table 33 GMS: Number of Pharmacists in Dispensing Fee Ranges by CHO
126
Community Healthcare Up to €20,001– €40,001– €60,001– €80,001– €100,001– €120,001– €140,001– €160,001– €180,001– €200,001– €220,001– €240,001 Organisation €20,000 €40,000 €60,000 €80,000 €100,000 €120,000 €140,000 €160,000 €180,000 €200,000 €220,000 €240,000 and Over
Donegal 5 1 1 1 4 6 2 7 2 5 3 3 25
Sligo/Leitrim/West Cavan 2 5 5 3 5 4 4 6 12 1 4 – 4
Cavan/Monaghan 2 3 – 4 3 6 5 6 3 7 3 7 11
CHO Area 1 – Total 9 9 6 8 12 16 11 19 17 13 10 10 40
Galway 10 4 6 6 7 5 8 13 9 12 6 5 23
Roscommon 4 3 1 – 1 1 – 1 2 2 1 4 7
Mayo 1 1 2 4 3 6 3 1 4 9 4 3 19
CHO Area 2 – Total 15 8 9 10 11 12 11 15 15 23 11 12 49
Clare 1 – 3 3 3 5 7 7 5 5 2 – 6
Limerick 1 2 6 8 4 8 7 5 7 5 7 6 20
North Tipperary/East Limerick 1 3 5 – 3 5 3 5 3 2 2 2 9
CHO Area 3 – Total 3 5 14 11 10 18 17 17 15 12 11 8 35
National 2016 121 94 132 126 139 161 160 157 152 139 116 99 400
National 2015 150 74 104 107 110 155 163 145 159 147 117 108 405
Note: Pharmacists contracts contained in the above table includes contracts that commenced or ceased in 2016. Of these, 1,684 held a contract for the full year.
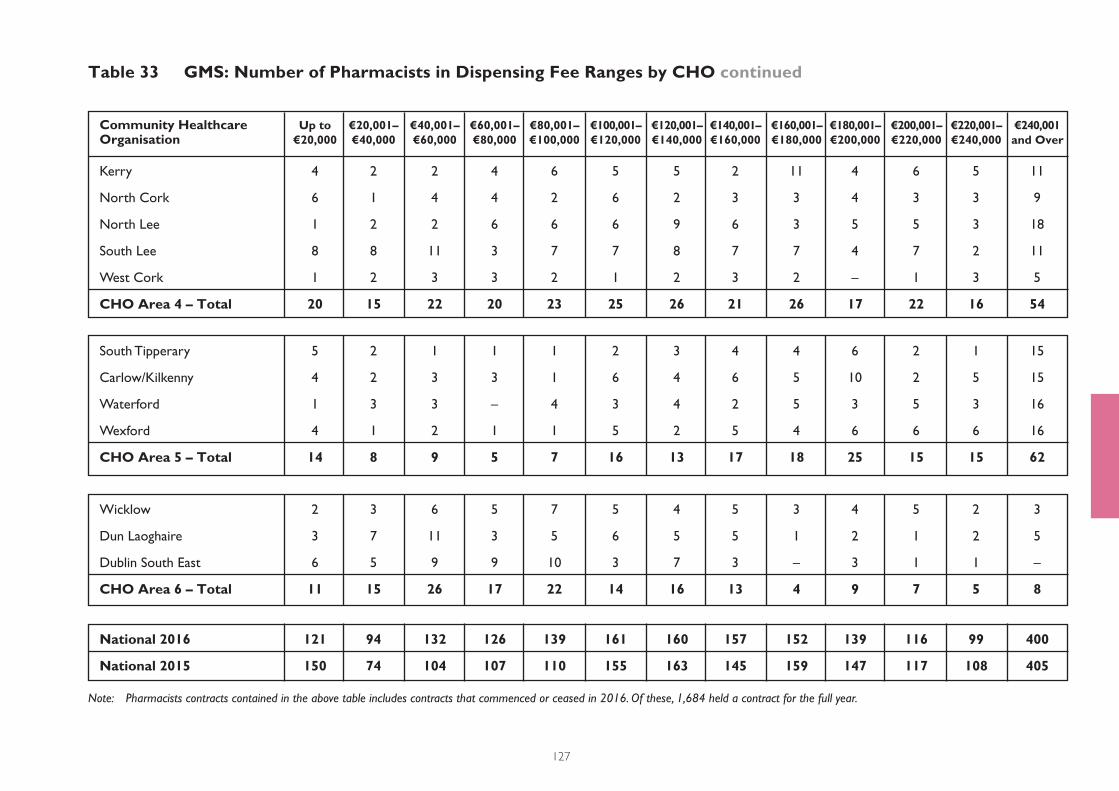
Table 33 GMS: Number of Pharmacists in Dispensing Fee Ranges by CHO continued
127
Community Healthcare Up to €20,001– €40,001– €60,001– €80,001– €100,001– €120,001– €140,001– €160,001– €180,001– €200,001– €220,001– €240,001 Organisation €20,000 €40,000 €60,000 €80,000 €100,000 €120,000 €140,000 €160,000 €180,000 €200,000 €220,000 €240,000 and Over
National 2016 121 94 132 126 139 161 160 157 152 139 116 99 400
National 2015 150 74 104 107 110 155 163 145 159 147 117 108 405
Note: Pharmacists contracts contained in the above table includes contracts that commenced or ceased in 2016. Of these, 1,684 held a contract for the full year.
Kerry 4 2 2 4 6 5 5 2 11 4 6 5 11
North Cork 6 1 4 4 2 6 2 3 3 4 3 3 9
North Lee 1 2 2 6 6 6 9 6 3 5 5 3 18
South Lee 8 8 11 3 7 7 8 7 7 4 7 2 11
West Cork 1 2 3 3 2 1 2 3 2 – 1 3 5
CHO Area 4 – Total 20 15 22 20 23 25 26 21 26 17 22 16 54
South Tipperary 5 2 1 1 1 2 3 4 4 6 2 1 15
Carlow/Kilkenny 4 2 3 3 1 6 4 6 5 10 2 5 15
Waterford 1 3 3 – 4 3 4 2 5 3 5 3 16
Wexford 4 1 2 1 1 5 2 5 4 6 6 6 16
CHO Area 5 – Total 14 8 9 5 7 16 13 17 18 25 15 15 62
Wicklow 2 3 6 5 7 5 4 5 3 4 5 2 3
Dun Laoghaire 3 7 11 3 5 6 5 5 1 2 1 2 5
Dublin South East 6 5 9 9 10 3 7 3 – 3 1 1 –
CHO Area 6 – Total 11 15 26 17 22 14 16 13 4 9 7 5 8
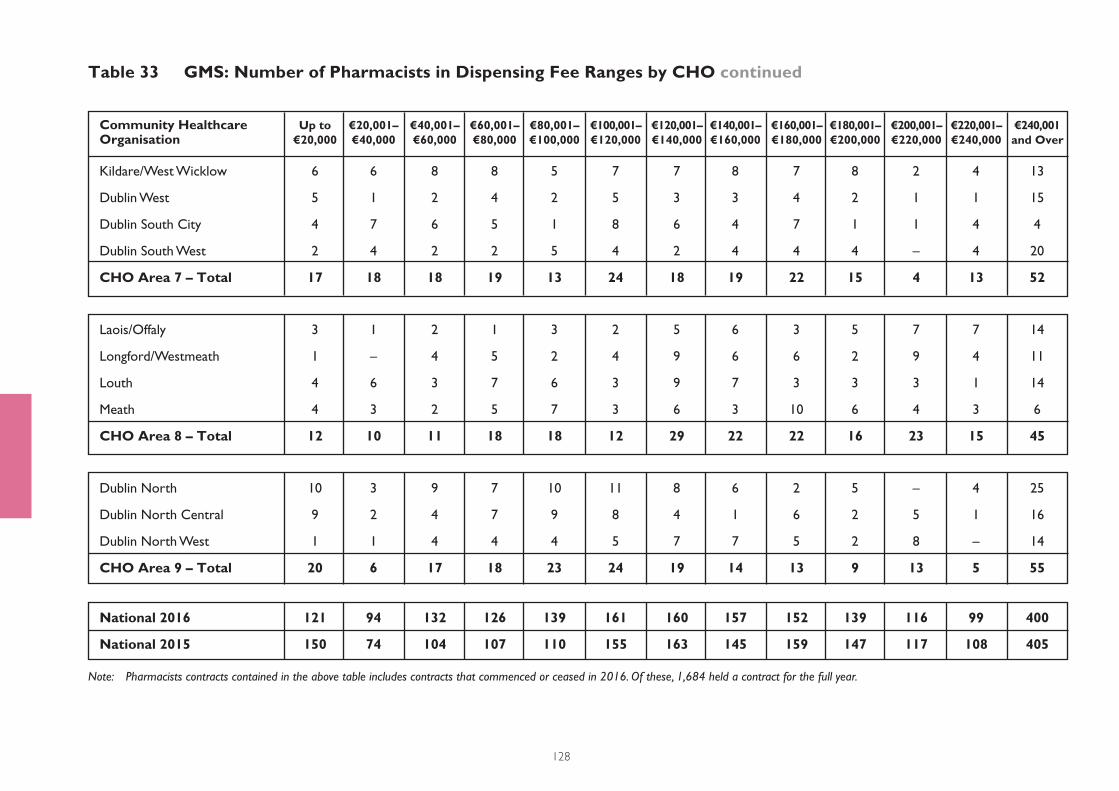
Table 33 GMS: Number of Pharmacists in Dispensing Fee Ranges by CHO continued
128
National 2016 121 94 132 126 139 161 160 157 152 139 116 99 400
National 2015 150 74 104 107 110 155 163 145 159 147 117 108 405
Note: Pharmacists contracts contained in the above table includes contracts that commenced or ceased in 2016. Of these, 1,684 held a contract for the full year.
Kildare/West Wicklow 6 6 8 8 5 7 7 8 7 8 2 4 13
Dublin West 5 1 2 4 2 5 3 3 4 2 1 1 15
Dublin South City 4 7 6 5 1 8 6 4 7 1 1 4 4
Dublin South West 2 4 2 2 5 4 2 4 4 4 – 4 20
CHO Area 7 – Total 17 18 18 19 13 24 18 19 22 15 4 13 52
Dublin North 10 3 9 7 10 11 8 6 2 5 – 4 25
Dublin North Central 9 2 4 7 9 8 4 1 6 2 5 1 16
Dublin North West 1 1 4 4 4 5 7 7 5 2 8 – 14
CHO Area 9 – Total 20 6 17 18 23 24 19 14 13 9 13 5 55
Laois/Offaly 3 1 2 1 3 2 5 6 3 5 7 7 14
Longford/Westmeath 1 – 4 5 2 4 9 6 6 2 9 4 11
Louth 4 6 3 7 6 3 9 7 3 3 3 1 14
Meath 4 3 2 5 7 3 6 3 10 6 4 3 6
CHO Area 8 – Total 12 10 11 18 18 12 29 22 22 16 23 15 45
Community Healthcare Up to €20,001– €40,001– €60,001– €80,001– €100,001– €120,001– €140,001– €160,001– €180,001– €200,001– €220,001– €240,001 Organisation €20,000 €40,000 €60,000 €80,000 €100,000 €120,000 €140,000 €160,000 €180,000 €200,000 €220,000 €240,000 and Over
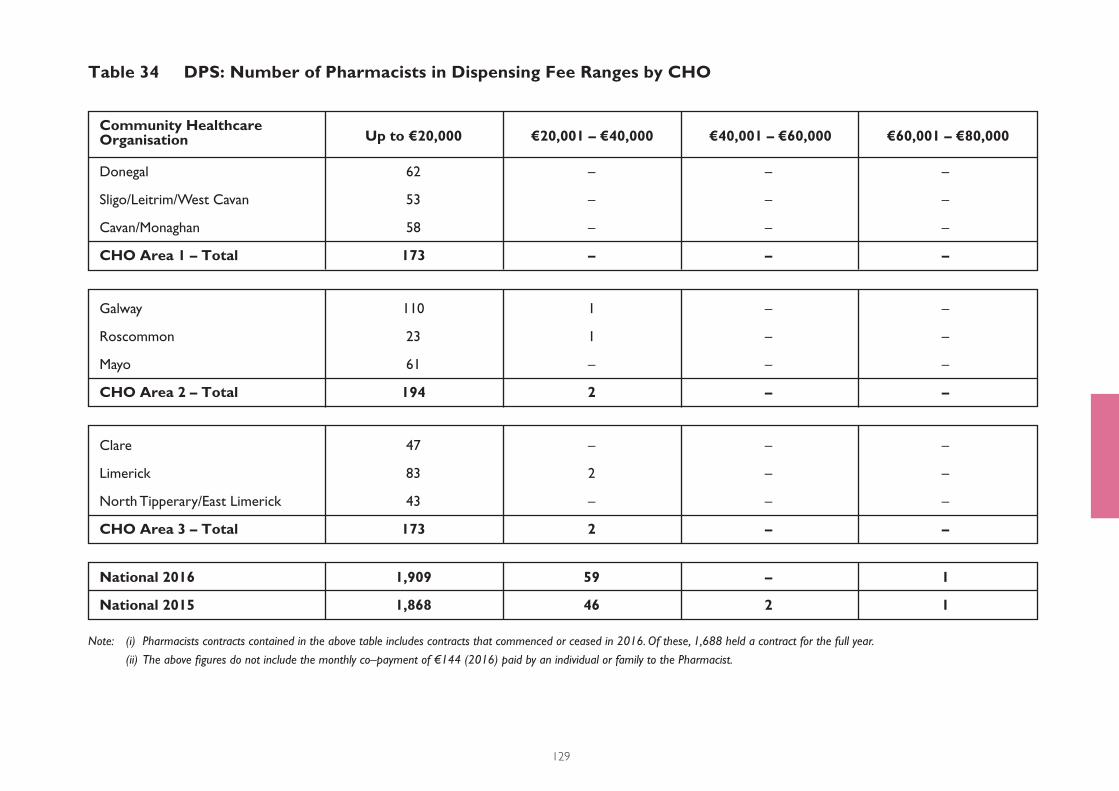
Table 34 DPS: Number of Pharmacists in Dispensing Fee Ranges by CHO
129
Donegal 62 – – –
Sligo/Leitrim/West Cavan 53 – – –
Cavan/Monaghan 58 – – –
CHO Area 1 – Total 173 – – –
Galway 110 1 – –
Roscommon 23 1 – –
Mayo 61 – – –
CHO Area 2 – Total 194 2 – –
Clare 47 – – –
Limerick 83 2 – –
North Tipperary/East Limerick 43 – – –
CHO Area 3 – Total 173 2 – –
Community HealthcareOrganisation Up to €20,000 €20,001 – €40,000 €40,001 – €60,000 €60,001 – €80,000
National 2016 1,909 59 – 1
National 2015 1,868 46 2 1
Note: (i) Pharmacists contracts contained in the above table includes contracts that commenced or ceased in 2016. Of these, 1,688 held a contract for the full year.
(ii) The above fi gures do not include the monthly co–payment of €144 (2016) paid by an individual or family to the Pharmacist.
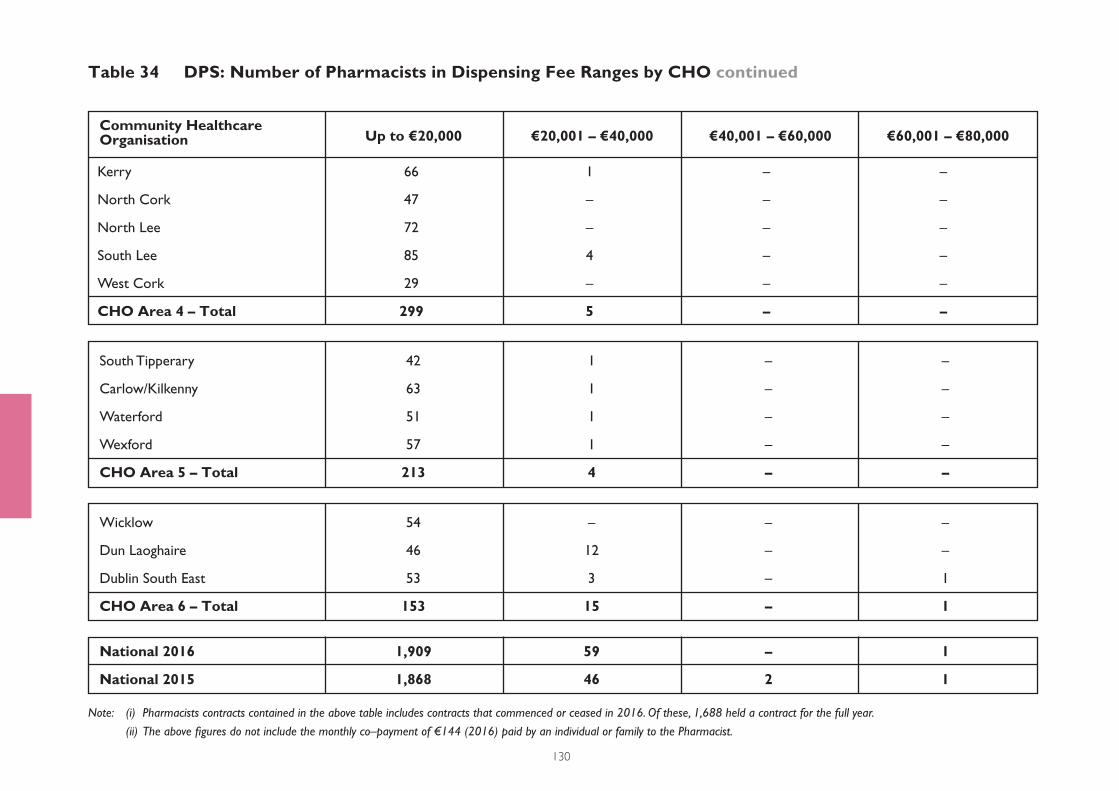
Table 34 DPS: Number of Pharmacists in Dispensing Fee Ranges by CHO continued
130
Kerry 66 1 – –
North Cork 47 – – –
North Lee 72 – – –
South Lee 85 4 – –
West Cork 29 – – –
CHO Area 4 – Total 299 5 – –
South Tipperary 42 1 – –
Carlow/Kilkenny 63 1 – –
Waterford 51 1 – –
Wexford 57 1 – –
CHO Area 5 – Total 213 4 – –
Wicklow 54 – – –
Dun Laoghaire 46 12 – –
Dublin South East 53 3 – 1
CHO Area 6 – Total 153 15 – 1
Community HealthcareOrganisation Up to €20,000 €20,001 – €40,000 €40,001 – €60,000 €60,001 – €80,000
National 2016 1,909 59 – 1
National 2015 1,868 46 2 1
Note: (i) Pharmacists contracts contained in the above table includes contracts that commenced or ceased in 2016. Of these, 1,688 held a contract for the full year.
(ii) The above fi gures do not include the monthly co–payment of €144 (2016) paid by an individual or family to the Pharmacist.
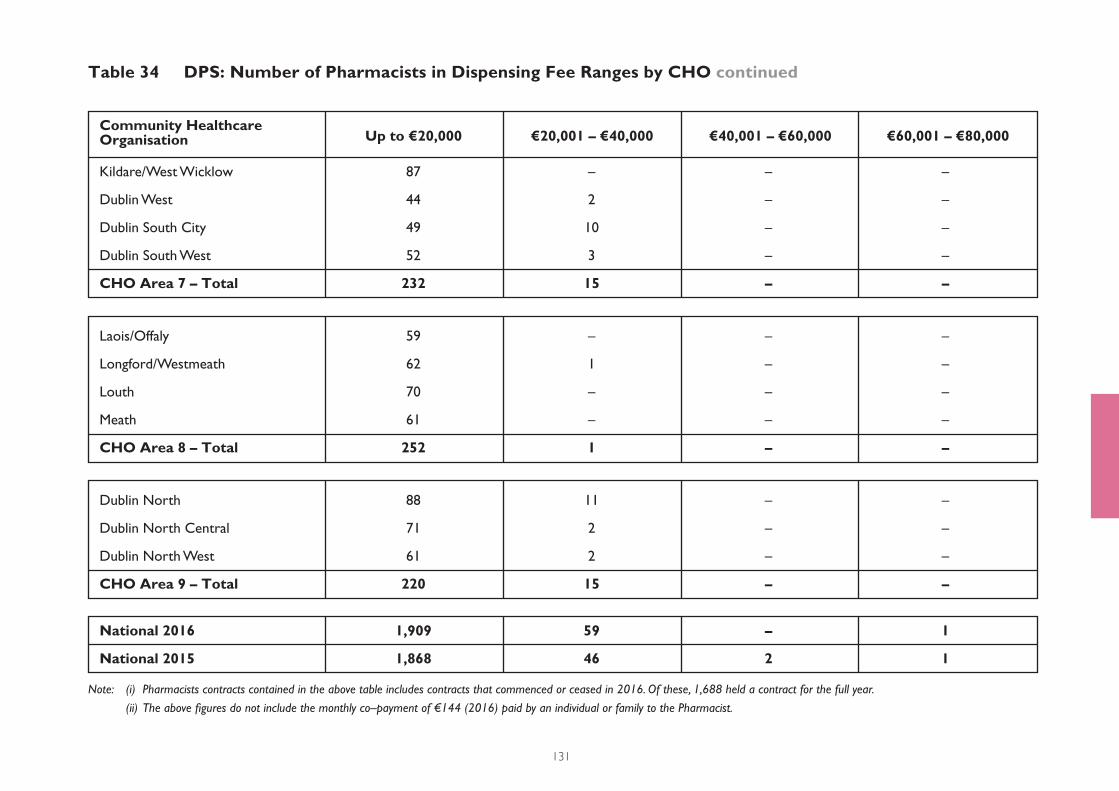
Table 34 DPS: Number of Pharmacists in Dispensing Fee Ranges by CHO continued
131
Kildare/West Wicklow 87 – – –
Dublin West 44 2 – –
Dublin South City 49 10 – –
Dublin South West 52 3 – –
CHO Area 7 – Total 232 15 – –
Laois/Offaly 59 – – –
Longford/Westmeath 62 1 – –
Louth 70 – – –
Meath 61 – – –
CHO Area 8 – Total 252 1 – –
Dublin North 88 11 – –
Dublin North Central 71 2 – –
Dublin North West 61 2 – –
CHO Area 9 – Total 220 15 – –
Community HealthcareOrganisation Up to €20,000 €20,001 – €40,000 €40,001 – €60,000 €60,001 – €80,000
National 2016 1,909 59 – 1
National 2015 1,868 46 2 1
Note: (i) Pharmacists contracts contained in the above table includes contracts that commenced or ceased in 2016. Of these, 1,688 held a contract for the full year.
(ii) The above fi gures do not include the monthly co–payment of €144 (2016) paid by an individual or family to the Pharmacist.
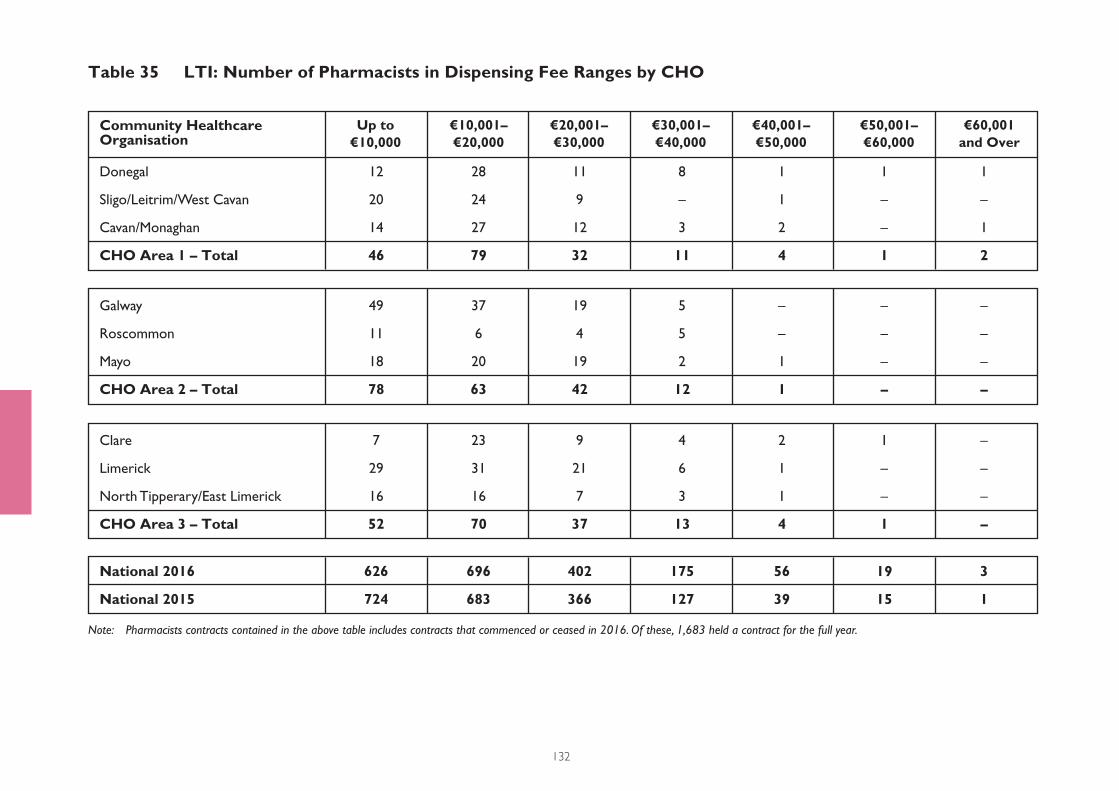
Table 35 LTI: Number of Pharmacists in Dispensing Fee Ranges by CHO
132
Donegal 12 28 11 8 1 1 1
Sligo/Leitrim/West Cavan 20 24 9 – 1 – –
Cavan/Monaghan 14 27 12 3 2 – 1
CHO Area 1 – Total 46 79 32 11 4 1 2
Galway 49 37 19 5 – – –
Roscommon 11 6 4 5 – – –
Mayo 18 20 19 2 1 – –
CHO Area 2 – Total 78 63 42 12 1 – –
Clare 7 23 9 4 2 1 –
Limerick 29 31 21 6 1 – –
North Tipperary/East Limerick 16 16 7 3 1 – –
CHO Area 3 – Total 52 70 37 13 4 1 –
Community HealthcareOrganisation
Up to€10,000
€10,001–€20,000
€30,001–€40,000
€50,001–€60,000
€20,001–€30,000
€40,001–€50,000
€60,001and Over
National 2016 626 696 402 175 56 19 3
National 2015 724 683 366 127 39 15 1
Note: Pharmacists contracts contained in the above table includes contracts that commenced or ceased in 2016. Of these, 1,683 held a contract for the full year.

Table 35 LTI: Number of Pharmacists in Dispensing Fee Ranges by CHO continued
133
Kerry 19 27 14 6 – – –
North Cork 18 13 11 3 2 – –
North Lee 21 33 14 3 – – –
South Lee 40 33 16 1 1 – –
West Cork 11 11 5 – 1 1 –
CHO Area 4 – Total 109 117 60 13 4 1 –
South Tipperary 14 11 15 2 2 – –
Carlow/Kilkenny 16 19 12 11 4 1 –
Waterford 16 16 9 6 4 1 –
Wexford 11 16 14 13 2 3 –
CHO Area 5 – Total 57 62 50 32 12 5 –
Wicklow 17 12 17 7 1 – –
Dun Laoghaire 20 19 12 5 – 1 –
Dublin South East 26 27 2 1 1 – –
CHO Area 6 – Total 63 58 31 13 2 1 –
Community HealthcareOrganisation
Up to€10,000
€10,001–€20,000
€30,001–€40,000
€50,001–€60,000
€20,001–€30,000
€40,001–€50,000
€60,001and Over
National 2016 626 696 402 175 56 19 3
National 2015 724 683 366 127 39 15 1
Note: Pharmacists contracts contained in the above table includes contracts that commenced or ceased in 2016. Of these, 1,683 held a contract for the full year.
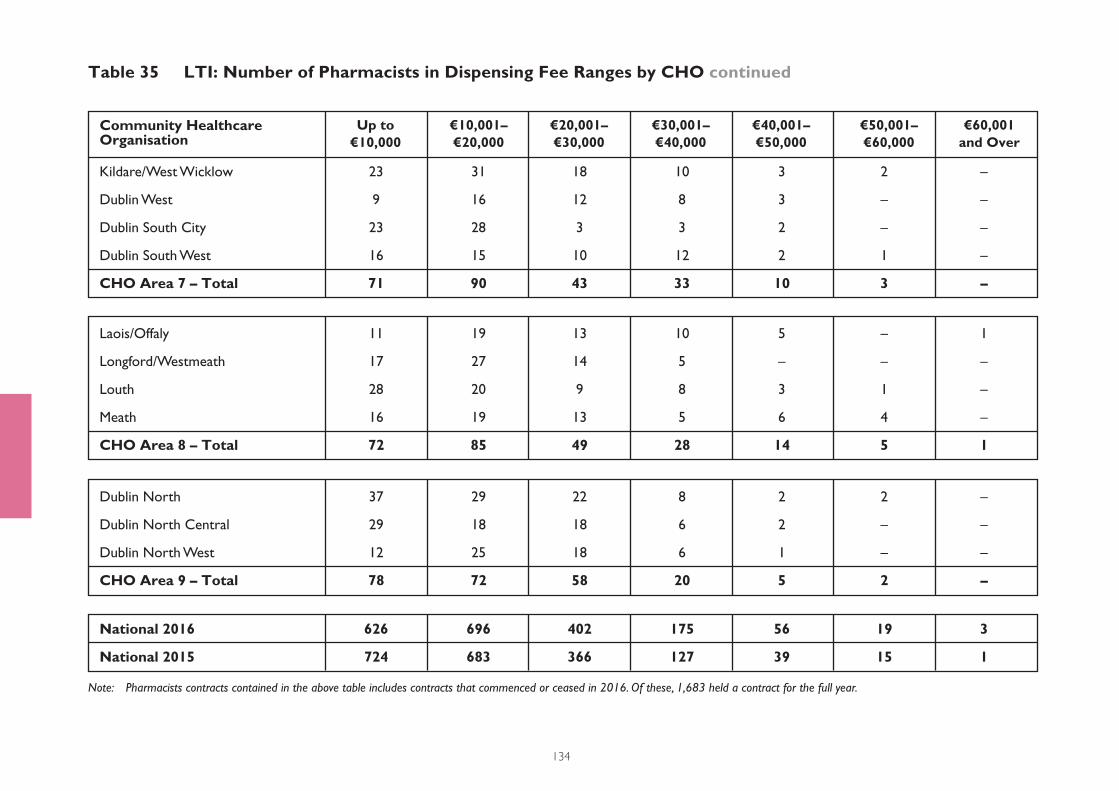
Table 35 LTI: Number of Pharmacists in Dispensing Fee Ranges by CHO continued
134
Kildare/West Wicklow 23 31 18 10 3 2 –
Dublin West 9 16 12 8 3 – –
Dublin South City 23 28 3 3 2 – –
Dublin South West 16 15 10 12 2 1 –
CHO Area 7 – Total 71 90 43 33 10 3 –
Laois/Offaly 11 19 13 10 5 – 1
Longford/Westmeath 17 27 14 5 – – –
Louth 28 20 9 8 3 1 –
Meath 16 19 13 5 6 4 –
CHO Area 8 – Total 72 85 49 28 14 5 1
Dublin North 37 29 22 8 2 2 –
Dublin North Central 29 18 18 6 2 – –
Dublin North West 12 25 18 6 1 – –
CHO Area 9 – Total 78 72 58 20 5 2 –
Community HealthcareOrganisation
Up to€10,000
€10,001–€20,000
€30,001–€40,000
€50,001–€60,000
€20,001–€30,000
€40,001–€50,000
€60,001and Over
National 2016 626 696 402 175 56 19 3
National 2015 724 683 366 127 39 15 1
Note: Pharmacists contracts contained in the above table includes contracts that commenced or ceased in 2016. Of these, 1,683 held a contract for the full year.

S E C T I O N
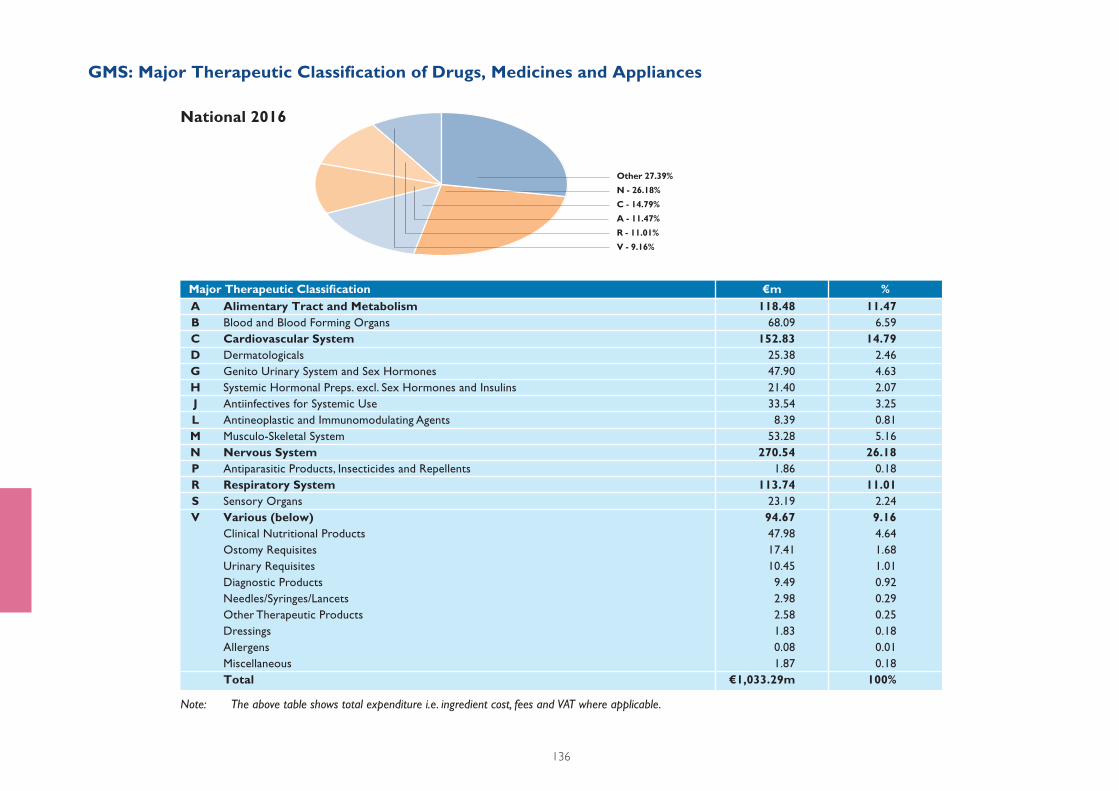
Note: The above table shows total expenditure i.e. ingredient cost, fees and VAT where applicable.
A - 11.47%
R - 11.01%
V - 9.16%
C - 14.79%
N - 26.18%
Other 27.39%
136
National 2016
Major Therapeutic Classifi cation €m % A Alimentary Tract and Metabolism 118.48 11.47 B Blood and Blood Forming Organs 68.09 6.59
C Cardiovascular System 152.83 14.79 D Dermatologicals 25.38 2.46
G Genito Urinary System and Sex Hormones 47.90 4.63
H Systemic Hormonal Preps. excl. Sex Hormones and Insulins 21.40 2.07
J Antiinfectives for Systemic Use 33.54 3.25
L Antineoplastic and Immunomodulating Agents 8.39 0.81
M Musculo-Skeletal System 53.28 5.16
N Nervous System 270.54 26.18 P Antiparasitic Products, Insecticides and Repellents 1.86 0.18
R Respiratory System 113.74 11.01 S Sensory Organs 23.19 2.24
V Various (below) 94.67 9.16 Clinical Nutritional Products 47.98 4.64
Ostomy Requisites 17.41 1.68
Urinary Requisites 10.45 1.01
Diagnostic Products 9.49 0.92
Needles/Syringes/Lancets 2.98 0.29
Other Therapeutic Products 2.58 0.25
Dressings 1.83 0.18
Allergens 0.08 0.01
Miscellaneous 1.87 0.18
Total €1,033.29m 100%
GMS: Major Therapeutic Classifi cation of Drugs, Medicines and Appliances

Note: (i) The above costs are inclusive of the monthly co-payment of €144 (2016) payable to the Pharmacy by an individual or family.
(ii) The above table shows total expenditure i.e. ingredient cost, fees and VAT where applicable.
R - 11.86%
A - 10.70%
V - 9.15%
C - 13.95%
N - 18.83%
Other 35.51%
137
National 2016
Major Therapeutic Classifi cation €m % A Alimentary Tract and Metabolism 16.44 10.70 B Blood and Blood Forming Organs 12.38 8.06
C Cardiovascular System 21.43 13.95 D Dermatologicals 5.25 3.41
G Genito Urinary System and Sex Hormones 12.20 7.94
H Systemic Hormonal Preps. excl. Sex Hormones and Insulins 3.08 2.00
J Antiinfectives for Systemic Use 4.49 2.92
L Antineoplastic and Immunomodulating Agents 2.63 1.71
M Musculo-Skeletal System 11.18 7.28
N Nervous System 28.93 18.83 P Antiparasitic Products, Insecticides and Repellents 0.39 0.25
R Respiratory System 18.23 11.86 S Sensory Organs 2.98 1.94
V Various (below) 14.06 9.15 Clinical Nutritional Products 5.05 3.29
Ostomy Requisites 4.58 2.98
Urinary Requisites 1.90 1.23
Diagnostic Products 0.69 0.45
Other Therapeutic Products 0.44 0.29
Needles/Syringes/Lancets 0.33 0.21
Dressings 0.17 0.11
Allergens 0.14 0.09
Miscellaneous 0.76 0.50
Total €153.67m 100%
DPS: Major Therapeutic Classifi cation of Drugs, Medicines and Appliances
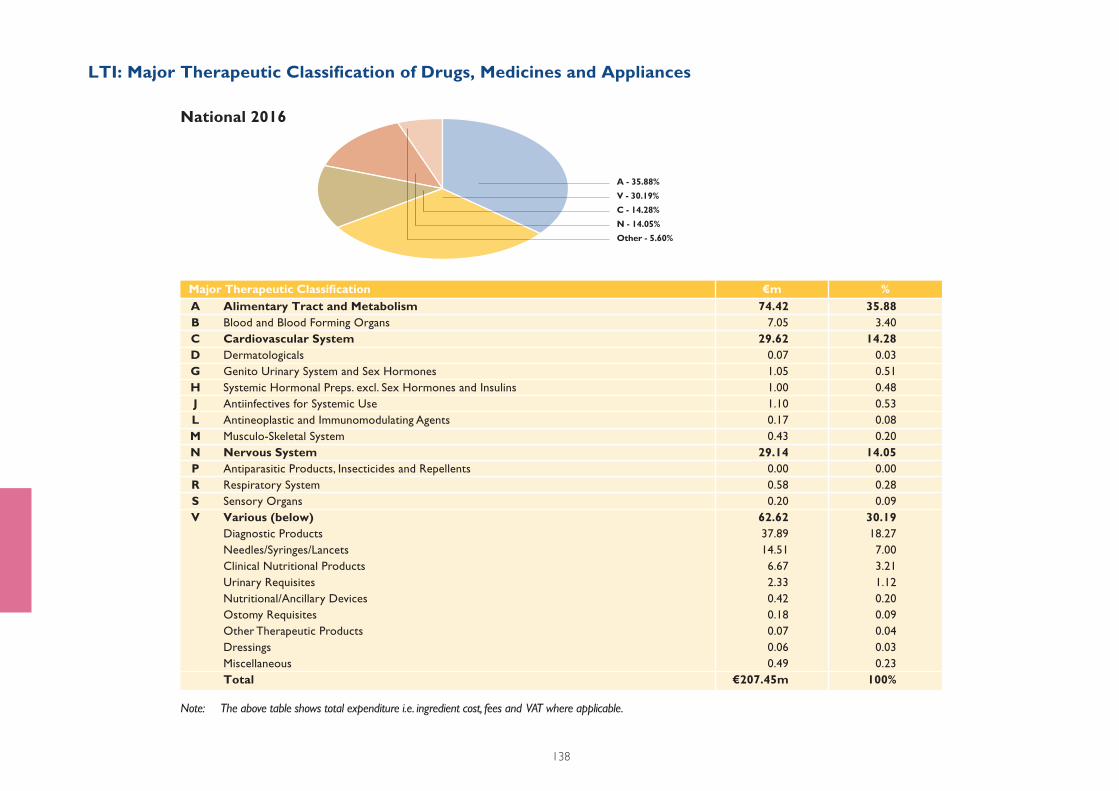
Note: The above table shows total expenditure i.e. ingredient cost, fees and VAT where applicable.
N - 14.05%
Other - 5.60%
C - 14.28%
V - 30.19%
A - 35.88%
138
National 2016
Major Therapeutic Classifi cation €m % A Alimentary Tract and Metabolism 74.42 35.88 B Blood and Blood Forming Organs 7.05 3.40
C Cardiovascular System 29.62 14.28 D Dermatologicals 0.07 0.03
G Genito Urinary System and Sex Hormones 1.05 0.51
H Systemic Hormonal Preps. excl. Sex Hormones and Insulins 1.00 0.48
J Antiinfectives for Systemic Use 1.10 0.53
L Antineoplastic and Immunomodulating Agents 0.17 0.08
M Musculo-Skeletal System 0.43 0.20
N Nervous System 29.14 14.05 P Antiparasitic Products, Insecticides and Repellents 0.00 0.00
R Respiratory System 0.58 0.28
S Sensory Organs 0.20 0.09
V Various (below) 62.62 30.19 Diagnostic Products 37.89 18.27
Needles/Syringes/Lancets 14.51 7.00
Clinical Nutritional Products 6.67 3.21
Urinary Requisites 2.33 1.12
Nutritional/Ancillary Devices 0.42 0.20
Ostomy Requisites 0.18 0.09
Other Therapeutic Products 0.07 0.04
Dressings 0.06 0.03
Miscellaneous 0.49 0.23
Total €207.45m 100%
LTI: Major Therapeutic Classifi cation of Drugs, Medicines and Appliances
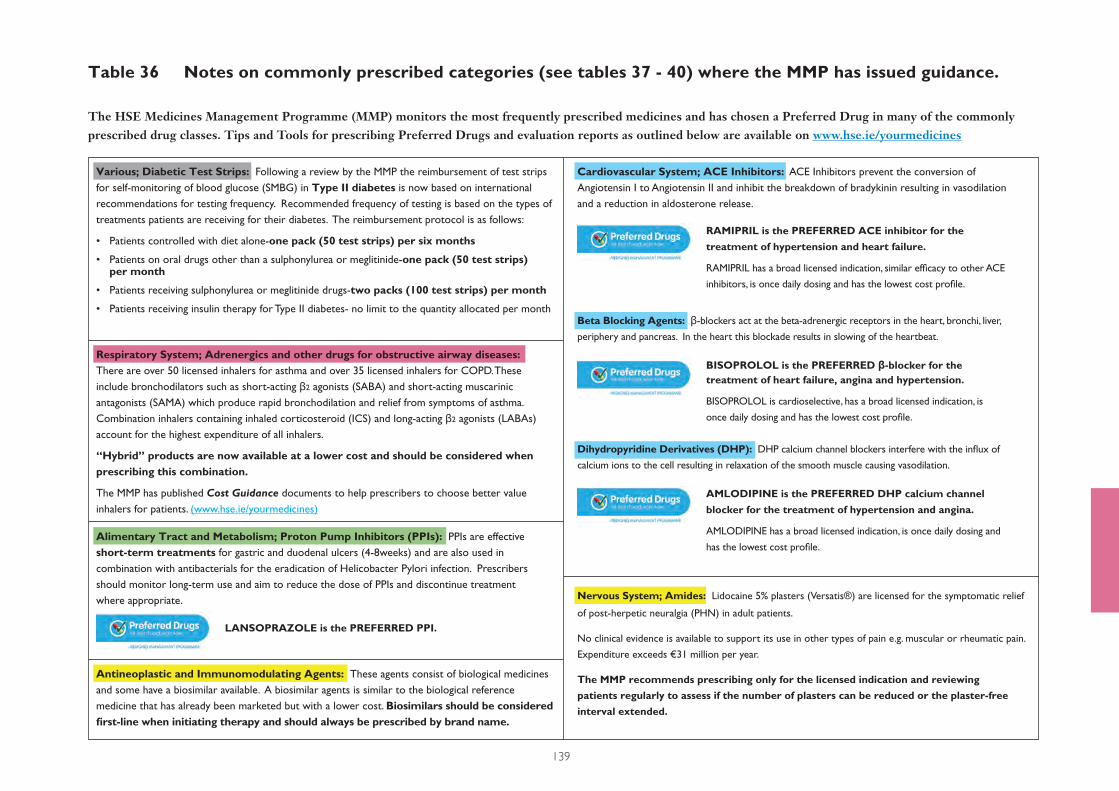
Nervous System; Amides: Lidocaine 5% plasters (Versatis®) are licensed for the symptomatic relief
of post-herpetic neuralgia (PHN) in adult patients.
No clinical evidence is available to support its use in other types of pain e.g. muscular or rheumatic pain.
Expenditure exceeds €31 million per year.
The MMP recommends prescribing only for the licensed indication and reviewing
patients regularly to assess if the number of plasters can be reduced or the plaster-free
interval extended.
139
Table 36 Notes on commonly prescribed categories (see tables 37 - 40) where the MMP has issued guidance.
The HSE Medicines Management Programme (MMP) monitors the most frequently prescribed medicines and has chosen a Preferred Drug in many of the commonly prescribed drug classes. Tips and Tools for prescribing Preferred Drugs and evaluation reports as outlined below are available on www.hse.ie/yourmedicines
LANSOPRAZOLE is the PREFERRED PPI.
RAMIPRIL is the PREFERRED ACE inhibitor for the
treatment of hypertension and heart failure.
RAMIPRIL has a broad licensed indication, similar effi cacy to other ACE
inhibitors, is once daily dosing and has the lowest cost profi le.
BISOPROLOL is the PREFERRED β-blocker for the treatment of heart failure, angina and hypertension.
BISOPROLOL is cardioselective, has a broad licensed indication, is
once daily dosing and has the lowest cost profi le.
AMLODIPINE is the PREFERRED DHP calcium channel
blocker for the treatment of hypertension and angina.
AMLODIPINE has a broad licensed indication, is once daily dosing and
has the lowest cost profi le.
Various; Diabetic Test Strips: Following a review by the MMP the reimbursement of test strips
for self-monitoring of blood glucose (SMBG) in Type II diabetes is now based on international
recommendations for testing frequency. Recommended frequency of testing is based on the types of
treatments patients are receiving for their diabetes. The reimbursement protocol is as follows:
• Patients controlled with diet alone-one pack (50 test strips) per six months
• Patients on oral drugs other than a sulphonylurea or meglitinide-one pack (50 test strips) per month
• Patients receiving sulphonylurea or meglitinide drugs-two packs (100 test strips) per month
• Patients receiving insulin therapy for Type II diabetes- no limit to the quantity allocated per month
Cardiovascular System; ACE Inhibitors: ACE Inhibitors prevent the conversion of
Angiotensin I to Angiotensin II and inhibit the breakdown of bradykinin resulting in vasodilation
and a reduction in aldosterone release.
Beta Blocking Agents: β-blockers act at the beta-adrenergic receptors in the heart, bronchi, liver,
periphery and pancreas. In the heart this blockade results in slowing of the heartbeat.
Dihydropyridine Derivatives (DHP): DHP calcium channel blockers interfere with the infl ux of
calcium ions to the cell resulting in relaxation of the smooth muscle causing vasodilation.
Respiratory System; Adrenergics and other drugs for obstructive airway diseases: There are over 50 licensed inhalers for asthma and over 35 licensed inhalers for COPD. These
include bronchodilators such as short-acting β2 agonists (SABA) and short-acting muscarinic
antagonists (SAMA) which produce rapid bronchodilation and relief from symptoms of asthma.
Combination inhalers containing inhaled corticosteroid (ICS) and long-acting β2 agonists (LABAs)
account for the highest expenditure of all inhalers.
“Hybrid” products are now available at a lower cost and should be considered when prescribing this combination.
The MMP has published Cost Guidance documents to help prescribers to choose better value
inhalers for patients. (www.hse.ie/yourmedicines)
Alimentary Tract and Metabolism; Proton Pump Inhibitors (PPIs): PPIs are effective
short-term treatments for gastric and duodenal ulcers (4-8weeks) and are also used in
combination with antibacterials for the eradication of Helicobacter Pylori infection. Prescribers
should monitor long-term use and aim to reduce the dose of PPIs and discontinue treatment
where appropriate.
Antineoplastic and Immunomodulating Agents: These agents consist of biological medicines
and some have a biosimilar available. A biosimilar agents is similar to the biological reference
medicine that has already been marketed but with a lower cost. Biosimilars should be considered fi rst-line when initiating therapy and should always be prescribed by brand name.
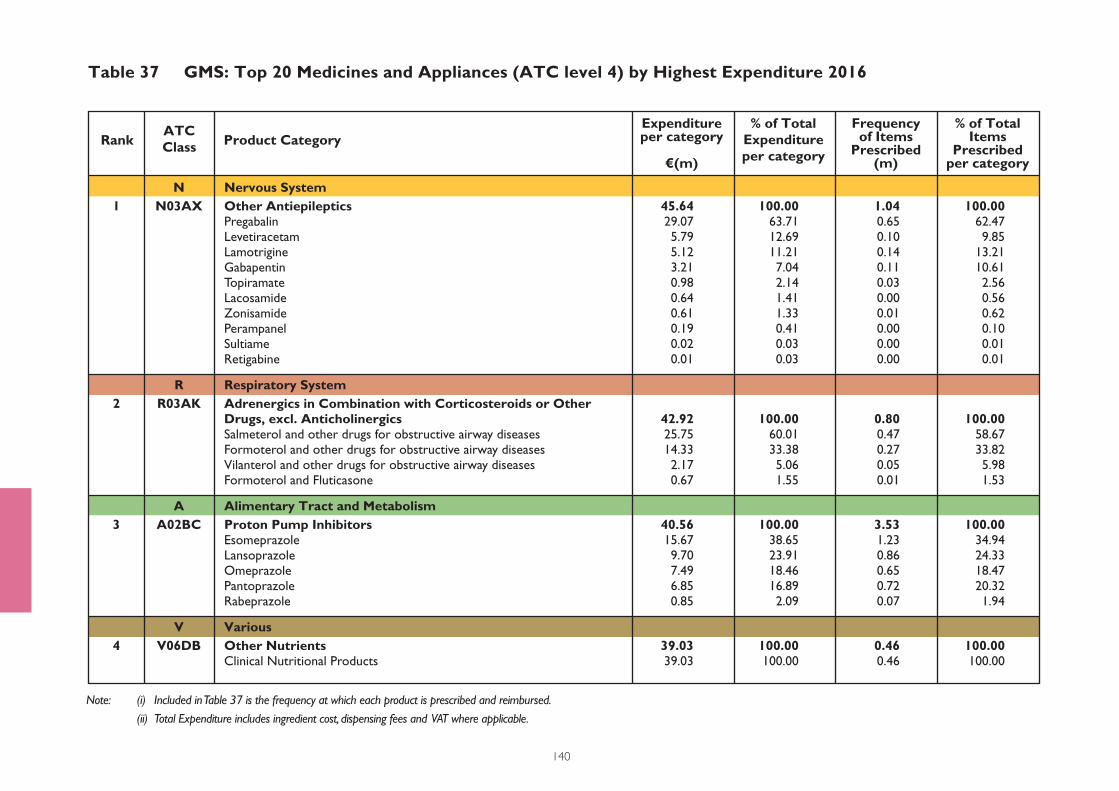
Note: (i) Included in Table 37 is the frequency at which each product is prescribed and reimbursed.
(ii) Total Expenditure includes ingredient cost, dispensing fees and VAT where applicable.
140
Table 37 GMS: Top 20 Medicines and Appliances (ATC level 4) by Highest Expenditure 2016
Rank Product CategoryATCClass
Expenditureper category
€(m)
% of Total Expenditureper category
Frequencyof Items
Prescribed(m)
% of TotalItems
Prescribedper category
N Nervous System 1 N03AX Other Antiepileptics 45.64 100.00 1.04 100.00 Pregabalin 29.07 63.71 0.65 62.47 Levetiracetam 5.79 12.69 0.10 9.85 Lamotrigine 5.12 11.21 0.14 13.21 Gabapentin 3.21 7.04 0.11 10.61 Topiramate 0.98 2.14 0.03 2.56 Lacosamide 0.64 1.41 0.00 0.56 Zonisamide 0.61 1.33 0.01 0.62 Perampanel 0.19 0.41 0.00 0.10 Sultiame 0.02 0.03 0.00 0.01 Retigabine 0.01 0.03 0.00 0.01
R Respiratory System 2 R03AK Adrenergics in Combination with Corticosteroids or Other Drugs, excl. Anticholinergics 42.92 100.00 0.80 100.00 Salmeterol and other drugs for obstructive airway diseases 25.75 60.01 0.47 58.67 Formoterol and other drugs for obstructive airway diseases 14.33 33.38 0.27 33.82 Vilanterol and other drugs for obstructive airway diseases 2.17 5.06 0.05 5.98 Formoterol and Fluticasone 0.67 1.55 0.01 1.53
A Alimentary Tract and Metabolism 3 A02BC Proton Pump Inhibitors 40.56 100.00 3.53 100.00 Esomeprazole 15.67 38.65 1.23 34.94 Lansoprazole 9.70 23.91 0.86 24.33 Omeprazole 7.49 18.46 0.65 18.47 Pantoprazole 6.85 16.89 0.72 20.32 Rabeprazole 0.85 2.09 0.07 1.94
V Various 4 V06DB Other Nutrients 39.03 100.00 0.46 100.00 Clinical Nutritional Products 39.03 100.00 0.46 100.00
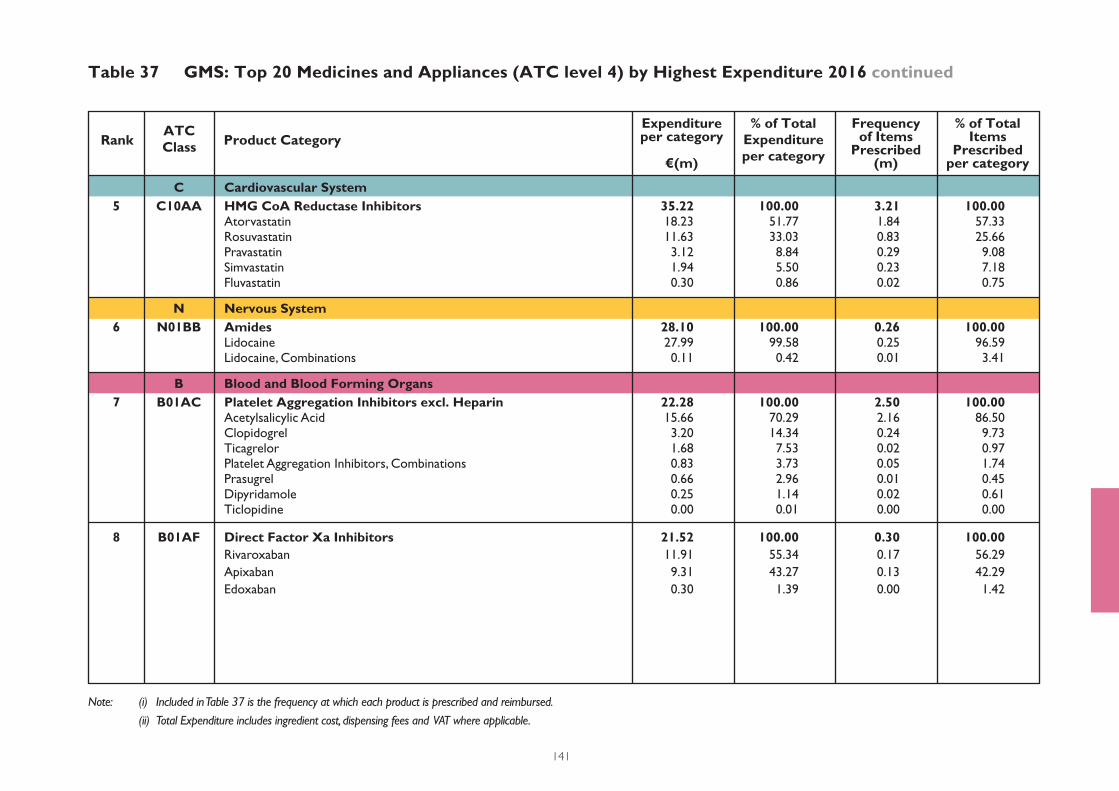
Note: (i) Included in Table 37 is the frequency at which each product is prescribed and reimbursed.
(ii) Total Expenditure includes ingredient cost, dispensing fees and VAT where applicable.
141
Table 37 GMS: Top 20 Medicines and Appliances (ATC level 4) by Highest Expenditure 2016 continued
Rank Product CategoryATCClass
Expenditureper category
€(m)
% of Total Expenditureper category
Frequencyof Items
Prescribed(m)
% of TotalItems
Prescribedper category
C Cardiovascular System 5 C10AA HMG CoA Reductase Inhibitors 35.22 100.00 3.21 100.00 Atorvastatin 18.23 51.77 1.84 57.33 Rosuvastatin 11.63 33.03 0.83 25.66 Pravastatin 3.12 8.84 0.29 9.08 Simvastatin 1.94 5.50 0.23 7.18 Fluvastatin 0.30 0.86 0.02 0.75
N Nervous System 6 N01BB Amides 28.10 100.00 0.26 100.00 Lidocaine 27.99 99.58 0.25 96.59 Lidocaine, Combinations 0.11 0.42 0.01 3.41
B Blood and Blood Forming Organs 7 B01AC Platelet Aggregation Inhibitors excl. Heparin 22.28 100.00 2.50 100.00 Acetylsalicylic Acid 15.66 70.29 2.16 86.50 Clopidogrel 3.20 14.34 0.24 9.73 Ticagrelor 1.68 7.53 0.02 0.97 Platelet Aggregation Inhibitors, Combinations 0.83 3.73 0.05 1.74 Prasugrel 0.66 2.96 0.01 0.45 Dipyridamole 0.25 1.14 0.02 0.61 Ticlopidine 0.00 0.01 0.00 0.00
8 B01AF Direct Factor Xa Inhibitors 21.52 100.00 0.30 100.00 Rivaroxaban 11.91 55.34 0.17 56.29
Apixaban 9.31 43.27 0.13 42.29
Edoxaban 0.30 1.39 0.00 1.42
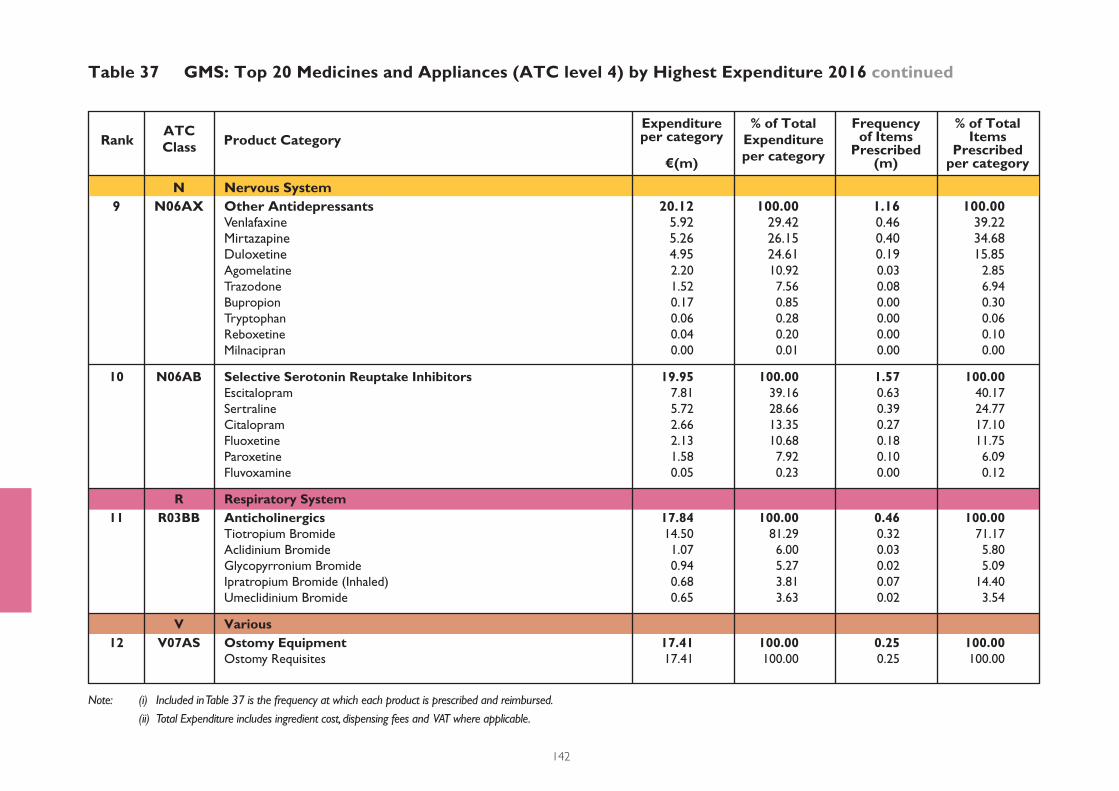
Note: (i) Included in Table 37 is the frequency at which each product is prescribed and reimbursed.
(ii) Total Expenditure includes ingredient cost, dispensing fees and VAT where applicable.
142
Table 37 GMS: Top 20 Medicines and Appliances (ATC level 4) by Highest Expenditure 2016 continued
Rank Product CategoryATCClass
Expenditureper category
€(m)
% of Total Expenditureper category
Frequencyof Items
Prescribed(m)
% of TotalItems
Prescribedper category
N Nervous System 9 N06AX Other Antidepressants 20.12 100.00 1.16 100.00 Venlafaxine 5.92 29.42 0.46 39.22 Mirtazapine 5.26 26.15 0.40 34.68 Duloxetine 4.95 24.61 0.19 15.85 Agomelatine 2.20 10.92 0.03 2.85
Trazodone 1.52 7.56 0.08 6.94
Bupropion 0.17 0.85 0.00 0.30
Tryptophan 0.06 0.28 0.00 0.06
Reboxetine 0.04 0.20 0.00 0.10
Milnacipran 0.00 0.01 0.00 0.00 10 N06AB Selective Serotonin Reuptake Inhibitors 19.95 100.00 1.57 100.00 Escitalopram 7.81 39.16 0.63 40.17
Sertraline 5.72 28.66 0.39 24.77
Citalopram 2.66 13.35 0.27 17.10
Fluoxetine 2.13 10.68 0.18 11.75
Paroxetine 1.58 7.92 0.10 6.09
Fluvoxamine 0.05 0.23 0.00 0.12
R Respiratory System 11 R03BB Anticholinergics 17.84 100.00 0.46 100.00 Tiotropium Bromide 14.50 81.29 0.32 71.17
Aclidinium Bromide 1.07 6.00 0.03 5.80
Glycopyrronium Bromide 0.94 5.27 0.02 5.09
Ipratropium Bromide (Inhaled) 0.68 3.81 0.07 14.40
Umeclidinium Bromide 0.65 3.63 0.02 3.54
V Various 12 V07AS Ostomy Equipment 17.41 100.00 0.25 100.00 Ostomy Requisites 17.41 100.00 0.25 100.00
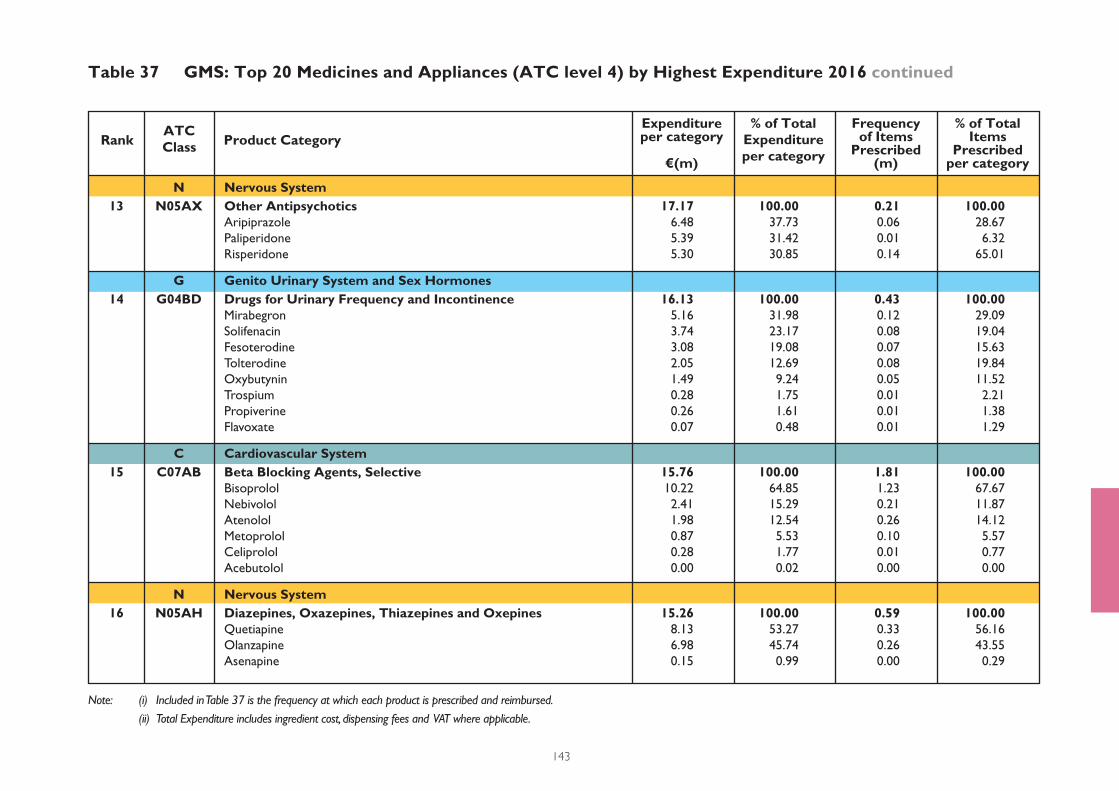
Note: (i) Included in Table 37 is the frequency at which each product is prescribed and reimbursed.
(ii) Total Expenditure includes ingredient cost, dispensing fees and VAT where applicable.
143
Table 37 GMS: Top 20 Medicines and Appliances (ATC level 4) by Highest Expenditure 2016 continued
Rank Product CategoryATCClass
Expenditureper category
€(m)
% of Total Expenditureper category
Frequencyof Items
Prescribed(m)
% of TotalItems
Prescribedper category
N Nervous System 13 N05AX Other Antipsychotics 17.17 100.00 0.21 100.00 Aripiprazole 6.48 37.73 0.06 28.67
Paliperidone 5.39 31.42 0.01 6.32
Risperidone 5.30 30.85 0.14 65.01
G Genito Urinary System and Sex Hormones 14 G04BD Drugs for Urinary Frequency and Incontinence 16.13 100.00 0.43 100.00 Mirabegron 5.16 31.98 0.12 29.09
Solifenacin 3.74 23.17 0.08 19.04
Fesoterodine 3.08 19.08 0.07 15.63
Tolterodine 2.05 12.69 0.08 19.84
Oxybutynin 1.49 9.24 0.05 11.52
Trospium 0.28 1.75 0.01 2.21
Propiverine 0.26 1.61 0.01 1.38
Flavoxate 0.07 0.48 0.01 1.29
C Cardiovascular System 15 C07AB Beta Blocking Agents, Selective 15.76 100.00 1.81 100.00 Bisoprolol 10.22 64.85 1.23 67.67
Nebivolol 2.41 15.29 0.21 11.87
Atenolol 1.98 12.54 0.26 14.12
Metoprolol 0.87 5.53 0.10 5.57
Celiprolol 0.28 1.77 0.01 0.77
Acebutolol 0.00 0.02 0.00 0.00
N Nervous System 16 N05AH Diazepines, Oxazepines, Thiazepines and Oxepines 15.26 100.00 0.59 100.00 Quetiapine 8.13 53.27 0.33 56.16
Olanzapine 6.98 45.74 0.26 43.55
Asenapine 0.15 0.99 0.00 0.29
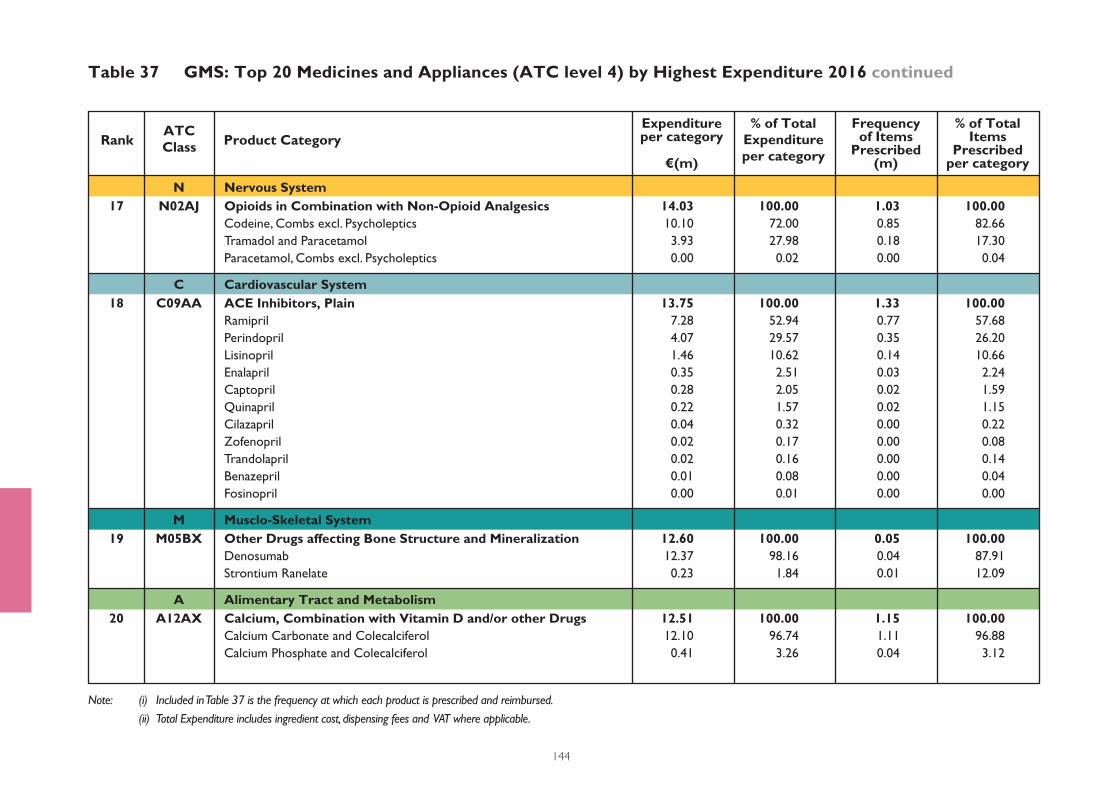
Note: (i) Included in Table 37 is the frequency at which each product is prescribed and reimbursed.
(ii) Total Expenditure includes ingredient cost, dispensing fees and VAT where applicable.
144
Table 37 GMS: Top 20 Medicines and Appliances (ATC level 4) by Highest Expenditure 2016 continued
Rank Product CategoryATCClass
Expenditureper category
€(m)
% of Total Expenditureper category
Frequencyof Items
Prescribed(m)
% of TotalItems
Prescribedper category
N Nervous System 17 N02AJ Opioids in Combination with Non-Opioid Analgesics 14.03 100.00 1.03 100.00 Codeine, Combs excl. Psycholeptics 10.10 72.00 0.85 82.66
Tramadol and Paracetamol 3.93 27.98 0.18 17.30
Paracetamol, Combs excl. Psycholeptics 0.00 0.02 0.00 0.04
C Cardiovascular System 18 C09AA ACE Inhibitors, Plain 13.75 100.00 1.33 100.00 Ramipril 7.28 52.94 0.77 57.68
Perindopril 4.07 29.57 0.35 26.20
Lisinopril 1.46 10.62 0.14 10.66
Enalapril 0.35 2.51 0.03 2.24
Captopril 0.28 2.05 0.02 1.59
Quinapril 0.22 1.57 0.02 1.15
Cilazapril 0.04 0.32 0.00 0.22
Zofenopril 0.02 0.17 0.00 0.08
Trandolapril 0.02 0.16 0.00 0.14
Benazepril 0.01 0.08 0.00 0.04
Fosinopril 0.00 0.01 0.00 0.00
M Musclo-Skeletal System 19 M05BX Other Drugs affecting Bone Structure and Mineralization 12.60 100.00 0.05 100.00 Denosumab 12.37 98.16 0.04 87.91
Strontium Ranelate 0.23 1.84 0.01 12.09
A Alimentary Tract and Metabolism 20 A12AX Calcium, Combination with Vitamin D and/or other Drugs 12.51 100.00 1.15 100.00 Calcium Carbonate and Colecalciferol 12.10 96.74 1.11 96.88
Calcium Phosphate and Colecalciferol 0.41 3.26 0.04 3.12
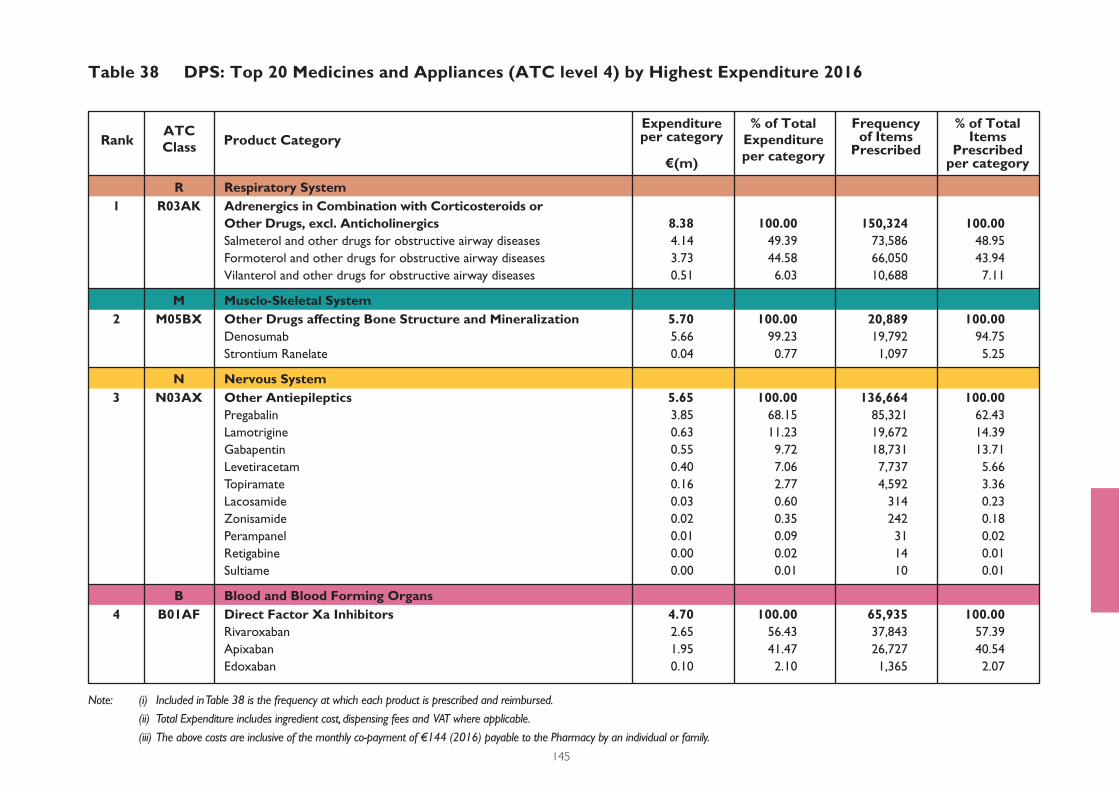
Note: (i) Included in Table 38 is the frequency at which each product is prescribed and reimbursed.
(ii) Total Expenditure includes ingredient cost, dispensing fees and VAT where applicable.
(iii) The above costs are inclusive of the monthly co-payment of €144 (2016) payable to the Pharmacy by an individual or family.
145
Table 38 DPS: Top 20 Medicines and Appliances (ATC level 4) by Highest Expenditure 2016
Rank Product CategoryATCClass
Expenditureper category
€(m)
% of Total Expenditureper category
Frequencyof Items
Prescribed
% of TotalItems
Prescribedper category
R Respiratory System 1 R03AK Adrenergics in Combination with Corticosteroids or Other Drugs, excl. Anticholinergics 8.38 100.00 150,324 100.00 Salmeterol and other drugs for obstructive airway diseases 4.14 49.39 73,586 48.95
Formoterol and other drugs for obstructive airway diseases 3.73 44.58 66,050 43.94
Vilanterol and other drugs for obstructive airway diseases 0.51 6.03 10,688 7.11
M Musclo-Skeletal System 2 M05BX Other Drugs affecting Bone Structure and Mineralization 5.70 100.00 20,889 100.00 Denosumab 5.66 99.23 19,792 94.75
Strontium Ranelate 0.04 0.77 1,097 5.25
N Nervous System 3 N03AX Other Antiepileptics 5.65 100.00 136,664 100.00 Pregabalin 3.85 68.15 85,321 62.43
Lamotrigine 0.63 11.23 19,672 14.39
Gabapentin 0.55 9.72 18,731 13.71
Levetiracetam 0.40 7.06 7,737 5.66
Topiramate 0.16 2.77 4,592 3.36
Lacosamide 0.03 0.60 314 0.23
Zonisamide 0.02 0.35 242 0.18
Perampanel 0.01 0.09 31 0.02
Retigabine 0.00 0.02 14 0.01
Sultiame 0.00 0.01 10 0.01
B Blood and Blood Forming Organs 4 B01AF Direct Factor Xa Inhibitors 4.70 100.00 65,935 100.00 Rivaroxaban 2.65 56.43 37,843 57.39
Apixaban 1.95 41.47 26,727 40.54
Edoxaban 0.10 2.10 1,365 2.07
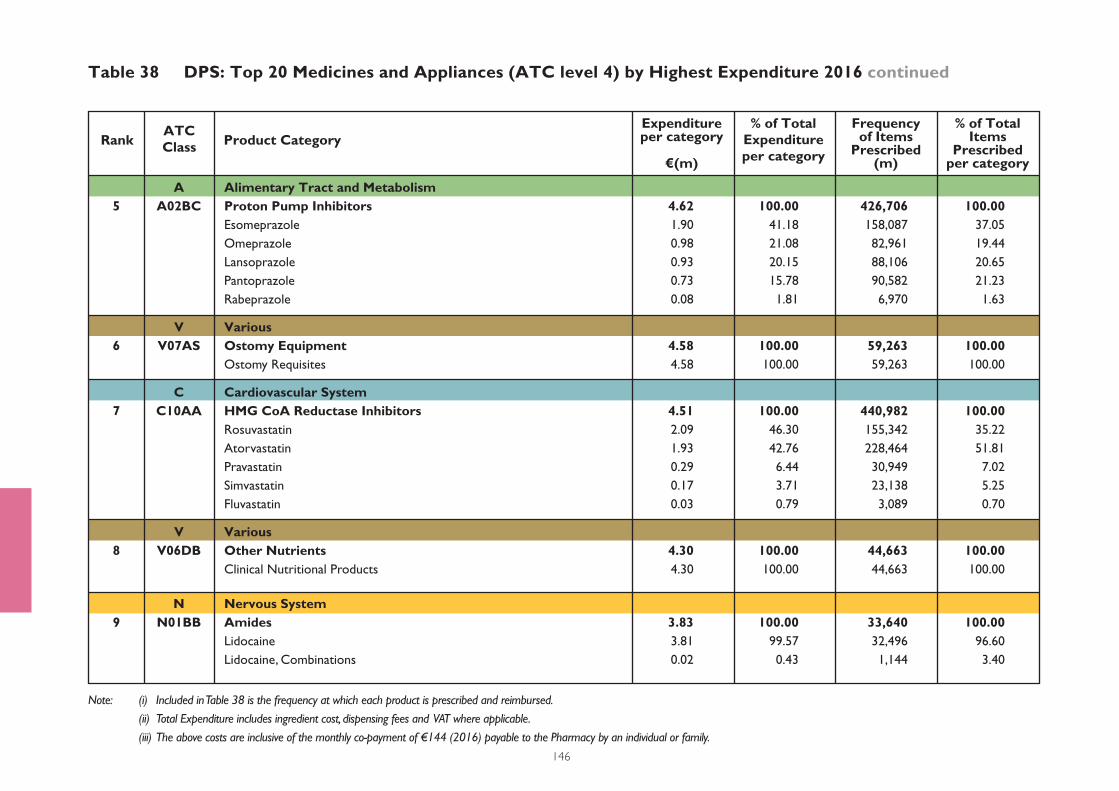
Note: (i) Included in Table 38 is the frequency at which each product is prescribed and reimbursed.
(ii) Total Expenditure includes ingredient cost, dispensing fees and VAT where applicable.
(iii) The above costs are inclusive of the monthly co-payment of €144 (2016) payable to the Pharmacy by an individual or family.
146
Table 38 DPS: Top 20 Medicines and Appliances (ATC level 4) by Highest Expenditure 2016 continued
Rank Product CategoryATCClass
Expenditureper category
€(m)
% of Total Expenditureper category
Frequencyof Items
Prescribed(m)
% of TotalItems
Prescribedper category
A Alimentary Tract and Metabolism 5 A02BC Proton Pump Inhibitors 4.62 100.00 426,706 100.00 Esomeprazole 1.90 41.18 158,087 37.05
Omeprazole 0.98 21.08 82,961 19.44
Lansoprazole 0.93 20.15 88,106 20.65
Pantoprazole 0.73 15.78 90,582 21.23
Rabeprazole 0.08 1.81 6,970 1.63
V Various 6 V07AS Ostomy Equipment 4.58 100.00 59,263 100.00 Ostomy Requisites 4.58 100.00 59,263 100.00
C Cardiovascular System 7 C10AA HMG CoA Reductase Inhibitors 4.51 100.00 440,982 100.00 Rosuvastatin 2.09 46.30 155,342 35.22
Atorvastatin 1.93 42.76 228,464 51.81
Pravastatin 0.29 6.44 30,949 7.02
Simvastatin 0.17 3.71 23,138 5.25
Fluvastatin 0.03 0.79 3,089 0.70
V Various 8 V06DB Other Nutrients 4.30 100.00 44,663 100.00 Clinical Nutritional Products 4.30 100.00 44,663 100.00
N Nervous System 9 N01BB Amides 3.83 100.00 33,640 100.00 Lidocaine 3.81 99.57 32,496 96.60
Lidocaine, Combinations 0.02 0.43 1,144 3.40
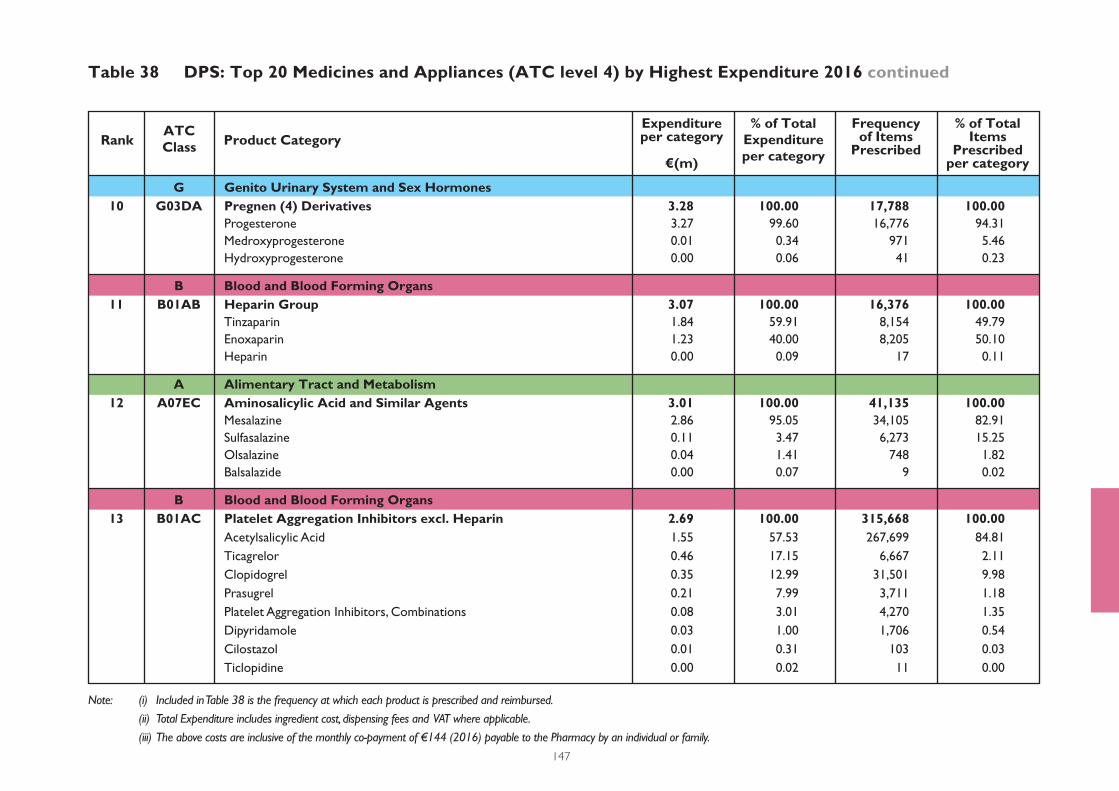
Note: (i) Included in Table 38 is the frequency at which each product is prescribed and reimbursed.
(ii) Total Expenditure includes ingredient cost, dispensing fees and VAT where applicable.
(iii) The above costs are inclusive of the monthly co-payment of €144 (2016) payable to the Pharmacy by an individual or family.
147
Table 38 DPS: Top 20 Medicines and Appliances (ATC level 4) by Highest Expenditure 2016 continued
Rank Product CategoryATCClass
Expenditureper category
€(m)
% of Total Expenditureper category
Frequencyof Items
Prescribed
% of TotalItems
Prescribedper category
G Genito Urinary System and Sex Hormones 10 G03DA Pregnen (4) Derivatives 3.28 100.00 17,788 100.00 Progesterone 3.27 99.60 16,776 94.31
Medroxyprogesterone 0.01 0.34 971 5.46
Hydroxyprogesterone 0.00 0.06 41 0.23
B Blood and Blood Forming Organs 11 B01AB Heparin Group 3.07 100.00 16,376 100.00 Tinzaparin 1.84 59.91 8,154 49.79
Enoxaparin 1.23 40.00 8,205 50.10
Heparin 0.00 0.09 17 0.11
A Alimentary Tract and Metabolism 12 A07EC Aminosalicylic Acid and Similar Agents 3.01 100.00 41,135 100.00 Mesalazine 2.86 95.05 34,105 82.91
Sulfasalazine 0.11 3.47 6,273 15.25
Olsalazine 0.04 1.41 748 1.82
Balsalazide 0.00 0.07 9 0.02
B Blood and Blood Forming Organs 13 B01AC Platelet Aggregation Inhibitors excl. Heparin 2.69 100.00 315,668 100.00 Acetylsalicylic Acid 1.55 57.53 267,699 84.81
Ticagrelor 0.46 17.15 6,667 2.11
Clopidogrel 0.35 12.99 31,501 9.98
Prasugrel 0.21 7.99 3,711 1.18
Platelet Aggregation Inhibitors, Combinations 0.08 3.01 4,270 1.35
Dipyridamole 0.03 1.00 1,706 0.54
Cilostazol 0.01 0.31 103 0.03
Ticlopidine 0.00 0.02 11 0.00
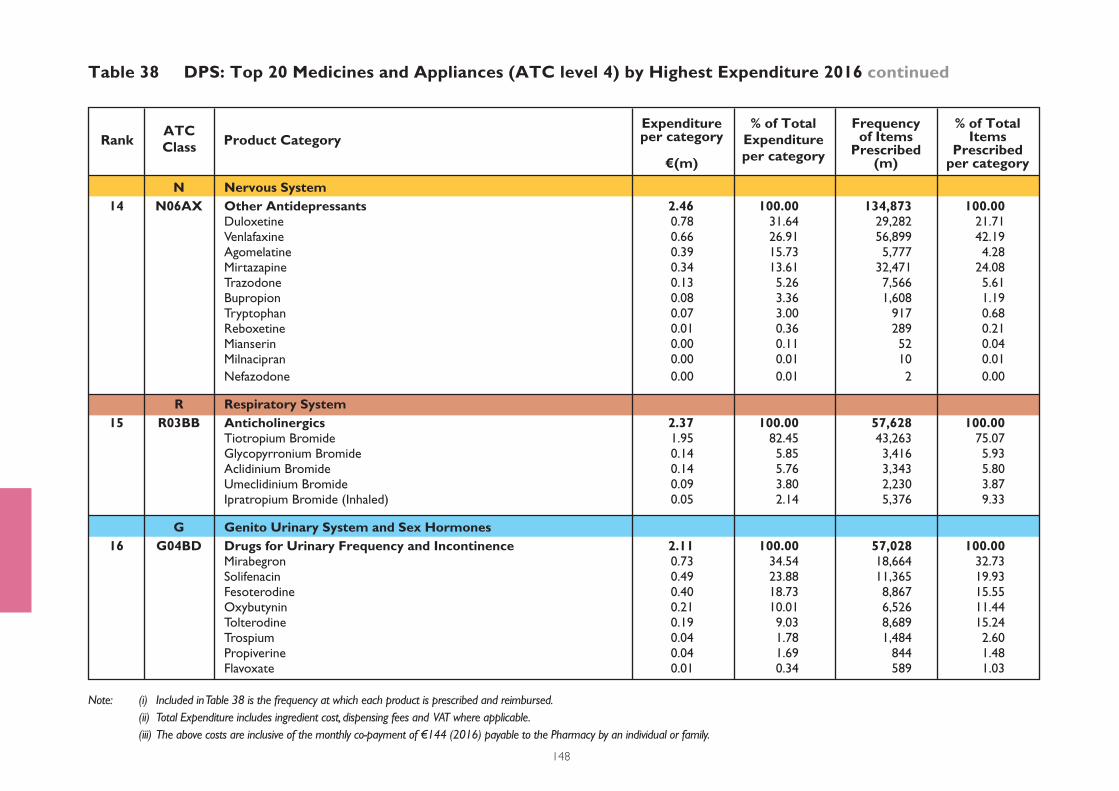
Note: (i) Included in Table 38 is the frequency at which each product is prescribed and reimbursed. (ii) Total Expenditure includes ingredient cost, dispensing fees and VAT where applicable. (iii) The above costs are inclusive of the monthly co-payment of €144 (2016) payable to the Pharmacy by an individual or family.
148
Table 38 DPS: Top 20 Medicines and Appliances (ATC level 4) by Highest Expenditure 2016 continued
Rank Product CategoryATCClass
Expenditureper category
€(m)
% of Total Expenditureper category
Frequencyof Items
Prescribed(m)
% of TotalItems
Prescribedper category
N Nervous System 14 N06AX Other Antidepressants 2.46 100.00 134,873 100.00 Duloxetine 0.78 31.64 29,282 21.71 Venlafaxine 0.66 26.91 56,899 42.19 Agomelatine 0.39 15.73 5,777 4.28 Mirtazapine 0.34 13.61 32,471 24.08 Trazodone 0.13 5.26 7,566 5.61 Bupropion 0.08 3.36 1,608 1.19 Tryptophan 0.07 3.00 917 0.68 Reboxetine 0.01 0.36 289 0.21 Mianserin 0.00 0.11 52 0.04 Milnacipran 0.00 0.01 10 0.01
Nefazodone 0.00 0.01 2 0.00
R Respiratory System 15 R03BB Anticholinergics 2.37 100.00 57,628 100.00 Tiotropium Bromide 1.95 82.45 43,263 75.07 Glycopyrronium Bromide 0.14 5.85 3,416 5.93 Aclidinium Bromide 0.14 5.76 3,343 5.80 Umeclidinium Bromide 0.09 3.80 2,230 3.87 Ipratropium Bromide (Inhaled) 0.05 2.14 5,376 9.33
G Genito Urinary System and Sex Hormones 16 G04BD Drugs for Urinary Frequency and Incontinence 2.11 100.00 57,028 100.00 Mirabegron 0.73 34.54 18,664 32.73 Solifenacin 0.49 23.88 11,365 19.93 Fesoterodine 0.40 18.73 8,867 15.55 Oxybutynin 0.21 10.01 6,526 11.44 Tolterodine 0.19 9.03 8,689 15.24 Trospium 0.04 1.78 1,484 2.60 Propiverine 0.04 1.69 844 1.48 Flavoxate 0.01 0.34 589 1.03

Note: (i) Included in Table 38 is the frequency at which each product is prescribed and reimbursed.
(ii) Total Expenditure includes ingredient cost, dispensing fees and VAT where applicable.
(iii) The above costs are inclusive of the monthly co-payment of €144 (2016) payable to the Pharmacy by an individual or family.
149
Table 38 DPS: Top 20 Medicines and Appliances (ATC level 4) by Highest Expenditure 2016 continued
Rank Product CategoryATCClass
Expenditureper category
€(m)
% of Total Expenditureper category
Frequencyof Items
Prescribed
% of TotalItems
Prescribedper category
C Cardiovascular System 17 C09CA Angiotensin II Antagonists, Plain 1.90 100.00 139,281 100.00 Olmesartan Medoxomil 0.68 35.76 31,679 22.75 Valsartan 0.40 21.00 37,649 27.03 Losartan 0.24 12.84 22,275 15.99 Telmisartan 0.24 12.44 23,131 16.61 Candesartan 0.17 8.83 15,072 10.82 Irbesartan 0.08 4.05 5,186 3.72 Eprosartan 0.06 3.30 2,763 1.98
Azilsartan Medoxomil 0.03 1.78 1,526 1.10
V Various 18 V07AN Urinary Equipment 1.89 100.00 15,906 100.00 Urinary Requisites 1.89 100.00 15,906 100.00
R Respiratory System 19 R01AD Corticosteroids 1.86 100.00 93,793 100.00 Fluticasone, Combinations 0.71 38.32 22,113 23.58 Fluticasone Furoate 0.68 36.47 41,041 43.76 Mometasone 0.22 12.06 13,653 14.56 Triamcinolone 0.09 4.68 4,606 4.91 Fluticasone 0.09 4.53 5,763 6.14 Beclometasone (Nasal) 0.05 2.71 5,919 6.31
Budesonide 0.02 1.23 698 0.74
N Nervous System 20 N06AB Selective Serotonin Reuptake Inhibitors 1.83 100.00 157,435 100.00 Escitalopram 0.74 40.40 63,987 40.64 Sertraline 0.51 27.73 37,144 23.59 Citalopram 0.22 12.20 26,568 16.88 Fluoxetine 0.18 10.09 18,348 11.66 Paroxetine 0.17 9.22 11,115 7.06 Fluvoxamine 0.01 0.36 273 0.17
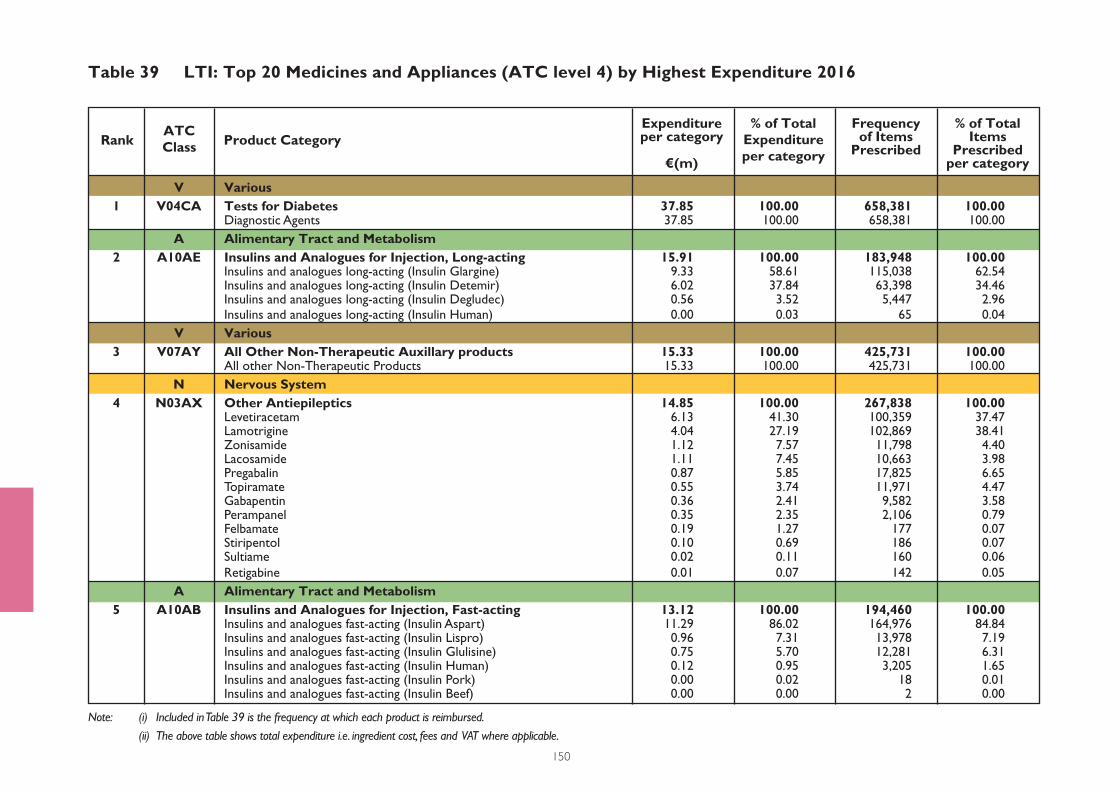
Note: (i) Included in Table 39 is the frequency at which each product is reimbursed.
(ii) The above table shows total expenditure i.e. ingredient cost, fees and VAT where applicable.
150
Table 39 LTI: Top 20 Medicines and Appliances (ATC level 4) by Highest Expenditure 2016
Rank Product CategoryATCClass
Expenditureper category
€(m)
% of Total Expenditureper category
Frequencyof Items
Prescribed
% of TotalItems
Prescribedper category
V Various 1 V04CA Tests for Diabetes 37.85 100.00 658,381 100.00 Diagnostic Agents 37.85 100.00 658,381 100.00
A Alimentary Tract and Metabolism 2 A10AE Insulins and Analogues for Injection, Long-acting 15.91 100.00 183,948 100.00 Insulins and analogues long-acting (Insulin Glargine) 9.33 58.61 115,038 62.54 Insulins and analogues long-acting (Insulin Detemir) 6.02 37.84 63,398 34.46 Insulins and analogues long-acting (Insulin Degludec) 0.56 3.52 5,447 2.96 Insulins and analogues long-acting (Insulin Human) 0.00 0.03 65 0.04
V Various 3 V07AY All Other Non-Therapeutic Auxillary products 15.33 100.00 425,731 100.00 All other Non-Therapeutic Products 15.33 100.00 425,731 100.00
N Nervous System 4 N03AX Other Antiepileptics 14.85 100.00 267,838 100.00 Levetiracetam 6.13 41.30 100,359 37.47 Lamotrigine 4.04 27.19 102,869 38.41 Zonisamide 1.12 7.57 11,798 4.40 Lacosamide 1.11 7.45 10,663 3.98 Pregabalin 0.87 5.85 17,825 6.65 Topiramate 0.55 3.74 11,971 4.47 Gabapentin 0.36 2.41 9,582 3.58 Perampanel 0.35 2.35 2,106 0.79 Felbamate 0.19 1.27 177 0.07 Stiripentol 0.10 0.69 186 0.07 Sultiame 0.02 0.11 160 0.06
Retigabine 0.01 0.07 142 0.05
A Alimentary Tract and Metabolism 5 A10AB Insulins and Analogues for Injection, Fast-acting 13.12 100.00 194,460 100.00 Insulins and analogues fast-acting (Insulin Aspart) 11.29 86.02 164,976 84.84 Insulins and analogues fast-acting (Insulin Lispro) 0.96 7.31 13,978 7.19 Insulins and analogues fast-acting (Insulin Glulisine) 0.75 5.70 12,281 6.31 Insulins and analogues fast-acting (Insulin Human) 0.12 0.95 3,205 1.65 Insulins and analogues fast-acting (Insulin Pork) 0.00 0.02 18 0.01 Insulins and analogues fast-acting (Insulin Beef) 0.00 0.00 2 0.00
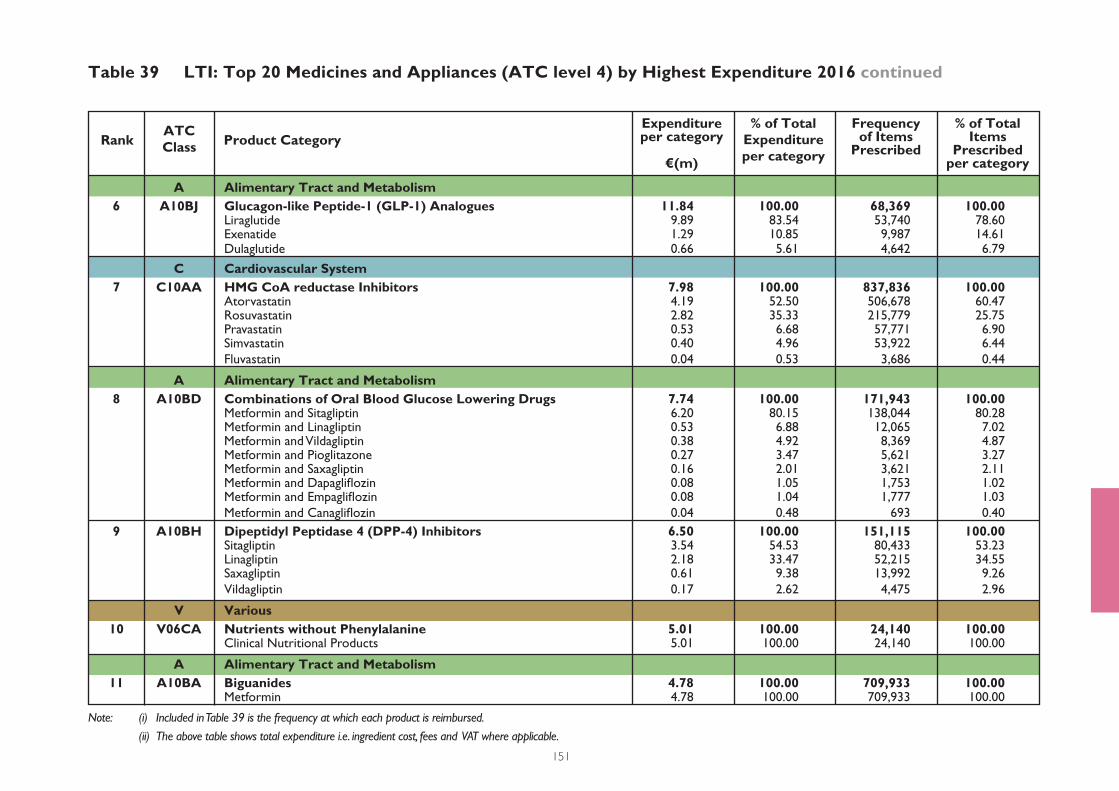
Note: (i) Included in Table 39 is the frequency at which each product is reimbursed.
(ii) The above table shows total expenditure i.e. ingredient cost, fees and VAT where applicable.
151
Table 39 LTI: Top 20 Medicines and Appliances (ATC level 4) by Highest Expenditure 2016 continued
Rank Product CategoryATCClass
Expenditureper category
€(m)
% of Total Expenditureper category
Frequencyof Items
Prescribed
% of TotalItems
Prescribedper category
A Alimentary Tract and Metabolism 6 A10BJ Glucagon-like Peptide-1 (GLP-1) Analogues 11.84 100.00 68,369 100.00 Liraglutide 9.89 83.54 53,740 78.60 Exenatide 1.29 10.85 9,987 14.61 Dulaglutide 0.66 5.61 4,642 6.79
C Cardiovascular System 7 C10AA HMG CoA reductase Inhibitors 7.98 100.00 837,836 100.00 Atorvastatin 4.19 52.50 506,678 60.47 Rosuvastatin 2.82 35.33 215,779 25.75 Pravastatin 0.53 6.68 57,771 6.90 Simvastatin 0.40 4.96 53,922 6.44
Fluvastatin 0.04 0.53 3,686 0.44
A Alimentary Tract and Metabolism 8 A10BD Combinations of Oral Blood Glucose Lowering Drugs 7.74 100.00 171,943 100.00 Metformin and Sitagliptin 6.20 80.15 138,044 80.28 Metformin and Linagliptin 0.53 6.88 12,065 7.02 Metformin and Vildagliptin 0.38 4.92 8,369 4.87 Metformin and Pioglitazone 0.27 3.47 5,621 3.27 Metformin and Saxagliptin 0.16 2.01 3,621 2.11 Metformin and Dapaglifl ozin 0.08 1.05 1,753 1.02 Metformin and Empaglifl ozin 0.08 1.04 1,777 1.03
Metformin and Canaglifl ozin 0.04 0.48 693 0.40
9 A10BH Dipeptidyl Peptidase 4 (DPP-4) Inhibitors 6.50 100.00 151,115 100.00 Sitagliptin 3.54 54.53 80,433 53.23 Linagliptin 2.18 33.47 52,215 34.55 Saxagliptin 0.61 9.38 13,992 9.26
Vildagliptin 0.17 2.62 4,475 2.96
V Various 10 V06CA Nutrients without Phenylalanine 5.01 100.00 24,140 100.00 Clinical Nutritional Products 5.01 100.00 24,140 100.00
A Alimentary Tract and Metabolism 11 A10BA Biguanides 4.78 100.00 709,933 100.00 Metformin 4.78 100.00 709,933 100.00
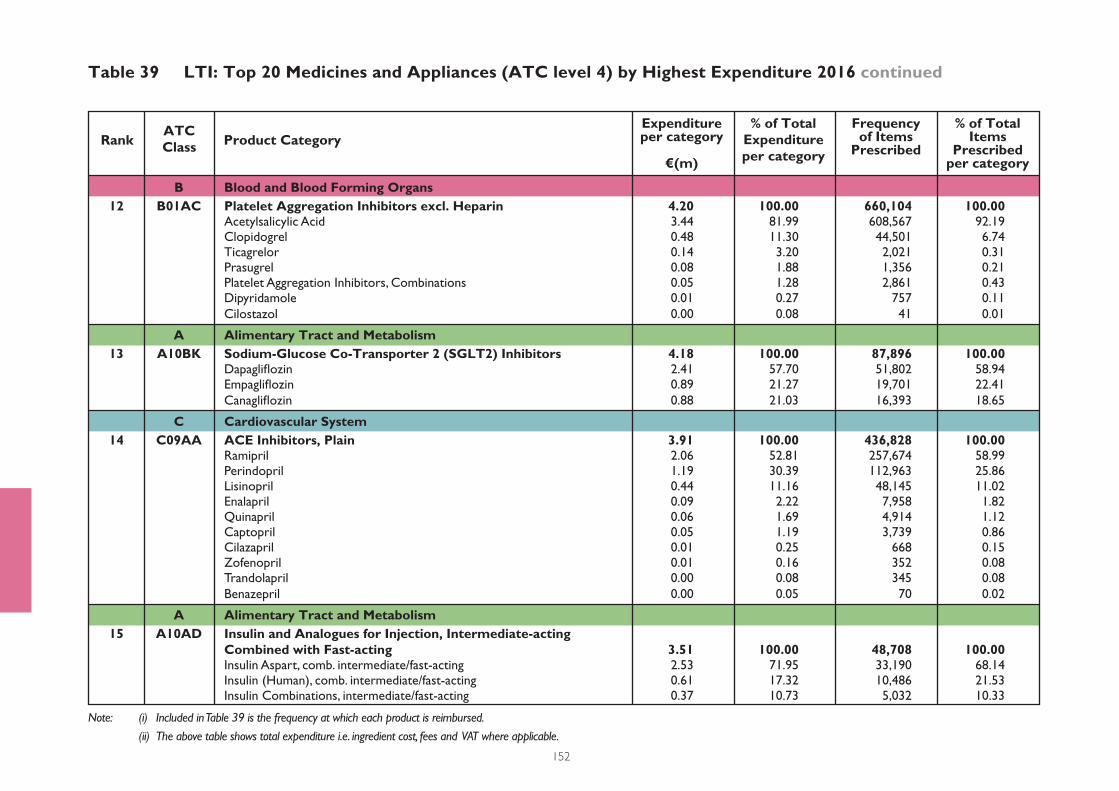
Note: (i) Included in Table 39 is the frequency at which each product is reimbursed.
(ii) The above table shows total expenditure i.e. ingredient cost, fees and VAT where applicable.
152
Table 39 LTI: Top 20 Medicines and Appliances (ATC level 4) by Highest Expenditure 2016 continued
Rank Product CategoryATCClass
Expenditureper category
€(m)
% of Total Expenditureper category
Frequencyof Items
Prescribed
% of TotalItems
Prescribedper category
B Blood and Blood Forming Organs 12 B01AC Platelet Aggregation Inhibitors excl. Heparin 4.20 100.00 660,104 100.00 Acetylsalicylic Acid 3.44 81.99 608,567 92.19 Clopidogrel 0.48 11.30 44,501 6.74 Ticagrelor 0.14 3.20 2,021 0.31 Prasugrel 0.08 1.88 1,356 0.21 Platelet Aggregation Inhibitors, Combinations 0.05 1.28 2,861 0.43 Dipyridamole 0.01 0.27 757 0.11
Cilostazol 0.00 0.08 41 0.01
A Alimentary Tract and Metabolism 13 A10BK Sodium-Glucose Co-Transporter 2 (SGLT2) Inhibitors 4.18 100.00 87,896 100.00 Dapaglifl ozin 2.41 57.70 51,802 58.94 Empaglifl ozin 0.89 21.27 19,701 22.41
Canaglifl ozin 0.88 21.03 16,393 18.65
C Cardiovascular System 14 C09AA ACE Inhibitors, Plain 3.91 100.00 436,828 100.00 Ramipril 2.06 52.81 257,674 58.99 Perindopril 1.19 30.39 112,963 25.86 Lisinopril 0.44 11.16 48,145 11.02 Enalapril 0.09 2.22 7,958 1.82 Quinapril 0.06 1.69 4,914 1.12 Captopril 0.05 1.19 3,739 0.86 Cilazapril 0.01 0.25 668 0.15 Zofenopril 0.01 0.16 352 0.08 Trandolapril 0.00 0.08 345 0.08
Benazepril 0.00 0.05 70 0.02
A Alimentary Tract and Metabolism 15 A10AD Insulin and Analogues for Injection, Intermediate-acting Combined with Fast-acting 3.51 100.00 48,708 100.00 Insulin Aspart, comb. intermediate/fast-acting 2.53 71.95 33,190 68.14 Insulin (Human), comb. intermediate/fast-acting 0.61 17.32 10,486 21.53 Insulin Combinations, intermediate/fast-acting 0.37 10.73 5,032 10.33
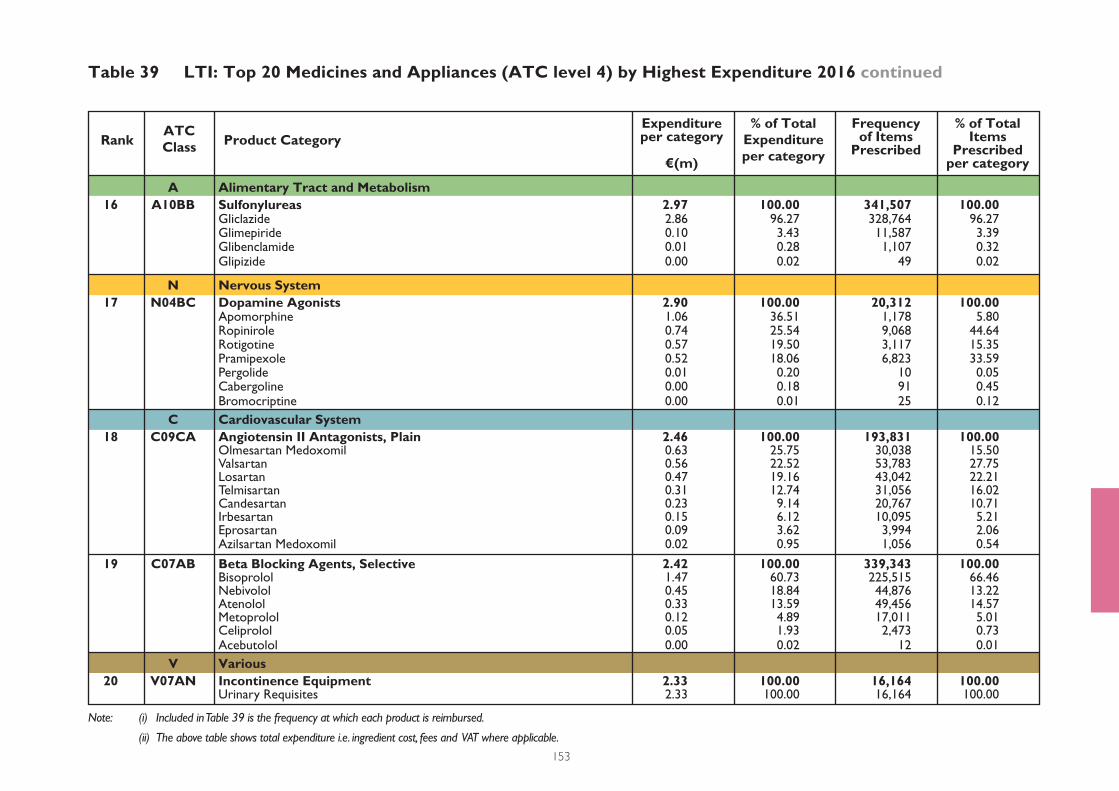
Note: (i) Included in Table 39 is the frequency at which each product is reimbursed.
(ii) The above table shows total expenditure i.e. ingredient cost, fees and VAT where applicable.
153
Table 39 LTI: Top 20 Medicines and Appliances (ATC level 4) by Highest Expenditure 2016 continued
Rank Product CategoryATCClass
Expenditureper category
€(m)
% of Total Expenditureper category
Frequencyof Items
Prescribed
% of TotalItems
Prescribedper category
A Alimentary Tract and Metabolism 16 A10BB Sulfonylureas 2.97 100.00 341,507 100.00 Gliclazide 2.86 96.27 328,764 96.27 Glimepiride 0.10 3.43 11,587 3.39 Glibenclamide 0.01 0.28 1,107 0.32 Glipizide 0.00 0.02 49 0.02
N Nervous System 17 N04BC Dopamine Agonists 2.90 100.00 20,312 100.00 Apomorphine 1.06 36.51 1,178 5.80 Ropinirole 0.74 25.54 9,068 44.64 Rotigotine 0.57 19.50 3,117 15.35 Pramipexole 0.52 18.06 6,823 33.59 Pergolide 0.01 0.20 10 0.05 Cabergoline 0.00 0.18 91 0.45 Bromocriptine 0.00 0.01 25 0.12
C Cardiovascular System 18 C09CA Angiotensin II Antagonists, Plain 2.46 100.00 193,831 100.00 Olmesartan Medoxomil 0.63 25.75 30,038 15.50 Valsartan 0.56 22.52 53,783 27.75 Losartan 0.47 19.16 43,042 22.21 Telmisartan 0.31 12.74 31,056 16.02 Candesartan 0.23 9.14 20,767 10.71 Irbesartan 0.15 6.12 10,095 5.21 Eprosartan 0.09 3.62 3,994 2.06 Azilsartan Medoxomil 0.02 0.95 1,056 0.54
19 C07AB Beta Blocking Agents, Selective 2.42 100.00 339,343 100.00 Bisoprolol 1.47 60.73 225,515 66.46 Nebivolol 0.45 18.84 44,876 13.22 Atenolol 0.33 13.59 49,456 14.57 Metoprolol 0.12 4.89 17,011 5.01 Celiprolol 0.05 1.93 2,473 0.73 Acebutolol 0.00 0.02 12 0.01
V Various 20 V07AN Incontinence Equipment 2.33 100.00 16,164 100.00 Urinary Requisites 2.33 100.00 16,164 100.00

Note: (i) Included in Table 40 is the frequency at which each product is reimbursed.
(ii) Total Expenditure includes ingredient cost and VAT where applicable, based on claims submitted by Pharmacists.
154
Table 40 HT: Top 20 Medicines and Appliances (ATC level 4) by Highest Expenditure 2016
Rank Product CategoryATCClass
Expenditureper category
€(m)
% of Total Expenditureper category
Frequencyof Items
Prescribed
% of TotalItems
Prescribedper category
L Antineoplastic and Immunomodulating Agents 1 L04AB Tumor Necrosis Factor alpha (TNF-a) Inhibitors 220.90 100.00 178,443 100.00 Adalimumab 123.48 55.90 93,067 52.15 Etanercept 66.36 30.04 63,356 35.51 Golimumab 18.93 8.57 16,130 9.04 Certolizumab Pegol 12.13 5.49 5,890 3.30
2 L01XE Protein Kinase Inhibitors 39.25 100.00 15,768 100.00 Imatinib 8.91 22.70 4,637 29.41 Ruxolitinib 4.50 11.47 1,543 9.79 Dasatinib 3.14 8.00 1,033 6.55 Nilotinib 3.09 7.86 1,233 7.82 Sunitinib 2.93 7.45 1,390 8.81 Ibrutinib 2.47 6.29 470 2.98 Dabrafenib 2.14 5.46 432 2.74 Everolimus 2.06 5.24 865 5.48 Pazopanib 2.00 5.10 1,021 6.48 Crizotinib 1.78 4.54 379 2.40 Erlotinib 1.34 3.41 789 5.00 Axitinib 1.16 2.96 340 2.15 Sorafenib 1.08 2.74 479 3.04 Regorafenib 0.85 2.18 317 2.01 Lapatinib 0.39 1.00 272 1.73 Afatinib 0.38 0.96 210 1.33 Lenvatinib 0.33 0.85 131 0.83 Bosutinib 0.29 0.74 101 0.64 Vemurafenib 0.28 0.71 75 0.48 Gefi tinib 0.07 0.18 37 0.24 Vandetanib 0.04 0.10 9 0.06 Ceritinib 0.02 0.06 5 0.03
3 L04AX Other Immunosuppressants 35.73 100.00 9,432 100.00 Lenalidomide 23.30 65.21 5,125 54.34 Pirfenidone 8.16 22.83 3,227 34.21 Pomalidomide 4.00 11.21 486 5.15 Thalidomide 0.27 0.75 594 6.30
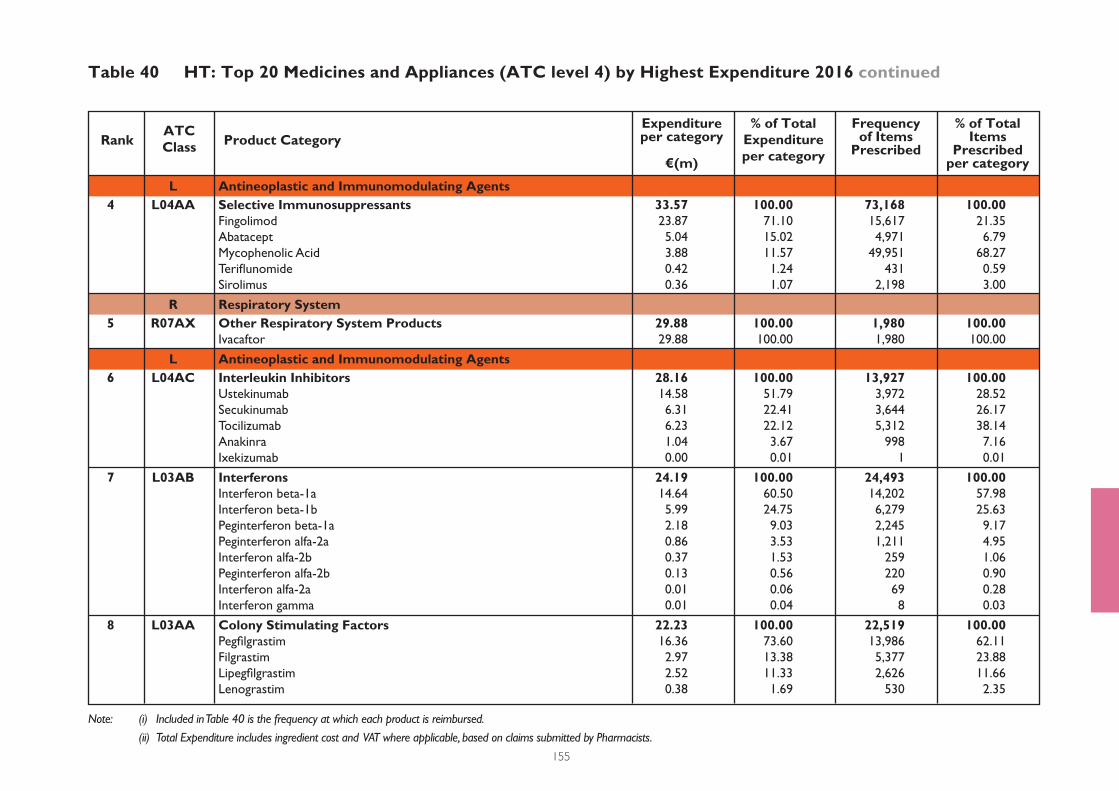
Note: (i) Included in Table 40 is the frequency at which each product is reimbursed.
(ii) Total Expenditure includes ingredient cost and VAT where applicable, based on claims submitted by Pharmacists.
155
Table 40 HT: Top 20 Medicines and Appliances (ATC level 4) by Highest Expenditure 2016 continued
Rank Product CategoryATCClass
Expenditureper category
€(m)
% of Total Expenditureper category
Frequencyof Items
Prescribed
% of TotalItems
Prescribedper category
L Antineoplastic and Immunomodulating Agents 4 L04AA Selective Immunosuppressants 33.57 100.00 73,168 100.00 Fingolimod 23.87 71.10 15,617 21.35
Abatacept 5.04 15.02 4,971 6.79
Mycophenolic Acid 3.88 11.57 49,951 68.27
Terifl unomide 0.42 1.24 431 0.59
Sirolimus 0.36 1.07 2,198 3.00
R Respiratory System 5 R07AX Other Respiratory System Products 29.88 100.00 1,980 100.00 Ivacaftor 29.88 100.00 1,980 100.00
L Antineoplastic and Immunomodulating Agents 6 L04AC Interleukin Inhibitors 28.16 100.00 13,927 100.00 Ustekinumab 14.58 51.79 3,972 28.52
Secukinumab 6.31 22.41 3,644 26.17
Tocilizumab 6.23 22.12 5,312 38.14
Anakinra 1.04 3.67 998 7.16
Ixekizumab 0.00 0.01 1 0.01
7 L03AB Interferons 24.19 100.00 24,493 100.00 Interferon beta-1a 14.64 60.50 14,202 57.98
Interferon beta-1b 5.99 24.75 6,279 25.63
Peginterferon beta-1a 2.18 9.03 2,245 9.17
Peginterferon alfa-2a 0.86 3.53 1,211 4.95
Interferon alfa-2b 0.37 1.53 259 1.06
Peginterferon alfa-2b 0.13 0.56 220 0.90
Interferon alfa-2a 0.01 0.06 69 0.28
Interferon gamma 0.01 0.04 8 0.03
8 L03AA Colony Stimulating Factors 22.23 100.00 22,519 100.00 Pegfi lgrastim 16.36 73.60 13,986 62.11
Filgrastim 2.97 13.38 5,377 23.88
Lipegfi lgrastim 2.52 11.33 2,626 11.66
Lenograstim 0.38 1.69 530 2.35
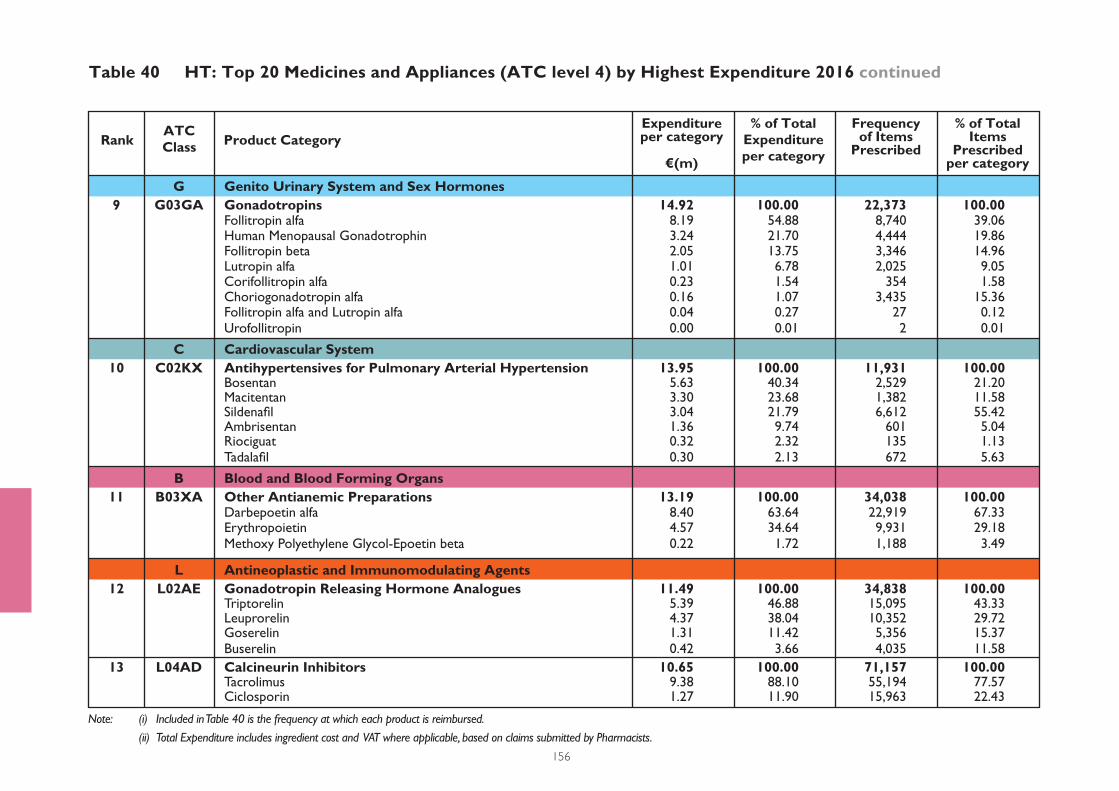
Note: (i) Included in Table 40 is the frequency at which each product is reimbursed.
(ii) Total Expenditure includes ingredient cost and VAT where applicable, based on claims submitted by Pharmacists.
156
Table 40 HT: Top 20 Medicines and Appliances (ATC level 4) by Highest Expenditure 2016 continued
Rank Product CategoryATCClass
Expenditureper category
€(m)
% of Total Expenditureper category
Frequencyof Items
Prescribed
% of TotalItems
Prescribedper category
G Genito Urinary System and Sex Hormones 9 G03GA Gonadotropins 14.92 100.00 22,373 100.00 Follitropin alfa 8.19 54.88 8,740 39.06 Human Menopausal Gonadotrophin 3.24 21.70 4,444 19.86 Follitropin beta 2.05 13.75 3,346 14.96 Lutropin alfa 1.01 6.78 2,025 9.05 Corifollitropin alfa 0.23 1.54 354 1.58 Choriogonadotropin alfa 0.16 1.07 3,435 15.36 Follitropin alfa and Lutropin alfa 0.04 0.27 27 0.12 Urofollitropin 0.00 0.01 2 0.01
C Cardiovascular System 10 C02KX Antihypertensives for Pulmonary Arterial Hypertension 13.95 100.00 11,931 100.00 Bosentan 5.63 40.34 2,529 21.20 Macitentan 3.30 23.68 1,382 11.58 Sildenafi l 3.04 21.79 6,612 55.42 Ambrisentan 1.36 9.74 601 5.04 Riociguat 0.32 2.32 135 1.13 Tadalafi l 0.30 2.13 672 5.63
B Blood and Blood Forming Organs 11 B03XA Other Antianemic Preparations 13.19 100.00 34,038 100.00 Darbepoetin alfa 8.40 63.64 22,919 67.33 Erythropoietin 4.57 34.64 9,931 29.18 Methoxy Polyethylene Glycol-Epoetin beta 0.22 1.72 1,188 3.49
L Antineoplastic and Immunomodulating Agents 12 L02AE Gonadotropin Releasing Hormone Analogues 11.49 100.00 34,838 100.00 Triptorelin 5.39 46.88 15,095 43.33 Leuprorelin 4.37 38.04 10,352 29.72 Goserelin 1.31 11.42 5,356 15.37 Buserelin 0.42 3.66 4,035 11.58
13 L04AD Calcineurin Inhibitors 10.65 100.00 71,157 100.00 Tacrolimus 9.38 88.10 55,194 77.57 Ciclosporin 1.27 11.90 15,963 22.43
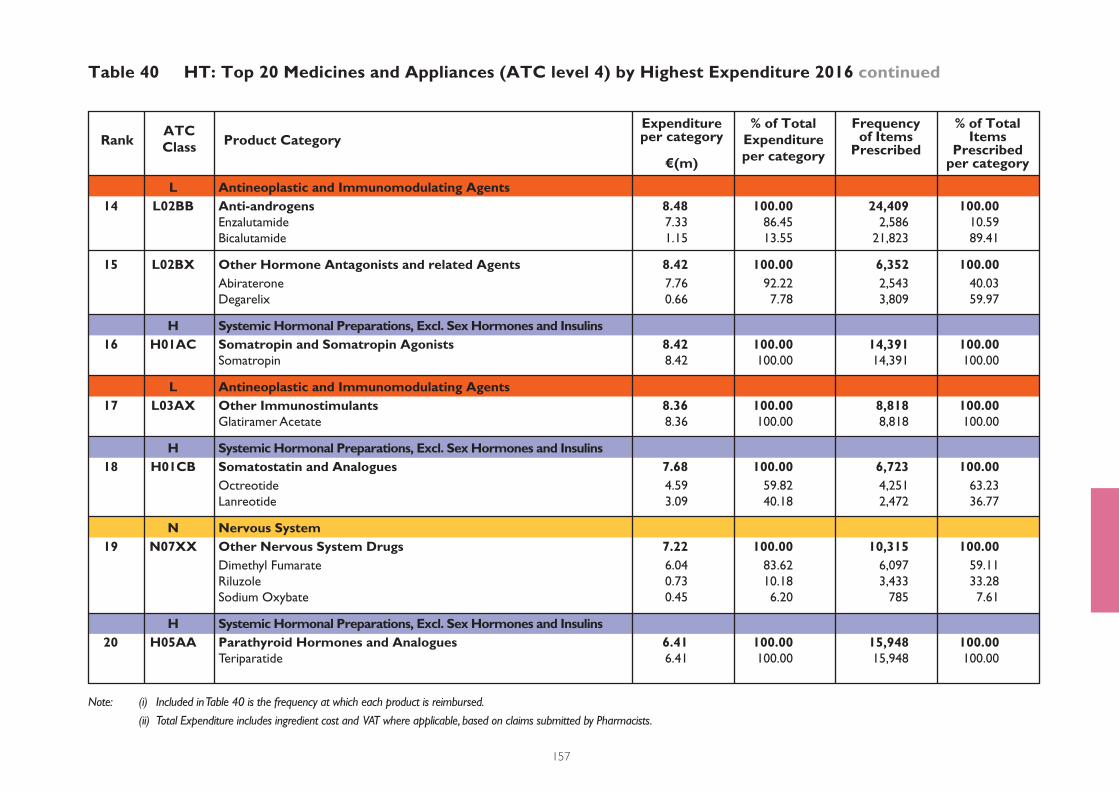
Note: (i) Included in Table 40 is the frequency at which each product is reimbursed.
(ii) Total Expenditure includes ingredient cost and VAT where applicable, based on claims submitted by Pharmacists.
157
Table 40 HT: Top 20 Medicines and Appliances (ATC level 4) by Highest Expenditure 2016 continued
Rank Product CategoryATCClass
Expenditureper category
€(m)
% of Total Expenditureper category
Frequencyof Items
Prescribed
% of TotalItems
Prescribedper category
L Antineoplastic and Immunomodulating Agents 14 L02BB Anti-androgens 8.48 100.00 24,409 100.00 Enzalutamide 7.33 86.45 2,586 10.59
Bicalutamide 1.15 13.55 21,823 89.41
15 L02BX Other Hormone Antagonists and related Agents 8.42 100.00 6,352 100.00 Abiraterone 7.76 92.22 2,543 40.03
Degarelix 0.66 7.78 3,809 59.97
H Systemic Hormonal Preparations, Excl. Sex Hormones and Insulins 16 H01AC Somatropin and Somatropin Agonists 8.42 100.00 14,391 100.00 Somatropin 8.42 100.00 14,391 100.00
L Antineoplastic and Immunomodulating Agents 17 L03AX Other Immunostimulants 8.36 100.00 8,818 100.00 Glatiramer Acetate 8.36 100.00 8,818 100.00
H Systemic Hormonal Preparations, Excl. Sex Hormones and Insulins 18 H01CB Somatostatin and Analogues 7.68 100.00 6,723 100.00 Octreotide 4.59 59.82 4,251 63.23
Lanreotide 3.09 40.18 2,472 36.77
N Nervous System 19 N07XX Other Nervous System Drugs 7.22 100.00 10,315 100.00 Dimethyl Fumarate 6.04 83.62 6,097 59.11
Riluzole 0.73 10.18 3,433 33.28
Sodium Oxybate 0.45 6.20 785 7.61
H Systemic Hormonal Preparations, Excl. Sex Hormones and Insulins 20 H05AA Parathyroid Hormones and Analogues 6.41 100.00 15,948 100.00 Teriparatide 6.41 100.00 15,948 100.00

Note: MMP refers to the Medicines Management Programme.
Simvastatin is the preferred statin by the MMP. Prescribers
should consider simvastatin fi rst-line and atorvastatin if an
increase in potency is required. Rosuvastatin is not recommended
due to cost.
Lansoprazole is the preferred PPI recommended by the MMP. It is recommended that the lowest dose be prescribed for the shortest duration that provides a therapeutic effect. Long-
term use of high dose PPIs can increase the risk of bone fracture &
hypomagnesaemia along with an increased risk of Clostridium diffi cile.
Amlodipine: Amlodipine is a dihydropyridine calcium channel blocker and is the preferred calcium channel blocker recommended by the MMP. It is licensed for the treatment
of hypertension and angina, is once daily dosing and has the lowest
acquisition cost.
The MMP recommend Citalopram as the preferred SSRI for the treatment of depression as it achieves the best balance between effi cacy, adverse-effect profi le, drug interactions and cost.
Bisoprolol: Bisoprolol is a cardioselective β-blocker and is
the preferred drug by the MMP. It is licensed for heart failure,
angina and hypertension and is once daily dosing with the lowest
acquisition cost.
158
Table 41 GMS: Notes on Some of the More Commonly Prescribed Products
Acetylsalicylic Acid: Acetylsalicylic Acid is the most commonly prescribed medicine on the GMS.
It is licensed for secondary prevention of thrombotic cerebrovascular and cardiovascular disease,
following by-pass surgery and mild to moderate pain. Aspirin should only be given to patients with a
high risk of a cardiac ischemic event due to the risk of bleeding.
Clinical Nutritional Products: This category includes oral nutritional supplements (ONS): sip
feeds, powdered and dessert style products used for patients at risk of malnutrition.
High-energy, low-volume sip feeds (e.g. compact) should be considered as they can aid compliance and have a lower cost. Treatment goals should be set and reviewed regularly to
ensure appropriate management of the patient’s nutritional needs.
Warfarin: Warfarin is a coumarin anticoagulant. It inhibits Vitamin K dependant synthesis of the
coagulation factors II, VII, IX and X. Warfarin is the anticoagulant of choice when INR is stable i.e.
the time in therapeutic range >70%. The direct acting anticoagulants (DOACs) [apixaban, dabigatran, edoxaban, rivaroxaban] are only licensed and reimbursed for stroke prevention in non-valvular atrial fi brillation, treatment of deep vein thrombosis or pulmonary embolism and thromboprophylaxis post elective knee and hip replacement surgery. Warfarin or low molecular weight heparins should be used fi rst-line for all other indications.
Metformin: Metformin is the only available biguanide. It exerts its effect mainly by decreasing
gluconeogenesis and by increasing peripheral utilisation of glucose. Hypoglycaemia does not usually
occur with metformin, therefore in line with international guidance, blood glucose monitoring may
not be required. One box of glucose test strips is reimbursed per month for patients on treatment with metformin alone for periodic testing.
Escitalopram: Escitalopram is a selective serotonin reuptake inhibitor (SSRI) and selectively inhibits
the reuptake of serotonin. It demonstrates comparable effi cacy to other SSRIs.
Lansoprazole, Omeprazole & Esomeprazole: These medicines are proton pump inhibitors
(PPIs) which prevent the secretion of gastric acid from the parietal cells in the stomach.
Atorvastatin & Rosuvastatin: Atorvastatin and Rosuvastatin are the most commonly prescribed
statins on the GMS scheme. Statins are prescribed for primary and secondary prevention of
cardiovascular disease.
Amoxicillin & Enzyme Inhibitor: Co-amoxiclav contains amoxicillin (a broad spectrum
penicillin) with a beta-lactamase inhibitor, clavulanic acid. Prescribing of co-amoxiclav should be
avoided in fi rst-line treatment in Primary Care. In many cases in Primary Care the preferred antibiotic is no antibiotic. Where indicated, the recommended fi rst-line treatments for upper
and lower respiratory tract infections include amoxicillin and phenoxymethylpenicillin. For more
information visit www.hse.ie/antibioticprescribing and www.antibioticprescribing.ie.
Salbutamol (Inhaled): Salbutamol is a short acting beta2 agonist indicated for the immediate
relief of mild to moderate symptoms of asthma. If beta2 agonist inhalation is required more than twice a week or if night-time symptoms occur at least once a week, a regular inhaled corticosteroid is indicated.
Zopiclone: Zopiclone is a ‘Z’ drug and acts on the benzodiazepine receptor. It is recommended
for short-term management of severe insomnia that interferes with normal daily life. Zopiclone should be prescribed for short periods of time (up to 4 weeks) only.
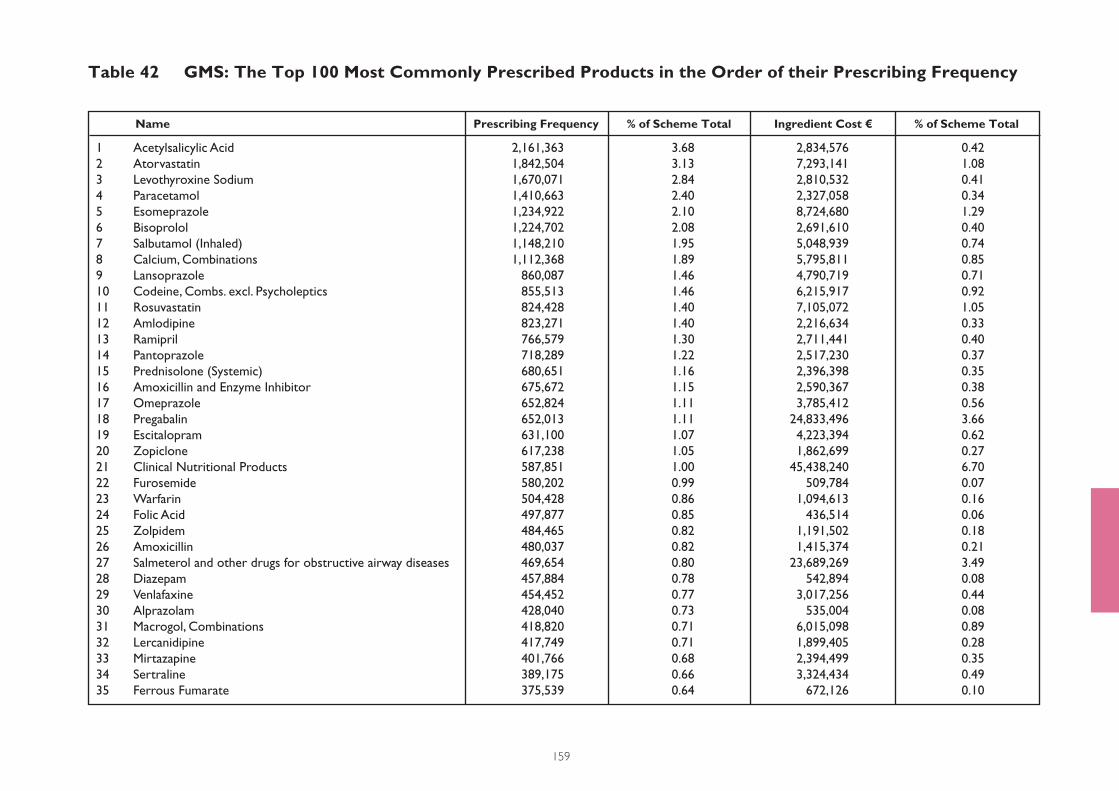
159
Table 42 GMS: The Top 100 Most Commonly Prescribed Products in the Order of their Prescribing Frequency
Name Prescribing Frequency % of Scheme Total Ingredient Cost € % of Scheme Total
1 Acetylsalicylic Acid 2,161,363 3.68 2,834,576 0.42
2 Atorvastatin 1,842,504 3.13 7,293,141 1.08
3 Levothyroxine Sodium 1,670,071 2.84 2,810,532 0.41
4 Paracetamol 1,410,663 2.40 2,327,058 0.34
5 Esomeprazole 1,234,922 2.10 8,724,680 1.29
6 Bisoprolol 1,224,702 2.08 2,691,610 0.40
7 Salbutamol (Inhaled) 1,148,210 1.95 5,048,939 0.74
8 Calcium, Combinations 1,112,368 1.89 5,795,811 0.85
9 Lansoprazole 860,087 1.46 4,790,719 0.71
10 Codeine, Combs. excl. Psycholeptics 855,513 1.46 6,215,917 0.92
11 Rosuvastatin 824,428 1.40 7,105,072 1.05
12 Amlodipine 823,271 1.40 2,216,634 0.33
13 Ramipril 766,579 1.30 2,711,441 0.40
14 Pantoprazole 718,289 1.22 2,517,230 0.37
15 Prednisolone (Systemic) 680,651 1.16 2,396,398 0.35
16 Amoxicillin and Enzyme Inhibitor 675,672 1.15 2,590,367 0.38
17 Omeprazole 652,824 1.11 3,785,412 0.56
18 Pregabalin 652,013 1.11 24,833,496 3.66
19 Escitalopram 631,100 1.07 4,223,394 0.62
20 Zopiclone 617,238 1.05 1,862,699 0.27
21 Clinical Nutritional Products 587,851 1.00 45,438,240 6.70
22 Furosemide 580,202 0.99 509,784 0.07
23 Warfarin 504,428 0.86 1,094,613 0.16
24 Folic Acid 497,877 0.85 436,514 0.06
25 Zolpidem 484,465 0.82 1,191,502 0.18
26 Amoxicillin 480,037 0.82 1,415,374 0.21
27 Salmeterol and other drugs for obstructive airway diseases 469,654 0.80 23,689,269 3.49
28 Diazepam 457,884 0.78 542,894 0.08
29 Venlafaxine 454,452 0.77 3,017,256 0.44
30 Alprazolam 428,040 0.73 535,004 0.08
31 Macrogol, Combinations 418,820 0.71 6,015,098 0.89
32 Lercanidipine 417,749 0.71 1,899,405 0.28
33 Mirtazapine 401,766 0.68 2,394,499 0.35
34 Sertraline 389,175 0.66 3,324,434 0.49
35 Ferrous Fumarate 375,539 0.64 672,126 0.10
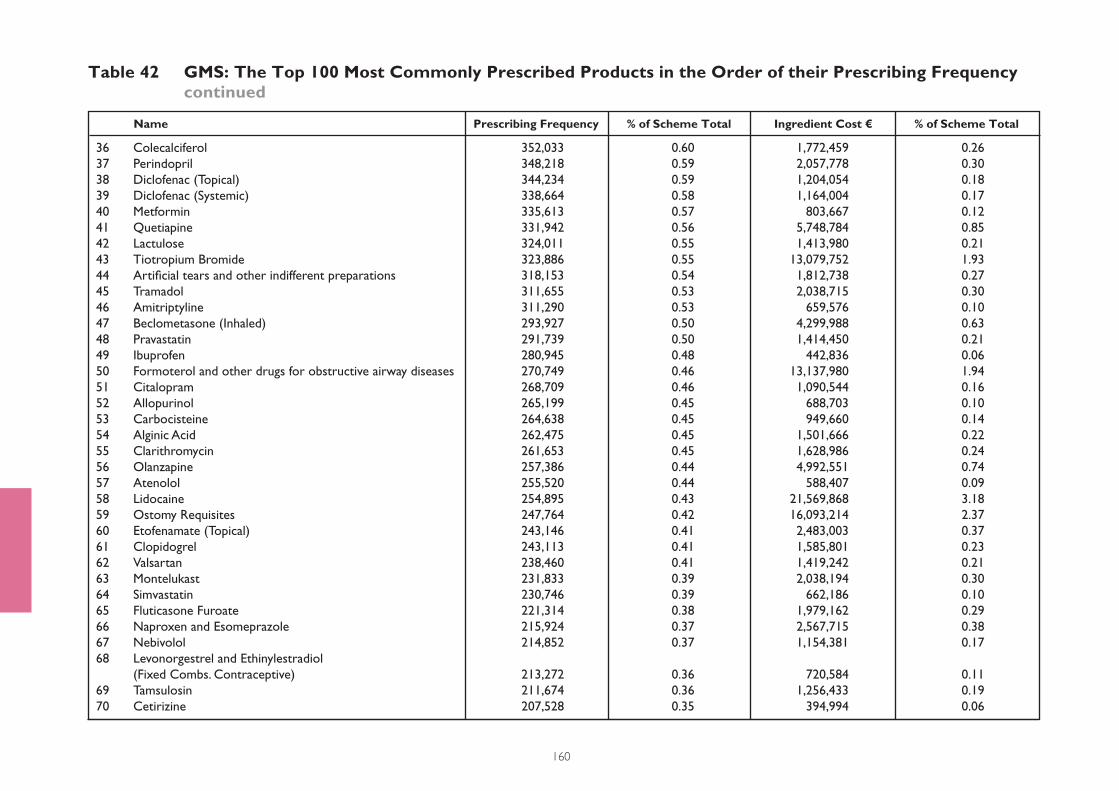
160
Table 42 GMS: The Top 100 Most Commonly Prescribed Products in the Order of their Prescribing Frequency continued
Name Prescribing Frequency % of Scheme Total Ingredient Cost € % of Scheme Total
36 Colecalciferol 352,033 0.60 1,772,459 0.26
37 Perindopril 348,218 0.59 2,057,778 0.30
38 Diclofenac (Topical) 344,234 0.59 1,204,054 0.18
39 Diclofenac (Systemic) 338,664 0.58 1,164,004 0.17
40 Metformin 335,613 0.57 803,667 0.12
41 Quetiapine 331,942 0.56 5,748,784 0.85
42 Lactulose 324,011 0.55 1,413,980 0.21
43 Tiotropium Bromide 323,886 0.55 13,079,752 1.93
44 Artifi cial tears and other indifferent preparations 318,153 0.54 1,812,738 0.27
45 Tramadol 311,655 0.53 2,038,715 0.30
46 Amitriptyline 311,290 0.53 659,576 0.10
47 Beclometasone (Inhaled) 293,927 0.50 4,299,988 0.63
48 Pravastatin 291,739 0.50 1,414,450 0.21
49 Ibuprofen 280,945 0.48 442,836 0.06
50 Formoterol and other drugs for obstructive airway diseases 270,749 0.46 13,137,980 1.94
51 Citalopram 268,709 0.46 1,090,544 0.16
52 Allopurinol 265,199 0.45 688,703 0.10
53 Carbocisteine 264,638 0.45 949,660 0.14
54 Alginic Acid 262,475 0.45 1,501,666 0.22
55 Clarithromycin 261,653 0.45 1,628,986 0.24
56 Olanzapine 257,386 0.44 4,992,551 0.74
57 Atenolol 255,520 0.44 588,407 0.09
58 Lidocaine 254,895 0.43 21,569,868 3.18
59 Ostomy Requisites 247,764 0.42 16,093,214 2.37
60 Etofenamate (Topical) 243,146 0.41 2,483,003 0.37
61 Clopidogrel 243,113 0.41 1,585,801 0.23
62 Valsartan 238,460 0.41 1,419,242 0.21
63 Montelukast 231,833 0.39 2,038,194 0.30
64 Simvastatin 230,746 0.39 662,186 0.10
65 Fluticasone Furoate 221,314 0.38 1,979,162 0.29
66 Naproxen and Esomeprazole 215,924 0.37 2,567,715 0.38
67 Nebivolol 214,852 0.37 1,154,381 0.17
68 Levonorgestrel and Ethinylestradiol
(Fixed Combs. Contraceptive) 213,272 0.36 720,584 0.11
69 Tamsulosin 211,674 0.36 1,256,433 0.19
70 Cetirizine 207,528 0.35 394,994 0.06
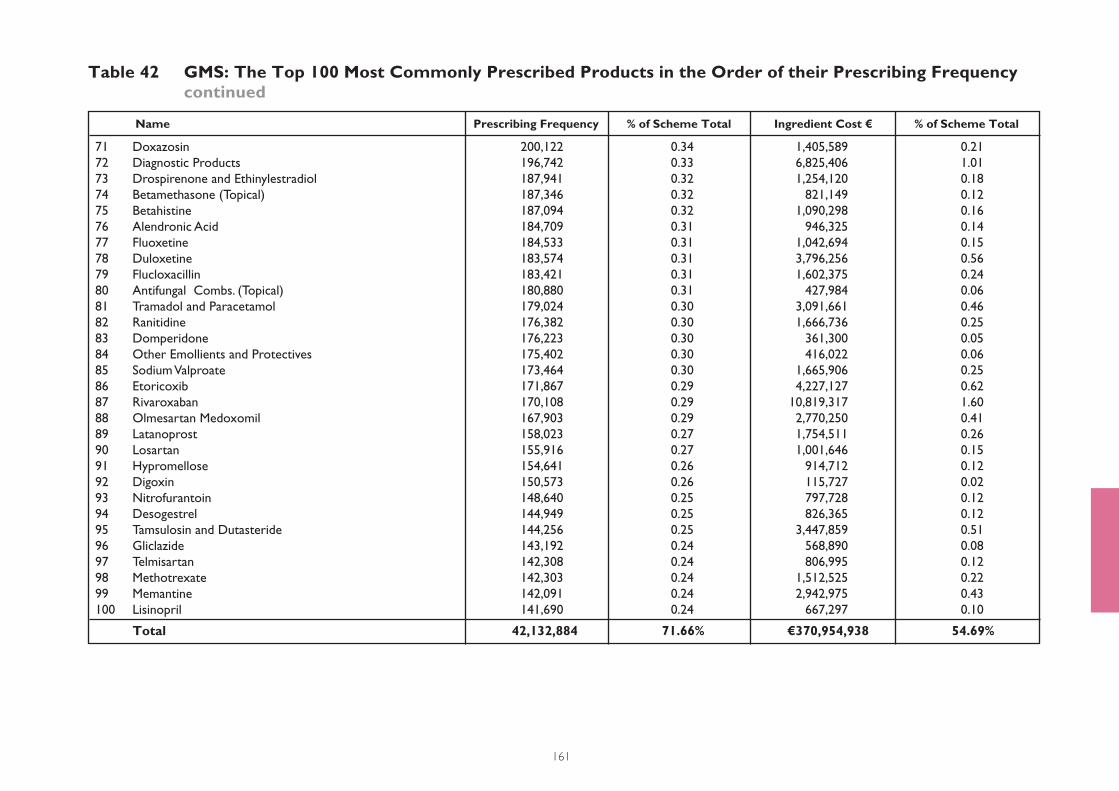
161
Table 42 GMS: The Top 100 Most Commonly Prescribed Products in the Order of their Prescribing Frequency continued
Name Prescribing Frequency % of Scheme Total Ingredient Cost € % of Scheme Total
71 Doxazosin 200,122 0.34 1,405,589 0.21
72 Diagnostic Products 196,742 0.33 6,825,406 1.01
73 Drospirenone and Ethinylestradiol 187,941 0.32 1,254,120 0.18
74 Betamethasone (Topical) 187,346 0.32 821,149 0.12
75 Betahistine 187,094 0.32 1,090,298 0.16
76 Alendronic Acid 184,709 0.31 946,325 0.14
77 Fluoxetine 184,533 0.31 1,042,694 0.15
78 Duloxetine 183,574 0.31 3,796,256 0.56
79 Flucloxacillin 183,421 0.31 1,602,375 0.24
80 Antifungal Combs. (Topical) 180,880 0.31 427,984 0.06
81 Tramadol and Paracetamol 179,024 0.30 3,091,661 0.46
82 Ranitidine 176,382 0.30 1,666,736 0.25
83 Domperidone 176,223 0.30 361,300 0.05
84 Other Emollients and Protectives 175,402 0.30 416,022 0.06
85 Sodium Valproate 173,464 0.30 1,665,906 0.25
86 Etoricoxib 171,867 0.29 4,227,127 0.62
87 Rivaroxaban 170,108 0.29 10,819,317 1.60
88 Olmesartan Medoxomil 167,903 0.29 2,770,250 0.41
89 Latanoprost 158,023 0.27 1,754,511 0.26
90 Losartan 155,916 0.27 1,001,646 0.15
91 Hypromellose 154,641 0.26 914,712 0.12
92 Digoxin 150,573 0.26 115,727 0.02
93 Nitrofurantoin 148,640 0.25 797,728 0.12
94 Desogestrel 144,949 0.25 826,365 0.12
95 Tamsulosin and Dutasteride 144,256 0.25 3,447,859 0.51
96 Gliclazide 143,192 0.24 568,890 0.08
97 Telmisartan 142,308 0.24 806,995 0.12
98 Methotrexate 142,303 0.24 1,512,525 0.22
99 Memantine 142,091 0.24 2,942,975 0.43
100 Lisinopril 141,690 0.24 667,297 0.10
Total 42,132,884 71.66% €370,954,938 54.69%
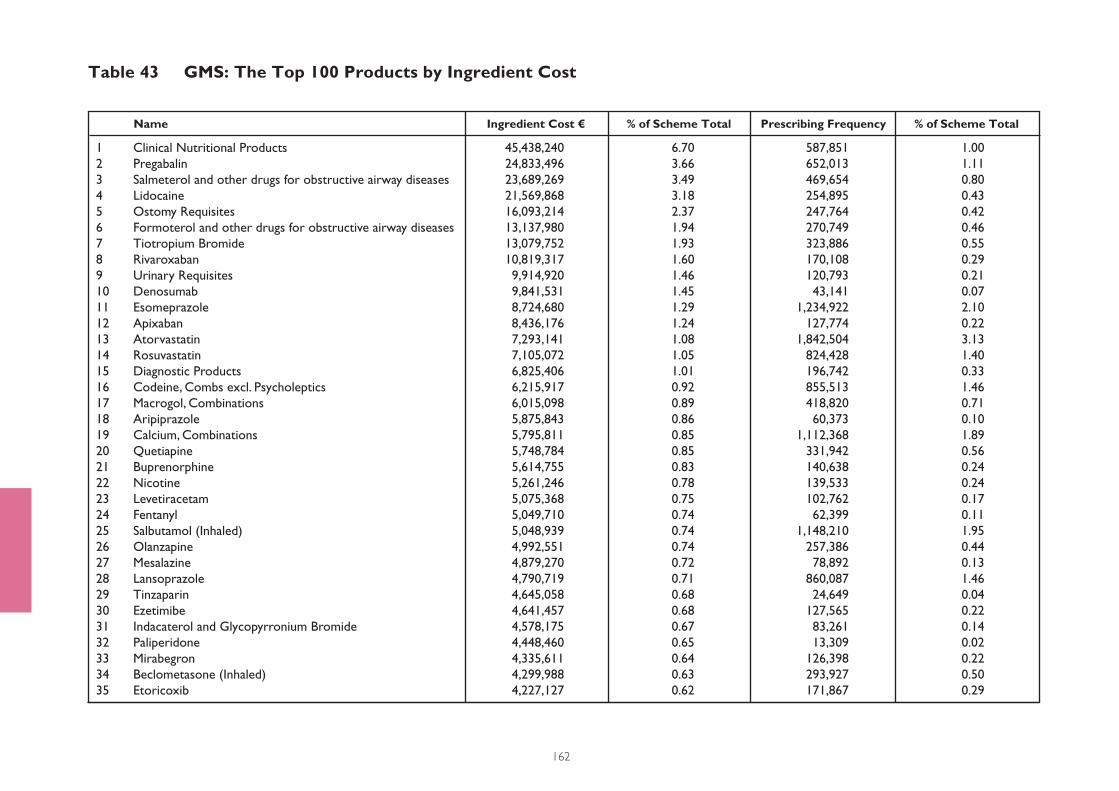
162
Table 43 GMS: The Top 100 Products by Ingredient Cost
Name Ingredient Cost € % of Scheme Total Prescribing Frequency % of Scheme Total
1 Clinical Nutritional Products 45,438,240 6.70 587,851 1.00
2 Pregabalin 24,833,496 3.66 652,013 1.11
3 Salmeterol and other drugs for obstructive airway diseases 23,689,269 3.49 469,654 0.80
4 Lidocaine 21,569,868 3.18 254,895 0.43
5 Ostomy Requisites 16,093,214 2.37 247,764 0.42
6 Formoterol and other drugs for obstructive airway diseases 13,137,980 1.94 270,749 0.46
7 Tiotropium Bromide 13,079,752 1.93 323,886 0.55
8 Rivaroxaban 10,819,317 1.60 170,108 0.29
9 Urinary Requisites 9,914,920 1.46 120,793 0.21
10 Denosumab 9,841,531 1.45 43,141 0.07
11 Esomeprazole 8,724,680 1.29 1,234,922 2.10
12 Apixaban 8,436,176 1.24 127,774 0.22
13 Atorvastatin 7,293,141 1.08 1,842,504 3.13
14 Rosuvastatin 7,105,072 1.05 824,428 1.40
15 Diagnostic Products 6,825,406 1.01 196,742 0.33
16 Codeine, Combs excl. Psycholeptics 6,215,917 0.92 855,513 1.46
17 Macrogol, Combinations 6,015,098 0.89 418,820 0.71
18 Aripiprazole 5,875,843 0.86 60,373 0.10
19 Calcium, Combinations 5,795,811 0.85 1,112,368 1.89
20 Quetiapine 5,748,784 0.85 331,942 0.56
21 Buprenorphine 5,614,755 0.83 140,638 0.24
22 Nicotine 5,261,246 0.78 139,533 0.24
23 Levetiracetam 5,075,368 0.75 102,762 0.17
24 Fentanyl 5,049,710 0.74 62,399 0.11
25 Salbutamol (Inhaled) 5,048,939 0.74 1,148,210 1.95
26 Olanzapine 4,992,551 0.74 257,386 0.44
27 Mesalazine 4,879,270 0.72 78,892 0.13
28 Lansoprazole 4,790,719 0.71 860,087 1.46
29 Tinzaparin 4,645,058 0.68 24,649 0.04
30 Ezetimibe 4,641,457 0.68 127,565 0.22
31 Indacaterol and Glycopyrronium Bromide 4,578,175 0.67 83,261 0.14
32 Paliperidone 4,448,460 0.65 13,309 0.02
33 Mirabegron 4,335,611 0.64 126,398 0.22
34 Beclometasone (Inhaled) 4,299,988 0.63 293,927 0.50
35 Etoricoxib 4,227,127 0.62 171,867 0.29
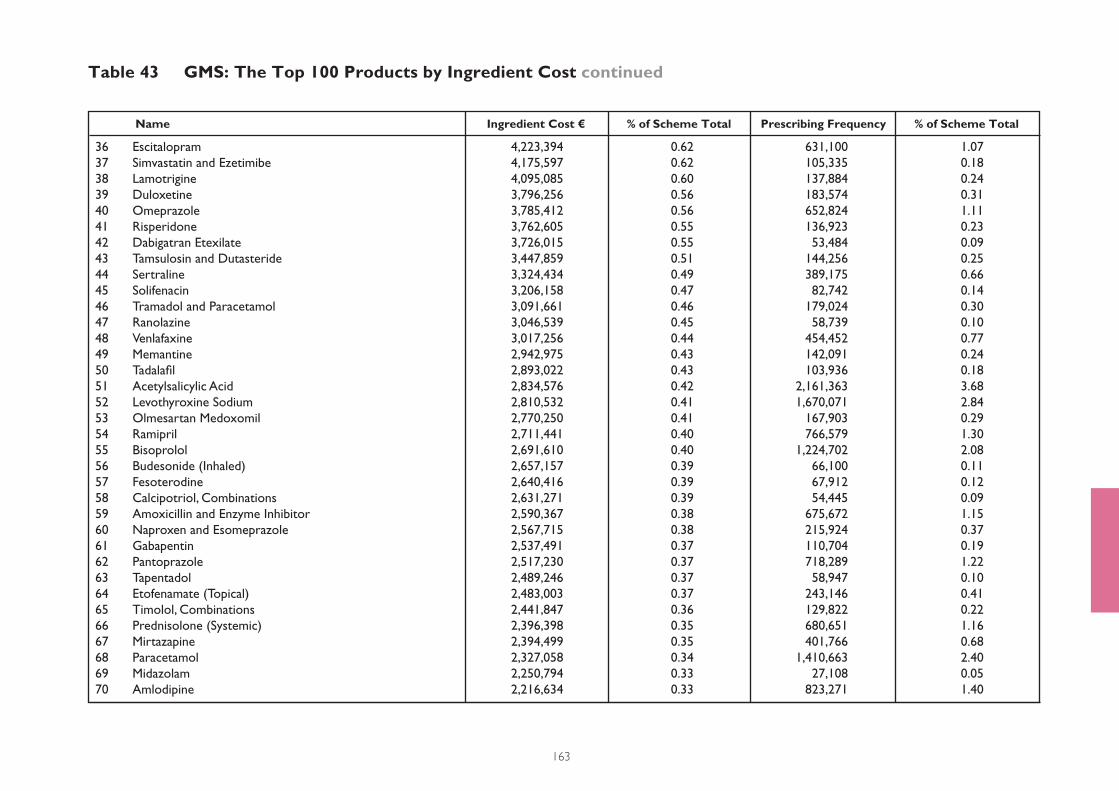
163
Table 43 GMS: The Top 100 Products by Ingredient Cost continued
Name Ingredient Cost € % of Scheme Total Prescribing Frequency % of Scheme Total
36 Escitalopram 4,223,394 0.62 631,100 1.07
37 Simvastatin and Ezetimibe 4,175,597 0.62 105,335 0.18
38 Lamotrigine 4,095,085 0.60 137,884 0.24
39 Duloxetine 3,796,256 0.56 183,574 0.31
40 Omeprazole 3,785,412 0.56 652,824 1.11
41 Risperidone 3,762,605 0.55 136,923 0.23
42 Dabigatran Etexilate 3,726,015 0.55 53,484 0.09
43 Tamsulosin and Dutasteride 3,447,859 0.51 144,256 0.25
44 Sertraline 3,324,434 0.49 389,175 0.66
45 Solifenacin 3,206,158 0.47 82,742 0.14
46 Tramadol and Paracetamol 3,091,661 0.46 179,024 0.30
47 Ranolazine 3,046,539 0.45 58,739 0.10
48 Venlafaxine 3,017,256 0.44 454,452 0.77
49 Memantine 2,942,975 0.43 142,091 0.24
50 Tadalafi l 2,893,022 0.43 103,936 0.18
51 Acetylsalicylic Acid 2,834,576 0.42 2,161,363 3.68
52 Levothyroxine Sodium 2,810,532 0.41 1,670,071 2.84
53 Olmesartan Medoxomil 2,770,250 0.41 167,903 0.29
54 Ramipril 2,711,441 0.40 766,579 1.30
55 Bisoprolol 2,691,610 0.40 1,224,702 2.08
56 Budesonide (Inhaled) 2,657,157 0.39 66,100 0.11
57 Fesoterodine 2,640,416 0.39 67,912 0.12
58 Calcipotriol, Combinations 2,631,271 0.39 54,445 0.09
59 Amoxicillin and Enzyme Inhibitor 2,590,367 0.38 675,672 1.15
60 Naproxen and Esomeprazole 2,567,715 0.38 215,924 0.37
61 Gabapentin 2,537,491 0.37 110,704 0.19
62 Pantoprazole 2,517,230 0.37 718,289 1.22
63 Tapentadol 2,489,246 0.37 58,947 0.10
64 Etofenamate (Topical) 2,483,003 0.37 243,146 0.41
65 Timolol, Combinations 2,441,847 0.36 129,822 0.22
66 Prednisolone (Systemic) 2,396,398 0.35 680,651 1.16
67 Mirtazapine 2,394,499 0.35 401,766 0.68
68 Paracetamol 2,327,058 0.34 1,410,663 2.40
69 Midazolam 2,250,794 0.33 27,108 0.05
70 Amlodipine 2,216,634 0.33 823,271 1.40
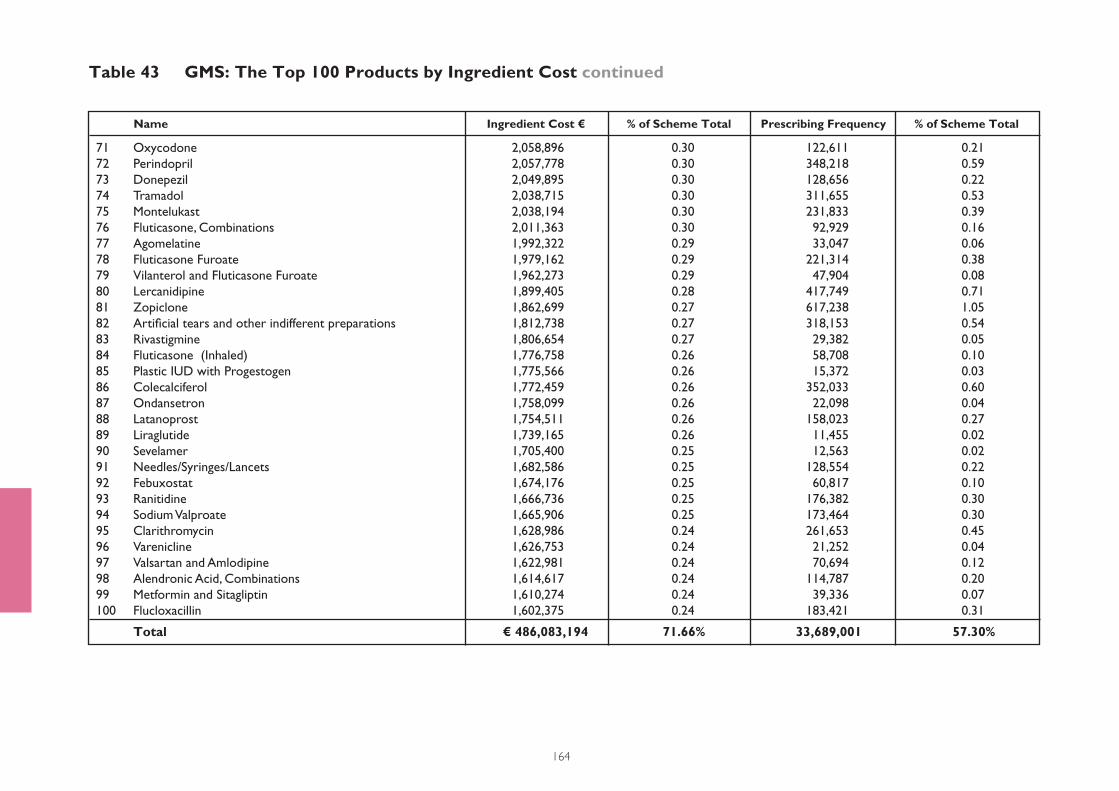
164
Table 43 GMS: The Top 100 Products by Ingredient Cost continued
Name Ingredient Cost € % of Scheme Total Prescribing Frequency % of Scheme Total
71 Oxycodone 2,058,896 0.30 122,611 0.21
72 Perindopril 2,057,778 0.30 348,218 0.59
73 Donepezil 2,049,895 0.30 128,656 0.22
74 Tramadol 2,038,715 0.30 311,655 0.53
75 Montelukast 2,038,194 0.30 231,833 0.39
76 Fluticasone, Combinations 2,011,363 0.30 92,929 0.16
77 Agomelatine 1,992,322 0.29 33,047 0.06
78 Fluticasone Furoate 1,979,162 0.29 221,314 0.38
79 Vilanterol and Fluticasone Furoate 1,962,273 0.29 47,904 0.08
80 Lercanidipine 1,899,405 0.28 417,749 0.71
81 Zopiclone 1,862,699 0.27 617,238 1.05
82 Artifi cial tears and other indifferent preparations 1,812,738 0.27 318,153 0.54
83 Rivastigmine 1,806,654 0.27 29,382 0.05
84 Fluticasone (Inhaled) 1,776,758 0.26 58,708 0.10
85 Plastic IUD with Progestogen 1,775,566 0.26 15,372 0.03
86 Colecalciferol 1,772,459 0.26 352,033 0.60
87 Ondansetron 1,758,099 0.26 22,098 0.04
88 Latanoprost 1,754,511 0.26 158,023 0.27
89 Liraglutide 1,739,165 0.26 11,455 0.02
90 Sevelamer 1,705,400 0.25 12,563 0.02
91 Needles/Syringes/Lancets 1,682,586 0.25 128,554 0.22
92 Febuxostat 1,674,176 0.25 60,817 0.10
93 Ranitidine 1,666,736 0.25 176,382 0.30
94 Sodium Valproate 1,665,906 0.25 173,464 0.30
95 Clarithromycin 1,628,986 0.24 261,653 0.45
96 Varenicline 1,626,753 0.24 21,252 0.04
97 Valsartan and Amlodipine 1,622,981 0.24 70,694 0.12
98 Alendronic Acid, Combinations 1,614,617 0.24 114,787 0.20
99 Metformin and Sitagliptin 1,610,274 0.24 39,336 0.07
100 Flucloxacillin 1,602,375 0.24 183,421 0.31
Total € 486,083,194 71.66% 33,689,001 57.30%
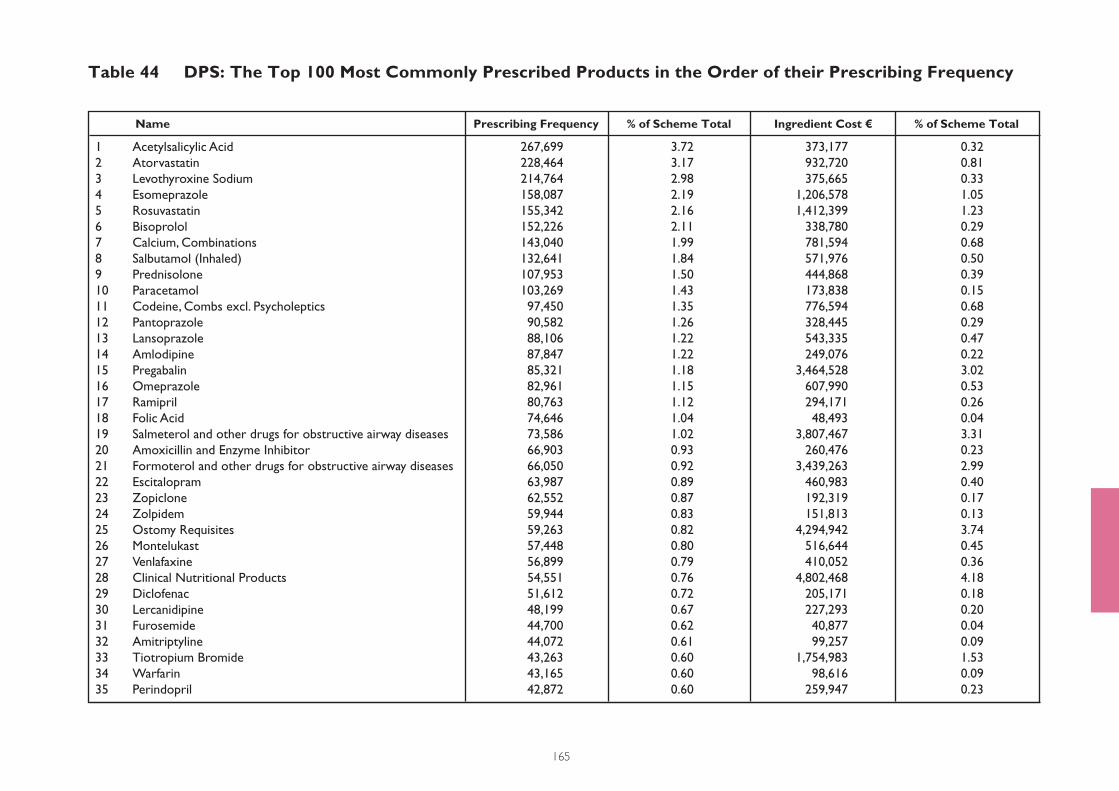
165
Table 44 DPS: The Top 100 Most Commonly Prescribed Products in the Order of their Prescribing Frequency
Name Prescribing Frequency % of Scheme Total Ingredient Cost € % of Scheme Total
1 Acetylsalicylic Acid 267,699 3.72 373,177 0.32
2 Atorvastatin 228,464 3.17 932,720 0.81
3 Levothyroxine Sodium 214,764 2.98 375,665 0.33
4 Esomeprazole 158,087 2.19 1,206,578 1.05
5 Rosuvastatin 155,342 2.16 1,412,399 1.23
6 Bisoprolol 152,226 2.11 338,780 0.29
7 Calcium, Combinations 143,040 1.99 781,594 0.68
8 Salbutamol (Inhaled) 132,641 1.84 571,976 0.50
9 Prednisolone 107,953 1.50 444,868 0.39
10 Paracetamol 103,269 1.43 173,838 0.15
11 Codeine, Combs excl. Psycholeptics 97,450 1.35 776,594 0.68
12 Pantoprazole 90,582 1.26 328,445 0.29
13 Lansoprazole 88,106 1.22 543,335 0.47
14 Amlodipine 87,847 1.22 249,076 0.22
15 Pregabalin 85,321 1.18 3,464,528 3.02
16 Omeprazole 82,961 1.15 607,990 0.53
17 Ramipril 80,763 1.12 294,171 0.26
18 Folic Acid 74,646 1.04 48,493 0.04
19 Salmeterol and other drugs for obstructive airway diseases 73,586 1.02 3,807,467 3.31
20 Amoxicillin and Enzyme Inhibitor 66,903 0.93 260,476 0.23
21 Formoterol and other drugs for obstructive airway diseases 66,050 0.92 3,439,263 2.99
22 Escitalopram 63,987 0.89 460,983 0.40
23 Zopiclone 62,552 0.87 192,319 0.17
24 Zolpidem 59,944 0.83 151,813 0.13
25 Ostomy Requisites 59,263 0.82 4,294,942 3.74
26 Montelukast 57,448 0.80 516,644 0.45
27 Venlafaxine 56,899 0.79 410,052 0.36
28 Clinical Nutritional Products 54,551 0.76 4,802,468 4.18
29 Diclofenac 51,612 0.72 205,171 0.18
30 Lercanidipine 48,199 0.67 227,293 0.20
31 Furosemide 44,700 0.62 40,877 0.04
32 Amitriptyline 44,072 0.61 99,257 0.09
33 Tiotropium Bromide 43,263 0.60 1,754,983 1.53
34 Warfarin 43,165 0.60 98,616 0.09
35 Perindopril 42,872 0.60 259,947 0.23
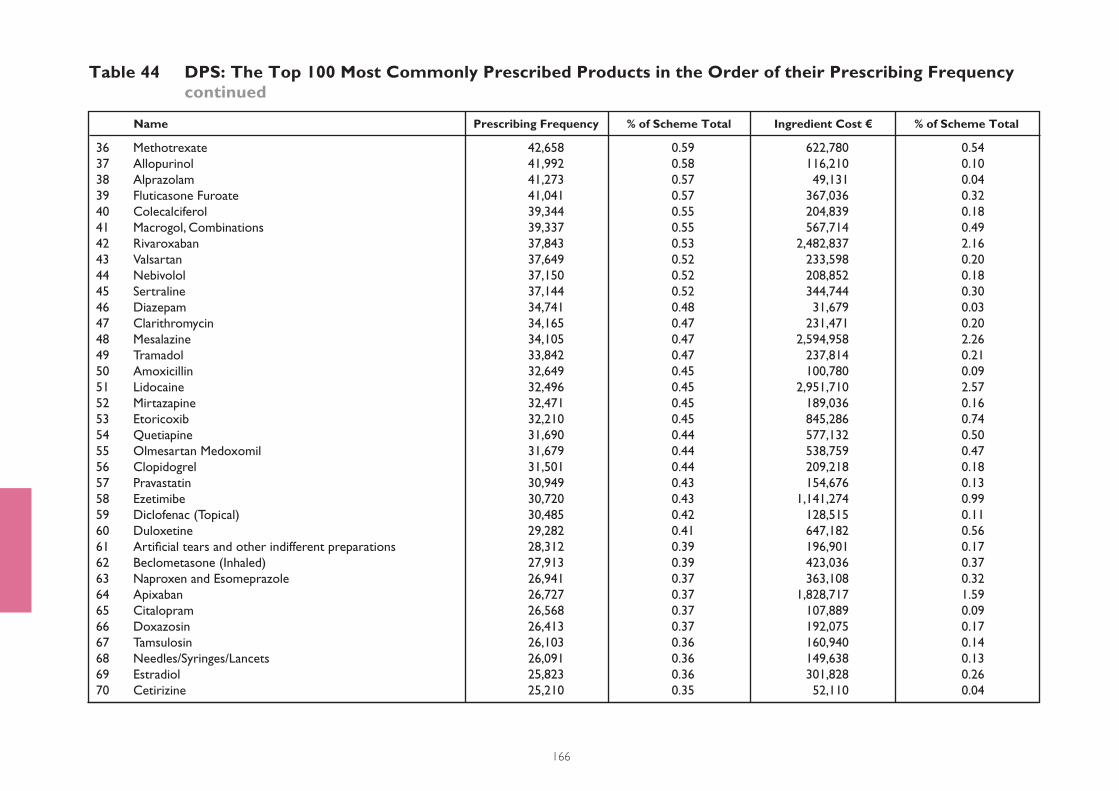
166
Table 44 DPS: The Top 100 Most Commonly Prescribed Products in the Order of their Prescribing Frequency continued
Name Prescribing Frequency % of Scheme Total Ingredient Cost € % of Scheme Total
36 Methotrexate 42,658 0.59 622,780 0.54
37 Allopurinol 41,992 0.58 116,210 0.10
38 Alprazolam 41,273 0.57 49,131 0.04
39 Fluticasone Furoate 41,041 0.57 367,036 0.32
40 Colecalciferol 39,344 0.55 204,839 0.18
41 Macrogol, Combinations 39,337 0.55 567,714 0.49
42 Rivaroxaban 37,843 0.53 2,482,837 2.16
43 Valsartan 37,649 0.52 233,598 0.20
44 Nebivolol 37,150 0.52 208,852 0.18
45 Sertraline 37,144 0.52 344,744 0.30
46 Diazepam 34,741 0.48 31,679 0.03
47 Clarithromycin 34,165 0.47 231,471 0.20
48 Mesalazine 34,105 0.47 2,594,958 2.26
49 Tramadol 33,842 0.47 237,814 0.21
50 Amoxicillin 32,649 0.45 100,780 0.09
51 Lidocaine 32,496 0.45 2,951,710 2.57
52 Mirtazapine 32,471 0.45 189,036 0.16
53 Etoricoxib 32,210 0.45 845,286 0.74
54 Quetiapine 31,690 0.44 577,132 0.50
55 Olmesartan Medoxomil 31,679 0.44 538,759 0.47
56 Clopidogrel 31,501 0.44 209,218 0.18
57 Pravastatin 30,949 0.43 154,676 0.13
58 Ezetimibe 30,720 0.43 1,141,274 0.99
59 Diclofenac (Topical) 30,485 0.42 128,515 0.11
60 Duloxetine 29,282 0.41 647,182 0.56
61 Artifi cial tears and other indifferent preparations 28,312 0.39 196,901 0.17
62 Beclometasone (Inhaled) 27,913 0.39 423,036 0.37
63 Naproxen and Esomeprazole 26,941 0.37 363,108 0.32
64 Apixaban 26,727 0.37 1,828,717 1.59
65 Citalopram 26,568 0.37 107,889 0.09
66 Doxazosin 26,413 0.37 192,075 0.17
67 Tamsulosin 26,103 0.36 160,940 0.14
68 Needles/Syringes/Lancets 26,091 0.36 149,638 0.13
69 Estradiol 25,823 0.36 301,828 0.26
70 Cetirizine 25,210 0.35 52,110 0.04
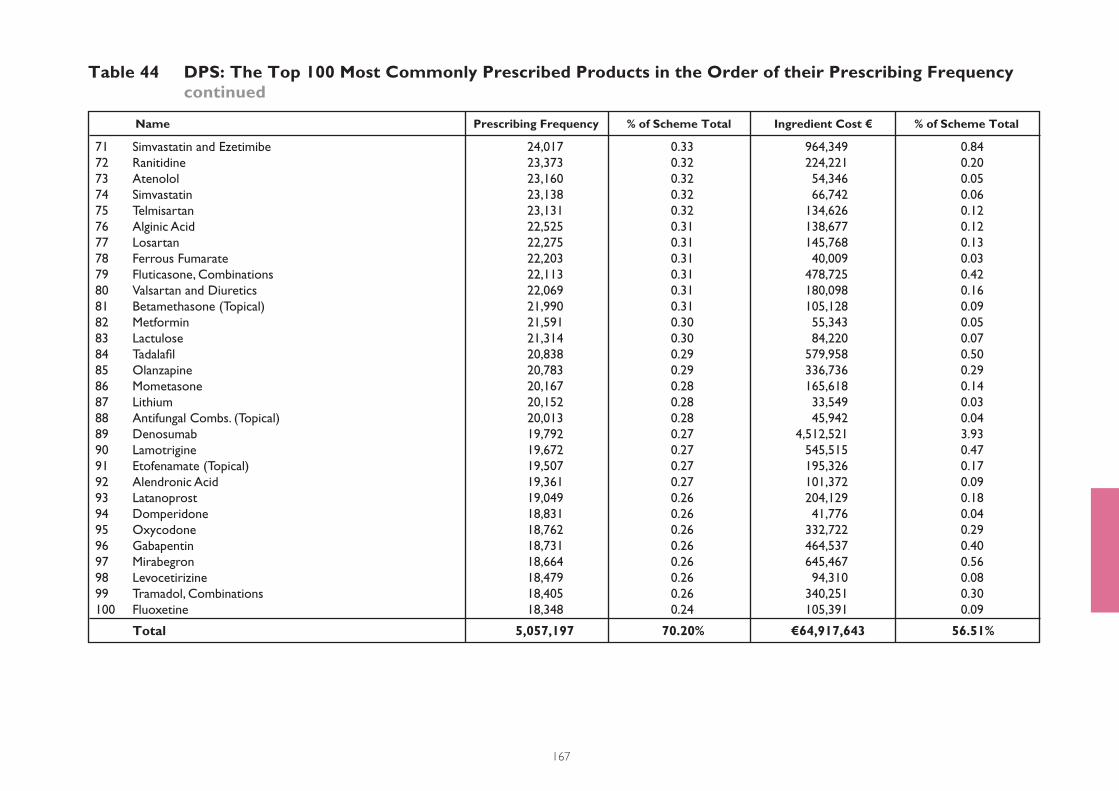
167
Table 44 DPS: The Top 100 Most Commonly Prescribed Products in the Order of their Prescribing Frequency continued
Name Prescribing Frequency % of Scheme Total Ingredient Cost € % of Scheme Total
71 Simvastatin and Ezetimibe 24,017 0.33 964,349 0.84
72 Ranitidine 23,373 0.32 224,221 0.20
73 Atenolol 23,160 0.32 54,346 0.05
74 Simvastatin 23,138 0.32 66,742 0.06
75 Telmisartan 23,131 0.32 134,626 0.12
76 Alginic Acid 22,525 0.31 138,677 0.12
77 Losartan 22,275 0.31 145,768 0.13
78 Ferrous Fumarate 22,203 0.31 40,009 0.03
79 Fluticasone, Combinations 22,113 0.31 478,725 0.42
80 Valsartan and Diuretics 22,069 0.31 180,098 0.16
81 Betamethasone (Topical) 21,990 0.31 105,128 0.09
82 Metformin 21,591 0.30 55,343 0.05
83 Lactulose 21,314 0.30 84,220 0.07
84 Tadalafi l 20,838 0.29 579,958 0.50
85 Olanzapine 20,783 0.29 336,736 0.29
86 Mometasone 20,167 0.28 165,618 0.14
87 Lithium 20,152 0.28 33,549 0.03
88 Antifungal Combs. (Topical) 20,013 0.28 45,942 0.04
89 Denosumab 19,792 0.27 4,512,521 3.93
90 Lamotrigine 19,672 0.27 545,515 0.47
91 Etofenamate (Topical) 19,507 0.27 195,326 0.17
92 Alendronic Acid 19,361 0.27 101,372 0.09
93 Latanoprost 19,049 0.26 204,129 0.18
94 Domperidone 18,831 0.26 41,776 0.04
95 Oxycodone 18,762 0.26 332,722 0.29
96 Gabapentin 18,731 0.26 464,537 0.40
97 Mirabegron 18,664 0.26 645,467 0.56
98 Levocetirizine 18,479 0.26 94,310 0.08
99 Tramadol, Combinations 18,405 0.26 340,251 0.30
100 Fluoxetine 18,348 0.24 105,391 0.09
Total 5,057,197 70.20% €64,917,643 56.51%
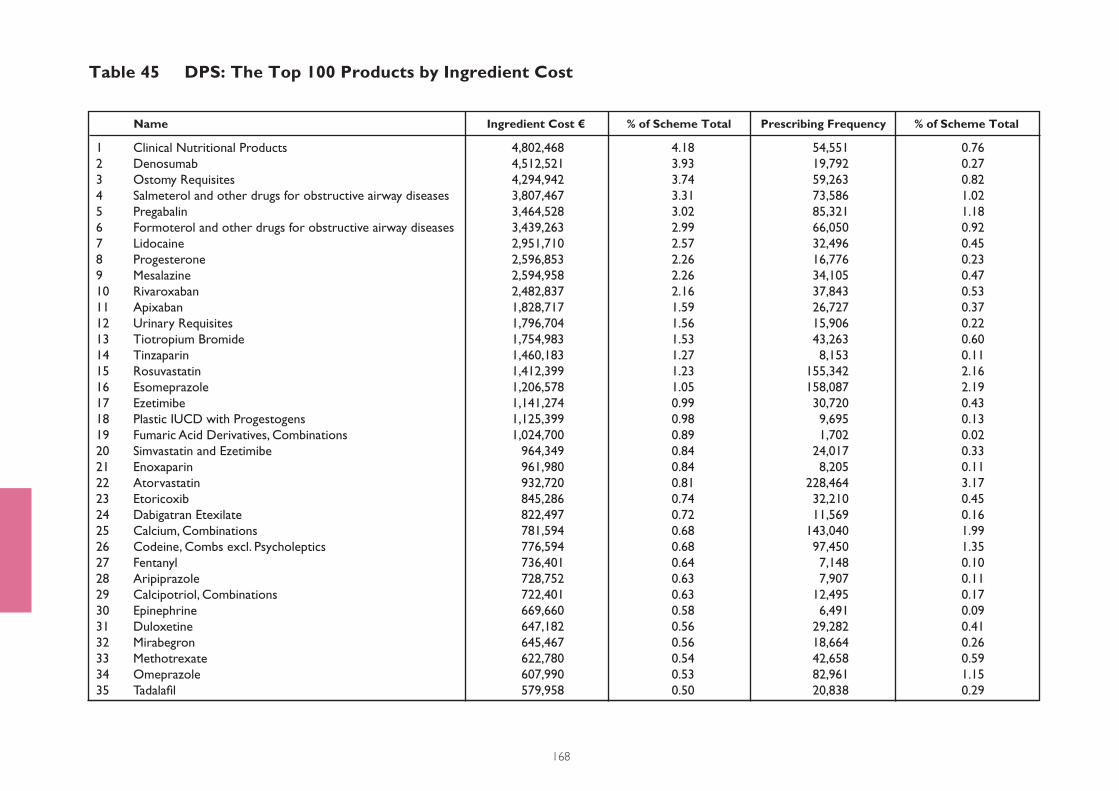
168
Table 45 DPS: The Top 100 Products by Ingredient Cost
Name Ingredient Cost € % of Scheme Total Prescribing Frequency % of Scheme Total
1 Clinical Nutritional Products 4,802,468 4.18 54,551 0.76
2 Denosumab 4,512,521 3.93 19,792 0.27
3 Ostomy Requisites 4,294,942 3.74 59,263 0.82
4 Salmeterol and other drugs for obstructive airway diseases 3,807,467 3.31 73,586 1.02
5 Pregabalin 3,464,528 3.02 85,321 1.18
6 Formoterol and other drugs for obstructive airway diseases 3,439,263 2.99 66,050 0.92
7 Lidocaine 2,951,710 2.57 32,496 0.45
8 Progesterone 2,596,853 2.26 16,776 0.23
9 Mesalazine 2,594,958 2.26 34,105 0.47
10 Rivaroxaban 2,482,837 2.16 37,843 0.53
11 Apixaban 1,828,717 1.59 26,727 0.37
12 Urinary Requisites 1,796,704 1.56 15,906 0.22
13 Tiotropium Bromide 1,754,983 1.53 43,263 0.60
14 Tinzaparin 1,460,183 1.27 8,153 0.11
15 Rosuvastatin 1,412,399 1.23 155,342 2.16
16 Esomeprazole 1,206,578 1.05 158,087 2.19
17 Ezetimibe 1,141,274 0.99 30,720 0.43
18 Plastic IUCD with Progestogens 1,125,399 0.98 9,695 0.13
19 Fumaric Acid Derivatives, Combinations 1,024,700 0.89 1,702 0.02
20 Simvastatin and Ezetimibe 964,349 0.84 24,017 0.33
21 Enoxaparin 961,980 0.84 8,205 0.11
22 Atorvastatin 932,720 0.81 228,464 3.17
23 Etoricoxib 845,286 0.74 32,210 0.45
24 Dabigatran Etexilate 822,497 0.72 11,569 0.16
25 Calcium, Combinations 781,594 0.68 143,040 1.99
26 Codeine, Combs excl. Psycholeptics 776,594 0.68 97,450 1.35
27 Fentanyl 736,401 0.64 7,148 0.10
28 Aripiprazole 728,752 0.63 7,907 0.11
29 Calcipotriol, Combinations 722,401 0.63 12,495 0.17
30 Epinephrine 669,660 0.58 6,491 0.09
31 Duloxetine 647,182 0.56 29,282 0.41
32 Mirabegron 645,467 0.56 18,664 0.26
33 Methotrexate 622,780 0.54 42,658 0.59
34 Omeprazole 607,990 0.53 82,961 1.15
35 Tadalafi l 579,958 0.50 20,838 0.29

169
Table 45 DPS: The Top 100 Products by Ingredient Cost continued
Name Ingredient Cost € % of Scheme Total Prescribing Frequency % of Scheme Total
36 Quetiapine 577,132 0.50 31,690 0.44
37 Salbutamol (Inhaled) 571,976 0.50 132,641 1.84
38 Macrogol, Combinations 567,714 0.49 39,337 0.55
39 Lamotrigine 545,515 0.47 19,672 0.27
40 Lansoprazole 543,335 0.47 88,106 1.22
41 Olmesartan Medoxomil 538,759 0.47 31,679 0.44
42 Montelukast 516,644 0.45 57,448 0.80
43 Buprenorphine 514,772 0.45 12,062 0.17
44 Dronedarone 513,110 0.45 6,876 0.10
45 Diagnostic Products 510,713 0.45 12,691 0.18
46 Fluticasone, Combinations 478,725 0.42 22,113 0.31
47 Ondansetron 476,086 0.41 5,591 0.08
48 Etonogestrel 474,698 0.41 3,817 0.05
49 Tapentadol 467,925 0.41 9,584 0.13
50 Indacaterol and Glycopyrronium Bromide 464,730 0.41 8,487 0.12
51 Gabapentin 464,537 0.40 18,731 0.26
52 Escitalopram 460,983 0.40 63,987 0.89
53 Vilanterol and Fluticasone Furoate 456,936 0.40 10,688 0.15
54 Solifenacin 453,518 0.39 11,365 0.16
55 Prednisolone 444,868 0.39 107,953 1.50
56 Tamsulosin and Dutasteride 437,565 0.38 18,142 0.25
57 Ticagrelor 431,919 0.38 6,667 0.09
58 Beclometasone (Inhaled) 423,036 0.37 27,913 0.39
59 Sumatriptan 418,048 0.36 7,690 0.11
60 Venlafaxine 410,052 0.36 56,899 0.79
61 Ranolazine 405,814 0.35 7,520 0.10
62 Mercaptopurine 403,671 0.35 3,468 0.05
63 Follitropin alfa 384,910 0.34 250 0.00
64 Levothyroxine Sodium 375,665 0.33 214,764 2.98
65 Acetylsalicylic Acid 373,177 0.32 267,699 3.72
66 Fluticasone Furoate 367,036 0.32 41,041 0.57
67 Levetiracetam 364,034 0.32 7,737 0.11
68 Naproxen and Esomeprazole 363,108 0.32 26,941 0.37
69 Agomelatine 360,680 0.31 5,777 0.08
70 Fesoterodine 355,747 0.31 8,867 0.12

170
Table 45 DPS: The Top 100 Products by Ingredient Cost continued
Name Ingredient Cost € % of Scheme Total Prescribing Frequency % of Scheme Total
71 Fluticasone (Inhaled) 355,744 0.31 11,307 0.16
72 Rifaximin 352,442 0.31 1,703 0.02
73 Sertraline 344,744 0.30 37,144 0.52
74 Hyaluronic Acid 342,231 0.30 12,883 0.18
75 Tramadol, Combinations 340,251 0.30 18,405 0.26
76 Testosterone 339,103 0.30 5,467 0.08
77 Bisoprolol 338,780 0.29 152,226 2.11
78 Olanzapine 336,736 0.29 20,783 0.29
79 Oxycodone 332,722 0.29 18,762 0.26
80 Budesonide 330,027 0.29 4,123 0.06
81 Famciclovir 329,264 0.29 3,080 0.04
82 Pantoprazole 328,445 0.29 90,582 1.26
83 Modafi nil 327,219 0.29 2,273 0.03
84 Azithromycin 325,812 0.28 17,527 0.24
85 Febuxostat 321,242 0.28 11,515 0.16
86 Ivabradine 308,741 0.27 6,373 0.09
87 Liraglutide 306,833 0.27 1,871 0.03
88 Estradiol 301,828 0.26 25,823 0.36
89 Eplerenone 301,718 0.26 9,247 0.13
90 Timolol, Combinations 298,303 0.26 16,536 0.23
91 Ramipril 294,171 0.26 80,763 1.12
92 Valsartan and Amlodipine 290,054 0.25 12,377 0.17
93 Budesonide (Inhaled) 285,645 0.25 9,172 0.13
94 Hydrocortisone 280,187 0.24 5,992 0.08
95 Prednisolone (Rectal) 277,946 0.24 1,963 0.03
96 Memantine 272,661 0.24 13,036 0.18
97 Olmesartan Medoxomil and Amlodipine 268,636 0.23 11,616 0.16
98 Azathioprine 267,189 0.23 15,962 0.22
99 Rivastigmine 266,070 0.23 4,054 0.06
100 Oxycodone, Combinations 265,820 0.23 6,405 0.09
Total € 84,991,797 73.98% 3,727,640 51.75%
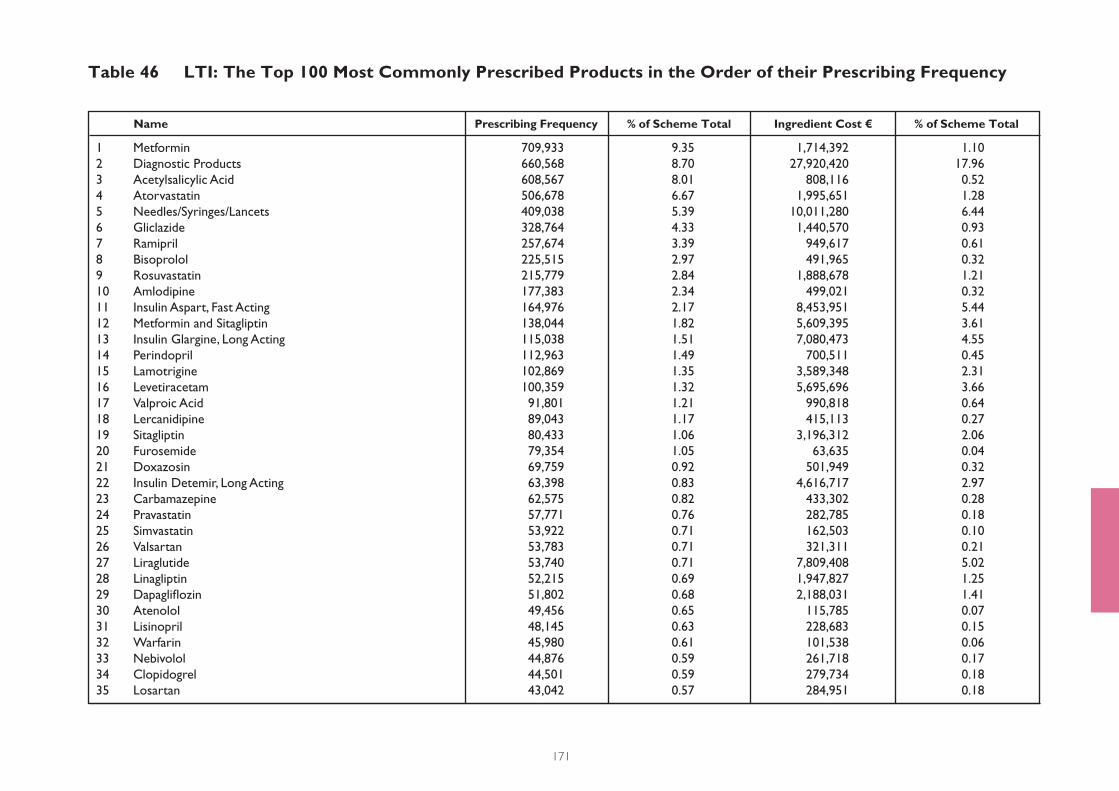
171
Table 46 LTI: The Top 100 Most Commonly Prescribed Products in the Order of their Prescribing Frequency
Name Prescribing Frequency % of Scheme Total Ingredient Cost € % of Scheme Total
1 Metformin 709,933 9.35 1,714,392 1.10
2 Diagnostic Products 660,568 8.70 27,920,420 17.96
3 Acetylsalicylic Acid 608,567 8.01 808,116 0.52
4 Atorvastatin 506,678 6.67 1,995,651 1.28
5 Needles/Syringes/Lancets 409,038 5.39 10,011,280 6.44
6 Gliclazide 328,764 4.33 1,440,570 0.93
7 Ramipril 257,674 3.39 949,617 0.61
8 Bisoprolol 225,515 2.97 491,965 0.32
9 Rosuvastatin 215,779 2.84 1,888,678 1.21
10 Amlodipine 177,383 2.34 499,021 0.32
11 Insulin Aspart, Fast Acting 164,976 2.17 8,453,951 5.44
12 Metformin and Sitagliptin 138,044 1.82 5,609,395 3.61
13 Insulin Glargine, Long Acting 115,038 1.51 7,080,473 4.55
14 Perindopril 112,963 1.49 700,511 0.45
15 Lamotrigine 102,869 1.35 3,589,348 2.31
16 Levetiracetam 100,359 1.32 5,695,696 3.66
17 Valproic Acid 91,801 1.21 990,818 0.64
18 Lercanidipine 89,043 1.17 415,113 0.27
19 Sitagliptin 80,433 1.06 3,196,312 2.06
20 Furosemide 79,354 1.05 63,635 0.04
21 Doxazosin 69,759 0.92 501,949 0.32
22 Insulin Detemir, Long Acting 63,398 0.83 4,616,717 2.97
23 Carbamazepine 62,575 0.82 433,302 0.28
24 Pravastatin 57,771 0.76 282,785 0.18
25 Simvastatin 53,922 0.71 162,503 0.10
26 Valsartan 53,783 0.71 321,311 0.21
27 Liraglutide 53,740 0.71 7,809,408 5.02
28 Linagliptin 52,215 0.69 1,947,827 1.25
29 Dapaglifl ozin 51,802 0.68 2,188,031 1.41
30 Atenolol 49,456 0.65 115,785 0.07
31 Lisinopril 48,145 0.63 228,683 0.15
32 Warfarin 45,980 0.61 101,538 0.06
33 Nebivolol 44,876 0.59 261,718 0.17
34 Clopidogrel 44,501 0.59 279,734 0.18
35 Losartan 43,042 0.57 284,951 0.18
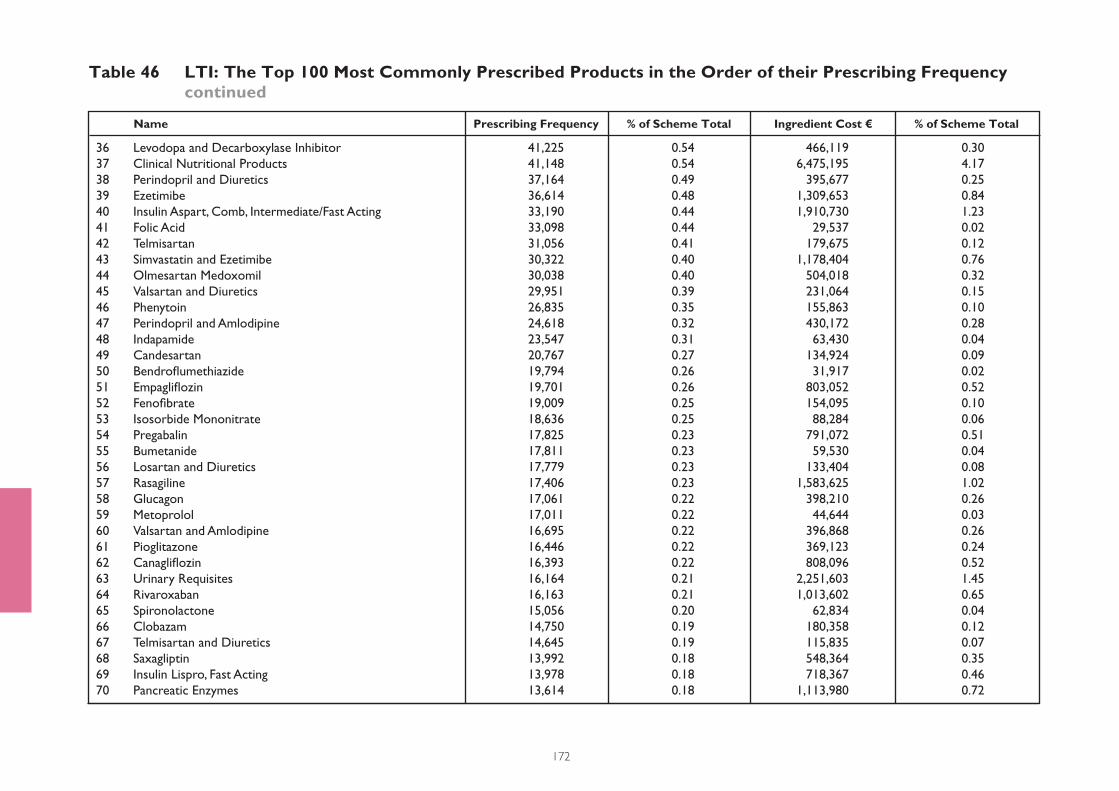
172
Table 46 LTI: The Top 100 Most Commonly Prescribed Products in the Order of their Prescribing Frequency continued
Name Prescribing Frequency % of Scheme Total Ingredient Cost € % of Scheme Total
36 Levodopa and Decarboxylase Inhibitor 41,225 0.54 466,119 0.30
37 Clinical Nutritional Products 41,148 0.54 6,475,195 4.17
38 Perindopril and Diuretics 37,164 0.49 395,677 0.25
39 Ezetimibe 36,614 0.48 1,309,653 0.84
40 Insulin Aspart, Comb, Intermediate/Fast Acting 33,190 0.44 1,910,730 1.23
41 Folic Acid 33,098 0.44 29,537 0.02
42 Telmisartan 31,056 0.41 179,675 0.12
43 Simvastatin and Ezetimibe 30,322 0.40 1,178,404 0.76
44 Olmesartan Medoxomil 30,038 0.40 504,018 0.32
45 Valsartan and Diuretics 29,951 0.39 231,064 0.15
46 Phenytoin 26,835 0.35 155,863 0.10
47 Perindopril and Amlodipine 24,618 0.32 430,172 0.28
48 Indapamide 23,547 0.31 63,430 0.04
49 Candesartan 20,767 0.27 134,924 0.09
50 Bendrofl umethiazide 19,794 0.26 31,917 0.02
51 Empaglifl ozin 19,701 0.26 803,052 0.52
52 Fenofi brate 19,009 0.25 154,095 0.10
53 Isosorbide Mononitrate 18,636 0.25 88,284 0.06
54 Pregabalin 17,825 0.23 791,072 0.51
55 Bumetanide 17,811 0.23 59,530 0.04
56 Losartan and Diuretics 17,779 0.23 133,404 0.08
57 Rasagiline 17,406 0.23 1,583,625 1.02
58 Glucagon 17,061 0.22 398,210 0.26
59 Metoprolol 17,011 0.22 44,644 0.03
60 Valsartan and Amlodipine 16,695 0.22 396,868 0.26
61 Pioglitazone 16,446 0.22 369,123 0.24
62 Canaglifl ozin 16,393 0.22 808,096 0.52
63 Urinary Requisites 16,164 0.21 2,251,603 1.45
64 Rivaroxaban 16,163 0.21 1,013,602 0.65
65 Spironolactone 15,056 0.20 62,834 0.04
66 Clobazam 14,750 0.19 180,358 0.12
67 Telmisartan and Diuretics 14,645 0.19 115,835 0.07
68 Saxagliptin 13,992 0.18 548,364 0.35
69 Insulin Lispro, Fast Acting 13,978 0.18 718,367 0.46
70 Pancreatic Enzymes 13,614 0.18 1,113,980 0.72
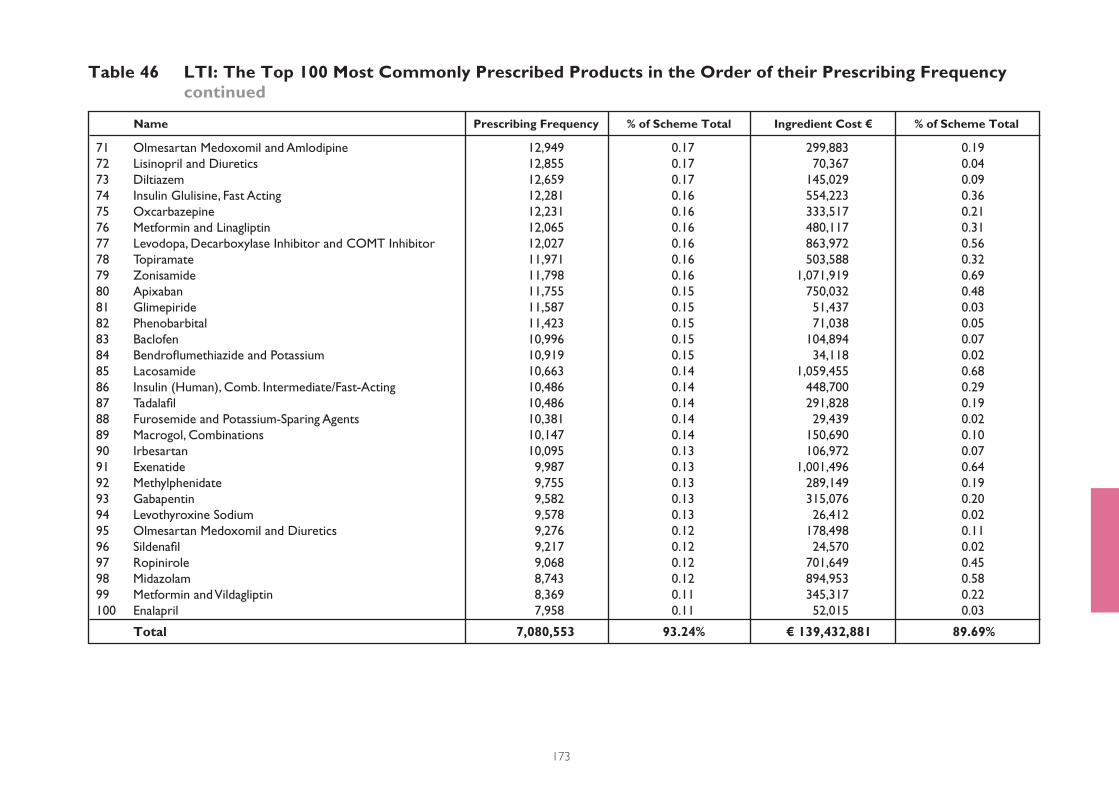
173
Table 46 LTI: The Top 100 Most Commonly Prescribed Products in the Order of their Prescribing Frequency continued
Name Prescribing Frequency % of Scheme Total Ingredient Cost € % of Scheme Total
71 Olmesartan Medoxomil and Amlodipine 12,949 0.17 299,883 0.19
72 Lisinopril and Diuretics 12,855 0.17 70,367 0.04
73 Diltiazem 12,659 0.17 145,029 0.09
74 Insulin Glulisine, Fast Acting 12,281 0.16 554,223 0.36
75 Oxcarbazepine 12,231 0.16 333,517 0.21
76 Metformin and Linagliptin 12,065 0.16 480,117 0.31
77 Levodopa, Decarboxylase Inhibitor and COMT Inhibitor 12,027 0.16 863,972 0.56
78 Topiramate 11,971 0.16 503,588 0.32
79 Zonisamide 11,798 0.16 1,071,919 0.69
80 Apixaban 11,755 0.15 750,032 0.48
81 Glimepiride 11,587 0.15 51,437 0.03
82 Phenobarbital 11,423 0.15 71,038 0.05
83 Baclofen 10,996 0.15 104,894 0.07
84 Bendrofl umethiazide and Potassium 10,919 0.15 34,118 0.02
85 Lacosamide 10,663 0.14 1,059,455 0.68
86 Insulin (Human), Comb. Intermediate/Fast-Acting 10,486 0.14 448,700 0.29
87 Tadalafi l 10,486 0.14 291,828 0.19
88 Furosemide and Potassium-Sparing Agents 10,381 0.14 29,439 0.02
89 Macrogol, Combinations 10,147 0.14 150,690 0.10
90 Irbesartan 10,095 0.13 106,972 0.07
91 Exenatide 9,987 0.13 1,001,496 0.64
92 Methylphenidate 9,755 0.13 289,149 0.19
93 Gabapentin 9,582 0.13 315,076 0.20
94 Levothyroxine Sodium 9,578 0.13 26,412 0.02
95 Olmesartan Medoxomil and Diuretics 9,276 0.12 178,498 0.11
96 Sildenafi l 9,217 0.12 24,570 0.02
97 Ropinirole 9,068 0.12 701,649 0.45
98 Midazolam 8,743 0.12 894,953 0.58
99 Metformin and Vildagliptin 8,369 0.11 345,317 0.22
100 Enalapril 7,958 0.11 52,015 0.03
Total 7,080,553 93.24% € 139,432,881 89.69%
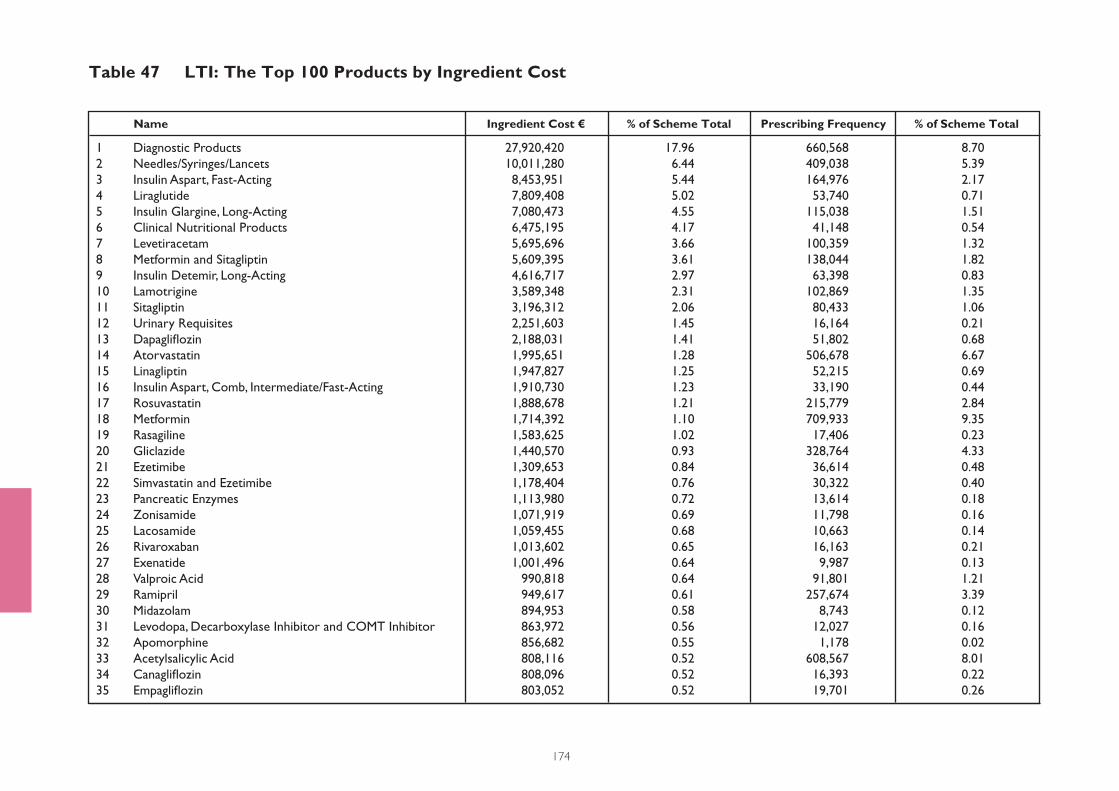
174
Table 47 LTI: The Top 100 Products by Ingredient Cost
Name Ingredient Cost € % of Scheme Total Prescribing Frequency % of Scheme Total
1 Diagnostic Products 27,920,420 17.96 660,568 8.70
2 Needles/Syringes/Lancets 10,011,280 6.44 409,038 5.39
3 Insulin Aspart, Fast-Acting 8,453,951 5.44 164,976 2.17
4 Liraglutide 7,809,408 5.02 53,740 0.71
5 Insulin Glargine, Long-Acting 7,080,473 4.55 115,038 1.51
6 Clinical Nutritional Products 6,475,195 4.17 41,148 0.54
7 Levetiracetam 5,695,696 3.66 100,359 1.32
8 Metformin and Sitagliptin 5,609,395 3.61 138,044 1.82
9 Insulin Detemir, Long-Acting 4,616,717 2.97 63,398 0.83
10 Lamotrigine 3,589,348 2.31 102,869 1.35
11 Sitagliptin 3,196,312 2.06 80,433 1.06
12 Urinary Requisites 2,251,603 1.45 16,164 0.21
13 Dapaglifl ozin 2,188,031 1.41 51,802 0.68
14 Atorvastatin 1,995,651 1.28 506,678 6.67
15 Linagliptin 1,947,827 1.25 52,215 0.69
16 Insulin Aspart, Comb, Intermediate/Fast-Acting 1,910,730 1.23 33,190 0.44
17 Rosuvastatin 1,888,678 1.21 215,779 2.84
18 Metformin 1,714,392 1.10 709,933 9.35
19 Rasagiline 1,583,625 1.02 17,406 0.23
20 Gliclazide 1,440,570 0.93 328,764 4.33
21 Ezetimibe 1,309,653 0.84 36,614 0.48
22 Simvastatin and Ezetimibe 1,178,404 0.76 30,322 0.40
23 Pancreatic Enzymes 1,113,980 0.72 13,614 0.18
24 Zonisamide 1,071,919 0.69 11,798 0.16
25 Lacosamide 1,059,455 0.68 10,663 0.14
26 Rivaroxaban 1,013,602 0.65 16,163 0.21
27 Exenatide 1,001,496 0.64 9,987 0.13
28 Valproic Acid 990,818 0.64 91,801 1.21
29 Ramipril 949,617 0.61 257,674 3.39
30 Midazolam 894,953 0.58 8,743 0.12
31 Levodopa, Decarboxylase Inhibitor and COMT Inhibitor 863,972 0.56 12,027 0.16
32 Apomorphine 856,682 0.55 1,178 0.02
33 Acetylsalicylic Acid 808,116 0.52 608,567 8.01
34 Canaglifl ozin 808,096 0.52 16,393 0.22
35 Empaglifl ozin 803,052 0.52 19,701 0.26

175
Table 47 LTI: The Top 100 Products by Ingredient Cost continued
Name Ingredient Cost € % of Scheme Total Prescribing Frequency % of Scheme Total
36 Pregabalin 791,072 0.51 17,825 0.23
37 Apixaban 750,032 0.48 11,755 0.15
38 Insulin Lispro, Fast-Acting 718,367 0.46 13,978 0.18
39 Ropinirole 701,649 0.45 9,068 0.12
40 Perindopril 700,511 0.45 112,963 1.49
41 Eslicarbazepine 598,369 0.38 3,554 0.05
42 Fampridine 574,438 0.37 3,652 0.05
43 Insulin Glulisine, Fast-Acting 554,223 0.36 12,281 0.16
44 Saxagliptin 548,364 0.35 13,992 0.18
45 Dulaglutide 519,580 0.33 4,642 0.06
46 Olmesartan Medoxomil 504,018 0.32 30,038 0.40
47 Topiramate 503,588 0.32 11,971 0.16
48 Doxazosin 501,949 0.32 69,759 0.92
49 Amlodipine 499,021 0.32 177,383 2.34
50 Pramipexole 494,509 0.32 6,823 0.09
51 Bisoprolol 491,965 0.32 225,515 2.97
52 Metformin and Linagliptin 480,117 0.31 12,065 0.16
53 Levodopa and Decarboxylase Inhibitor 466,119 0.30 41,225 0.54
54 Insulin (Human), Comb. Intermediate/Fast-Acting 448,700 0.29 10,486 0.14
55 Rotigotine 446,650 0.29 3,117 0.04
56 Carbamazepine 433,302 0.28 62,575 0.82
57 Insulin Degludec 432,172 0.28 5,447 0.07
58 Perindopril and Amlodipine 430,172 0.28 24,618 0.32
59 Lercanidipine 415,113 0.27 89,043 1.17
60 Glucagon 398,210 0.26 17,061 0.22
61 Valsartan and Amlodipine 396,868 0.26 16,695 0.22
62 Perindopril and Diuretics 395,677 0.25 37,164 0.49
63 Pioglitazone 369,123 0.24 16,446 0.22
64 Nutritional/Ancillary Devices 347,821 0.22 1,745 0.02
65 Metformin and Vildagliptin 345,317 0.22 8,369 0.11
66 Perampanel 339,609 0.22 2,106 0.03
67 Dabigatran Etexilate 334,221 0.21 4,830 0.06
68 Oxcarbazepine 333,517 0.21 12,231 0.16
69 Valsartan 321,311 0.21 53,783 0.71
70 Gabapentin 315,076 0.20 9,582 0.13
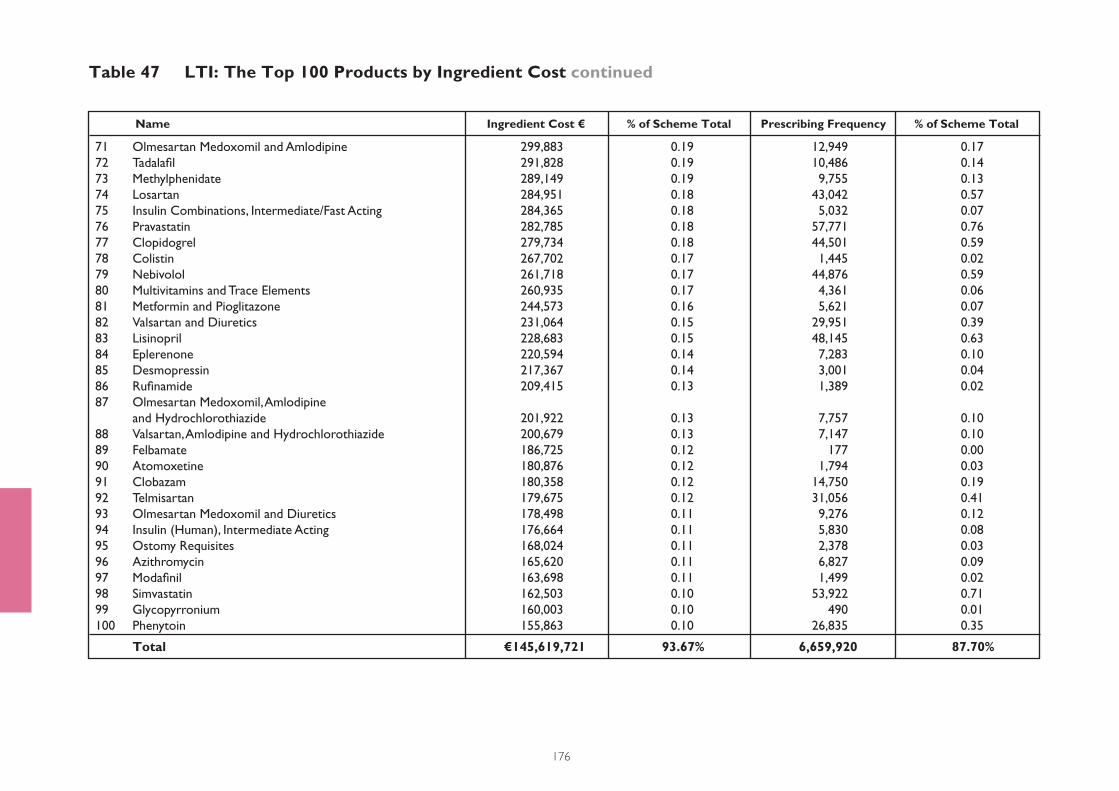
176
Table 47 LTI: The Top 100 Products by Ingredient Cost continued
Name Ingredient Cost € % of Scheme Total Prescribing Frequency % of Scheme Total
71 Olmesartan Medoxomil and Amlodipine 299,883 0.19 12,949 0.17
72 Tadalafi l 291,828 0.19 10,486 0.14
73 Methylphenidate 289,149 0.19 9,755 0.13
74 Losartan 284,951 0.18 43,042 0.57
75 Insulin Combinations, Intermediate/Fast Acting 284,365 0.18 5,032 0.07
76 Pravastatin 282,785 0.18 57,771 0.76
77 Clopidogrel 279,734 0.18 44,501 0.59
78 Colistin 267,702 0.17 1,445 0.02
79 Nebivolol 261,718 0.17 44,876 0.59
80 Multivitamins and Trace Elements 260,935 0.17 4,361 0.06
81 Metformin and Pioglitazone 244,573 0.16 5,621 0.07
82 Valsartan and Diuretics 231,064 0.15 29,951 0.39
83 Lisinopril 228,683 0.15 48,145 0.63
84 Eplerenone 220,594 0.14 7,283 0.10
85 Desmopressin 217,367 0.14 3,001 0.04
86 Rufi namide 209,415 0.13 1,389 0.02
87 Olmesartan Medoxomil, Amlodipine
and Hydrochlorothiazide 201,922 0.13 7,757 0.10
88 Valsartan, Amlodipine and Hydrochlorothiazide 200,679 0.13 7,147 0.10
89 Felbamate 186,725 0.12 177 0.00
90 Atomoxetine 180,876 0.12 1,794 0.03
91 Clobazam 180,358 0.12 14,750 0.19
92 Telmisartan 179,675 0.12 31,056 0.41
93 Olmesartan Medoxomil and Diuretics 178,498 0.11 9,276 0.12
94 Insulin (Human), Intermediate Acting 176,664 0.11 5,830 0.08
95 Ostomy Requisites 168,024 0.11 2,378 0.03
96 Azithromycin 165,620 0.11 6,827 0.09
97 Modafi nil 163,698 0.11 1,499 0.02
98 Simvastatin 162,503 0.10 53,922 0.71
99 Glycopyrronium 160,003 0.10 490 0.01
100 Phenytoin 155,863 0.10 26,835 0.35
Total €145,619,721 93.67% 6,659,920 87.70%
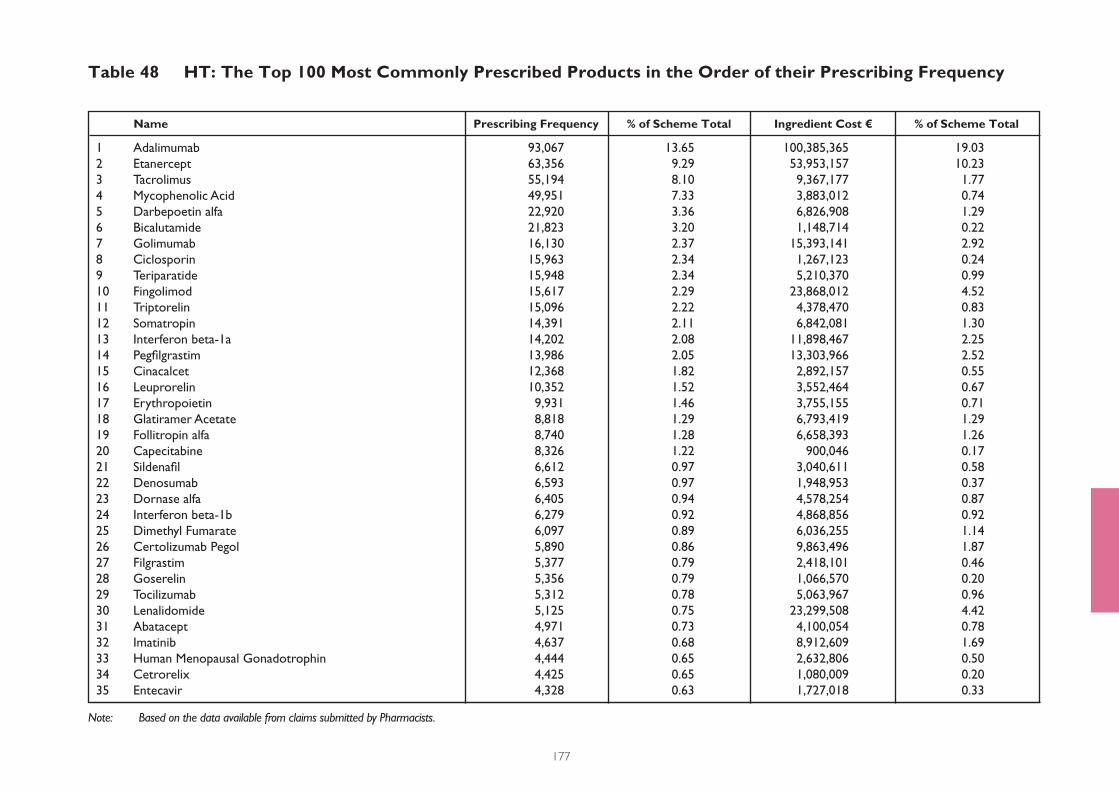
Note: Based on the data available from claims submitted by Pharmacists.
177
Table 48 HT: The Top 100 Most Commonly Prescribed Products in the Order of their Prescribing Frequency
Name Prescribing Frequency % of Scheme Total Ingredient Cost € % of Scheme Total
1 Adalimumab 93,067 13.65 100,385,365 19.03
2 Etanercept 63,356 9.29 53,953,157 10.23
3 Tacrolimus 55,194 8.10 9,367,177 1.77
4 Mycophenolic Acid 49,951 7.33 3,883,012 0.74
5 Darbepoetin alfa 22,920 3.36 6,826,908 1.29
6 Bicalutamide 21,823 3.20 1,148,714 0.22
7 Golimumab 16,130 2.37 15,393,141 2.92
8 Ciclosporin 15,963 2.34 1,267,123 0.24
9 Teriparatide 15,948 2.34 5,210,370 0.99
10 Fingolimod 15,617 2.29 23,868,012 4.52
11 Triptorelin 15,096 2.22 4,378,470 0.83
12 Somatropin 14,391 2.11 6,842,081 1.30
13 Interferon beta-1a 14,202 2.08 11,898,467 2.25
14 Pegfi lgrastim 13,986 2.05 13,303,966 2.52
15 Cinacalcet 12,368 1.82 2,892,157 0.55
16 Leuprorelin 10,352 1.52 3,552,464 0.67
17 Erythropoietin 9,931 1.46 3,755,155 0.71
18 Glatiramer Acetate 8,818 1.29 6,793,419 1.29
19 Follitropin alfa 8,740 1.28 6,658,393 1.26
20 Capecitabine 8,326 1.22 900,046 0.17
21 Sildenafi l 6,612 0.97 3,040,611 0.58
22 Denosumab 6,593 0.97 1,948,953 0.37
23 Dornase alfa 6,405 0.94 4,578,254 0.87
24 Interferon beta-1b 6,279 0.92 4,868,856 0.92
25 Dimethyl Fumarate 6,097 0.89 6,036,255 1.14
26 Certolizumab Pegol 5,890 0.86 9,863,496 1.87
27 Filgrastim 5,377 0.79 2,418,101 0.46
28 Goserelin 5,356 0.79 1,066,570 0.20
29 Tocilizumab 5,312 0.78 5,063,967 0.96
30 Lenalidomide 5,125 0.75 23,299,508 4.42
31 Abatacept 4,971 0.73 4,100,054 0.78
32 Imatinib 4,637 0.68 8,912,609 1.69
33 Human Menopausal Gonadotrophin 4,444 0.65 2,632,806 0.50
34 Cetrorelix 4,425 0.65 1,080,009 0.20
35 Entecavir 4,328 0.63 1,727,018 0.33
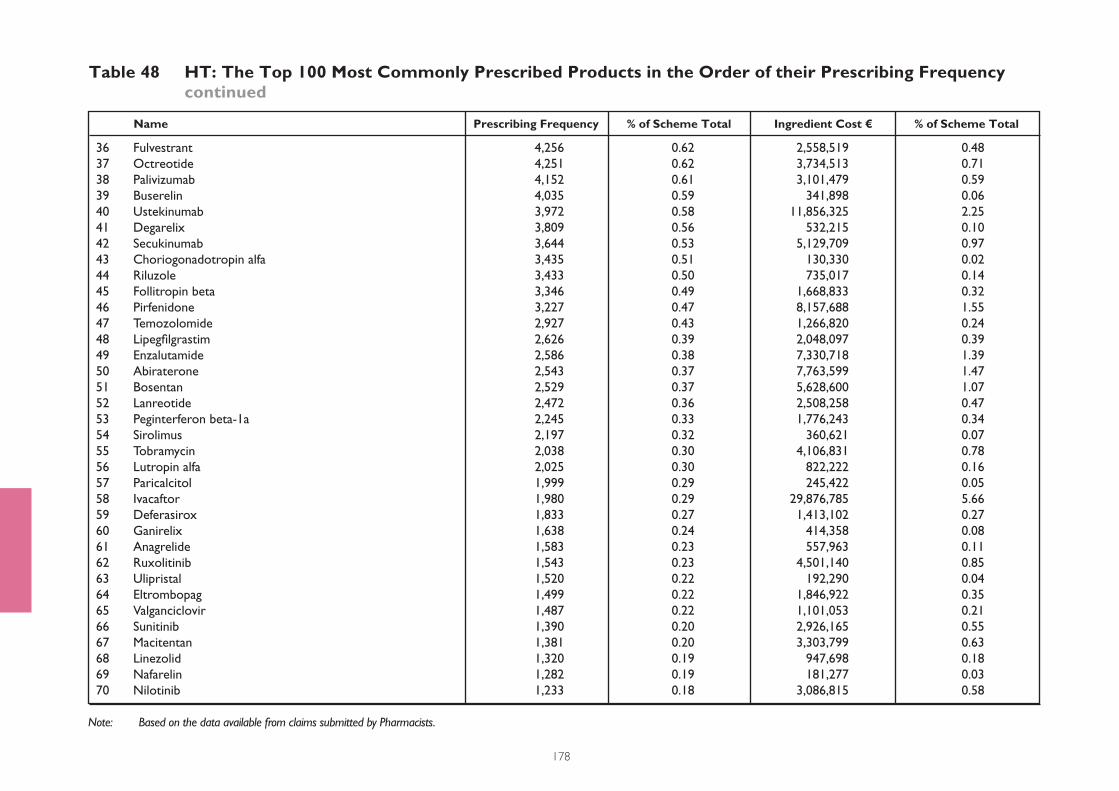
Note: Based on the data available from claims submitted by Pharmacists.
178
Table 48 HT: The Top 100 Most Commonly Prescribed Products in the Order of their Prescribing Frequency continued
Name Prescribing Frequency % of Scheme Total Ingredient Cost € % of Scheme Total
36 Fulvestrant 4,256 0.62 2,558,519 0.48
37 Octreotide 4,251 0.62 3,734,513 0.71
38 Palivizumab 4,152 0.61 3,101,479 0.59
39 Buserelin 4,035 0.59 341,898 0.06
40 Ustekinumab 3,972 0.58 11,856,325 2.25
41 Degarelix 3,809 0.56 532,215 0.10
42 Secukinumab 3,644 0.53 5,129,709 0.97
43 Choriogonadotropin alfa 3,435 0.51 130,330 0.02
44 Riluzole 3,433 0.50 735,017 0.14
45 Follitropin beta 3,346 0.49 1,668,833 0.32
46 Pirfenidone 3,227 0.47 8,157,688 1.55
47 Temozolomide 2,927 0.43 1,266,820 0.24
48 Lipegfi lgrastim 2,626 0.39 2,048,097 0.39
49 Enzalutamide 2,586 0.38 7,330,718 1.39
50 Abiraterone 2,543 0.37 7,763,599 1.47
51 Bosentan 2,529 0.37 5,628,600 1.07
52 Lanreotide 2,472 0.36 2,508,258 0.47
53 Peginterferon beta-1a 2,245 0.33 1,776,243 0.34
54 Sirolimus 2,197 0.32 360,621 0.07
55 Tobramycin 2,038 0.30 4,106,831 0.78
56 Lutropin alfa 2,025 0.30 822,222 0.16
57 Paricalcitol 1,999 0.29 245,422 0.05
58 Ivacaftor 1,980 0.29 29,876,785 5.66
59 Deferasirox 1,833 0.27 1,413,102 0.27
60 Ganirelix 1,638 0.24 414,358 0.08
61 Anagrelide 1,583 0.23 557,963 0.11
62 Ruxolitinib 1,543 0.23 4,501,140 0.85
63 Ulipristal 1,520 0.22 192,290 0.04
64 Eltrombopag 1,499 0.22 1,846,922 0.35
65 Valganciclovir 1,487 0.22 1,101,053 0.21
66 Sunitinib 1,390 0.20 2,926,165 0.55
67 Macitentan 1,381 0.20 3,303,799 0.63
68 Linezolid 1,320 0.19 947,698 0.18
69 Nafarelin 1,282 0.19 181,277 0.03
70 Nilotinib 1,233 0.18 3,086,815 0.58
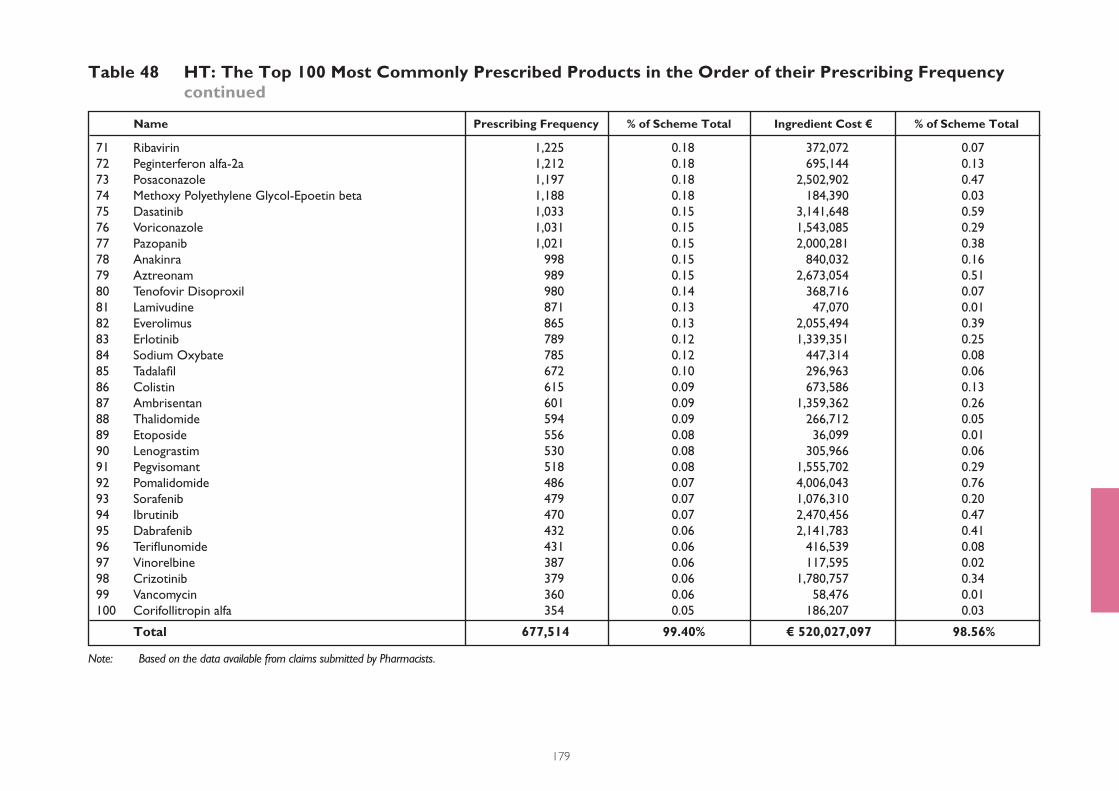
Note: Based on the data available from claims submitted by Pharmacists.
179
Table 48 HT: The Top 100 Most Commonly Prescribed Products in the Order of their Prescribing Frequency continued
Name Prescribing Frequency % of Scheme Total Ingredient Cost € % of Scheme Total
71 Ribavirin 1,225 0.18 372,072 0.07
72 Peginterferon alfa-2a 1,212 0.18 695,144 0.13
73 Posaconazole 1,197 0.18 2,502,902 0.47
74 Methoxy Polyethylene Glycol-Epoetin beta 1,188 0.18 184,390 0.03
75 Dasatinib 1,033 0.15 3,141,648 0.59
76 Voriconazole 1,031 0.15 1,543,085 0.29
77 Pazopanib 1,021 0.15 2,000,281 0.38
78 Anakinra 998 0.15 840,032 0.16
79 Aztreonam 989 0.15 2,673,054 0.51
80 Tenofovir Disoproxil 980 0.14 368,716 0.07
81 Lamivudine 871 0.13 47,070 0.01
82 Everolimus 865 0.13 2,055,494 0.39
83 Erlotinib 789 0.12 1,339,351 0.25
84 Sodium Oxybate 785 0.12 447,314 0.08
85 Tadalafi l 672 0.10 296,963 0.06
86 Colistin 615 0.09 673,586 0.13
87 Ambrisentan 601 0.09 1,359,362 0.26
88 Thalidomide 594 0.09 266,712 0.05
89 Etoposide 556 0.08 36,099 0.01
90 Lenograstim 530 0.08 305,966 0.06
91 Pegvisomant 518 0.08 1,555,702 0.29
92 Pomalidomide 486 0.07 4,006,043 0.76
93 Sorafenib 479 0.07 1,076,310 0.20
94 Ibrutinib 470 0.07 2,470,456 0.47
95 Dabrafenib 432 0.06 2,141,783 0.41
96 Terifl unomide 431 0.06 416,539 0.08
97 Vinorelbine 387 0.06 117,595 0.02
98 Crizotinib 379 0.06 1,780,757 0.34
99 Vancomycin 360 0.06 58,476 0.01
100 Corifollitropin alfa 354 0.05 186,207 0.03
Total 677,514 99.40% € 520,027,097 98.56%
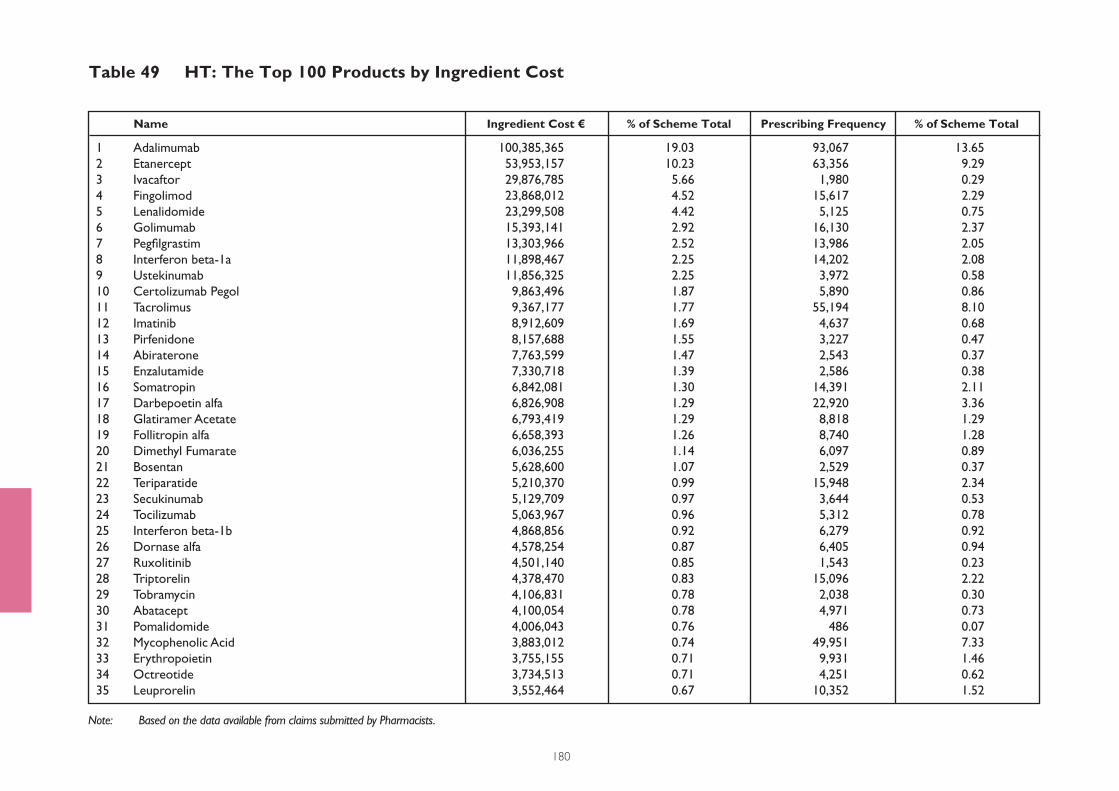
Note: Based on the data available from claims submitted by Pharmacists.
180
Table 49 HT: The Top 100 Products by Ingredient Cost
Name Ingredient Cost € % of Scheme Total Prescribing Frequency % of Scheme Total
1 Adalimumab 100,385,365 19.03 93,067 13.65
2 Etanercept 53,953,157 10.23 63,356 9.29
3 Ivacaftor 29,876,785 5.66 1,980 0.29
4 Fingolimod 23,868,012 4.52 15,617 2.29
5 Lenalidomide 23,299,508 4.42 5,125 0.75
6 Golimumab 15,393,141 2.92 16,130 2.37
7 Pegfi lgrastim 13,303,966 2.52 13,986 2.05
8 Interferon beta-1a 11,898,467 2.25 14,202 2.08
9 Ustekinumab 11,856,325 2.25 3,972 0.58
10 Certolizumab Pegol 9,863,496 1.87 5,890 0.86
11 Tacrolimus 9,367,177 1.77 55,194 8.10
12 Imatinib 8,912,609 1.69 4,637 0.68
13 Pirfenidone 8,157,688 1.55 3,227 0.47
14 Abiraterone 7,763,599 1.47 2,543 0.37
15 Enzalutamide 7,330,718 1.39 2,586 0.38
16 Somatropin 6,842,081 1.30 14,391 2.11
17 Darbepoetin alfa 6,826,908 1.29 22,920 3.36
18 Glatiramer Acetate 6,793,419 1.29 8,818 1.29
19 Follitropin alfa 6,658,393 1.26 8,740 1.28
20 Dimethyl Fumarate 6,036,255 1.14 6,097 0.89
21 Bosentan 5,628,600 1.07 2,529 0.37
22 Teriparatide 5,210,370 0.99 15,948 2.34
23 Secukinumab 5,129,709 0.97 3,644 0.53
24 Tocilizumab 5,063,967 0.96 5,312 0.78
25 Interferon beta-1b 4,868,856 0.92 6,279 0.92
26 Dornase alfa 4,578,254 0.87 6,405 0.94
27 Ruxolitinib 4,501,140 0.85 1,543 0.23
28 Triptorelin 4,378,470 0.83 15,096 2.22
29 Tobramycin 4,106,831 0.78 2,038 0.30
30 Abatacept 4,100,054 0.78 4,971 0.73
31 Pomalidomide 4,006,043 0.76 486 0.07
32 Mycophenolic Acid 3,883,012 0.74 49,951 7.33
33 Erythropoietin 3,755,155 0.71 9,931 1.46
34 Octreotide 3,734,513 0.71 4,251 0.62
35 Leuprorelin 3,552,464 0.67 10,352 1.52
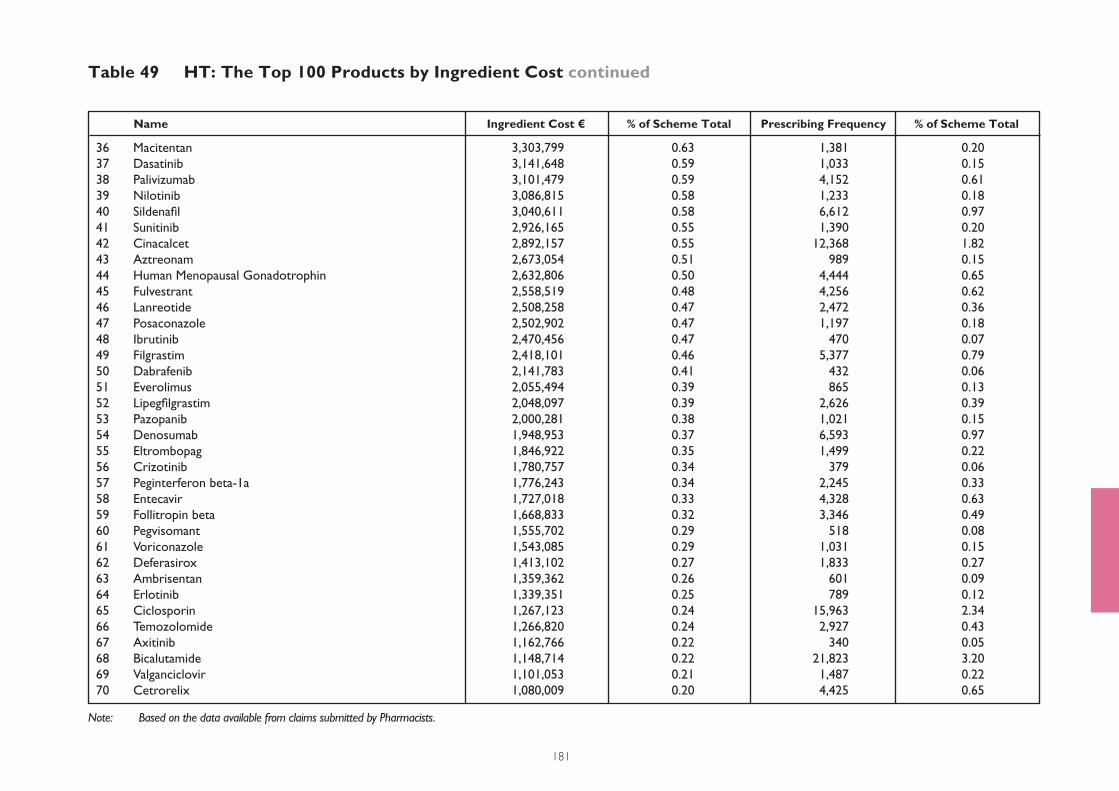
Note: Based on the data available from claims submitted by Pharmacists.
181
Table 49 HT: The Top 100 Products by Ingredient Cost continued
Name Ingredient Cost € % of Scheme Total Prescribing Frequency % of Scheme Total
36 Macitentan 3,303,799 0.63 1,381 0.20
37 Dasatinib 3,141,648 0.59 1,033 0.15
38 Palivizumab 3,101,479 0.59 4,152 0.61
39 Nilotinib 3,086,815 0.58 1,233 0.18
40 Sildenafi l 3,040,611 0.58 6,612 0.97
41 Sunitinib 2,926,165 0.55 1,390 0.20
42 Cinacalcet 2,892,157 0.55 12,368 1.82
43 Aztreonam 2,673,054 0.51 989 0.15
44 Human Menopausal Gonadotrophin 2,632,806 0.50 4,444 0.65
45 Fulvestrant 2,558,519 0.48 4,256 0.62
46 Lanreotide 2,508,258 0.47 2,472 0.36
47 Posaconazole 2,502,902 0.47 1,197 0.18
48 Ibrutinib 2,470,456 0.47 470 0.07
49 Filgrastim 2,418,101 0.46 5,377 0.79
50 Dabrafenib 2,141,783 0.41 432 0.06
51 Everolimus 2,055,494 0.39 865 0.13
52 Lipegfi lgrastim 2,048,097 0.39 2,626 0.39
53 Pazopanib 2,000,281 0.38 1,021 0.15
54 Denosumab 1,948,953 0.37 6,593 0.97
55 Eltrombopag 1,846,922 0.35 1,499 0.22
56 Crizotinib 1,780,757 0.34 379 0.06
57 Peginterferon beta-1a 1,776,243 0.34 2,245 0.33
58 Entecavir 1,727,018 0.33 4,328 0.63
59 Follitropin beta 1,668,833 0.32 3,346 0.49
60 Pegvisomant 1,555,702 0.29 518 0.08
61 Voriconazole 1,543,085 0.29 1,031 0.15
62 Deferasirox 1,413,102 0.27 1,833 0.27
63 Ambrisentan 1,359,362 0.26 601 0.09
64 Erlotinib 1,339,351 0.25 789 0.12
65 Ciclosporin 1,267,123 0.24 15,963 2.34
66 Temozolomide 1,266,820 0.24 2,927 0.43
67 Axitinib 1,162,766 0.22 340 0.05
68 Bicalutamide 1,148,714 0.22 21,823 3.20
69 Valganciclovir 1,101,053 0.21 1,487 0.22
70 Cetrorelix 1,080,009 0.20 4,425 0.65
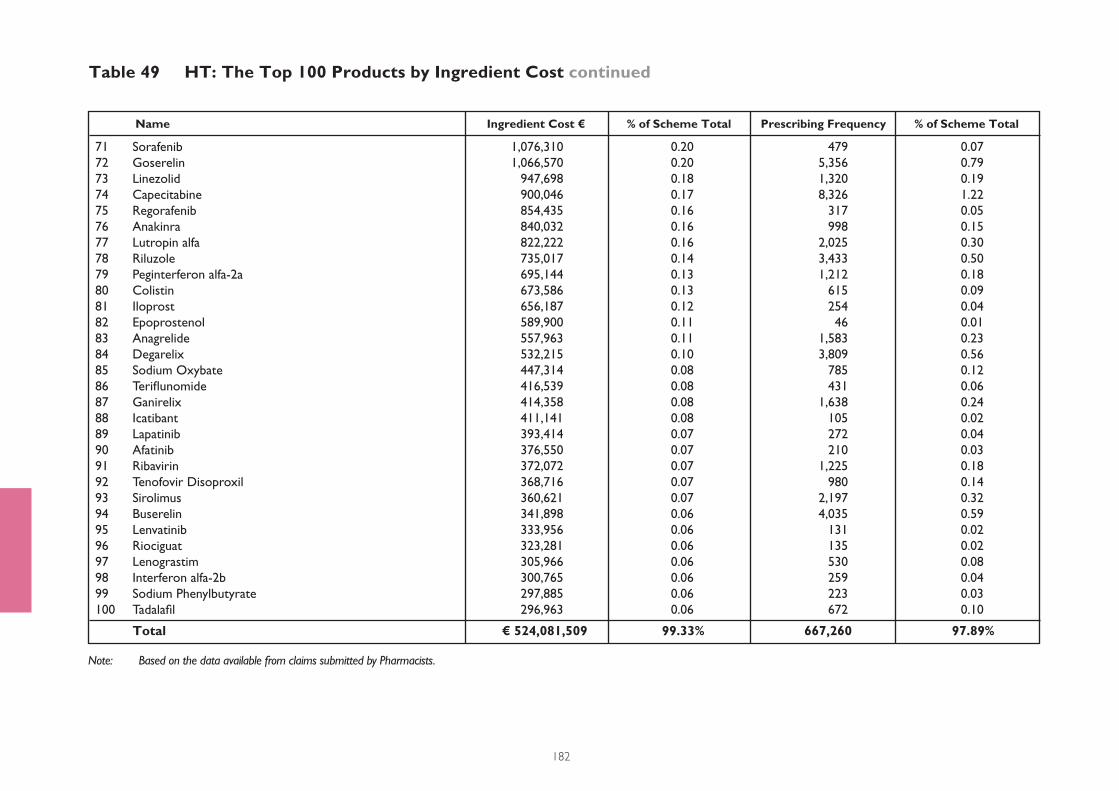
Note: Based on the data available from claims submitted by Pharmacists.
182
Table 49 HT: The Top 100 Products by Ingredient Cost continued
Name Ingredient Cost € % of Scheme Total Prescribing Frequency % of Scheme Total
71 Sorafenib 1,076,310 0.20 479 0.07
72 Goserelin 1,066,570 0.20 5,356 0.79
73 Linezolid 947,698 0.18 1,320 0.19
74 Capecitabine 900,046 0.17 8,326 1.22
75 Regorafenib 854,435 0.16 317 0.05
76 Anakinra 840,032 0.16 998 0.15
77 Lutropin alfa 822,222 0.16 2,025 0.30
78 Riluzole 735,017 0.14 3,433 0.50
79 Peginterferon alfa-2a 695,144 0.13 1,212 0.18
80 Colistin 673,586 0.13 615 0.09
81 Iloprost 656,187 0.12 254 0.04
82 Epoprostenol 589,900 0.11 46 0.01
83 Anagrelide 557,963 0.11 1,583 0.23
84 Degarelix 532,215 0.10 3,809 0.56
85 Sodium Oxybate 447,314 0.08 785 0.12
86 Terifl unomide 416,539 0.08 431 0.06
87 Ganirelix 414,358 0.08 1,638 0.24
88 Icatibant 411,141 0.08 105 0.02
89 Lapatinib 393,414 0.07 272 0.04
90 Afatinib 376,550 0.07 210 0.03
91 Ribavirin 372,072 0.07 1,225 0.18
92 Tenofovir Disoproxil 368,716 0.07 980 0.14
93 Sirolimus 360,621 0.07 2,197 0.32
94 Buserelin 341,898 0.06 4,035 0.59
95 Lenvatinib 333,956 0.06 131 0.02
96 Riociguat 323,281 0.06 135 0.02
97 Lenograstim 305,966 0.06 530 0.08
98 Interferon alfa-2b 300,765 0.06 259 0.04
99 Sodium Phenylbutyrate 297,885 0.06 223 0.03
100 Tadalafi l 296,963 0.06 672 0.10
Total € 524,081,509 99.33% 667,260 97.89%
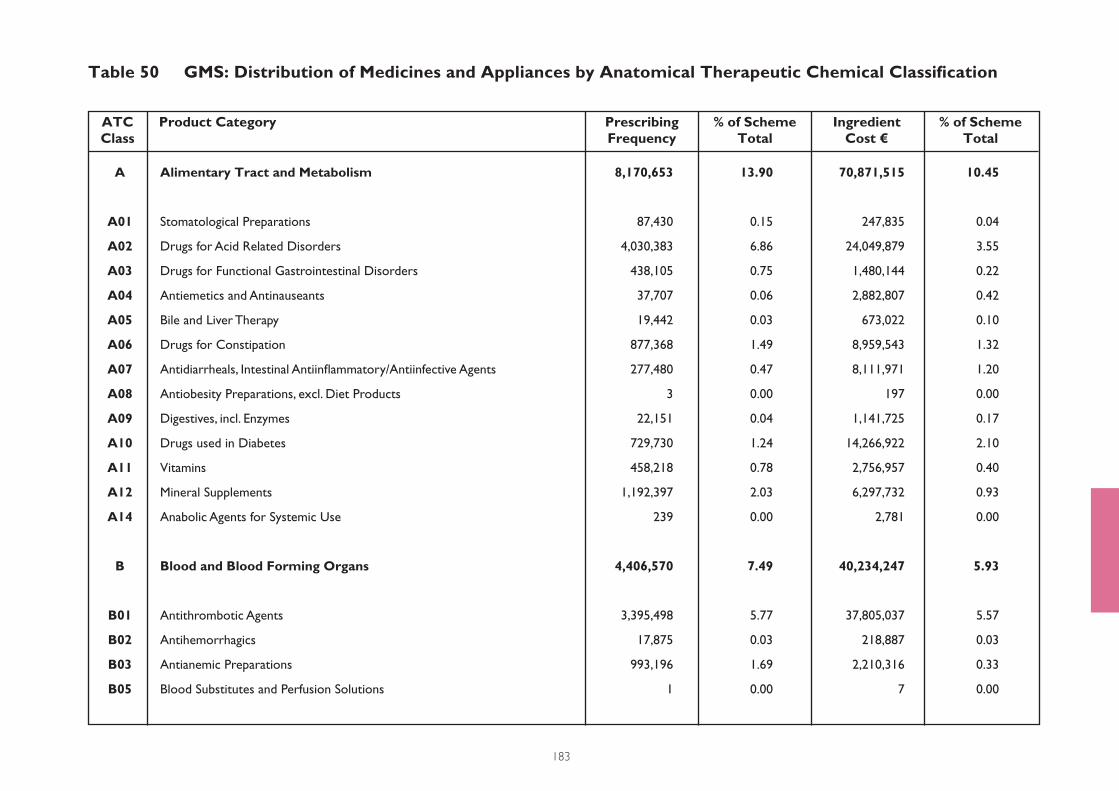
183
Table 50 GMS: Distribution of Medicines and Appliances by Anatomical Therapeutic Chemical Classifi cation
Product CategoryATCClass
PrescribingFrequency
% of Scheme Total
IngredientCost €
% of Scheme Total
A Alimentary Tract and Metabolism 8,170,653 13.90 70,871,515 10.45
A01 Stomatological Preparations 87,430 0.15 247,835 0.04
A02 Drugs for Acid Related Disorders 4,030,383 6.86 24,049,879 3.55
A03 Drugs for Functional Gastrointestinal Disorders 438,105 0.75 1,480,144 0.22
A04 Antiemetics and Antinauseants 37,707 0.06 2,882,807 0.42
A05 Bile and Liver Therapy 19,442 0.03 673,022 0.10
A06 Drugs for Constipation 877,368 1.49 8,959,543 1.32
A07 Antidiarrheals, Intestinal Antiinfl ammatory/Antiinfective Agents 277,480 0.47 8,111,971 1.20
A08 Antiobesity Preparations, excl. Diet Products 3 0.00 197 0.00
A09 Digestives, incl. Enzymes 22,151 0.04 1,141,725 0.17
A10 Drugs used in Diabetes 729,730 1.24 14,266,922 2.10
A11 Vitamins 458,218 0.78 2,756,957 0.40
A12 Mineral Supplements 1,192,397 2.03 6,297,732 0.93
A14 Anabolic Agents for Systemic Use 239 0.00 2,781 0.00
B Blood and Blood Forming Organs 4,406,570 7.49 40,234,247 5.93
B01 Antithrombotic Agents 3,395,498 5.77 37,805,037 5.57
B02 Antihemorrhagics 17,875 0.03 218,887 0.03
B03 Antianemic Preparations 993,196 1.69 2,210,316 0.33
B05 Blood Substitutes and Perfusion Solutions 1 0.00 7 0.00
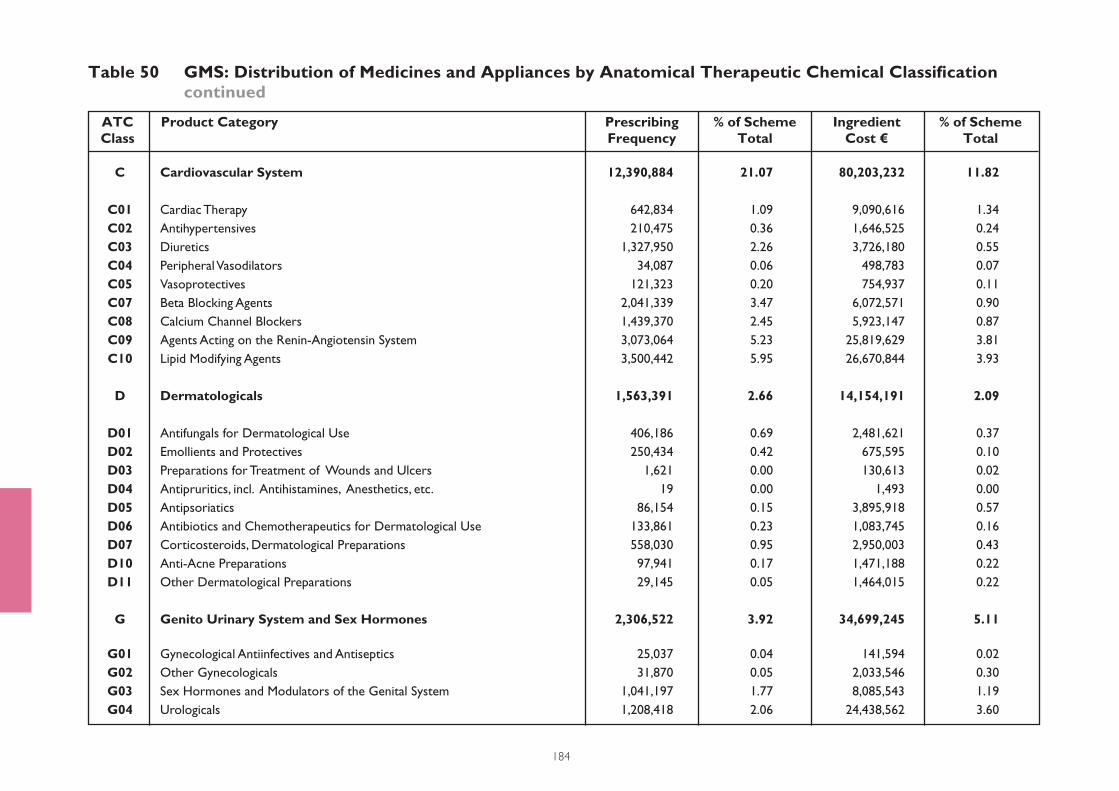
184
Table 50 GMS: Distribution of Medicines and Appliances by Anatomical Therapeutic Chemical Classifi cation continued
Product CategoryATCClass
PrescribingFrequency
% of Scheme Total
IngredientCost €
% of Scheme Total
C Cardiovascular System 12,390,884 21.07 80,203,232 11.82
C01 Cardiac Therapy 642,834 1.09 9,090,616 1.34
C02 Antihypertensives 210,475 0.36 1,646,525 0.24
C03 Diuretics 1,327,950 2.26 3,726,180 0.55
C04 Peripheral Vasodilators 34,087 0.06 498,783 0.07
C05 Vasoprotectives 121,323 0.20 754,937 0.11
C07 Beta Blocking Agents 2,041,339 3.47 6,072,571 0.90
C08 Calcium Channel Blockers 1,439,370 2.45 5,923,147 0.87
C09 Agents Acting on the Renin-Angiotensin System 3,073,064 5.23 25,819,629 3.81
C10 Lipid Modifying Agents 3,500,442 5.95 26,670,844 3.93
D Dermatologicals 1,563,391 2.66 14,154,191 2.09
D01 Antifungals for Dermatological Use 406,186 0.69 2,481,621 0.37
D02 Emollients and Protectives 250,434 0.42 675,595 0.10
D03 Preparations for Treatment of Wounds and Ulcers 1,621 0.00 130,613 0.02
D04 Antipruritics, incl. Antihistamines, Anesthetics, etc. 19 0.00 1,493 0.00
D05 Antipsoriatics 86,154 0.15 3,895,918 0.57
D06 Antibiotics and Chemotherapeutics for Dermatological Use 133,861 0.23 1,083,745 0.16
D07 Corticosteroids, Dermatological Preparations 558,030 0.95 2,950,003 0.43
D10 Anti-Acne Preparations 97,941 0.17 1,471,188 0.22
D11 Other Dermatological Preparations 29,145 0.05 1,464,015 0.22
G Genito Urinary System and Sex Hormones 2,306,522 3.92 34,699,245 5.11
G01 Gynecological Antiinfectives and Antiseptics 25,037 0.04 141,594 0.02
G02 Other Gynecologicals 31,870 0.05 2,033,546 0.30
G03 Sex Hormones and Modulators of the Genital System 1,041,197 1.77 8,085,543 1.19
G04 Urologicals 1,208,418 2.06 24,438,562 3.60

185
Table 50 GMS: Distribution of Medicines and Appliances by Anatomical Therapeutic Chemical Classifi cation continued
Product CategoryATCClass
PrescribingFrequency
% of Scheme Total
IngredientCost €
% of Scheme Total
H Systemic Hormonal Preparations, Excl. Sex Hormones and Insulins 2,532,136 4.31 7,702,606 1.14
H01 Pituitary and Hypothalamic Hormones and Analogues 14,085 0.02 773,331 0.11
H02 Corticosteroids for Systemic Use 772,915 1.32 3,711,673 0.55
H03 Thyroid Therapy 1,740,322 2.96 3,101,286 0.46
H04 Pancreatic Hormones 4,814 0.01 116,316 0.02
J Antiinfectives for Systemic Use 2,894,296 4.92 19,365,912 2.86
J01 Antibacterials for Systemic Use 2,715,336 4.62 15,796,625 2.33
J02 Antimycotics for Systemic Use 107,542 0.18 953,432 0.14
J04 Antimycobacterials 8,237 0.01 174,824 0.03
J05 Antivirals for Systemic Use 63,181 0.11 2,441,031 0.36
L Antineoplastic and Immunomodulating Agents 338,374 0.58 6,322,537 0.93
L01 Antineoplastic Agents 26,655 0.05 1,012,225 0.15
L02 Endocrine Therapy 111,512 0.19 2,567,899 0.38
L04 Immunosuppressants 200,207 0.34 2,742,413 0.40
M Musculo-Skeletal System 3,118,350 5.31 34,025,293 5.01
M01 Antiinfl ammatory and Antirheumatic Products 1,350,361 2.30 10,398,944 1.53
M02 Topical Products for Joint and Muscular Pain 715,022 1.22 4,820,384 0.71
M03 Muscle Relaxants 62,208 0.11 708,843 0.11
M04 Antigout Preparations 363,502 0.62 2,532,718 0.37
M05 Drugs for Treatment of Bone Diseases 507,256 0.86 14,201,782 2.09
M09 Other Drugs for Disorders of the Musculo-Skeletal System 120,001 0.20 1,362,622 0.20
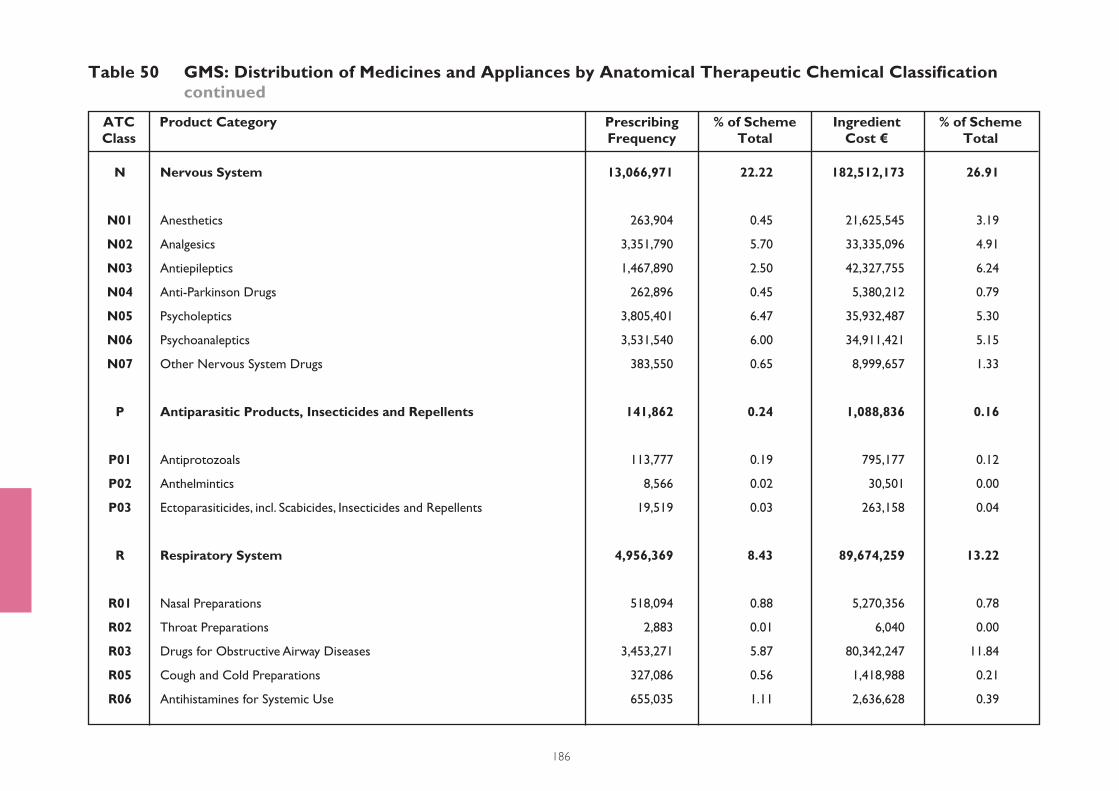
186
Table 50 GMS: Distribution of Medicines and Appliances by Anatomical Therapeutic Chemical Classifi cation continued
Product CategoryATCClass
PrescribingFrequency
% of Scheme Total
IngredientCost €
% of Scheme Total
N Nervous System 13,066,971 22.22 182,512,173 26.91
N01 Anesthetics 263,904 0.45 21,625,545 3.19
N02 Analgesics 3,351,790 5.70 33,335,096 4.91
N03 Antiepileptics 1,467,890 2.50 42,327,755 6.24
N04 Anti-Parkinson Drugs 262,896 0.45 5,380,212 0.79
N05 Psycholeptics 3,805,401 6.47 35,932,487 5.30
N06 Psychoanaleptics 3,531,540 6.00 34,911,421 5.15
N07 Other Nervous System Drugs 383,550 0.65 8,999,657 1.33
P Antiparasitic Products, Insecticides and Repellents 141,862 0.24 1,088,836 0.16
P01 Antiprotozoals 113,777 0.19 795,177 0.12
P02 Anthelmintics 8,566 0.02 30,501 0.00
P03 Ectoparasiticides, incl. Scabicides, Insecticides and Repellents 19,519 0.03 263,158 0.04
R Respiratory System 4,956,369 8.43 89,674,259 13.22
R01 Nasal Preparations 518,094 0.88 5,270,356 0.78
R02 Throat Preparations 2,883 0.01 6,040 0.00
R03 Drugs for Obstructive Airway Diseases 3,453,271 5.87 80,342,247 11.84
R05 Cough and Cold Preparations 327,086 0.56 1,418,988 0.21
R06 Antihistamines for Systemic Use 655,035 1.11 2,636,628 0.39
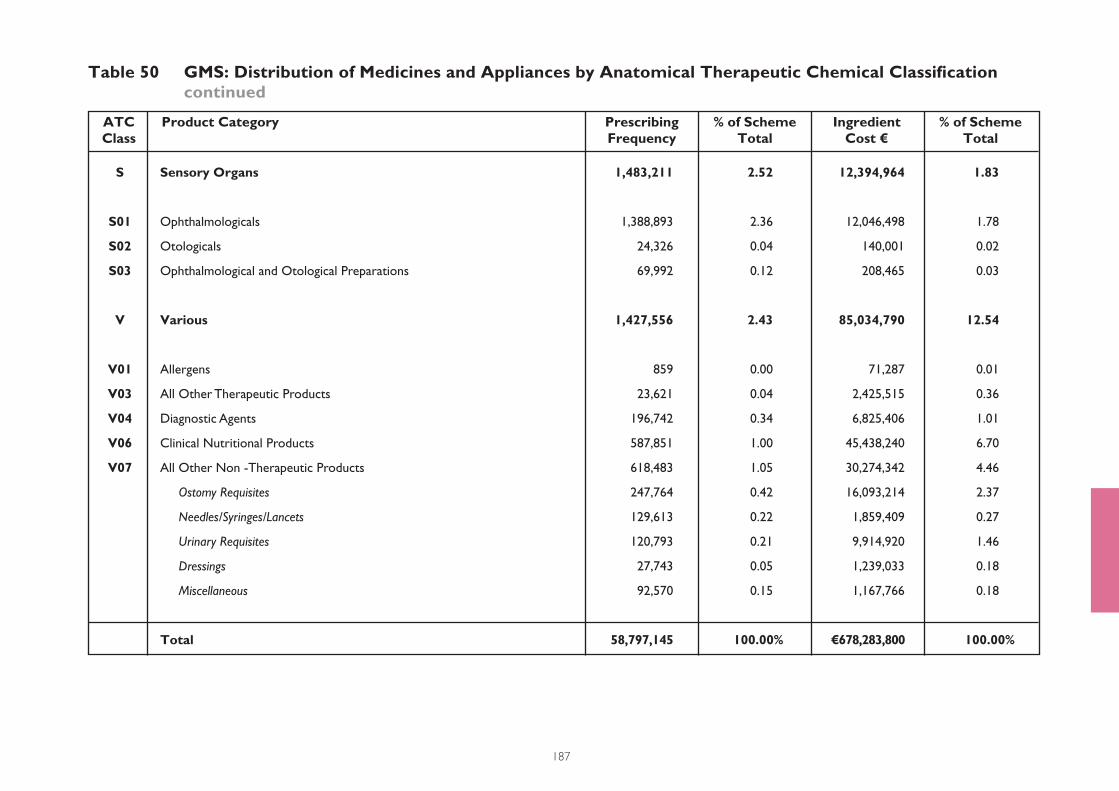
187
Table 50 GMS: Distribution of Medicines and Appliances by Anatomical Therapeutic Chemical Classifi cation continued
Product CategoryATCClass
PrescribingFrequency
% of Scheme Total
IngredientCost €
% of Scheme Total
S Sensory Organs 1,483,211 2.52 12,394,964 1.83
S01 Ophthalmologicals 1,388,893 2.36 12,046,498 1.78
S02 Otologicals 24,326 0.04 140,001 0.02
S03 Ophthalmological and Otological Preparations 69,992 0.12 208,465 0.03
V Various 1,427,556 2.43 85,034,790 12.54
V01 Allergens 859 0.00 71,287 0.01
V03 All Other Therapeutic Products 23,621 0.04 2,425,515 0.36
V04 Diagnostic Agents 196,742 0.34 6,825,406 1.01
V06 Clinical Nutritional Products 587,851 1.00 45,438,240 6.70
V07 All Other Non -Therapeutic Products 618,483 1.05 30,274,342 4.46
Ostomy Requisites 247,764 0.42 16,093,214 2.37
Needles/Syringes/Lancets 129,613 0.22 1,859,409 0.27
Urinary Requisites 120,793 0.21 9,914,920 1.46
Dressings 27,743 0.05 1,239,033 0.18
Miscellaneous 92,570 0.15 1,167,766 0.18
Total 58,797,145 100.00% €678,283,800 100.00%
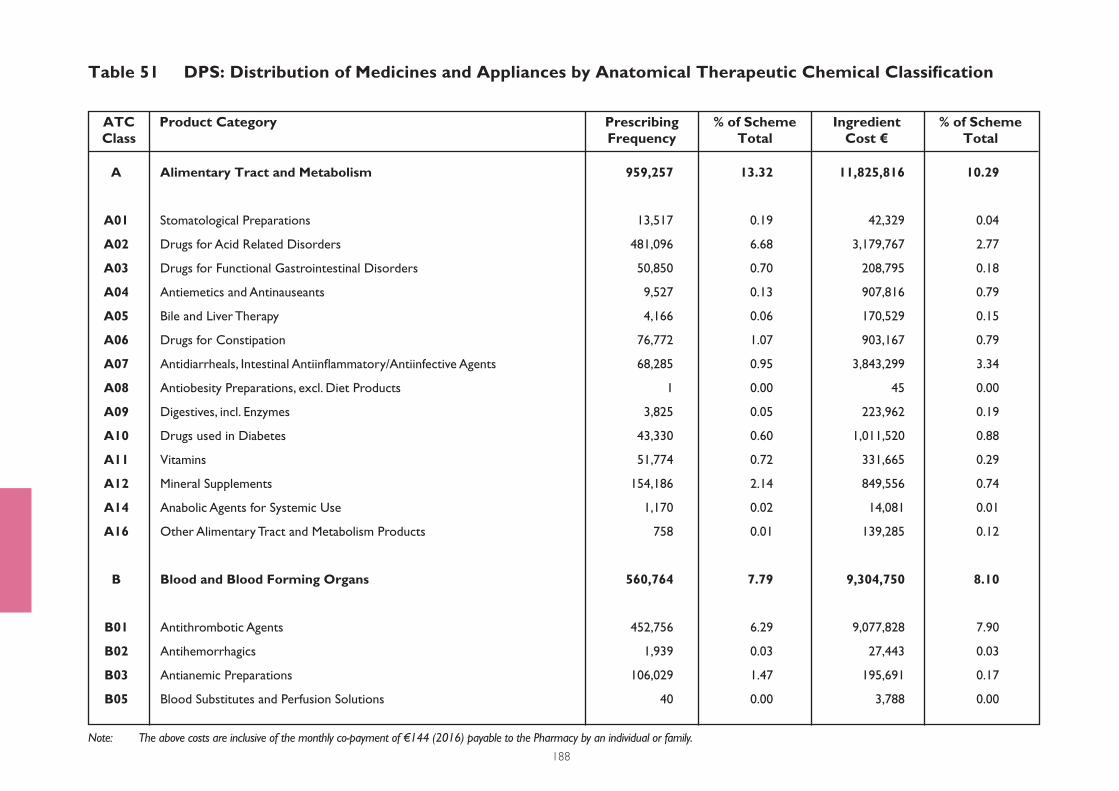
Note: The above costs are inclusive of the monthly co-payment of €144 (2016) payable to the Pharmacy by an individual or family.
188
Table 51 DPS: Distribution of Medicines and Appliances by Anatomical Therapeutic Chemical Classifi cation
Product CategoryATCClass
PrescribingFrequency
% of Scheme Total
IngredientCost €
% of Scheme Total
A Alimentary Tract and Metabolism 959,257 13.32 11,825,816 10.29
A01 Stomatological Preparations 13,517 0.19 42,329 0.04
A02 Drugs for Acid Related Disorders 481,096 6.68 3,179,767 2.77
A03 Drugs for Functional Gastrointestinal Disorders 50,850 0.70 208,795 0.18
A04 Antiemetics and Antinauseants 9,527 0.13 907,816 0.79
A05 Bile and Liver Therapy 4,166 0.06 170,529 0.15
A06 Drugs for Constipation 76,772 1.07 903,167 0.79
A07 Antidiarrheals, Intestinal Antiinfl ammatory/Antiinfective Agents 68,285 0.95 3,843,299 3.34
A08 Antiobesity Preparations, excl. Diet Products 1 0.00 45 0.00
A09 Digestives, incl. Enzymes 3,825 0.05 223,962 0.19
A10 Drugs used in Diabetes 43,330 0.60 1,011,520 0.88
A11 Vitamins 51,774 0.72 331,665 0.29
A12 Mineral Supplements 154,186 2.14 849,556 0.74
A14 Anabolic Agents for Systemic Use 1,170 0.02 14,081 0.01
A16 Other Alimentary Tract and Metabolism Products 758 0.01 139,285 0.12
B Blood and Blood Forming Organs 560,764 7.79 9,304,750 8.10
B01 Antithrombotic Agents 452,756 6.29 9,077,828 7.90
B02 Antihemorrhagics 1,939 0.03 27,443 0.03
B03 Antianemic Preparations 106,029 1.47 195,691 0.17
B05 Blood Substitutes and Perfusion Solutions 40 0.00 3,788 0.00
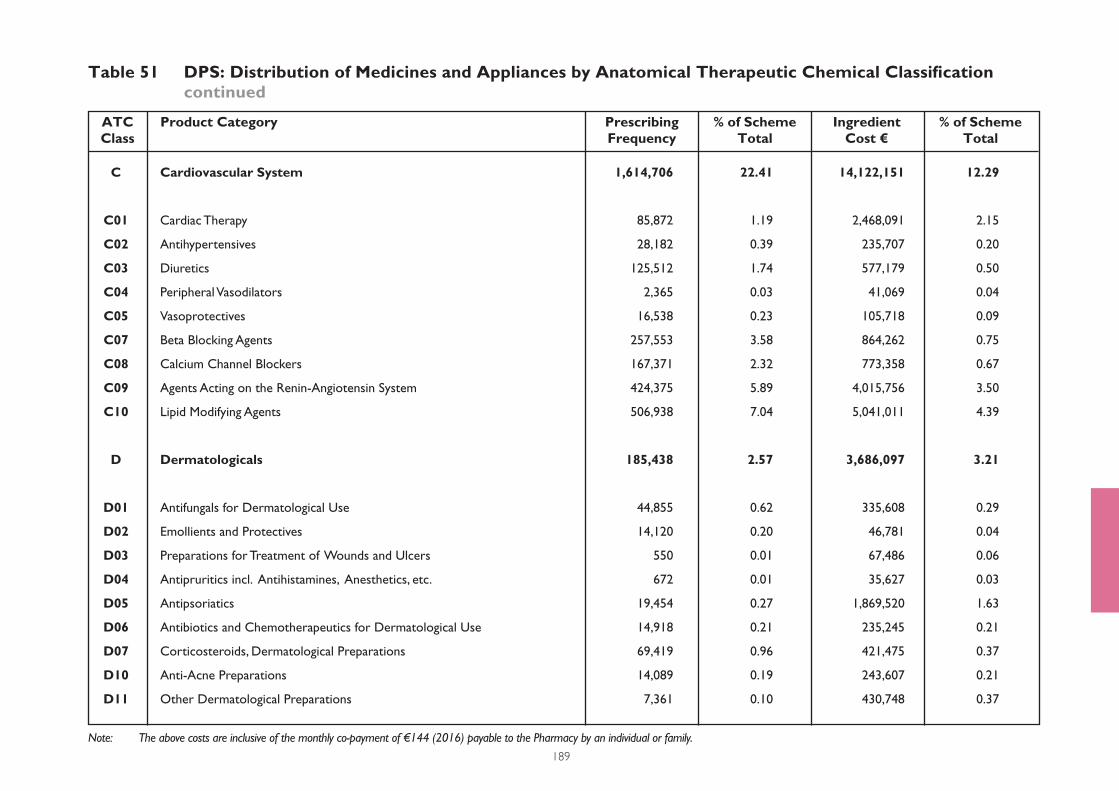
Note: The above costs are inclusive of the monthly co-payment of €144 (2016) payable to the Pharmacy by an individual or family.
189
Table 51 DPS: Distribution of Medicines and Appliances by Anatomical Therapeutic Chemical Classifi cation continued
Product CategoryATCClass
PrescribingFrequency
% of Scheme Total
IngredientCost €
% of Scheme Total
C Cardiovascular System 1,614,706 22.41 14,122,151 12.29
C01 Cardiac Therapy 85,872 1.19 2,468,091 2.15
C02 Antihypertensives 28,182 0.39 235,707 0.20
C03 Diuretics 125,512 1.74 577,179 0.50
C04 Peripheral Vasodilators 2,365 0.03 41,069 0.04
C05 Vasoprotectives 16,538 0.23 105,718 0.09
C07 Beta Blocking Agents 257,553 3.58 864,262 0.75
C08 Calcium Channel Blockers 167,371 2.32 773,358 0.67
C09 Agents Acting on the Renin-Angiotensin System 424,375 5.89 4,015,756 3.50
C10 Lipid Modifying Agents 506,938 7.04 5,041,011 4.39
D Dermatologicals 185,438 2.57 3,686,097 3.21
D01 Antifungals for Dermatological Use 44,855 0.62 335,608 0.29
D02 Emollients and Protectives 14,120 0.20 46,781 0.04
D03 Preparations for Treatment of Wounds and Ulcers 550 0.01 67,486 0.06
D04 Antipruritics incl. Antihistamines, Anesthetics, etc. 672 0.01 35,627 0.03
D05 Antipsoriatics 19,454 0.27 1,869,520 1.63
D06 Antibiotics and Chemotherapeutics for Dermatological Use 14,918 0.21 235,245 0.21
D07 Corticosteroids, Dermatological Preparations 69,419 0.96 421,475 0.37
D10 Anti-Acne Preparations 14,089 0.19 243,607 0.21
D11 Other Dermatological Preparations 7,361 0.10 430,748 0.37

Note: The above costs are inclusive of the monthly co-payment of €144 (2016) payable to the Pharmacy by an individual or family.
190
Table 51 DPS: Distribution of Medicines and Appliances by Anatomical Therapeutic Chemical Classifi cation continued
Product CategoryATCClass
PrescribingFrequency
% of Scheme Total
IngredientCost €
% of Scheme Total
G Genito Urinary System and Sex Hormones 299,347 4.16 9,852,934 8.58
G01 Gynecological Antiinfectives and Antiseptics 1,756 0.02 11,778 0.01
G02 Other Gynecologicals 12,095 0.17 1,203,987 1.05
G03 Sex Hormones and Modulators of the Genital System 123,753 1.72 5,001,332 4.35
G04 Urologicals 161,743 2.25 3,635,837 3.17
H Systemic Hormonal Preparations, Excl. Sex Hormones and Insulins 355,490 4.93 1,513,046 1.32
H01 Pituitary and Hypothalamic Hormones and Analogues 2,745 0.04 268,100 0.23
H02 Corticosteroids for Systemic Use 130,829 1.82 800,284 0.70
H03 Thyroid Therapy 221,468 3.07 433,759 0.38
H04 Pancreatic Hormones 448 0.01 10,903 0.01
J Antiinfectives for Systemic Use 317,512 4.41 3,073,974 2.68
J01 Antibacterials for Systemic Use 285,410 3.96 2,126,941 1.85
J02 Antimycotics for Systemic Use 16,068 0.22 212,658 0.19
J04 Antimycobacterials 2,020 0.03 54,179 0.05
J05 Antivirals for Systemic Use 14,014 0.20 680,196 0.59
L Antineoplastic and Immunomodulating Agents 84,464 1.17 2,117,900 1.84
L01 Antineoplastic Agents 6,544 0.09 502,315 0.44
L02 Endocrine Therapy 16,463 0.23 564,666 0.49
L04 Immunosuppressants 61,457 0.85 1,050,919 0.91
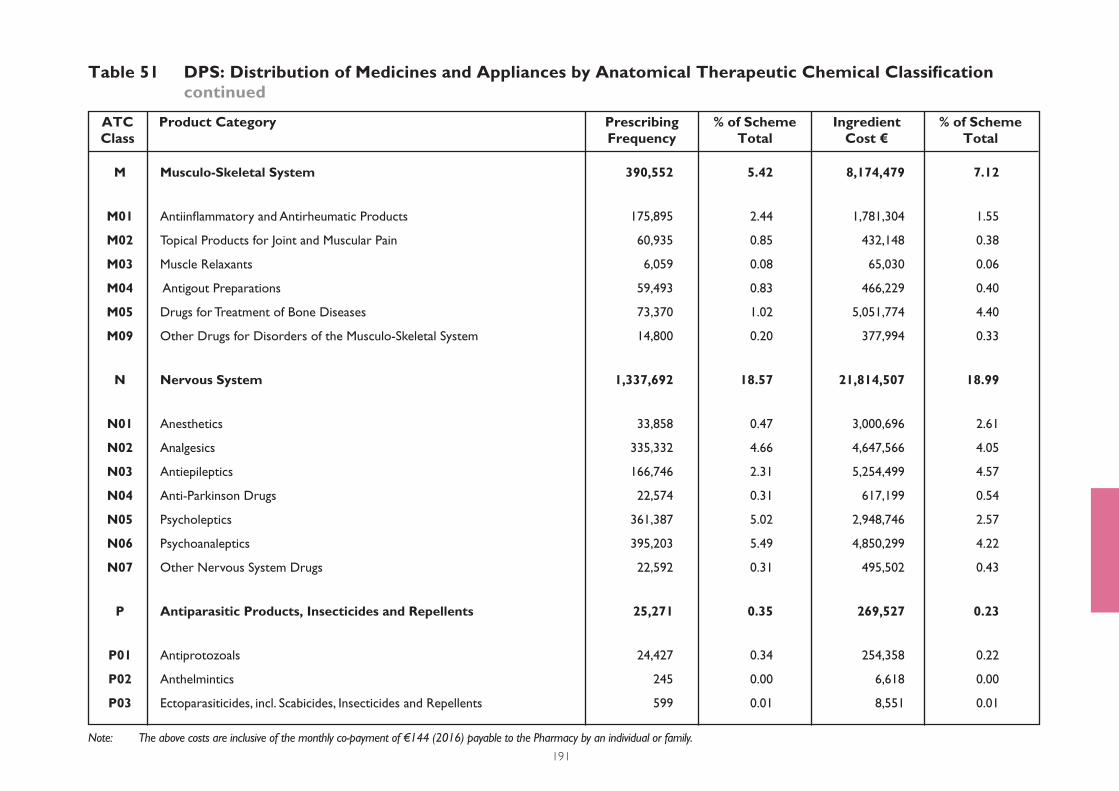
Note: The above costs are inclusive of the monthly co-payment of €144 (2016) payable to the Pharmacy by an individual or family.
191
Table 51 DPS: Distribution of Medicines and Appliances by Anatomical Therapeutic Chemical Classifi cation continued
Product CategoryATCClass
PrescribingFrequency
% of Scheme Total
IngredientCost €
% of Scheme Total
M Musculo-Skeletal System 390,552 5.42 8,174,479 7.12
M01 Antiinfl ammatory and Antirheumatic Products 175,895 2.44 1,781,304 1.55
M02 Topical Products for Joint and Muscular Pain 60,935 0.85 432,148 0.38
M03 Muscle Relaxants 6,059 0.08 65,030 0.06
M04 Antigout Preparations 59,493 0.83 466,229 0.40
M05 Drugs for Treatment of Bone Diseases 73,370 1.02 5,051,774 4.40
M09 Other Drugs for Disorders of the Musculo-Skeletal System 14,800 0.20 377,994 0.33
N Nervous System 1,337,692 18.57 21,814,507 18.99
N01 Anesthetics 33,858 0.47 3,000,696 2.61
N02 Analgesics 335,332 4.66 4,647,566 4.05
N03 Antiepileptics 166,746 2.31 5,254,499 4.57
N04 Anti-Parkinson Drugs 22,574 0.31 617,199 0.54
N05 Psycholeptics 361,387 5.02 2,948,746 2.57
N06 Psychoanaleptics 395,203 5.49 4,850,299 4.22
N07 Other Nervous System Drugs 22,592 0.31 495,502 0.43
P Antiparasitic Products, Insecticides and Repellents 25,271 0.35 269,527 0.23
P01 Antiprotozoals 24,427 0.34 254,358 0.22
P02 Anthelmintics 245 0.00 6,618 0.00
P03 Ectoparasiticides, incl. Scabicides, Insecticides and Repellents 599 0.01 8,551 0.01
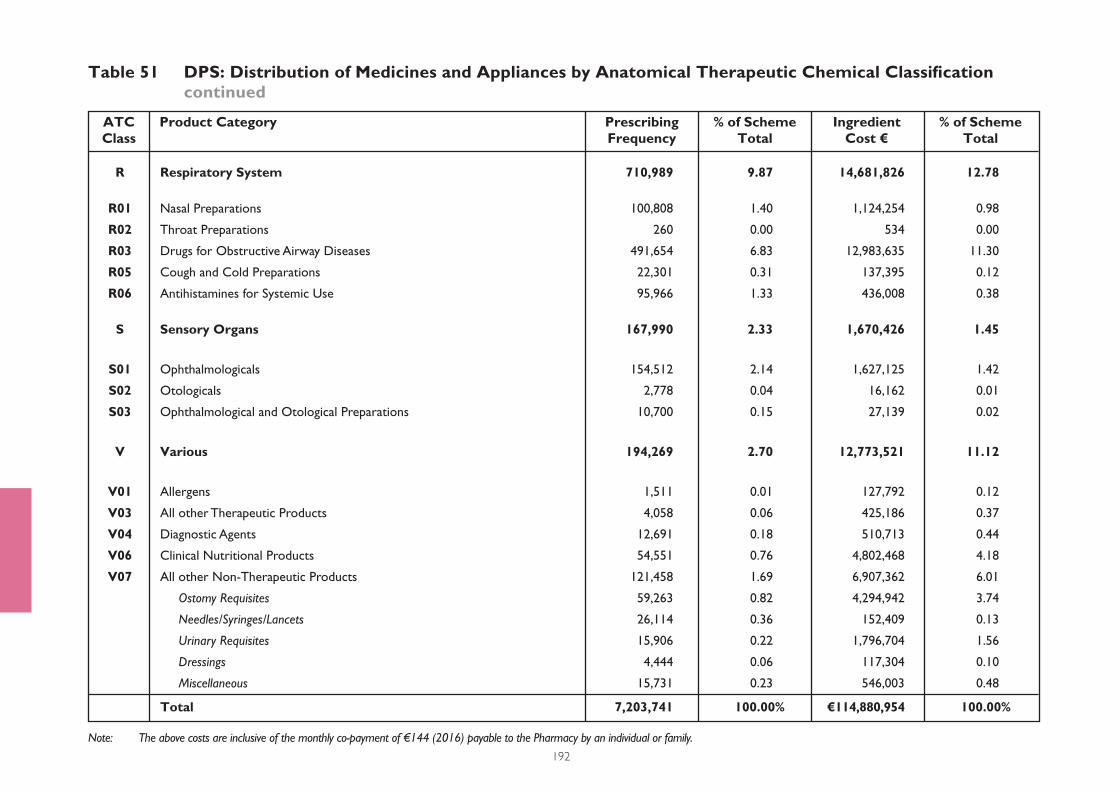
Note: The above costs are inclusive of the monthly co-payment of €144 (2016) payable to the Pharmacy by an individual or family.
192
Table 51 DPS: Distribution of Medicines and Appliances by Anatomical Therapeutic Chemical Classifi cation continued
Product CategoryATCClass
PrescribingFrequency
% of Scheme Total
IngredientCost €
% of Scheme Total
R Respiratory System 710,989 9.87 14,681,826 12.78
R01 Nasal Preparations 100,808 1.40 1,124,254 0.98
R02 Throat Preparations 260 0.00 534 0.00
R03 Drugs for Obstructive Airway Diseases 491,654 6.83 12,983,635 11.30
R05 Cough and Cold Preparations 22,301 0.31 137,395 0.12
R06 Antihistamines for Systemic Use 95,966 1.33 436,008 0.38
S Sensory Organs 167,990 2.33 1,670,426 1.45
S01 Ophthalmologicals 154,512 2.14 1,627,125 1.42
S02 Otologicals 2,778 0.04 16,162 0.01
S03 Ophthalmological and Otological Preparations 10,700 0.15 27,139 0.02
V Various 194,269 2.70 12,773,521 11.12
V01 Allergens 1,511 0.01 127,792 0.12
V03 All other Therapeutic Products 4,058 0.06 425,186 0.37
V04 Diagnostic Agents 12,691 0.18 510,713 0.44
V06 Clinical Nutritional Products 54,551 0.76 4,802,468 4.18
V07 All other Non-Therapeutic Products 121,458 1.69 6,907,362 6.01
Ostomy Requisites 59,263 0.82 4,294,942 3.74
Needles/Syringes/Lancets 26,114 0.36 152,409 0.13
Urinary Requisites 15,906 0.22 1,796,704 1.56
Dressings 4,444 0.06 117,304 0.10
Miscellaneous 15,731 0.23 546,003 0.48
Total 7,203,741 100.00% €114,880,954 100.00%

193
Table 52 LTI: Distribution of Medicines and Appliances by Anatomical Therapeutic Chemical Classifi cation
Product CategoryATCClass
PrescribingFrequency
% of Scheme Total
IngredientCost €
% of Scheme Total
A Alimentary Tract and Metabolism 2,068,620 27.24 57,050,710 36.70
A01 Stomatological Preparations 660 0.01 4,084 0.00
A02 Drugs for Acid Related Disorders 19,585 0.26 239,842 0.16
A03 Drugs for Functional Gastrointestinal Disorders 2,270 0.03 170,932 0.11
A04 Antiemetics and Antinauseants 1,238 0.02 92,355 0.06
A05 Bile and Liver Therapy 837 0.01 27,848 0.02
A06 Drugs for Constipation 16,738 0.22 204,245 0.13
A07 Antidiarrheals, Intestinal Antiinfl ammatory/Antiinfective Agents 844 0.01 28,637 0.02
A09 Digestives, incl. Enzymes 13,667 0.18 1,140,479 0.73
A10 Drugs Used in Diabetes 1,985,231 26.14 54,400,169 34.99
A11 Vitamins 18,606 0.24 485,077 0.31
A12 Mineral Supplements 7,465 0.10 46,868 0.03
A14 Anabolic Agents for Systemic Use 2 0.00 12 0.00
A16 Other Alimentary Tract and Metabolism Products 1,477 0.02 210,162 0.14
B Blood and Blood Forming Organs 775,219 10.21 3,682,763 2.37
B01 Antithrombotic Agents 739,861 9.74 3,594,191 2.31
B02 Antihemorrhagics 1,012 0.01 30,621 0.02
B03 Antianemic Preparations 34,077 0.45 34,604 0.02
B05 Blood Substitutes and Perfusion Solutions 269 0.01 23,347 0.02
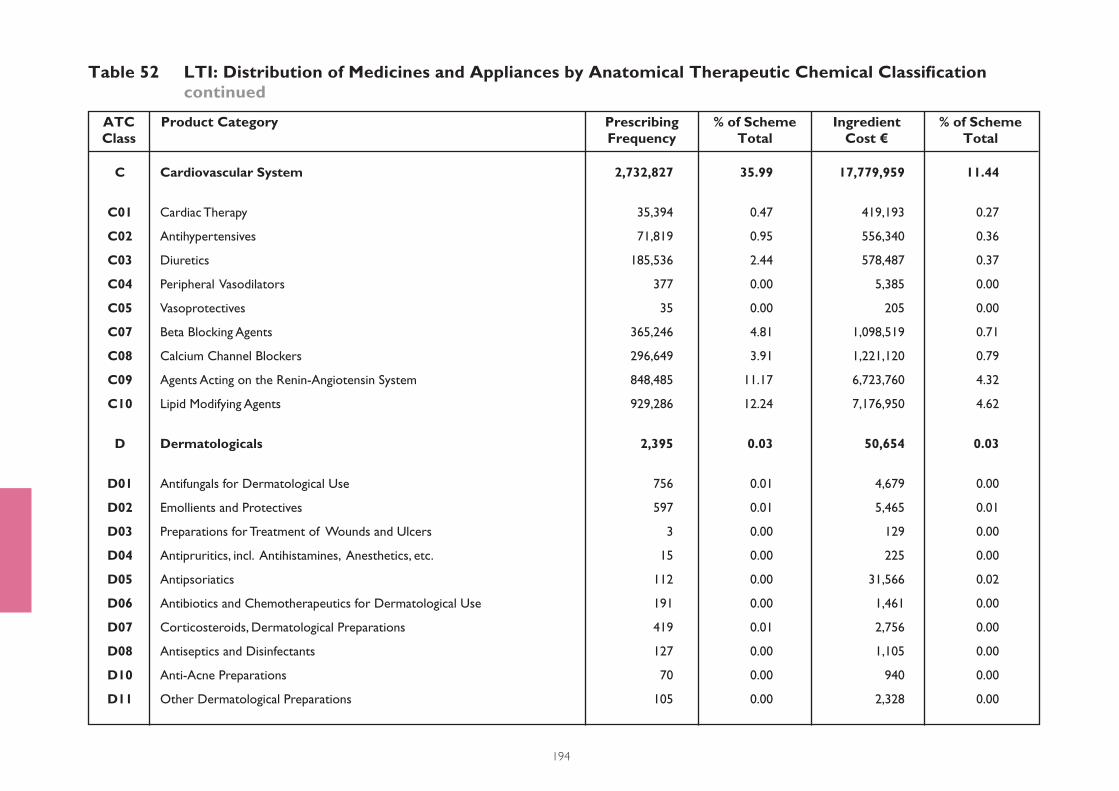
194
Table 52 LTI: Distribution of Medicines and Appliances by Anatomical Therapeutic Chemical Classifi cation continued
Product CategoryATCClass
PrescribingFrequency
% of Scheme Total
IngredientCost €
% of Scheme Total
C Cardiovascular System 2,732,827 35.99 17,779,959 11.44
C01 Cardiac Therapy 35,394 0.47 419,193 0.27
C02 Antihypertensives 71,819 0.95 556,340 0.36
C03 Diuretics 185,536 2.44 578,487 0.37
C04 Peripheral Vasodilators 377 0.00 5,385 0.00
C05 Vasoprotectives 35 0.00 205 0.00
C07 Beta Blocking Agents 365,246 4.81 1,098,519 0.71
C08 Calcium Channel Blockers 296,649 3.91 1,221,120 0.79
C09 Agents Acting on the Renin-Angiotensin System 848,485 11.17 6,723,760 4.32
C10 Lipid Modifying Agents 929,286 12.24 7,176,950 4.62
D Dermatologicals 2,395 0.03 50,654 0.03
D01 Antifungals for Dermatological Use 756 0.01 4,679 0.00
D02 Emollients and Protectives 597 0.01 5,465 0.01
D03 Preparations for Treatment of Wounds and Ulcers 3 0.00 129 0.00
D04 Antipruritics, incl. Antihistamines, Anesthetics, etc. 15 0.00 225 0.00
D05 Antipsoriatics 112 0.00 31,566 0.02
D06 Antibiotics and Chemotherapeutics for Dermatological Use 191 0.00 1,461 0.00
D07 Corticosteroids, Dermatological Preparations 419 0.01 2,756 0.00
D08 Antiseptics and Disinfectants 127 0.00 1,105 0.00
D10 Anti-Acne Preparations 70 0.00 940 0.00
D11 Other Dermatological Preparations 105 0.00 2,328 0.00
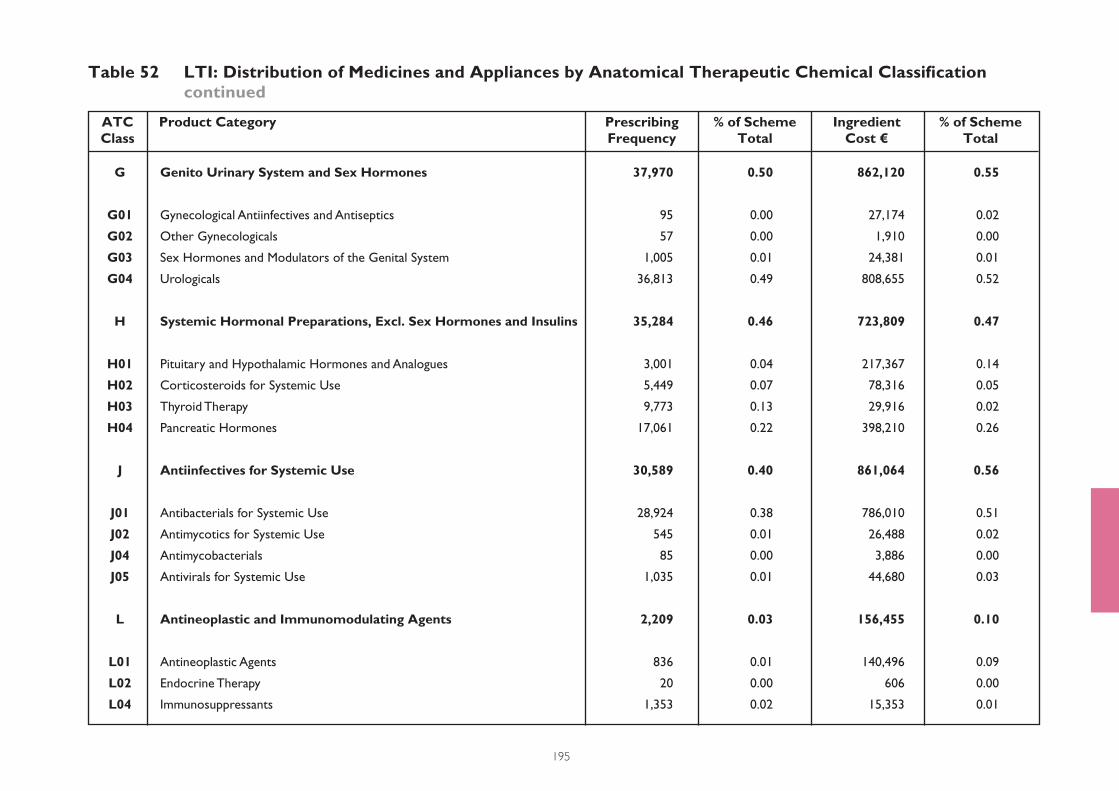
195
Table 52 LTI: Distribution of Medicines and Appliances by Anatomical Therapeutic Chemical Classifi cation continued
Product CategoryATCClass
PrescribingFrequency
% of Scheme Total
IngredientCost €
% of Scheme Total
G Genito Urinary System and Sex Hormones 37,970 0.50 862,120 0.55
G01 Gynecological Antiinfectives and Antiseptics 95 0.00 27,174 0.02
G02 Other Gynecologicals 57 0.00 1,910 0.00
G03 Sex Hormones and Modulators of the Genital System 1,005 0.01 24,381 0.01
G04 Urologicals 36,813 0.49 808,655 0.52
H Systemic Hormonal Preparations, Excl. Sex Hormones and Insulins 35,284 0.46 723,809 0.47
H01 Pituitary and Hypothalamic Hormones and Analogues 3,001 0.04 217,367 0.14
H02 Corticosteroids for Systemic Use 5,449 0.07 78,316 0.05
H03 Thyroid Therapy 9,773 0.13 29,916 0.02
H04 Pancreatic Hormones 17,061 0.22 398,210 0.26
J Antiinfectives for Systemic Use 30,589 0.40 861,064 0.56
J01 Antibacterials for Systemic Use 28,924 0.38 786,010 0.51
J02 Antimycotics for Systemic Use 545 0.01 26,488 0.02
J04 Antimycobacterials 85 0.00 3,886 0.00
J05 Antivirals for Systemic Use 1,035 0.01 44,680 0.03
L Antineoplastic and Immunomodulating Agents 2,209 0.03 156,455 0.10
L01 Antineoplastic Agents 836 0.01 140,496 0.09
L02 Endocrine Therapy 20 0.00 606 0.00
L04 Immunosuppressants 1,353 0.02 15,353 0.01
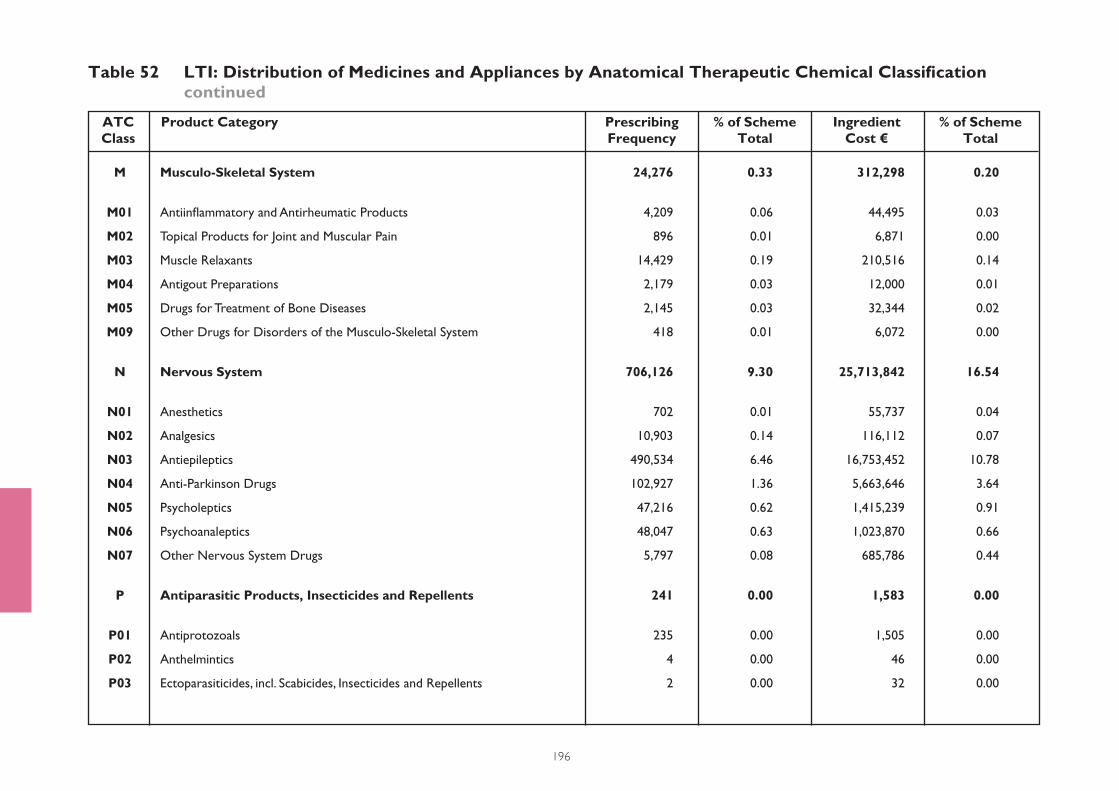
196
Table 52 LTI: Distribution of Medicines and Appliances by Anatomical Therapeutic Chemical Classifi cation continued
Product CategoryATCClass
PrescribingFrequency
% of Scheme Total
IngredientCost €
% of Scheme Total
M Musculo-Skeletal System 24,276 0.33 312,298 0.20
M01 Antiinfl ammatory and Antirheumatic Products 4,209 0.06 44,495 0.03
M02 Topical Products for Joint and Muscular Pain 896 0.01 6,871 0.00
M03 Muscle Relaxants 14,429 0.19 210,516 0.14
M04 Antigout Preparations 2,179 0.03 12,000 0.01
M05 Drugs for Treatment of Bone Diseases 2,145 0.03 32,344 0.02
M09 Other Drugs for Disorders of the Musculo-Skeletal System 418 0.01 6,072 0.00
N Nervous System 706,126 9.30 25,713,842 16.54
N01 Anesthetics 702 0.01 55,737 0.04
N02 Analgesics 10,903 0.14 116,112 0.07
N03 Antiepileptics 490,534 6.46 16,753,452 10.78
N04 Anti-Parkinson Drugs 102,927 1.36 5,663,646 3.64
N05 Psycholeptics 47,216 0.62 1,415,239 0.91
N06 Psychoanaleptics 48,047 0.63 1,023,870 0.66
N07 Other Nervous System Drugs 5,797 0.08 685,786 0.44
P Antiparasitic Products, Insecticides and Repellents 241 0.00 1,583 0.00
P01 Antiprotozoals 235 0.00 1,505 0.00
P02 Anthelmintics 4 0.00 46 0.00
P03 Ectoparasiticides, incl. Scabicides, Insecticides and Repellents 2 0.00 32 0.00
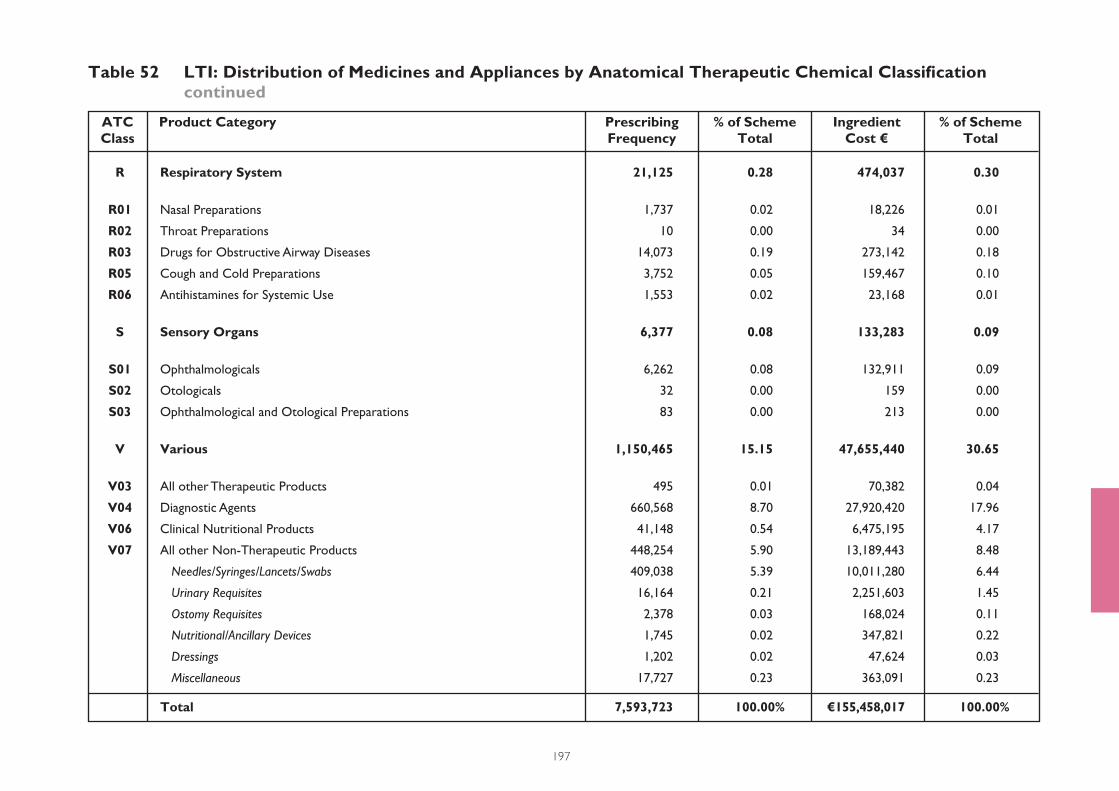
197
Table 52 LTI: Distribution of Medicines and Appliances by Anatomical Therapeutic Chemical Classifi cation continued
Product CategoryATCClass
PrescribingFrequency
% of Scheme Total
IngredientCost €
% of Scheme Total
R Respiratory System 21,125 0.28 474,037 0.30
R01 Nasal Preparations 1,737 0.02 18,226 0.01
R02 Throat Preparations 10 0.00 34 0.00
R03 Drugs for Obstructive Airway Diseases 14,073 0.19 273,142 0.18
R05 Cough and Cold Preparations 3,752 0.05 159,467 0.10
R06 Antihistamines for Systemic Use 1,553 0.02 23,168 0.01
S Sensory Organs 6,377 0.08 133,283 0.09
S01 Ophthalmologicals 6,262 0.08 132,911 0.09
S02 Otologicals 32 0.00 159 0.00
S03 Ophthalmological and Otological Preparations 83 0.00 213 0.00
V Various 1,150,465 15.15 47,655,440 30.65
V03 All other Therapeutic Products 495 0.01 70,382 0.04
V04 Diagnostic Agents 660,568 8.70 27,920,420 17.96
V06 Clinical Nutritional Products 41,148 0.54 6,475,195 4.17
V07 All other Non-Therapeutic Products 448,254 5.90 13,189,443 8.48
Needles/Syringes/Lancets/Swabs 409,038 5.39 10,011,280 6.44
Urinary Requisites 16,164 0.21 2,251,603 1.45
Ostomy Requisites 2,378 0.03 168,024 0.11
Nutritional/Ancillary Devices 1,745 0.02 347,821 0.22
Dressings 1,202 0.02 47,624 0.03
Miscellaneous 17,727 0.23 363,091 0.23
Total 7,593,723 100.00% €155,458,017 100.00%
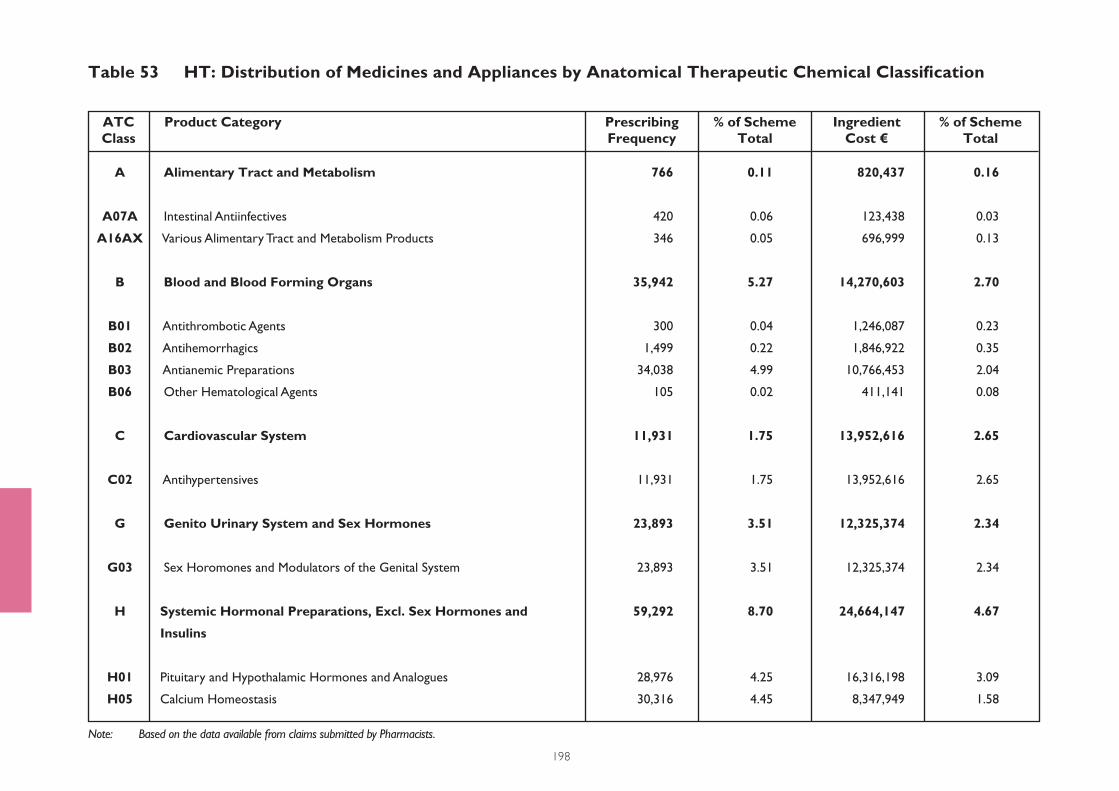
Note: Based on the data available from claims submitted by Pharmacists.
198
Table 53 HT: Distribution of Medicines and Appliances by Anatomical Therapeutic Chemical Classifi cation
Product CategoryATCClass
PrescribingFrequency
% of Scheme Total
IngredientCost €
% of Scheme Total
A Alimentary Tract and Metabolism 766 0.11 820,437 0.16
A07A Intestinal Antiinfectives 420 0.06 123,438 0.03
A16AX Various Alimentary Tract and Metabolism Products 346 0.05 696,999 0.13
B Blood and Blood Forming Organs 35,942 5.27 14,270,603 2.70
B01 Antithrombotic Agents 300 0.04 1,246,087 0.23
B02 Antihemorrhagics 1,499 0.22 1,846,922 0.35
B03 Antianemic Preparations 34,038 4.99 10,766,453 2.04
B06 Other Hematological Agents 105 0.02 411,141 0.08
C Cardiovascular System 11,931 1.75 13,952,616 2.65
C02 Antihypertensives 11,931 1.75 13,952,616 2.65
G Genito Urinary System and Sex Hormones 23,893 3.51 12,325,374 2.34
G03 Sex Horomones and Modulators of the Genital System 23,893 3.51 12,325,374 2.34
H Systemic Hormonal Preparations, Excl. Sex Hormones and 59,292 8.70 24,664,147 4.67
Insulins
H01 Pituitary and Hypothalamic Hormones and Analogues 28,976 4.25 16,316,198 3.09
H05 Calcium Homeostasis 30,316 4.45 8,347,949 1.58
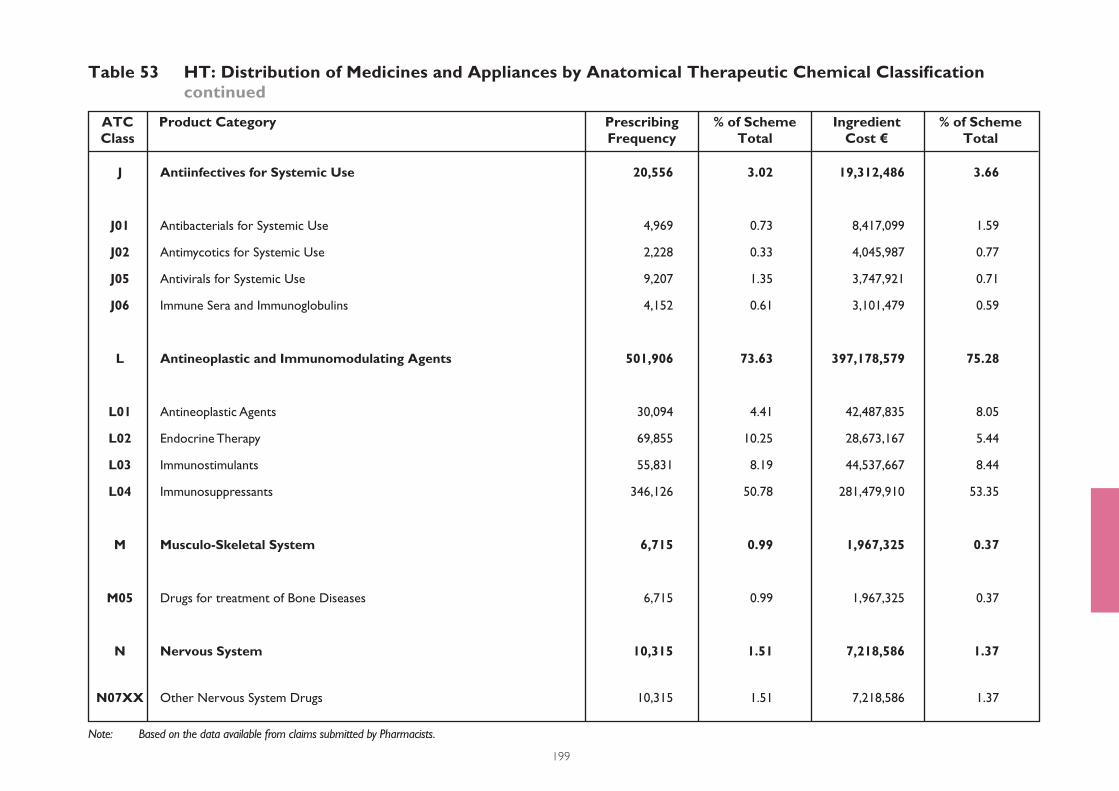
Note: Based on the data available from claims submitted by Pharmacists.
199
Table 53 HT: Distribution of Medicines and Appliances by Anatomical Therapeutic Chemical Classifi cation continued
Product CategoryATCClass
PrescribingFrequency
% of Scheme Total
IngredientCost €
% of Scheme Total
J Antiinfectives for Systemic Use 20,556 3.02 19,312,486 3.66
J01 Antibacterials for Systemic Use 4,969 0.73 8,417,099 1.59
J02 Antimycotics for Systemic Use 2,228 0.33 4,045,987 0.77
J05 Antivirals for Systemic Use 9,207 1.35 3,747,921 0.71
J06 Immune Sera and Immunoglobulins 4,152 0.61 3,101,479 0.59
L Antineoplastic and Immunomodulating Agents 501,906 73.63 397,178,579 75.28
L01 Antineoplastic Agents 30,094 4.41 42,487,835 8.05
L02 Endocrine Therapy 69,855 10.25 28,673,167 5.44
L03 Immunostimulants 55,831 8.19 44,537,667 8.44
L04 Immunosuppressants 346,126 50.78 281,479,910 53.35
M Musculo-Skeletal System 6,715 0.99 1,967,325 0.37
M05 Drugs for treatment of Bone Diseases 6,715 0.99 1,967,325 0.37
N Nervous System 10,315 1.51 7,218,586 1.37
N07XX Other Nervous System Drugs 10,315 1.51 7,218,586 1.37

Note: Based on the data available from claims submitted by Pharmacists.
200
Table 53 HT: Distribution of Medicines and Appliances by Anatomical Therapeutic Chemical Classifi cation continued
Product CategoryATCClass
PrescribingFrequency
% of Scheme Total
IngredientCost €
% of Scheme Total
R Respiratory System 8,385 1.23 34,455,039 6.53
R05CB Mucolytics 6,405 0.94 4,578,254 0.87
R07AX Other Respiratory System Products 1,980 0.29 29,876,785 5.66
V Various 1,930 0.28 1,444,061 0.27
V03AC Iron Chelating Agents 1,930 0.28 1,444,061 0.27
Total 681,631 100.00% €527,609,253 100.00%

S E C T I O N
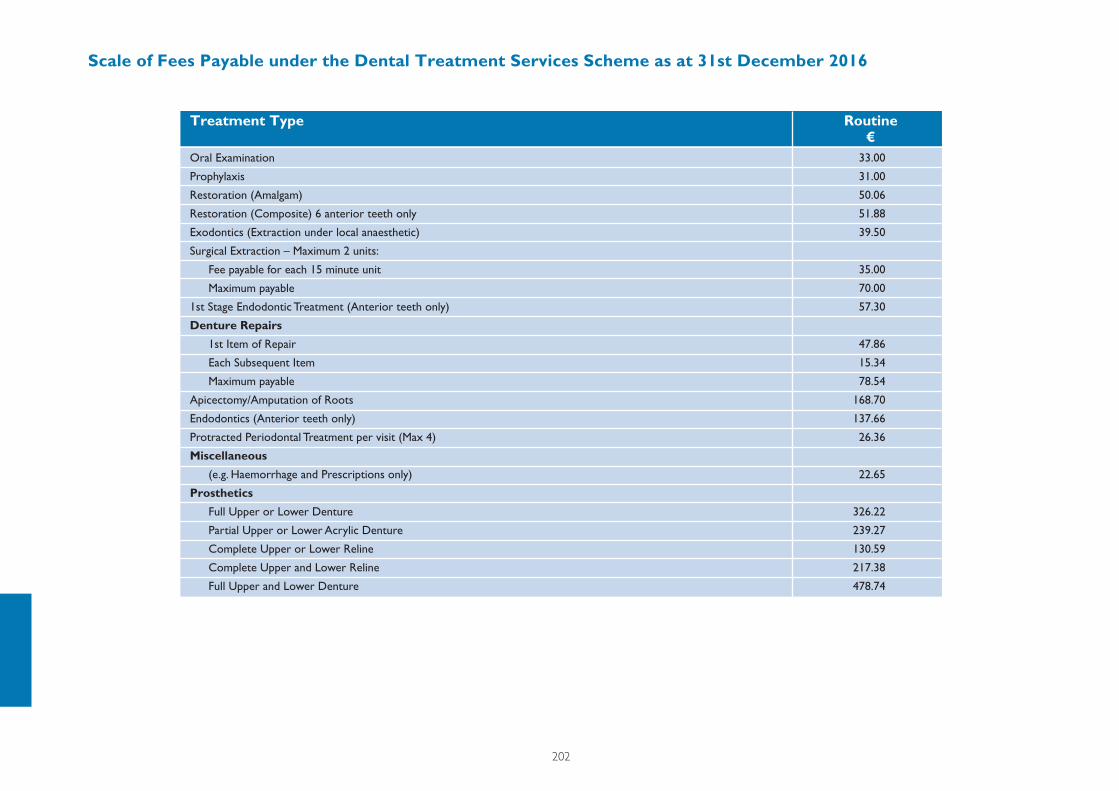
202
Scale of Fees Payable under the Dental Treatment Services Scheme as at 31st December 2016
Oral Examination 33.00
Prophylaxis 31.00
Restoration (Amalgam) 50.06
Restoration (Composite) 6 anterior teeth only 51.88
Exodontics (Extraction under local anaesthetic) 39.50
Surgical Extraction – Maximum 2 units:
Fee payable for each 15 minute unit 35.00
Maximum payable 70.00
1st Stage Endodontic Treatment (Anterior teeth only) 57.30
Denture Repairs
1st Item of Repair 47.86
Each Subsequent Item 15.34
Maximum payable 78.54
Apicectomy/Amputation of Roots 168.70
Endodontics (Anterior teeth only) 137.66
Protracted Periodontal Treatment per visit (Max 4) 26.36
Miscellaneous
(e.g. Haemorrhage and Prescriptions only) 22.65
Prosthetics
Full Upper or Lower Denture 326.22
Partial Upper or Lower Acrylic Denture 239.27
Complete Upper or Lower Reline 130.59
Complete Upper and Lower Reline 217.38
Full Upper and Lower Denture 478.74
Treatment Type Routine €

203
Note: Dentists were also reimbursed total fees of €66,228, (€70,706 in 2015) in respect of Health (Amendment) Act 1996.
Dentists were reimbursed a total of €64,327,033 in 2016, in respect of treatments provided for more than 416,662 GMS persons under the DTS Scheme.
The following treatments were available to all GMS eligible persons.
ROUTINE: Routine treatments are categorised as either ‘Above the Line’ or ‘Below the Line’;
‘Above the Line’ treatments are uncomplicated procedures e.g. Amalgam (Filling); Extractions;
‘Below the Line’ treatments are advanced procedures e.g. Protracted Periodontal; Prosthetics.
‘Below the Line’ treatments – prior Health Service Executive approval for a specifi c course of treatment under this category is required. Full denture treatment is available, with prior Health Service Executive approval, to all eligible GMS persons over 16 years.
Above the Line €46.63m Below the Line €17.70m
Payments to Dentists: Claims Reimbursed 2016
Payments to Dentists: Claims Reimbursed in each CHO
CHO Area 1 €6,958,388
CHO Area 2 €6,502,463
CHO Area 3 €5,561,118
CHO Area 4 €10,341,764
CHO Area 5 €9,078,773
CHO Area 6 €3,240,189
CHO Area 7 €7,766,671
CHO Area 8 €8,579,057
CHO Area 9 €6,298,610
National €64,327,033
Corresponding fi gure for 2015 €66,434,810
Community Healthcare Organisation 2016
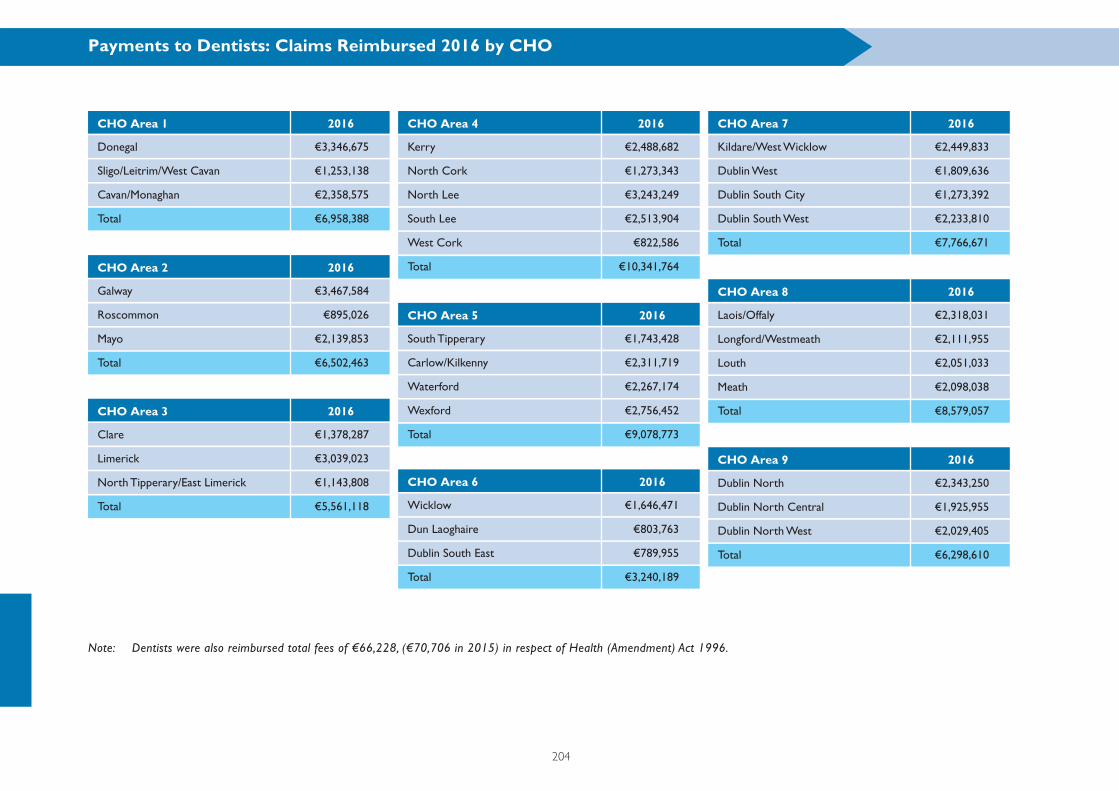
204
South Tipperary €1,743,428
Carlow/Kilkenny €2,311,719
Waterford €2,267,174
Wexford €2,756,452
Total €9,078,773
Wicklow €1,646,471
Dun Laoghaire €803,763
Dublin South East €789,955
Total €3,240,189
CHO Area 5 2016
CHO Area 6 2016
Note: Dentists were also reimbursed total fees of €66,228, (€70,706 in 2015) in respect of Health (Amendment) Act 1996.
Payments to Dentists: Claims Reimbursed 2016 by CHO
Donegal €3,346,675
Sligo/Leitrim/West Cavan €1,253,138
Cavan/Monaghan €2,358,575
Total €6,958,388
Galway €3,467,584
Roscommon €895,026
Mayo €2,139,853
Total €6,502,463
Clare €1,378,287
Limerick €3,039,023
North Tipperary/East Limerick €1,143,808
Total €5,561,118
Kerry €2,488,682
North Cork €1,273,343
North Lee €3,243,249
South Lee €2,513,904
West Cork €822,586
Total €10,341,764
Kildare/West Wicklow €2,449,833
Dublin West €1,809,636
Dublin South City €1,273,392
Dublin South West €2,233,810
Total €7,766,671
Laois/Offaly €2,318,031
Longford/Westmeath €2,111,955
Louth €2,051,033
Meath €2,098,038
Total €8,579,057
Dublin North €2,343,250
Dublin North Central €1,925,955
Dublin North West €2,029,405
Total €6,298,610
CHO Area 1 2016
CHO Area 2 2016
CHO Area 3 2016
CHO Area 4 2016 CHO Area 7 2016
CHO Area 8 2016
CHO Area 9 2016

205
National – Number of Treatments Claimed 2016
Number and Value of Dental Treatments Claimed by CHO
Number of Dental Treatments Claimed 2016
ROUTINE – Routine treatments are categorised as either ‘Above the Line’ or ‘Below the Line’: ‘Above the Line’ (ATL) treatments are uncomplicated procedures; ‘Below the Line’ (BTL) treatments are advanced procedures.
* The most frequently used ATL service was Oral Examination, which was used by 391,727 patients followed by Amalgam Restoration.
** In the BTL category the most frequently used service was Prosthetics followed by Protracted Periodontal and Endodontics.
*** This fi gure is the number of unique GMS persons treated.
CHO Area 1 117,139 7,284 43,861 €6,958,388
CHO Area 2 122,901 5,985 46,589 €6,502,463
CHO Area 3 99,647 5,732 35,180 €5,561,118
CHO Area 4 188,071 10,016 66,990 €10,341,764
CHO Area 5 160,561 9,867 56,715 €9,078,773
CHO Area 6 57,056 2,949 21,360 €3,240,189
CHO Area 7 137,700 7,729 50,456 €7,766,671
CHO Area 8 153,931 8,314 55,657 €8,579,057
CHO Area 9 114,556 5,604 39,854 €6,298,610
National 1,151,562 63,480 416,662 €64,327,033
Corresponding fi gures for 2015 1,186,342 64,583 420,459 €66,434,810
Community Healthcare *Above the **Below the ***No. of Persons Value ofOrganisation Line Line Treated Reimbursements
Above the line 1,151,562
Below the line 63,480
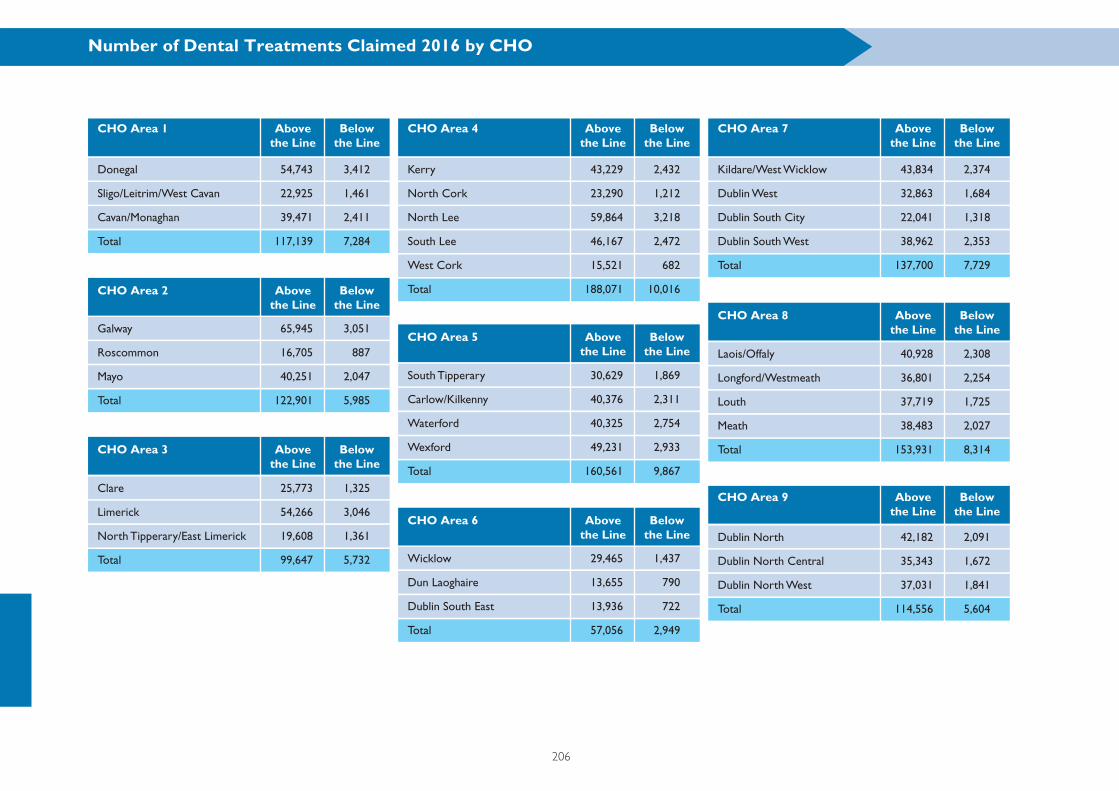
206
South Tipperary 30,629 1,869
Carlow/Kilkenny 40,376 2,311
Waterford 40,325 2,754
Wexford 49,231 2,933
Total 160,561 9,867
Wicklow 29,465 1,437
Dun Laoghaire 13,655 790
Dublin South East 13,936 722
Total 57,056 2,949
CHO Area 5
CHO Area 6
Number of Dental Treatments Claimed 2016 by CHO
Donegal 54,743 3,412
Sligo/Leitrim/West Cavan 22,925 1,461
Cavan/Monaghan 39,471 2,411
Total 117,139 7,284
Galway 65,945 3,051
Roscommon 16,705 887
Mayo 40,251 2,047
Total 122,901 5,985
Clare 25,773 1,325
Limerick 54,266 3,046
North Tipperary/East Limerick 19,608 1,361
Total 99,647 5,732
Kerry 43,229 2,432
North Cork 23,290 1,212
North Lee 59,864 3,218
South Lee 46,167 2,472
West Cork 15,521 682
Total 188,071 10,016
Kildare/West Wicklow 43,834 2,374
Dublin West 32,863 1,684
Dublin South City 22,041 1,318
Dublin South West 38,962 2,353
Total 137,700 7,729
Laois/Offaly 40,928 2,308
Longford/Westmeath 36,801 2,254
Louth 37,719 1,725
Meath 38,483 2,027
Total 153,931 8,314
Dublin North 42,182 2,091
Dublin North Central 35,343 1,672
Dublin North West 37,031 1,841
Total 114,556 5,604
CHO Area 1 Abovethe Line
Abovethe Line
Abovethe Line
Abovethe Line
Abovethe Line
Abovethe Line
Abovethe Line
Abovethe Line
Abovethe Line
Belowthe Line
Belowthe Line
Belowthe Line
Belowthe Line
Belowthe Line
Belowthe Line
Belowthe Line
Belowthe Line
Belowthe Line
CHO Area 2
CHO Area 3
CHO Area 4 CHO Area 7
CHO Area 8
CHO Area 9
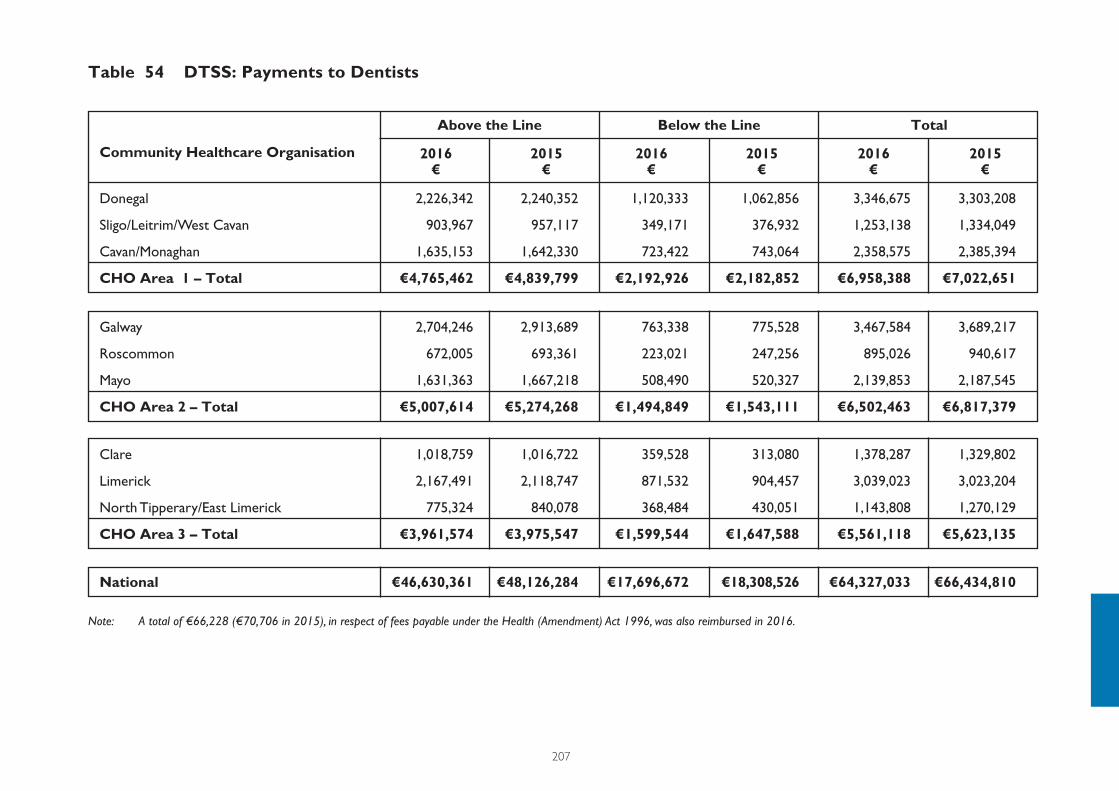
207
Note: A total of €66,228 (€70,706 in 2015), in respect of fees payable under the Health (Amendment) Act 1996, was also reimbursed in 2016.
2016 2015 2016 2015 2016 2015 € € € € € €
Donegal 2,226,342 2,240,352 1,120,333 1,062,856 3,346,675 3,303,208
Sligo/Leitrim/West Cavan 903,967 957,117 349,171 376,932 1,253,138 1,334,049
Cavan/Monaghan 1,635,153 1,642,330 723,422 743,064 2,358,575 2,385,394
CHO Area 1 – Total €4,765,462 €4,839,799 €2,192,926 €2,182,852 €6,958,388 €7,022,651
Galway 2,704,246 2,913,689 763,338 775,528 3,467,584 3,689,217
Roscommon 672,005 693,361 223,021 247,256 895,026 940,617
Mayo 1,631,363 1,667,218 508,490 520,327 2,139,853 2,187,545
CHO Area 2 – Total €5,007,614 €5,274,268 €1,494,849 €1,543,111 €6,502,463 €6,817,379
Clare 1,018,759 1,016,722 359,528 313,080 1,378,287 1,329,802
Limerick 2,167,491 2,118,747 871,532 904,457 3,039,023 3,023,204
North Tipperary/East Limerick 775,324 840,078 368,484 430,051 1,143,808 1,270,129
CHO Area 3 – Total €3,961,574 €3,975,547 €1,599,544 €1,647,588 €5,561,118 €5,623,135
National €46,630,361 €48,126,284 €17,696,672 €18,308,526 €64,327,033 €66,434,810
Community Healthcare Organisation
Above the Line Below the Line Total
Table 54 DTSS: Payments to Dentists
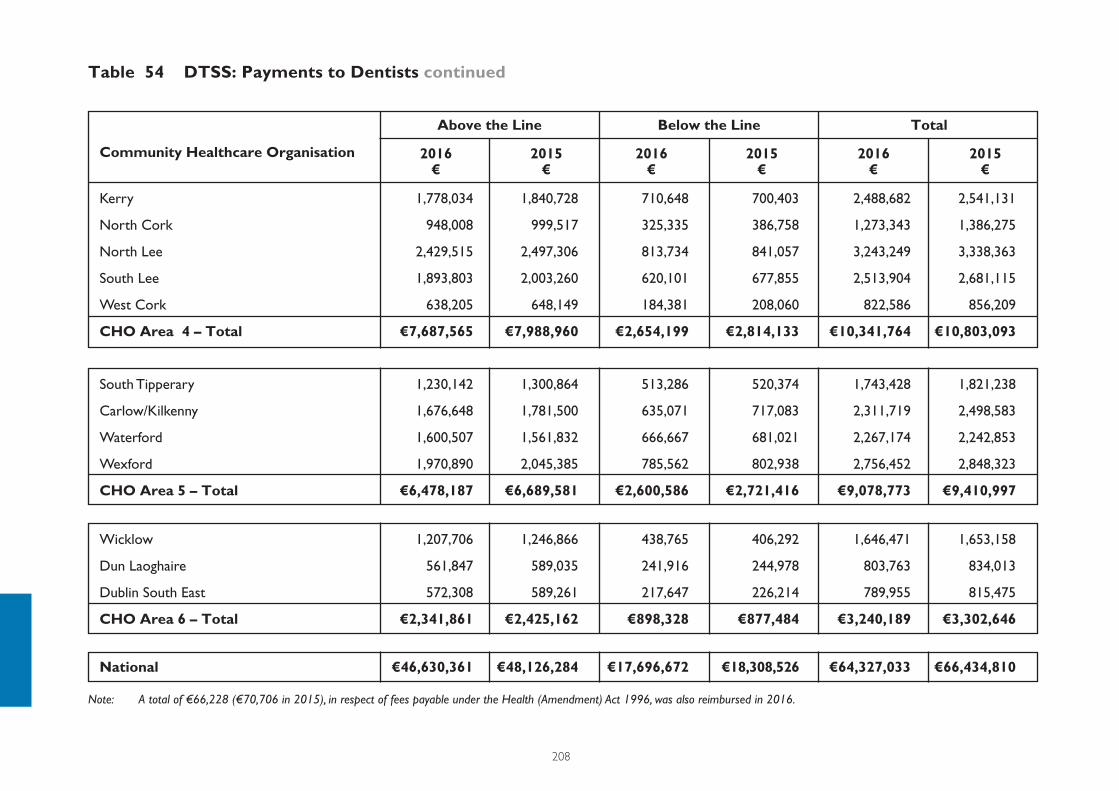
208
Note: A total of €66,228 (€70,706 in 2015), in respect of fees payable under the Health (Amendment) Act 1996, was also reimbursed in 2016.
2016 2015 2016 2015 2016 2015 € € € € € €
Kerry 1,778,034 1,840,728 710,648 700,403 2,488,682 2,541,131
North Cork 948,008 999,517 325,335 386,758 1,273,343 1,386,275
North Lee 2,429,515 2,497,306 813,734 841,057 3,243,249 3,338,363
South Lee 1,893,803 2,003,260 620,101 677,855 2,513,904 2,681,115
West Cork 638,205 648,149 184,381 208,060 822,586 856,209
CHO Area 4 – Total €7,687,565 €7,988,960 €2,654,199 €2,814,133 €10,341,764 €10,803,093
South Tipperary 1,230,142 1,300,864 513,286 520,374 1,743,428 1,821,238
Carlow/Kilkenny 1,676,648 1,781,500 635,071 717,083 2,311,719 2,498,583
Waterford 1,600,507 1,561,832 666,667 681,021 2,267,174 2,242,853
Wexford 1,970,890 2,045,385 785,562 802,938 2,756,452 2,848,323
CHO Area 5 – Total €6,478,187 €6,689,581 €2,600,586 €2,721,416 €9,078,773 €9,410,997
Wicklow 1,207,706 1,246,866 438,765 406,292 1,646,471 1,653,158
Dun Laoghaire 561,847 589,035 241,916 244,978 803,763 834,013
Dublin South East 572,308 589,261 217,647 226,214 789,955 815,475
CHO Area 6 – Total €2,341,861 €2,425,162 €898,328 €877,484 €3,240,189 €3,302,646
National €46,630,361 €48,126,284 €17,696,672 €18,308,526 €64,327,033 €66,434,810
Community Healthcare Organisation
Above the Line Below the Line Total
Table 54 DTSS: Payments to Dentists continued
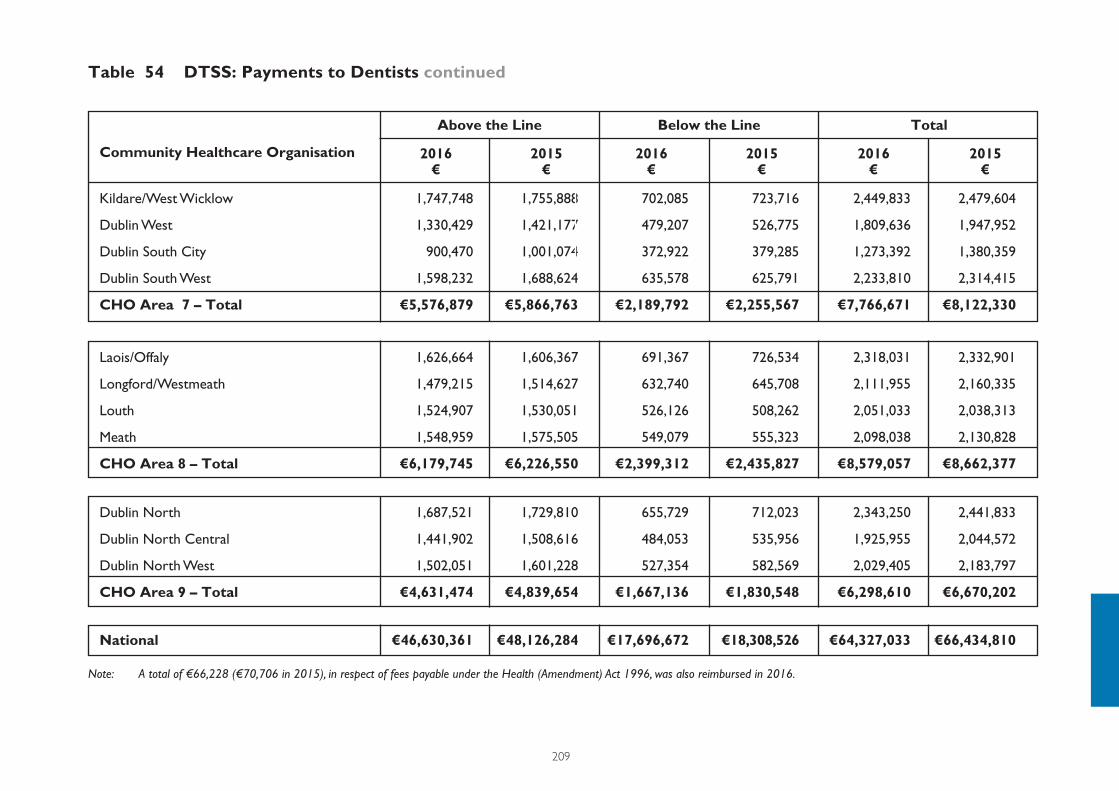
209
2016 2015 2016 2015 2016 2015 € € € € € €
Kildare/West Wicklow 1,747,748 1,755,888 702,085 723,716 2,449,833 2,479,604
Dublin West 1,330,429 1,421,177 479,207 526,775 1,809,636 1,947,952
Dublin South City 900,470 1,001,074 372,922 379,285 1,273,392 1,380,359
Dublin South West 1,598,232 1,688,624 635,578 625,791 2,233,810 2,314,415
CHO Area 7 – Total €5,576,879 €5,866,763 €2,189,792 €2,255,567 €7,766,671 €8,122,330
Laois/Offaly 1,626,664 1,606,367 691,367 726,534 2,318,031 2,332,901
Longford/Westmeath 1,479,215 1,514,627 632,740 645,708 2,111,955 2,160,335
Louth 1,524,907 1,530,051 526,126 508,262 2,051,033 2,038,313
Meath 1,548,959 1,575,505 549,079 555,323 2,098,038 2,130,828
CHO Area 8 – Total €6,179,745 €6,226,550 €2,399,312 €2,435,827 €8,579,057 €8,662,377
Dublin North 1,687,521 1,729,810 655,729 712,023 2,343,250 2,441,833
Dublin North Central 1,441,902 1,508,616 484,053 535,956 1,925,955 2,044,572
Dublin North West 1,502,051 1,601,228 527,354 582,569 2,029,405 2,183,797
CHO Area 9 – Total €4,631,474 €4,839,654 €1,667,136 €1,830,548 €6,298,610 €6,670,202
National €46,630,361 €48,126,284 €17,696,672 €18,308,526 €64,327,033 €66,434,810
Community Healthcare Organisation
Above the Line Below the Line Total
Note: A total of €66,228 (€70,706 in 2015), in respect of fees payable under the Health (Amendment) Act 1996, was also reimbursed in 2016.
Table 54 DTSS: Payments to Dentists continued
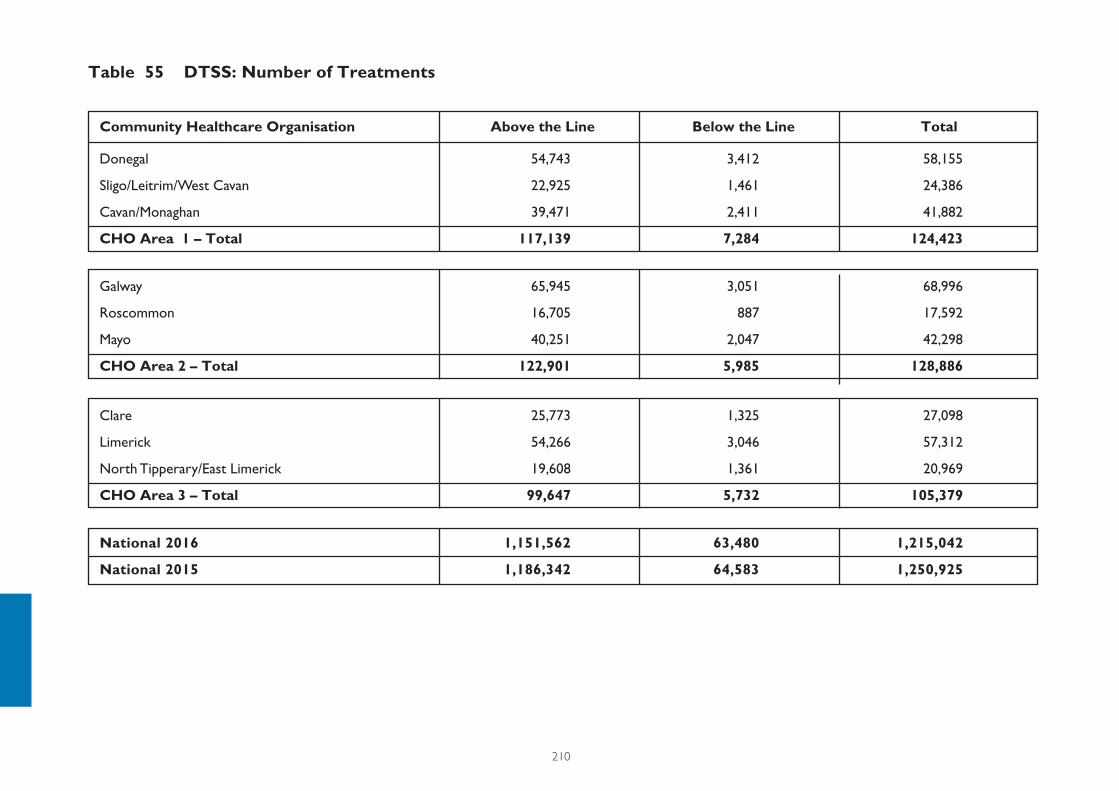
210
Donegal 54,743 3,412 58,155
Sligo/Leitrim/West Cavan 22,925 1,461 24,386
Cavan/Monaghan 39,471 2,411 41,882
CHO Area 1 – Total 117,139 7,284 124,423
Galway 65,945 3,051 68,996
Roscommon 16,705 887 17,592
Mayo 40,251 2,047 42,298
CHO Area 2 – Total 122,901 5,985 128,886
Clare 25,773 1,325 27,098
Limerick 54,266 3,046 57,312
North Tipperary/East Limerick 19,608 1,361 20,969
CHO Area 3 – Total 99,647 5,732 105,379
National 2016 1,151,562 63,480 1,215,042
National 2015 1,186,342 64,583 1,250,925
Community Healthcare Organisation Above the Line Below the Line Total
Table 55 DTSS: Number of Treatments
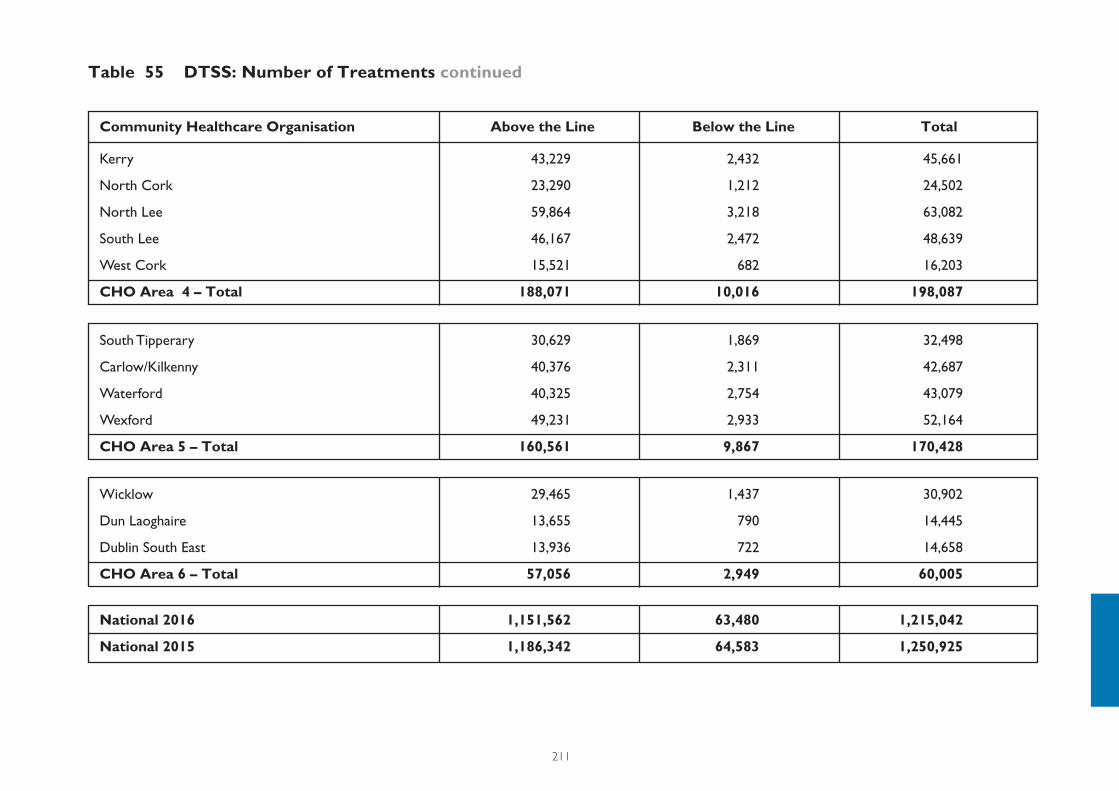
211
Kerry 43,229 2,432 45,661
North Cork 23,290 1,212 24,502
North Lee 59,864 3,218 63,082
South Lee 46,167 2,472 48,639
West Cork 15,521 682 16,203
CHO Area 4 – Total 188,071 10,016 198,087
South Tipperary 30,629 1,869 32,498
Carlow/Kilkenny 40,376 2,311 42,687
Waterford 40,325 2,754 43,079
Wexford 49,231 2,933 52,164
CHO Area 5 – Total 160,561 9,867 170,428
National 2016 1,151,562 63,480 1,215,042
National 2015 1,186,342 64,583 1,250,925
Community Healthcare Organisation Above the Line Below the Line Total
Table 55 DTSS: Number of Treatments continued
Wicklow 29,465 1,437 30,902
Dun Laoghaire 13,655 790 14,445
Dublin South East 13,936 722 14,658
CHO Area 6 – Total 57,056 2,949 60,005
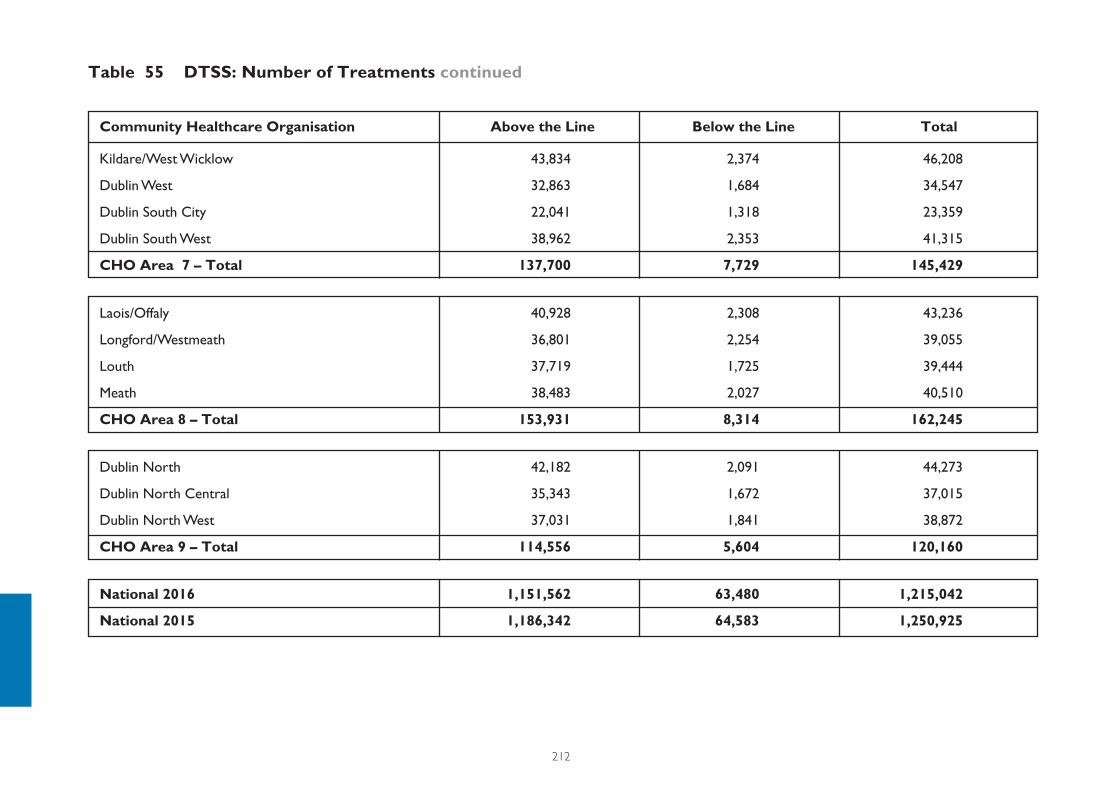
212
Kildare/West Wicklow 43,834 2,374 46,208
Dublin West 32,863 1,684 34,547
Dublin South City 22,041 1,318 23,359
Dublin South West 38,962 2,353 41,315
CHO Area 7 – Total 137,700 7,729 145,429
Laois/Offaly 40,928 2,308 43,236
Longford/Westmeath 36,801 2,254 39,055
Louth 37,719 1,725 39,444
Meath 38,483 2,027 40,510
CHO Area 8 – Total 153,931 8,314 162,245
National 2016 1,151,562 63,480 1,215,042
National 2015 1,186,342 64,583 1,250,925
Community Healthcare Organisation Above the Line Below the Line Total
Dublin North 42,182 2,091 44,273
Dublin North Central 35,343 1,672 37,015
Dublin North West 37,031 1,841 38,872
CHO Area 9 – Total 114,556 5,604 120,160
Table 55 DTSS: Number of Treatments continued
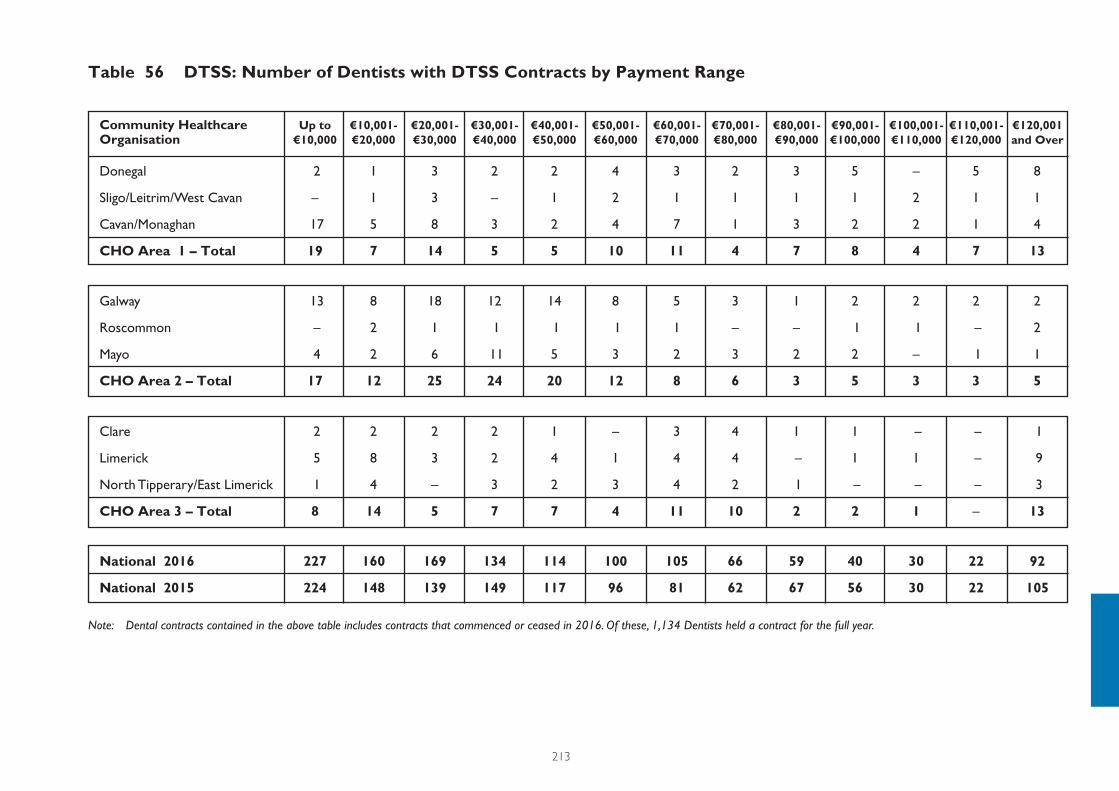
213
Note: Dental contracts contained in the above table includes contracts that commenced or ceased in 2016. Of these, 1,134 Dentists held a contract for the full year.
Donegal 2 1 3 2 2 4 3 2 3 5 – 5 8
Sligo/Leitrim/West Cavan – 1 3 – 1 2 1 1 1 1 2 1 1
Cavan/Monaghan 17 5 8 3 2 4 7 1 3 2 2 1 4
CHO Area 1 – Total 19 7 14 5 5 10 11 4 7 8 4 7 13
National 2016 227 160 169 134 114 100 105 66 59 40 30 22 92
National 2015 224 148 139 149 117 96 81 62 67 56 30 22 105
Clare 2 2 2 2 1 – 3 4 1 1 – – 1
Limerick 5 8 3 2 4 1 4 4 – 1 1 – 9
North Tipperary/East Limerick 1 4 – 3 2 3 4 2 1 – – – 3
CHO Area 3 – Total 8 14 5 7 7 4 11 10 2 2 1 – 13
Galway 13 8 18 12 14 8 5 3 1 2 2 2 2
Roscommon – 2 1 1 1 1 1 – – 1 1 – 2
Mayo 4 2 6 11 5 3 2 3 2 2 – 1 1
CHO Area 2 – Total 17 12 25 24 20 12 8 6 3 5 3 3 5
Community Healthcare Up to €10,001- €20,001- €30,001- €40,001- €50,001- €60,001- €70,001- €80,001- €90,001- €100,001- €110,001- €120,001 Organisation €10,000 €20,000 €30,000 €40,000 €50,000 €60,000 €70,000 €80,000 €90,000 €100,000 €110,000 €120,000 and Over
Table 56 DTSS: Number of Dentists with DTSS Contracts by Payment Range
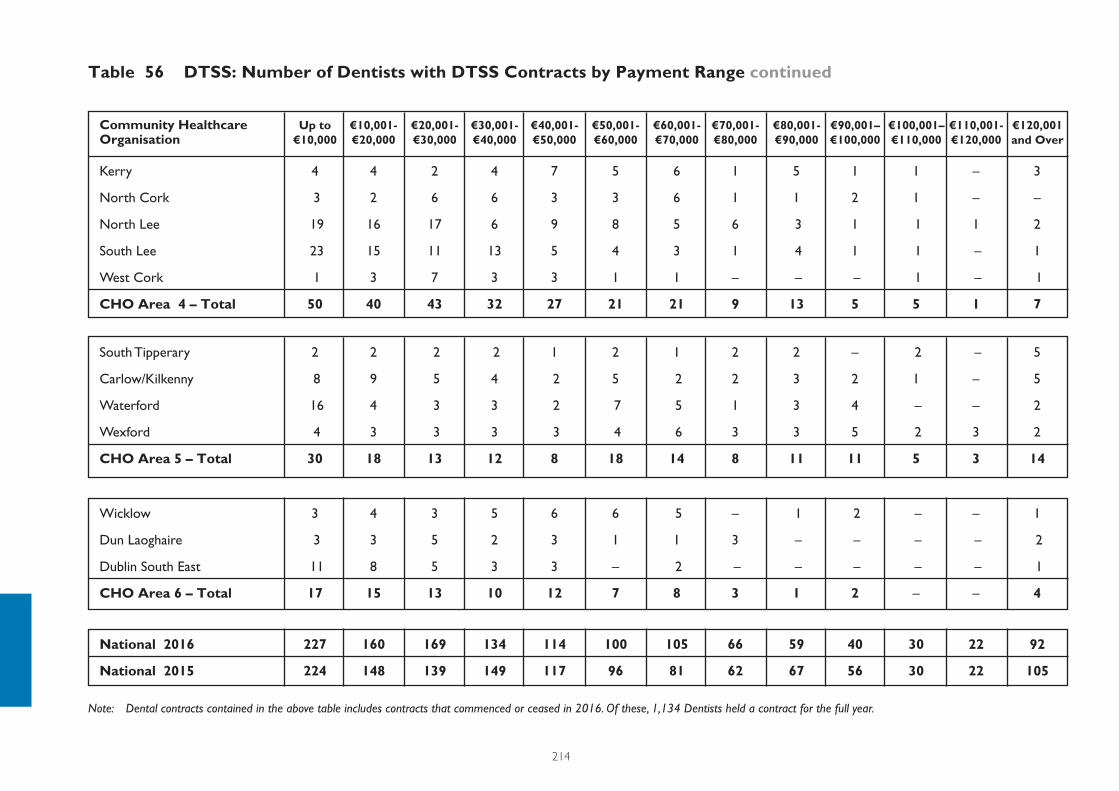
214
Note: Dental contracts contained in the above table includes contracts that commenced or ceased in 2016. Of these, 1,134 Dentists held a contract for the full year.
Kerry 4 4 2 4 7 5 6 1 5 1 1 – 3
North Cork 3 2 6 6 3 3 6 1 1 2 1 – –
North Lee 19 16 17 6 9 8 5 6 3 1 1 1 2
South Lee 23 15 11 13 5 4 3 1 4 1 1 – 1
West Cork 1 3 7 3 3 1 1 – – – 1 – 1
CHO Area 4 – Total 50 40 43 32 27 21 21 9 13 5 5 1 7
National 2016 227 160 169 134 114 100 105 66 59 40 30 22 92
National 2015 224 148 139 149 117 96 81 62 67 56 30 22 105
Wicklow 3 4 3 5 6 6 5 – 1 2 – – 1
Dun Laoghaire 3 3 5 2 3 1 1 3 – – – – 2
Dublin South East 11 8 5 3 3 – 2 – – – – – 1
CHO Area 6 – Total 17 15 13 10 12 7 8 3 1 2 – – 4
South Tipperary 2 2 2 2 1 2 1 2 2 – 2 – 5
Carlow/Kilkenny 8 9 5 4 2 5 2 2 3 2 1 – 5
Waterford 16 4 3 3 2 7 5 1 3 4 – – 2
Wexford 4 3 3 3 3 4 6 3 3 5 2 3 2
CHO Area 5 – Total 30 18 13 12 8 18 14 8 11 11 5 3 14
Community Healthcare Up to €10,001- €20,001- €30,001- €40,001- €50,001- €60,001- €70,001- €80,001- €90,001– €100,001– €110,001- €120,001 Organisation €10,000 €20,000 €30,000 €40,000 €50,000 €60,000 €70,000 €80,000 €90,000 €100,000 €110,000 €120,000 and Over
Table 56 DTSS: Number of Dentists with DTSS Contracts by Payment Range continued
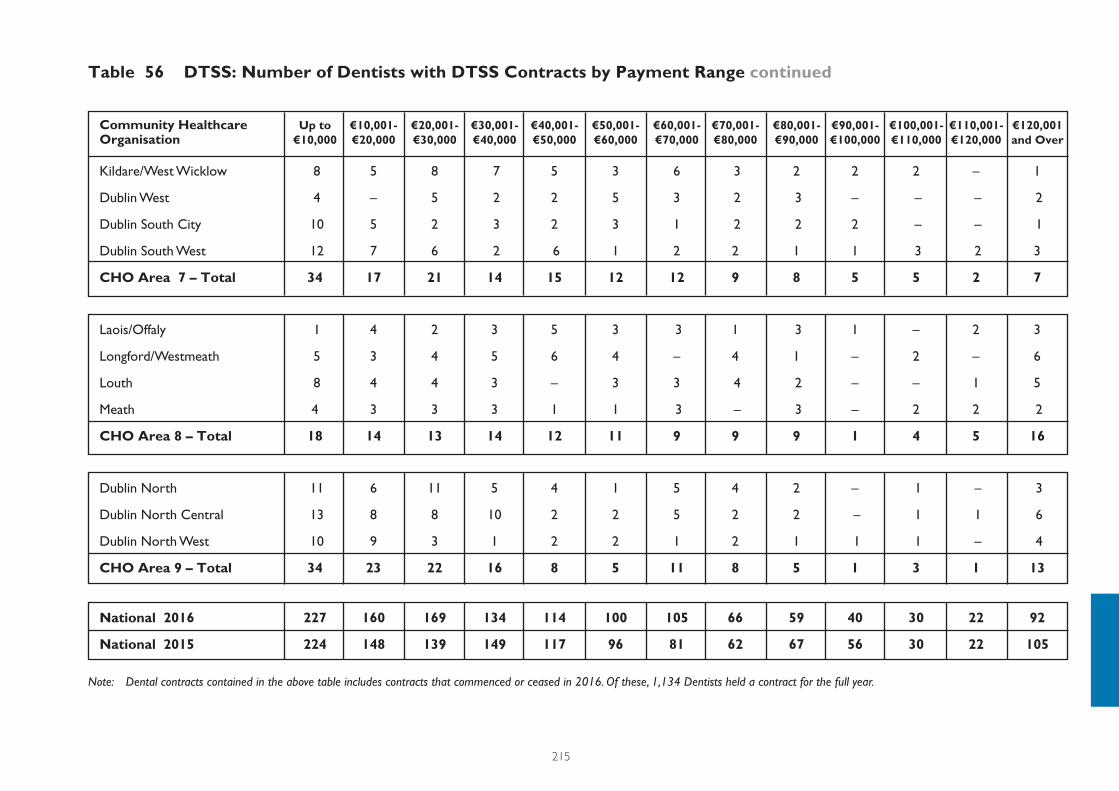
215
Table 56 DTSS: Number of Dentists with DTSS Contracts by Payment Range continued
Note: Dental contracts contained in the above table includes contracts that commenced or ceased in 2016. Of these, 1,134 Dentists held a contract for the full year.
Kildare/West Wicklow 8 5 8 7 5 3 6 3 2 2 2 – 1
Dublin West 4 – 5 2 2 5 3 2 3 – – – 2
Dublin South City 10 5 2 3 2 3 1 2 2 2 – – 1
Dublin South West 12 7 6 2 6 1 2 2 1 1 3 2 3
CHO Area 7 – Total 34 17 21 14 15 12 12 9 8 5 5 2 7
National 2016 227 160 169 134 114 100 105 66 59 40 30 22 92
National 2015 224 148 139 149 117 96 81 62 67 56 30 22 105
Dublin North 11 6 11 5 4 1 5 4 2 – 1 – 3
Dublin North Central 13 8 8 10 2 2 5 2 2 – 1 1 6
Dublin North West 10 9 3 1 2 2 1 2 1 1 1 – 4
CHO Area 9 – Total 34 23 22 16 8 5 11 8 5 1 3 1 13
Laois/Offaly 1 4 2 3 5 3 3 1 3 1 – 2 3
Longford/Westmeath 5 3 4 5 6 4 – 4 1 – 2 – 6
Louth 8 4 4 3 – 3 3 4 2 – – 1 5
Meath 4 3 3 3 1 1 3 – 3 – 2 2 2
CHO Area 8 – Total 18 14 13 14 12 11 9 9 9 1 4 5 16
Community Healthcare Up to €10,001- €20,001- €30,001- €40,001- €50,001- €60,001- €70,001- €80,001- €90,001- €100,001- €110,001- €120,001 Organisation €10,000 €20,000 €30,000 €40,000 €50,000 €60,000 €70,000 €80,000 €90,000 €100,000 €110,000 €120,000 and Over

216

S E C T I O N
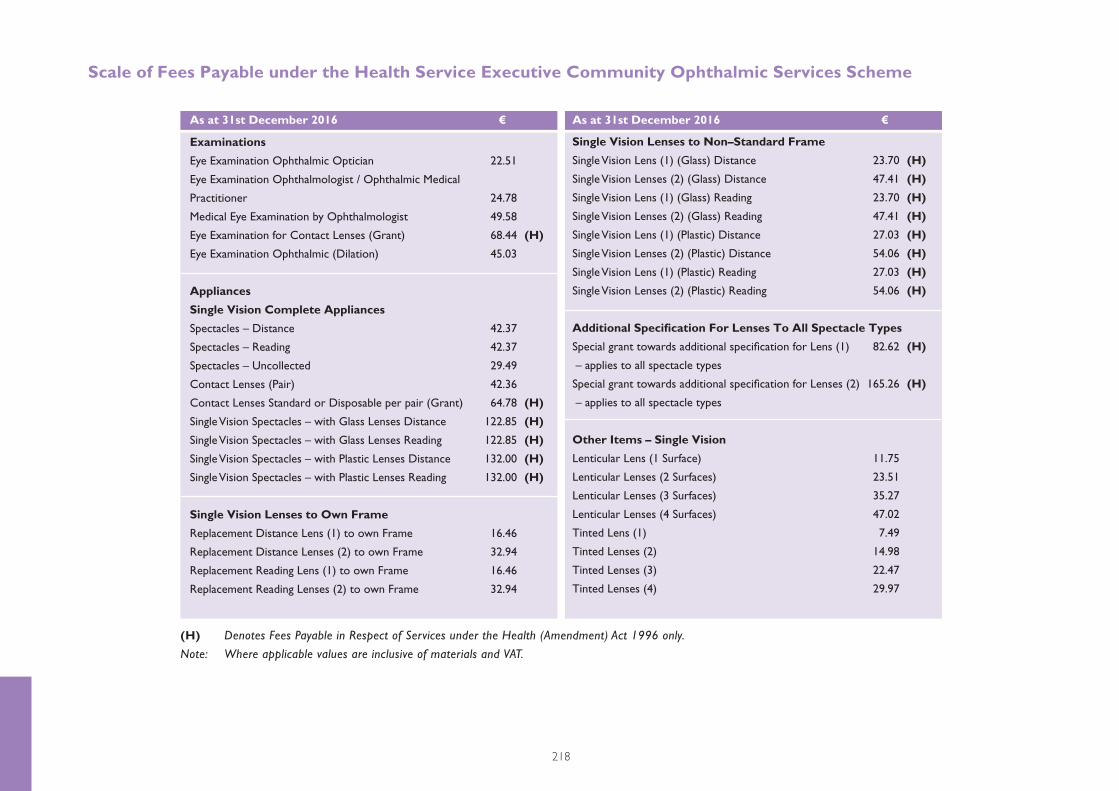
218
Scale of Fees Payable under the Health Service Executive Community Ophthalmic Services Scheme
(H) Denotes Fees Payable in Respect of Services under the Health (Amendment) Act 1996 only.
Note: Where applicable values are inclusive of materials and VAT.
Examinations
Eye Examination Ophthalmic Optician 22.51
Eye Examination Ophthalmologist / Ophthalmic Medical
Practitioner 24.78
Medical Eye Examination by Ophthalmologist 49.58
Eye Examination for Contact Lenses (Grant) 68.44 (H)
Eye Examination Ophthalmic (Dilation) 45.03
Appliances
Single Vision Complete Appliances
Spectacles – Distance 42.37
Spectacles – Reading 42.37
Spectacles – Uncollected 29.49
Contact Lenses (Pair) 42.36
Contact Lenses Standard or Disposable per pair (Grant) 64.78 (H)
Single Vision Spectacles – with Glass Lenses Distance 122.85 (H)
Single Vision Spectacles – with Glass Lenses Reading 122.85 (H)
Single Vision Spectacles – with Plastic Lenses Distance 132.00 (H)
Single Vision Spectacles – with Plastic Lenses Reading 132.00 (H)
Single Vision Lenses to Own Frame
Replacement Distance Lens (1) to own Frame 16.46
Replacement Distance Lenses (2) to own Frame 32.94
Replacement Reading Lens (1) to own Frame 16.46
Replacement Reading Lenses (2) to own Frame 32.94
Single Vision Lenses to Non–Standard Frame
Single Vision Lens (1) (Glass) Distance 23.70 (H)
Single Vision Lenses (2) (Glass) Distance 47.41 (H)
Single Vision Lens (1) (Glass) Reading 23.70 (H)
Single Vision Lenses (2) (Glass) Reading 47.41 (H)
Single Vision Lens (1) (Plastic) Distance 27.03 (H)
Single Vision Lenses (2) (Plastic) Distance 54.06 (H)
Single Vision Lens (1) (Plastic) Reading 27.03 (H)
Single Vision Lenses (2) (Plastic) Reading 54.06 (H)
Additional Specifi cation For Lenses To All Spectacle Types
Special grant towards additional specifi cation for Lens (1) 82.62 (H)
– applies to all spectacle types
Special grant towards additional specifi cation for Lenses (2) 165.26 (H)
– applies to all spectacle types
Other Items – Single Vision
Lenticular Lens (1 Surface) 11.75
Lenticular Lenses (2 Surfaces) 23.51
Lenticular Lenses (3 Surfaces) 35.27
Lenticular Lenses (4 Surfaces) 47.02
Tinted Lens (1) 7.49
Tinted Lenses (2) 14.98
Tinted Lenses (3) 22.47
Tinted Lenses (4) 29.97
As at 31st December 2016 € As at 31st December 2016 €
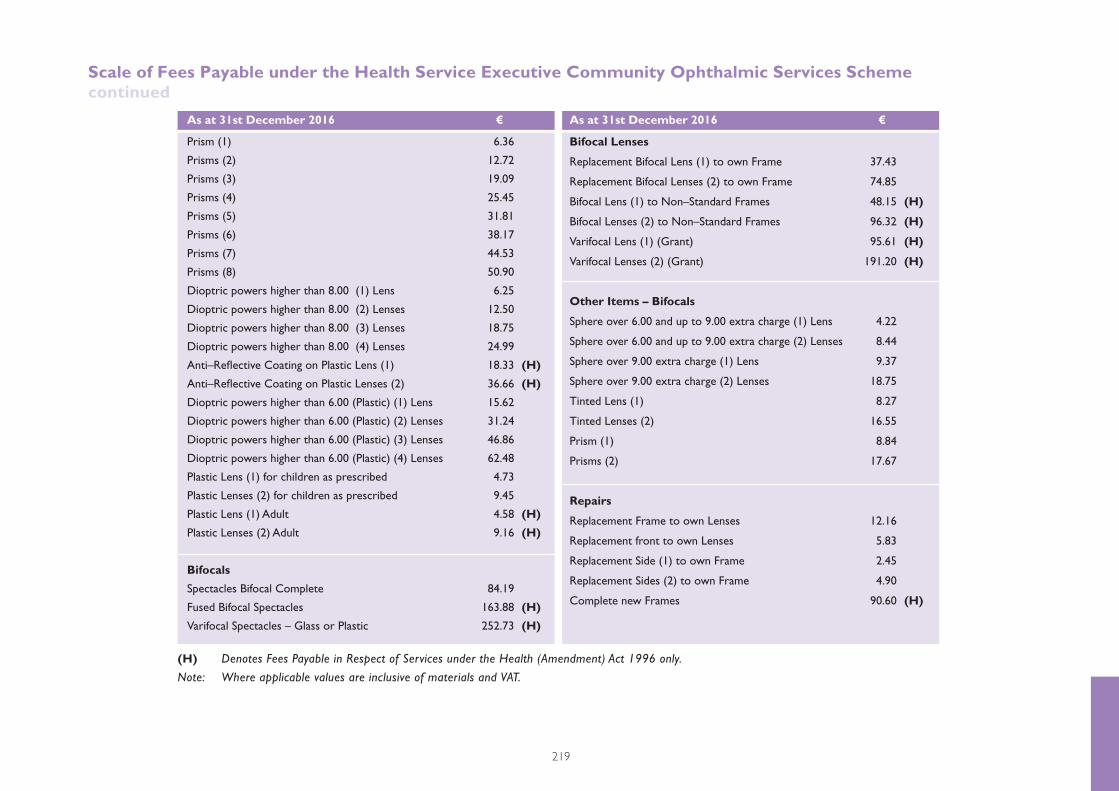
219
(H) Denotes Fees Payable in Respect of Services under the Health (Amendment) Act 1996 only.
Note: Where applicable values are inclusive of materials and VAT.
Scale of Fees Payable under the Health Service Executive Community Ophthalmic Services Scheme continued
Prism (1) 6.36
Prisms (2) 12.72
Prisms (3) 19.09
Prisms (4) 25.45
Prisms (5) 31.81
Prisms (6) 38.17
Prisms (7) 44.53
Prisms (8) 50.90
Dioptric powers higher than 8.00 (1) Lens 6.25
Dioptric powers higher than 8.00 (2) Lenses 12.50
Dioptric powers higher than 8.00 (3) Lenses 18.75
Dioptric powers higher than 8.00 (4) Lenses 24.99
Anti–Refl ective Coating on Plastic Lens (1) 18.33 (H)
Anti–Refl ective Coating on Plastic Lenses (2) 36.66 (H)
Dioptric powers higher than 6.00 (Plastic) (1) Lens 15.62
Dioptric powers higher than 6.00 (Plastic) (2) Lenses 31.24
Dioptric powers higher than 6.00 (Plastic) (3) Lenses 46.86
Dioptric powers higher than 6.00 (Plastic) (4) Lenses 62.48
Plastic Lens (1) for children as prescribed 4.73
Plastic Lenses (2) for children as prescribed 9.45
Plastic Lens (1) Adult 4.58 (H)
Plastic Lenses (2) Adult 9.16 (H)
Bifocals
Spectacles Bifocal Complete 84.19
Fused Bifocal Spectacles 163.88 (H)
Varifocal Spectacles – Glass or Plastic 252.73 (H)
Bifocal Lenses
Replacement Bifocal Lens (1) to own Frame 37.43
Replacement Bifocal Lenses (2) to own Frame 74.85
Bifocal Lens (1) to Non–Standard Frames 48.15 (H)
Bifocal Lenses (2) to Non–Standard Frames 96.32 (H)
Varifocal Lens (1) (Grant) 95.61 (H)
Varifocal Lenses (2) (Grant) 191.20 (H)
Other Items – Bifocals
Sphere over 6.00 and up to 9.00 extra charge (1) Lens 4.22
Sphere over 6.00 and up to 9.00 extra charge (2) Lenses 8.44
Sphere over 9.00 extra charge (1) Lens 9.37
Sphere over 9.00 extra charge (2) Lenses 18.75
Tinted Lens (1) 8.27
Tinted Lenses (2) 16.55
Prism (1) 8.84
Prisms (2) 17.67
Repairs
Replacement Frame to own Lenses 12.16
Replacement front to own Lenses 5.83
Replacement Side (1) to own Frame 2.45
Replacement Sides (2) to own Frame 4.90
Complete new Frames 90.60 (H)
As at 31st December 2016 € As at 31st December 2016 €
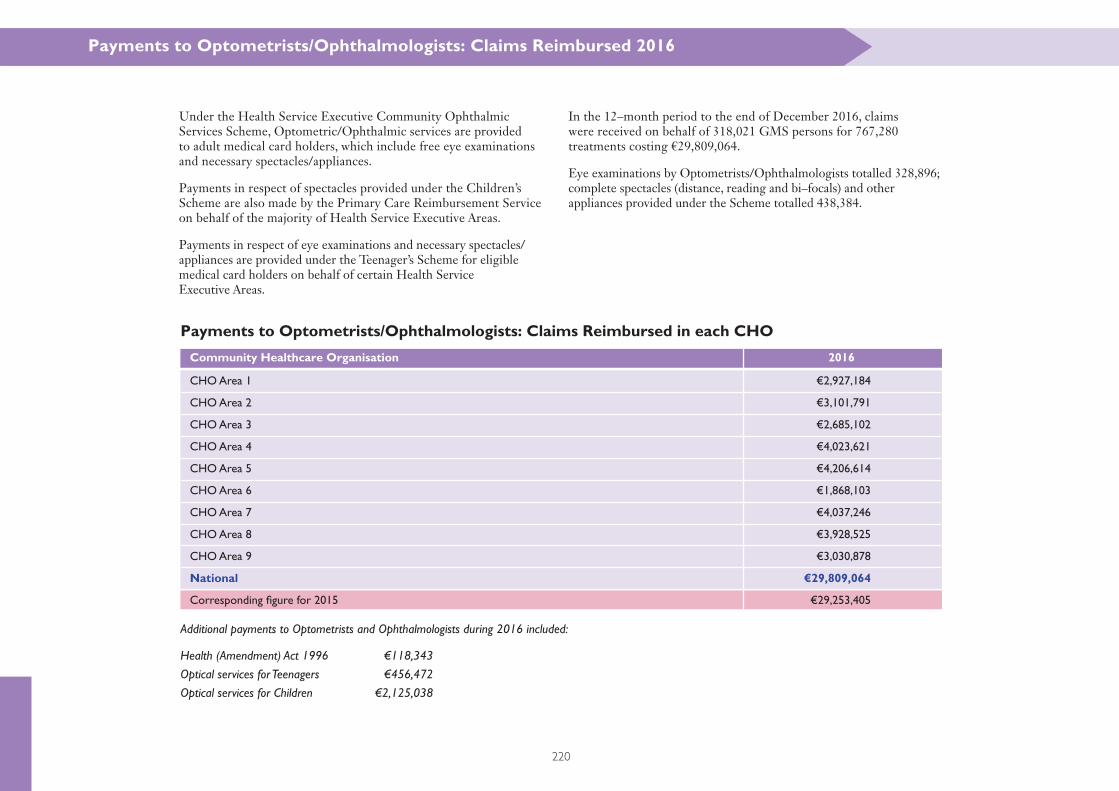
220
Under the Health Service Executive Community Ophthalmic Services Scheme, Optometric/Ophthalmic services are provided to adult medical card holders, which include free eye examinations and necessary spectacles/appliances.
Payments in respect of spectacles provided under the Children’s Scheme are also made by the Primary Care Reimbursement Service on behalf of the majority of Health Service Executive Areas.
Payments in respect of eye examinations and necessary spectacles/appliances are provided under the Teenager’s Scheme for eligiblemedical card holders on behalf of certain Health Service Executive Areas.
In the 12–month period to the end of December 2016, claims were received on behalf of 318,021 GMS persons for 767,280 treatments costing €29,809,064.
Eye examinations by Optometrists/Ophthalmologists totalled 328,896; complete spectacles (distance, reading and bi–focals) and other appliances provided under the Scheme totalled 438,384.
Payments to Optometrists/Ophthalmologists: Claims Reimbursed in each CHO
Payments to Optometrists/Ophthalmologists: Claims Reimbursed 2016
Additional payments to Optometrists and Ophthalmologists during 2016 included:
Health (Amendment) Act 1996 €118,343
Optical services for Teenagers €456,472
Optical services for Children €2,125,038
CHO Area 1 €2,927,184
CHO Area 2 €3,101,791
CHO Area 3 €2,685,102
CHO Area 4 €4,023,621
CHO Area 5 €4,206,614
CHO Area 6 €1,868,103
CHO Area 7 €4,037,246
CHO Area 8 €3,928,525
CHO Area 9 €3,030,878
National €29,809,064
Corresponding fi gure for 2015 €29,253,405
Community Healthcare Organisation 2016

221
South Tipperary €887,986
Carlow/Kilkenny €1,038,946
Waterford €1,098,820
Wexford €1,180,862
Total €4,206,614
Wicklow €953,282
Dun Laoghaire €438,757
Dublin South East €476,064
Total €1,868,103
CHO Area 5 2016
CHO Area 6 2016
Payments to Optometrists/Ophthalmologists: Claims Reimbursed 2016 by CHO
Donegal €1,445,172
Sligo/Leitrim/West Cavan €717,132
Cavan/Monaghan €764,880
Total €2,927,184
Galway €1,553,033
Roscommon €559,440
Mayo €989,318
Total €3,101,791
Clare €996,644
Limerick €1,139,647
North Tipperary/East Limerick €548,811
Total €2,685,102
Kerry €1,219,360
North Cork €557,957
North Lee €1,082,211
South Lee €869,226
West Cork €294,867
Total €4,023,621
Kildare/West Wicklow €1,383,447
Dublin West €880,232
Dublin South City €692,737
Dublin South West €1,080,830
Total €4,037,246
Laois/Offaly €1,272,724
Longford/Westmeath €940,980
Louth €879,631
Meath €835,190
Total €3,928,525
Dublin North €1,243,906
Dublin North Central €937,106
Dublin North West €849,866
Total €3,030,878
CHO Area 1 2016
CHO Area 2 2016
CHO Area 3 2016
CHO Area 4 2016 CHO Area 7 2016
CHO Area 8 2016
CHO Area 9 2016
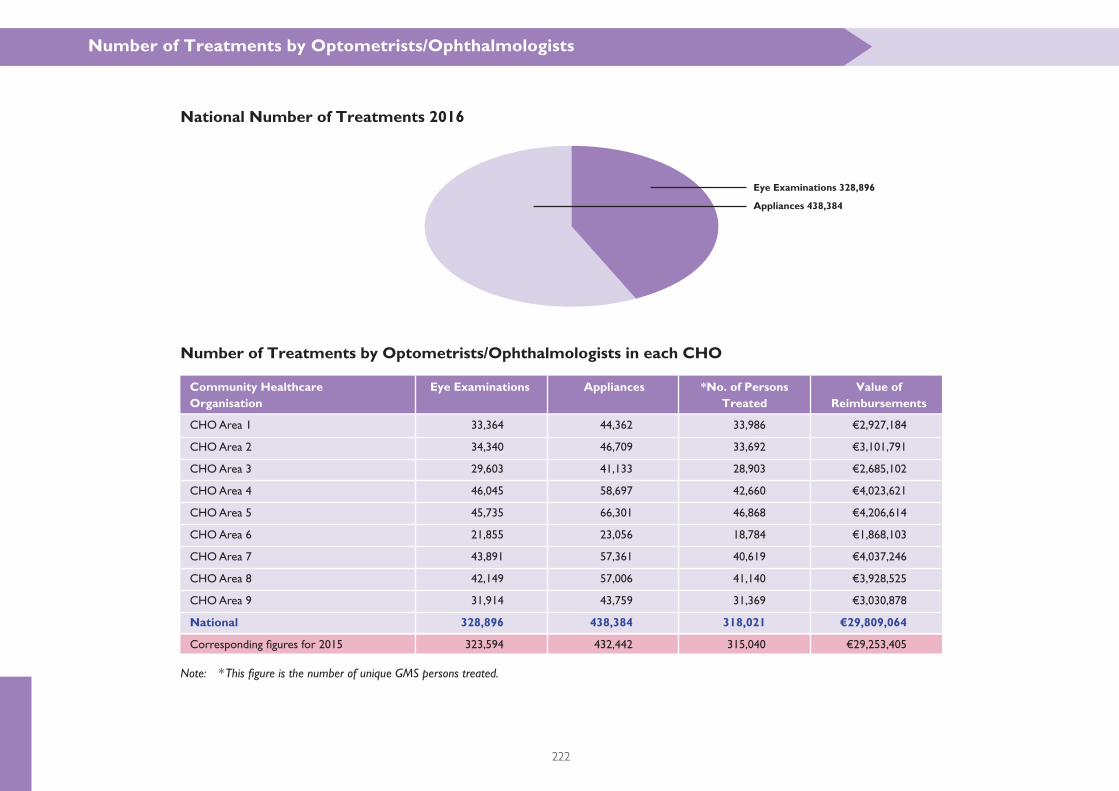
222
National Number of Treatments 2016
Number of Treatments by Optometrists/Ophthalmologists in each CHO
Number of Treatments by Optometrists/Ophthalmologists
Note: * This fi gure is the number of unique GMS persons treated.
CHO Area 1 33,364 44,362 33,986 €2,927,184
CHO Area 2 34,340 46,709 33,692 €3,101,791
CHO Area 3 29,603 41,133 28,903 €2,685,102
CHO Area 4 46,045 58,697 42,660 €4,023,621
CHO Area 5 45,735 66,301 46,868 €4,206,614
CHO Area 6 21,855 23,056 18,784 €1,868,103
CHO Area 7 43,891 57,361 40,619 €4,037,246
CHO Area 8 42,149 57,006 41,140 €3,928,525
CHO Area 9 31,914 43,759 31,369 €3,030,878
National 328,896 438,384 318,021 €29,809,064
Corresponding fi gures for 2015 323,594 432,442 315,040 €29,253,405
Community Healthcare Eye Examinations Appliances *No. of Persons Value ofOrganisation Treated Reimbursements
Eye Examinations 328,896
Appliances 438,384
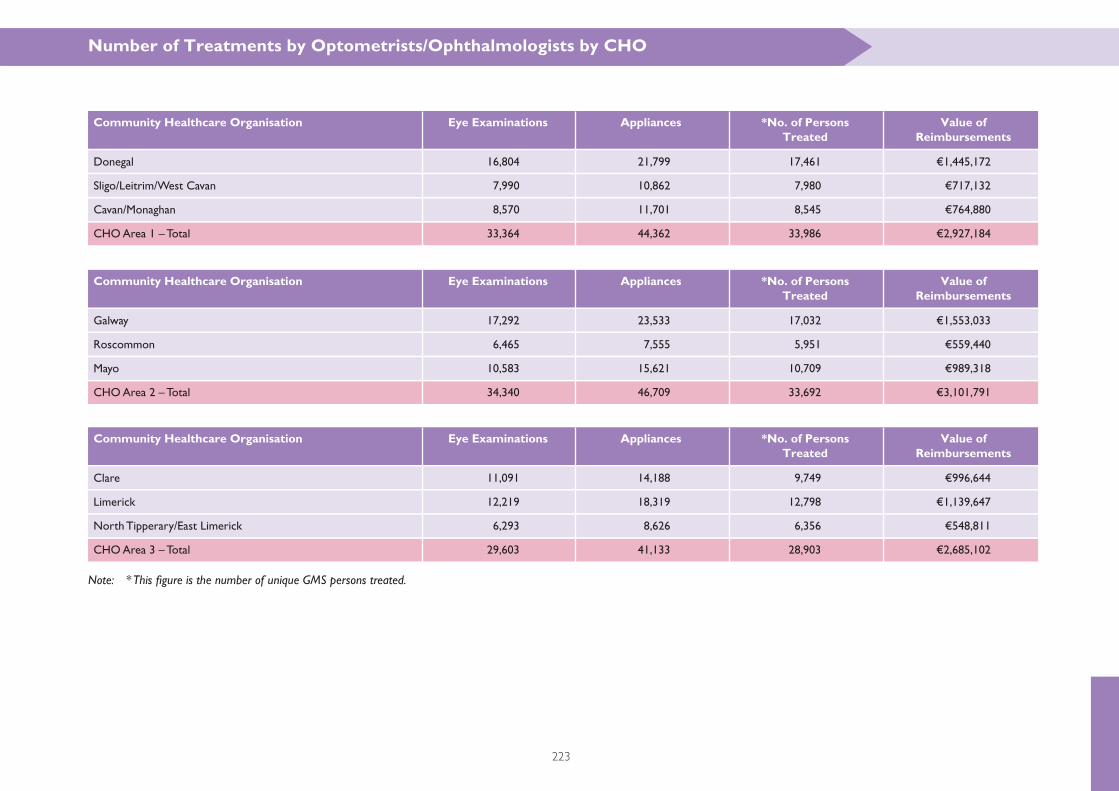
223
Note: * This fi gure is the number of unique GMS persons treated.
Number of Treatments by Optometrists/Ophthalmologists by CHO
Donegal 16,804 21,799 17,461 €1,445,172
Sligo/Leitrim/West Cavan 7,990 10,862 7,980 €717,132
Cavan/Monaghan 8,570 11,701 8,545 €764,880
CHO Area 1 – Total 33,364 44,362 33,986 €2,927,184
Galway 17,292 23,533 17,032 €1,553,033
Roscommon 6,465 7,555 5,951 €559,440
Mayo 10,583 15,621 10,709 €989,318
CHO Area 2 – Total 34,340 46,709 33,692 €3,101,791
Clare 11,091 14,188 9,749 €996,644
Limerick 12,219 18,319 12,798 €1,139,647
North Tipperary/East Limerick 6,293 8,626 6,356 €548,811
CHO Area 3 – Total 29,603 41,133 28,903 €2,685,102
Community Healthcare Organisation Eye Examinations Appliances *No. of Persons Value of Treated Reimbursements
Community Healthcare Organisation Eye Examinations Appliances *No. of Persons Value of Treated Reimbursements
Community Healthcare Organisation Eye Examinations Appliances *No. of Persons Value of Treated Reimbursements
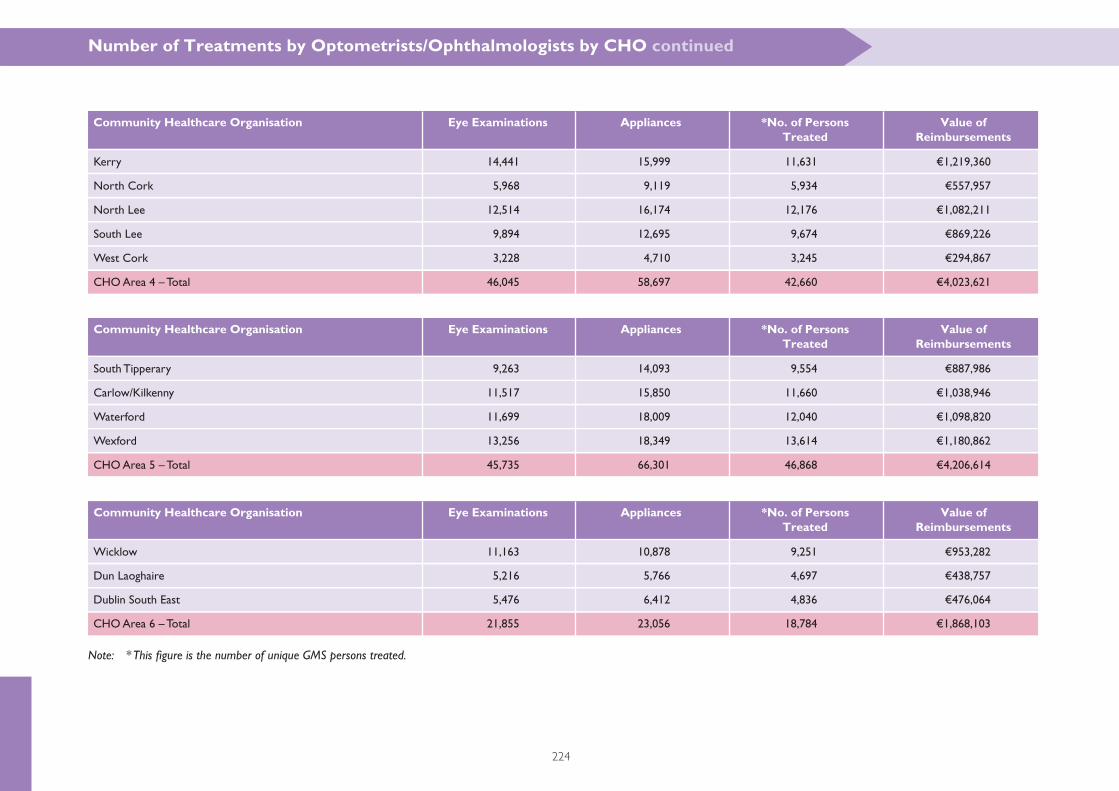
224
Note: * This fi gure is the number of unique GMS persons treated.
Number of Treatments by Optometrists/Ophthalmologists by CHO continued
Kerry 14,441 15,999 11,631 €1,219,360
North Cork 5,968 9,119 5,934 €557,957
North Lee 12,514 16,174 12,176 €1,082,211
South Lee 9,894 12,695 9,674 €869,226
West Cork 3,228 4,710 3,245 €294,867
CHO Area 4 – Total 46,045 58,697 42,660 €4,023,621
South Tipperary 9,263 14,093 9,554 €887,986
Carlow/Kilkenny 11,517 15,850 11,660 €1,038,946
Waterford 11,699 18,009 12,040 €1,098,820
Wexford 13,256 18,349 13,614 €1,180,862
CHO Area 5 – Total 45,735 66,301 46,868 €4,206,614
Wicklow 11,163 10,878 9,251 €953,282
Dun Laoghaire 5,216 5,766 4,697 €438,757
Dublin South East 5,476 6,412 4,836 €476,064
CHO Area 6 – Total 21,855 23,056 18,784 €1,868,103
Community Healthcare Organisation Eye Examinations Appliances *No. of Persons Value of Treated Reimbursements
Community Healthcare Organisation Eye Examinations Appliances *No. of Persons Value of Treated Reimbursements
Community Healthcare Organisation Eye Examinations Appliances *No. of Persons Value of Treated Reimbursements
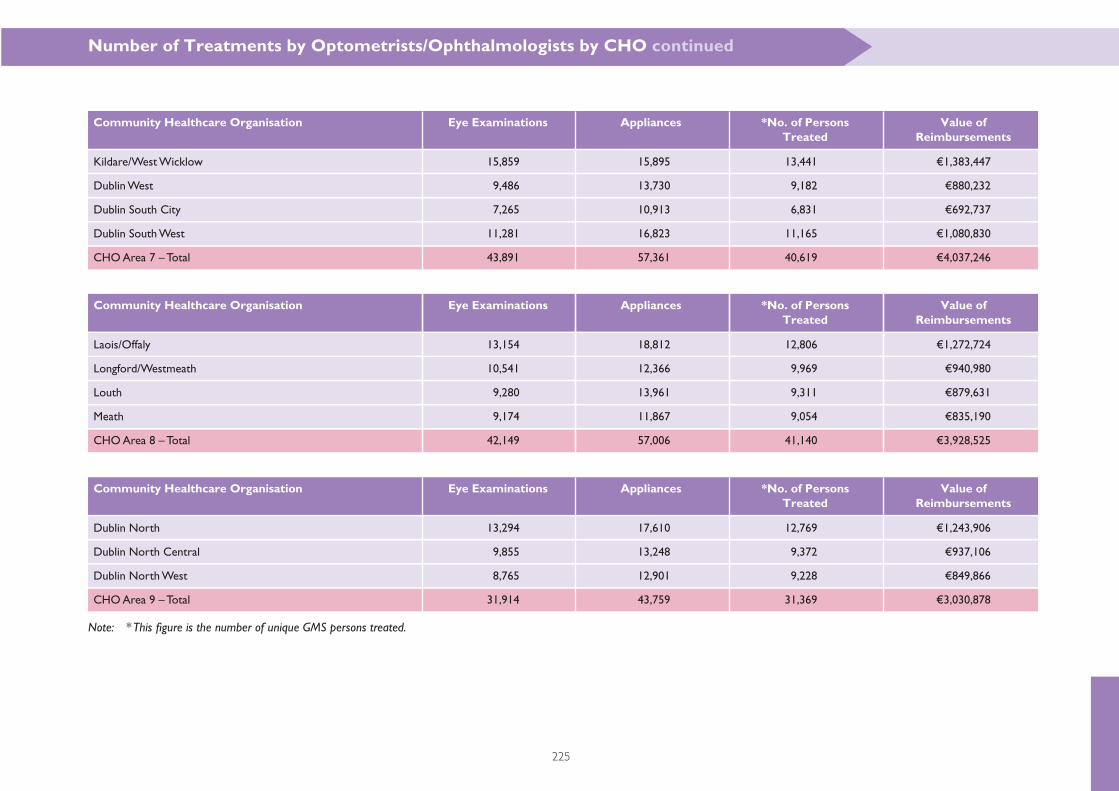
225
Note: * This fi gure is the number of unique GMS persons treated.
Community Healthcare Organisation Eye Examinations Appliances *No. of Persons Value of Treated Reimbursements
Number of Treatments by Optometrists/Ophthalmologists by CHO continued
Kildare/West Wicklow 15,859 15,895 13,441 €1,383,447
Dublin West 9,486 13,730 9,182 €880,232
Dublin South City 7,265 10,913 6,831 €692,737
Dublin South West 11,281 16,823 11,165 €1,080,830
CHO Area 7 – Total 43,891 57,361 40,619 €4,037,246
Dublin North 13,294 17,610 12,769 €1,243,906
Dublin North Central 9,855 13,248 9,372 €937,106
Dublin North West 8,765 12,901 9,228 €849,866
CHO Area 9 – Total 31,914 43,759 31,369 €3,030,878
Community Healthcare Organisation Eye Examinations Appliances *No. of Persons Value of Treated Reimbursements
Community Healthcare Organisation Eye Examinations Appliances *No. of Persons Value of Treated Reimbursements
Laois/Offaly 13,154 18,812 12,806 €1,272,724
Longford/Westmeath 10,541 12,366 9,969 €940,980
Louth 9,280 13,961 9,311 €879,631
Meath 9,174 11,867 9,054 €835,190
CHO Area 8 – Total 42,149 57,006 41,140 €3,928,525
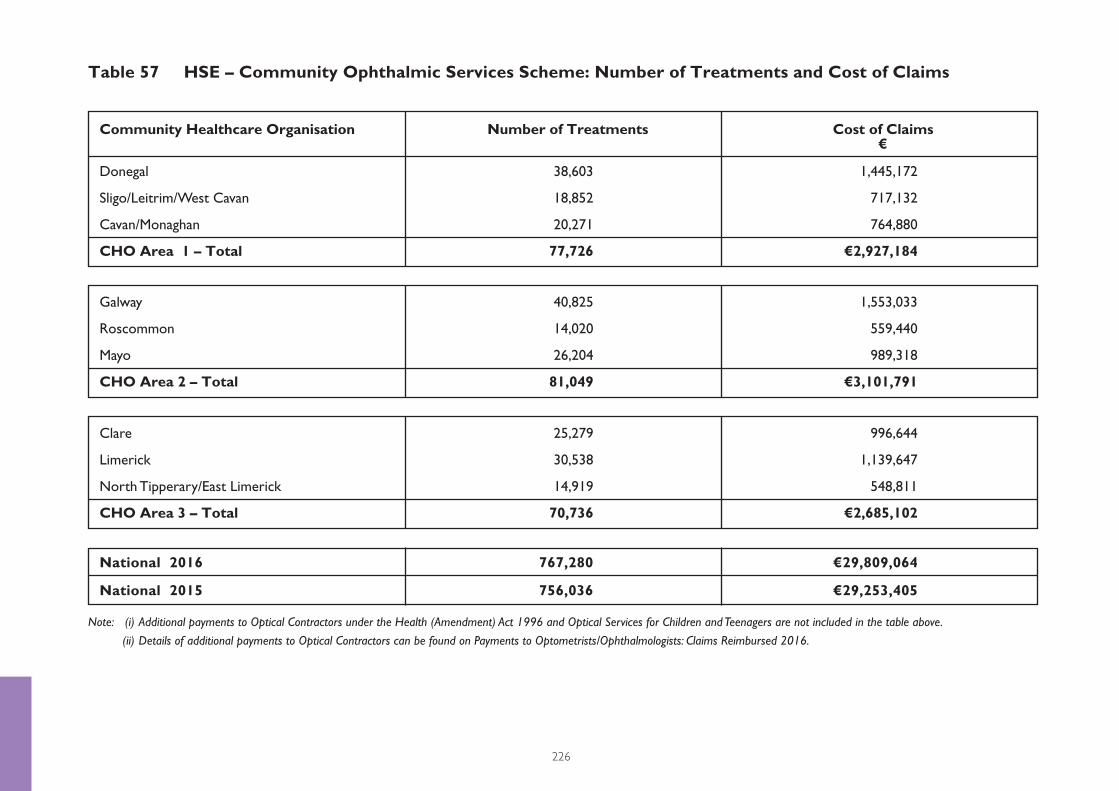
226
Note: (i) Additional payments to Optical Contractors under the Health (Amendment) Act 1996 and Optical Services for Children and Teenagers are not included in the table above.
(ii) Details of additional payments to Optical Contractors can be found on Payments to Optometrists/Ophthalmologists: Claims Reimbursed 2016.
Donegal 38,603 1,445,172
Sligo/Leitrim/West Cavan 18,852 717,132
Cavan/Monaghan 20,271 764,880
CHO Area 1 – Total 77,726 €2,927,184
Galway 40,825 1,553,033
Roscommon 14,020 559,440
Mayo 26,204 989,318
CHO Area 2 – Total 81,049 €3,101,791
Clare 25,279 996,644
Limerick 30,538 1,139,647
North Tipperary/East Limerick 14,919 548,811
CHO Area 3 – Total 70,736 €2,685,102
National 2016 767,280 €29,809,064
National 2015 756,036 €29,253,405
Community Healthcare Organisation Number of Treatments Cost of Claims €
Table 57 HSE – Community Ophthalmic Services Scheme: Number of Treatments and Cost of Claims
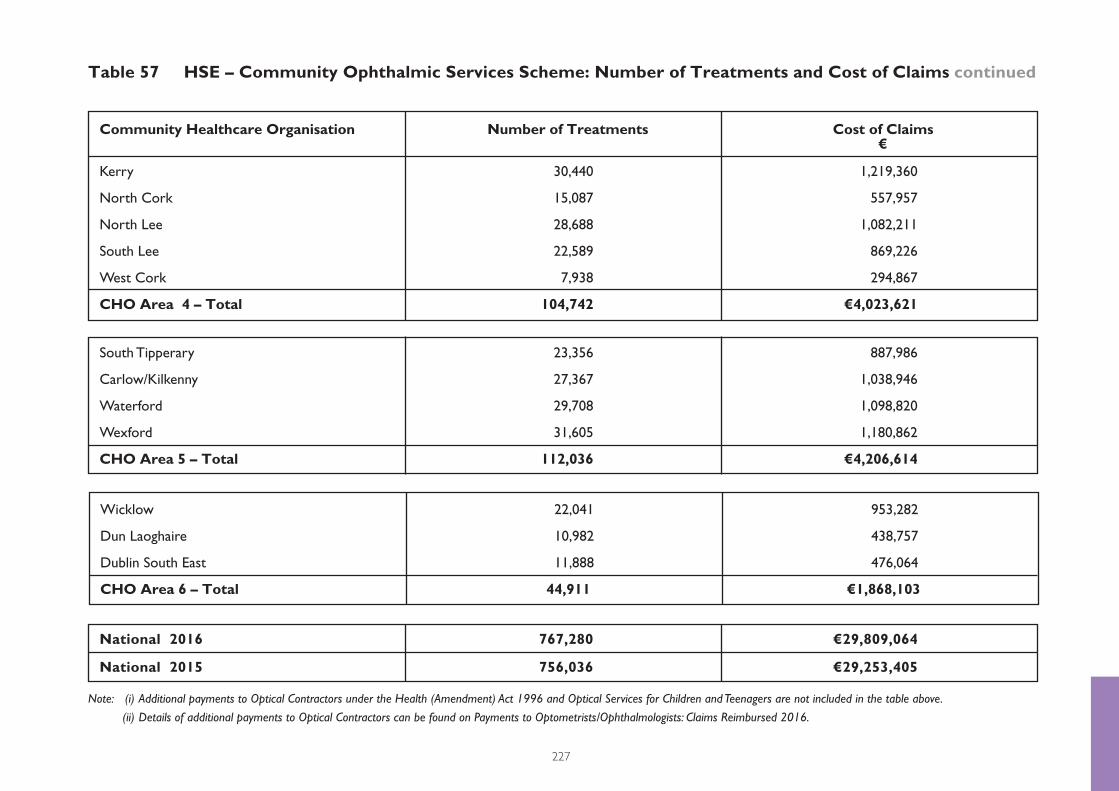
227
Note: (i) Additional payments to Optical Contractors under the Health (Amendment) Act 1996 and Optical Services for Children and Teenagers are not included in the table above.
(ii) Details of additional payments to Optical Contractors can be found on Payments to Optometrists/Ophthalmologists: Claims Reimbursed 2016.
Wicklow 22,041 953,282
Dun Laoghaire 10,982 438,757
Dublin South East 11,888 476,064
CHO Area 6 – Total 44,911 €1,868,103
Kerry 30,440 1,219,360
North Cork 15,087 557,957
North Lee 28,688 1,082,211
South Lee 22,589 869,226
West Cork 7,938 294,867
CHO Area 4 – Total 104,742 €4,023,621
South Tipperary 23,356 887,986
Carlow/Kilkenny 27,367 1,038,946
Waterford 29,708 1,098,820
Wexford 31,605 1,180,862
CHO Area 5 – Total 112,036 €4,206,614
National 2016 767,280 €29,809,064
National 2015 756,036 €29,253,405
Community Healthcare Organisation Number of Treatments Cost of Claims €
Table 57 HSE – Community Ophthalmic Services Scheme: Number of Treatments and Cost of Claims continued
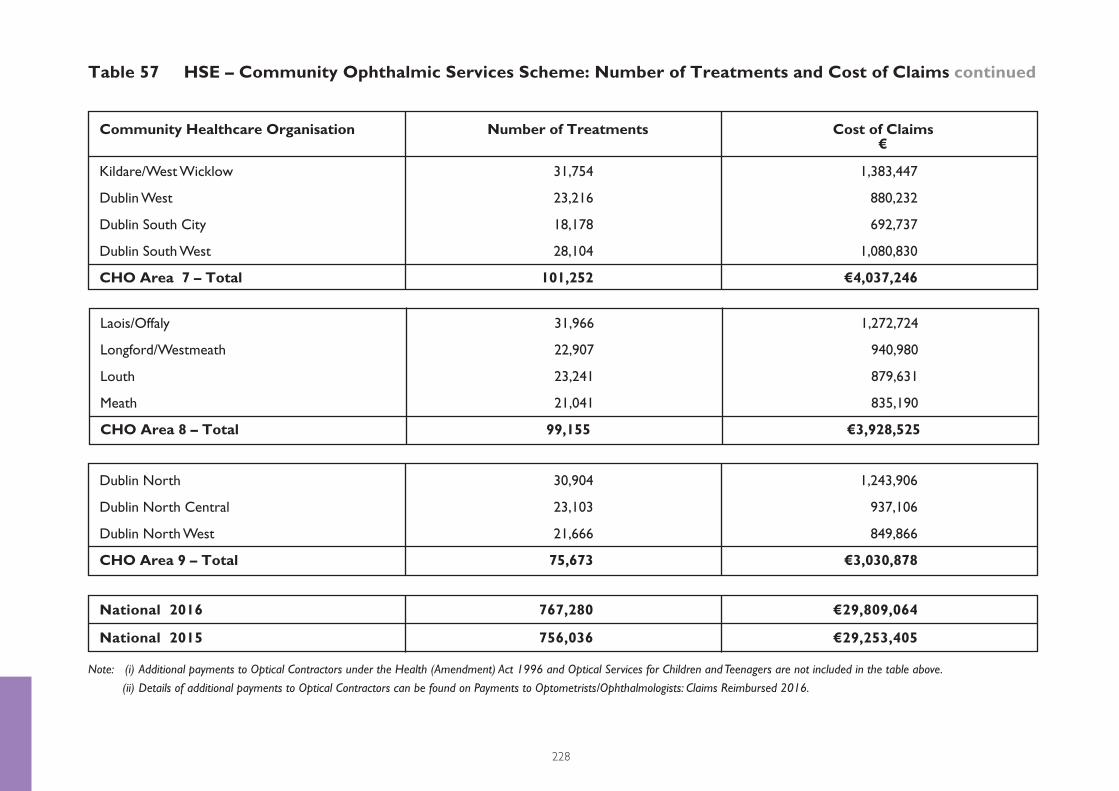
228
Note: (i) Additional payments to Optical Contractors under the Health (Amendment) Act 1996 and Optical Services for Children and Teenagers are not included in the table above.
(ii) Details of additional payments to Optical Contractors can be found on Payments to Optometrists/Ophthalmologists: Claims Reimbursed 2016.
Kildare/West Wicklow 31,754 1,383,447
Dublin West 23,216 880,232
Dublin South City 18,178 692,737
Dublin South West 28,104 1,080,830
CHO Area 7 – Total 101,252 €4,037,246
Dublin North 30,904 1,243,906
Dublin North Central 23,103 937,106
Dublin North West 21,666 849,866
CHO Area 9 – Total 75,673 €3,030,878
Laois/Offaly 31,966 1,272,724
Longford/Westmeath 22,907 940,980
Louth 23,241 879,631
Meath 21,041 835,190
CHO Area 8 – Total 99,155 €3,928,525
National 2016 767,280 €29,809,064
National 2015 756,036 €29,253,405
Community Healthcare Organisation Number of Treatments Cost of Claims €
Table 57 HSE – Community Ophthalmic Services Scheme: Number of Treatments and Cost of Claims continued
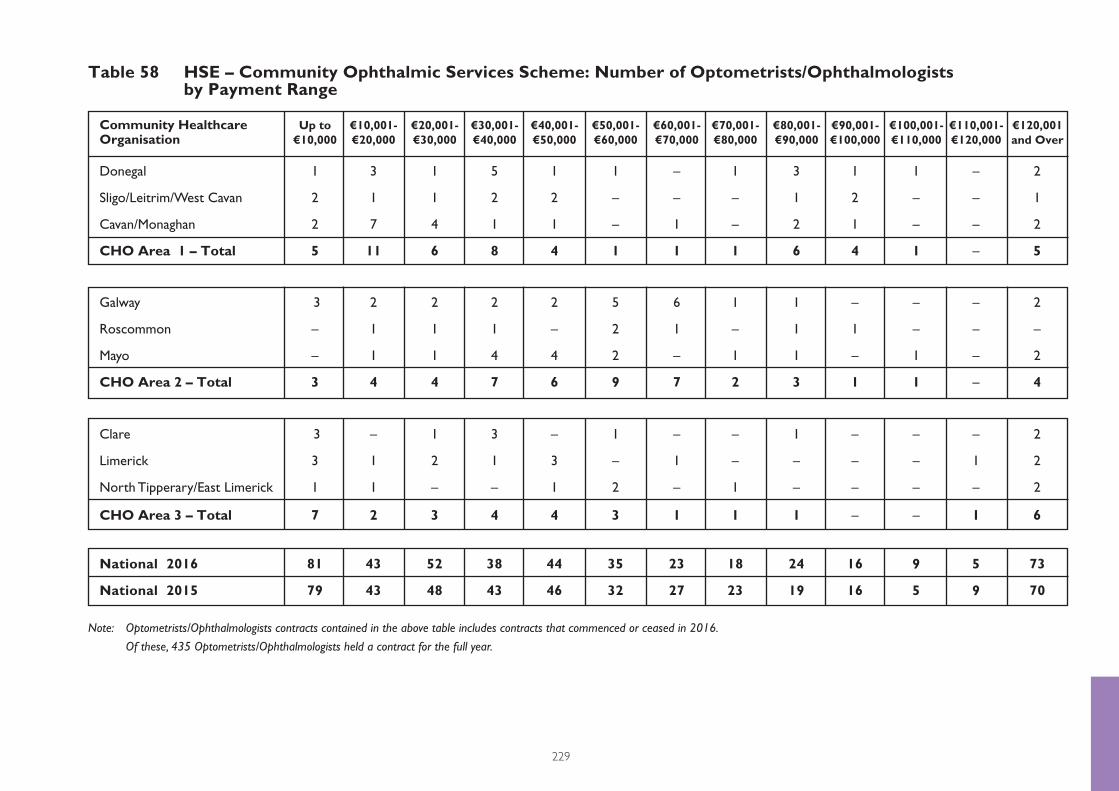
229
Note: Optometrists/Ophthalmologists contracts contained in the above table includes contracts that commenced or ceased in 2016.
Of these, 435 Optometrists/Ophthalmologists held a contract for the full year.
Donegal 1 3 1 5 1 1 – 1 3 1 1 – 2
Sligo/Leitrim/West Cavan 2 1 1 2 2 – – – 1 2 – – 1
Cavan/Monaghan 2 7 4 1 1 – 1 – 2 1 – – 2
CHO Area 1 – Total 5 11 6 8 4 1 1 1 6 4 1 – 5
National 2016 81 43 52 38 44 35 23 18 24 16 9 5 73
National 2015 79 43 48 43 46 32 27 23 19 16 5 9 70
Clare 3 – 1 3 – 1 – – 1 – – – 2
Limerick 3 1 2 1 3 – 1 – – – – 1 2
North Tipperary/East Limerick 1 1 – – 1 2 – 1 – – – – 2
CHO Area 3 – Total 7 2 3 4 4 3 1 1 1 – – 1 6
Galway 3 2 2 2 2 5 6 1 1 – – – 2
Roscommon – 1 1 1 – 2 1 – 1 1 – – –
Mayo – 1 1 4 4 2 – 1 1 – 1 – 2
CHO Area 2 – Total 3 4 4 7 6 9 7 2 3 1 1 – 4
Community Healthcare Up to €10,001- €20,001- €30,001- €40,001- €50,001- €60,001- €70,001- €80,001- €90,001- €100,001- €110,001- €120,001 Organisation €10,000 €20,000 €30,000 €40,000 €50,000 €60,000 €70,000 €80,000 €90,000 €100,000 €110,000 €120,000 and Over
Table 58 HSE – Community Ophthalmic Services Scheme: Number of Optometrists/Ophthalmologists by Payment Range
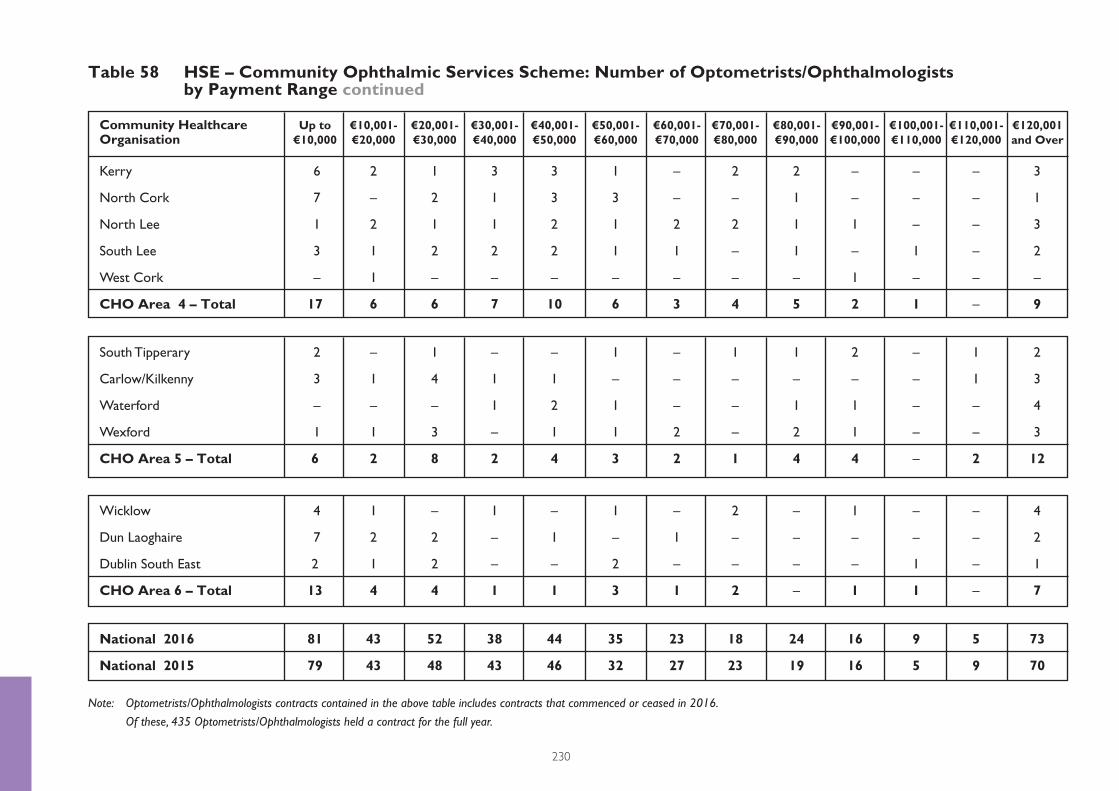
230
Note: Optometrists/Ophthalmologists contracts contained in the above table includes contracts that commenced or ceased in 2016.
Of these, 435 Optometrists/Ophthalmologists held a contract for the full year.
Kerry 6 2 1 3 3 1 – 2 2 – – – 3
North Cork 7 – 2 1 3 3 – – 1 – – – 1
North Lee 1 2 1 1 2 1 2 2 1 1 – – 3
South Lee 3 1 2 2 2 1 1 – 1 – 1 – 2
West Cork – 1 – – – – – – – 1 – – –
CHO Area 4 – Total 17 6 6 7 10 6 3 4 5 2 1 – 9
National 2016 81 43 52 38 44 35 23 18 24 16 9 5 73
National 2015 79 43 48 43 46 32 27 23 19 16 5 9 70
Wicklow 4 1 – 1 – 1 – 2 – 1 – – 4
Dun Laoghaire 7 2 2 – 1 – 1 – – – – – 2
Dublin South East 2 1 2 – – 2 – – – – 1 – 1
CHO Area 6 – Total 13 4 4 1 1 3 1 2 – 1 1 – 7
South Tipperary 2 – 1 – – 1 – 1 1 2 – 1 2
Carlow/Kilkenny 3 1 4 1 1 – – – – – – 1 3
Waterford – – – 1 2 1 – – 1 1 – – 4
Wexford 1 1 3 – 1 1 2 – 2 1 – – 3
CHO Area 5 – Total 6 2 8 2 4 3 2 1 4 4 – 2 12
Community Healthcare Up to €10,001- €20,001- €30,001- €40,001- €50,001- €60,001- €70,001- €80,001- €90,001- €100,001- €110,001- €120,001 Organisation €10,000 €20,000 €30,000 €40,000 €50,000 €60,000 €70,000 €80,000 €90,000 €100,000 €110,000 €120,000 and Over
Table 58 HSE – Community Ophthalmic Services Scheme: Number of Optometrists/Ophthalmologists by Payment Range continued
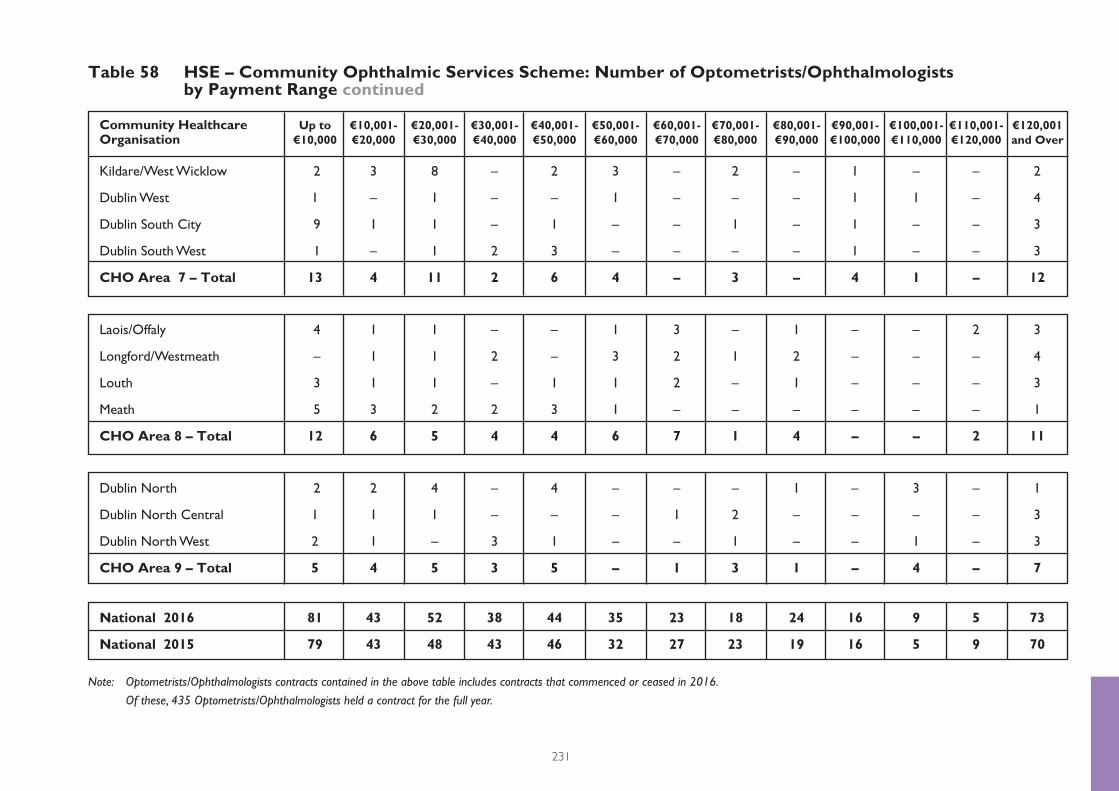
231
Table 58 HSE – Community Ophthalmic Services Scheme: Number of Optometrists/Ophthalmologists by Payment Range continued
Note: Optometrists/Ophthalmologists contracts contained in the above table includes contracts that commenced or ceased in 2016.
Of these, 435 Optometrists/Ophthalmologists held a contract for the full year.
Kildare/West Wicklow 2 3 8 – 2 3 – 2 – 1 – – 2
Dublin West 1 – 1 – – 1 – – – 1 1 – 4
Dublin South City 9 1 1 – 1 – – 1 – 1 – – 3
Dublin South West 1 – 1 2 3 – – – – 1 – – 3
CHO Area 7 – Total 13 4 11 2 6 4 – 3 – 4 1 – 12
National 2016 81 43 52 38 44 35 23 18 24 16 9 5 73
National 2015 79 43 48 43 46 32 27 23 19 16 5 9 70
Dublin North 2 2 4 – 4 – – – 1 – 3 – 1
Dublin North Central 1 1 1 – – – 1 2 – – – – 3
Dublin North West 2 1 – 3 1 – – 1 – – 1 – 3
CHO Area 9 – Total 5 4 5 3 5 – 1 3 1 – 4 – 7
Laois/Offaly 4 1 1 – – 1 3 – 1 – – 2 3
Longford/Westmeath – 1 1 2 – 3 2 1 2 – – – 4
Louth 3 1 1 – 1 1 2 – 1 – – – 3
Meath 5 3 2 2 3 1 – – – – – – 1
CHO Area 8 – Total 12 6 5 4 4 6 7 1 4 – – 2 11
Community Healthcare Up to €10,001- €20,001- €30,001- €40,001- €50,001- €60,001- €70,001- €80,001- €90,001- €100,001- €110,001- €120,001 Organisation €10,000 €20,000 €30,000 €40,000 €50,000 €60,000 €70,000 €80,000 €90,000 €100,000 €110,000 €120,000 and Over