Embed Size (px)
Citation preview
Process Control Monitoring for WWTP Operations
Tom HornLaboratory, Project Manager
Industrial Fluid Management, Inc.

IFM services several industrial and municipal water and
wastewater treatment plants throughout Ohio, Indiana and
Michigan
Levels of service include:
• Complete Plant Operation• Technical Supervision• Treatment aids (bioaugmentation, chemical
treatment)• Laboratory Services• Consultation,training and maintenance
Plant Operations include:
• Trickling Filters• Lagoons• Activated sludge (SBR, extended aeration,
package plants)• Lamella systems, pure water systems and
water recycle systems
Municipal Systems we operate or or provide consultation:
1 Normally not operating @ optimum efficiency
2 Poor design or in dire need for repairs3 Unique treatment circumstances such as
small community with industrial discharger
With all of the different systems IFM has operated or assisted in, they all require
process control monitoring of some type and to varying
degrees.
Process Control Monitoring
• Any test that can be used to determine loadings, removal rates and treatment efficiency of a system or any of its individual treatment systems. (Basically any test that helps us understand what is happening at plant in times of proper operation and times or upset)
Process Control
• Can be used to monitor and track plant performance
• Track what variables affect plant performance and to what degree
• Explain what causes plant upsets (weather, toxic substances, etc.)
What’s a lab analyst role in this?
• We perform the process control• We normally are the first to see data from
raw, primary, secondary and final effluent data
• Can have a positive role in finding “optimum treatment”
Over time, a laboratory analyst should be able to determine plant performance from process control data.
Process control testing performed:
• pH, CBOD5, COD, NH3, NO3, NO2, TSS, MLSS, RASSS, % solids, % volatiles, alkalinity, P, 30 min. settling, spin test, microscopic exams, color, odor, turbidity, any other test that can be used as a tool for plant operators.
Frequency of Process Control
• Size of plant• Time allotted to plant operations
How does a lab analyst determine what tests are necessary?
Initially, one wants to start with the simplest method(s) first and progressing to more advanced tests.
Observations of plant
• Document physical changes in appearance of aeration tank, lagoon, clarifiers, etc. and visual color, odor, turbidity of effluent daily or as much as possible
• “Small” items such as changes in color or appearance can serve as a warning as to bigger problems on the way

What do Process Control Parameters Indicate?
• Nutrient availability to biological portion of plant, loadings, required adjustments
• Ratio of Carbon, Nitrogen, Phosphorous and other nutrients available to microlife
Other items Process control is used for
• Sludge age, MCRT
• Wasting rates
• % removal efficiencies
Inhibitory Conditions
• Toxic or inhibitory substance (chemical that kills or keeps biological activity low)
• Organic overload (high BOD)• Septicity or low alkaline conditions

Ideal nutrient ratio is:•100:5:1•100 mg/l CBOD-5•5 mg/l N as Ammonia•1 mg/l P

Settling characteristics & biological activity
• These determine level of treatment and maturity of biolife in system.
• Usually, settling characteristics are dependent upon level of biology
Preliminary Data (for any system)
• Raw influent, primary effluent, secondary effluent, pH, COD or CBOD5 (not BOD-5), NH3-N, P, alkalinity, oil & grease
• These tests can be used to profile wastewater feeding the biological portion of the plant
• BOD-5 is a sum of carbon and nitrogen entering system
• EXAMPLE:– Low influent CBOD-5
with high NH3-N and low alkalinity. Plants where homes have holding tanks and decant is treated at activated sludge plant. (package plant)
• PROBLEM:– Maintaining mixed
liquor is difficult do to low carbon source and meeting nitrification due to low alkalinity.
• POSSIBLE SOLUTION:– increase carbon source at plant to even out
nutrient balance.– Addition of lime for alkalinity increase to
buffer nitrification process.
Example of how extensive studies can aid in treatment
• PROBLEM:– Plants consisting of
primary clarification, secondary trickling filters and clarifiers followed by tertiary trickling filter. Plants was not nitrifying as efficiently on weekends as during the week.
• POTENTIAL CAUSES– Large food processor in
city (high loadings)– Flow fluctuations on
weekends– Plant used enormous
chemical additives in primary and secondary clarifiers for increased sedimentation and clarification

QUESTIONS?
1 How were we going to determine what problems were the cause for inconsistent nitrification?
2 What tests were we going to utilize for this study?
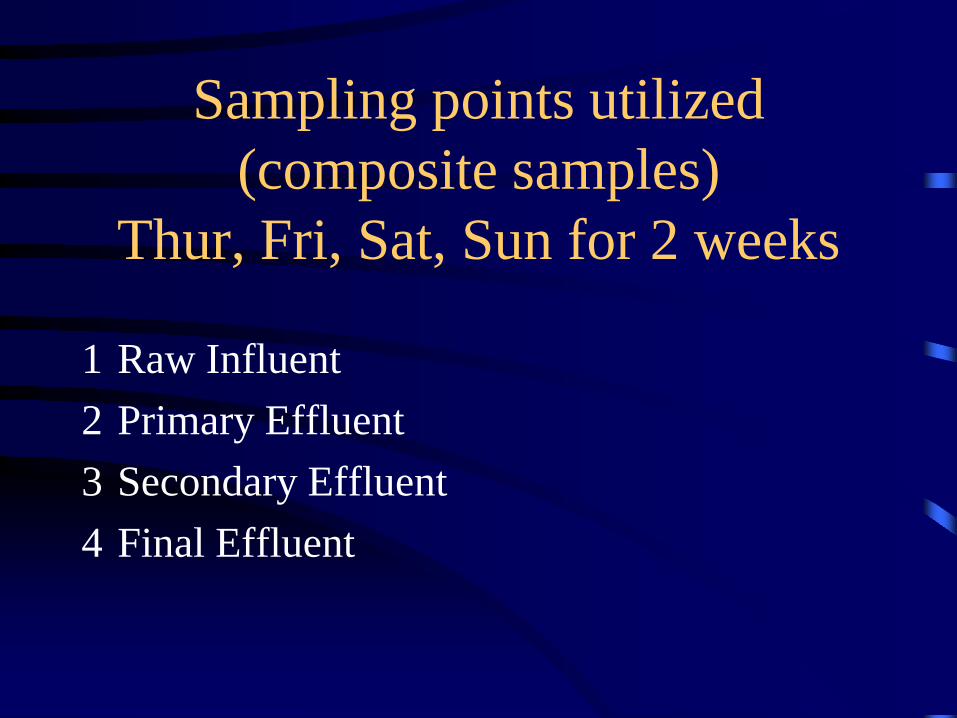
Sampling points utilized (composite samples)
Thur, Fri, Sat, Sun for 2 weeks
1 Raw Influent2 Primary Effluent3 Secondary Effluent4 Final Effluent
Parameters that were analyzed on these samples
COD, Ammonia, Alkalinity
Over the two week period, we found the following:
• Influent COD dropped considerably over the weekend.
• Influent ammonia increased over the weekend.
Primary clarifiers COD removal efficiency increased dramatically on the weekends to the point that the secondary filters were essentially starved compared to loadings during the week.
Final effluent characteristics when ammonia exceeded limits, effluent alkalinity was extremely low.
Other items that contributed:
1 Food Processor was not in operation over the weekenda This led to lower flows at the plant, but also
lower loadings than during the week.b Increased detention time in sewer and
throughout the plant (indicated by higher ammonia levels in the raw influent).
CONCLUSIONS:
• Plant biomass was adapted for heavy loadings of organics during operation of food processor discharging to city sewer. Plant was surprisingly very efficient at removing theses extremely high loadings.
• Actually, this facility was sending more # of BOD than plant was designed for.
When that source of food was shut off during the weekend it led
to the following:
1 Increased detention time in sewer leading to a more septic influent.
2 Shock to biomass. Not enough food to sustain activity to biomass over weekend
3 Plant began to “rob” alkalinity due to above conditions leading to poor nitrification
Possible Recommendations
• Add food over the weekend to keep biomass healthy and operational
• Look at chemical feed (ferric chloride) addition in the primary
Decision was to alter ferric feed
1 This would lessen efficiency of primary clarifier to allow more food to reach trickling filters to prevent the filters from “shutting down”
2 Avoid robbing alkalinity by less acid addition to allow nitrification to continue through weekend
Over the next few weeks, the plant began to operate on the weekends with the same quality of effluent as during the week.

Looking back some other items I would have analyzed would be:
• Nitrate and Nitrite on secondary effluent to prove if ammonia was actually being removed or if the plant was creating ammonia.
• Ammonia is broken down to…– nitrate which converts to nitrite during
nitrification, presence of these ions would indicate nitrification was occuring
This is just one example of how a laboratory analyst can assist in
the operation of WWTP’s
Every plant is going to operate differently, it is up to analysts to be proactive in determining what tests are important to that plant’s
performance.
Basic Tools for Process Control
• Portable pH and dissolved oxygen meters• Microscope• Settleometer• Sampling equipment, dippers and sludge
judge
Other tools for process control
• Composite samplers• Filtration assembly with vacuum source
(MLSS, RASSS)• Drying oven and muffle furnace• Nutrient test kits (NH3, P, trace minerals)• Centrifuge (spin tests)• ORP meters Oxidation Reduction Potential

![[XLS] · Web viewCRM solution security solution business package data mining business operations manual e-Learning seminar log analysis log monitoring third party evaluation/verification](https://img.pdfslide.tips/doc/110x75/5aa036667f8b9a0d158dd257/xls-viewcrm-solution-security-solution-business-package-data-mining-business-operations.jpg)