Embed Size (px)
Citation preview
Helicopter Operations Monitoring Programme (HOMP)
A helicopter Flight Data Monitoring A helicopter Flight Data Monitoring (FDM) programme(FDM) programme
Shell AircraftBRISTOW HELICOPTERS
What is Flight Data Monitoring?
Definition:“A systematic method of accessing, analysing and acting upon information obtained from digital flight data records of routine operations to improve safety”
FDM involves the pro-active use of flight data to identify and address operational risks before they can lead to incidents and accidents
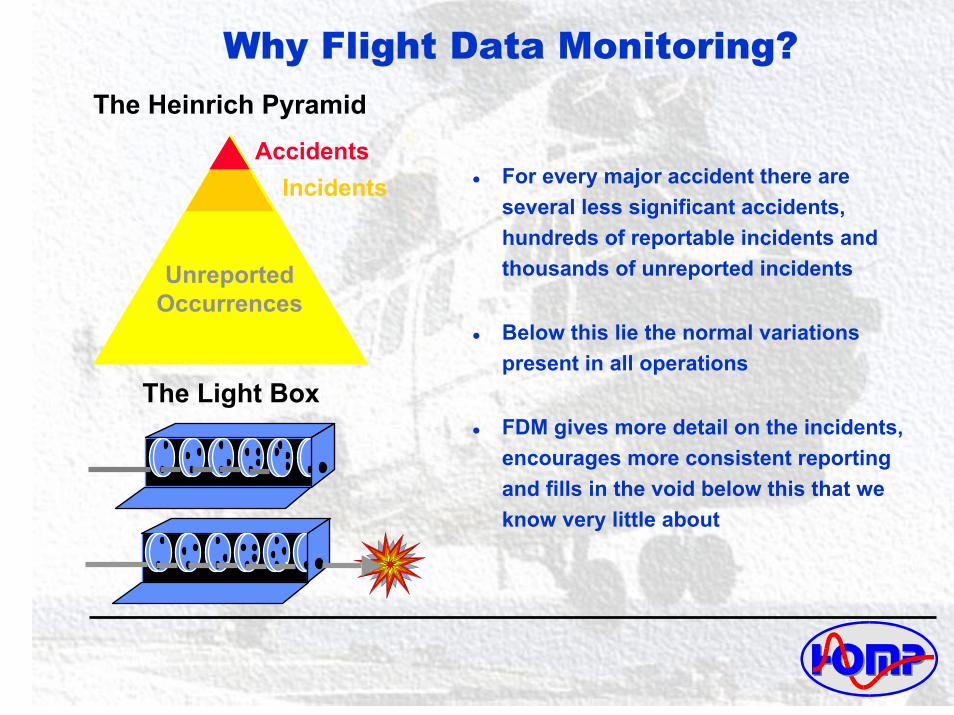
Why Flight Data Monitoring?The Heinrich Pyramid
For every major accident there are several less significant accidents, hundreds of reportable incidents and thousands of unreported incidents
Below this lie the normal variations present in all operations
FDM gives more detail on the incidents, encourages more consistent reporting and fills in the void below this that we know very little about
Accidents
UnreportedOccurrences
Incidents
The Light Box
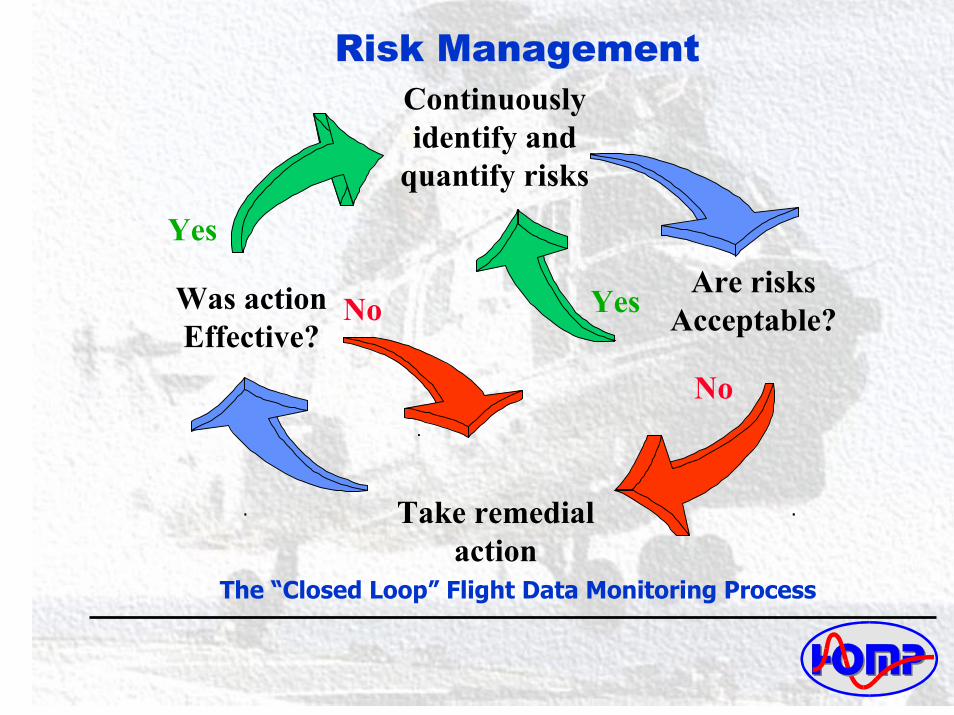
Risk ManagementContinuouslyidentify and
quantify risks
Are risksAcceptable?
Was actionEffective?
Yes
No
Take remedialaction
No
Yes
The “Closed Loop” Flight Data Monitoring Process
HOMP Trial Objectives
Establish how best to monitor helicopter flight operations
Evaluate the safety benefits of this monitoring
Evaluate the tools and equipment selected for the trial, eliminate technical risks
Establish a HOMP management strategy
Assess the workload for a typical operator
Obtain aircrew and management ‘buy-in’
Further expose Industry to the concept of a HOMP
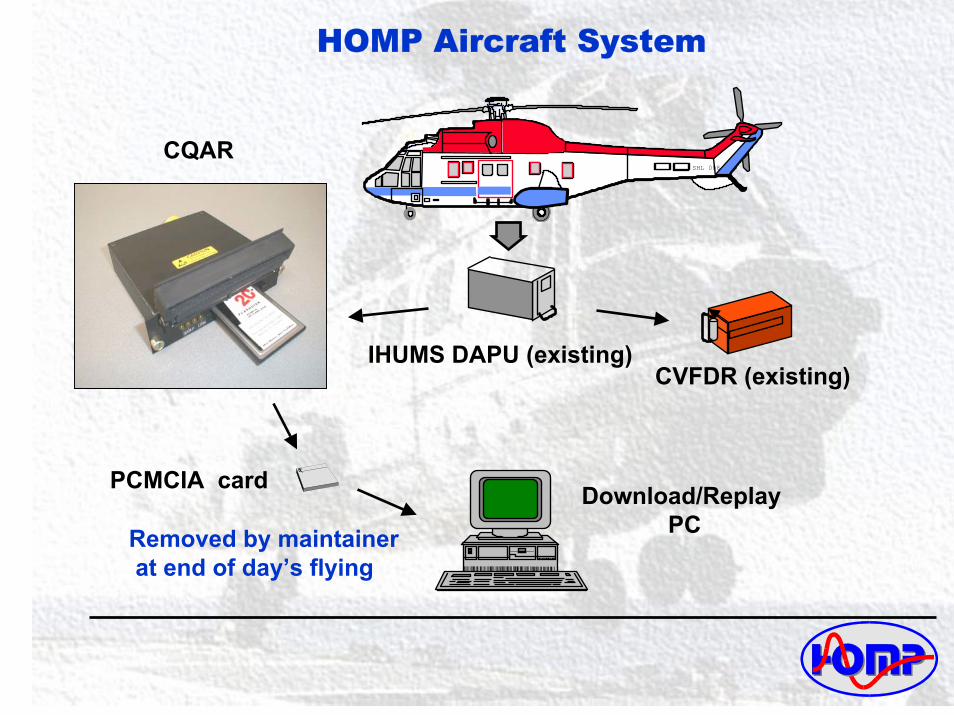
HOMP Aircraft System
SHL 008
CQAR
CVFDR (existing)IHUMS DAPU (existing)
PCMCIA card Download/ReplayPCRemoved by maintainer
at end of day’s flying
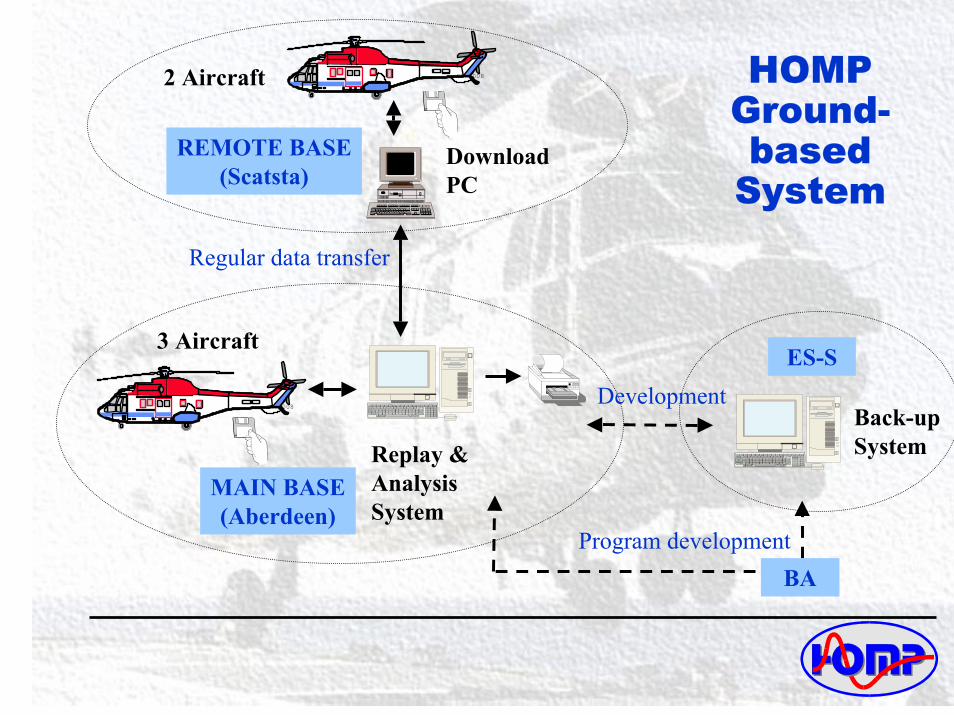
REMOTE BASE(Scatsta)
DownloadPC
SHL 0082 Aircraft HOMP Ground-based
SystemRegular data transfer
MAIN BASE(Aberdeen)
SHL 008
Replay & Analysis System
3 Aircraft
Back-up System
ES-SDevelopment
Program developmentBA
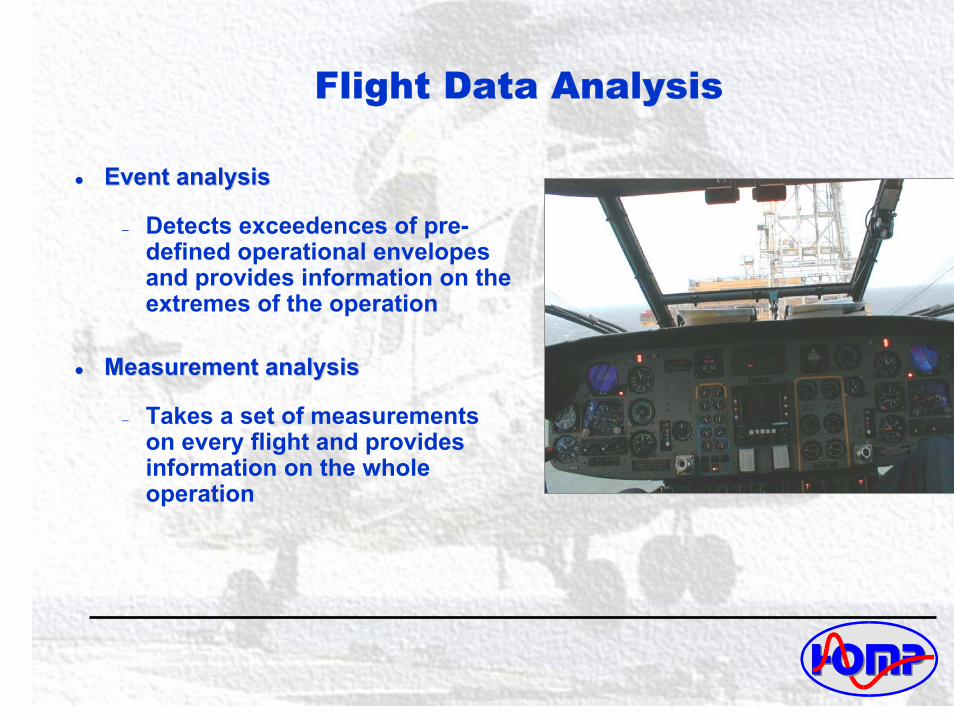
Flight Data Analysis
Event analysisEvent analysis
– Detects exceedences of pre-defined operational envelopes and provides information on the extremes of the operation
Measurement analysisMeasurement analysis
– Takes a set of measurements on every flight and provides information on the whole operation
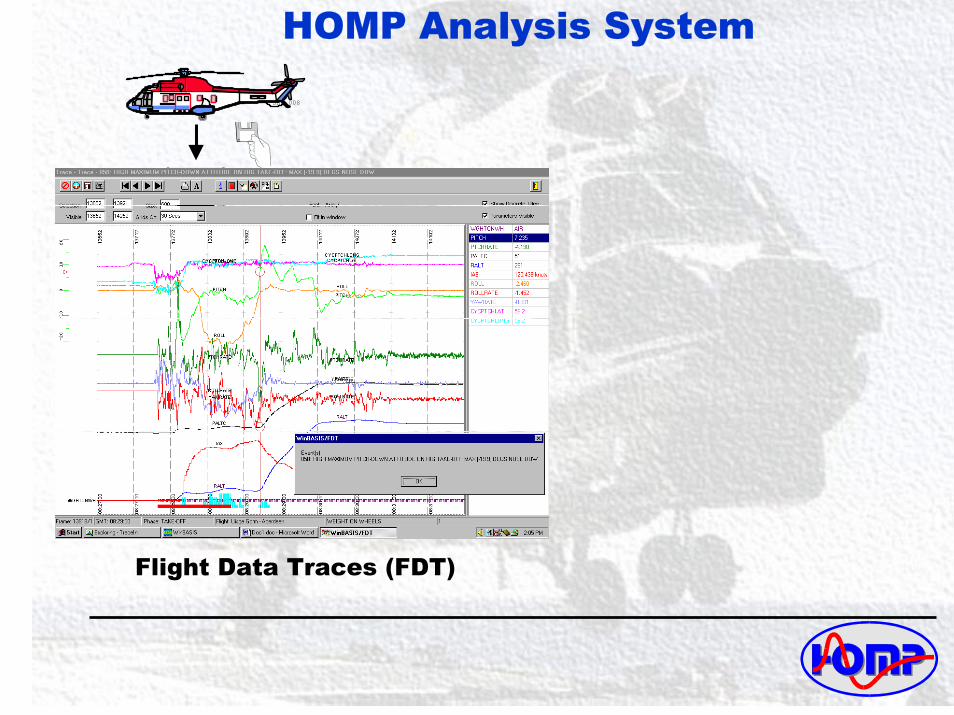
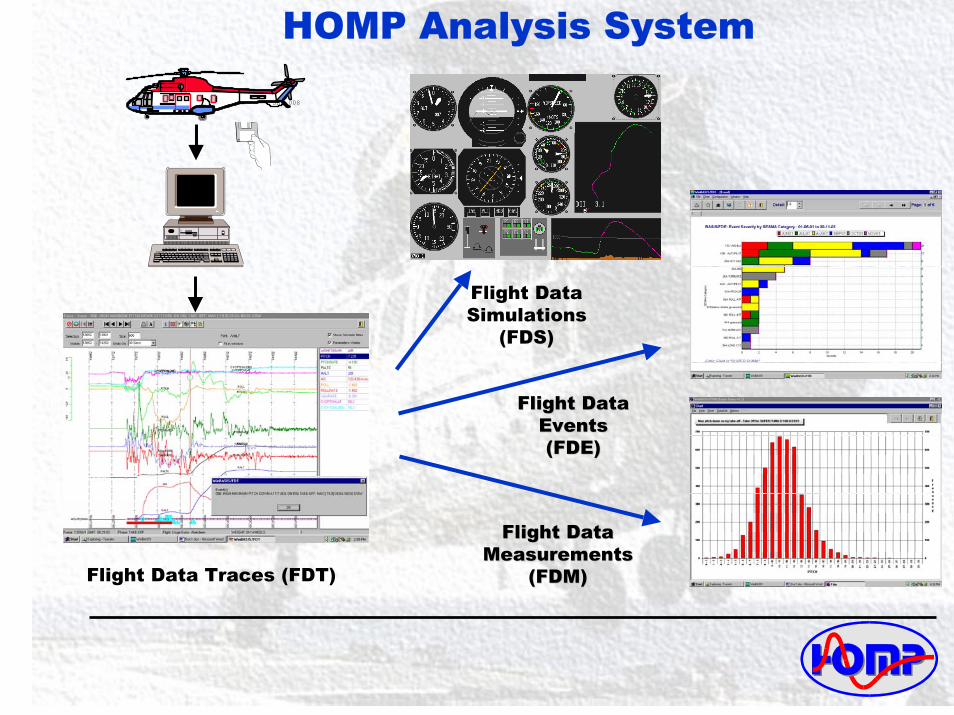
HOMP Analysis System
SHL 008
Flight Data Traces (FDT)
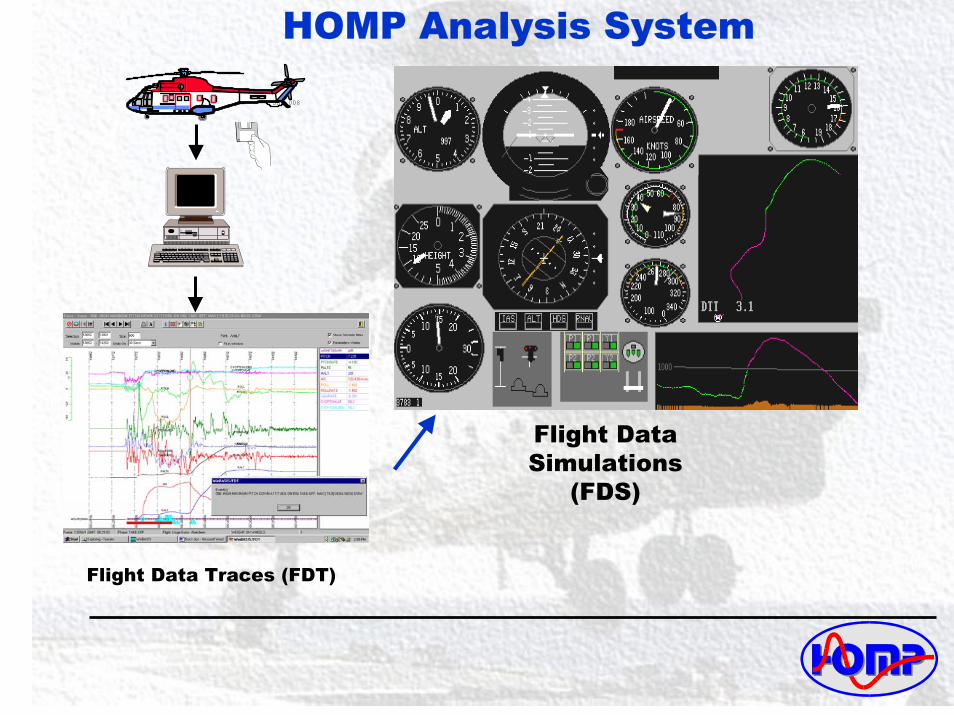
HOMP Analysis System
SHL 008
Flight DataSimulations
(FDS)
Flight Data Traces (FDT)
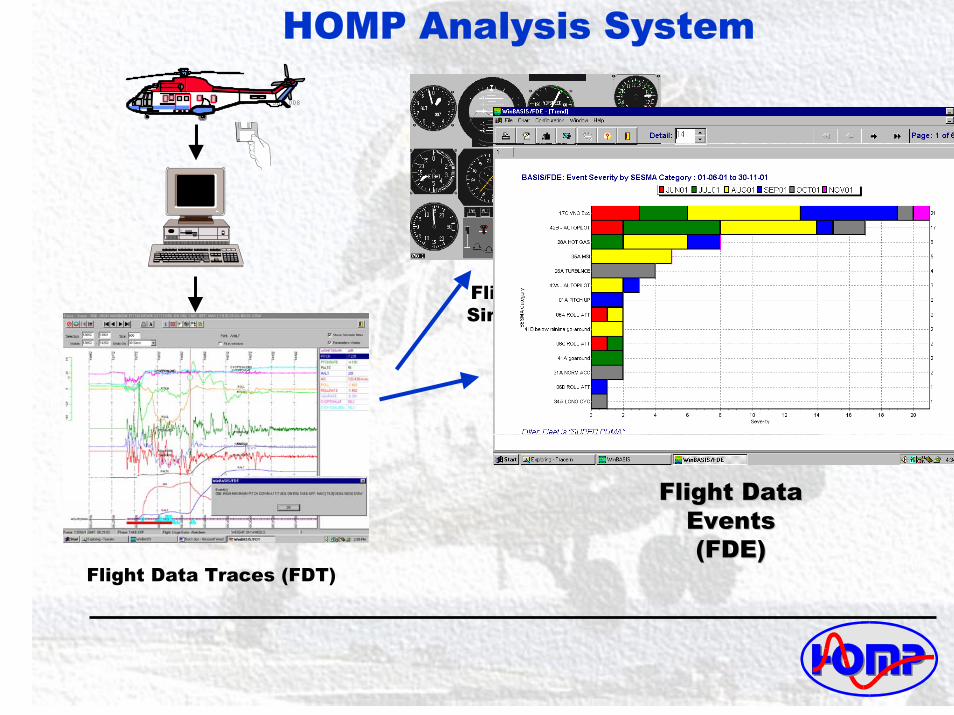
HOMP Analysis System
SHL 008
Flight DataSimulations
(FDS)
Flight DataFlight DataEventsEvents(FDE)(FDE)
Flight Data Traces (FDT)
HOMP Analysis System
SHL 008
Flight DataSimulations
(FDS)
Flight DataFlight DataEventsEvents(FDE)(FDE)
Flight Data Measurements (FDM)Flight Data Measurements (FDM)Flight Data Traces (FDT)
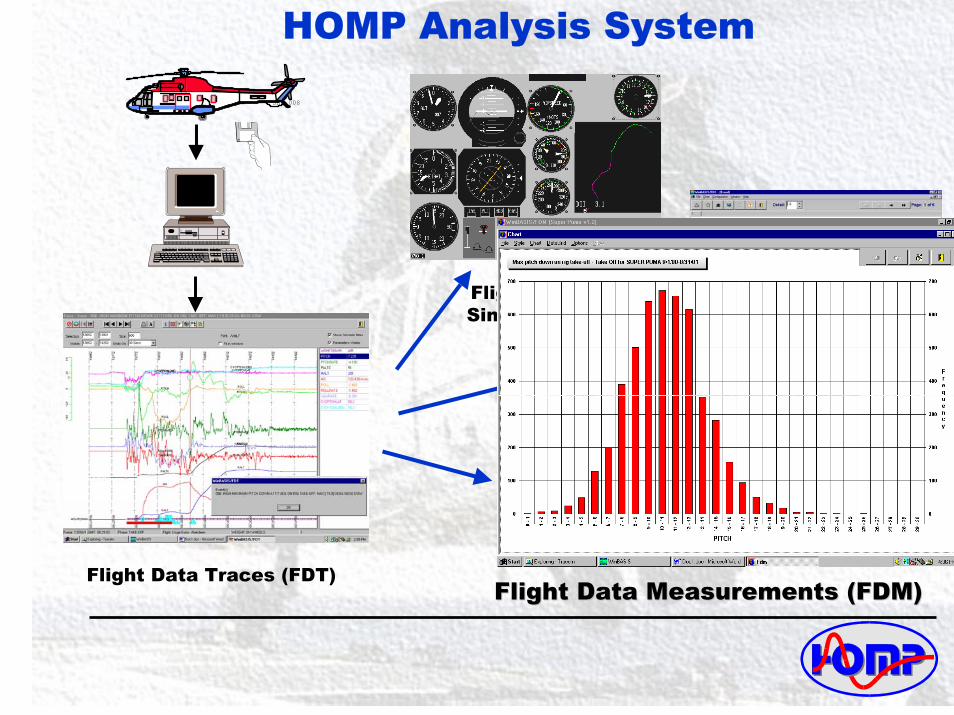
HOMP Analysis System
SHL 008
Flight DataSimulations
(FDS)
Flight DataFlight DataEventsEvents(FDE)(FDE)
Flight DataFlight DataMeasurementsMeasurements
(FDM)(FDM)Flight Data Traces (FDT)
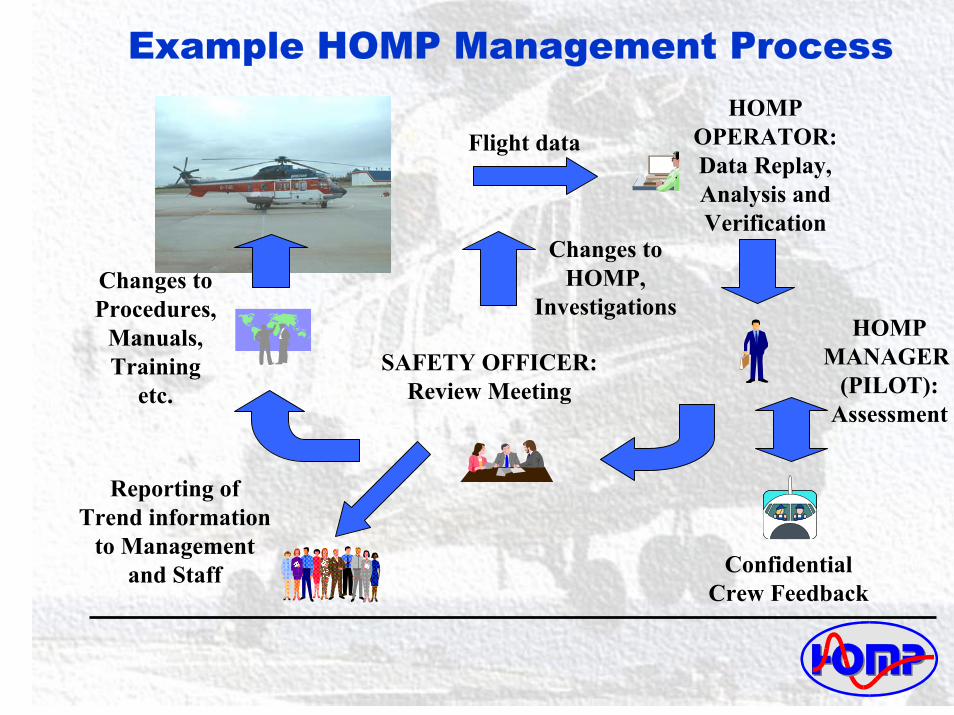
Example HOMP Management Process
Flight dataHOMP
OPERATOR:Data Replay,Analysis andVerification
ConfidentialCrew Feedback
SAFETY OFFICER:Review Meeting
Reporting ofTrend information
to Managementand Staff
Changes toHOMP,
InvestigationsHOMP
MANAGER (PILOT):
Assessment
Changes toProcedures,
Manuals,Training
etc.
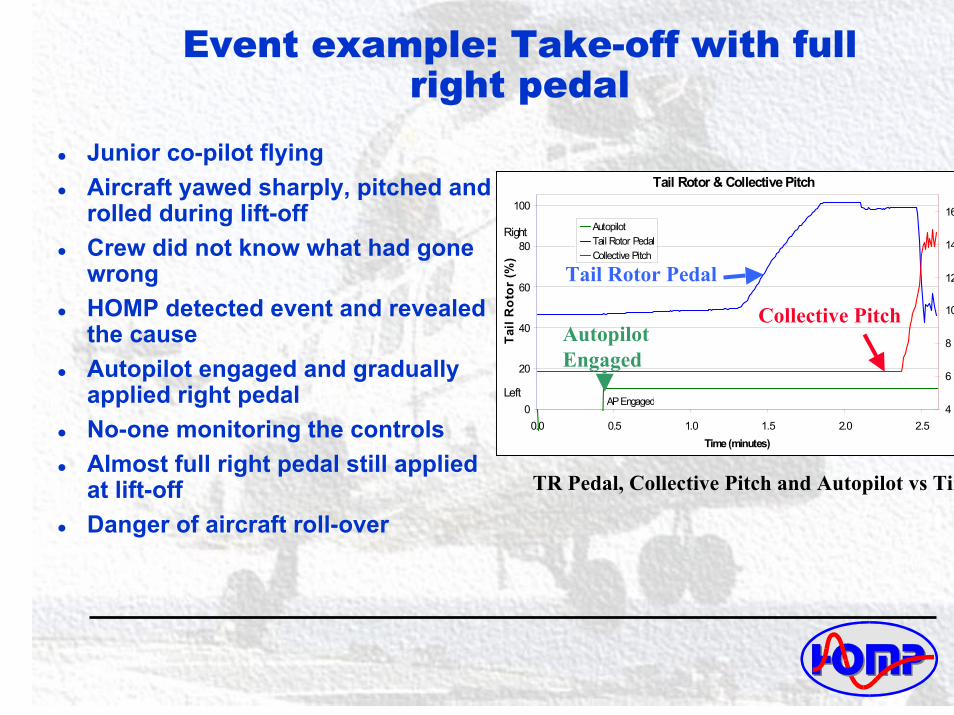
Event example: Take-off with full right pedal
Junior co-pilot flyingAircraft yawed sharply, pitched and rolled during lift-offCrew did not know what had gone wrongHOMP detected event and revealed the causeAutopilot engaged and gradually applied right pedalNo-one monitoring the controlsAlmost full right pedal still applied at lift-offDanger of aircraft roll-over
Tail Rotor & Collective Pitch
0
20
40
60
80
100
0.0 0.5 1.0 1.5 2.0 2.5Time (minutes)
Tail
Rot
or (%
)
4
6
8
10
12
14
16
Col
lect
ive
(deg
rees
)
AutopilotTail Rotor PedalCollective Pitch
Right
LeftAP Engaged
TR Pedal, Collective Pitch and Autopilot vs Time
Tail Rotor Pedal
Collective PitchAutopilot Engaged
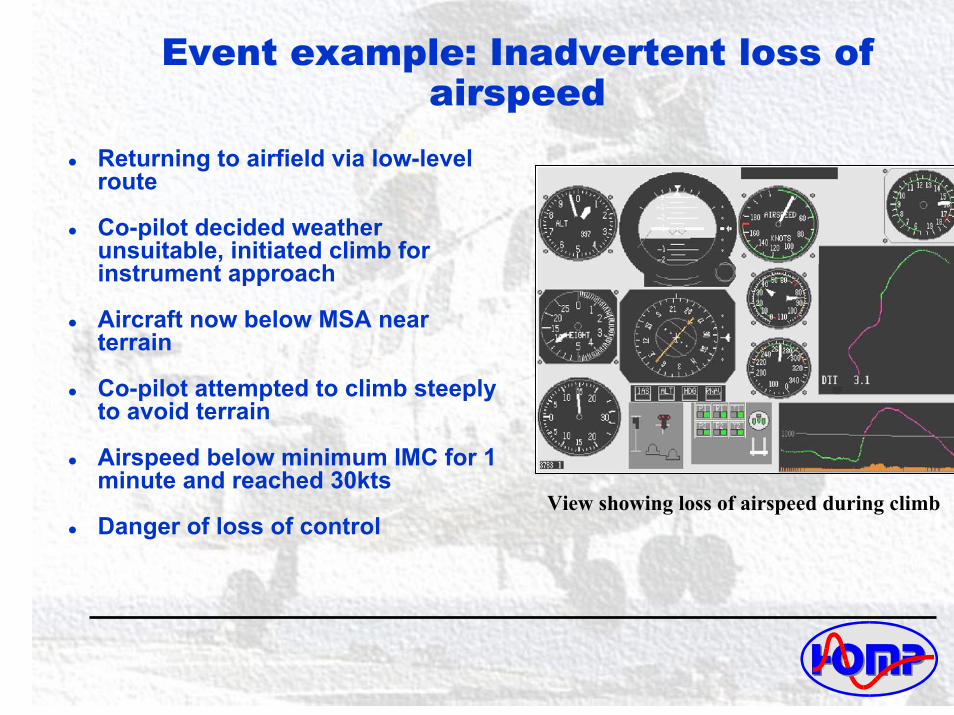
Event example: Inadvertent loss of airspeed
Returning to airfield via low-level route
Co-pilot decided weather unsuitable, initiated climb for instrument approach
Aircraft now below MSA near terrain
Co-pilot attempted to climb steeply to avoid terrain
Airspeed below minimum IMC for 1 minute and reached 30kts
Danger of loss of controlView showing loss of airspeed during climb
Event example: Takeoff with cabin heater on
Heater must be off for takeoff and landing as there is single-engine performance penalty
Many occurrences of heater being left on
Offshore check list does not include this item
A general bulletin was issued to aircrew
Very few events subsequently occurred
Decision not to add item to already long pre-takeoff checklist
HOMP enabled action to be taken, then monitored the effectiveness of this action
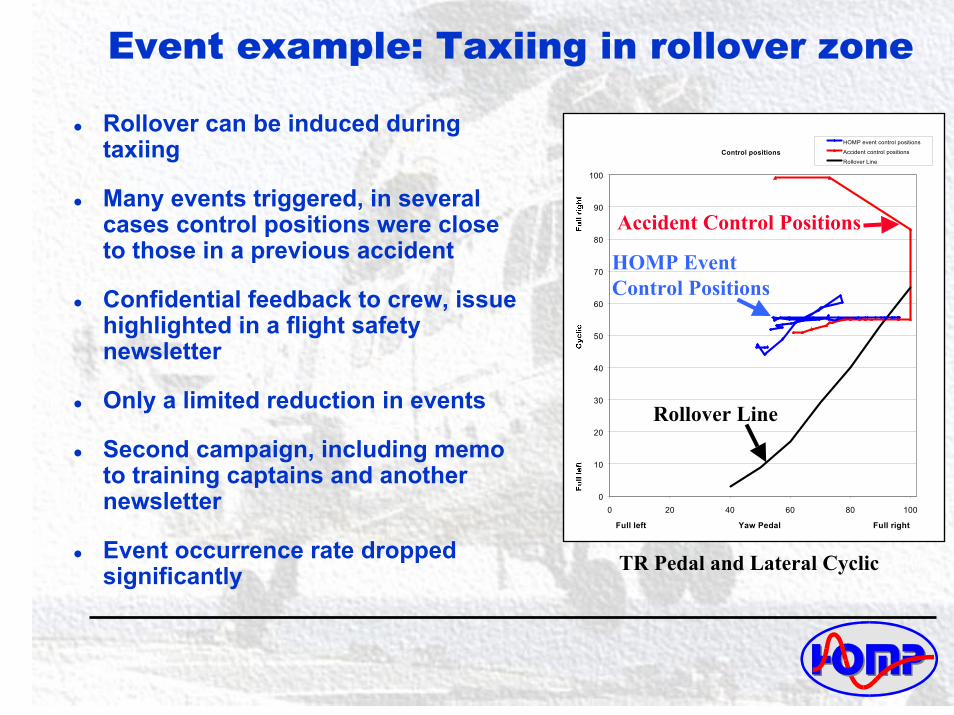
Event example: Taxiing in rollover zone
Rollover can be induced during taxiing
Many events triggered, in several cases control positions were close to those in a previous accident
Confidential feedback to crew, issue highlighted in a flight safety newsletter
Only a limited reduction in events
Second campaign, including memo to training captains and another newsletter
Event occurrence rate dropped significantly
Control positions
0
10
20
30
40
50
60
70
80
90
100
0 20 40 60 80 100
Full left Yaw Pedal Full right
HOMP event control positions
Accident control positions
Rollover Line
Rollover Line
Accident Control Positions
HOMP Event Control Positions
TR Pedal and Lateral Cyclic
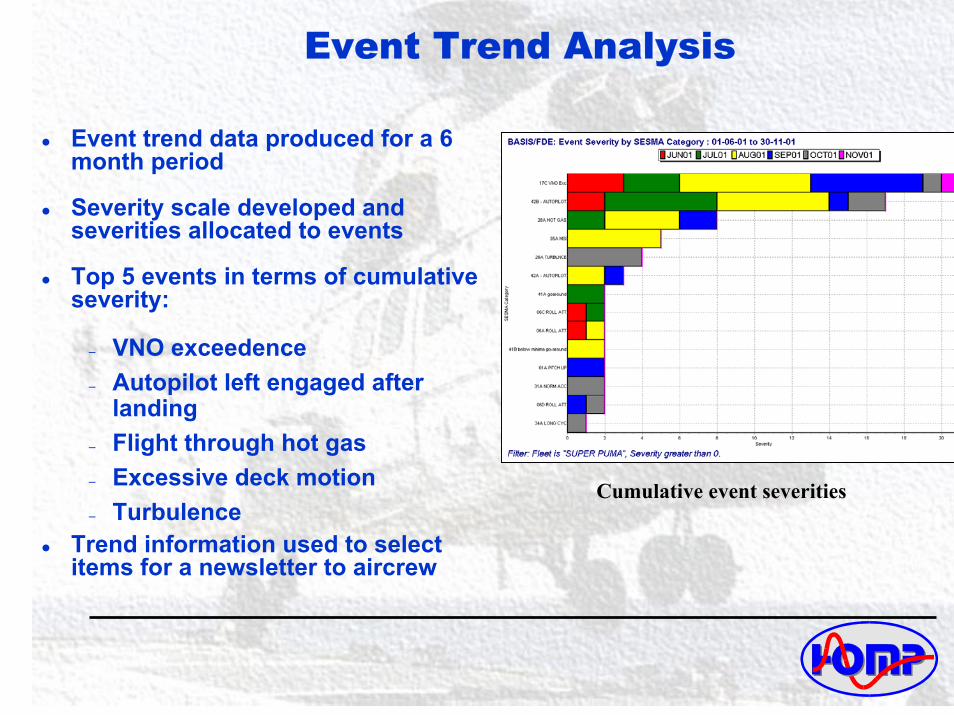
Event Trend Analysis
Event trend data produced for a 6 month period
Severity scale developed and severities allocated to events
Top 5 events in terms of cumulative severity:
– VNO exceedence– Autopilot left engaged after
landing– Flight through hot gas– Excessive deck motion– Turbulence
Trend information used to select items for a newsletter to aircrew
Cumulative event severities
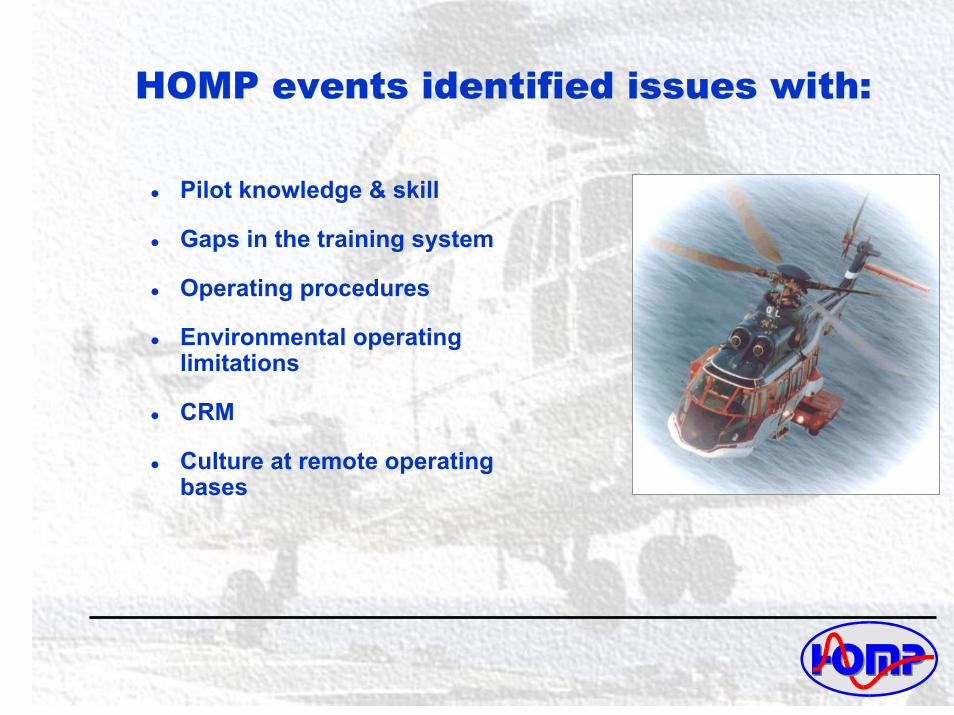
HOMP events identified issues with:
Pilot knowledge & skill
Gaps in the training system
Operating procedures
Environmental operating limitations
CRM
Culture at remote operating bases
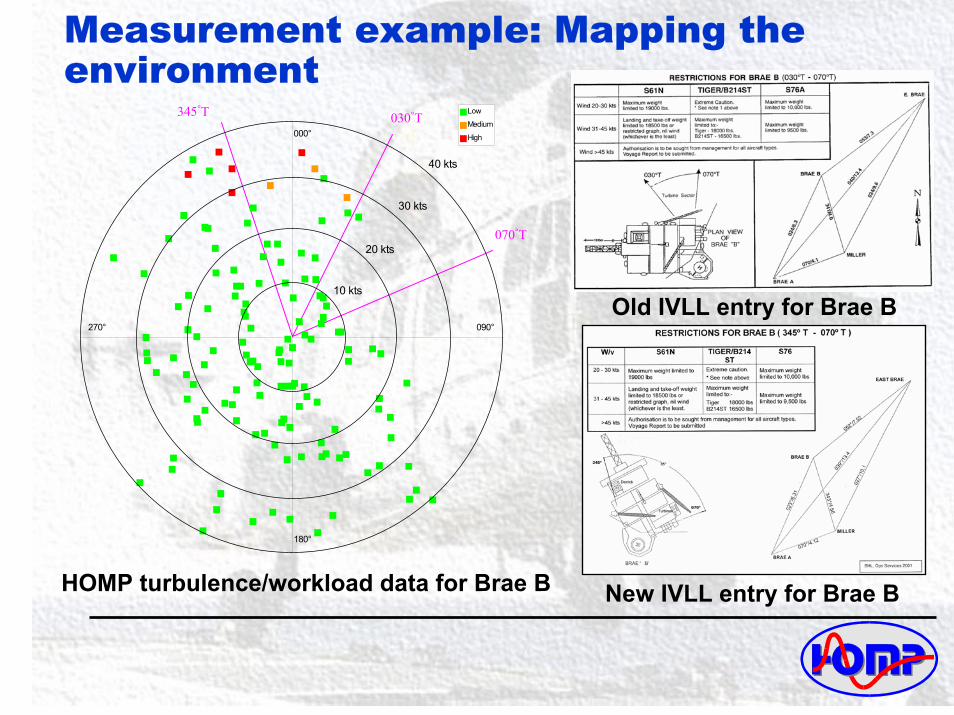
Measurement example: Mapping the environment
070°T
345°T 030°TLow
Medium
High000°
090°270°
180°
30 kts
40 kts
20 kts
10 kts
HOMP turbulence/workload data for Brae B
Old IVLL entry for Brae B
New IVLL entry for Brae B
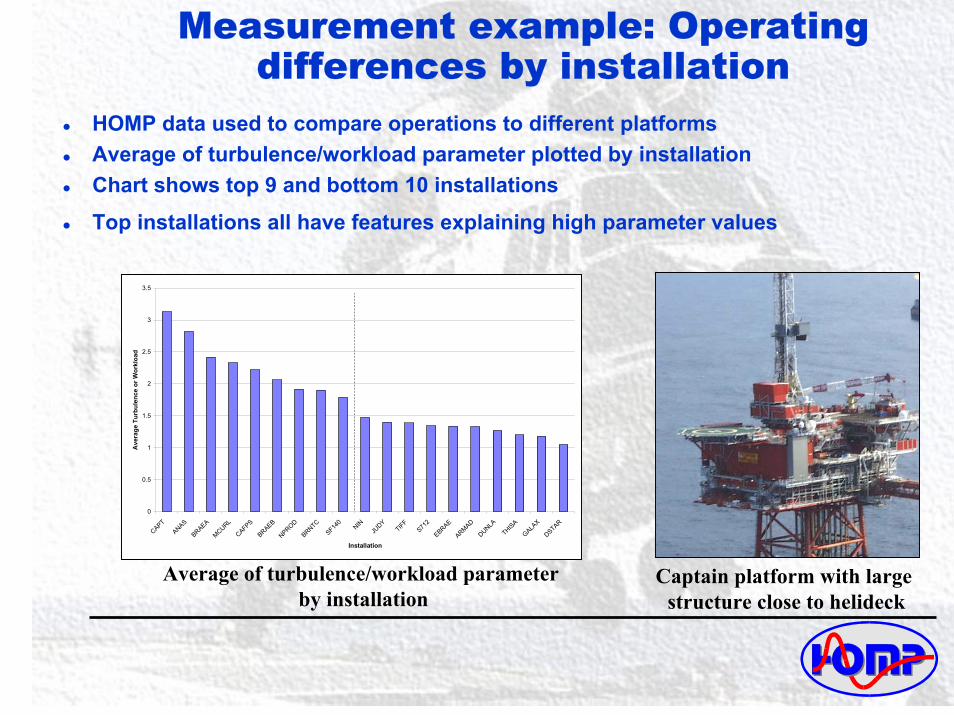
Measurement example: Operating differences by installation
HOMP data used to compare operations to different platformsAverage of turbulence/workload parameter plotted by installationChart shows top 9 and bottom 10 installationsTop installations all have features explaining high parameter values
0
0.5
1
1.5
2
2.5
3
3.5
CAPT
ANASBRAEAMCURLCAFPSBRAEBNPRODBRNTC
SF140
NIN
JUDY
TIFF
S712
EBRAEARMADDUNLA
THISAGALA
XDSTAR
Installation
Ave
rage
Tur
bule
nce
or W
orkl
oad
Average of turbulence/workload parameter by installation
Captain platform with large structure close to helideck
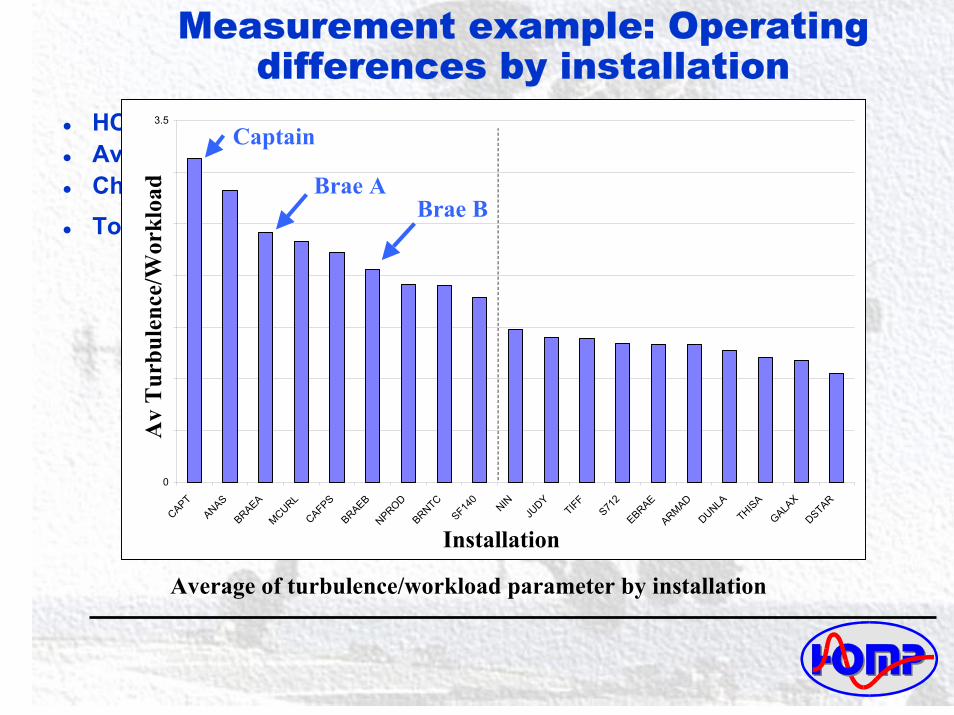
Measurement example: Operating differences by installation
HOMP data used to compare operations to different platformsAverage of turbulence/workload parameter plotted by installationChart shows top 9 and bottom 10 installationsTop installations all have features explaining high parameter values
Average of turbulence/workload parameter by installation
0
0.5
1
1.5
2
2.5
3
3.5
CAPT
ANASBRAEAMCURLCAFPSBRAEBNPRODBRNTC
SF140
NIN
JUDY
TIFF
S712
EBRAEARMADDUNLA
THISAGALA
XDSTAR
Installation
Ave
rage
Tur
bule
nce
or W
orkl
oad
Captain
Brae ABrae B
Av
Tur
bule
nce/
Wor
kloa
d
Installation

Measurement example: Operating differences by installation
HOMP data used to compare operations to different platformsAverage of turbulence/workload parameter plotted by installationChart shows top 9 and bottom 10 installationsTop installations all have features explaining high parameter values
0
0.5
1
1.5
2
2.5
3
3.5
CAPT
ANASBRAEAMCURLCAFPSBRAEBNPRODBRNTC
SF140
NIN
JUDY
TIFF
S712
EBRAEARMADDUNLA
THISAGALA
XDSTAR
Installation
Ave
rage
Tur
bule
nce
or W
orkl
oad
Average of turbulence/workload parameter by installation
Captain platform with large structure close to helideck
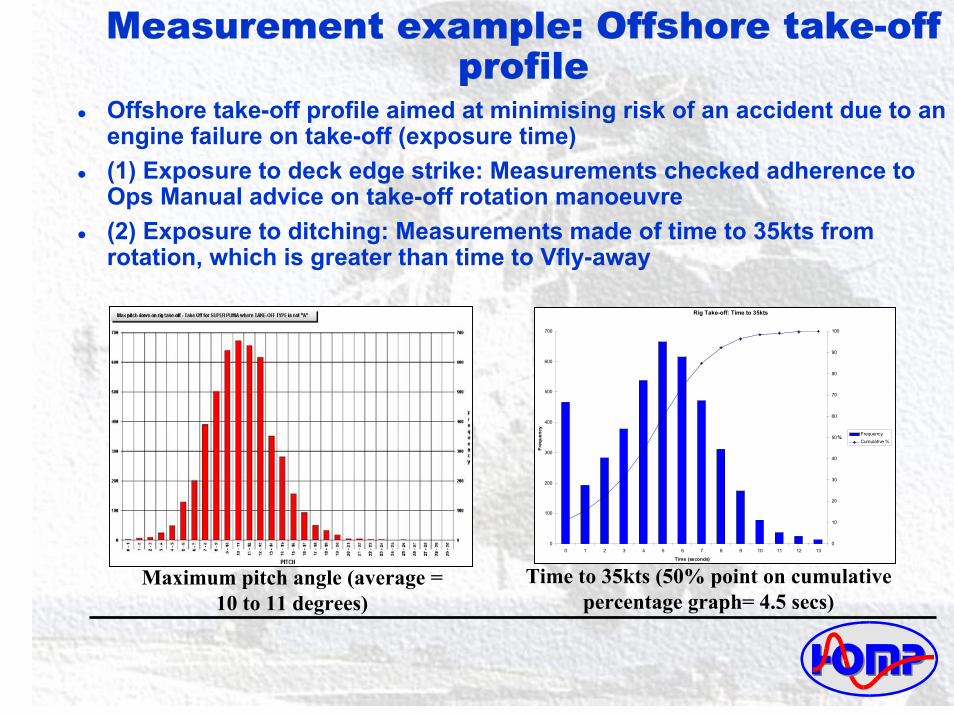
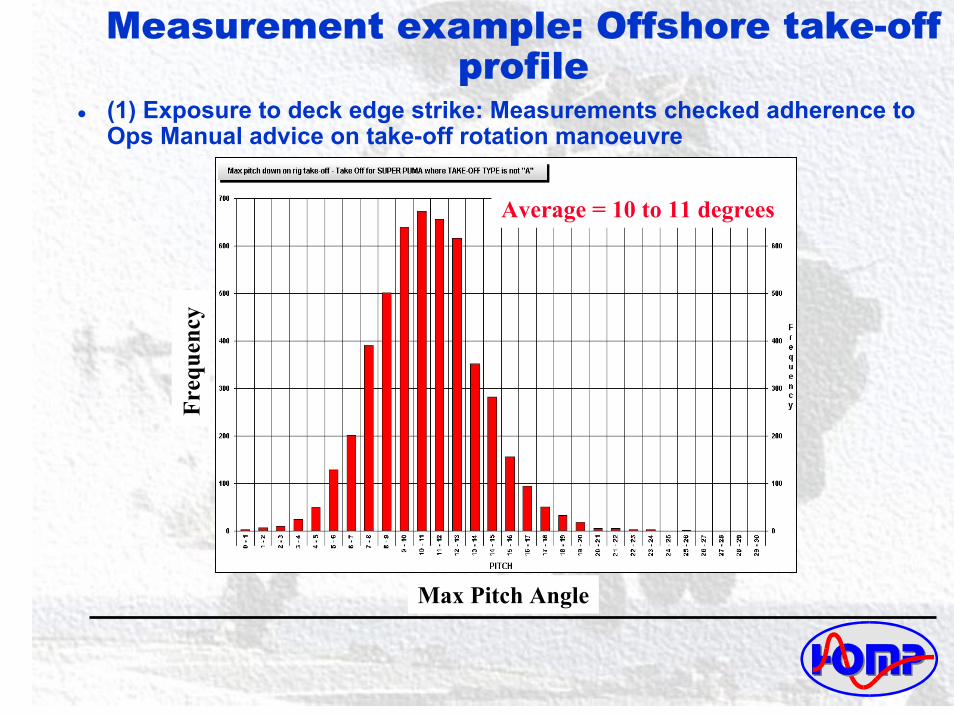
Measurement example: Offshore take-off profile
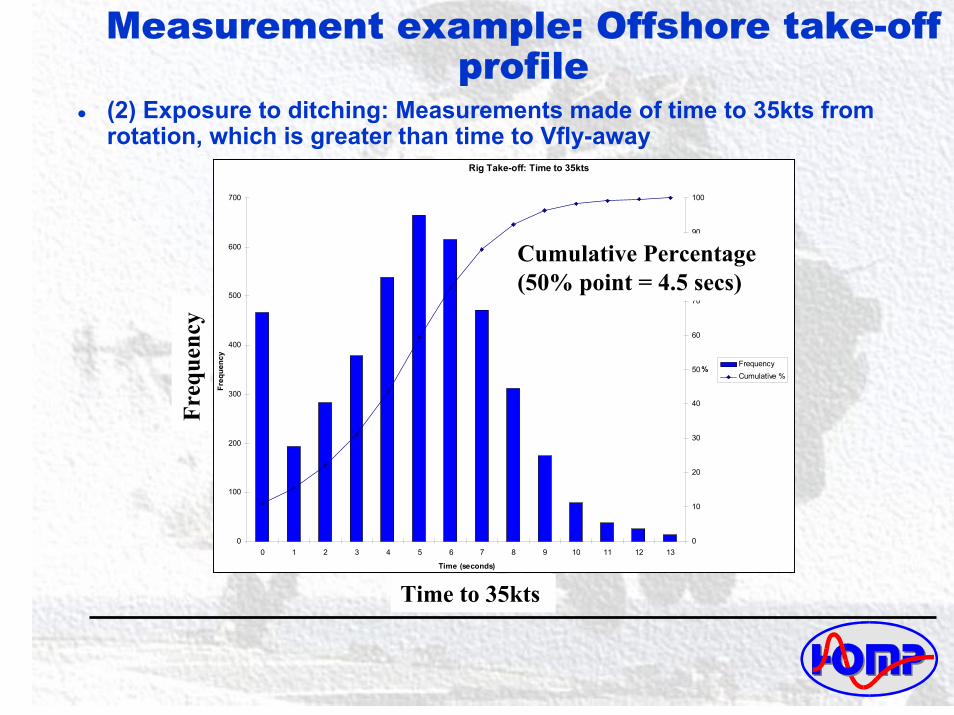
Offshore take-off profile aimed at minimising risk of an accident due to an engine failure on take-off (exposure time)(1) Exposure to deck edge strike: Measurements checked adherence to Ops Manual advice on take-off rotation manoeuvre(2) Exposure to ditching: Measurements made of time to 35kts from rotation, which is greater than time to Vfly-away
Maximum pitch angle (average = 10 to 11 degrees)
Time to 35kts (50% point on cumulative percentage graph= 4.5 secs)
Rig Take-off: Time to 35kts
0
100
200
300
400
500
600
700
0 1 2 3 4 5 6 7 8 9 10 11 12 13
Time (seconds)
Freq
uenc
y0
10
20
30
40
50
60
70
80
90
100
%FrequencyCumulative %
Measurement example: Offshore take-off profile
(1) Exposure to deck edge strike: Measurements checked adherence to Ops Manual advice on take-off rotation manoeuvre
Freq
uenc
y
Max Pitch Angle
Average = 10 to 11 degrees
Measurement example: Offshore take-off profile
(2) Exposure to ditching: Measurements made of time to 35kts from rotation, which is greater than time to Vfly-away
Rig Take-off: Time to 35kts
0
100
200
300
400
500
600
700
0 1 2 3 4 5 6 7 8 9 10 11 12 13
Time (seconds)
Freq
uenc
y
0
10
20
30
40
50
60
70
80
90
100
%FrequencyCumulative %
Freq
uenc
y
Time to 35kts
Cumulative Percentage(50% point = 4.5 secs)
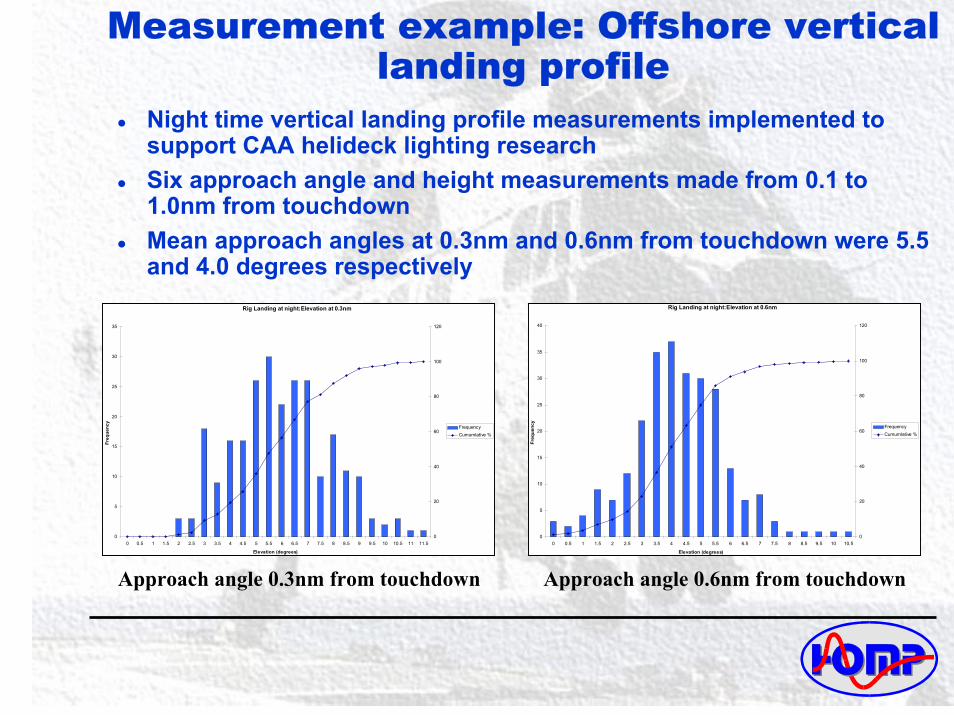
Measurement example: Offshore vertical landing profile
Night time vertical landing profile measurements implemented to support CAA helideck lighting researchSix approach angle and height measurements made from 0.1 to 1.0nm from touchdownMean approach angles at 0.3nm and 0.6nm from touchdown were 5.5 and 4.0 degrees respectively
Rig Landing at night:Elevation at 0.6nm
0
5
10
15
20
25
30
35
40
0 0.5 1 1.5 2 2.5 3 3.5 4 4.5 5 5.5 6 6.5 7 7.5 8 8.5 9.5 10 10.5
Elevation (degrees)
Freq
uenc
y0
20
40
60
80
100
120
FrequencyCumumlative %
Rig Landing at night:Elevation at 0.3nm
0
5
10
15
20
25
30
35
0 0.5 1 1.5 2 2.5 3 3.5 4 4.5 5 5.5 6 6.5 7 7.5 8 8.5 9 9.5 10 10.5 11 11.5
Elevation (degrees)
Freq
uenc
y
0
20
40
60
80
100
120
FrequencyCumumlative %
Approach angle 0.3nm from touchdown Approach angle 0.6nm from touchdown
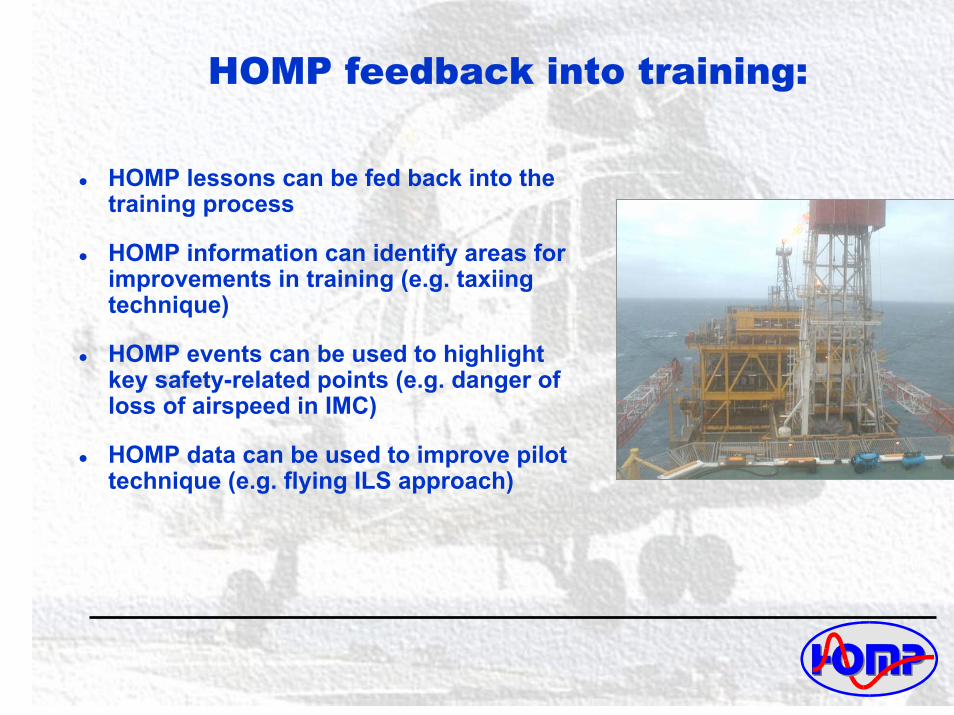
HOMP feedback into training:
HOMP lessons can be fed back into the training process
HOMP information can identify areas for improvements in training (e.g. taxiing technique)
HOMP events can be used to highlight key safety-related points (e.g. danger of loss of airspeed in IMC)
HOMP data can be used to improve pilot technique (e.g. flying ILS approach)
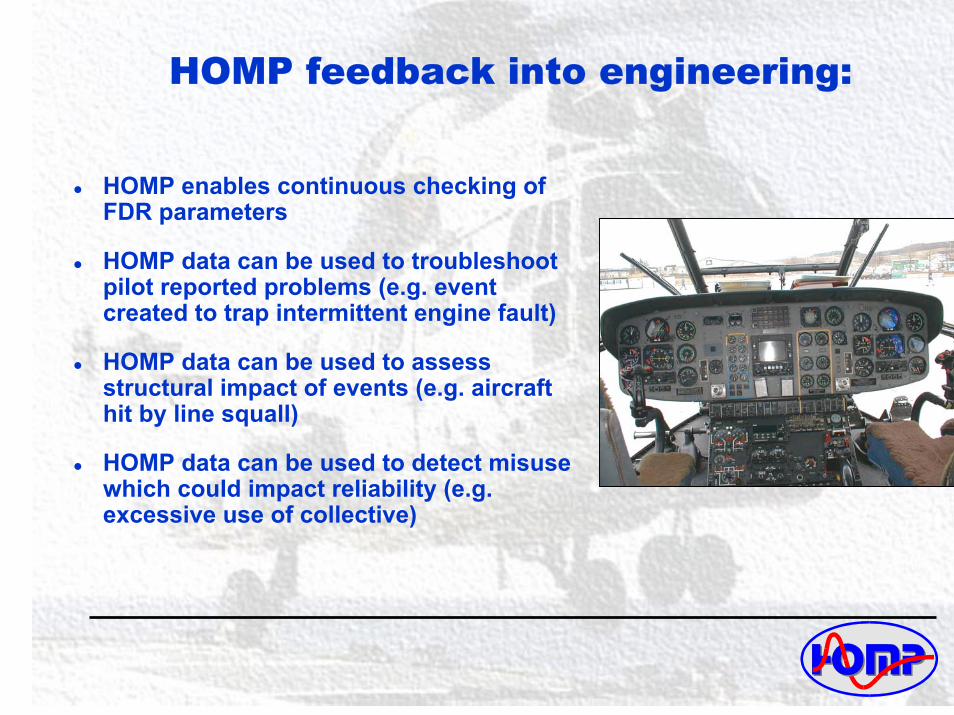
HOMP feedback into engineering:
HOMP enables continuous checking of FDR parameters
HOMP data can be used to troubleshoot pilot reported problems (e.g. event created to trap intermittent engine fault)
HOMP data can be used to assess structural impact of events (e.g. aircraft hit by line squall)
HOMP data can be used to detect misuse which could impact reliability (e.g. excessive use of collective)
Example Implementation Costs
StartStart--up costsup costs
– Per aircraft costs (including CQAR, mod kit and installation): typically no more than £10k
– Ground based system costs (3 fleets, including hardware, software and configuration): typically no more than £80k
– System introduction and commissioning
OnOn--going costsgoing costs
– Personnel (3 fleets): One full-time technician, one part-time HOMP Manager (1/3 time), one part-time Fleet Rep per fleet (1/4 time), Flight Safety Officer (1/4 time)
– System maintenance and support
Summary
The HOMP provided valuable new information on the risks associated with helicopter offshore operations
Events have identified hazards which otherwise would not have come to light
The operator has been able to take appropriate corrective and preventative measures
The measurements are building a useful picture of everyday operations which has not previously available
The HOMP has shown how pro-active use of flight data in a FDM programme can significantly enhance the safety of helicopter offshore operations
In Conclusion
The HOMP successfully identified and addressed significant safety issues
The HOMP trial demonstrated that it is a practical and cost effective flight safety tool
The trial equipment was very reliable and effective
The operator has implemented good HOMP operation and management procedures and aircrew response has been positive
Because of this success, UKOOA has committed its members to implement HOMP on all UK offshore helicopters