Embed Size (px)
Citation preview
165
doi: 10.2169/internalmedicine.8801-16
Intern Med 57: 165-171, 2018
http://internmed.jp
【 ORIGINAL ARTICLE 】
Progression of Hepatic Hypovascular Nodules withHypointensity in the Hepatobiliary Phase of
Gd-EOB-DTPA-enhanced MRI in HepatocellularCarcinoma Cases
Tsukasa Saitoh 1, Shuichi Sato 2, Tomotaka Yazaki 2, Hiroshi Tobita 2, Tatsuya Miyake 2,
Shunji Ishihara 2, Takashi Katsube 3, Hajime Kitagaki 3 and Yoshikazu Kinoshita 2
Abstract:Objective We investigated the possible factors for predicting the future progression to hepatocellular carci-
noma (HCC) from hypovascular nodules detected in the hepatobiliary phase of gadolinium-ethoxybenzyl-
diethylenetriamine pentaacetic acid-enhanced magnetic resonance imaging (Gd-EOB-DTPA-MRI).
Methods A total of 91 hypovascular nodules detected by Gd-EOB-DTPA-MRI in 28 patients without any
past history of treatment for HCC were retrospectively examined. The nodules were categorized into those
with and without HCC progression, then comparisons were made to identify any factors possibly related to a
progression to HCC in each case. In addition, we performed a receiver operating characteristics (ROC) analy-
sis to determine the cut-off value for the initial nodule size for predicting HCC progression within 12
months.
Results The observation period of the 28 patients was 1,172.6±95.6 (mean±standard error) days. The num-
ber of hypovascular nodules that changed to hypervascular ones was 15 (16.5%), and the cumulative inci-
dence of hypervascular transformation was 7.1% at 12 months and 12.7% at 24 months. Of all 91 hypovas-
cular nodules, 33 in 18 patients were diagnosed as HCC based on hypervascular transformation and/or size
enlargement, while the remaining 58 did not progress to HCC. There was no significant difference regarding
the background characteristics between the HCC progressed and non-progressed groups according to a multi-
variate analysis, or between the patients who had nodules that progressed to HCC and those with nodules
that did not progress to HCC. Regarding HCC progression at 12 months, the area under the ROC (AUROC)
had a level of 0.745 and showed that an initial nodule cut-off size of 9.5 mm (sensitivity, 57.9%; specificity,
87.3%) was predictive.
Conclusion In patients without a past HCC treatment history, it is difficult to determine whether hypovas-
cular nodules have a high risk of progression to HCC based on background factors alone.
Key words: Gd-EOB-DTPA, hepatic hypovascular nodule, hepatocellular carcinoma, magnetic resonance
imaging
(Intern Med 57: 165-171, 2018)(DOI: 10.2169/internalmedicine.8801-16)
Introduction
Hepatocellular carcinoma (HCC) is the sixth most com-
mon type of cancer in the world and third most frequent
cause of cancer death (1). Most cases are associated with
cirrhosis related to chronic hepatitis B virus (HBV) or hepa-
titis C virus (HCV) infection (2), and surveillance is needed
for patients with those high-risk conditions. The current
HCC surveillance methods include imaging studies and the
1Department of Gastroenterology, Matsue Red Cross Hospital, Japan, 2Department of Internal Medicine II, Shimane University Faculty of Medi-
cine, Japan and 3Department of Radiology, Shimane University Faculty of Medicine, Japan
Received: December 30, 2016; Accepted: May 17, 2017; Advance Publication by J-STAGE: October 16, 2017
Correspondence to Dr. Tsukasa Saitoh, [email protected]

Intern Med 57: 165-171, 2018 DOI: 10.2169/internalmedicine.8801-16
166
measurement of tumor markers. As for imaging, ultra-
sonography (US), contrast enhanced computed tomography
(CT), and magnetic resonance imaging (MRI) are widely
used, and recent improvements in those have enabled the
early detection of HCC and thus improved the treatment of
affected patients.
Gadolinium-ethoxybenzyl-diethylenetriamine pentaacetic
acid (Gd-EOB-DTPA), recently developed as a liver-specific
MRI contrast agent, provides information regarding the liver
hemodynamic state in the early dynamic phase as well as
the hepatocyte function in the hepatobiliary phase. Gd-EOB-
DTPA is taken up by hepatocytes (3), thus hepatic focal le-
sions without a normal hepatobiliary function can be de-
picted as hypointense lesions in comparison to the surround-
ing liver tissue with a normal hepatobiliary function in the
hepatobiliary phase (4). Previous studies have shown Gd-
EOB-DTPA-MRI to have a higher sensitivity for detecting
HCC than other imaging modalities, especially for lesions
smaller than 20 mm including hypovascular well-
differentiated HCC (5, 6). However, though Gd-EOB-DTPA-
MRI is useful for HCC detection, several unresolved issues
related to this imaging modality remain.
We often observe hypointensity nodules in the hepatobili-
ary phase of Gd-EOB-DTPA-MRI that are hypovascular in
the arterial phase. These tend to be diagnosed as potential
dysplastic nodules or possible well-differentiated HCC, and
therefore require follow-up examinations. During the follow-
up period, some lesions become hypervascular and are fi-
nally diagnosed as typical HCCs, while others remain stable
in regard to their size and characteristics, and may even dis-
appear. At present, it is not known which hypovascular nod-
ules detected by Gd-EOB-DTPA-MRI will finally become
hypervascular lesions and thereafter be diagnosed as typical
HCC. Additionally, in patients without a past history of
HCC treatment, the natural history of these hypovascular
nodules found incidentally has not yet been investigated.
In this retrospective longitudinal study, we examined the
natural course of Gd-EOB-DTPA-MRI-detected hypovascu-
lar nodules in patients without a past HCC treatment history.
We also analyzed the possible factors related to a future
HCC progression from these nodules.
Materials and Methods
The present study was approved by the ethics committee
of Shimane University Hospital, which waived the require-
ment for written informed consent because it was a retro-
spective analysis of medical records.
Patients
We recruited patients who were initially examined using
Gd-EOB-DTPA-MRI at Shimane University Hospital from
June 2008 to June 2013 for any reason. All nodules found
by that modality were then investigated in detail, after ex-
cluding liver hemangiomas and liver cysts. Nodules found in
patients previously treated for HCC prior to the initial Gd-
EOB-DTPA-MRI examination were also excluded, as were
those that were hypervascular in the arterial phase and
washed out in a later phase, as such nodules can easily be
diagnosed as HCC (7-9). Nodules �5 mm in diameter, hy-
povascular in the arterial phase, and those showing hypoin-
tensity in the hepatobiliary phase of Gd-EOB-DTPA-MRI
were included, as such nodules potentially progress to HCC
and were defined as hypovascular nodules for this study. As
a result, 91 hypovascular nodules observed in 28 patients
were included and evaluated.
Study groups
Nodules that were histopathologically diagnosed as HCC
during the follow-up period were determined to be nodules
that progressed to HCC during the study period. In addition,
the HCC diagnosis was also made based on the hypervascu-
larization of the nodules in the arterial phase of Gd-EOB-
DTPA-MRI and/or those that showed an enlargement of 2
mm or more in diameter. The nodules were categorized into
those that did and did not progress to HCC, and we made
comparisons to reveal any factors possibly related to HCC
progression. In addition to an analysis of each type of nod-
ule, we also analyzed the characteristics of the patients who
did and did not have nodules that progressed to HCC.
MRI technique
Gd-EOB-DTPA-MRI was performed using a commer-
cially available 1.5- or 3.0-T system (Signa HDx; GE
Healthcare, Milwaukee, USA). For signal reception, an 8-
channel phased-array surface coil that covered the entire
liver was used. The arterial and hepatobiliary phases of dy-
namic fat-suppressed gradient-echo (GRE) T1-weighted im-
ages (T1WIs) were performed at 20-30 seconds and 20 min-
utes, respectively, after the administration of Gd-EOB-DTPA
(PrimovistⓇ; Bayer Schering Pharma, Berlin, Germany) at
0.025 mmol/kg body weight at a speed of 1 mL/s through
an intravenous cubital line, followed by flushing with 20
mL of saline. The images were acquired in the transverse
plane and viewed in 5-mm slices.
Statistical analysis
A statistical analysis was performed using the IBM SPSS
Statistics software program, v. 19.0 (IBM, Chicago, USA).
Clinical variables were compared between the groups using
either Mann-Whitney’s U test or Pearson’s chi-square test.
Mann-Whitney’s U test was used to compare continuous
values, including the observation period, patient age, periph-
eral blood platelet count, prothrombin time (PT), albumin,
total-bilirubin (T-bil), aspartate aminotransferase (AST),
alanine aminotransferase (ALT), lactate dehydrogenase
(LDH), NH3, alfa fetoprotein (AFP), protein induced by vi-
tamin K absence or antagonist-II (PIVKA-II), and the nod-
ule size. Pearson’s chi-square test was used to compare any
categorical values, including gender, background liver etiol-
ogy [hepatitis B viral infection, hepatitis C viral infection,
or no such viral infection (non-B, non-C)], the presence of

Intern Med 57: 165-171, 2018 DOI: 10.2169/internalmedicine.8801-16
167
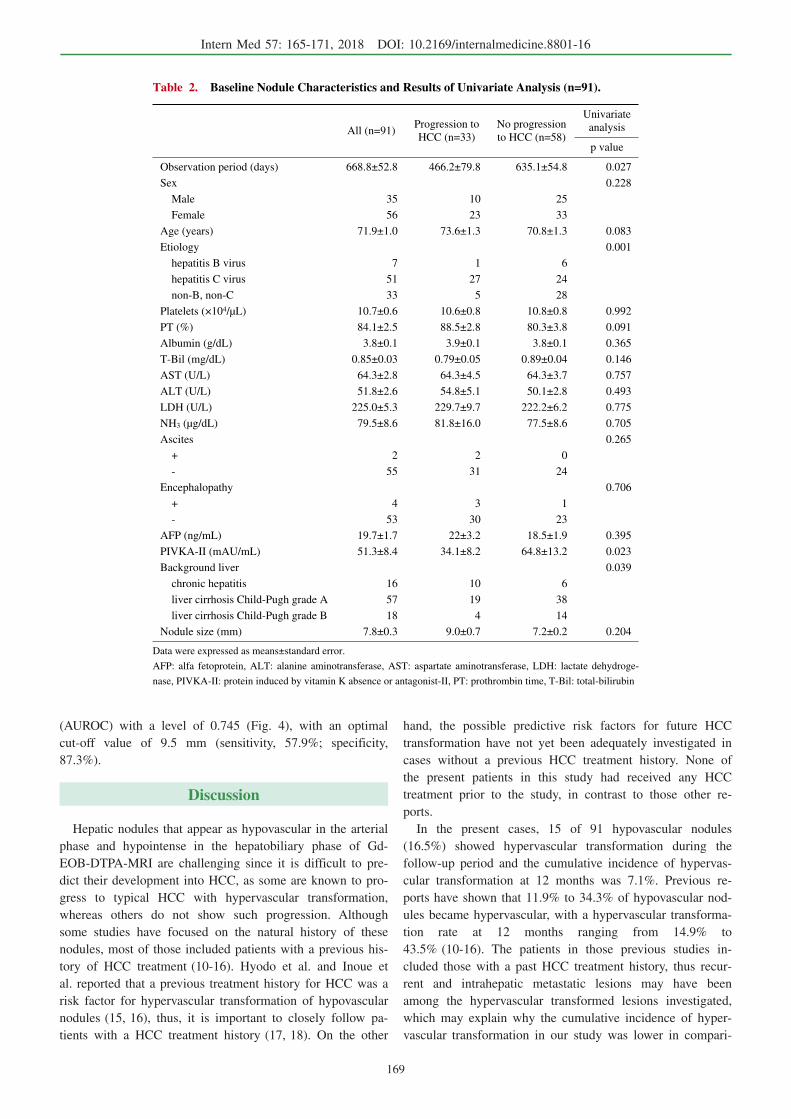
Figure 1. Representative course of hypervascular transformation of hypovascular nodules ob-served in a 77-year-old man with chronic hepatitis C. Shown are images from the arterial/hepatobili-ary phase of Gd-EOB-DTPA-MRI at the initial follow-up examination (A, B), then 2 (C, D), and 4 (E, F) years after the initial examination. In the hepatobiliary phase, a hypointense nodule was observed at the initial examination (B) and it showed a gradual growth thereafter (D, F: arrows). The nodule was not hypervascular in the images shown in (A) and (C), after which a hypervascular portion was observed (E: arrow). Gd-EOB-DTPA: gadolinium-ethoxybenzyl-diethylenetriamine pantaacetic acid
ascites and hepatic encephalopathy, and the background liver
condition (chronic hepatitis, Child-Pugh grade A or B liver
cirrhosis).
A multivariate analysis was also conducted using the find-
ings of a logistic regression analysis with the factors shown
to be significantly different between the groups by Mann-
Whitney’s U test or Pearson’s chi-square test. A p value
<0.05 was considered to indicate a statistically significant
difference.
A Kaplan-Meier time-to-event curve was produced to esti-
mate the cumulative hypervascular transformation of nodules
from a hypovascular state. This analysis was also done to
estimate the cumulative progression ratio of nodules to
HCC, which was defined as described above.
A receiver operating characteristics (ROC) analysis was
performed for nodules followed for more than 12 months to
determine the cut-off value of the initial nodule size for pre-
dicting HCC progression at 12 months.
Results
The mean age of the 28 patients at the time of the initial
Gd-EOB-DTPA-MRI examination was 68.8±1.8 (standard
error: SE) years old. The mean observation period was
1,172.6±95.6 days and 16 of the 28 patients were treated
during the observation period for hypovascular nodules that
showed a progression to HCC. Fig. 1 presents a representa-
tive course that showed the hypervascular transformation of
hypovascular nodules. All enrolled patients had chronic liver
diseases, ranging from chronic hepatitis to Child-Pugh grade
B liver cirrhosis (Table 1).
In the 28 patients, we identified 91 hepatic hypovascular
nodules with a risk of potential progression to HCC. Of
those, 15 (16.5%) hypovascular nodules changed to hyper-
vascular ones in the arterial phase and the mean observation
period until that transformation was 808.0±137.9 days.

Intern Med 57: 165-171, 2018 DOI: 10.2169/internalmedicine.8801-16
168
Figure 2. Cumulative ratio of hypervascular transforma-tion. The cumulative incidence of hypervascular transforma-tion was 7.1% at 12 and 12.7% at 24 months.
Number of nodules examined at each time point68 49 30 22 10 7 391 2
Figure 3. Cumulative ratio of the progression of hypovascu-lar nodules to HCC. The cumulative incidence of the progres-sion to HCC including hypervascular transformation and en-largement of the nodules was 22.4% at 12 and 29.1% at 24 months. HCC: hepatocellular carcinoma
Number of nodules examined at each time point91 43 17 4 164 26 5
Table 1. Baseline Characteristics of All Patients (n=28).
All patients (n=28)
Observation period (days) 1,172.6±95.6
Sex
male 12
female 16
Age (years) 68.8±1.8
Etiology
hepatitis B virus 3
hepatitis C virus 16
non-B, non-C 9
Therapy for HCC during observation period
yes 16
no 12
Number of Gd-EOB-DTPA-MRI examinations 5.6±0.6
Number of hypovascular nodules 3.3±0.5
Platelets (×104/μL) 10.5±0.9
PT (%) 87.3±5.2
Albumin (g/dL) 3.9±0.1
T-Bil (mg/dL) 0.94±0.06
AST (U/L) 60.4±4.9
ALT (U/L) 50.0±4.8
LDH (U/L) 224.8±9.2
NH3 (μg/dL) 93.8±21.8
Ascites
+ 1
- 27
Encephalopathy
+ 3
- 25
AFP (ng/mL) 18.7±3.3
PIVKA-II (mAU/mL) 47.4±17.0
Clinical diagnosis
chronic hepatitis 8
liver cirrhosis Child-Pugh grade A 15
liver cirrhosis Child-Pugh grade B 5
Data were expressed as means±standard error.
AFP: alfa fetoprotein, ALT: alanine aminotransferase, AST: aspartate
aminotransferase, LDH: lactate dehydrogenase, PIVKA-II: protein in-
duced by vitamin K absence or antagonist-II, PT: prothrombin time, T-
Bil: total-bilirubin
Fig. 2 shows the cumulative ratio of hypervascular transfor-
mation, which was 7.1% at 12 and 12.7% at 24 months.
Fig. 3 presents the cumulative ratio of hypovascular nodule
progression to HCC including hypervascular transformation
and nodule enlargement, which was 22.4% at 12 and 29.1%
at 24 months.
Among all 91 hypovascular nodules, 33 in 18 patients
were finally classified as showing HCC progression, while
the remaining 58 were classified as non-progression. A uni-
variate analysis revealed significant differences in regard to
the etiology of liver damage (p=0.001), plasma PIVKA-II
concentration (p=0.023), and background liver condition (p=
0.039) between the nodule groups (Table 2). However, ac-
cording to the multivariate analysis findings, those did not
remain as significant predictive factors.
While 18 patients had nodules that progressed to HCC,
there were 10 patients with nodules that showed no such
progression. As for the differences between these patient
groups, age (p=0.002) and etiology of liver damage (p=
0.013) were found to be significant in a univariate analysis
(Table 3). However, in a multivariate analysis, those did not
remain as significant predicting factors.
Among the 91 original hypovascular nodules, 17 were
followed for less than 12 months without any progression to
HCC. We conducted a ROC analysis of the remaining 74
nodules to predict their progression to HCC at 12 months.
The initial nodule size yielded an area under the ROC
Intern Med 57: 165-171, 2018 DOI: 10.2169/internalmedicine.8801-16
169
Table 2. Baseline Nodule Characteristics and Results of Univariate Analysis (n=91).
All (n=91)Progression to
HCC (n=33)
No progression
to HCC (n=58)
Univariate
analysis
p value
Observation period (days) 668.8±52.8 466.2±79.8 635.1±54.8 0.027
Sex 0.228
Male 35 10 25
Female 56 23 33
Age (years) 71.9±1.0 73.6±1.3 70.8±1.3 0.083
Etiology 0.001
hepatitis B virus 7 1 6
hepatitis C virus 51 27 24
non-B, non-C 33 5 28
Platelets (×104/μL) 10.7±0.6 10.6±0.8 10.8±0.8 0.992
PT (%) 84.1±2.5 88.5±2.8 80.3±3.8 0.091
Albumin (g/dL) 3.8±0.1 3.9±0.1 3.8±0.1 0.365
T-Bil (mg/dL) 0.85±0.03 0.79±0.05 0.89±0.04 0.146
AST (U/L) 64.3±2.8 64.3±4.5 64.3±3.7 0.757
ALT (U/L) 51.8±2.6 54.8±5.1 50.1±2.8 0.493
LDH (U/L) 225.0±5.3 229.7±9.7 222.2±6.2 0.775
NH3 (μg/dL) 79.5±8.6 81.8±16.0 77.5±8.6 0.705
Ascites 0.265
+ 2 2 0
- 55 31 24
Encephalopathy 0.706
+ 4 3 1
- 53 30 23
AFP (ng/mL) 19.7±1.7 22±3.2 18.5±1.9 0.395
PIVKA-II (mAU/mL) 51.3±8.4 34.1±8.2 64.8±13.2 0.023
Background liver 0.039
chronic hepatitis 16 10 6
liver cirrhosis Child-Pugh grade A 57 19 38
liver cirrhosis Child-Pugh grade B 18 4 14
Nodule size (mm) 7.8±0.3 9.0±0.7 7.2±0.2 0.204
Data were expressed as means±standard error.
AFP: alfa fetoprotein, ALT: alanine aminotransferase, AST: aspartate aminotransferase, LDH: lactate dehydroge-
nase, PIVKA-II: protein induced by vitamin K absence or antagonist-II, PT: prothrombin time, T-Bil: total-bilirubin
(AUROC) with a level of 0.745 (Fig. 4), with an optimal
cut-off value of 9.5 mm (sensitivity, 57.9%; specificity,
87.3%).
Discussion
Hepatic nodules that appear as hypovascular in the arterial
phase and hypointense in the hepatobiliary phase of Gd-
EOB-DTPA-MRI are challenging since it is difficult to pre-
dict their development into HCC, as some are known to pro-
gress to typical HCC with hypervascular transformation,
whereas others do not show such progression. Although
some studies have focused on the natural history of these
nodules, most of those included patients with a previous his-
tory of HCC treatment (10-16). Hyodo et al. and Inoue et
al. reported that a previous treatment history for HCC was a
risk factor for hypervascular transformation of hypovascular
nodules (15, 16), thus, it is important to closely follow pa-
tients with a HCC treatment history (17, 18). On the other
hand, the possible predictive risk factors for future HCC
transformation have not yet been adequately investigated in
cases without a previous HCC treatment history. None of
the present patients in this study had received any HCC
treatment prior to the study, in contrast to those other re-
ports.
In the present cases, 15 of 91 hypovascular nodules
(16.5%) showed hypervascular transformation during the
follow-up period and the cumulative incidence of hypervas-
cular transformation at 12 months was 7.1%. Previous re-
ports have shown that 11.9% to 34.3% of hypovascular nod-
ules became hypervascular, with a hypervascular transforma-
tion rate at 12 months ranging from 14.9% to
43.5% (10-16). The patients in those previous studies in-
cluded those with a past HCC treatment history, thus recur-
rent and intrahepatic metastatic lesions may have been
among the hypervascular transformed lesions investigated,
which may explain why the cumulative incidence of hyper-
vascular transformation in our study was lower in compari-

Intern Med 57: 165-171, 2018 DOI: 10.2169/internalmedicine.8801-16
170
Table 3. Baseline Patient Characteristics and Results of Univariate Analysis (n=28).
Progression to
HCC (n=18)
No progression
to HCC (n=10)
Univariate
analysis
p value
Observation period (days) 554.1±118.7 738.3±99.6 0.250
Sex 0.172
Male 6 6
Female 12 4
Age (years) 73.0±2.0 61.4±1.9 0.002
Etiology 0.013
hepatitis B virus 1 2
hepatitis C virus 14 2
non-B, non-C 3 6
Platelets (×104/μL) 10.4±1.0 10.4±1.9 0.924
PT (%) 88.8±3.6 82.7±7.7 0.741
Albumin (g/dL) 3.8±0.1 4.0±0.2 0.470
T-Bil (mg/dL) 0.85±0.07 1.06±0.11 0.142
AST (U/L) 61.3±5.4 59.6±9.8 0.549
ALT (U/L) 50.0±6.0 50.8±8.0 1.000
LDH (U/L) 221.4±11.4 225.0±14.3 0.848
NH3 (μg/dL) 102.0±27.5 66.3±15.2 0.735
Ascites 0.448
+ 1 0
- 17 10
Encephalopathy 0.927
+ 2 1
- 16 9
AFP (ng/mL) 22.6±5.2 13.8±3.6 0.342
PIVKA-II (mAU/mL) 41.4±14.4 136.0±72.2 0.282
Background liver 0.756
chronic hepatitis 6 2
liver cirrhosis Child-Pugh grade A 9 6
liver cirrhosis Child-Pugh grade B 3 2
Data were expressed as means±standard error.
AFP: alfa fetoprotein, ALT: alanine aminotransferase, AST: aspartate aminotransferase, LDH: lac-
tate dehydrogenase, PIVKA-II: protein induced by vitamin K absence or antagonist-II, PT: pro-
thrombin time, T-Bil: total-bilirubin
son to other reports.
In the present study, we compared 2 types of hypovascu-
lar nodules, those that did and did not show progression to
HCC, and 2 types of patients, those who did and did not
have hypovascular nodules that progressed to HCC. How-
ever, there was no statistical difference in regard to the
background factors including all clinical data between those
2 groups of nodules and patients. It is difficult to classify
hypovascular nodules into those with a high risk of progres-
sion to HCC based on background factors alone at the initial
time of identification, and thus it is important to closely
monitor all hypovascular nodules.
Some previous reports have noted that the initial nodule
size is a risk factor for the future development of
HCC (10-13). Although the present analysis was limited to
lesions followed for at least 12 months, our results sug-
gested that the initial nodule size of the nodule is useful for
predicting HCC progression within 12 months. Motosugi et
al., Kumada et al. and Takechi et al. reported 11, 15, and 9
mm, respectively, as the optimal nodule size cut-off val-
ues (10, 11, 13), which are slightly larger than that deter-
mined in the present study (cut-off 9.5 mm), because these
results covered only nodules showing hypervascular change.
On the other hand, Takayama et al. reported 9 mm as an op-
timal nodule size cut-off value for progression to hypervas-
cular and/or an enlarged lesion (12), very similar to that
found in the present study.
This study is associated with some limitations, including
its retrospective nature. In addition, the interval between Gd-
EOB-DTPA-MRI examinations was dependent on the at-
tending physician and varied among the patients. A future
prospective study with a consistent follow-up interval would
make more precise risk assessment possible. Furthermore, a
histopathological diagnosis of nodules was lacking in this
study. The parameters used for the HCC diagnosis were hy-
pervascular transformation and/or remarkable enlargement.

Intern Med 57: 165-171, 2018 DOI: 10.2169/internalmedicine.8801-16
171
Figure 4. A receiver operating characteristics (ROC) analy-sis for predicting HCC progression at 12 months. The area un-der the ROC (AUROC) was 0.745 and the optimal cut-off value was determined to be 9.5 mm (sensitivity, 57.9%; specificity, 87.3%). HCC: hepatocellular carcinoma
Finally, the number of patients and nodules included in this
study was rather limited. It will be necessary to conduct a
prospective study to investigate nodule size and the etiology
of liver damage that was shown to be a significant factor ac-
cording to a univariate analysis among all nodules and pa-
tients.
In conclusion, in patients without any past HCC treatment
history, it is difficult to divide hypovascular nodules into
those with a high risk of progression to HCC based on
background factors alone at the time of initial identification.
Since hypovascular nodules have the potential for HCC de-
velopment, it is important to closely follow up such affected
patients.
The authors state that they have no Conflict of Interest (COI).
References
1. Fitzmaurice C, Dicker D, Pain A, et al. The global burden of can-
cer 2013. JAMA Oncol 4: 505-527, 2015.
2. El-Serag HB. Epidemiology of viral hepatitis and hepatocellular
carcinoma. Gastroenterology 142: 1264-1273, 2012.
3. Schuhmann-Giampieri G, Schmitt-Willich H, Press WR, Negishi
C, Weinmann HJ, Speck U. Preclinical evaluation of Gd-EOB-
DTPA as a contrast agent in MR imaging of the hepatobiliary sys-
tem. Radiology 183: 59-64, 1992.
4. Vogel TJ, Kummel S, Hammerstingl R, et al. Liver tumors: com-
parison of MR imaging with Gd-EOB-DTPA and Gd-DTPA. Radi-
ology 200: 59-67, 1996.
5. Liu X, Zou L, Liu F, Zhou Y, Song B. Gadoxetic acid disodium-
enhanced magnetic resonance imaging for the detection of hepato-
cellular carcinoma: a meta-analysis. PLoS One 8: e70896, 2013.
6. Sugimoto K, Kim SR, Imoto S, et al. Characteristics of hypovas-
cular versus hypervacular well-differentiated hepatocellular carci-
noma smaller than 2 cm - focus on tumor size, markers and imag-
ing detectability. Dig Dis 33: 721-727, 2015.
7. Bruix J, Sherman M. Management of hepatocellular carcinoma: an
update. Hepatology 53: 1020-1022, 2011.
8. Llovet JM, Ducreux M, Lencioni R, et al. EASL-EORTC clinical
practice guidelines: management of hepatocellular carcinoma. J
Hepatol 56: 908-943, 2012.
9. Kudo M, Izumi N, Kokudo N, et al. Management of hepatocellu-
lar carcinoma in Japan: consensus-based clinical practice guide-
lines proposed by the Japan Society of Hepatology (JSH) 2010
updated version. Dig Dis 29: 339-364, 2011.
10. Motosugi U, Ichikawa T, Sano K, et al. Outcome of hypovascular
hepatic nodules revealing no gadoxetic acid uptake in patients
with chronic liver disease. J Magn Reson Imaging 34: 88-94,
2011.
11. Kumada T, Toyoda H, Tada T, et al. Evolution of hypointense he-
patocellular nodules observed only in the hepatobiliary phase of
gadoxetate disodium-enhanced MRI. AJR Am J Roentgenol 197:
58-63, 2011.
12. Takayama Y, Nishie A, Nakayama T, et al. Hypovascular hepatic
nodule showing hypointensity in the hepatobiliary phase of gadox-
tic acid-enhanced MRI in patients with chronic liver disease: pre-
diction of malignant transformation. Eur J Radiol 81: 3072-3078,
2012.
13. Takechi M, Tsuda T, Yoshioka S, et al. Risk of hypervasculariza-
tion in small hypovascular hepatic nodules showing hypointense in
the hepatobiliary phase of gadoxetic acid-enhanced MRI in pa-
tients with chronic liver disease. Jpn J Radiol 30: 743-751, 2012.
14. Higaki A, Ito K, Tamada T, et al. High-risk nodules detected in
the hepatobiliary phase of Gd-EOB-DTPA-enhanced MR imaging
in cirrhosis or chronic hepatitis: incidence and predictive factors
for hypervascular transformation, preliminary results. J Magn
Reson Imaging 37: 1377-1383, 2013.
15. Hyodo T, Murakami T, Imai Y, et al. Hypovascular nodules in pa-
tients with chronic liver disease: risk factors for development of
hypervascular hepatocellular carcinoma. Radiology 266: 480-490,
2013.
16. Inoue T, Hyodo T, Murakami T, et al. Hypovascular hepatic nod-
ules showing hypointense on the hepatobiliary-phase image of Gd-
EOB-DTPA-enhanced MRI to develop a hypervascular hepatocel-
lular carcinoma: a nationwide retrospective study on their natural
course and risk factors. Dig Dis 31: 472-479, 2013.
17. Kumada T, Nakano S, Takeda I, et al. Patterns of recurrence after
initial treatment in patients with small hepatocellular carcinoma.
Hepatology 25: 87-92, 1997.
18. Kim YS, Lim HK, Rhim H, et al. Ten-year outcomes of percuta-
neous radiofrequency ablation as first-line therapy of early hepato-
cellular carcinoma: analysis of prognostic factors. J Hepatol 58:
89-97, 2013.
The Internal Medicine is an Open Access article distributed under the Creative
Commons Attribution-NonCommercial-NoDerivatives 4.0 International License. To
view the details of this license, please visit (https://creativecommons.org/licenses/
by-nc-nd/4.0/).
Ⓒ 2018 The Japanese Society of Internal Medicine
Intern Med 57: 165-171, 2018


![Nodules & placards [Mode de compatibilité]](https://img.pdfslide.tips/doc/110x75/5875f8651a28ab1a6c8bcb4a/nodules-placards-mode-de-compatibilite.jpg)