Embed Size (px)
Citation preview
Quantitative 3D investigation of Neuronal network in mouse spinal cord model I. Bukreeva 1&, G. Campi 2&, M. Fratini13&, R. Spanò4, D. Bucci5, G. Battaglia5, F. Giove3,6, A. Bravin7, A. Uccelli8 , C. Venturi8 , M. Mastrogiacomo4 & A. Cedola1* 1. Institute of Nanotechnology-‐CNR c/o Physics Department at ‘Sapienza’ University, Piazzale Aldo Moro 2, 00185 Rome, Italy. 2. Institute of Crystallography-‐CNR, 00015 Monterotondo, Rome, Italy. 3. Museo Storico della Fisica e Centro Studi e Ricerche Enrico Fermi, Piazza del Viminale 1, 00184 Roma, Italy, 4. Department of Experimental Medicine, University of Genova & AUO San Martino -‐ IST Istituto Nazionale per la Ricerca sul Cancro, Largo R. Benzi 10, 16132 Genova, Italy. 5. I.R.C.C.S. Neuromed, Località Camerelle, 86077 Pozzilli, Italy. 6. Fondazione Santa Lucia I.R.C.C.S., Via Ardeatina 306, 00179 Roma, Italy 7. European Synchrotron Radiation Facility, 71 Avenue des Martyrs, 38043 Grenoble, Cedex France 8University of Genova DINOGMI Largo Daneo, 3 IT-‐16132 Genova & Equal contribution *Corresponding author: [email protected]
Supplementary Information To confirm the validity of our approach we compare the results obtained by applying our algorithm
on a tomographic reconstructed slice (20 micron thick) with the results obtained with a standard
quantitative analysis on a histological section (20 micron thick), treated with a motor neurons
marker (immunohistochemical analysis of SMI-32). As shown in the fig. S1 our approach locates
the neurons in the tomographic image in the same region where they appear in the histology. The
final neuron density in the histology, following the counting procedure described in Battaglia et al.
(2015)20, is about 6 x10³ in the healthy mouse. In the x-ray tomography, where our approach has
been applied, we found out 5 x10³.
Figure S1: A) Tomographic reconstructed slice of the healthy mouse spinal cord in the ventral horn of the cervical region (20 micron thick). B) Immunohistochemical analysis of SMI-32, a marker of motor neurons, of a representative healthy mouse spinal cord in the ventral horn of the cervical region, where was applied the statistical analysis to
distinguish the motor neurons to confirm the potentially of our approach for the 3D reconstruction of imaged spinal cord.
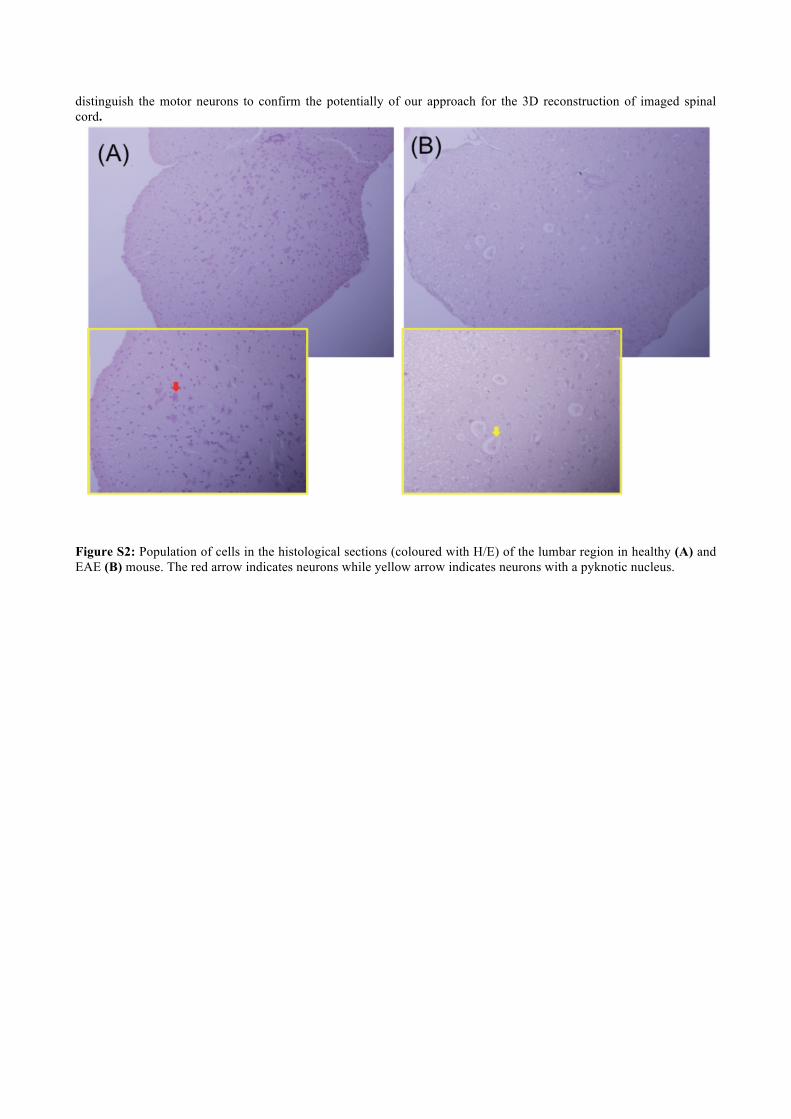
Figure S2: Population of cells in the histological sections (coloured with H/E) of the lumbar region in healthy (A) and EAE (B) mouse. The red arrow indicates neurons while yellow arrow indicates neurons with a pyknotic nucleus.
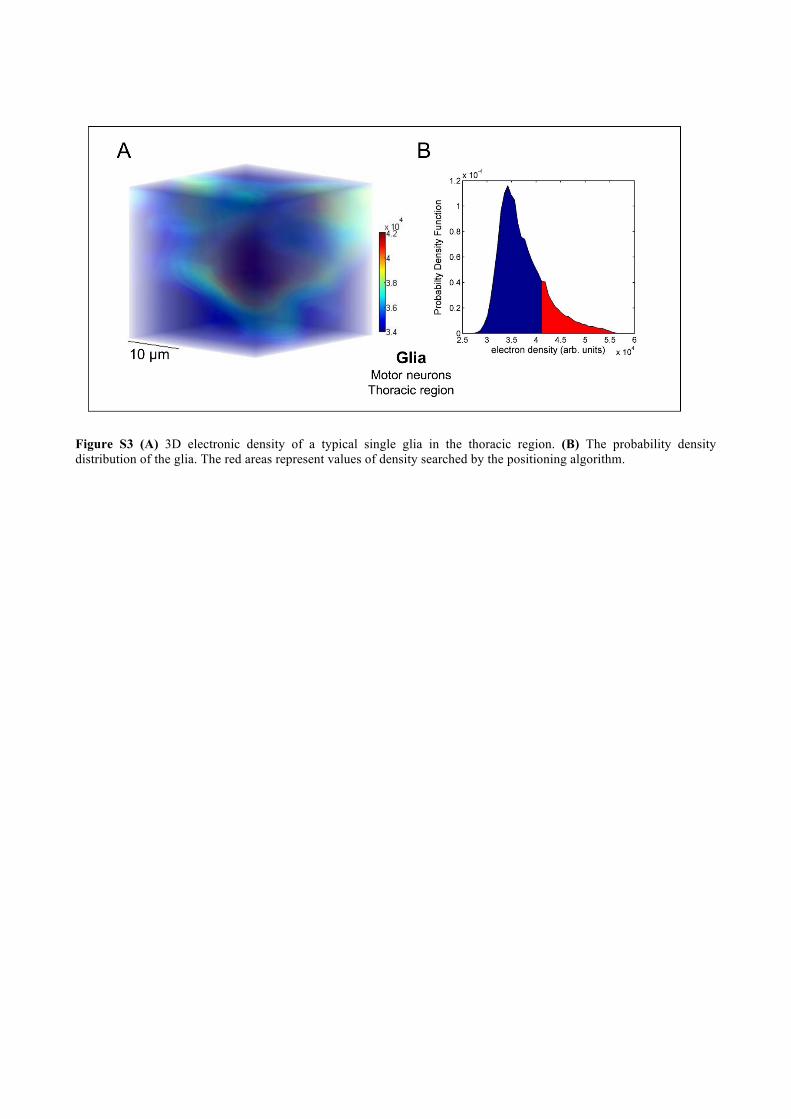
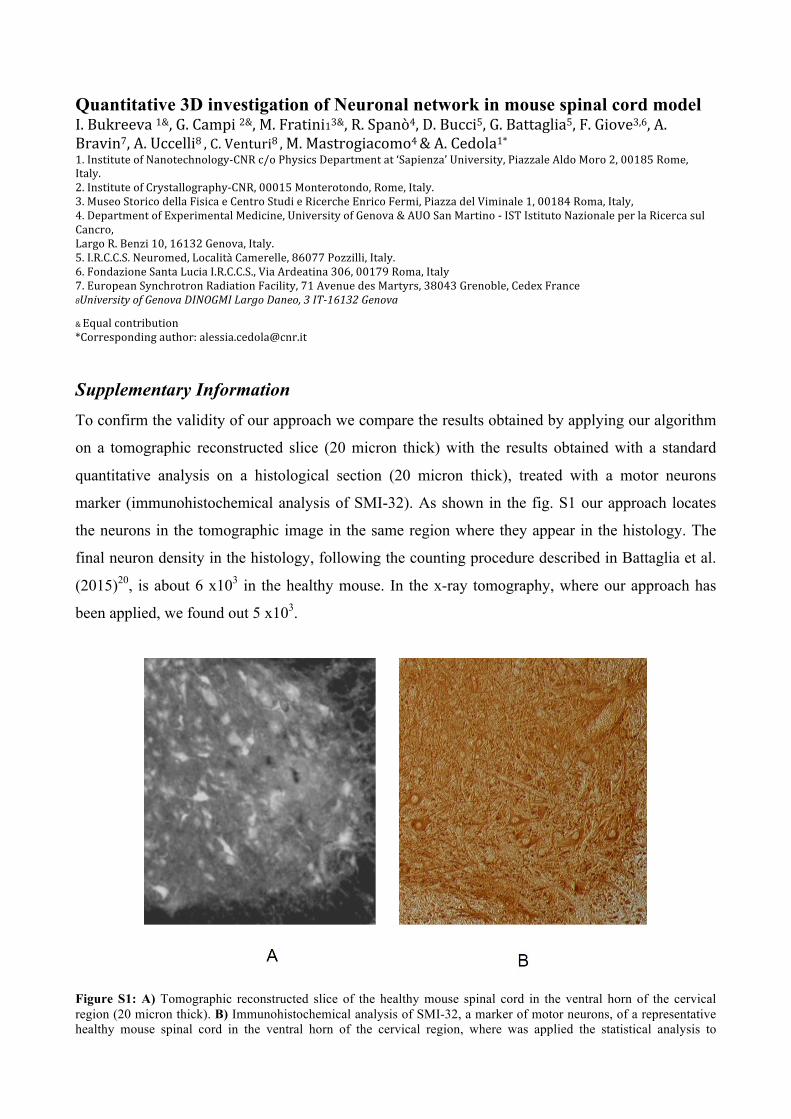
Figure S3 (A) 3D electronic density of a typical single glia in the thoracic region. (B) The probability density distribution of the glia. The red areas represent values of density searched by the positioning algorithm.