Embed Size (px)
Citation preview
Quantitative NDI Integration with Probabilistic Fracture Mechanics for the Assessment of Fracture Risk in Pipelines
Jochen H. Kurz, Dragos Cioclov, Gerd Dobmann, Christian Boller Fraunhofer Institut für Zerstörungsfreie Prüfverfahren (IZFP), Saarbrücken, Germany
Abstract. In the context of probabilistic paradigm of fracture risk assessment in structural components a computer simulation rationale is presented which has at the base the integration of Quantitative Non-destructive Inspection and Probabilistic Fracture Mechanics. In this study the static failure under static loading is assessed in the format known as Failure Assessment Diagram (FAD). The key concept in the analysis is the stress intensity factor (SIF) which accounts on the geometry of the component and the size of a pre-existent defect of a crack nature. FAD assessments can be made in deterministic sense, which yields the end result in dual terms of fail/not-fail. The fracture risk is evaluated in probabilistic terms. The superposed probabilistic pattern over the deterministic one (in mean sense) is implemented via Monte-Carlo sampling. The probabilistic fracture simulation yields a more informative analysis in terms of probability of failure. An important feature of the PVrisk software is the ability to simulate the influence of the quality and reliability of non-destructive inspection (NDI). It is achieved by integrating, algorithmically, probabilistic FAD analysis and the Probability of Detection (POD). The POD information can only be applied in a probabilistic analysis and leads to a refinement of the assessment. By this means, it can be ascertained the decrease of probability of failure (increase of reliability) when POD-characterized NDI is applied. Therefore, this procedure can be used as a tool for inspection based life time conceptions. In this paper results of sensitivity analyses of the fracture toughness are presented with the aim to outline, in terms of non-failure probabilities, the benefits of applying NDI, in various qualities, in comparison with the situation when NDI is lacking.
1. Introduction
1.1 Failure assessment by fracture mechanics methods
Nowadays, the non-destructive evaluation of structural components allows the detection of cracks and other types of flaws with high resolution. When cracks are involved in mechanical failure events, fracture mechanics provides concepts for lifetime prediction of components when component geometry, material characteristics and load intensity under steady state or dynamic loading are known.
Failure risk assessment of load-carrying components means analysing the state of the component which is determined by the conjoint interaction between defect type and magnitude, material microstructure and the state of stress induced by applied loading. Characterizing the defect state means detection of defects, classification of crack-like and non-crack-like and sizing. Obviously, from the failure potential standpoint, cracks are the most critical flaws. Nowadays, for engineering assessment purposes in metallic structures
4th European-American Workshop on Reliability of NDE - Fr.1.A.3
1
ww
w.ndt.net/index.php?id=
8354
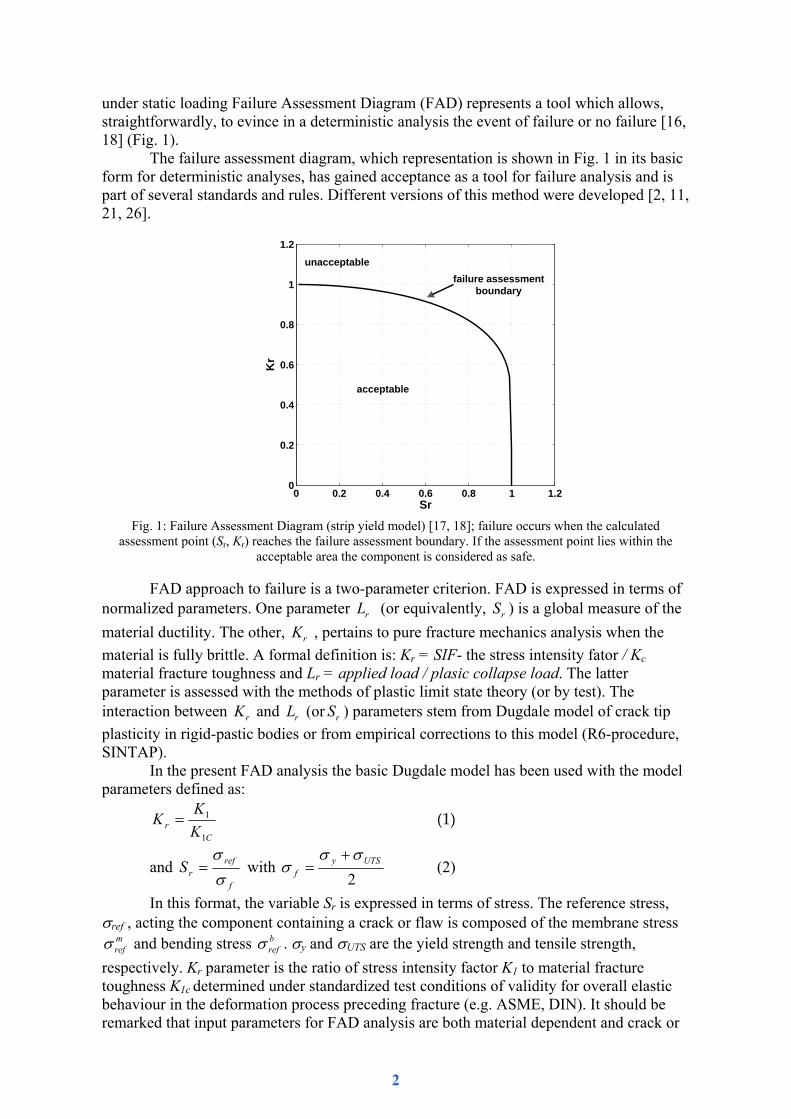
under static loading Failure Assessment Diagram (FAD) represents a tool which allows, straightforwardly, to evince in a deterministic analysis the event of failure or no failure [16, 18] (Fig. 1).
The failure assessment diagram, which representation is shown in Fig. 1 in its basic form for deterministic analyses, has gained acceptance as a tool for failure analysis and is part of several standards and rules. Different versions of this method were developed [2, 11, 21, 26].
0 0.2 0.4 0.6 0.8 1 1.20
0.2
0.4
0.6
0.8
1
1.2
Sr
Kr
acceptable
unacceptable
failure assessmentboundary
Fig. 1: Failure Assessment Diagram (strip yield model) [17, 18]; failure occurs when the calculated
assessment point (Sr, Kr) reaches the failure assessment boundary. If the assessment point lies within the acceptable area the component is considered as safe.
FAD approach to failure is a two-parameter criterion. FAD is expressed in terms of
normalized parameters. One parameter rL (or equivalently, rS ) is a global measure of the material ductility. The other, rK , pertains to pure fracture mechanics analysis when the material is fully brittle. A formal definition is: Kr = SIF- the stress intensity fator / Kc material fracture toughness and Lr = applied load / plasic collapse load. The latter parameter is assessed with the methods of plastic limit state theory (or by test). The interaction between rK and rL (or rS ) parameters stem from Dugdale model of crack tip plasticity in rigid-pastic bodies or from empirical corrections to this model (R6-procedure, SINTAP).
In the present FAD analysis the basic Dugdale model has been used with the model parameters defined as:
Cr K
KK1
1= (1)
and f
refrS
σσ
= with 2
UTSyf
σσσ
+= (2)
In this format, the variable Sr is expressed in terms of stress. The reference stress, σref , acting the component containing a crack or flaw is composed of the membrane stress
mrefσ and bending stress b
refσ . σy and σUTS are the yield strength and tensile strength, respectively. Kr parameter is the ratio of stress intensity factor K1 to material fracture toughness K1c determined under standardized test conditions of validity for overall elastic behaviour in the deformation process preceding fracture (e.g. ASME, DIN). It should be remarked that input parameters for FAD analysis are both material dependent and crack or
2
flaw geometry/crack size dependent, in the latter case via the analytical expression of stress intensity factor. The concept of stress intensity factor determination can be found in text- and handbooks (e.g. [1], [20]).
1.2 b) Probabilistic assessment of failure risk
Failure Assessment Diagram was originally designed for deterministic input information. However, material values are scattered and have error bounds. If the crack or flaw geometry was determined by non-destructive testing methods, measurement errors are also present. Therefore, realistic assumptions require the consideration of uncertainties [12]. The result of such an analysis is a quantitative assessment in terms of probability of failure. The probabilistic failure assessment has the capability to take all uncertainties of the input parameters into account.
However, the result is a probability of failure and not a fail/safe decision which is a matter of a higher level decision which must account on information not contained in FAD such as maintenance policy, the operational risk, human errors included and economic considerations. Though, a realistic analysis has to consider all sources of uncertainty and variability [12].
Within a risk based analysis two aspects play a key role: the risk frequency and the risk severity. The risk frequency assessment consists of two components, the statistical inference on past events (a posteriori analysis) and the probabilistic prediction (a priori analysis). The severity assessment considers the economic, environmental, social, political etc. aspects. Therefore, the risk as the result of a probabilistic assessment can be, globally, quantified as follows [19]:
⎥⎦⎤
⎢⎣⎡×⎥⎦
⎤⎢⎣⎡=⎥⎦
⎤⎢⎣⎡
EventeConsequencSeverity
UnitTimeEventFrequency
UnitTimeeConsequencRisk (3)
One way to reduce plants failure probabilities is to inspect the plant periodically and repair or replace the components that show signs of deterioration and damage. Such in-service inspections are particularly common for pressure vessels, piping and associated welds. In the past, inspection intervals were based on historical experience and engineering judgement. In recent years, methods have been developed to set inspection locations and intervals on the base of risk. A new engineering methodology has emerged known as risk based or risk-informed in-service inspection (ISI). Structural reliability (SR) and/or probabilistic fracture mechanics (PFM) is used further to estimate plants failure probability and systems risk assessment methodology is used to determine the effect of the plants failures on the entire risk of the system. These risk estimates are used to rank or group the plants components and the plants within the system according to their contribution to the risk. The higher ranked components or plants are inspected more often and more thoroughly [22].
One method to consider all uncertainties in an analysis and therefore to quantify the risk of failure is the Monte Carlo simulation (MCS). The term Monte Carlo methods describes a group of numerical procedures which all use random numbers in the numerical analysis or for the simulation of different processes. Monte Carlo methods are used in very different fields: engineering, statistical physics, geophysics and economy as most solient examples. However, all approaches have in common that the a priori information on the model parameters is represented by a probability distribution over the model space [3, 23]. In principle, using MCS all uncertainties can be taken into account in form of statistical distributions. The probabilistic fracture mechanical approach followed in this paper is based on the Monte Carlo simulation.
3
Besides the possibility to take measurement errors and the scattering of measurement data into account the direct MCS approach offers also the possibility to consider the influence of the applied non-destructive testing method. On the one hand this is done by considering the so called probability of detection (POD) for all cracks of a given length which is postulated as the proportion of cracks that will be detected by an NDE technique when applied by qualified operators to a population of components in a defined working environment. On the other hand measurement errors can also be considered in form of distributions.
POD is an important part of the design and maintenance procedure based on the damage tolerance concept. As a relevant example on this line it is worth mentioning the extended research performed during several high-tech development programs such as space shuttle program, development of off-shore structural design and maintenance and the development of damage tolerance design and philosophy applied to civil aircraft design and health monitoring [10, 14, 23].
The POD has to be determined individually for each NDT technique and technical application. So far, the irregularities of flaws are small in size, NDT techniques are very near to the physical limit of detectability, i.e., more data to evaluate are in the range of electrical noise hence, less detectability is to be expected [15].
2. Failure risk sensitivity study in a pipeline
2.1 Material characteristics and pipe geometry
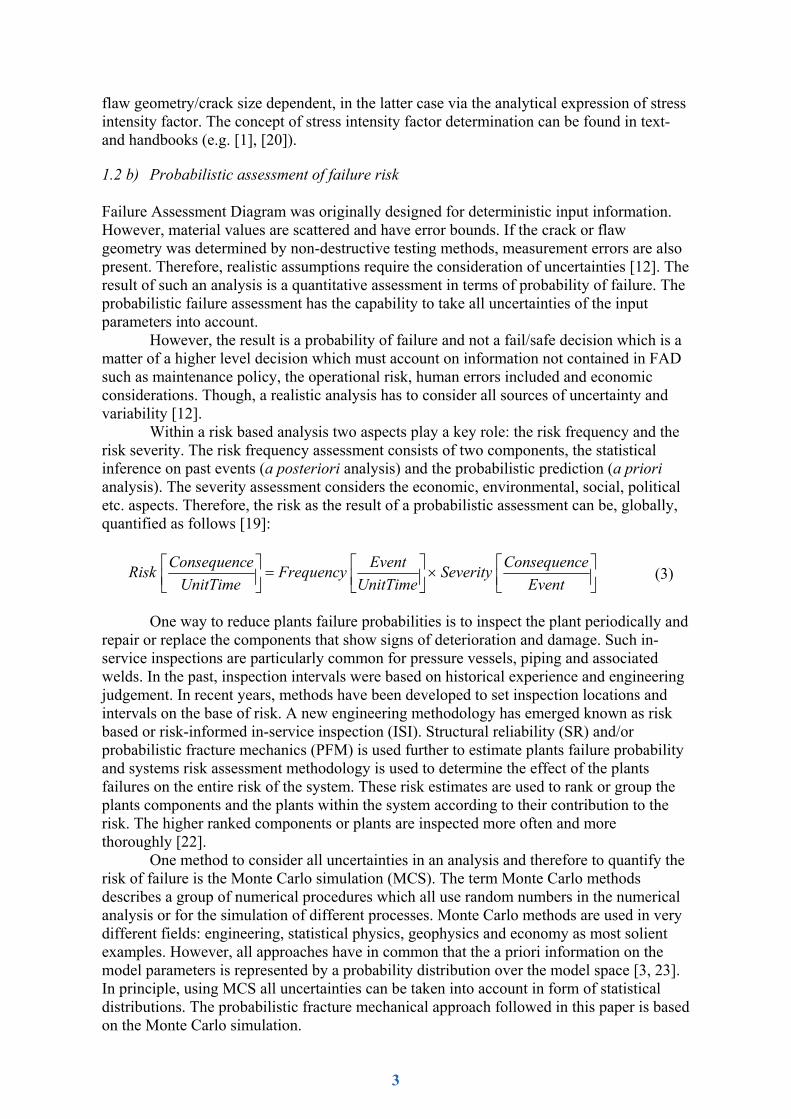
PVrisk rationale, adapted for failure risk assessment in pressure vessels and pipes is based on Monte Carlo simulation. Stress intensity factors (SIF) are calculated according to analytical solutions of wide recognizance. It is possible to implement numerical SIF data resulted from finite element analysis. The considered material in this study is a high strength low alloy steel (HSLA), API grade X70, 0.12%C (Nb V), TM-treatment. The deterministic mean values of the material strength and toughness characteristics, as well as the inner pressure in the pipe are listed in Tab. 1. Pipe dimensions are shown in Fig. 2 together with the geometry of assumed initial semi-elliptical crack, placed longitudinally on the inner face of the pipe. For comparison purposes the same pipe dimension, the crack geometry and crack size as in the analysis reported by [3, 4] have been considered.
Fig. 2 Sketch of the chosen crack geometry of an internal semi-elliptical crack in a cylindrical
pipeline. The geometry values of the specimens are drawn in the sketch.
4
Table 1. Deterministic material parameters and inner pressure
UTS [MPa] YP [MPa] Kc [MPa m ] Pressure [MPa] 565 482 140 12.1
2.2 Statistical variation of material characteristics
Material characteristics UTS, YP and Kc are assumed to have statistical variations which reflect the normal practice in nowadays steel manufacturing practice. Weibull three-parameter distribution has been chosen since, this extremal distribution is analytically versatile enabling to fit non-symmetric trends which is merely the rule than an exception encountered in processing experimental data in deformation and fracture of structural steel testing. Furthermore, Weibull distribution has a theoretical background stemming from the weakest-link model. The general form of 3P-Weibull distribution is:
( ) 0
0
1 exp⎡ ⎤⎛ ⎞−⎢ ⎥= − −⎜ ⎟−⎢ ⎥⎝ ⎠⎣ ⎦
b
a
x xP xx x
(4)
with 0x the inferior threshold, ax the scale parameter and b the shape parameter of the distribution.
Statistical parameters of the distribution of material characteristics used in the sensitivity analysis are given in Tab. 2.
Table 2. 3P Weibull distribution of strength characteristics. Statistic parameters.
Material characteristic 0x ax b
UTS – Ultimate Tensile Strength [MPa] 550 590 5 YP – Yield Point [MPa] 465 500 6
Kc - Fracture Toughness [MPa m ] 60 140 4
2.3 Initial crack and its statistics
FAD rationale presupposes the existence of an initial crack. In a present analysis the inner longitudinal crack is considered to penetrate the pipe wall as a transverse crack (b – direction) as is illustrated in Fig. 2. For failure risk analysis of structural elements which might contain cracks the problem of the initial crack is approached from the engineering design standpoint by the concept of equivalent initial flaw (EIF) size. This is a concept of importance in the design of heavy loaded structures in aircraft, off-shore or metallic structures industries [e.g. 13]. In the present study FAD analysis have been performed under both deterministic and statistic EIF size. Since it is relatively often the case that measurement errors of crack geometries are of minor influence on the quantitative NDT results most of the calculations in this study are performed with deterministic crack geometry values. Starting from the EIF values the statistic variation of crack size is considered to follow 3P-Weibull distribution with the parameters given in Tab. 3.
Table 3. 3P Weibull distribution of crack size. Statistic parameters.
Mean - mm Threshold - mm Scale - mm Shape b 4
0.0001*) 5.77 1
2=a b 8 11.54 1
*) Dummy value to emulate zero in computer processing.
5
2.4 Probability of crack detection
In order to explore the benefit gained in terms of reducing the failure risk as result of applying non-destructive testing (NDT) on flawed structural components, PVrisk has a module which simulates the probability of detection (POD) of flaws as function of their size, b. The relationship )(bPOD results from previous experiments performed under the very specific circumstances encountered in real-life operation of the component. Hence, a
)(bPOD curve specifically refers to NDT technique (ultrasound, eddy-currents, magnetic particles, etc.) as well as the geometry of the component, the NDT operators techniques and all other relevant factors which may influence the non-destructive inspection. In the present study Asymptotic exponential with lower threshold )(bPOD rule have been considered (e.g. Cioclov 2002):
⎭⎬⎫
⎩⎨⎧
⎥⎦
⎤⎢⎣
⎡−−
−−=)()(
exp1)(1 o
o
aaab
AbPOD (5)
with 0 1, andA a a as empirical fitting parameters. 0a is the inferior threshold of the crack size under which the considered NDT technique has no capacity of detection. 1a is a scale parameter while A is a parameter, close to unity, which is related with extraneous influences on POD.
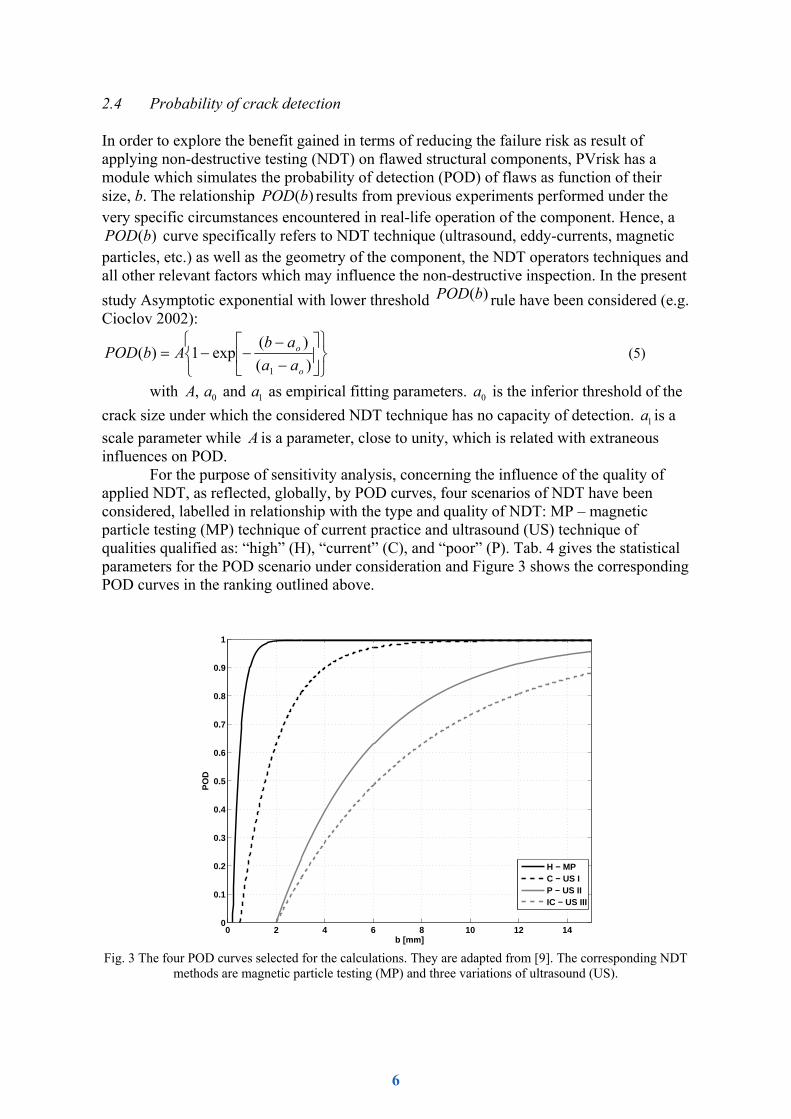
For the purpose of sensitivity analysis, concerning the influence of the quality of applied NDT, as reflected, globally, by POD curves, four scenarios of NDT have been considered, labelled in relationship with the type and quality of NDT: MP – magnetic particle testing (MP) technique of current practice and ultrasound (US) technique of qualities qualified as: “high” (H), “current” (C), and “poor” (P). Tab. 4 gives the statistical parameters for the POD scenario under consideration and Figure 3 shows the corresponding POD curves in the ranking outlined above.
0 2 4 6 8 10 12 140
0.1
0.2
0.3
0.4
0.5
0.6
0.7
0.8
0.9
1
b [mm]
PO
D
H − MPC − US IP − US IIIC − US III
Fig. 3 The four POD curves selected for the calculations. They are adapted from [9]. The corresponding NDT
methods are magnetic particle testing (MP) and three variations of ultrasound (US).
6
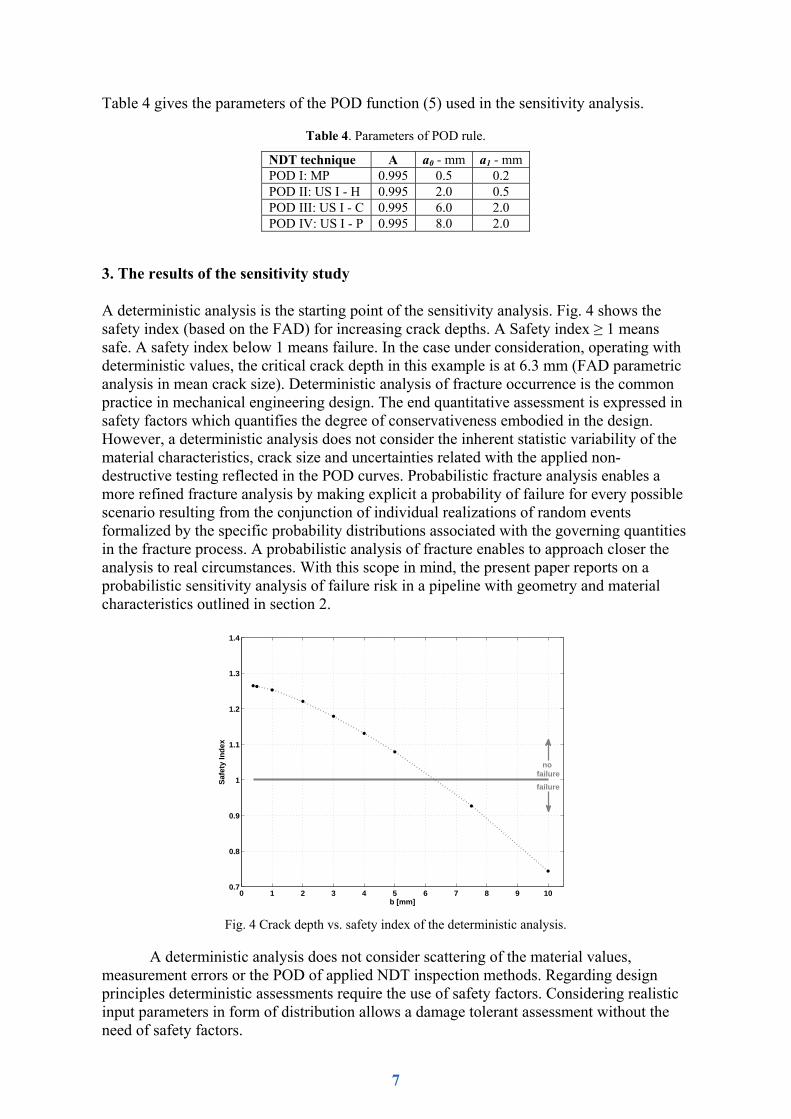
Table 4 gives the parameters of the POD function (5) used in the sensitivity analysis.
Table 4. Parameters of POD rule.
NDT technique A a0 - mm a1 - mm POD I: MP 0.995 0.5 0.2 POD II: US I - H 0.995 2.0 0.5 POD III: US I - C 0.995 6.0 2.0 POD IV: US I - P 0.995 8.0 2.0
3. The results of the sensitivity study
A deterministic analysis is the starting point of the sensitivity analysis. Fig. 4 shows the safety index (based on the FAD) for increasing crack depths. A Safety index ≥ 1 means safe. A safety index below 1 means failure. In the case under consideration, operating with deterministic values, the critical crack depth in this example is at 6.3 mm (FAD parametric analysis in mean crack size). Deterministic analysis of fracture occurrence is the common practice in mechanical engineering design. The end quantitative assessment is expressed in safety factors which quantifies the degree of conservativeness embodied in the design. However, a deterministic analysis does not consider the inherent statistic variability of the material characteristics, crack size and uncertainties related with the applied non-destructive testing reflected in the POD curves. Probabilistic fracture analysis enables a more refined fracture analysis by making explicit a probability of failure for every possible scenario resulting from the conjunction of individual realizations of random events formalized by the specific probability distributions associated with the governing quantities in the fracture process. A probabilistic analysis of fracture enables to approach closer the analysis to real circumstances. With this scope in mind, the present paper reports on a probabilistic sensitivity analysis of failure risk in a pipeline with geometry and material characteristics outlined in section 2.
0 1 2 3 4 5 6 7 8 9 100.7
0.8
0.9
1
1.1
1.2
1.3
1.4
b [mm]
Saf
ety
Ind
ex
failure
no failure
Fig. 4 Crack depth vs. safety index of the deterministic analysis.
A deterministic analysis does not consider scattering of the material values,
measurement errors or the POD of applied NDT inspection methods. Regarding design principles deterministic assessments require the use of safety factors. Considering realistic input parameters in form of distribution allows a damage tolerant assessment without the need of safety factors.
7
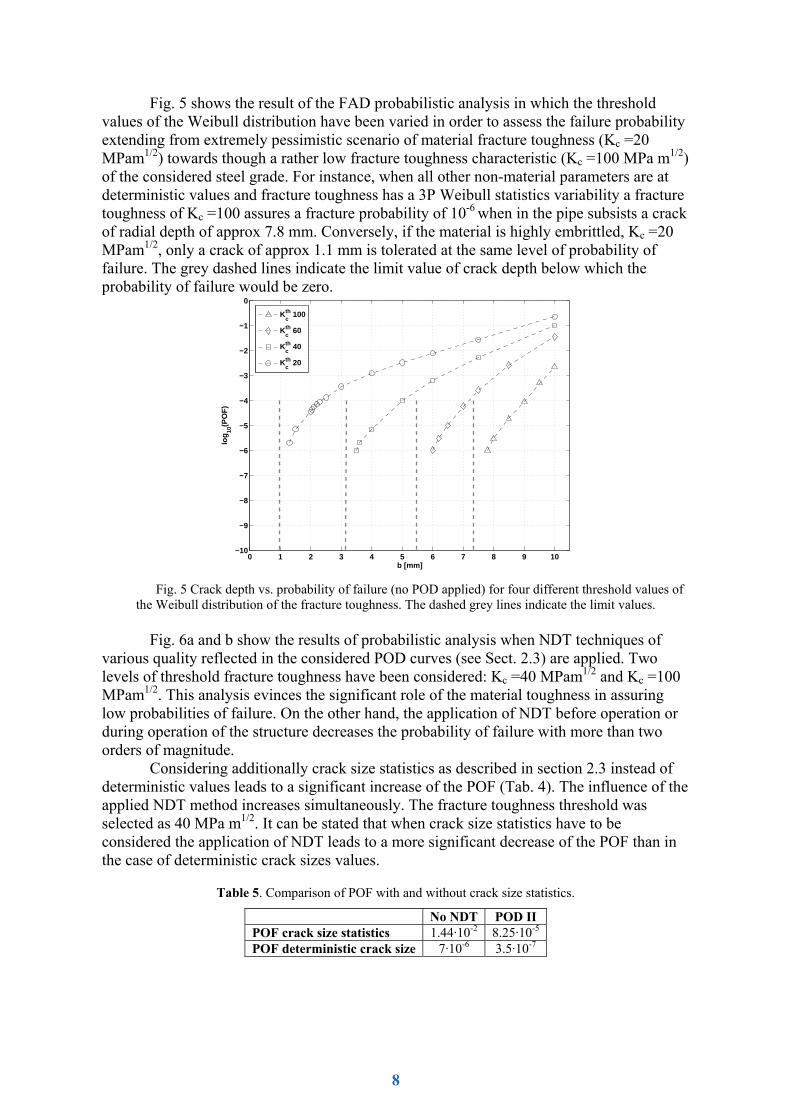
Fig. 5 shows the result of the FAD probabilistic analysis in which the threshold values of the Weibull distribution have been varied in order to assess the failure probability extending from extremely pessimistic scenario of material fracture toughness (Kc =20 MPam1/2) towards though a rather low fracture toughness characteristic (Kc =100 MPa m1/2) of the considered steel grade. For instance, when all other non-material parameters are at deterministic values and fracture toughness has a 3P Weibull statistics variability a fracture toughness of Kc =100 assures a fracture probability of 10-6 when in the pipe subsists a crack of radial depth of approx 7.8 mm. Conversely, if the material is highly embrittled, Kc =20 MPam1/2, only a crack of approx 1.1 mm is tolerated at the same level of probability of failure. The grey dashed lines indicate the limit value of crack depth below which the probability of failure would be zero.
0 1 2 3 4 5 6 7 8 9 10−10
−9
−8
−7
−6
−5
−4
−3
−2
−1
0
b [mm]
log
10(P
OF
)
Kcth 100
Kcth 60
Kcth 40
Kcth 20
Fig. 5 Crack depth vs. probability of failure (no POD applied) for four different threshold values of
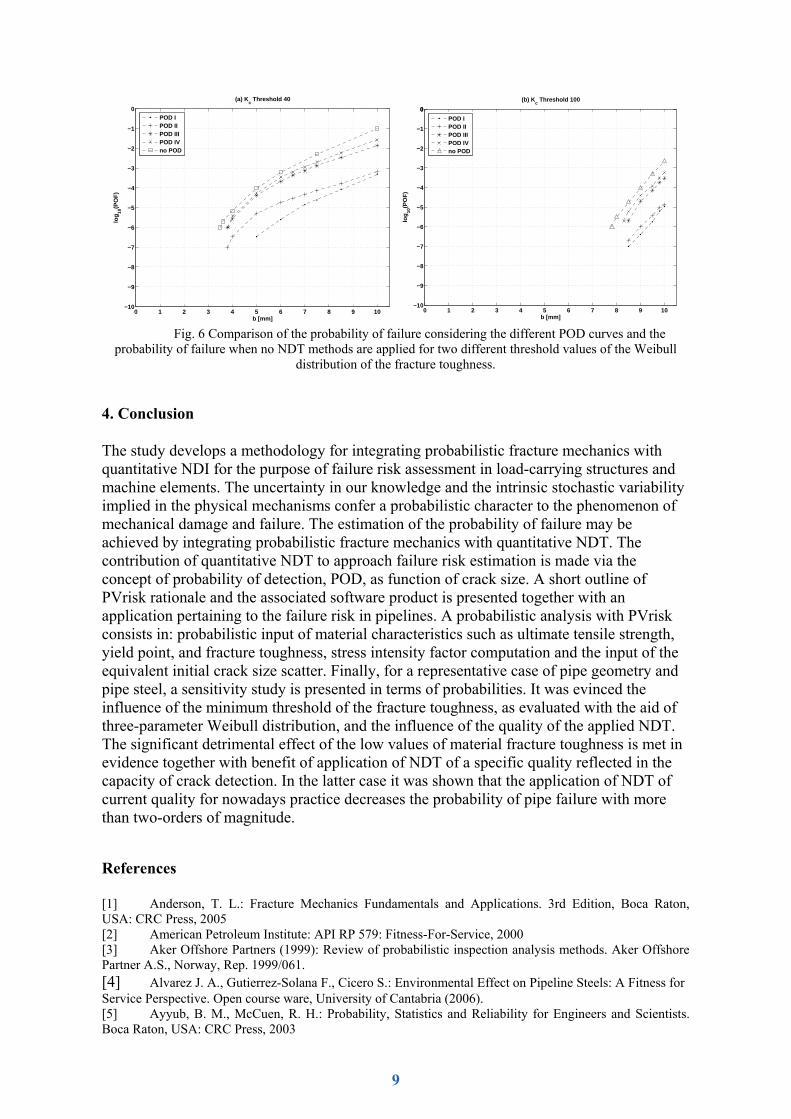
the Weibull distribution of the fracture toughness. The dashed grey lines indicate the limit values. Fig. 6a and b show the results of probabilistic analysis when NDT techniques of
various quality reflected in the considered POD curves (see Sect. 2.3) are applied. Two levels of threshold fracture toughness have been considered: Kc =40 MPam1/2 and Kc =100 MPam1/2. This analysis evinces the significant role of the material toughness in assuring low probabilities of failure. On the other hand, the application of NDT before operation or during operation of the structure decreases the probability of failure with more than two orders of magnitude.
Considering additionally crack size statistics as described in section 2.3 instead of deterministic values leads to a significant increase of the POF (Tab. 4). The influence of the applied NDT method increases simultaneously. The fracture toughness threshold was selected as 40 MPa m1/2. It can be stated that when crack size statistics have to be considered the application of NDT leads to a more significant decrease of the POF than in the case of deterministic crack sizes values.
Table 5. Comparison of POF with and without crack size statistics.
No NDT POD IIPOF crack size statistics 1.44·10-2 8.25·10-5 POF deterministic crack size 7·10-6 3.5·10-7
8
0 1 2 3 4 5 6 7 8 9 10−10
−9
−8
−7
−6
−5
−4
−3
−2
−1
0
b [mm]
log
10(P
OF
)
(a) Kc Threshold 40
POD IPOD IIPOD IIIPOD IVno POD
0 1 2 3 4 5 6 7 8 9 10
−10
−9
−8
−7
−6
−5
−4
−3
−2
−1
00
b [mm]
log
10(P
OF
)
(b) Kc Threshold 100
POD IPOD IIPOD IIIPOD IVno POD
Fig. 6 Comparison of the probability of failure considering the different POD curves and the
probability of failure when no NDT methods are applied for two different threshold values of the Weibull distribution of the fracture toughness.
4. Conclusion
The study develops a methodology for integrating probabilistic fracture mechanics with quantitative NDI for the purpose of failure risk assessment in load-carrying structures and machine elements. The uncertainty in our knowledge and the intrinsic stochastic variability implied in the physical mechanisms confer a probabilistic character to the phenomenon of mechanical damage and failure. The estimation of the probability of failure may be achieved by integrating probabilistic fracture mechanics with quantitative NDT. The contribution of quantitative NDT to approach failure risk estimation is made via the concept of probability of detection, POD, as function of crack size. A short outline of PVrisk rationale and the associated software product is presented together with an application pertaining to the failure risk in pipelines. A probabilistic analysis with PVrisk consists in: probabilistic input of material characteristics such as ultimate tensile strength, yield point, and fracture toughness, stress intensity factor computation and the input of the equivalent initial crack size scatter. Finally, for a representative case of pipe geometry and pipe steel, a sensitivity study is presented in terms of probabilities. It was evinced the influence of the minimum threshold of the fracture toughness, as evaluated with the aid of three-parameter Weibull distribution, and the influence of the quality of the applied NDT. The significant detrimental effect of the low values of material fracture toughness is met in evidence together with benefit of application of NDT of a specific quality reflected in the capacity of crack detection. In the latter case it was shown that the application of NDT of current quality for nowadays practice decreases the probability of pipe failure with more than two-orders of magnitude.
References
[1] Anderson, T. L.: Fracture Mechanics Fundamentals and Applications. 3rd Edition, Boca Raton, USA: CRC Press, 2005 [2] American Petroleum Institute: API RP 579: Fitness-For-Service, 2000 [3] Aker Offshore Partners (1999): Review of probabilistic inspection analysis methods. Aker Offshore Partner A.S., Norway, Rep. 1999/061. [4] Alvarez J. A., Gutierrez-Solana F., Cicero S.: Environmental Effect on Pipeline Steels: A Fitness for Service Perspective. Open course ware, University of Cantabria (2006). [5] Ayyub, B. M., McCuen, R. H.: Probability, Statistics and Reliability for Engineers and Scientists. Boca Raton, USA: CRC Press, 2003
9
[9] Benyon J.A., Watson A.S. (2001): The use of Monte Carlo analysis to increase axle inspection interval. Proceedings of the 13th Int. Wheelset Congress, Rome, Italy. [10] Boller C. (Ed.); Chang F.-K. (Ed.); Fujino Y. (Ed.): Encyclopedia of Structural Health Monitoring, Vol.4: Principles of SHM-Based Structural Monitoring, Design and Maintenance, New York, Wiley & Sons, 2009. [11] BS 7910:2005: Guide to methods for assessing the acceptability of flaws in metallic structures. British Standard Institution, 2005 [12] Cioclov, D.: Integration of Fracture Mechanics and Nondestructive Testing. A Probabilistic Approach. In: Proc. of the South-East European Welding Congress, Timisoara, Romania, 1, May 24.-26. 2006 [13] Cioclov D. (2002): Simulation of failure risk by combined probabilistic fracture mechanics and quantitative NDE analysis. 3rd European-American Workshop on Reliability of NDE and Demining, BAM, Berlin, September 10th – 13th.2002. [14] Cioclov D.D., Escobedo Medina M.C., and Schmidt H.-J., (2003). On the probabilistic fracture mechanics simulation of fatigue life and crack statistics for the purpose of damage tolerance assessment. Proc. 22nd Symp. Int. Comm. Aeronautical Fatigue. ICAF 2003. In: Fatigue of Aeronautical Structures as an Engineering Challenge. Vol. 1, pp.189-210. EMAS Pub., Sheffield, U.K [15] Dobmann, G., Cioclov, D., Kurz, J. H. (2007). The role of probabilistic approaches in NDT defect- detection, -classification, and –sizing. Welding in the World 51 (2007), pp. 9-15 [16] Dowling A. R., Townley C. H. A.: The Effects of Defects on Structural Failure: A Two-Criteria Approach. International Journal of Pressure Vessels and Piping 3 (1875), pp. 77-137 [17] Dugdale D. S.: Yielding of steel sheets containing slits. J. Mech. Phys. Solids 8 (1960), pp. 100-104 [18] Harrison R. P., Loosemore K., Milne, I.: Assessment of the Integrity of Structures Containing Defects. CEGB Report R/H/R6. United Kingdom: Central Electricity Generation Board, 1976 [19] Koplan S., Garrick, B. J.: On the quantitative definition of risk, Risk Analysis. In: EPRI Workshop on Implementation of Risk-Based isi Methods. Charlotte, North Carolina, USA: Feb 29 - March 1, 1996 [20] Murakami, Y. (Ed.): Stress Intensity Factors Handbook. Vol. 2. Oxford, UK: Pergamon Books Ltd., 1987 [21] Nichols, R. W. (Ed.): The Revision to the Structural Integrity Assessment Method CEGB/R6. International Journal of Pressure Vessels & Piping 32 (1988), pp. 1-327 [22] R6: Assessment of the integrity of structures containing defects. Appendix 10, Probabilistic Fracture Mechanics Procedure, Nuclear Electric Procedure R/H/6 – Revision 3, Nuclear Electric, A10.1-24, 1998 [23] Rummel, W. D., Marietta, M., Hardy, G. L., Cooper, T. D.: Application of NDE Reliability to Sys-tems. In: ASM Handbook: Nondestructive Evaluation and Quality Control. 3rd Edition, Ohio, USA: ASM International, 17 (1994), pp. 674-688 [24] Sundaramajan: Guide to Reliability Engineering: Data, Analysis, Applications, Implementation and Management. NY, USA: Van Nostrand Reinhold, 1991 [25] Tarantola, A.: Inverse Problem Theory and Methods for Model Parameter Estimation. Philadelphia, USA: Society for Industrial and Applied Mathematics, 2005 [26] Zerbst U., Wiesner C., Kocak M., Hodulak L.: SINTAP: Entwurf einer vereinheitlichten europäischen Fehlerbewertungsprozedur – eine Einführung. GKSS 99/E/65, 1999
10