Embed Size (px)
Citation preview
RADIOCARBON, Vol 48, Nr 1, 2006, p 69–82 © 2006 by the Arizona Board of Regents on behalf of the University of Arizona
69
RADIOCARBON DETERMINATION OF PARTICULATE ORGANIC CARBON IN NON-TEMPERATED, ALPINE GLACIER ICE
Peter Steier1,2 • Roswitha Drosg1 • Mariaelenea Fedi3 • Walter Kutschera1 • Martin Schock4 • Dietmar Wagenbach4 • Eva Maria Wild1
ABSTRACT. Dating ice samples from glaciers via radiocarbon is a challenge that requires systematic investigations. Thiswork describes an approach for extraction and accelerator mass spectrometry (AMS) 14C analysis of the particulate organiccarbon (POC) fraction in glacier ice samples. Measurements were performed at VERA (Vienna Environmental ResearchAccelerator) on ice samples obtained mainly from the non-temperated ablation zone of the Grenzgletscher (Grenz Glacier)system (Monte Rosa Massif, Swiss Alps). The samples were obtained from 2 sampling sites situated roughly on a commonflow line. The sample masses used were between 0.3 and 1.4 kg of ice, yielding between 18 and 307 µg of carbon as POC.The carbon contamination introduced during sample processing varied between 5.4 and 33 µg C and originated mainly fromthe quartz filters and the rinsing liquids used in processing. Minimum sample sizes for successful graphitization of CO2 in ourlaboratory could be reduced to <10 µg carbon, with a background in the graphitization process of ~0.5 µg of 40-pMC carbon.Evaluation of the whole procedure via 11 Grenzgletscher samples revealed a surprisingly large scatter of pMC values. Weobtain a mean calibrated age of 2100 BC to AD 900 (95.4% confidence level), which is not significantly different for the 2sampling sites. Discussions of these results suggest that single 14C dates of glacial POC are presently of limited significance.Future improvements with respect to analytical precision and sample characterization are proposed in order to fully explorethe POC dating potential.
INTRODUCTION
Glaciers and ice sheets constitute an important archive of Earth’s climatic and environmental his-tory. Compared to other paleoarchives, glaciers and ice sheets are unique in providing proxy recordsrelated to climate parameters (e.g. stable water isotopes), as well as direct access to past atmosphericcomposition changes (e.g. greenhouse gases and atmospheric dust). Most investigations were per-formed on ice cores drilled in Greenland (e.g. GRIP and GISP2, Hammer et al. 1997) and Antarctica(e.g. Vostok, Petit et al. 1999; Dome C, EPICA Community Members 2004). In these high-latitudeice sheets, englacial temperatures are low enough to keep the isotopic and chemical ice composition“frozen” in time, whereas their large-scale geometry commonly ensures a smooth and approxi-mately linear depth-age relationship over a substantial fraction of the total ice thickness. Thus, anappropriate chronology—which is the prime prerequisite for exploiting the climatological informa-tion—can be derived from stratigraphical investigations over several thousand years (Meese et al.1997). Annual layer counting and oxygen isotopic stage correlation are the most important strati-graphical methods and have become standard tools for dating polar ice cores.
However, stratigraphical dating is not applicable to all ice archives, which include non-temperatedmountain glaciers, rock glaciers, cave ice, cold ablation zones, and ice wedges. For example, non-temperated mountain glaciers, necessarily situated on the highest summit ranges, show relativelysmall glacier geometries. This leads to complex ice-flow patterns, extensive ice-thinning rates, andirregular snow deposition. These shortcomings commonly restrict useful stratigraphical dating tosome 100 yr at best (e.g. Thomson et al. 2002; Wagenbach 1989; Eisen et al. 2003). Thus, to extendthe domain of long-term ice records to non-polar regions and to explore other promising icearchives, an alternative dating tool is urgently needed.
1Vienna Environmental Research Accelerator (VERA), Institut für Isotopenforschung und Kernphysik, Universität Wien,Währinger Straße 17, A-1090 Wien, Austria.
2Corresponding author. Email: [email protected] di Fisica dell’Università di Firenze and INFN Sezione di Firenze, via Sansone 1, 50019 Sesto Fiorentino (Fi),Italy.
4Institut für Umweltphysik, Universität Heidelberg, Im Neuheimer Feld 229, 69120 Heidelberg, Germany.
70 P Steier et al.
Radiocarbon analysis is the most precise tool for dating organic matter remains throughout theHolocene. Organic matter is deployed in stratified archives like lake sediments or peat bogs (e.g.Goslar et al. 2005). Provided that the organic carbon entrapped in glacier bodies is representative forthe deposition age, 14C dating is expected to be useful for these kinds of archives as well. Organicmicrofossils like moss (Haeberli et al. 1999) or insect remains (Thompson et al. 1998) found bychance in ice cores have already been used. However, only small amounts of organic carbon arecommonly contained in glacier ice, either entrapped as trace gases in air bubbles or preserved asaerosol-related species in the ice matrix. The organic carbon fractions may be divided into POC(particulate organic carbon) and DOC (dissolved organic carbon), which are distinguished using apore filter of typically 0.4 µm pore size.
Inorganic CO2 eventually trapped in air bubbles below the firn-ice transition is a less suitable 14C-dating target since it may contain a substantial contribution of in situ-produced 14C (mainly via spal-lation of oxygen in the ice by energetic cosmic ray neutrons, Lal et al. 1990; Lal et al. 2000; Lal etal. 2001; Van Roijen et al. 1995). This is especially true for mountain drill sites, where the in situcontribution is enhanced due to high altitudes and low accumulation rates.
In this work, we explore the potential of 14C dating the POC fraction of glacier ice. Intending todevelop an appropriate procedure, we focused on ice-block samples collected in the non-temperatedablation zone, a polythermal valley glacier in the Alps. This approach offers samples of large vol-ume at reasonable effort for testing and evaluation of the method. Various cold ice bodies fromlower altitude, as well as ice-sheet margins, may also present an important future application (e.g.Reeh et al. 1991) of this dating tool.
METHODS
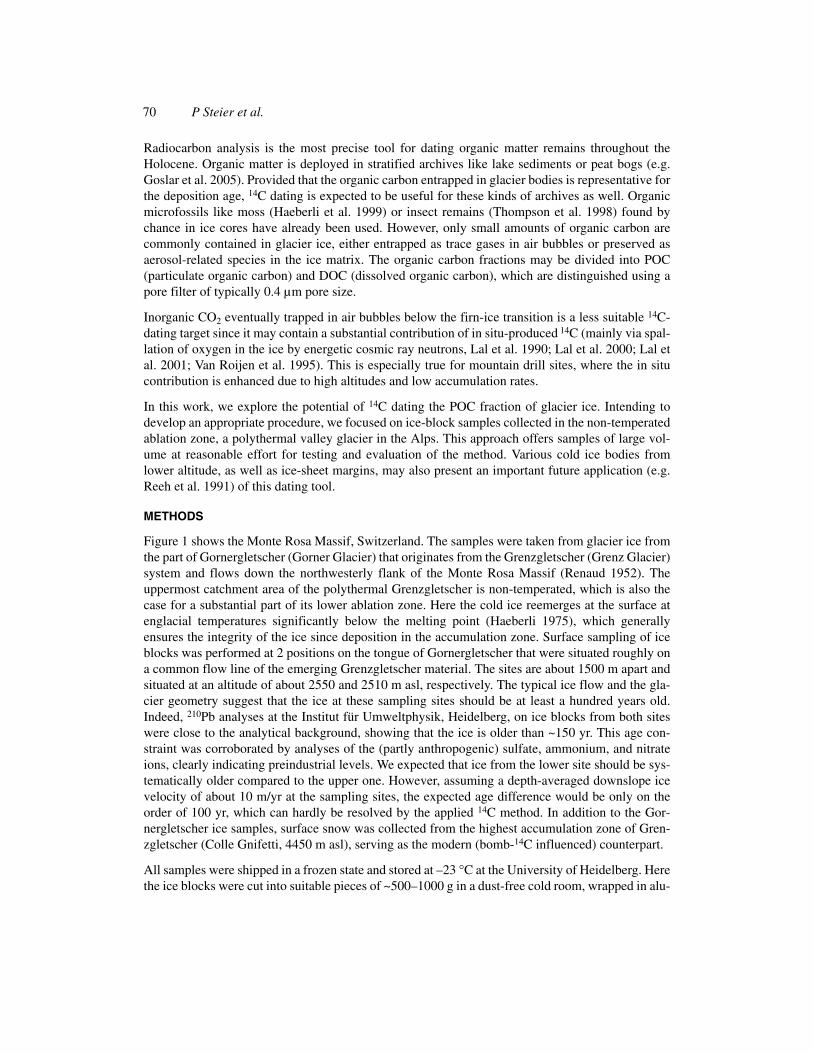
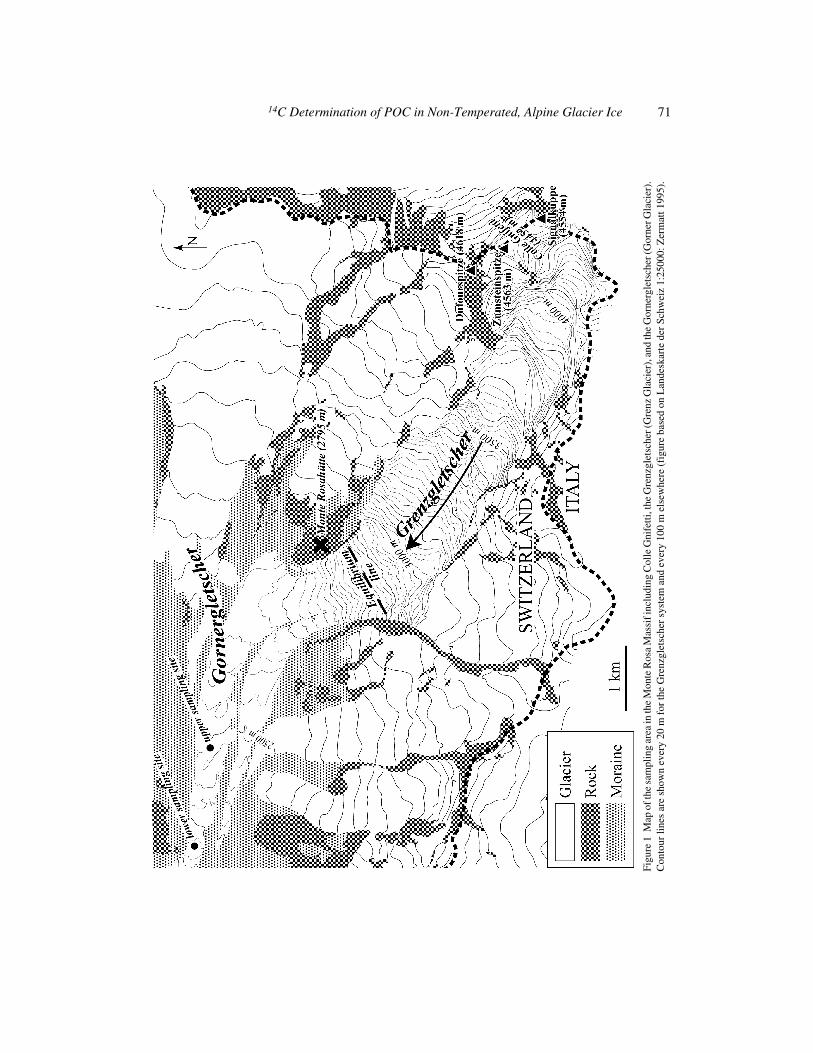
Figure 1 shows the Monte Rosa Massif, Switzerland. The samples were taken from glacier ice fromthe part of Gornergletscher (Gorner Glacier) that originates from the Grenzgletscher (Grenz Glacier)system and flows down the northwesterly flank of the Monte Rosa Massif (Renaud 1952). Theuppermost catchment area of the polythermal Grenzgletscher is non-temperated, which is also thecase for a substantial part of its lower ablation zone. Here the cold ice reemerges at the surface atenglacial temperatures significantly below the melting point (Haeberli 1975), which generallyensures the integrity of the ice since deposition in the accumulation zone. Surface sampling of iceblocks was performed at 2 positions on the tongue of Gornergletscher that were situated roughly ona common flow line of the emerging Grenzgletscher material. The sites are about 1500 m apart andsituated at an altitude of about 2550 and 2510 m asl, respectively. The typical ice flow and the gla-cier geometry suggest that the ice at these sampling sites should be at least a hundred years old.Indeed, 210Pb analyses at the Institut für Umweltphysik, Heidelberg, on ice blocks from both siteswere close to the analytical background, showing that the ice is older than ~150 yr. This age con-straint was corroborated by analyses of the (partly anthropogenic) sulfate, ammonium, and nitrateions, clearly indicating preindustrial levels. We expected that ice from the lower site should be sys-tematically older compared to the upper one. However, assuming a depth-averaged downslope icevelocity of about 10 m/yr at the sampling sites, the expected age difference would be only on theorder of 100 yr, which can hardly be resolved by the applied 14C method. In addition to the Gor-nergletscher ice samples, surface snow was collected from the highest accumulation zone of Gren-zgletscher (Colle Gnifetti, 4450 m asl), serving as the modern (bomb-14C influenced) counterpart.
All samples were shipped in a frozen state and stored at –23 °C at the University of Heidelberg. Herethe ice blocks were cut into suitable pieces of ~500–1000 g in a dust-free cold room, wrapped in alu-
14C Determination of POC in Non-Temperated, Alpine Glacier Ice 71
Figu
re 1
Map
of t
he s
ampl
ing
area
in th
e M
onte
Ros
a M
assi
f inc
ludi
ng C
olle
Gni
fetti
, the
Gre
nzgl
etsc
her (
Gre
nz G
laci
er),
and
the
Gor
nerg
lets
cher
(Gor
ner G
laci
er).
Con
tour
line
s ar
e sh
own
ever
y 20
m f
or th
e G
renz
glet
sche
r sy
stem
and
eve
ry 1
00 m
els
ewhe
re (
figu
re b
ased
on
Lan
desk
arte
der
Sch
wei
z 1:
2500
0: Z
erm
att 1
995)
.
72 P Steier et al.
minum foil, and sealed in polyethylene bags. After shipment to the University of Vienna, the blockswere kept in a freezer at about –15 °C.
Preindustrial atmospheric POC is mainly composed of biogenic particles (such as pollen, bacteria,spores, etc.), leaf fragments, the organic fraction of soil dust, and products of biomass burning likeelemental carbon (EC). Secondary organic aerosol, as derived from gas-to-particle reactions (Sein-feld 1998) of volatile biogenic precursors, are thought to be mainly water soluble and thus may notsubstantially contribute to the filterable POC contained in meltwater samples. There is no need toseparate the major POC fractions (e.g. organic carbon [OC] and elemental carbon [EC]) as done formodern atmospheric aerosol (e.g. Szidat et al. 2004). In preindustrial ice, we expect that all POCfractions yield 14C ages correlated to the time of ice formation. Deviations from this assumption area principal limitation of the method and are discussed below.
Two methods have been used by other groups to extract POC from ice samples: filtering of melt-water (Chýlek et al. 1987) and sublimating the ice sample in a vacuum while depositing the particlesonto a surface substrate (Biegalski et al. 1998). Sublimation may provide a better particle recoveryyield and would collect a part of the DOC fraction as well, but the meltwater is unavoidably lost. Wehave chosen to develop a filtration method. If one considers rare and small ice samples from remotedrill sites, this method may allow us to extract the POC of the complete sample without interferingwith further measurements on the meltwater itself (including separate DOC analyses). Additionally,filtration allows us to handle large samples in a relatively short time. The VERA Laboratory wasalready involved in 14C measurements of snow (Weissenbök et al. 2000), but not in preparing thesamples. Thus, we had to customize an appropriate filtration procedure, whereas only minor exper-imental changes were required in the accelerator mass spectrometry (AMS) target preparation andmeasurement procedures.
The overall carbon content is as low as a few dozen µg per kg of ice; thus, care has to be taken tocontrol the contamination introduced during sample preparation. Since ambient dust imposes a sub-stantial problem, the critical steps during handling of the ice and the POC filters were performed ina laminar-flow box (nominally class 100). Materials used in the setup are (almost exclusively) madeof quartz, glass, stainless steel, and PTFE or PFA. Teflon® tubing is expected to prevent particlesfrom sticking to the tube walls. Parts and tools are cleaned in an ultrasonic bath; residual surfacedust was blown off with clean N2. Materials that withstand high temperatures (quartz filters, quartzvials, and copper oxide for the combustion, see below) were heated shortly before use at 950 °C for4 hr. Still hot (~500 °C), they were put into a container with saturated H2O atmosphere. This proce-dure should reduce readsorption of carbon-containing trace gases from laboratory air.
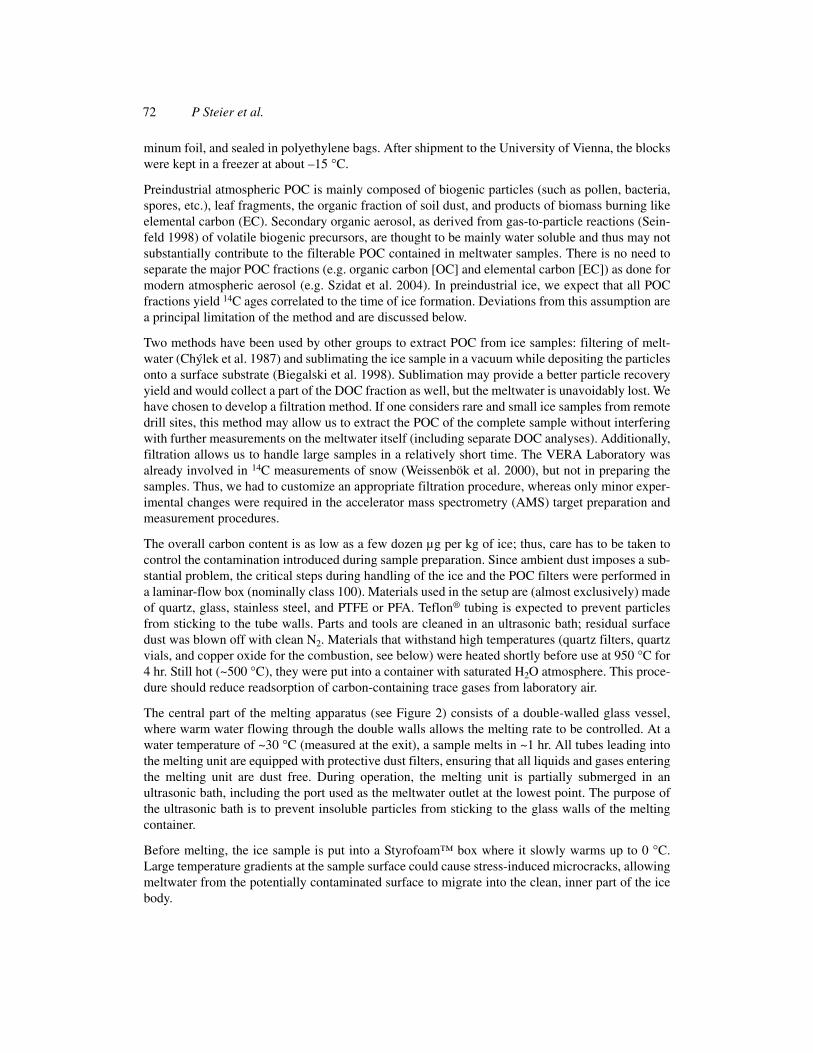
The central part of the melting apparatus (see Figure 2) consists of a double-walled glass vessel,where warm water flowing through the double walls allows the melting rate to be controlled. At awater temperature of ~30 °C (measured at the exit), a sample melts in ~1 hr. All tubes leading intothe melting unit are equipped with protective dust filters, ensuring that all liquids and gases enteringthe melting unit are dust free. During operation, the melting unit is partially submerged in anultrasonic bath, including the port used as the meltwater outlet at the lowest point. The purpose ofthe ultrasonic bath is to prevent insoluble particles from sticking to the glass walls of the meltingcontainer.
Before melting, the ice sample is put into a Styrofoam™ box where it slowly warms up to 0 °C.Large temperature gradients at the sample surface could cause stress-induced microcracks, allowingmeltwater from the potentially contaminated surface to migrate into the clean, inner part of the icebody.
14C Determination of POC in Non-Temperated, Alpine Glacier Ice 73
The melting unit is taken into the laminar flow box for sample loading with tubings closed. Meltingand filtration are done under overpressure with clean N2. This procedure protects the meltwater fromcontamination with laboratory air, which will be essential for future measurements of the DOCfraction.
The sample filter holder is made of stainless steel and Teflon with a stainless steel frit supporting thequartz fiber filter (Sartorius QMF, 85 g/m2, binder-free, 25 mm diameter, later-cut down to 12 mm).The filter was mounted only after disposal of the first ~100 mL of sample water, in order to elimi-nate surface contamination. A filtration rate of typically ~0.2 mL/sec was maintained and controlledby the N2 overpressure (400–1000 mbar) and by a hose clamp at the sample filter outlet. Filtrationof accumulated meltwater was done at intervals, with the ultrasonic bath switched off in betweensteps. The meltwater was not pushed out completely, since gas bubbles inside the filter holderrequire a strong pressure increase to start the filtration process again. For possible subsequent anal-yses, the filtrate can be collected in a glass bottle inside a glove bag filled with clean N2.
After complete melting of the ice sample, the apparatus is rinsed with ~50 mL 1M HCl, which istransferred from a flask by N2 overpressure through a combination of several filters into the meltingunit. In the final procedure, we used a combination of a glass frit, a quartz filter (similar to the POCsample filter), and a polycarbonate membrane filter (pore size 0.22 µm, Poretics). The melting unitfilled with the rinsing liquid is thoroughly shaken. The ultrasonic bath is switched on for 5 min tomobilize particles sticking to the walls, and the rinsing liquid is drained also through the POC filter.By using HCl in the first rinsing, we expect complete removal of carbonate particles. Rinsing isrepeated twice using ~50 mL H2O bidest.
Figure 2 Schematic layout of the apparatus for ice melting and subsequent collection of POC on a particle filter: 1) N2
bottle; 2) pressure gauge; 3) pressure exhaust; 4) pressure release valve for melting container; 5) filter for gas; 6) N2 pres-sure supply/release pipe; 7) melting container; 8) ice sample; 9) ultrasonic bath; 10, 11) warm water in and out; 12) POCsample filter; 13) hose clamp; 14) bottle for meltwater sample; 15) N2 supply for meltwater bottle/glove bag; 16) glovebag; 17) transfer flask for rinsing liquids; 18) manifold valve; 19) filter for rinsing liquids. The arrows indicate the flowdirection. See text for operational procedure.
74 P Steier et al.
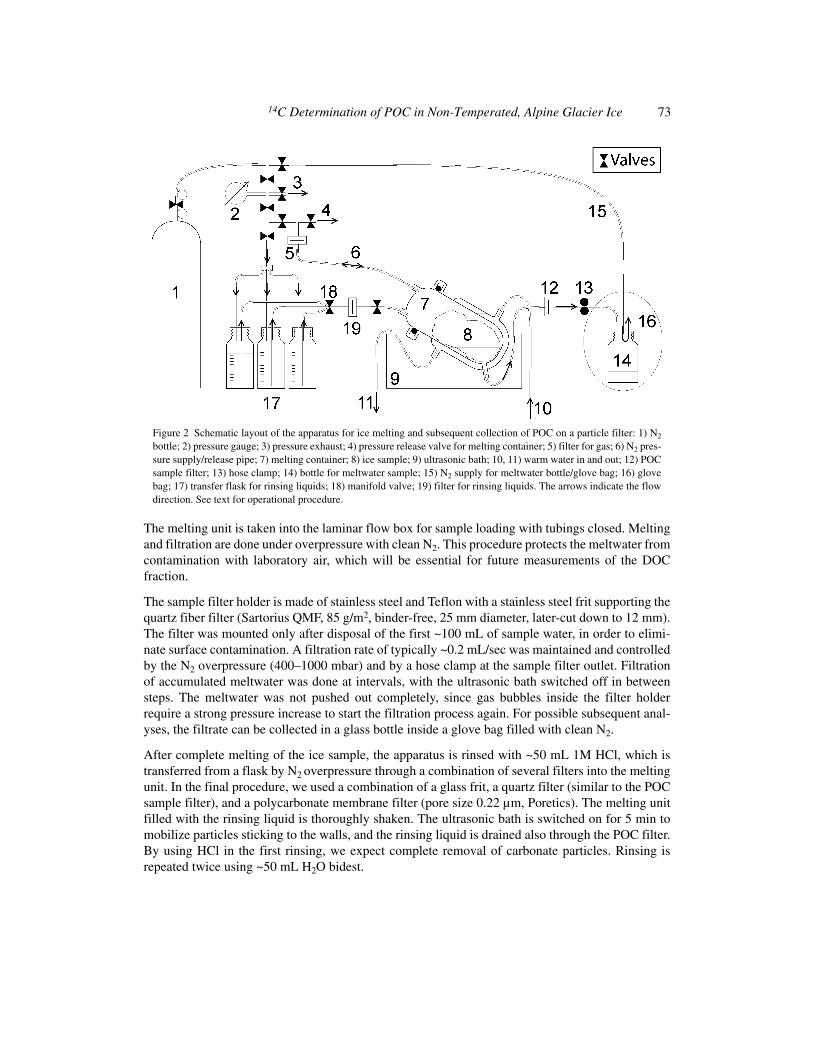
Before each use, the melting unit is cleaned and a process blank is taken. Cleaning of the meltingapparatus is done similarly to the rinsing after ice melting (except that no sample filter is attached),with ~200 mL 0.7M HNO3 and 2 rinses with ~100 mL H2O bidest. A process blank is prepared foreach sample using the same amount of rinsing liquids that is used afterwards for the correspondingice sample. Table 1 shows the results for the process blanks actually used for blank correction. Here,as in the following, we characterize the 14C content by pMC values (percent Modern Carbon), asdefined by Stuiver and Polach (1977).
The filtration procedure was slightly different for the first 2 Gornergletscher samples from each site.For these, 100 mL of HCl (0.1M) and 2 × 100 mL of H2O bidest were used for rinsing; the quartzfilters for the POC samples were 25 mm in diameter. The amount of carbon collected on the processblanks is variable in both amount and 14C content. The investigations performed thus far do not yetprove a clear correlation between the contamination and the amount of filtrated liquids. To assessand possibly improve the quality of the rinsing liquids remains one methodical focus for the future.For the present experiments, we reduced the total amount of rinsing liquids down to the smallestamount that can be reliably handled by the present setup (150 mL). Another possible source of con-tamination is represented by the quartz filter itself. From unused, wetted filters, typically 3 µg ofcarbon were extracted. Thus, we decided to reduce the filter diameter to 12 mm. We also cut off the“unused” margin of the filter after the filtration, yielding an effective diameter of 8 mm.
By these means, the typical background fell to ~7 µg C. The disadvantage is, however, the reductionof the active filtration surface. For some very “dirty” ice samples, the 12-mm filters were completelyblocked after a small amount of meltwater (175 mL in one case) was passed through, so the remain-ing sample had to be discarded without filtration. (We stopped filtration when the rate had decreased
Table 1 Summary of 14C measurements on process blanks.
Label of process blank
Correspondingice sample
Eff. filterdiameter(mm)
Rinsing liquids(mL)
Mblank,meas
(µg carbon)pMCblank,meas
(%)
HD51 HD44 25 300 8.6 65.8 ± 1.0HD54 HD56 25 340 32.4 77.7 ± 0.7HD58 HD59 25 400 10.7 119.2 ± 1.4HD63 HD60 25 400 11.0 103.1 ± 1.4M25 M26 25 150 17.3 78.1 ± 0.9Average of 25-mm filters 16.0 ± 9.7a
aStandard deviation.
M8 M9 8 150 6.0 85.5 ± 2.2M10 M11 8 150 5.4 72.4 ± 2.6M12 M13 8 150 6.2 102.1 ± 3.0M14 M15 8 150 7.5 80.3 ± 2.2M23 M24 8 150 8.7 71.0 ± 1.7M21 M22 8 150 6.2 77.8 ± 3.7M18 M19 8 150 7.8 89.7 ± 3.2Average of 8-mm filters 6.8 ± 1.2a
Overall average 85.2 ± 15.7a
14C Determination of POC in Non-Temperated, Alpine Glacier Ice 75
down to 0.5 mL/min at a nitrogen pressure of 1000 mbar.) Samples from the lower site show gener-ally higher POC values. Thus, we decided to process the last sample of this batch (M26) again witha larger filter (25 mm diameter). With the larger filter, we introduced a higher carbon background.However, since the amount of collected POC was also higher in this case, the larger filter back-ground did not pose a significant problem.
The still-wet filter is then placed in a quartz vial together with 500 mg pretreated copper oxide(Merck, p.a., wire 0.65 mm × 3 mm) to provide oxygen during sample combustion, and with a smallpiece of silver wire to bind sulfur and halogens. The filled vial is evacuated and heated for ~1 hr to~130 °C to remove moisture and volatile carbon compounds before flame-sealing. Subsequently, thePOC sample is combusted to CO2 for 4 hr at 950 °C. After cooling down inside the oven, the sam-ples are ready for graphitization. Systematic investigations revealed that the copper oxide contrib-utes <1 µg to the carbon contamination (compare Vandeputte et al. 1998).
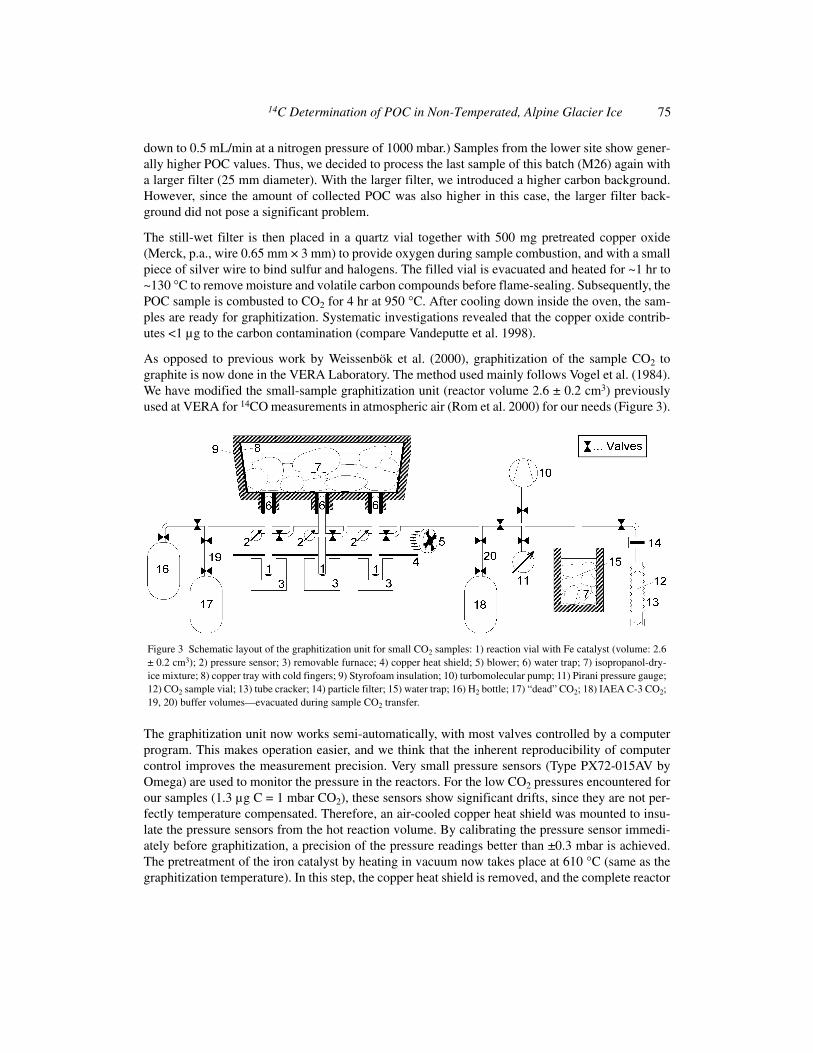
As opposed to previous work by Weissenbök et al. (2000), graphitization of the sample CO2 tographite is now done in the VERA Laboratory. The method used mainly follows Vogel et al. (1984).We have modified the small-sample graphitization unit (reactor volume 2.6 ± 0.2 cm3) previouslyused at VERA for 14CO measurements in atmospheric air (Rom et al. 2000) for our needs (Figure 3).
The graphitization unit now works semi-automatically, with most valves controlled by a computerprogram. This makes operation easier, and we think that the inherent reproducibility of computercontrol improves the measurement precision. Very small pressure sensors (Type PX72-015AV byOmega) are used to monitor the pressure in the reactors. For the low CO2 pressures encountered forour samples (1.3 µg C = 1 mbar CO2), these sensors show significant drifts, since they are not per-fectly temperature compensated. Therefore, an air-cooled copper heat shield was mounted to insu-late the pressure sensors from the hot reaction volume. By calibrating the pressure sensor immedi-ately before graphitization, a precision of the pressure readings better than ±0.3 mbar is achieved.The pretreatment of the iron catalyst by heating in vacuum now takes place at 610 °C (same as thegraphitization temperature). In this step, the copper heat shield is removed, and the complete reactor
Figure 3 Schematic layout of the graphitization unit for small CO2 samples: 1) reaction vial with Fe catalyst (volume: 2.6± 0.2 cm3); 2) pressure sensor; 3) removable furnace; 4) copper heat shield; 5) blower; 6) water trap; 7) isopropanol-dry-ice mixture; 8) copper tray with cold fingers; 9) Styrofoam insulation; 10) turbomolecular pump; 11) Pirani pressure gauge;12) CO2 sample vial; 13) tube cracker; 14) particle filter; 15) water trap; 16) H2 bottle; 17) “dead” CO2; 18) IAEA C-3 CO2;19, 20) buffer volumes—evacuated during sample CO2 transfer.
76 P Steier et al.
assembly heats up to ~50–60 °C. This improves the cleaning by out-gassing. The Viton® O-ringspreviously used for the reactor chambers were replaced by Teflon gaskets, for which we observe lessout-gassing at high temperatures. A Pirani gauge connected to the central manifold allows us todetect leaks easily.
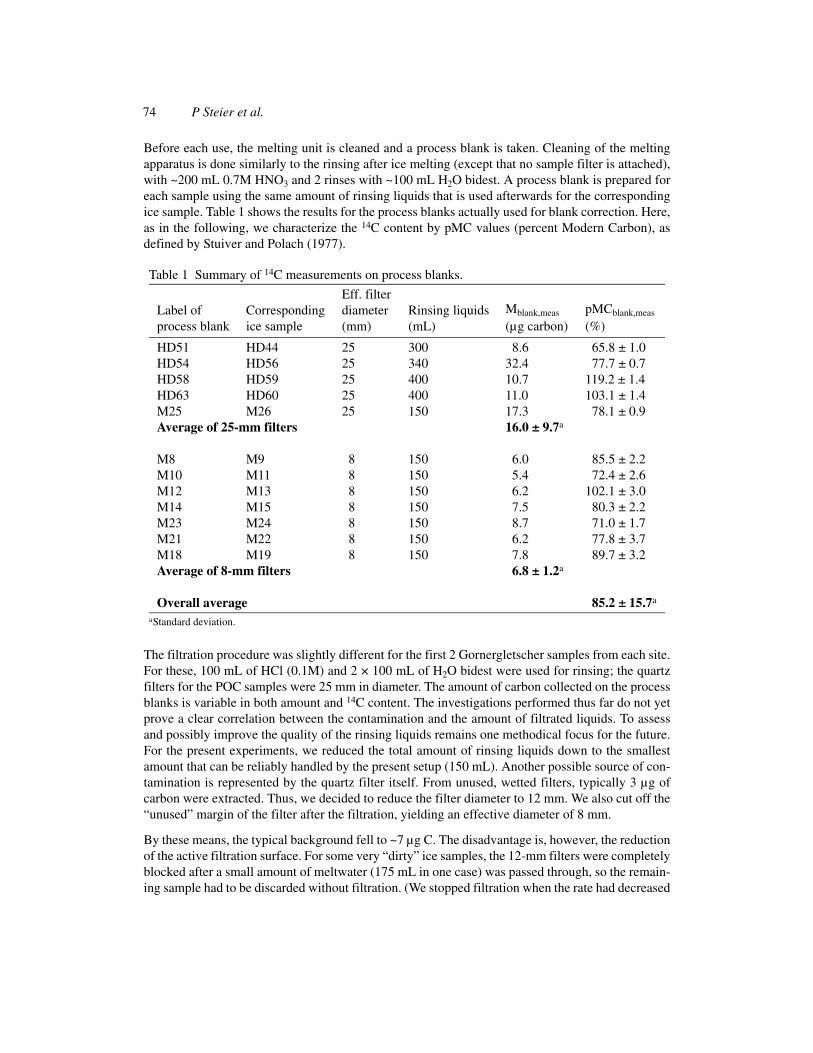
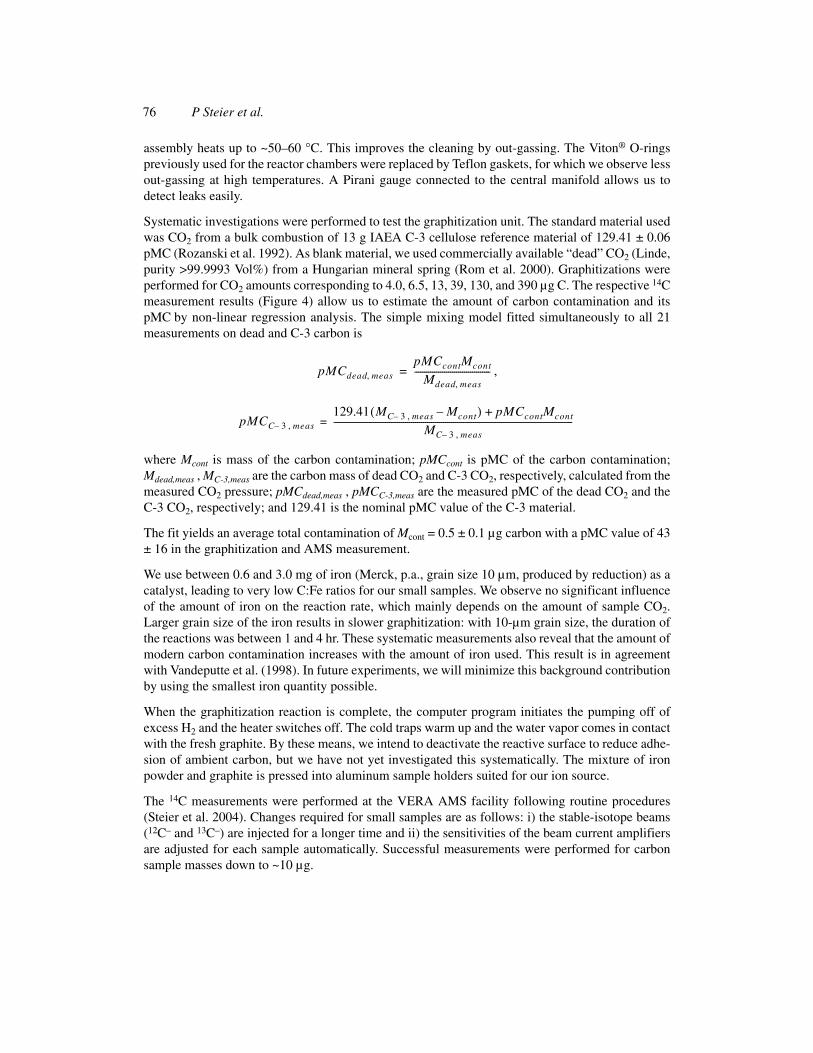
Systematic investigations were performed to test the graphitization unit. The standard material usedwas CO2 from a bulk combustion of 13 g IAEA C-3 cellulose reference material of 129.41 ± 0.06pMC (Rozanski et al. 1992). As blank material, we used commercially available “dead” CO2 (Linde,purity >99.9993 Vol%) from a Hungarian mineral spring (Rom et al. 2000). Graphitizations wereperformed for CO2 amounts corresponding to 4.0, 6.5, 13, 39, 130, and 390 µg C. The respective 14Cmeasurement results (Figure 4) allow us to estimate the amount of carbon contamination and itspMC by non-linear regression analysis. The simple mixing model fitted simultaneously to all 21measurements on dead and C-3 carbon is
,
where Mcont is mass of the carbon contamination; pMCcont is pMC of the carbon contamination;Mdead,meas , MC-3,meas are the carbon mass of dead CO2 and C-3 CO2, respectively, calculated from themeasured CO2 pressure; pMCdead,meas , pMCC-3,meas are the measured pMC of the dead CO2 and theC-3 CO2, respectively; and 129.41 is the nominal pMC value of the C-3 material.
The fit yields an average total contamination of Mcont = 0.5 ± 0.1 µg carbon with a pMC value of 43± 16 in the graphitization and AMS measurement.
We use between 0.6 and 3.0 mg of iron (Merck, p.a., grain size 10 µm, produced by reduction) as acatalyst, leading to very low C:Fe ratios for our small samples. We observe no significant influenceof the amount of iron on the reaction rate, which mainly depends on the amount of sample CO2.Larger grain size of the iron results in slower graphitization: with 10-µm grain size, the duration ofthe reactions was between 1 and 4 hr. These systematic measurements also reveal that the amount ofmodern carbon contamination increases with the amount of iron used. This result is in agreementwith Vandeputte et al. (1998). In future experiments, we will minimize this background contributionby using the smallest iron quantity possible.
When the graphitization reaction is complete, the computer program initiates the pumping off ofexcess H2 and the heater switches off. The cold traps warm up and the water vapor comes in contactwith the fresh graphite. By these means, we intend to deactivate the reactive surface to reduce adhe-sion of ambient carbon, but we have not yet investigated this systematically. The mixture of ironpowder and graphite is pressed into aluminum sample holders suited for our ion source.
The 14C measurements were performed at the VERA AMS facility following routine procedures(Steier et al. 2004). Changes required for small samples are as follows: i) the stable-isotope beams(12C– and 13C–) are injected for a longer time and ii) the sensitivities of the beam current amplifiersare adjusted for each sample automatically. Successful measurements were performed for carbonsample masses down to ~10 µg.
pMCdead meas,pMCcontMcont
Mdead meas,--------------------------------------=
pMCC 3– meas,129.41 MC 3– meas, Mcont–( ) pMCcontMcont+
MC 3– meas,------------------------------------------------------------------------------------------------------------------------=
14C Determination of POC in Non-Temperated, Alpine Glacier Ice 77
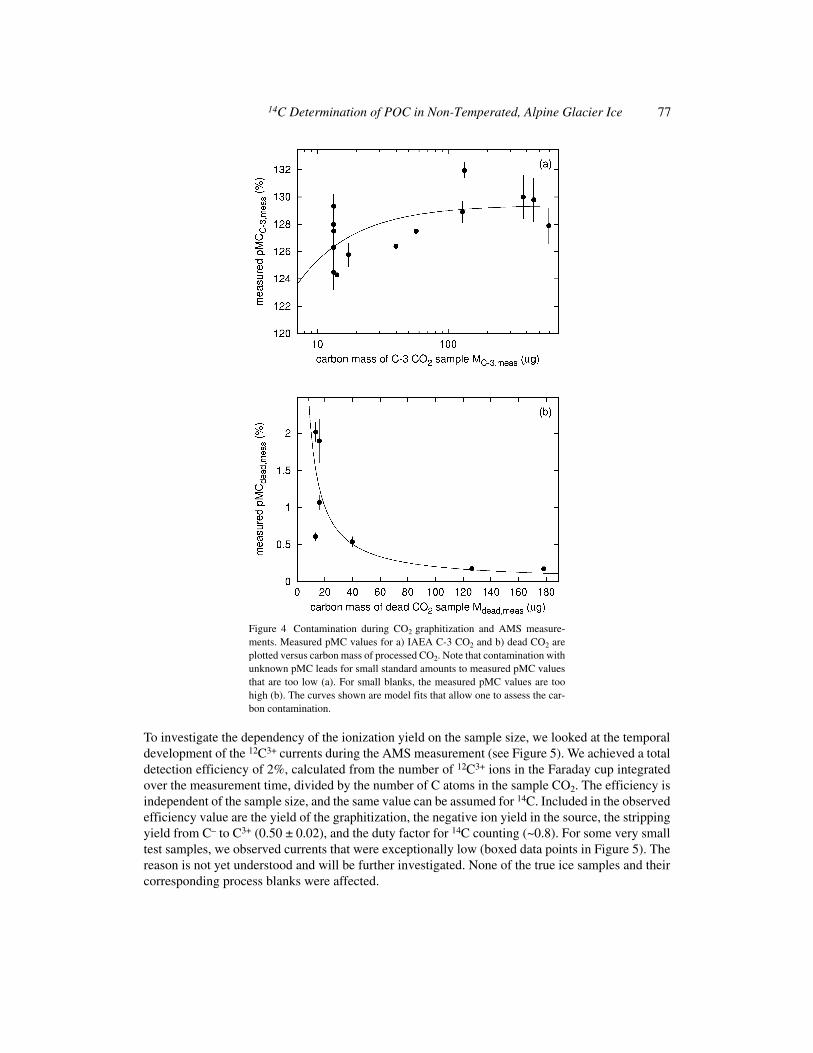
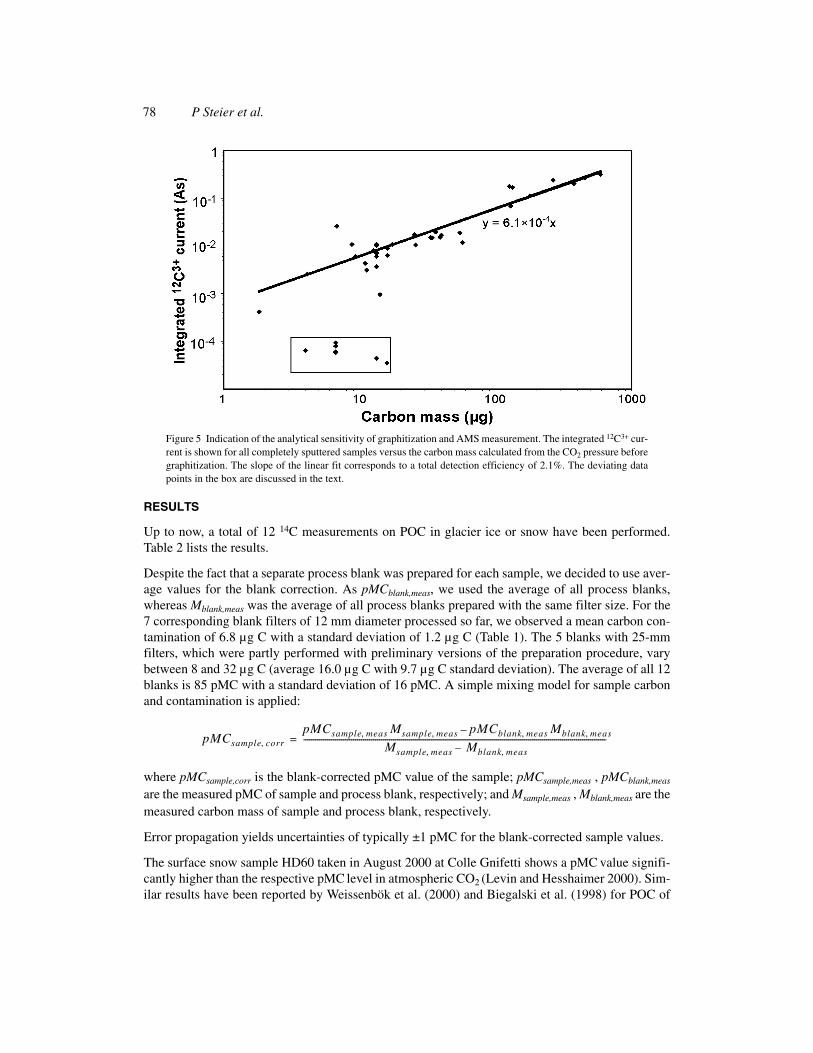
To investigate the dependency of the ionization yield on the sample size, we looked at the temporaldevelopment of the 12C3+ currents during the AMS measurement (see Figure 5). We achieved a totaldetection efficiency of 2%, calculated from the number of 12C3+ ions in the Faraday cup integratedover the measurement time, divided by the number of C atoms in the sample CO2. The efficiency isindependent of the sample size, and the same value can be assumed for 14C. Included in the observedefficiency value are the yield of the graphitization, the negative ion yield in the source, the strippingyield from C– to C3+ (0.50 ± 0.02), and the duty factor for 14C counting (~0.8). For some very smalltest samples, we observed currents that were exceptionally low (boxed data points in Figure 5). Thereason is not yet understood and will be further investigated. None of the true ice samples and theircorresponding process blanks were affected.
Figure 4 Contamination during CO2 graphitization and AMS measure-ments. Measured pMC values for a) IAEA C-3 CO2 and b) dead CO2 areplotted versus carbon mass of processed CO2. Note that contamination withunknown pMC leads for small standard amounts to measured pMC valuesthat are too low (a). For small blanks, the measured pMC values are toohigh (b). The curves shown are model fits that allow one to assess the car-bon contamination.
78 P Steier et al.
RESULTS
Up to now, a total of 12 14C measurements on POC in glacier ice or snow have been performed.Table 2 lists the results.
Despite the fact that a separate process blank was prepared for each sample, we decided to use aver-age values for the blank correction. As pMCblank,meas, we used the average of all process blanks,whereas Mblank,meas was the average of all process blanks prepared with the same filter size. For the7 corresponding blank filters of 12 mm diameter processed so far, we observed a mean carbon con-tamination of 6.8 µg C with a standard deviation of 1.2 µg C (Table 1). The 5 blanks with 25-mmfilters, which were partly performed with preliminary versions of the preparation procedure, varybetween 8 and 32 µg C (average 16.0 µg C with 9.7 µg C standard deviation). The average of all 12blanks is 85 pMC with a standard deviation of 16 pMC. A simple mixing model for sample carbonand contamination is applied:
where pMCsample,corr is the blank-corrected pMC value of the sample; pMCsample,meas , pMCblank,meas
are the measured pMC of sample and process blank, respectively; and Msample,meas , Mblank,meas are themeasured carbon mass of sample and process blank, respectively.
Error propagation yields uncertainties of typically ±1 pMC for the blank-corrected sample values.
The surface snow sample HD60 taken in August 2000 at Colle Gnifetti shows a pMC value signifi-cantly higher than the respective pMC level in atmospheric CO2 (Levin and Hesshaimer 2000). Sim-ilar results have been reported by Weissenbök et al. (2000) and Biegalski et al. (1998) for POC of
Figure 5 Indication of the analytical sensitivity of graphitization and AMS measurement. The integrated 12C3+ cur-rent is shown for all completely sputtered samples versus the carbon mass calculated from the CO2 pressure beforegraphitization. The slope of the linear fit corresponds to a total detection efficiency of 2.1%. The deviating datapoints in the box are discussed in the text.
pMCsample corr,pMCsample meas, Msample meas, pMCblank meas, Mblank meas,–
Msample meas, Mblank meas,–--------------------------------------------------------------------------------------------------------------------------------------------------------=
14C Determination of POC in Non-Temperated, Alpine Glacier Ice 79
recent snow samples. Our measured value of 119.6 pMC corresponds to atmospheric 14CO2 levelsfrom ~1985. However, a straightforward transformation into a sample age is not possible for modernPOC, since an unknown amount of particles from fossil fuel combustion will have diluted the 14Ccontent.
As illustrated in Figure 6, a considerable scatter in the final pMC results of the ablation zone sam-ples is evident, which appears to be partly introduced by some outliers. This may be due the follow-ing reasons: 1) laboratory contamination by both fossil and modern carbon (note that the processingblank variability does not formally explain the observed outliers); 2) incomplete removal of carbon-ate particles, leading to extremely low pMC values for some samples; 3) substantial contribution ofalready “old” organic carbon (e.g. by soil dust deposition); and 4) intrusion of modern or youngercarbon through snow deposited into crevasses upstream from the sampling sites. The first 2 effectsmay be minimized in future measurements by more refined procedures. Points 3 and 4 impose aprincipal limitation of the method. Additional measurements on the ice or meltwater may allow usto sort out such unreliable samples in the future. Extraordinarly high soil dust levels could indicate“old” organic carbon, whereas samples that experienced a contribution of modern snow or meltwa-ter may be sorted out by tritium and 210Pb analyses or by traces of blue (bubble-free) ice. We havemeasured tritium and 210Pb on ice from our sampling sites, with negative results concerning anycontamination by modern material. However, these measurements were not repeated on the ice sam-ples processed for POC.
The statistical method used to further evaluate the present results should not be sensitive to theseoutliers, but should yield the “typical” pMC value, which is representative for the true sample age.Additionally, the measurement uncertainties as given in Table 2 are too small to explain the scatter
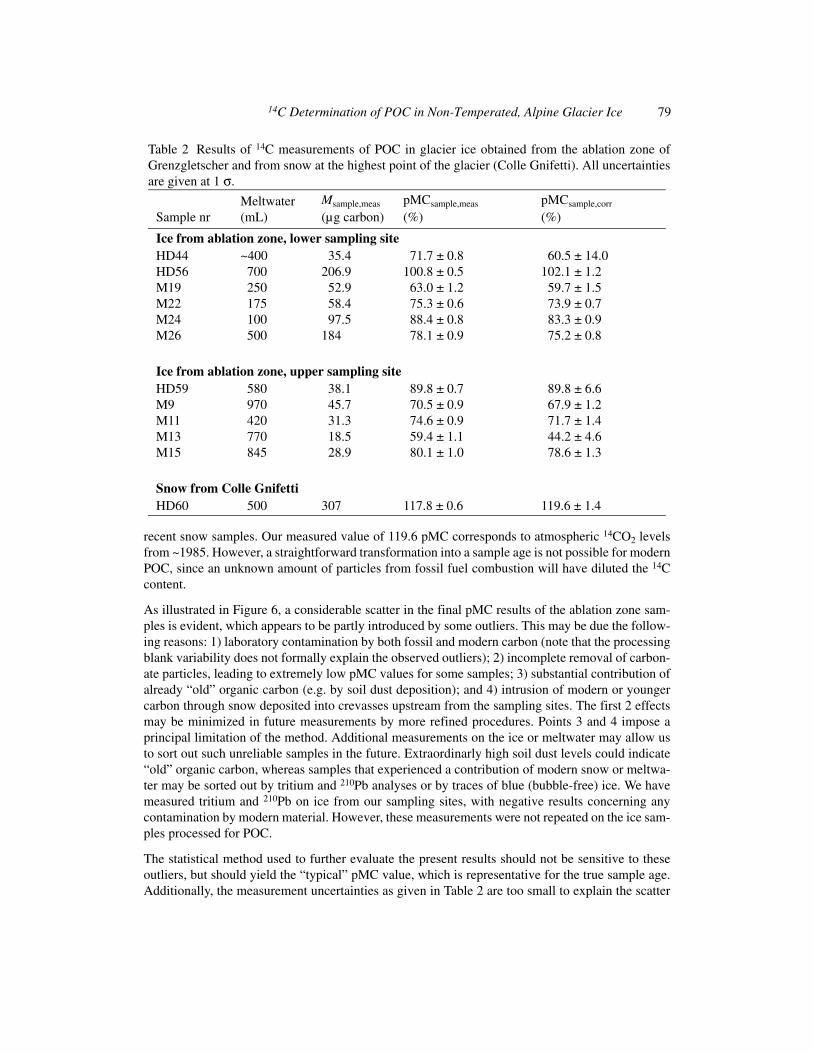
Table 2 Results of 14C measurements of POC in glacier ice obtained from the ablation zone ofGrenzgletscher and from snow at the highest point of the glacier (Colle Gnifetti). All uncertaintiesare given at 1 σ.
Sample nrMeltwater (mL)
Msample,meas
(µg carbon)pMCsample,meas
(%)pMCsample,corr
(%)
Ice from ablation zone, lower sampling siteHD44 ~400 35.4 71.7 ± 0.8 60.5 ± 14.0HD56 700 206.9 100.8 ± 0.5 102.1 ± 1.2M19 250 52.9 63.0 ± 1.2 59.7 ± 1.5M22 175 58.4 75.3 ± 0.6 73.9 ± 0.7M24 100 97.5 88.4 ± 0.8 83.3 ± 0.9M26 500 184 78.1 ± 0.9 75.2 ± 0.8
Ice from ablation zone, upper sampling siteHD59 580 38.1 89.8 ± 0.7 89.8 ± 6.6M9 970 45.7 70.5 ± 0.9 67.9 ± 1.2M11 420 31.3 74.6 ± 0.9 71.7 ± 1.4M13 770 18.5 59.4 ± 1.1 44.2 ± 4.6M15 845 28.9 80.1 ± 1.0 78.6 ± 1.3
Snow from Colle GnifettiHD60 500 307 117.8 ± 0.6 119.6 ± 1.4
80 P Steier et al.
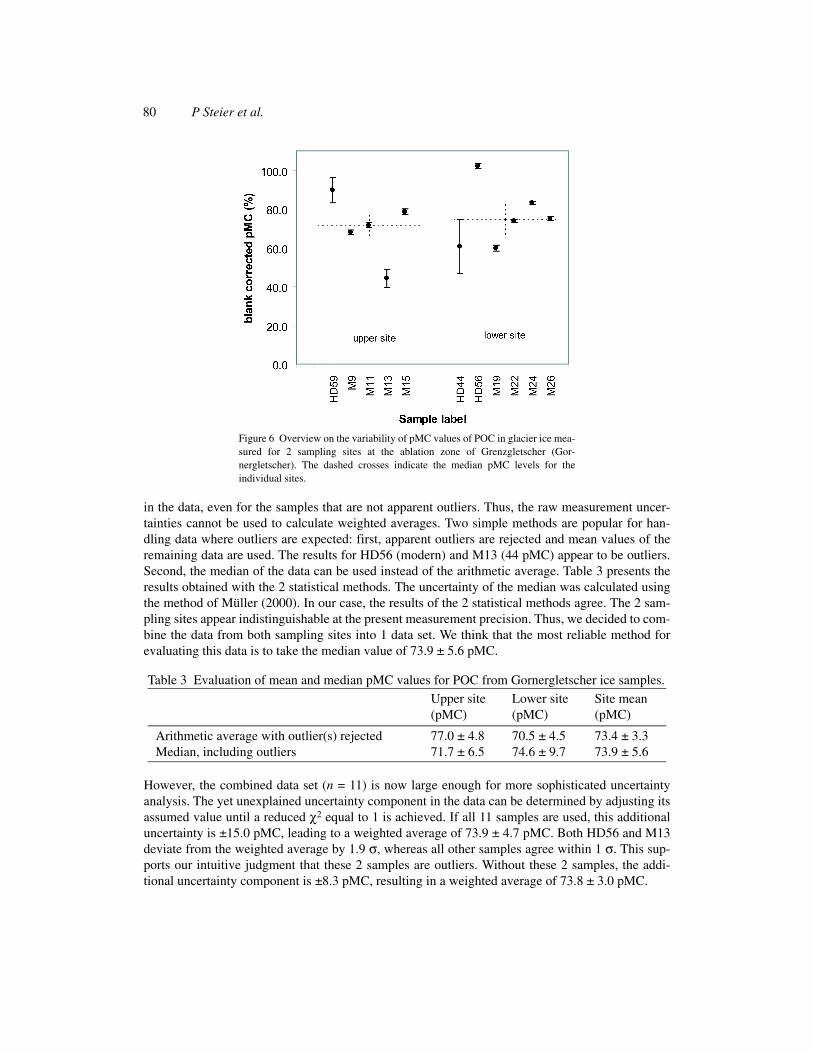
in the data, even for the samples that are not apparent outliers. Thus, the raw measurement uncer-tainties cannot be used to calculate weighted averages. Two simple methods are popular for han-dling data where outliers are expected: first, apparent outliers are rejected and mean values of theremaining data are used. The results for HD56 (modern) and M13 (44 pMC) appear to be outliers.Second, the median of the data can be used instead of the arithmetic average. Table 3 presents theresults obtained with the 2 statistical methods. The uncertainty of the median was calculated usingthe method of Müller (2000). In our case, the results of the 2 statistical methods agree. The 2 sam-pling sites appear indistinguishable at the present measurement precision. Thus, we decided to com-bine the data from both sampling sites into 1 data set. We think that the most reliable method forevaluating this data is to take the median value of 73.9 ± 5.6 pMC.
However, the combined data set (n = 11) is now large enough for more sophisticated uncertaintyanalysis. The yet unexplained uncertainty component in the data can be determined by adjusting itsassumed value until a reduced χ2 equal to 1 is achieved. If all 11 samples are used, this additionaluncertainty is ±15.0 pMC, leading to a weighted average of 73.9 ± 4.7 pMC. Both HD56 and M13deviate from the weighted average by 1.9 σ, whereas all other samples agree within 1 σ. This sup-ports our intuitive judgment that these 2 samples are outliers. Without these 2 samples, the addi-tional uncertainty component is ±8.3 pMC, resulting in a weighted average of 73.8 ± 3.0 pMC.
Figure 6 Overview on the variability of pMC values of POC in glacier ice mea-sured for 2 sampling sites at the ablation zone of Grenzgletscher (Gor-nergletscher). The dashed crosses indicate the median pMC levels for theindividual sites.
Table 3 Evaluation of mean and median pMC values for POC from Gornergletscher ice samples.
Upper site(pMC)
Lower site(pMC)
Site mean(pMC)
Arithmetic average with outlier(s) rejected 77.0 ± 4.8 70.5 ± 4.5 73.4 ± 3.3Median, including outliers 71.7 ± 6.5 74.6 ± 9.7 73.9 ± 5.6
14C Determination of POC in Non-Temperated, Alpine Glacier Ice 81
In our opinion, the most accurate value of the Grenzgletscher ice in the area of the 2 ice pits is 73.9 ±5.6 pMC. This corresponds to a calibrated age of 2100 BC to AD 900 at a 95.4% confidence level,which is in broad agreement with the glaciological picture. At the current measurement precision,the wiggles of the calibration curve yield only a minor contribution to the uncertainty.
DISCUSSION
We developed and tested a system dedicated to AMS 14C analyses of POC amounts in the range of10–100 µg C per kg of ice as contained in high alpine snow and non-temperated glacier ice.Combustion yields CO2 amounts down to ~20 µg C for the filtrated POC and down to ~5 µg C forthe filtration blanks, which can be analyzed for 14C at a typical precision of 1–3%. A much largercontribution to the total uncertainty is introduced by the reproducibility of the filter blanks, leadingto an uncertainty of up to 23% for the blank-corrected result of the smallest samples.
Improvements to the sample preparation technique should concentrate on further minimizing theamount and variability of the carbon background introduced during meltwater processing. In thiscontext, attempts will be made to detach the collected particles from a suitable filter medium. Thiswould allow for the processing of a larger amount of meltwater by using a smaller filter, whichshould greatly reduce the contamination level.
Test samples from the non-temperated ablation zone of Grenzgletscher showed a surprisingly largescatter in the pMC values, which makes it evident that at present a single 14C date of glacial POCseems to have limited significance. This observation calls for a set of several measurements on thesame ice body to achieve a reliable evaluation in terms of age. This strategy will be taken intoaccount in future measurements by dividing the meltwater of 1 ice sample into aliquots of the small-est size still suitable for reliable 14C determination. Especially in the case of ice samples from non-temperated ablation zones, a full chemical and radiochemical characterization of the ice samplesappears to be mandatory in order to identify unreliable results. Finally, selected ice samples ofknown age (e.g. by stratigraphical dating) will be analyzed to tackle the question of how well the 14Cage of POC represents the true age of the ice.
ACKNOWLEDGMENTS
We thank Edwin Pak (14C Radiometric Laboratory, Institut für Isotopenforschung und Kernphysik,Universität Wien) for the bulk combustion of IAEA C-3 cellulose. The work was partly funded bythe EC projects ALP-IMP (EVK2-CT-2002-00148) and CARBOSOL (EVK2-2001-00067).
REFERENCES
Armbruster M. 2000. Stratigraphische Datierung hoch-alpiner Eisbohrkerne über die letzten 1000 Jahre[Master’s thesis]. Heidelberg: Institut für Umwelt-physik, Universität Heidelberg. In German.
Biegalski SR, Currie LA, Fletcher RA, Klouda GA,Weissenbök R. 1998. AMS and microprobe analysisof combusted particles in ice and snow. Radiocarbon40(1):3–10.
Chýlek P, Srivastava V, Cahenzli L, Pinnick RG, Dod RL,Novakov T, Cook TL, Hinds BD. 1987. Aerosol andgraphitic carbon content of snow. Journal of Geophys-ical Research 92:9801–9.
Eisen O, Nixdorf U, Keck L, Wagenbach D. 2003. Alpine
ice cores and ground penetrating radar: combined in-vestigations for glaciological and climatic interpreta-tions of a cold Alpine ice body. Tellus B 55:1007–17.
EPICA Community Members. 2004. Eight glacial cyclesfrom an Antarctic ice core. Nature 429:623–8.
Goslar T, van der Knaap WO, Hicks S, Andri M, CzernikJ, Goslar E, Räsänen S, Hyötylä H. 2005. Radiocarbondating of modern peat profiles: pre- and post-bomb14C variations in the construction of age-depth mod-els. Radiocarbon 47(1):115–34.
Haeberli W. 1975. Eistemperaturen in den Alpen.Zeitschrift für Gletscherkunde und Glazialgeologie11/2:203–20. In German.
82 P Steier et al.
Haeberli, W, Kääb A, Wagner S, Vonder Mühll D, Gei-ssler P, Haas JN, Glatzel-Mattheier H, Wagenbach D.1999. Pollen analysis and 14C age of moss remains ina permafrost core recovered from the active rock gla-cier Murtel-Corvatsch, Swiss Alps: geomorphologicaland glaciological implications. Journal of Glaciology45/149:1–8.
Hammer C, Mayewski PA, Peel D, Stuiver M. 1997.Preface. Journal of Geophysical Research 102:26,315–6.
Landeskarte der Schweiz 1:25000: Zermatt [map]. 1995.Bundesamt für Landestopographie. Wabern, Switzer-land.
Lal D, Jull AJT, Donahue DJ, Burtner D, Nishiizumi K.1990. Polar ice ablation rates measured using in situcosmogenic 14C. Nature 346:350–2.
Lal D, Jull AJT, Burr GS, Donahue DJ. 2000. On thecharacteristics of cosmogenic in situ 14C in someGISP2 Holocene and late glacial ice samples. NuclearInstruments and Methods in Physics Research B 172:623–31.
Lal D, Jull AJT, Donahue DJ, Burr GS, Deck B, Jouzel J,Steig E. 2001. Record of cosmogenic in situ produced14C in Vostok and Taylor Dome ice samples: implica-tions for strong role of wind ventilation processes.Journal of Geophysical Research 106:31,933–42.
Levin I, Hesshaimer V. 2000. Radiocarbon—a uniquetracer of global carbon cycle dynamics. Radiocarbon42(1):69–80.
Meese DA, Gow AJ, Alley RB, Zielinski GA, GrootesPM, Ram M, Taylor KC, Mayewski PA, Bolzan JF.1997. The Greenland Ice Sheet Project 2 depth-agescale: methods and results. Journal of GeophysicalResearch 102:26,411–23.
Müller JW. 2000. Possible advantages of a robust evalu-ation of comparisons. Journal of Research of the Na-tional Institute of Standards and Technology 105:551–5.
Petit JR, Jouzel J, Raynaud D, Barkov NI, Barnola J-M,Basile I, Benders M, Chappellaz J, Davis M, DelayqueG, Delmotte M, Kotlyakov VM, Legrand M, LipenkovVY, Lorius C, Pépin L, Ritz C, Saltzman E, StievenardM. 1999. Climate and atmospheric history of the past420,000 years from the Vostok ice core, Antarctica.Nature 399:429–36.
Reeh N, Oerter H, Lettrguilly A, Miller H, HubbertenHW. 1991. A new, detailed ice-age oxygen-18 recordfrom the ice sheet margin in central West Greenland.Palaeogeography, Palaeoclimatology, Palaeoecology(Global and Planetary Change Section) 90:373–83.
Renaud A. 1952. Observations on the surface movementand ablation of the Gorner Glacier (Switzerland).Journal of Glaciology 2/11:54–7.
Rom W, Brenninkmeijer CAM, Bronk Ramsey C, Kut-
schera W, Priller A, Puchegger S, Röckmann T, SteierP. 2000. Methodological aspects of atmospheric 14COmeasurements with AMS. Nuclear Instruments andMethods in Physics Research B 172:530–6.
Rozanski K, Stichler W, Gonfiantini R, Scott EM, Beu-kens RP, Kromer B, van der Plicht J. 1992. The IAEA14C intercomparison exercise 1990. Radiocarbon34(3):506–19.
Seinfeld JH. 1998. Atmospheric Chemistry and Physics:From Air Pollution to Climate Change. New York:John Wiley & Sons. 1326 p.
Steier P, Dellinger F, Kutschera W, Rom W, Wild EM.2004. Pushing the precision limit of 14C measure-ments with AMS. Radiocarbon 46(2):969–78.
Stuiver M, Polach HA. 1977. Discussion: reporting of14C data. Radiocarbon 19(3):355–63.
Szidat S, Jenk TM, Gäggeler HW, Synal HA, Hajdas I,Bonani G, Saurer M. 2004. THEODORE, a two-stepheating system for the EC/OC determination of radio-carbon (14C) in the environment. Nuclear Instrumentsand Methods in Physics Research B 223–224:829–36.
Thompson LG, Davis ME, Mosley-Thompson E, SowersTA, Henderson KA, Zagorodnov VS, Lin P-N,Mikhalenko VN, Campen RK, Bolzan JF, Cole-Dai J,Francou B. 1998. A 25,000-year tropical climate his-tory from Bolivian ice cores. Science 282:1858–64.
Thompson LG, Mosley-Thompson E, Davis ME, Hend-erson KA, Brecher HH, Zagorodnov VS, MashiottaTA, Lin P-N, Mikhalenko VN, Hardy DR, Beer J.2002. Kilimanjaro ice core records: evidence of Ho-locene climate change in tropical Africa. Science 298:589–93.
Van Roijen JJ, van der Borg K, de Jong AFM, OerlemansJ. 1995. Ages and ablation rates from 14C measure-ments on Antarctic ice. Annals of Glaciology 21:139–43.
Vandeputte K, Moens L, Dams R, van der Plicht J. 1998.Study of the 14C-contamination potential of C impuri-ties in CuO and Fe. Radiocarbon 40(1):103–10.
Vogel JS, Southon JR, Nelson DE, Brown TA. 1984. Per-formance of catalytically condensed carbon for use inaccelerator mass spectrometry. Nuclear Instrumentsand Methods in Physics Research B 5:289–93.
Wagenbach D. 1989. Environmental records in alpineglaciers and ice sheets. In: Oeschger H, Langway CC,editors. The Environmental Record in Glaciers andIce Sheets. Dahlem Konferenzen. Chichester: JohnWiley & Sons Limited. p 69–83.
Weissenbök R, Currie LA, Gröllert C, Kutschera W, Ma-rolf J, Priller A, Puxbaum H, Rom W, Steier P. 2000.Accelerator mass spectrometry analysis of non-solu-ble carbon in aerosol particles from high alpine snow(Mt. Sonnblick, Austria). Radiocarbon 42(2):285–94.