Embed Size (px)
Citation preview

Chetana’sRamprasad KhandelwalInstitute of Management & Research
QuestQuestQuestJournal of Management Research
Volume IX, Issue I
March 2018
ISSN 0976-2000

EDITORIAL BOARDChief Editor
Dr. Madhumita Patil(CEO, CIMR & CRKIMR)
Editor
Dr. Jayashree Bhakay(Director, CRKIMR)
Chetana’sRamprasad KhandelwalInstitute of Management & Research
Dr. Sunita Srivastava
Dr. Nandita Mishra
Dr. Aditi Raut
Dr. Nalini Krishnan
Dr. Balaji Sadavarte
Dr. M. Shivprasad
Dr. Hufrish Majra
Members of Editorial Committee
“Quest” Journal of Management Research is a bi-annual publication of
Chetana's Ramprasad Khandelwal Institute of Management and Research to
disseminate knowledge and information in the area of finance, marketing, human
resources, operations, general management practices, business development etc.
The Journal intends to focus on theoretical, applied and interdisciplinary
research in business and management studies. It provides a forum for debate and
deliberations for academicians, industrialist and practitioners in the field of business
and management.
The Views expressed in the articles and other material published in the journal
do not reflect the opinions of the Institute.

FROM THE EDITOR’S DESK
The present era is rightly described as “ICE” era, i.e. Information,Communication and Entertainment. The period is witnessing lots ofchanges the way different functions are performed by businesses,society and government all across the world because of the technologicalrevolution. Technology is one of the determinants of success of a firmas well as the economic and social development of a nation.
Bill Gates has once mentioned, “the advance of technology is based onmaking it fit in so that you don’t really even notice it, so it’s part ofeveryday life”. Technology appears to be a life changer in socio,economic, political and regulatory system of the nations. There aremajor changes in the marketing, finance and infrastructure sector ofevery economy. It has also brought in several changes in the educationsector all across the globe. The impact of technology has become avery interesting topic for research work, academic as well as scientific.
We are happy to share with you these technological advancements ashave been researched by the authors in the current issue of our journal.The case studies, published in the journal, compel the readers tothink, debate and do further research on issues raised by the authors.We hope that readers will enjoy reading all the articles published inthis issue.
We thank the authors who have spontaneously responded to ourinvitation to write research articles, papers as well as case studies forour journal.
Dr. (Ms) Jayashree BhakayEditor

.

CONTENT
1. The Evolution of Marketing and Strategic Thought 1 - 12Dr. Amit Rangnekar
2. Digitization in Transaction Banking 13 - 24Bittesh Chaki
3. Hyperloop : An Impeccable Assumption or A Phenomenal Reality 25 - 31Srisiddarth Revankar
4. Analysis of Infrastructure report 32 - 43Barkha Thakar, Archit Padwe and Nitin Singh
5. A comprehensive Marketing Plan of MAPRO Foods Pvt. Ltd. 44 - 48Pritesh Choudhari
6. Amazon : Innovations for India 49 - 59Dr. Amit Rangnekar
7. Financial Modeling & Portfolio Management Services 60 - 67Sai Apurva Appala
8. A study of the Impact of Curry festival to Promote and Penetrate 68 - 73Maggi Coconut Milk PowderNandita Yadav
9. Impact of Inflation on FMCG, Power and Infrastructure sector 74 - 83Barkha Thakar, Archit Padwe and Nitin Singh
10. Talent Acquisition in Insurance Sector 84 - 91Ashwini Ajgaonkar
11. Ignitor : The New Product in Market by Arc Motors 92 - 96Tejas Narayan Patel
ISSN 2229-4740

.

1
THE EVOLUTION OF MARKETING AND STRATEGIC THOUGHTISSN – 0976-2000
The Evolution of Marketing and Strategic Thought
* Dr. Amit Rangnekar
Vol IX Issue (1) (2018) : pp 1 - 12
* Dr. Amit Rangnekar is an MBA (Marketing) and PhD (Business Strategy) from NMIMS, Email: [email protected]
1
Introduction
This chapter takes you through the evolution of marketing and strategic thought through the twentieth cen-tury and into the new millennium. The chapter highlights the stellar contribution of the pioneers in marketingand strategy, who have contributed innovative ideas and concepts, which are ubiquitously used by studentsand practitioners of management. Most of these thoughts are covered in the later chapters along with theirapplications in the current context.
1.1 OriginThe Online Etymology Dictionary dates the use ofthe term ‘marketing’ to the 1560s when it meant‘buying and selling,’ which is drawn from the word‘market’ which means ‘to trade, deal in, buy’ drawnfrom marché (French), mercatus (Latin), mercato(Italian) and (Spanish) Mercado (http://www.etymonline.com/).
In 1810 the term strategy was first used, meaning‘art of a general’ drawn from strategia (Greek)which means ‘office or command of a general’.Strategia is derived from stratos ‘army, expedition’and agos ‘leader’ (http://www.etymonline.com/).Hence strategy means the ‘art of war’ and also draws
from military and political strategists. In the Eigh-teenth century, Adam Smith’s ‘Wealth of Nations’1 proclaimed that ‘Consumption is the sole end andpurpose of production’. This was the era of theinfluence of economics, and continued into thetwentieth century with a focus on commoditieswhere price became the distinguishing competitiveadvantage.
Table 1.1 divides the evolution of marketing andstrategic thought into four distinct periodic phases-commodities till the 1950s, marketing and strategyin the 1960s and 1970s, marketing strategy andservices in the 1980s and 1990s, and relationships,internet and social media in the new millennium.
Volume IX Issue (1) March 2018 Chetana’s R.K. Institute of Management and Research
Chetana’s

THE EVOLUTION OF MARKETING AND STRATEGIC THOUGHT
2
1.2 Pre 1950s- CommoditiesIn 1908, the same year when the Harvard BusinessSchool started, Henry Ford revolutionized theAmerican automobile industry by introducing massproduction methods, which made automobilesaffordable and popular. In 1912, Parlin2 classifiedconsumer goods as convenience, shopping, spe-cialty and emergency goods, which led to a deeperunderstanding of the dynamics of marketing con-sumer goods.
In 1923, Alfred Sloan3 of General Motors createda decentralized structure with multiple business
units, which were led by a business head who wasresponsible for production, marketing, and finance.In 1924, Sloan introduced the concept of segmen-tation by announcing ‘a car for every purse andpurpose’. Sloan segmented the American car mar-ket by price range, and each brand was focused onone segment. While Chevrolet targeted the lowerend of the market Cadillac targeted the high end.Sloan also introduced the concept of car financingfor dealers and customers thus creating wants anddesires and established strong customer relation-ships. While Ford focused on mass production andmarketed only one model, GM overtook Ford as
Table 1.1 The Evolution of Marketing and Strategic Thought
Volume IX Issue (1) March 2018 Chetana’s R.K.I.M.R. ISSN – 0976-2000
Pre 1950s 1950-70s 1980-90s 2000+ Commodities Marketing + Strategy Marketing Strategy +
Services Relationship + Internet + Social Media
Commodities Corporate strategy Competitive strategy Delta Model Consumer goods Strategic management Competitive advantage Permission and interruption
marketing Mass production Business strategy 5 forces model Social media Brand management Business environment Value Chain Customer lifetime value Distribution channels, Middlemen
SWOT analysis Business level strategies Buzz marketing
Marketing research Product differentiation Market driven Viral marketing Mail order Market segmentation Services mix 7Ps Customer equity Advertising Product life cycle Relationship marketing 3 V’s Print advertising Customer orientation Marketing warfare Radio advertising Positioning Integrated Marketing
Communications (IMC)
Survey Social marketing Brand equity Aided Recall Non profit marketing Brand identity TV advertising BCG matrix Internet ads Marketing concept GE matrix Mobile phone ads Structure-conduct-performance
Macro marketing Globalisation of markets
Ansoff matrix Telemarketing Brand architecture Marketing concept Core competence Marketing mix Competitive advantage 4Ps Direct marketing Blog ads Experiential marketing

3
THE EVOLUTION OF MARKETING AND STRATEGIC THOUGHT
the global leader in the automobiles market, a po-sition it held for 77 years from 1929 to 2006! Froman economics base, marketing became more mana-gerial where it slowly evolved into a separate func-tion.
Marketing Research as an organized businessactivity began in 1911 when Charles Parlin startedcommercial research at the Curtis Publishing Com-pany4. The advent of marketing research coincidedwith the emergence of the advertising agencies inthe 1920s. In the early 1930’s Daniel Starch5 devel-oped the survey and questionnaire concept byinterviewing people, asking them questions on in-terest and awareness levels on advertisements, andcollecting the data, to ensure the advertisementseffectively reach their readers. In the 1930s GeorgeGallup6 developed the ‘aided recall’ system tomeasure the effectiveness of radio and televisionadvertising. In the 1940s sampling techniquesstarted, and the introduction of computers from the1960s led to the dominance of quantitative market-ing research. This was further bolstered with tech-nological advances like the internet, scanners,barcodes, computer assisted telephone interview-ing, sophisticated software and high speed com-plex data processing capability of computers.
In June 1836, French newspaper La Presse7 wasthe first to include paid advertising in its pages,which allowed it to lower its price, extend its read-ership and increase its profitability, a formula cop-ied by all newspapers subsequently. Mail orderadvertising in the late 1890s, was followed by printadvertising for weight gain medicines, books andencyclopedia, at the turn of the century. N.W. Ayer& Son in 1869 was the first advertising agencylocated in Philadelphia but modern advertising wascreated by tobacco companies in the 1920s, whohad started mass production and hence needed to
create demand for cigarettes through advertising.
Radio advertisement started in 1922 and gave afillip to the advertising industry. This was followedby TV advertisements in 1941 that provided sight,sound and motion, so a variety of products couldbe advertised effectively, with greater recall andrecognition by the audience. The 1970s sawtelemarketing being introduced for promotion.However, the emergence of the internet transformedadvertising as internet ads (1994) and search en-gines (1995) started targeting captive audiences inbillions. Mobile phone advertising (1996) was fol-lowed by blog ads (1998), and ads on social medialike Linked In (2003), Facebook (2003) and Twit-ter (2006). During the start of the century newspa-per advertising reigned, which was overtaken byTV advertising in the 1980s but in the new millen-nium the youth are spending more time on theinternet than in front of the TV.
Neil McElroy8 of Procter & Gamble (P&G) intro-duced the concept of ‘brand management’ in 1931.While designing the promotion for Camay soap, herealised Camay had to compete with brands fromLever and Palmolive, as also P&G’s Ivory. He ar-gued that each brand should receive concentratedattention with a separate dedicated team in chargeof marketing that brand as a separate business. Thebrand would be targeted to different consumermarkets, which would distinguish the brand fromothers, and would be less competitive with eachother. Thus, the concepts of differentiation andbrand management were born, which emerged askey elements of marketing strategy.
1.3 The 1950s-1970s - Marketing + StrategyThe paradigm shift in marketing emerged postWorld War II and lasted till the Seventies. Changeslike advanced mathematical modeling, mass con-
Volume IX Issue (1) March 2018 Chetana’s R.K.I.M.R. ISSN – 0976-2000

THE EVOLUTION OF MARKETING AND STRATEGIC THOUGHT
4
sumer goods production, and curriculum changesin business study9 took place in this period. Pro-duction oriented companies realised that with grow-ing affluence, consumers had more power in themarket. Their sales orientation did not resonate withconsumers, which led to the emergence and impor-tance of the marketing department, which nowincluded advertising, sales, promotion, public rela-tions, etc. Due to surplus supply, companies neededto work harder to generate demand, sell their prod-ucts and fight for market share. Thus, the market-ing concept where a business exists to addresscustomer needs became widely accepted.
Joseph Bain’s ‘structure-conduct-performance’model10 (1956) hypothesized that industry structure(number of sellers and buyers, product differentia-tion, barriers to entry, degree of fixed versus vari-able costs, vertical integration) determined firmconduct (pricing, promotion), which in turn deter-mined economic performance (profitability). In1962, Alfred Chandler11, professor of business his-tory at the Harvard Business School, studied thecorporate structure of the biggest firms, and opinedthat the organisational structure was developedin response to the corporation’s business strategyto avail of opportunities in the market.
In 1957, Igor Ansoff, the father of strategy, createda growth strategy matrix12 that set the directionfor business strategy through two dimensions, prod-uct and market, which remains very relevant today.Throughout the 1960s Ansoff introduced the con-cept of corporate strategy, strategic managementand business strategy, followed by path breakingwork on the business environment and its rela-tionship to the firm, industry analysis, and the con-cept of strengths and weaknesses. The ubiquitousSWOT analysis technique however, was later pre-sented by Albert Humphrey at a convention atStanford University in the 1960s.
Peter Drucker13, the management guru, espousedconcepts in marketing that were path breaking andare still relevant despite the many changes inthought. In 1954 Drucker articulated the ‘market-ing concept’ by saying that marketing wasn’t aseparate function but the entire business seen fromthe customer’s point of view. Drucker asserted that‘Business has only two functions- marketing andinnovation. All the rest are costs.’ Drucker furtheradded that ‘the only purpose of a business is tocreate a customer.’ These thoughts completelychanged paradigms in marketing with the focusshifting towards the customer.
In the early 1950s, Neil Borden, a marketing pro-fessor at the Harvard Business School, redefinedthe position of the marketing manager by introduc-ing the ‘marketing mix’14 which was defined asan integrated set of marketing tactics to realiseorganisational objectives and create a closer, highervalue relationship with customers. Borden identi-fied the mix as- Products, Markets, Pricing, Brand-ing, Channels of Distribution, Advertising, Pack-aging, Display, Servicing, Physical Handling, andFact Finding and Analysis.
In the late 1950s, E. Jerome McCarthy, a market-ing professor at the Michigan State University, clas-sified and condensed the number of variables inthe marketing mix into four categories- product,price, place and promotion. McCarthy’s 4Ps15 con-cept continues to be popular along with the addi-tional P’s introduced by other marketers.
Wendell Smith (1956)16 mooted the concept of‘product differentiation and market segmenta-tion’ as alternative marketing strategies whileChester Wasson (1960)17 introduced the idea of the‘product life cycle’.
Theodore Levitt (1960), a marketing professor at
Volume IX Issue (1) March 2018 Chetana’s R.K.I.M.R. ISSN – 0976-2000

5
THE EVOLUTION OF MARKETING AND STRATEGIC THOUGHT
the Harvard Business School, published a seminalarticle ‘Marketing Myopia’18, in the Harvard Busi-ness Review, which shifted the focus on marketingfrom ‘product orientation to customer orientation’.Levitt asserted that selling focused on the needs ofthe seller, marketing on the needs of the buyer. In1965 Levitt augmented the concept of the productlifecycle19 and explained how products go throughdifferent phases in its lifecycle and the differentcompetitive strategies that need to be formulated inevery phase. In 1980, Levitt posited that all goodsand services can be ‘differentiated’20 if the natureof the product is understood. He classified prod-ucts as generic, expected, augmented and poten-tial, and that marketers should activate all productlevels to attract and retain customers. In 1983 Levittpredicted the ‘globalisation of markets’21 due totechnology which was a powerful binding force tohomogenise markets everywhere.
The 1960s saw a focus on buyer (consumer)behaviour and buying decisions, more under theambit of psychological factors than under market-ing. John Howard and Jagdish Sheth (1969)22 in-troduced the buyer behaviour model which ex-plained consumer and industrial buyer behav-ior, identified the variables that influence the deci-sion making process, loyalty factors, and the rela-tionship that leads to a purchase decision. Thismodel influenced later researches on consumer,industrial and organisational buying behavior.
Philip Kotler23, the marketing guru, espoused theconcepts of sales response (1967), market share,optimal marketing mix relative to competition,and extended marketing management beyond tra-ditional marketing mix techniques to the market-ing of social and not for profit organisations.Kotler has published over 50 books on marketingincluding the all time best seller on marketingmanagement which has influenced generations of
marketers for close to 50 years.
George Fisk24 (1967) delineated micro- and macro-marketing systems while Donald Dixon25 (1967)expanded the macro perspective, showing how themarketing system was integrated into the largersociety of which it forms a part.
Building on the work of Clark (1922)26 who intro-duced the term ‘channel of distribution’ andBeckman (1937) who explained the concept ofmiddlemen, Bucklin27 (1965) defined distributionas ‘a set of institutions which perform all of theactivities utilised to move a product and its titlefrom production to consumption’. This period alsosaw advances in the study of distribution, whichled to further research in the area of distributionchannels and availability of products.
The mail-order catalogue was pioneered in 1872by Aaron Montgomery Ward28. But LesterWunderman29, in 1967, coined the term ‘directmarketing’ and pioneered various loyalty progra-mmes like the toll-free number, magazine subscrip-tion card and customer rewards. Direct marketingallows businesses to directly communicate to thecustomer, through different media like phone call,sms, email, mail, interactive websites, online dis-play ads, fliers and catalogues. Today direct mar-keting is practised by most companies in some formor the other.
In 1969 Jack Trout a young advertising executiveintroduced the term ‘positioning’30 in the journal‘Industrial Marketing’. Later Trout and his partnerAl Ries elaborated on this topic in their book ‘Po-sitioning - The Battle for Your Mind’31 where theysaid positioning is creating an image or identity inthe minds of their target market. Ries and JackTrout described how positioning can be effectivelyapplied as a key communication tool to reach tar-
Volume IX Issue (1) March 2018 Chetana’s R.K.I.M.R. ISSN – 0976-2000

THE EVOLUTION OF MARKETING AND STRATEGIC THOUGHT
6
get customers in a crowded marketplace. The po-sitioning concept became very successful and isextensively used in branding.
From the mid Seventies to the turn of the millen-nium, was the period of paradigm broadening.Consumer behavior drawn from psychology enteredmarketing, and the genius of Philip Kotler led thisera with advances in marketing management, ex-change and consumer behavior. This expanded theboundaries of marketing to include the seller’sperspective in marketing products and services.
The Boston Consulting Group (BCG) matrix32 orthe growth-share matrix (1972), and the GeneralElectric (GE) matrix33, co-developed by McKinsey,in the 1970s, both, analysed business portfolios.The McKinsey 7S framework34 (1981), highlightedthat effective strategic management emerged froma fit between the seven variables- structure, strat-egy, systems, staff, skill, style and shared values.The industry, the markets and firm scope becameimportant in the late 1980s, with a focus on therelationship between strategy and performance.
1.4 The 1980s- 1990s- Marketing Strategy + Ser-vicesDrawing upon various models of industrial eco-nomics, strategy guru, Michael Porter defined the5 forces 35 (1979) or attributes of industry struc-ture- entry barriers, intensity of rivalry, substitutes,and the relative power of suppliers and buyers, andhow they could influence the ability of a firm toeither maintain or create above normal returns.Porter followed this up with influential volumes oncompetition- competitive strategy36 (1980) andcompetitive advantage37 (1985), which providedframeworks for analysing the effects of differentmarket conditions like differentiated oligopolies oncorporate strategies and anticipated strategic posi-
tions, thus providing newer paradigms38. Porteridentified three business level strategies that firmsuse to gain competitive advantage- cost leadership,differentiation, and focus. The Value Chain analy-sis framework (1985), focused on the rent generat-ing potential of each link in the value chain, andsuggested investments in various links, outsourcing,or expansion of activities.
Kotler broadened the marketing paradigms withupdated and relevant editions that factored in thelatest advances in marketing thought and uniquelycontributed in the areas of consumer behavior,customer value, strategic marketing, marketingin the new economy, and augmented the body ofknowledge in the areas of the marketing mix, seg-mentation, targeting and positioning, as also mar-keting strategies, marketing warfare and marketingof services. Kotler advocated the importance of‘values’ in the exchange process, which facilitatedthe transfer of goods from producers to consumers.Kotler introduced the concept of emotion in theexchange process, which hitherto involved onlygoods, money, time and energy, which gave rise tothe social exchange school of thought.
Booms and Bitner39 (1981) introduced the servicesmix of 7Ps which demonstrated that the marketingof services required unique and different decisionsthan marketing products. The integration of threenew Ps- people, process and physical evidence (ser-vice scape) to the marketing mix, spawned a newfield of management theory and practice separatefrom product marketing. In 1983 Leonard Berryintroduced the concept of relationship marketing40,a precursor to CRM or customer relationship mar-keting, a key ingredient in modern marketing. CRMhelps a company convert its prospects, retain itscustomers, and regains lost customers. ChristopherLovelock41 and Valarie Zeithaml42 have pioneered
Volume IX Issue (1) March 2018 Chetana’s R.K.I.M.R. ISSN – 0976-2000

7
THE EVOLUTION OF MARKETING AND STRATEGIC THOUGHT
the subject of services marketing, distinguishingit from product marketing. With the services sectorcontributing maximum to the global economy, studyof services marketing is extremely important in thecurrent context.
Holbrook and Hirshman43 (1982) introduced theterm “Experiential Marketing” which refers tocustomer experiences with a brand that helps drivesales and increases brand image and awareness.Customers engage and interact with the brand insensory ways, experience the benefits of a productfor themselves, and become brand loyal.
Thomas Nagle’s44 (1987) research on pricing led tothe development of path breaking strategies andtactics in pricing, which drew pricing away fromthe traditional accounting and economic models toan effective marketing strategy. Akshay Rao et al45
(2000) highlighted how companies can emergesuccessful in price wars that they use in their battleto capture the customer. David Bryce et al46 formu-lated strategies for incumbents to fight the freeofferings on the online and the physical world.
Strategy, which means directing action towardsdesired outcome, has many factors in common withwarfare including organising and deploying re-sources, and setting and achieving specific goals.From the 1980s many marketing and business strat-egists drew from the vast body of the knowledgeof warfare and political strategists like Sun Tzu,Attila the Hun, Mao Zedong and Chanakya. PhilipKotler and Ravi Singh (1980)47 developed the ini-tial models followed by the best selling MarketingWarfare48 by Al Ries and Jack Trout in 1986. Themarketing warfare strategies are based on theplayer’s competitive position- leader, challenger,follower and nicher, and a single strategy or amix of strategies from among offensive, defen-sive, flanking and guerilla, strategies may be
employed. While these strategies are widely ac-cepted the current trend is moving towards co-op-erative strategies and strategic alliances, than con-frontation.
With companies shifting away from mass market-ing, the need for an integrated approach to market-ing communication focusing on the market, media,society and consumers, was felt. The term Inte-grated Marketing Communications (IMC)49 wasfirst defined by the American Association of Ad-vertising Agencies (AAAA) in 1989. In 1999 Kotlerdefined IMC as the concept under which a com-pany carefully integrates and coordinates its manycommunication channels to deliver clear, consis-tent and compelling message about the organiza-tion and its products. Duncan50 (2002) developedthe IMC process model, which furthered the exist-ing body of knowledge on IMC.
The concept of capabilities and core competence51
of firms mooted by Gary Hamel and CK Prahaladin 1989 drew on the emphasis on knowledge andits link to the building of capabilities and competi-tive advantage as the focus.
George Day52 (1990) introduced the concept of the‘Market driven organisation’ which have supe-rior skills in understanding, attracting and retainingvaluable customers, as their strategies are alignedwith changing market requirements. Day also es-poused that firms follow two strategy formulationapproaches- ‘outside-in’ approach where the firmassesses the external environment and formulatesstrategic options; and the ‘inside-out’ approachwhere the firm assesses its resources and capabili-ties and then formulates strategies to meet the chal-lenges. Day proposed a third ‘strategic thinking’approach which integrates both outside-in and in-side-out approaches.
Volume IX Issue (1) March 2018 Chetana’s R.K.I.M.R. ISSN – 0976-2000

THE EVOLUTION OF MARKETING AND STRATEGIC THOUGHT
8
The 1990s saw significant augmentation in the areaof brand, branding, brand management and brandportfolio management. In 1992, David Aaker in-troduced the concept of brand equity53 which isthe differential that makes a customer prefer onebrand over another, and is a strategic asset for thecompany due to its brand value. Kevin Lane Keller54
(1998) developed the concepts of brand equity andbrand management54 further. The concept ofbrand identity55 was developed by Aaker, whileJean Noel Kapferer56 (1992) delved on creating andsustaining the brand identity. In 2000, Aaker andJoakimsthaler introduced and developed the con-cept of brand architecture57, which highlightedthe roles and responsibilities of brands within theportfolio and their linkages to the corporate brand.These concepts hold the key to successful brandmanagement, differentiation and portfolio brandmanagement.
1.5 The New Millennium- Relationships +Internet + Social MediaThe growing importance of retaining the customer,and service excellence culminated in two modelsbased on relationship marketing, to drive long termrevenues. Mulhern (1999) introduced the conceptof Customer lifetime value58 (CLV), a marketingformula, where a company spends money up front,and sacrifices initial profits, to build a relationshipwith customers whose loyalty and increased busi-ness will reap profits in the long term. This modelis extremely popular among technology companieslike Samsung and Apple. Aravindakshan et al (2002)introduced the concept of customer equity59, whichis the value of the potential future revenue gener-ated by a company’s customers in a lifetime. Acompany with high customer equity will be valuedat a higher price than a company with a low cus-tomer equity.
Seth Godin60 (1999) classified radio, print and TVadvertisements as well as direct marketing as ‘in-terruption marketing’ which interrupted the cus-tomer while they were doing something of theirinterest. Godin also introduced the concept of ‘per-mission marketing’ where the company seeks thepermission of the customer before communicatingas certain websites do for promotional mail andthird party mail. Permission marketing helps builda long term relationship with customers throughcontent, search engine optimisation and socialmedia. Interruption is perceived as intrusive in di-rect marketing and irritating in the electronic me-dia, it is not very cost effective, while permissionis considered to be more cost effective, especiallywith the growing penetration of the internet.
‘Buzz’61 marketing was introduced by EmanuelRosen (2000) as a term to describe an interest,excitement and anticipation created around a ce-lebrity or an event or brand or service through word-of-mouth marketing. The internet effectively helpedproliferate the ‘buzz’ through social media likeYouTube, Facebook, Linked-In and Twitter. How-ever ‘buzz’ is the goal of viral marketing especiallyon the internet like what public relations and ad-vertising would do with conventional media. RalphWilson (2000) developed Viral Marketing62 Com-munication (VMC) as a consumer-to-consumermarketing tactic, which employs the internet toencourage individuals to pass on a marketing mes-sage to others.
The Delta Model63 (Hax and Wilde, 2002) inte-grated strategy formulation and execution, captur-ing the essence of how the business positioned it-self, and the tactical means to adapt continuouslyto a dynamic environment. Nirmalya Kumar (2004)created a framework to analyse and plan marketingstrategy in terms of the 3 V’s64- valued customer,
Volume IX Issue (1) March 2018 Chetana’s R.K.I.M.R. ISSN – 0976-2000

9
THE EVOLUTION OF MARKETING AND STRATEGIC THOUGHT
valued network and value proposition, to driveinnovation and growth.
From the new millennium the focus of marketingchanged to customer driven businesses with greateremphasis on service excellence and relationshipmanagement. Globalization and technology, drivenby the mobile phone and the internet have reduced‘geography to history’ and spawned new paradigmson marketing in the areas of online advertising, e-commerce and social networking, further catalysingmarketing thought.
RECOMMENDED READING 1
I. ‘Handbook of Strategy and Management’, An-drew Pettigrew, Sage, London, 2002.II. ‘Sage Handbook of Marketing’, P Maclaran, MSaren, B Stern and Tadajewski, M. Sage, London,2009.
REFERENCES
1. Smith, Adam (1776). ‘The Wealth of Nations’,W. Strahan and T. Cadell, London
2. Parlin, C. (1912) ‘“Department Store Report”Vol. B, (October) 1912’, cited by E.H. cited byEdward H. Gardner (1945) ‘Consumer GoodsClassification’, Journal of Marketing, 9 (Janu-ary) pp.275-276.
3. Alfred Sloan and Organizational management,accessed 17 November, 2012 http://www.melodiesinmarketing.com/2008/01/28/alfred-sloan-and-organizational-management/
4. Ward, Douglas (2002). ‘A New Brand of Busi-ness: Charles Coolidge Parlin, Curtis Publish-ing Company, and the Origins of Market Re-search’, Temple University Press, Philadelphia.
5. Daniel Starch,Wikipedia, accessed 16 November,2012 http://en.wikipedia.org/wiki/Daniel_StarchAccesses
6. ‘George Gallup Biography’, Encyclopedia ofWorld Biography, Wikipedia, accessed 13 June2012 http://en.wikipedia.org/wiki/George_Gallup
7. La Presse: Stanton Glantz in Mad Men Season 3Extra - Clearing the Air - The History of Ciga-rette Advertising, Part 1, Wikipedia, accessed 18November, 2012 http://en.wikipedia.org/wiki/Advertising
8. American Business, 1920-2000: How It Worked- P&G: Changing the Face of Consumer Mar-keting, Harvard Business School WorkingKnowledge for Business Leaders, accessed 18November, 2012 http://hbswk.hbs.edu/archive/1476.html
9. Shaw, Eric H. and Jones, Brian D. G., ‘A Historyof Schools of Marketing Thought,’ MarketingTheory, 5 (3) (September 2005), pp. 239-282.
10. Bain, J.S. (1956). ‘Barriers to New Competition’.Harvard University Press, Cambridge, Ma.
11. Chandler, A. (1962). ‘Strategy and Structure’,MIT Press, Cambridge, Ma.
12. Ansoff, I., ‘Strategies for Diversification’,Harvard Business Review, Vol. 35 Issue 5 (Sep-tember-October 1957), pp. 113-124.
13. Drucker, Peter (1954). ‘The Practice of Manage-ment’, Heinemann Professional Publishing, NewYork.
14. Borden, Neil H., “The Concept of the MarketingMix,” Journal of Advertising Research, 4(2)(1964), pp. 2-7.
15. McCarthy, Jerome E. (1960). ‘Basic Marketing:
Volume IX Issue (1) March 2018 Chetana’s R.K.I.M.R. ISSN – 0976-2000

THE EVOLUTION OF MARKETING AND STRATEGIC THOUGHT
10
a Managerial Approach’, McGraw Hill, UnitedStates.
16. Smith, Wendell R., ‘Product Differentiation andMarket Segmentation as Alternative MarketingStrategies’, Journal of Marketing, 21 (July 1956),pp. 3-8.
17. Wasson, C., ‘What is “New” About a New Prod-uct?’, Journal of Marketing 24 (July 1960), pp.52-56.
18. Levitt, T., ‘Marketing Myopia’, Harvard Busi-ness Review, 38 (July-August 1960) pp. 24-47.
19. Levitt, T., ‘Exploit the product life cycle’,Harvard Business Review, 43 (November-De-cember 1965), pp. 81-94.
20. Levitt, T., Marketing Success Through Differen-tiation- of Anything, Harvard Business Review,(January-February 1980), pp. 83-91.
21. Levitt, T., ‘The Globalisation of markets’,Harvard Business Review, (May-June 1983), pp.92-102.
22. Howard, John A. and Sheth, Jagdish N. (1969).‘The theory of buyer behavior’, Wiley, New York.
23. Kotler, Philip and Armstrong, Gary (1999). ‘Prin-ciples of Marketing’, 8th Edition, Prentice Hall,NJ.
24. Fisk, G. (1967). ‘Marketing Systems’, Harper &Row, New York.
25. Dixon, D.F. and Wilkinson, I.F. (1982). ‘TheMarketing System’, Longman, Australia.
26. Maclaran, P., Saren, M., Stern, B. andTadajewski, M. (2009). ‘Sage Handbook of Mar-keting’, Sage Publications, London.
27. Bucklin, L.P., ‘Postponement, Speculation andthe Structure of Distribution Channels’, Journalof Marketing Research, 2 (February 1965) pp.
26-31.
28. History of Mongomery Ward, Funding Universe,accessed 2 December 2012, http://www.fundinguniverse.com/company-histories/montgomery-ward-co-incorporated-history/
29. Wunderman, Lester (1997). ‘Being Direct: Mak-ing Advertising Pay’, Random House, NY.
30. Trout, J., ‘“Positioning” is a game people playin today’s me-too market place’, Industrial Mar-keting, 54 (6) (June 1969), pp.51-55.
31. Ries, A. and Trout, J. (1981). ‘Positioning, Thebattle for your mind’, Warner Books- McGraw-Hill, New York.
32. BCG Matrix, accessed 19 December, 2012 http:// w w w. b c g . c o m / a b o u t _ b c g / h i s t o r y /history_1968.aspx
33. McKinsey Quarterly, Enduring Ideas: The GE–McKinsey nine-box matrix, accessed 20 Decem-ber, 2012 https://www.mckinseyquarterly.com/Enduring_ideas_The_GE-McKinsey_nine-box_matrix_2198
34. A Brief History of the Mckinsey 7-S Model, ac-cessed 19 December, 2012 http://www.tompeters.com/dispatches/012016.php
35. Porter, M.E. (1979) How Competitive ForcesShape Strategy, Harvard Business Review,(March-April 1979).
36. Porter, M.E. (1980).’Competitive Strategy: Tech-niques for Analyzing Industries and Competi-tors’, The Free Press, New York.
37. Porter, M.E. (1985). ‘Competitive Advantage;Creating and Sustaining Superior Performance’,The Free Press, New York.
38. Pettigrew, A. (2002). ‘Handbook of Strategy andManagement’, pp. 40-42, Sage, London.
Volume IX Issue (1) March 2018 Chetana’s R.K.I.M.R. ISSN – 0976-2000

11
THE EVOLUTION OF MARKETING AND STRATEGIC THOUGHT
39. Booms, B.H. and Bitner, M.J. (1981). Market-ing strategies and organization structures for ser-vice firms, in Donnelly, J.H. and George, W.R.(Eds), Marketing of Services, American Market-ing Association, Chicago, IL, pp. 47-51.
40. Berry, Leonard L. 1983, ‘Relationship Market-ing’, American Marketing Association’s ServicesMarketing Conference, paper published in theJournal of Relationship Marketing pp. 59-77.
41. Lovelock, C.H. (1996). ‘Services Marketing’, 3rdEdition, Prentice-Hall, New Jersey.
42. Zeithaml, Valarie and Bitner, Mary (2000). ‘Ser-vices Marketing’, McGraw Hill, Illinois.
43. Holbrook B. M. and Hirshman C. E., ‘The Ex-periential Aspects of Consumption: ConsumerFantasies, Feeling and Fun’, Journal of Con-sumer Research, 9(September 1982), pp.132-140.
44. Nagle, Thomas (1987). ‘The Strategy and Tac-tics of Pricing: A Guide to Profitable DecisionMaking’, Prentice Hall, New Jersey.
45. Rao, Akshay R., Bergen, Mark E. and Davis,Scott, ‘How to Fight a Price War’, Harvard Busi-ness Review, (March 2000), pp. 107-116.
46. Bryce, D.J., Dyer J.H. and Nile W.H., ‘Compet-ing against free’, The Harvard Business Review,(June 2011), pp.104-108.
47. Kotler, Philip and Singh, Ravi, ‘Marketing War-fare in the 1980s’. Journal of Business Strategy,1 (3) (1981), pp. 30–41.
48. Ries, Al and Trout, Jack (1986). ‘Marketing War-fare’, McGraw Hill, New York.
49. Kitchen, P.J. and Schultz, D.E (1997), ‘IntegratedMarketing Communications in U.S. AdvertisingAgencies: An Exploratory Study’, Journal of
Advertising Research, (September October2002), accessed 16 November, 2012 http://u t s . c c . u t e x a s . e d u / ~ t e c a s / s y l l a b i 2 /adv391kfall2002/readings/JARSchultz.pdf
50. Duncan, T. (2002). ‘IMC: Using Advertising andPromotion to Build Brands’ (International Edi-tion), McGraw-Hill, New York.
51. Prahalad, C.K. and Hamel, G., ‘The Core Com-petence of the Corporation’, Harvard BusinessReview, 68 (3) (1990), pp. 79–91.
52. Day, George S. (1990). ‘Market Driven Strategy’,The Free Press, New York.
53. Aaker, David (1991). ‘Managing Brand Equity’,The Free Press, New York.
54. Keller, Kevin Lane (1998). ‘Strategic BrandManagement’, Prentice Hall, New Jersey.
55. Aaker, David (1991). ‘Building Strong Brands’,Pocket Books, UK.
56. Kapferer, Jean Noel (1992). ‘Strategic BrandManagement’, 2nd Edition, Kogan Page, London.
57. Aaker, David and Joachimsthaler, Erich (2000).‘Brand Leadership’’, Pocket Books, UK.
58. Mulhern, F. J., ‘Customer Profitability Analysis:Measurement, Concentration, and Research Di-rections’, Journal of Interactive Marketing, 13(1)(1999) pp. 25-40.
59. Aravindakshan Ashwin, Rust Roland T., LemonKatherine N., and Zeithaml Valarie A., ‘CustomerEquity: Making Marketing Strategy FinanciallyAccountable’, Journal of Systems Science andSystems Engineering, 2004.
60. Godin, Seth (1999). ‘Permission marketing: turn-ing strangers into friends, and friends into cus-tomers’, Simon & Schuster, New York.
Volume IX Issue (1) March 2018 Chetana’s R.K.I.M.R. ISSN – 0976-2000

THE EVOLUTION OF MARKETING AND STRATEGIC THOUGHT
12
61. Emanuel, Rosen (2003). ‘Anatomy of Buzz: Cre-ating Word-of-Mouth Marketing’, Profile Books,London.
62. Wilson, R.F. “The six simple principles of viralmarketing”, Web Marketing Today, 70 (2000), pp.1-3.
63. Hax, Arnoldo C. and Wilde, Dean L. II, ‘TheDelta Model — Toward a Unified Frameworkof Strategy’, Massachusetts Institute of Technol-ogy (MIT) - Sloan School of Management, Work-ing Paper No. 4261-02‘ (2002).
64. Kumar, Nirmalya (2004). ‘Marketing as Strat-egy’, Harvard Business Publishing, Cambridge,Ma.
65. Marketing Definition, Etymonline, accessed 3October, 2012, http://www.etymonline.com/index.php?search=marketing
66. Bartels, Robert, ‘Influences on the developmentof Marketing Thought, 1900-1923’, The Jour-nal of Marketing, XVI (July 1951 No. 1).
67. Perreault, William D., Jr., and E. JeromeMcCarthy (1999)’. ‘Basic Marketing: A Global-Managerial Approach’, 13th Edition, McGraw-Hill, Boston.
68. Day, G. (1981). ‘The product life cycle: Analysisand applications issues’, Journal of Marketing,45 (Autumn 1981), pp 60–67.
69. Cabre, Charles and Renart, Lluis G., ‘How toimprove a CRM strategy’, University of Navarra,
IESE Business School, Working Paper No. 690(May 2007).
70. Gardner, E.H., ‘Consumer Goods Classification’,Journal of Marketing, 9 (January 1945) pp.275-276.
71. ‘What is Marketing Research?’, eNotes, accessed23 November, 2013 http://www.enotes.com/mar-keting-research-reference/marketing-research
72. Boyd, Harper W., and Westfall, Ralph.(1972). ‘Marketing Research: Text and Cases’,Minnesota.
73. Studlar, Donley T. (2002). ‘Tobacco Control:Comparative Politics in the United States andCanada’, p.55, Broadview Press, Ontario.
74. Sheth, J.N., Gardner, D.M. and Garrett, D.E.(1988). ‘Marketing Theory: Evolution and Evalu-ation’, John Wiley, New York.
75. Aaker, David (2012). ‘Strategic Market Manage-ment’, 7th Edition, Wiley, India.
76. Aaker, David (2004). ‘Brand Portfolio Strategy:Creating Relevance, Differentiation, Energy,Leverage, and Clarity’, The Free Press, NewYork.
77. ‘The Customer Lifetime Value Equation: Will ItPay Off for Tech Companies?’,Knowledge@Wharton, published 7 December,2011, accessed 19 December, 2012. http://k n o w l e d g e . w h a r t o n . u p e n n . e d u /article.cfm?articleid=2890
Volume IX Issue (1) March 2018 Chetana’s R.K.I.M.R. ISSN – 0976-2000

13
DIGITIZATION IN TRANSACTION BANKING
Digitization in Transaction Banking
* Bittesh Chaki
* Bittesh Chaki, Student, MMS Batch 2016-2018 CRKIMR
13
AbstractMigration from paper-based payments to electronic payment systems will improve the overall efficiency ofthe payment system, and also provide cost savings and efficiency to the entire economy. In recent yearsIndian banking system has been undergoing modernization phase and implementing many innovative ideasin the system. This study is focused on only payment and settlement system and it is based on secondary datasources. Data in this report has been analyzed by using simple statistical tools.
Keywords: NEFT, RTGS, Mobile Banking, Debit & Credit Cards, ATM, POS, MDR
INTRODUCTION
Various developments have taken place in Indianbanking. Among the various developments, tech-nology has influenced the way customer interactswith banks. In India, Reserve Bank of India out-lined the mission to ensure that payment and settle-ment systems are safe, efficient, interoperable,authorized, accessible, inclusive and compliant withinternational standard. The Vision is to proactivelyencourage electronic payment system for usheringin a cashless society in India. Regulation is keen topromote innovation and competition with an inten-tion to help payment system achieve internationalstandards.
REVIEW OF LITERATURE
Vijay M. Kumbhar (2011) In his research paper“Factors Affecting the Customer satisfaction in E-banking: Some evidences Form Indian Banks”. Thisstudy evaluates major factors (i.e. service quality,brand perception and perceived value) affecting oncustomers’ satisfaction in e-banking service settings.His study also evaluates influence of service qual-ity on brand perception, perceived value and satis-faction in e-banking.
Aastha Gupta & Manish Gupta (2013) In their re-search paper “Electronic Mode of Payment – Astudy of Indian Banking System”, tried to examine
ISSN – 0976-2000 Vol IX Issue (1) (2018) : pp 13 - 24
Volume IX Issue (1) March 2018 Chetana’s R.K. Institute of Management and Research
Chetana’s

DIGITIZATION IN TRANSACTION BANKING
14
different modes of transaction in Indian Bankingsystem and how technology has helped in evolve.Asish Das in his paper “The Art of Living for ATMsin India” (2014) tried to find out the cost of ATMbusiness for the banks and how banks can mini-mize cost by directing customers to ATM ratherthan branch transaction.
RESEARCH METHODOLOGY
The present study has been made from secondary
(Source: RBI)
Fig 1: Growth in number of Retail Digital Transaction
data. This Secondary Data has been collected fromNational Payment Corporation of India and ReserveBank of India websites, magazines, publicationsand annual reports.
OBJECTIVES OF STUDY
To study the trends in various Payment Systems To understand the scope of Digitization in Trans-
action Banking
GROWTH IN DIGITAL TRANSACTION
Volume IX Issue (1) March 2018 Chetana’s R.K.I.M.R. ISSN – 0976-2000

15
DIGITIZATION IN TRANSACTION BANKING
RTGS NEFT IMPS m-Wallet PPI Cards Mobile Banking NACH
2012-13 68.52 394.13 1.23 32.70 33.76 53.30 0.00
2013-14 81.11 661.01 15.36 107.51 25.60 94.71 86.50
2014-15 92.78 927.55 78.37 255.00 58.91 171.92 340.17
2015-16 98.34 1,252.88 220.81 603.98 143.47 389.49 1,404.08
2016-17 107.86 1,622.10 506.73 1,629.98 333.11 976.85 2,057.27
CAGR 9.50% 32.71% 233.30% 118.54% 58.07% 78.90% 120.84% (Source:RBI, NPCI)
Table 2: Value of transaction amount in Rs. Billion
RTGS NEFT IMPS m-wallet PPI card Mobile Banking NACH
2012-13 1,026,350.05 29,022.42 4.33 10.01 49.62 59.90 0.00
2013-14 904,968.04 43,785.52 95.81 29.05 28.36 224.18 214.81
2014-15 929,332.89 59,803.83 581.87 81.84 105.35 1,035.30 1,220.88
2015-16 1,035,551.64 83,273.11 1,622.26 205.84 253.77 4,040.91 3,801.83
2016-17 1,253,652.08 120,039.68 4,111.06 532.42 277.52 13,104.76 7,916.17
CAGR 4.08% 32.84% 293.95% 121.40% 41.10% 193.76% 146.39%
(Source:RBI, NPCI)
The total Retail Digital Payments were arrivedat by adding Retail Electronic Clearing Servicescovering ECS Debit and Credit including NECS,NEFT and IMPS; Credit Card at POS, Debit Cardat POS, Prepaid Instruments and National Auto-matic Clearing House (NACH)
Calculating the total retail digital payment trans-actions for India for the last 10 years and check-ing the best trend line to fit the data well, we tryto see next 3 years transaction volumes and seewhere India is headed
The polynomial 3rd order trend line fits most ap-propriately for this data (with best R-square of0.9949)
The likely transactions for the next 3 years werepredicted/calculated using the trend line equa-tion given in the graph, India’s retail electronicpayments would probably touch about 13.613billion for the year 2017-18 and 19.316 billionin 2018-19 and 26.513 billion by 2019-20 at thisrate of growth
TRENDS IN DIGITAL TRANSACTION
Table 1: Volume of Transactions in Million
Volume IX Issue (1) March 2018 Chetana’s R.K.I.M.R. ISSN – 0976-2000

DIGITIZATION IN TRANSACTION BANKING
16
Fig 2: 5years trend in Digital Payment systems
(Source:RBI, NPCI)
Exponential growth in IMPS (Immediate Pay-ment Service) and m-Wallets both in terms ofvalue and volume is due to the fact that both arecheaper, instant payment, available 24*7 andeasily operable by smartphones
Rise in m-Wallets is also due to rise in OLA andUber cab services where people use digital wal-lets frequently and also various small merchantshave started accepting m-wallets
Also m-wallets like PayTM, Mobikwik, PayUhave been granted licenses to work as operatingUnits under Bharat Bill Payment System (BBPS)so various bills like electricity, water, land, tele-phone were paid by customers using m-wallets
National Automated Clearing House (NACH) isa centralized clearing system launched by theNational Payments Corporation of India. Its highgrowth rate is due to the fact that existing ECSmandates was to be moved to the NACH plat-form in partnership with participating banks
Growth in mobile banking is due to the fact thatin recent years almost all banks have come upwith their own mobile banking apps and are con-tinuously developing it. Also UPI (Unified Pay-ment Interface) provided by NPCI enablessmaller banks to make their own apps easily andat much lesser cost
National Electronic Fund Transfer System
Volume IX Issue (1) March 2018 Chetana’s R.K.I.M.R. ISSN – 0976-2000

17
DIGITIZATION IN TRANSACTION BANKING
(NEFT) shows a growth of 32% both in terms ofvolume and transaction
Real Time Gross Settlement System (RTGS)
volume of transactions grew by 9.5% CAGR(compounded annual growth rate) over these 5years whereas the value of transaction grew by4% for the same period
TRENDS IN CARD TRANSACTION
Fig 3: Change in transaction volume of Credit Cards as a % of total transaction at ATM & POS
(Source: RBI)
Huge bulk of Debit Card transactions are at ATMsbut that is slowly changing as people are moretending to use Debit Cards at POS terminalsrather than cash transaction. Also use of DebitCards at POS terminals are at rise
For Credit Cards use at ATMs was already lower
than at POS, but that is also declining further.Overall Card transaction at ATMs is decliningand at POS its increasing.
When comparing the volume of transactions,Debit Card grew by 9% whereas Credit Cardgrew by 21%.
Volume IX Issue (1) March 2018 Chetana’s R.K.I.M.R. ISSN – 0976-2000

DIGITIZATION IN TRANSACTION BANKING
18
The higher growth in Credit Cards is due to therecent tendency of banks to issue Credit Cardsrelying more on credit bureau scores in assess-ing the credit worthiness of credit card seekers.Also, most banks have restricted issuing cardsto their own customers, keeping them better in-formed.
Under Pradhan Mantri Jan Dhan Yojana numer-ous bank accounts were created along with DebitCards but number of active users are still doubt-ful.
From a banks point of view, serving customers atbank branch is much more expensive than at ATMs.
Fig 4: Change in transaction volume of Debit Cards as a % of total transaction at ATM & POS
(Source: RBI)
Branch service to customers cost around Rs 40-45per customer compared to Rs. 10-20 at ATMs.ATMs now provide services both financial and non-financial (passbook printing, Cheque collect, Ministatement etc.) Thanks to National Financial Switch(NFS) regulated by NCPI, ATMs of a Bank nowaccepts cards of other banks. For this NPCI re-ceives Rs.0.50 per transaction. The bank whoseATM is being used gets paid by other banks whosecards are being used for the services it gives. Thischarge is called Reverse Interchange. Banks domanage to recover this ATM service charges fromits customers in the range of Rs.10-15 for non-financial transactions and Rs. 18-20 for financialtransactions. These rates usually differ bank to bank.
Volume IX Issue (1) March 2018 Chetana’s R.K.I.M.R. ISSN – 0976-2000

19
DIGITIZATION IN TRANSACTION BANKING
ATM TRANSACTION DATA ANALYSIS
Fig 5: Quarter to Quarter growth in no. of ATMs
(Source: RBI)
(Source: RBI)
Fig 6: Quarter to Quarter average per day transactions at ATMs
Volume IX Issue (1) March 2018 Chetana’s R.K.I.M.R. ISSN – 0976-2000

DIGITIZATION IN TRANSACTION BANKING
20
RBI has mandated banks to give free monthly ATMtransactions: 5 at own bank and 3 at other banksfor metro cities and 5 at both own and other banksin all other cities. This means banks have to bearthe cost of these transactions on their own. But thisis still profitable for banks due to the fact that branchbanking is much more expensive.
Considering the cost of setting up an ATM, main-
taining and management, cash loading, rent elec-tricity etc. it comes down to around Rs. 12-18 lacs.Now for an ATM to make a breakeven it requiresaround 140-170 daily transactions. Figure 6 showsthat national average is in the range of 108-114transaction daily. This indicates Banks are makinga loss in ATMs but it is still beneficial for them ascost of serving customer at branches is still high.
Table 3: Group wise and region wise distribution of ATMs
Public Sector Banks Private Sector Banks Foreign Banks
Year Metro Urban Semi-
Urban Rural Metro Urban Semi-Urban Rural Metro Urban Semi-
Urban Rural
2013-14 25947 33843 31150 19484 19024 13594 12030 3819 909 204 20 31 2014-15 28644 36139 36481 27401 20805 14768 11698 4219 835 208 22 32 2015-16 30190 41827 40581 29714 22542 15526 12874 4639 791 216 21 31 2016-17 34340 42838 41964 29256 24598 15414 13908 4913 751 183 17 15
(Source: RBI)
From the table we can see that Public sector banksare more focused on expanding their ATM networkin rural and semi-rural areas where CAGR growthrate is around 15% and 11% respectively. Privatesector banks are more focused on Rural and Metrocities where their CAGR growth rate is around 10%each. For foreign banks there is sharp decline innumber of ATMs across all regions.
Major reasons for such changes are as follows:
RBI “1-3” rule which makes it compulsory forbanks to set up 3 ATMs in Tier- 4,5,6 cities foreach ATM set up in Tier-1&2 cities
Cost of setting up and maintaining ATMs in Semi-urban and Rural areas is less as rent is low andalso low cost models can be set up there
Also emergence of Brown Label ATMs (BLA)and White Label ATMs (WLA) has slowed down
the growth of ATMs by banks.
Banks tie up with 3rd party to set up Brown La-bel ATMs where the entire setup and maintenancecost is borne by the 3rd party organization
Brown label ATM are those where hardware andthe lease of the ATM machine is owned by a ser-vice provider, but cash management and connec-tivity to banking networks is provided by a sponsorbank whose brand is used on the ATM. While LabelATM or WLAs are owned and operated by Non-Bank entities.
POS TERMINAL TRANSACTIONANALYSIS
A point of sale (POS) system is a combination ofsoftware and hardware that allows merchants totake transactions and simplify key day-to-day busi-
Volume IX Issue (1) March 2018 Chetana’s R.K.I.M.R. ISSN – 0976-2000

21
DIGITIZATION IN TRANSACTION BANKING
ness operations. There are 3 types of POS systems:
1. Physical POS – Here the merchant has a POSmachine in his cash counter where the customerpays using any bank Debit or Credit Card.
2. Mobile POS – Here the merchant has asmartphone with the bank’s app installed and anintegrated or external card or biometric reader.
3. Virtual POS – Here the customer pays throughan E-payment gateway using a smartphone orweb browser. The payment proceeds after suc-cessful validation of card details.
Table 4: Growth in ATMs and POS over years
No. of ATMs No. of POS 2011-12 95,686.00 660,920.00 2012-13 114,014.00 854,290.00 2013-14 160,055.00 1,065,984.00 2014-15 189,279.00 1,126,735.00 2015-16 212,061.00 1,385,668.00 2016-17 222,475.00 2,529,141.00 CAGR 15.10% 25.07%
(Source: RBI)
Although transaction through POS terminals areon rise and also the growth of bank’s POS by ac-quiring merchants is much higher than growth inATMs over the last 6 years but the concentration ofPOS is limited to few top banks.
The bank whose POS terminal is set up with theMerchant to accept the payment is called ‘AcquirerBank’, the bank whose Card the customer uses tomake the payment is called ‘Issuer Bank’. For everytransaction the customer makes using his card, apart of it is taken by the merchant as ‘MerchantDiscount Rate’ (MDR). Usually this rate is passedon to the customer in form of charging products atMRP. Also at some places Merchants tend to chargeextra for card payments over cash payments.
Fig 7: Working of a Card System
Volume IX Issue (1) March 2018 Chetana’s R.K.I.M.R. ISSN – 0976-2000

DIGITIZATION IN TRANSACTION BANKING
22
Now this MDR is distributed among ’Acquirerbank’ (15-20%), ‘Issuer Bank’(60-80%) and tech-nology network provider like Visa, MasterCard etc.(4-8%). Currently for Debit Cards RBI has cappedthe MDR at 0.75% for transaction till 2000 and1% for transaction above 2000. But post demoneti-
zation till 31st March 2017 the MDR for Debit Cardtransactions on small amount was further reducedto 0.25% on transaction amount till 1000 and 0.5%on amount between 1000-2000. For Credit cardsthere is no cap on MDR.
Table 5: Bank Group wise market share in ATM, POS and Cards
(Source: RBI)
Almost 75% of these POS terminals are concen-trated to 5 major banks: SBI (20%), AXIS Bank(17%), HDFC Bank (17%), ICICI Bank (12%),Corporation Bank (9%). Smaller banks do not seeany incentives to acquire merchants to use theirPOS terminals due to the fact that distribution ofMDR is more skewed towards Issuer Bank whosecard is used in the POS terminal. Smaller banksare just issuing Debit and Credit cards to its cus-tomers and enjoying the majority share of MDRwhen these customers make payment to merchantsat POS terminal.
INDIAN POST : MONEY ORDER
Various modes of digital payments are available tocustomers but they still have a lot of scope to grow.The money order system of the Department of Postmade as many as 65million transactions in 2016-17. They have upgraded and provide 3 money or-der services electronic money order (eMO), instant
money order (iMO), and mobile money order(mMO). These services are comparable to NEFT,IMPS and mobile banking respectively. Each ofthese services provided by Indian Post is charged5-10times higher than its banking counterpart andpeople are still using these services. Key reasonsfor such scenario are: NEFT, IMPS and UPI require bank at either or
both end of the transaction. Although a lot of bankaccounts are created under PMJDY but the num-ber of active accounts are still a question. A goodnumber of adults in each village lack bank ac-counts.
Migrant workers send money to their villages butthey lack bank account and hence dependent onMoney Order.
The mobile wallet system is dependent onsmartphones and although there are billion plusmobile users, 2/3rd of the unique mobile usersare using feature phones and cannot be used for
Volume IX Issue (1) March 2018 Chetana’s R.K.I.M.R. ISSN – 0976-2000

23
DIGITIZATION IN TRANSACTION BANKING
digital transactions.
Also the mobile banking apps or wallets avail-able are either in English or in Hindi which makesthem unusable for many people who only knowlocal language.
Not all bank branches are under the electronicpayment systems. Digital payment ecosystemsis confined to large commercial banks. RegionalRural Banks and Rural Cooperative banks needto be brought under pan India electronic network.
Many state government still use money ordersystem for disbursement of social benefit pay-ments in rural areas.
Money order system meets the needs of a sec-tion that requires doorstep delivery of service.Aged parents would prefer money being deliv-ered at home by the postman who knows the ben-eficiaries well. Banks have not been able to matchthe service.
There is also no meaningful partnership betweenbanks and post offices. About 1,50,000 serviceoutlets of the postal system and 1,30,000 bankbranches operate without inter connectivity. Theideal stage would be interconnectivity of all theseoutlets.
CONCLUSION
Indian digital payment industry is showing highgrowth and is expected to touch 25 billion yearlydigital transactions in next 2.5 years. India’s goalto go cashless is possible but it still requires a lotof effort from government and people. Every yearRBI and commercial banks lose upto Rs. 21000crore in currency operations. They have to playmajor role in educating people about advantages ofgoing cashless and what are various digital modesavailable for payment and how to use them.
Use of Cards for payment are on a rise and thereis a prominent growth of customers transactingCards at POS. The growth in number of cards isalso high owing to credit rating agencies and ag-gressive marketing for Credit Cards and PMJDYfor Debit Cards. But due to less transactions atATMs, the ATM business for banks are not thatmuch profitable. Also emergence of Brown andWhite label ATMs has given banks reason to shiftfrom setting ATMs to acquiring merchants to usetheir POS terminals.
In order to encourage smaller banks to make theirown POS terminals and acquire merchants and pushtowards digital payment, RBI has to make the MDRmore equally distributed among Acquirer Bank,Issuer Bank and network provider. Only then smallerbanks will get incentive to acquire merchants bymarketing aggressively.
RECOMMENDATION
Banks prime focus on acquiring merchants to usetheir POS terminals
To expand ATM networks banks should look forsetting up Brown Label ATMs
In order to incentivize digital banking, banks cancome up with various savings account productswhere every month customer would be entitledfor limited free number of NEFT, RTGS or IMPStransactions up to certain amount
REFERENCE
1. Reserve Bank of India - https://www.rbi.org.in/
2. Database on Indian Economy - https://dbie.rbi.org.in/DBIE/dbie.rbi?site=home
3. National Payment Corporation of India - http://www.npci.org.in/
Volume IX Issue (1) March 2018 Chetana’s R.K.I.M.R. ISSN – 0976-2000

DIGITIZATION IN TRANSACTION BANKING
24
4. MDR - https://www.pressreader.com/india/busi-ness-standard/20170317/281956017597113
5. Papers of Prof. Ashish Das - http://www.math.iitb.ac.in/~ashish/paper.htm
6. Growth in Credit Cards - https://qz.com/998098/after-years-of-diffidence-among-users-credit-cards-hit-a-record-high-in-india/
7. Indian Post Money Order - http://economictimes.indiatimes.com/industry/banking/finance/for-the-whatsapp-moment-in-payments-postal-sys-tem-and-banking-system-should-be-intercon-nected/articleshow/59825002.cms
8. White Label ATMs - http://www. thehindubusinessline.com/money-and-banking/srei-infra-to-roll-out-white-label-atms-in-smaller-towns/article8975050.ece
Volume IX Issue (1) March 2018 Chetana’s R.K.I.M.R. ISSN – 0976-2000
Corporates across the world publish the Sustainability Reports / CSR Reports as perthe Global Reporting Standards. Few theme based reports are worth reading.(Compiled from Report Alerts)
1. Mondi, the international packaging and paper Group : Partnering for change
2. Scotiabank : Building the Economy of Everyone
3. The Rezidor Hotel Group, member of The Radisson Hotel Group: Buildinga new future together
4. Nestle: The Nestlé in Society – Creating Shared Value
5. Stockland was recently named the Global Leader for the Listed Diversified – Office/Retail category: Innovation Through Diversity
6. CLP, one of the largest investor-operators of power assets in the Asia-Pacific region:Making lives brighter
7. Yorkshire Building Society Group: Society Matters
8. The Electrolux Group: For the Better
9. Vaisala, a global leader in environmental and industrial measurement: Observations fora Better World – Valuable Impacts for Customers and Societies
10. The Ferrero Group: Glocal Care, Sharing values to create value

25
HYPERLOOP: AN IMPECCABLE ASSUMPTION OR A PHENOMENAL REALITYISSN – 0976-2000 Vol IX Issue (1) (2018) : pp 25 - 31
25Volume IX Issue (1) March 2018 Chetana’s R.K. Institute of Management and Research
Chetana’s
* Srisidharth Revankar
Hyperloop: An Impeccable Assumption or A Phenomenal Reality
AbstractOne who is disrupting the market today, can get disrupted tomorrow, it’s not a saying but a mere fact thateveryone is behind someone. Disruptor might create a new market or reshape the existing one. The wayhuman travels, eats, socialise, everything undergoes disruption. A classic example of disruption to the televi-sion and movie industry is ‘Netflix’, by revolutionising the world of entertainment retail, giving a convenientlow-cost approach, it threw ‘Blockbuster’ to bankruptcy. No one can ever determine how vulnerable thedisruption could be.
India has always welcomed technologies and its acceptance is unparalleled. May it be a floppy disk to a CD,then a DVD, then a Pen drive, the utility quotient has increased from 1.44mb floppy disk to a 1 TB pen drive,however the flow is not interrupted for the love of the past technology. For the matter of fact, the biggestchanges are not incremental, but disruptive, because they challenge the status quo. Hyperloop can be nextmode of transport to 7.6 billion people on this planet, which might change the definition of traveling, sciencefiction fantasy may become a reality.
* Srisidharth Revankar, MBA (Marketing) from Mumbai University
INCEPTION OF HYPERLOOP
Before the concept of hyperloop coming into thepicture, Shanghai Maglev train was the fastest inthe world, with a top operating speed of 430km/h(270 mph) by covering 30 km in 8 minutes [1].Shanghai Maglev train uses the concept of mag-netic levitation (works on Electrodynamic suspen-sion), here superconductors are used to levitateabove the rail and hence there is no contact of railsand the train.
The concept of Hyperloop was first publicly men-tioned by Elon Musk, an American Entrepreneur,CEO & founder of Tesla motors & SpaceX in 2012.On August 2013, The Hyperloop Alpha conceptwas first publicly proposed by Elon Musk. The 57pages document consisted the technology, designs& specifications, estimated cost & a well draftedoperational route from Los Angeles to San Fran-cisco. The proposed route was of 360 miles (530km), which would be covered in 35 minutes, withan estimated average speed of 600 mph (970 km/


HYPERLOOP: AN IMPECCABLE ASSUMPTION OR A PHENOMENAL REALITY
30 Volume IX Issue (1) March 2018 Chetana’s R.K.I.M.R. ISSN – 0976-2000
erations on these questions and share their viewsin open forums.
REFERENCES
1. https://shanghaichina.ca/video/maglevtrain.html
2. http://www.spacex.com/sites/spacex/files/hyperloop_alpha.pdf
3. https://www.alignproductionsystems.com/case_study/hyperloop/
4. http://www.spacex.com/sites/spacex/files/2018_hyperloop_competition_rules.pdf
5. https://arstechnica.com/information-technology/2016/05/hyperloop-company-exclusively-li-censed-passive-magnetic-levitation-system/
6. http://www.telegraph.co.uk/technology/2017/07/12/high-speed-hyperloop-completes-first-test-run/
7. https://economictimes.indiatimes.com/small-biz/security-tech/technology/why-hyperloops-bibop-gresta-wants-to-put-a-stop-to-high-speed-rail-w a y - s y s t e m s / a r t i c l e s h o w /57159700.cms?utm_source=contentofinterest&utm_medium=text&utm_campaign=cppst
8. http://www.nasdaq.com/article/5-fastest-grow-ing-economies-in-the-world-cm773771
9. http://www.imf.org/external/pubs/ft/weo/2017/02/weodata/weorept.aspx?pr.x=32&pr.y=7&sy= 2 0 1 6 & e y = 2 0 1 8 & s c s m = 1 & s s d = 1 &sort=country&ds=.&br=1&c=534&s=NGDPD%2CPPPGDP%2CNGDPDPC%2CPPPPC&grp=0&a=
10. http://www.imf.org/external/datamapper/NGDP_RPCH@WEO/OEMDC/ADVEC/
WEOWORLDl
11. http://www.pewresearch.org/fact-tank/2014/07/11/half-the-worlds-population-live-in-just-6-countries/
12. https://erail.in/blog/countries-with-largest-rail-way-networks-in-world/50
13. http://edition.cnn.com/2016/11/22/asia/india-railway-system/index.html
14. http://www.worldometers.info/world-popula-tion/population-by-country/
15. http://www.nhai.org/roadnetwork.htm
16. https://www.indiatimes.com/news/india/fuel-worth-rs-60-000-crore-wasted-annually-due-to-heavy-traffic-congestion-in-delhi-270915.html
17. https://timesofindia.indiatimes.com/city/pune/pune-mumbai-hyperloop-route-most-feasible-study/articleshow/62421090.cms
18. https://hyperloop-one.com/virgin-hyperloop-one-signs-mou-india-government-maharashtra-conduct-its-preliminary-study
19. https://www.prnewswire.com/news-releases/hyperloop-transportation-technologies-to-launch-indias-first-hyperloop-300514708.html
20. https://economictimes.indiatimes.com/industry/transportation/railways/htt-to-build-indias-first-hyperloop-connecting-amaravati-vijayawada/articleshow/60395268.cms
21. https://hyperloop-one.com/virgin-hyperloop-one-signs-mou-india-government-karnataka-conduct-its-preliminary-study
22. https://timesofindia.indiatimes.com/city/pune/pune-mumbai-hyperloop-route-most-feasible-
31
HYPERLOOP: AN IMPECCABLE ASSUMPTION OR A PHENOMENAL REALITY
Volume IX Issue (1) March 2018 Chetana’s R.K.I.M.R. ISSN – 0976-2000
study/articleshow/62421090.cms
23. https://hyperloop-one.com/virgin-hyperloop-one-signs-mou-india-government-maharashtra-conduct-its-preliminary-study
24. https://www.cogoport.com/articles/major-indian-sea-ports
25. http://bwdisrupt.businessworld.in/article/-The-Indian-Transportation-Market-is-Expected-to-be-Worth-300B-by-2020-Raghav-Himatsingka-Founder-CEO-Truckola/13-03-2017-114309/
26. http://www.hindustantimes.com/tech/hyperloop-transportation-technologies-with-cheaper-effi-cient-model-eyes- indian-market /s tory-Sn4Tip5tOBVQ2MUP3eOebM.html
27. https://qz.com/854268/elon-musks-hyperloop-wants-to-solve-indias-railway-problem/
28. http://www.thehindubusinessline.com/economy/policy/india-makes-it-to-top-100in-ease-of-do-ing-business/article9935450.ece
29. http://www.doingbusiness.org/rankings
BOOKS TO READ
1. Kranti Nation: India and the Fourth Industrial Revolution by Pranjal Sharma
2. The Fourth Industrial Revolution by Klaus Schwab
3. Emerging Indian Multinationals: Strategic Players in a Multipolar World edited byMohan Thite, Adrian Wilkinson and Pawan Budhwar
4. The Unusual Billionaires by Saurabh Mukerjea
5. Rise Like a Phoenix- Scripting Corporate Turnarounds by Pradip Chandra
6. Grass Roots Innovation by Anil K. Gupta
7. The Target by Shantanu Guha Roy
8. Unlock the Real power of Ideation by R. Sridhar
9. Boom Country? The New Wave of Indian Enterprise by Alan Rosling

ANALYSIS OF INFRASTRUCTURE REPORT
32
* Barkha Thakkar** Archit Padwe and Nitin Singh
* Barkha Thakkar, ** Archit Padwe and Nitin Singh, Students MMS Batch 2016-18, CRKIMR
ISSN – 0976-2000 Vol IX Issue (1) (2018) : pp 32 - 43Chetana’s
Volume IX Issue (1) March 2018 Chetana’s R.K. Institute of Management and Research
Analysis of Infrastructure Report
AbstractInfrastructure sectors such as roadways, ports, railways, airways, water transportation provides us with theservices that are essential for industrialized societies. A strong and well developed infrastructure forms thebackbone of all the developed and healthy economies and also it remains to be a key driver for India economy.In this report we are going to focus on some insights of the sector and mainly going to discuss about theupcoming plans strategies undertaken to clear out any hindrances which are slowing down the growth andalso any new investments which are possibly going to undertake. This report will also consist about differentPublic Private Partnership undertaken by Government of India who is also making lot of efforts to achieve allround social, economic, political cultural and national development for its people
1 INTRODUCTION
The Infrastructure Sector in India was after inde-pendence completely in the hands of the publicsector and this hampered the growth of this sector.India’s less spending on real estate, power, tele-communications, construction, and transportationprevented the country from sustaining very highrates of growth.
Mr Nitin Gadkari, Minister of Road Transport andHighways, and Shipping, has announced thegovernment’s target of Rs 25 trillion (US$ 376.53
billion) investment in infrastructure over a periodof three years, which will include Rs 8 trillion (US$120.49 billion) for developing 27 industrial clus-ters and an additional Rs 5 trillion (US$ 75.30billion) for road, railway and port connectivityprojects.
Infrastructure sector includes power, bridges, dams,roads and urban infrastructure development. InAugust 2016, India jumped 19 places in WorldBank’s Logistics Performance Index (LPI) 2016, torank 35th amongst 160 countries.

33
ANALYSIS OF INFRASTRUCTURE REPORT
Volume IX Issue (1) March 2018 Chetana’s R.K.I.M.R. ISSN – 0976-2000
After FDIInfrastructure Sector Growth Rate in India GDPhas increased at the rate of 9%.
Market SizeIndia needs Rs 31 trillion (US$ 454.83 billion) tobe spent on infrastructure development over thenext five years, with 70 per cent of funds neededfor power, roads and urban infrastructure segments.
The Indian power sector itself has an investmentpotential of US$ 250 billion in the next 4-5 years,providing immense opportunities in power genera-tion, distribution, transmission and equipment, ac-cording to Mr Piyush Goyal, Union minister ofcoal, power and renewable energy.
Foreign Direct Investment (FDI) received in con-struction development sector from April 2000 toMarch 2016 stood at US$ 24.19 billion, accordingto the Department of Industrial Policy and Promo-tion (DIPP).
GOVERNMENT INITIATIVE ANDINVESTMENT
Infrastructure Budget Allocations
Provision has been made of Rs 241,387 crore(US$ 35.7 billion) in 2017-18 for transportationsector as a whole, including, rail, roads andshipping.
For 2017-18, the total capital and developmentexpenditure of Railways has been pegged at Rs1, 31,000 crore (US$ 19.4 billion). This includesRs 55,000 crore (US$ 8.1 billion) provided bythe Government.
Railway lines of 3,500 kms will be commissionedin 2017-18.
It is proposed to feed about 7,000 stations withsolar power in the medium term.
In the road sector, Budget allocation for high-ways increased from Rs 57,976 crore in BE2016-17 to Rs 64,900 crore (US$ 9.6 billion) in2017-18.
The contribution of the Infrastructure Sector in theIndia GDP.
Before FDI-Infrastructure Sector Growth Rate inIndia GDP came to 3.5% in 1996- 1997 and thenext year, this figure was 4.6%.
Source: IBEF

ANALYSIS OF INFRASTRUCTURE REPORT
34 Volume IX Issue (1) March 2018 Chetana’s R.K.I.M.R. ISSN – 0976-2000
Total length of roads, including those underPMGSY, built from 2014-15 till the current yearis about 1,40,000 kms which is significantlyhigher than previous three years.
Second phase of Solar Park development to betaken up for additional 20,000 MW capacities.
The Union Cabinet has approved several reformssuch as allowing National Highways Authorityof India (NHAI) to extend the concession periodfor current incomplete projects in build-operate-transfer (BOT) mode.
Government of India plans to launch the NationalInfrastructure Investment Fund (NIFF) with aninitial corpus of at least Rs 40,000 crore (US$5.87 billion)
2. INFRASTRUCTURE SECTOR
2.1 Airline Infrastructure
2.1.1 Revenue Model
A) Aeronautical revenuesAirports levy user charges on airlines for the facili-ties they use. In India, user charges are regulatedby the Ministry of Civil Aviation and AAI. Withthe establishment of the Airport Economic Regula-tory Authority (AERA), the new airport regulatornow decides on airport charges to be fixed foreach airport, depending on the revenue model,passenger traffic, quality of service and investmentrequirements at the airport.
Landing and airport tariff structures are regularlyreported to the International Civil Aviation Organi-zation (ICAO). These include all charges and feesrelated to air transport operations. The various usercharges levied by airports are:
User Development Fee (UDF) - Levied on pas-sengers by airport operators to provide and main-tain infrastructure services. UDF is charged toensure fair return to the airport developers on theinvestments made and for improving the viabil-ity of the airport’s operations.
Development Fee (DF) - Charged by the airportat a rate prescribed by the Central governmenton embarking passengers. It is used for variouspurposes such as financing the cost of up grada-tion, expansion or development of the airport.
Other charges: Landing, parking, security andhangar charges for aircraft
Passenger and cargo fees: Passenger service feeis charged by the airlines and passed on to therespective airport.
B) Non-aeronautical revenuesNon-aeronautical revenues come from activitiesother than the core business of an airport. Theseinclude retailing, rentals, parking and conces-sions on food and beverages, etc. At most suc-cessful global airports, non-aeronautical revenuesform more than 50 per cent of total revenuesand have been growing much faster than aero-nautical revenues, leading to superior operatingprofit margins for airport developers.
2.1.2 Current Scenario-Currently, five international airports have beencompleted successfully under PPP mode. Four ex-isting airports and two Greenfield projects will beoffered on PPP basis which is expected to attractinvestments from private players.
Delhi International Airport, a GMR led consortium,signed a land license agreement with Airbus to setup India’s 1st full flight simulator at the Aero city,Indira Gandhi International (IGI) Airport.

35
ANALYSIS OF INFRASTRUCTURE REPORT
Volume IX Issue (1) March 2018 Chetana’s R.K.I.M.R. ISSN – 0976-2000
2.1.3 FDI
The GOI has allowed 100 per cent FDI underautomatic route for Greenfield projects, whereas,74 per cent FDI is allowed under automatic routefor brownfield projects.
100 per cent FDI is allowed under automatic routein scheduled air transport service, regional airtransport service and domestic scheduled passen-ger airline. FDI over 49 per cent would requiregovernment approval.
Approval of 49 per cent FDI in aviation for for-eign carriers
2.1.4 Players-Until 2013, AAI was the only major player involvedin developing and upgrading airports in India. Postliberalization, private sector participation in thesector has been increasing.
Private sector investment increased to US$9.3 bil-lion during the 12th Five Year Plan from US$ 5.5billion in the previous plan.
GMR- Development of Hyderabad InternationalAirport; modernization of Delhi InternationalAirport
GVK- Modernization of Mumbai InternationalAirport
SIEMENS- Development of Bengaluru Interna-tional Airport
L & T- Development of Bengaluru InternationalAirport
Unique Development of Bengaluru InternationalAirport
Maytas Development of Simoga and Gulbargaairports in Karnataka
2.2 Railway Sector
As of March 2016, IR has a total route network of
about 66,030 kilometers spread across 8,500 sta-tions. It operates more than 22,300 trains daily. Ithas 2.45 lakh wagons, 63,045 coaches and 10,773locomotives. India’s railway network is recognizedas one of the largest railway systems in the worldunder single management.
The Government of India has focused on investingon railway infrastructure by making investor-friendly policies. It has moved quickly to enableForeign Direct Investment (FDI) in railways toimprove infrastructure for freight and high-speedtrains. At present, several domestic and foreigncompanies are also looking to invest in Indian railprojects.
Private sector companies are being encouraged toparticipate in rail projects, which were largely inthe public domain. The Cabinet approved ‘partici-pative models for rail connectivity and capacityaugmented projects’, which allows private owner-ship of some railway lines.
2.2.1 Revenue Model-
Two Major Segments:
A) PASSENGER:
As on FY16, over 13,000 passenger trains are inoperation.
Over 23 million passengers travel by trains dailyin India. The passenger traffic stood at 8151 mil-lion in FY16.
B) FREIGHT:
Around 1,107 million tonnes of freight was trans-ported via trains in FY16 and 2,165 milliontonnes is expected in FY20

ANALYSIS OF INFRASTRUCTURE REPORT
36 Volume IX Issue (1) March 2018 Chetana’s R.K.I.M.R. ISSN – 0976-2000
These include a huge variety of goods such asmineral ores, Iron and steel, fertilizers, petro-chemicals and agricultural produce.
REVENUE BREAKUP SEGMENT
STRONG REVENUE GROWTH FORINDIAN RAILWAYS
Revenue growth has been strong over the years;during FY07–16, revenues increased at a CAGRof 6.4 per cent to USD25.2 billion in FY16
Revenues from the sector are estimated to reachto USD44.5 billion by the end of FY20
Revenues would expand at a CAGR of 9.07 percent during FY07–20E
Indian Railway sector aims to boost passengerAmenities.
Indian Railways generated USD16.9 billion in
earnings from commodity freight traffic duringFY16
Increasing carrying capacity, cost effectiveness,improving quality of service will support the in-crement in the share of Railway in the freightmovement from 35 per cent to 50 per cent by2020
2.2.2 Key Players Supporting Indian Railways
Some Private Players in the Sector:Railway projects in India have typically been inthe public sector domain.
Private players were involved in allied activitiessuch as track laying and maintenance, maintenanceof coaches and wagons, construction of bridges,stations, signaling and telecommunications works.Punj Lloyd-
Construction of eight metro stations in Bengaluru
Construction of two elevated Metro stations atMG Road and Trinity Circle in Reach-1 (inau-gurated in September 2011)
Construction of elevated stations at Mysore RoadTerminal, Deepanjali Nagar and Magadi Roadin Reach – 2 (Completion by December 2014)
Kalindee
Gauge conversion of VilluPuram-Mayiladuthuraisection
Installation and commissioning of signaling andtelecommunications facilities at NTPC
Design, Manufacture, Supply, Installing, Testingand Commissioning of Automatic Fare collec-tion system for Bangalore Metro Rail Corpora-tion Ltd
Source : Crisil Research

37
ANALYSIS OF INFRASTRUCTURE REPORT
Volume IX Issue (1) March 2018 Chetana’s R.K.I.M.R. ISSN – 0976-2000
2.3 Road Sector
2.3.1 Revenue ModelBOT: Build–operate–transfer (BOT) or build–own–operate–transfer (BOOT) is a form of project fi-nancing, wherein a private entity receives a con-cession from the private or public sector to finance,design, construct, own, and operate a facility statedin the concession contract
EPC: Under an EPC contract, the government fundsthe construction and the road developer only has todevelop the project in a stipulated period of time.All the necessary clearance are regarding environ-ment and land use are provided by the governmentthe company has to develop and operate the project.Fixed Margin of Profit.- The EPC mode takes threeto four months for a project to be awarded, whileBOT contracts take 18-20 months, which NHAIthinks is another major advantage.
HAM: It’s a combination of BOT and EPC model.Promoters Equity is 10- 15% remaining is borrowedby the company. Major players: Sadbhav Engineer-ing Ltd.
2.3.2 Current ScenarioSecond Largest Road Network: India had the 2ndlargest road network in the world, spanning overa total of 5.23 million kilometers.
Over 65 per cent of all goods in the country aretransported through roads, while, 85.9 per cent ofthe total passenger traffic uses road network tocommute.
Rising budget allocation of road sector: DuringFY17-18, Government of India allocated USD 9.51billion for development of national highways acrossthe country.
About 75 to 80 % of the total cost of the project iscan be borrowed by the company.As per findingsof Crisil 5% increase in traffic was reported duringyear 2016 and the same scenario is expected tocontinue this fiscal year as well.
As per findings of Crisil Average growth rate innumber of vehicle registered is 10.4%.
2.3.3 Major players:IRB infrastructure, HCC, Ashoka Buildcon Lim-ited, GMR
2.3.4 FDIKey Authority for road development in IndiaNational highway authority of India (NHAI)
Statutory body under ministry of road transportand highways
It’s responsible for National highways’ develop-ment, maintenance and management
Three main projectso National Highway Developmental Project
(NHDP)o Golden quadrilateralo North-South + East-West corridors
KEY positive points for road sectorAttractive opportunities:Roads and bridge infrastructure industry to be worth

ANALYSIS OF INFRASTRUCTURE REPORT
38 Volume IX Issue (1) March 2018 Chetana’s R.K.I.M.R. ISSN – 0976-2000
USD19.2 billion by FY17 .The Central Govern-ment has fast tracked at least 24 roads and high-ways projects .Government is planning to offer abonus of 10 per cent of the total project cost tofirms that construct & deliver highway projectsbefore deadline.
Increasing Infrastructure development ofNational highwaysThe size of national highway is expected to reachto 100000 kilometres by the end of FY17 from97135 kilometres as on FY15
NHAI has planned to award projects covering 5,300kilometres – 2800 kilometres under Engineering,Procurement, and Construction (EPC) mode, 1,000under Build–operate– transfer (BOT) mode & 1500kilometres under hybrid mode in FY16
Major FII investment In this area are from Canada,Middle East & the US.
Cumulative FDI inflows into the construction de-velopment sector, including roads and highways,has increased at a CAGR of 17.04 per centfromUSD8.06 billion in FY10 to USD24.25 billionby FY17 .
Major Domestic Investment:To finance various projects during FY17, NHAIplans to raise USD 2.99 billion through Employ-ees’ Provident Fund Organization (EPFO), USD1.27 billion through Life Insurance Corporation(LIC);Commercial banks. USD 746.82 million eachthrough Masala Bonds and 54-EC bonds and USD2.46 billion from the market.
3. STATISTICAL DATA ANALYSIS
3.1 Beta analysisBeta analysis gives information about how muchsuch stock is going to move up or down when themarket moves. Beta is the slope of line of regres-
Source: NSE; Chetana Research

39
ANALYSIS OF INFRASTRUCTURE REPORT
sion plotted by stock return against market returnit most widely used CAPM model. Beta can benegative or positive. Negative Beta means stocksmoves downward when the market moves upwardor vice a versa. Positive beta means both stockand the market moves in the same direction that isif the stock goes up so does the market, positivebeta could be between 0 and 1,1,beta>1 .A betavalue of 1.3 would indicate that stock moves up by1.3 times when market moves by 1. Beta value ofgreater than 1 is generally for high risk high returnkind of stock. Beta value of 0.8 to 1 indicatesmoderate risk moderate return kind of stock andpositive beta value of less than 0.8 gives low risklow return.
Time period under consideration Jan 17 to March17.
Benchmark: Nifty 50
High risk high returns stocks
Company Beta Annualized Standard Deviation
IRB Infrastructure 1.784 28 GMR 1.42 37 Simplex 1.85 37 Ashok buildcon 1.441 31 Reliance Infrastructure
1.6 27
Conclusion from Beta Analysis:The most risky as well as the most return givingstock is simplex infrastructure since it has the high-est beta of 1.85 and highest annualized standarddeviation of 37 percent.
The least risky stock in the above case is relianceinfrastructure with annualized standard deviationof 27 percent and beta of 1.6
3.2 Analysis & Conclusion of order book valuewith respect to revenue
Order book is calculated as the total contract value(as per the terms of the contract/attendant docu-ments) of all existing contracts as of such date,minus any revenue already recognized by the Com-pany in relation to such existing contracts up toand including such date (PMC Order Book). In ourindustry, the order book is considered to be one ofthe indicators of future performance as it repre-sents a significant portion of anticipated futurerevenue.
Further in this report regression analysis is donewhere revenue is dependent variable and order bookis independent. Relationship established is analyzedon the basis of positive and negative relation. Asorder book is number of orders received at a par-ticular time and it estimates the future revenue tobe received it acts like performance parameter andefficiency of company
NCCNCC is among the top 3 construction companies inIndia in terms of revenues. Its presence is acrossbuildings & housing, transportation, water & envi-ronment, irrigation, electrical, metals, mining, powerand railways. Well diversified operations having afoothold in every segment of construction sector.Revenue analysis conducted using regression saysthat if 1000 rs of order book value is received rev-enue will be decreased by 2%. Here negative rela-tionship was observed which says that company isnot performing well to achieve its targets.
NBCCNBCC is India’s largest central public sector enter-prise in construction sector under ministry of urbandevelopment, government of India. Debt free com-pany with negative working capital. PMC contrib-
Volume IX Issue (1) March 2018 Chetana’s R.K.I.M.R. ISSN – 0976-2000

ANALYSIS OF INFRASTRUCTURE REPORT
40
utes about 70% of its annual revenue. Areas cov-ered under PMC include Roads, Hospitals/MedicalColleges, Institutions, Offices, Airports, Bridges,and Industrial & Environmental Structures etc. TheReal estate development division focuses on resi-dential and commercial complexes.
Revenue analysis conducted using regression saysthat if 1000 rs of order book value is received rev-enue will be increased by 3.9% i.e. 136 cr. Posi-tive relation as more order book value is receivedmore revenue is to be expected in future.
Sadbhav InfraRevenue analysis conducted using regression saysthat if 1000 rs of order book value is received rev-enue will be increased by 15% i.e. 182 cr. It canbe observed that with increase of 1000 rs of orderbook Sadbhav infra is highest beneficiary amongstall as revenue will be increased by 15%, so it canbe said that company has not received much ordersas compare to others in the report.
L&T Infrastructure Development Projects Lim-itedL&T Infrastructure Development Projects Limited(L&T IDPL) is a pioneer of the Public-Private-Partnership (PPP) model of development in India,which involves the development of infrastructureprojects by private sector players in partnership withthe Central and State Governments Revenue analy-sis conducted using regression says that if 1000 rsof order book value is received revenue will beincreased by 2.14% i.e. 264 cr.
3.3 Ratio AnalysisIRB Infrastructure: Ebitda margin of the com-pany declined due to rise in operating expenses.Currently Ebitda stands at 17% in 2017 for thecompany. Net profit margin of the company also
declined due to rise in tax expense. Return on Equityis 8% which is far below the average returns fromstock market. Return on Capital Employed alsodeclined severely which may indicate improper uti-lization of debt taken by the company. Interest cov-erage ratio is 1.96 which may be a concern for therepayments of the loans taken from the banks. Alsoreceivable days of the company declined from 22in the year 2013 to 1 this year which may indicatesthat company is able to recover money easily with-out much delay.
NCC: Ebitda margin of the company remains stableat 10% which indicates that operating expenses ofthe company are well managed so that marginsremain intact. Net Profit margin of the companyimproved marginally and is at 3% this is due toreduction in interest expense. Return on Equity alsoimproved marginally and is at 7% on account ofimprovements in PAT which is good for sharehold-ers point of view. Return on Capital Employed re-mained approximately at 20 percent which againindicates that the company is able to keep its costunder control and generate good returns for share-holder as well as for the stakeholders of the com-pany. A steady decline in debt equity ratio is seenover the period which indicates the company ispaying its debt. Inventory turnover has increased to5.16 from 4.99 which again is a good indicationfor the company since cost of carrying the inven-tory is reduced. Receivable turnover ratio declinedto 2.23 from 5.95 which indicates is not able tomanage short term credits given properly.
GMR infrastructure: A sharp rise is seen in theEbitda of the company which stands at 339% thisyear. The revenue declined by the factor of 10 inthe last five years again which is not a very goodindicator which led to rise in Ebitda. Due very largeexceptional cost PAT is negative and net profit
Volume IX Issue (1) March 2018 Chetana’s R.K.I.M.R. ISSN – 0976-2000

41
ANALYSIS OF INFRASTRUCTURE REPORT
margin is at -853% again which indicated the com-pany is some sort of legal battle which led to risein exceptional cost. Return on Equity is negativeand is at -16% which is not good for shareholderspoint of view. Return on Capital Employed is at4% which again is not a very handsome numberand indicates that the company is not able to utilizecapital properly. Inventory turnover also declinedwhich indicates additional cost of carrying the in-ventory. Interest coverage ratio for the company is1.14 again this number indicates trouble becausethe company is just managing to pay interest ofdebts taken.
NBCC: Revenue of the company increased overlast five years however the Ebitda margin declinedslightly over this period of time which indicatescompany is able to make sustained profit over thisperiod. Ebitda stands at 8.3% in 2017 and EBITmargin is at 8.2%.Return on Equity is 20.7 whichgood compared to other companies in the sector.Return on Capital Employed is at 30.5 percentwhich is really good and indicates the company isutilizing capital efficiently and prudently. The com-pany has an Interest Coverage Ratio of 12 whichindicates the company is in a very good positionand can pay off its interest on Debts without veryeasily. Payable turnover ratio declined over last fiveyears which indicates that company is utilizingcredit offered very effectively. Debt equity ratio ofthe company is nearly 0 which indicates that thecompany has very little long term debts.
Sadbhav Engineering: The company revenue in-creased by 33% in the last five years and EbitaMargin of the Company also improved slightly andis at 13.1% which indicates that company was ableto keep its operational expenses under control.NetProfit of the company declined in the last five yearsthe reason for this sharp rise in finance cost and
also depreciation and amortization expenses.Netprofit in 2016 stands at 4.2%.Return on equity alsoincreased slightly in 2016 and is at 9% this is duerise in net profit compared to last year. Return onCapital Employed stands at 17% in 2016 and hasimproved in the last for years and indicates thecompany is utilizing its capital very efficiently andprudently. Interest Coverage ratio stands at 2.1 in2016 which again may be a concern since the com-pany interest on debt paying capacity is not look-ing so attractive. Inventory turnover has improvedin the last four years which indicates the companyis churning its inventory more and cost of holdinginventory has gone down. Inventory turnover in2016 is 22.63.The current ratio of the company isnearly 1 which indicates the company practicallyoperates at zero working capital.
L&T: Ebitda of the company declined in the lastfour years this due to increase in revenue in thesame period. Ebitda stands at 12.95% in the year2017 which better compared to most of the infra-structure company. Although Net Profit Margin ofthe company remained between 8 to 9 percent inthe last five years Return Equity Declined in thelast five years and this year it is at 11.85%.Themain reason for decline in equity is rise in reservesand surplus that is accumulated profit of the com-pany. Return on Capital Employed is at 76% in theyear 2017 which better than most of the other com-pany and also it indicates that company utilizescapital in much better way compared to other com-pany in the same business. Interest Coverage of thecompany is at 5.45 in the year 2017 which againindicates that the company ability to pay debts isgood. Current ratio of the company is 1.45 in theyear 2017 which indicates that the company work-ing capital is positive and uses comparatively littleworking capital as compared to other company inthe same business also it is able to fund its day to
Volume IX Issue (1) March 2018 Chetana’s R.K.I.M.R. ISSN – 0976-2000

ANALYSIS OF INFRASTRUCTURE REPORT
42
today capital requirements easily.
BEML: Over last five years Ebitda of the com-pany deviated from 2 to 6 percent which is due toinconsistent growth in railways and mining sector.Ebitda of the company in the year 2016 was 5.7percent. Return on Equity of the company improvedslightly and is it at 2.5 percent this due to slightrise in net profit of the company in the last 4 years.Return on Capital Employed also improved slightlyand is at 4.6 percent this year. An improvement inReturn on Capital Employed indicates that the com-pany is able to utilize its capital and generate moreper unit investment. Debt Equity ratio of the com-pany declined marginally compared to last yearshareholder’s equity remained constant over the lasttwo years which gives an indication that the com-pany has started to pay of its debt. A significantrise is seen in the Interest Coverage Ratio of thecompany it almost doubled compared to last year.Interest Coverage ratio in the year 2016 is 2.33 andrising interest coverage ratio indicates that the com-pany is in better position to pay of its interest aswell as debs however an Interest Coverage Ratioof 2 indicates that the company has to still remaincautious. Inventory turnover ratio improved overthe last five years and indicates inventory carryingcost has declined since company is able to manageits inventory well.
4. CONCLUSION
In the above report, study of some sub sectors ofinfrastructure is done.
Further statistical analysis of few companies wasdone with the help of beta analysis of stock, analy-sis of order book with revenue and ratio analysis.Therefore, it can be concluded that:
Under Beta Analysis-The most risky as well as the most return givingstock is simplex infrastructure since it has the high-est beta of 1.85 and highest annualized standarddeviation of 37 percent . The least risky stock inthe above case is reliance infrastructure with annu-alized standard deviation of 27 percent and beta of1.6
Under order with revenue-Relation between order book and revenue is con-sidered and analysis is done. NCC infra has nega-tive relation it signifies poor performance of thecompany. Nbcc, Sadbhav Infra and L&T Infra havepositive relationship which depicts success rate ofcompanies. Sadbhav infra. Sadbhav infra is highestbeneficiary amongst all as revenue will be increasedby 15%, so it can be said that company has notreceived much orders as compare to others in thereport.
Under Ratio analysis-Return on equity is highest for NBCC which isattractive from investment point of view; it goesnegative for GMR which means it is running inlosses. EBITDA margin is highest for GMR whichindicates high borrowing and less interest coverageof firm. L&T Infra and IRB are considered as goodcompanies which balances its debt as per theirinterest coverage capacity. NBCC has no debt capi-tal structure which makes it highest in terms ofinterest coverage ratio. Receivable days show effi-ciency of company to recover its funds from themarket and resemble the efficiency of company.With this IRB is the most efficient company amongothers and GMR is the least efficient.
Volume IX Issue (1) March 2018 Chetana’s R.K.I.M.R. ISSN – 0976-2000

43
ANALYSIS OF INFRASTRUCTURE REPORT
5. ANNEXURESOperational & Financial Ratios NBCC NCC GMR BEML IRB Sadbhav L & T Diluted EPS (Rs) 5.15 4.06 -2.68 12.57 5.78 7.79 58.49 Diluted BV PS (Rs) 5.65 15.61 503.43 2.92837 1.7199 47.6
Profitability Ratios EBITDA Margin (%) 8.3% 10% 339% 5.7% 17% 13.1% 12.95%
EBIT Margin (%) 8.2% 8% 330% 3.9% 17% 10.4% 11.08%
Net Profit Margin (%) 5.4% 3% -853% 1.8% 6% 4.2% 8.4%
Performance Ratios Return on Equity (%) 21% 7% -16% 2.5% 8% 9% 11.85% Return on Capital Employed (%) 31% 19% 4% 4.6% 14% 17% 76%
Efficiency Ratios
Inventory Days 90 70.7 17.9 209.41 - 16.13 9.93 Receivable Days 127 163.8 255.7 149.14 1.002201 114.65 112.17 Payable Days 114 132.8 218.1 50.39 103.8299 42.48 135.33
Infrastructure Sector Ratio Interest Coverage Ratio 13.0 1.5 1.1 2.3 2.6 1.0 5.2 Profit Margin (EBITDA) 8.16 49.43% 75.49% 41.79% 10.49% 18.58% 20.81% Payout Ratio 38.86 9.88 0.00 15.73 43.26 - 26.93 Valuation Of company with reference to debt 21.35 6.23 20.16 28.51 15.48 59.57 14.44 Debt to Equity Ratio 0 0.53 0.58 0.24 1.23 0.72 0.30
Financial Stability Ratios Total Debt/Equity (x) - 0.4 0.6 0.24 1.229025 0.72 0.206 Current Ratio (x) 1.34 1.3 1.8 2.52 0.788579 1.14 1.45 Quick Ratio (x) 0.98 1.0 1.8 1.24 0.788579 1.05 1.409
Turnover ratios Inventory Turnover Ratio 4.0 5.16 20.39 1.74 0.00 22.63 36.8 Receivables Turnover Ratio 2.8 2.23 1.43 2.45 364.20 3.18 3.25 Payables Turnover Ratio 3.1 2.75 1.67 7.24 3.52 8.59 2.7
6. REFERENCES
1. https://ceai.org.in/industrynews/industry-news/infrastructure-sector-in-india-report/
2. https://www.crisilresearch.com/CuttingEdge/indianInfrastructure.jspx?serviceId=918
3. https://www.ibef.org/download/Infrastructure-
Sector-040213.pdf4. http://www.mcrhrdi.gov.in/Group12012/
introductiontoppp.pdf5. https://transformingindia.mygov.in/category/in-
frastructure/civil-aviation/6. https://www.pwc.in/assets/pdfs/infrastructure-in-
india.pdf
Volume IX Issue (1) March 2018 Chetana’s R.K.I.M.R. ISSN – 0976-2000
COMPREHENSIVE MARKETING PLAN OF MAPRO FOODS PVT. LTD.
44
* Pritesh Choudhari
* Pritesh Choudhari. PGDM-(Marketing) CIMR, Batch 2016-18
ISSN – 0976-2000 Vol IX Issue (1) (2018) : pp 44 - 48Chetana’s
Volume IX Issue (1) March 2018 Chetana’s R.K. Institute of Management and Research
Comprehensive Marketing Plan of Mapro Foods Pvt. Ltd.
AbstractThis report is all about to show a Marketing plan for Mapro products; the report shows the plan that howMapro can offer its products in the market. With respect to this the report contains comprehensive marketingplan components including company analysis, push & pull strategy and B2B sales; the report shows theMapro objectives and marketing strategies in terms of its 4ps. This report shows how Mapro foods do B2Bsales with the help of traditional sales modal, direst sales model and sales representative approach and thestrategy used for B2C sales.
Keywords: B2B, B2C, Push & Pull strategy, 4Ps, Traditional sales model, Direct sales model, Sales repre-sentative approach
INTRODUCTION
Founded in 1959, the Company had its humblebeginnings in the hill-town of Panchgani, nearMahabaleswar, when a businessman named KishoreVora a pharmacist by profession, decided to makesome strawberry jam. He then went on to developinnovative products such as jelly sweets, fruit cubeswith fruit juice and rose syrups with rose petals –all for the first time in country. Today, his ‘hobby’has borne fruit in the shape of Mapro, one of themost modern, hygienic, quality-focussed fruit prod-uct manufacturing units in India. His vision hasbeen taken forward, thereby transforming the re-gion around Mahabaleshwar and Panchgani, the
erstwhile sleepy hill stations of Maharashtra, into aflourishing fruit processing zone. The company hasshown organic growth over the last five decadesrepresenting sound financials with sustained prof-itability. Set up as a Family business over 55 yearsago, it has earned a name for quality and consis-tency. Mapro products enjoy Premium Status in theIndian market. The Manufacturing facilities areCertified ISO 9001:2000 and HACCP by BvQi.The Company has expanded capacity to now pro-duce 30000MT of processed frozen foods p.a. It issetting up a Frozen and Fresh Food DistributionChain in Indian Metros to service the fast growingmodern Organized Retail Supermarkets being setup in India.

45
COMPREHENSIVE MARKETING PLAN OF MAPRO FOODS PVT. LTD.
Volume IX Issue (1) March 2018 Chetana’s R.K.I.M.R. ISSN – 0976-2000
Today Mapro is leading supplier of tasty as well asnutritious fruit product to the International marketi.e.Fiji, Mauritius, Oman, Russia, UAE, Uganda,USA.
Mapro’s portfolio of products provides a high quo-tient of natural fruit in the form of Jams, Fruit barsand chews, Syrups, Crushes, Squashes, and Des-sert Toppings. Its range of premium products suchas Thandai crush and Kesar syrup are made fromthe finest selection of exotic ingredients. Mapro’sproducts are known for their wholesome taste andquality, as also their natural goodness and nutritivevalue.
Mapro was the pioneer of fruit-based confection-ery in India, with its first jelly sweets being madefrom fruit juices and liquid glucose. The ‘Falero’pulpy fruit chews, which are better known as ‘patesde Fruit’ in the rest of the world – are excellentexemplars of Mapro’s very own Innovation Labs.Faleros come in unique indigenous flavours thatare suited to the Indian palate, like KacchiKairi(Raw Mango), Alphonso Mango and Strawberry.
MARKETING MIX
FMCG Company carries out its marketing task bymaking a market offer (Ramaswamy&Namakumari,2013). First, the company creates a product thatwill meet the needs and value of the consumer.Secondly, the company completes auxiliary func-tions, for example, transportation, warehousing andretaining. Such features allow the product to reachthe consumer conveniently. Third, the companycommunicates, through various promotional activi-ties, the benefits/value of the market offer to thecustomers. Personal selling, advertisements, andsales promotion are examples of promotional ac-tivities employed. Lastly, the company undertakes
the price mechanism and perfects the marketingtask by arriving at a pleasant task. The product,place, promotion and pricing represent the primaryelements of company’s market offer. With thesefour elements, the FMCG Company sets toattainits value delivery tasks.
ProductA product represents the heart of an FMCG com-pany and acts as a need satisfying entity to anFMCG consumer. According to KPMG’s sectorreport, the FMCG sector consists of several prod-ucts, with sig nificant categories being food, bev-erages, personal and home care products. FMCGproducts are repeatedly the same within these cat-egories, which leads to intense competition amongretailers. Mapro foods have wide collection in pro-cessed food products category over 125 products.Mapro has divided its product into jam, crush, re-store, coolz, lounge, squash, premium, falero, bar& jellies, toppings, mazaana, F2O fruit drink.
PriceKozami (2002) maintains that pricing is the main-stay of a company’s marketing policy. Prices ofFMCG products are not particular. The prices keepon changing and are different for different prod-ucts. Mpro pricing strategy depends on the marketand geographical segment. The different brand ofMapro have a different pricing strategy Mapro pric-ing strategy runs parallel with that of its competi-tors.
Price comparison Mapro vs Mala’s
Table 1.1 Price comparison Marop vs Mala’s
Mapro Mala’s Crush/syrup (750ml) Rs.144 Rs.135 Jam Rs. 160 Rs.168

COMPREHENSIVE MARKETING PLAN OF MAPRO FOODS PVT. LTD.
46 Volume IX Issue (1) March 2018 Chetana’s R.K.I.M.R. ISSN – 0976-2000
PlaceDistribution is an essential function of FMCG prod-ucts. There are several types of distribution arrange-ments. The conventional strategy of Mapro followsmanufacturing carrying and forwarding distributor-retailors-consumers. Mapro distribution channel isstrong and has superior marketing and sales net-works that supplement the distribution channel.
Mapro has established widespread distributionchannels to reach its customers in West, Northand South India. Its network comprises of 12super distributors and over 300 distributors across17 Indian states.
PromotionThe policy in FMCG sector is to maintain commu-nication simple and profit-oriented. In order to craftan increased demand in the market. The companyconcentrates on point-of-sales promotion rather thanembarking on a grandiose brand-building activityinvolving print and electronic media. The taste ofproduct and nutritional value, and uniqueness re-sult in repeat sales.
B2BB2B still represents a small and not-well-under-stood segment for most FMCG companies. Themarket for most FMCG products is wholly differ-ent from those found through retail. Many productsare sold unbranded or in bulk and are less respon-
dent to consumer trends or whims; as a result thereare fewer opportunities to differentiate brands andproduct lines. Consequently, purchasing decisionsin B2B channels are much more determined byother, more structural metrics: price; quality andfunctionality; flexibility and service; timeliness.Factors like advertising and promotion have lim-ited if any pull in these channels (Matthew Oster,April 2006).
Mapro Food Products, one of the leadingcompanies in India to provide processed fruit prod-uct, is looking at expanding its presence in theHoReCa segment. With the company’s primaryfocus being on the B2C segment, it has a strongportfolio of over 125 products in India and abroad.Mapro has three divisions i.e. Falero division,HoReCa division, B2C division. Within thisHoReCa division deals with B2B like Hotels, Res-taurants and Catering service. Market drivers inthis segment are distributors, retailers and whole-saler as the organization in this segment directlypurchase from these market drivers. factors likeadvertising and promotion has less influence onthe customers in this segment so the companieshas to appoint sales representative who can visitthese organization and pitch the brand in front ofthe decision maker in the respective organisation.In this segment relationship of wholesaler or dis-tributor with decision makers influence the pur-chase decision.
Two models that are generally used are:Traditional sales model
Fig: 1.1 Traditional model
Company Distributor
Retailer
Wholesaler
HoRECa

47
COMPREHENSIVE MARKETING PLAN OF MAPRO FOODS PVT. LTD.
Volume IX Issue (1) March 2018 Chetana’s R.K.I.M.R. ISSN – 0976-2000
The above Fig 1.1 shows; how the distributors,retailer and wholesaler play the major role in thissegment. The purchase orders are placed accordingto the need and convenience of the organizationi.e. if the quantity per month of a product used isless (e.g. 1-3 bottles of crush) then the organiza-tion will directly purchase form retailer. If the quan-tity per month is more (e.g. 1-3 cases of crush)then the organization purchase form wholesalers ordistributer for better price and offer. The organiza-tions which have centralized purchase prefer dis-tributors for on time delivery and geographicalreach.
Direct sales Model
Fig: 1.2 Direct sales model
The above model (Fig: 1.2) comes into action whensome specific product is not available with thedistributor, wholesalers and retailers these productsare directly to be purchase form the company. MaproFoods have such products like Fruit fill, Honey,Gulkand which are not available with any distribu-tor, wholesaler or retailer and are delivered directlyto the customer from the company when demanded.
Sales representative approachIn this paper on the basis of experience and obser-vation in field study the researcher has developeda following model.
The Fig: 1.3 shows the approach of the sales rep-resentative in HoReCa segment. it is a lone pro-cess where in after tasting the sample and lookingat all the external (SKU’s and price) and internal(quality and taste) parameters the purchase is donethis process is followed in Grade-A, B Hotels,Restaurants and Juice Parlour. The approach for
Sales representative
Appointment
Meet purchase manger
Chef
Sample tasting
Bartender Owner
Purchase order
the catering services and local restaurant is differ-ent it doesn’t include sample tasting, the purchasehere is more influenced by price and offers.
Push & Pull strategyPull - Pull marketing is where you develop adver-tising and promotional strategies that are meant toentice the prospect to buy your product or service.Some classic examples are “half off!” or “bring inthis coupon to save 25%” or “buy one get onefree”, etc.
With pull marketing, you are trying to create a senseof increased, time limited value so that the cus-tomer will come into your store to buy. The prac-tises carried out by Mapro food to pull the custom-ers are point-of-sales promotion, combo pack(ketchup and syrup/ syrup and jam) and festiveoffers.
Push- Push marketing is where you develop adver-tising and promotional strategies geared toward yourmarketing and distribution channels to entice themin promoting your product. As consumers, you rarelysee this type of marketing when it is directed to thedistributors. It might include wholesale discounts,kickbacks, bonuses, and other types of support. It’sall designed to have the retailer promote your prod-
Fig: 1.3 Suggested Model
Company HoRECa

COMPREHENSIVE MARKETING PLAN OF MAPRO FOODS PVT. LTD.
48 Volume IX Issue (1) March 2018 Chetana’s R.K.I.M.R. ISSN – 0976-2000
uct to the end users over a different product. Maprouses push strategy like 12+2 (i.e. for 12 bottles ofany sharbat get two bottles free), provide highermargin to the retailers so that they promote theirproduct more and cross sealing (e.g. for 6 bottlesof any sharbat get two 450gm ketchup free) to in-crease the sales and awareness about the productwhich comes under the umbrella of company.
CONCLUSION
From FMCG’s perspective, the four Ps have beensignificant, in some instances, at least for market-ers of FMCG product. The FMCG sector repre-sents the world of pure marketing. The sector isthe best training ground for learning various formsof marketing disciplines and processes. Differentmarketing mix elements impact the sales and brandawareness with differing levels of intensity. Thestudies made by Mapro foods conclude that distri-bution and promotional strategy occupies the focalpoint to achieve better sales.
Although B2B ends up being often quite emotionaland impulsive as well with even more efforts afterthe decision to make it appear hyper rational (likeomitting better alternatives or more pressing needsfor that cash.). B2B means generally there will beother people with considerable to decisive input onthe buying decision but who aren’t accessible tothe salesperson, don’t see or read the advertising,don’t get the online or physical mailings, don’t goto trade shows or industry conferences, ignore bothtrade media and most business media so publicrelations work doesn’t reach them reliably eithertheir input comes from isolated ignorance and otherpriorities. For business development in B2B thecompany should perform a market research to knowthe prospective of buyers in this segment it willhelp company to make better marketing strategy.A successful strategy will usually have elements of
both the push and pull promotional methods. Ifyou are starting a new business and intend to sella product through retailers, you’ll almost certainlyneed to persuade outlets to purchase and stock yourproduct. You’ll also need to raise brand awarenessand start building valuable word of mouth refer-rals. If you have designed a product around thecustomer and have considered all elements of themarketing mix, both of these aspects should beachievable.
REFERENCES
1. The Marketing Mix 4P’s and 7P’s Explained(http://marketingmix.co.uk/)
2. What are the differences between B2C and B2Bin FMCG Sales & Marketing (https://www.quora.com/What-are-the-differences-be-tween-B2C-and-B2B-in-FMCG-Sales-Market-ing)
3. Mapro.com4. How B2B research methods can help FMCG
companies (https://www.quirks.com/articles/how-b2b-research-methods-can-help-fmcg-com-panies)
5. Push and Pull Marketing (http://fmcg-marketing.blogspot.in/2007/10/push-and-pull-marketing.html)
6. Marketing Mix in FMCG’s leading Companies:Four Ps Analysis (https://www.ijser.org/researchpaper/Marketing-Mix-in-FMCGs-lead-ing-Companies—Four-Ps-Analysis.pdf)
7. Marketing Management, Millenium Edition,Philip Kotler, Marketing mix, Pg. 9-11
8. “Push” vs. “Pull” Marketing research, AdrianaRocha, September 2015
9. Marketing Management-Department of highereducation, Ramaswamy VS and Namakumari,Business to Business (B2B), Pg. 32-33, Busi-ness to Business Market Research, Pg. 84.

49
AMAZON- INNOVATIONS FOR INDIA
* Dr. Amit Rangnekar
49
ISSN – 0976-2000 Vol IX Issue (1) (2018) : pp 49 - 59
Volume IX Issue (1) March 2018 Chetana’s R.K. Institute of Management and Research
Chetana’s
Amazon- Innovations for India
* Dr. Amit Rangnekar is an MBA (Marketing) and PhD (Business Strategy) from NMIMS, Email: [email protected]
AbstractIn this case, we study Amazon’s India entry, growth and challenger strategies. How Amazon leveraged theexisting ecosystem through innovative strategies, built a compelling value proposition by offering a widerselection, delivered promptly and at competitive prices, despite strong, funded competition.
Background: On 1st January 2018, Jeff Bezos, the iconic founder of Amazon is in deep discussion with AmitAgarwal the CEO of Amazon India, on the strategy Amazon needs to adopt to ascend to the online retailerleadership in India. Bezos outlines his vision 2020 and Amit Agarwal presents the strategy for Amazon toemerge as India’s largest online retailer by market share and gross merchandise value by 2020
AMAZON ORIGIN AND PROGRESS
In the past three decades, the consumer technologyspace has been revolutionized leading to signifi-cant changes in consumer behavior and attitudes,post the new millennium. American giants Apple,Google, Facebook and Amazon, have led this trans-formation and become an inseparable part of ourdaily life. Such has been their domination that thecombined market capitalization of these four techtitans- Apple ($879 billion), Google ($718 billion),Amazon ($550 billion) and Facebook ($517
billion) now exceeds the GDP of India ($2264billion)!
Apple rules the consumer electronics space, Googleand Facebook capture the lion’s share of onlineadvertising through search, online videos and so-cial media, while Amazon dominates the e-com-merce and cloud services space. The astonishingpart is that except Apple none of them were inexistence in the last 25 years!
Brand Finance1 ranks Amazon as the world’s third

AMAZON- INNOVATIONS FOR INDIA
50 Volume IX Issue (1) March 2018 Chetana’s R.K.I.M.R. ISSN – 0976-2000
largest brand by value, at $106.3 billion. Amazon’ssales in 2016 were $136 billion with a net profit of$2.37 billion. Amazon’s market capitalization isover $500 billion, twice the GDP of Pakistan ($236billion)! Jeff Bezos, Amazon’s founder is currentlythe richest man in the world worth $100 billion.
In 1994, Jeff Bezos, a Wall Street investment banker,gave up his job to start Amazon named after thegreat South American river. He could envision thepotential of online retail and started with books aseach book has standard content across the world,and there is no ‘touch and feel’ involved in buyinga book. In 1995 Amazon sold books in the USAand in 45 other countries, ending with annual salesof over $500,000.
COMPETITIVE ADVANTAGE-INNOVATION ENGINE
Amazon listed its shares in 1997, forayed into CDsand videos in 1998, and later on apparel, electron-ics and toys through retail alliances. In 2002 Ama-zon started free shipping and in 2005 launchedAmazon Prime, a blockbuster brand that is a keydriver of growth and purchases for Amazon today.In 2006 Amazon created its own private labels ofdifferent products to leverage customer’s trust, earnhigher margins, and reduce dependence on largemanufacturers. In 2006 Amazon pioneered theFulfillment by Amazon (FBA) program to ensureall deliveries are routed through Amazon to ensureconsistency in the service experience. In 2007Amazon launched Kindle its book reader to comple-ment its dominance in the online book retail. In thesame year Amazon started grocery deliveriesthrough Amazon Fresh, entering a major retail seg-ment. In 2013 Amazon same day delivery was in-troduced, followed by Sunday deliveries in 2015.In 2016 Amazon introduced Amazon local for spe-
cific local purchases, followed by Amazon Pay, theire-wallet. In 2017, Amazon Now was introducedwhich delivers groceries free in two hours, givingcustomers the hyper convenience of online shop-ping but saving them a trip to the food mall or thegrocer. Amazon has been granted patents for skywarehouses which will be a floating warehouse withsmall drones that can self-assemble into biggerdrones capable of transporting larger packages. Thisstrategy if successfully executed can fulfill deliver-ies by air, completely revolutionizing the retail,services and logistics sectors.
Google dominates the information search functionglobally with over 85% market share, which is non-commercial, and earns money through advertising.Amazon dominates product search which is com-mercial in nature and earns money on every trans-action plus on advertising. Amazon Web Servicesis the global leader in cloud computing sector with30% global share, triple the market share ofMicrosoft’s Azure, and much higher than that ofIBM and Google.
Amazon focuses on price, convenience and selec-tion, the three key reasons to buy for consumers,and adds value through deft execution. Amazon’sbusiness model is radically different from othercompanies. Amazon’s investments in technologyhave made them more efficient than competitors,as they employ half the staff for the same amountof business. Amazon makes losses or minimal prof-its hence pays low or no taxes. A Wall Street Jour-nal article dated 22nd September 20172 said that inthe last ten years Walmart paid $64 billion in taxes,while Amazon paid just $1.4 billion, yet added $220billion to their market capitalization in the last 3years.

51
AMAZON- INNOVATIONS FOR INDIA
Volume IX Issue (1) March 2018 Chetana’s R.K.I.M.R. ISSN – 0976-2000
INDIAN ONLINE RETAIL MARKET
Although Amazon dominates online retail in theUSA with nearly 50% share, its share of the totalretail market is less than 5% in the USA3. Due toits policy of internet censorship Amazon, likeGoogle and Twitter, are banned in China, wherelocal companies like Alibaba and Tencent domi-nate. Hence to sustain its global growth Amazonentered India by acquiring Junglee.com in 2008.Amazon built its sourcing, supply and systemsnetwork and started a full-fledged set up in 2013.Amazon’s India entry was fraught with challengesthey had never encountered before in any largemarket. The FDI (foreign direct investment) policyprohibited online retailers with FDI to sell directlyto Indian consumers. Hence the traditional modelof inventory led where goods were bought at whole-sale rates and sold at retail rates gave way to themarket place model which is asset light. Onlineretailers with FDI were allowed to operate throughan online/ digital platform (market place) like awebsite or an app, which connected buyers to sell-ers. The online retailer earned commissions fromsellers on every transaction as well as enlisting feesfor onboarding the sellers, and also through adver-tising. This model is also called an aggregatorbusiness model.
The overall infrastructure for online retail in Indiawas under developed with very low penetration.While India had a population of 1.25 billion, 65%of its population was below 35 years of age, and67% lived in rural areas with limited access to theinternet. Almost 80% of India’s population usedmobile phones, but only 25% were connected tothe internet with less than 10% using smart phones.The preferred modes of browsing the internet weredesktops and laptops, and the dominant mode ofpayment was cash with very low credit card pen-
etration and much lower online shopping. The ven-dor base was very small and consisted of largelyunorganized and unconnected suppliers who wereskeptical about going online.
The Indian retail market in 2014 was $525 billionwith unorganized retail stores like Kiranas, momand pop stores and general stores accounting for$479 billion or 91.5%, organized retail like BigBazaar and other chain stores accounting for $44billion or 8%, and online retail accounting for $2.3billion or 0.5% of total sales4.However industryexperts estimated that by 2020 the Indian retailmarket would touch $ 1 trillion with the onlineretail market touching $100 billion with over 175million Indians shopping online. Although theIndian market seemed challenging, Amazon viewedit as an opportunity and realized that adapting theirtechnology to the available infrastructure and envi-ronment in India would reap solid dividends infuture, than investing in building new technologiesin India.
COMPETITION
Amazon pioneered e-tail globally, but local Indiane-tailers had established themselves firmly beforeAmazon could formally launch their services inIndia. The competition in the Indian online retailmarket was a duopoly with Flipkart dominating themarket followed by Snapdeal, a distant second. Theywere followed by multi category players likeShopclues and Infibeam, and a multitude of small,niche players like Myntra, Jabong, Lenskart andBaby Oye. Flipkart focused on the urban areas andhigh tier towns with limited categories. Snapdealfocused on the extra urban areas, low tier townsand offered a larger range with a larger seller basethan Flipkart. Snapdeal’s product mix was differ-ent from others with unique items like water fil-

AMAZON- INNOVATIONS FOR INDIA
52 Volume IX Issue (1) March 2018 Chetana’s R.K.I.M.R. ISSN – 0976-2000
ters, bird cages and tyres being sold on their website,while Flipkart relied on books, fashion and elec-tronics as key categories. Shopclues and Infibeamoperated in multiple categories like Flipkart, whileMyntra and Jabong focused on fashion, Lenskarton eye wear and Baby Oye on baby products.Another reason for the growth of the online retailmarket in India is the retail policy for organizedretailers with FDI, who are prohibited from retail-ing multiple brands and can retail only singlebrands. Also the organized retailers have to sourcea certain percentage of their requirements locally.These two criteria have prevented the full-fledgedentry of global retail giants like Walmart, Tescoand Carrefour in India. The Indian consumer istraditionally price sensitive but value conscious,hence the online retail market remains a discount-driven, highly-attritional ecommerce market withlow loyalty.
FLIPKART LEADERSHIP STRATEGIES
Flipkart, whose founders worked for Amazon,started in 2007 and pioneered online retail of books.By understanding the Indian customer’s discomfortwith paying in advance, Flipkart revolutionizedonline buying in India by offering cash on delivery(COD). This strategy drove online purchases acrossIndia and helped Flipkart emerge as a clear leader.Flipkart consolidated its leadership by expandinginto various categories and offering reliable ser-vice. Flipkart acquired Myntra, the fashion e-tailerin 2014 for $300 million, to consolidate its pres-ence in the fashion category as it accounted foralmost 30% of the market. The main investors inMyntra and Flipkart were Tiger and Accel, whowere keen to merge the two for economies of scaleand scope. The online fashion market was growingat 300%, twice the market growth rate, and theFlipkart – Myntra combine would account for over
50% of the fashion e-tail segment. Flipkart furtheracquired Jabong, another leading fashion e-tailer in2016 to bolster its dominance in fashion.
Tiger Global, Accel, Naspers and the founders werethe original investors in Flipkart, who diluted theirstake subsequently. In 2017, eBay, China’s Tencentand Microsoft together invested $1.4 billion inFlipkart for a 20% stake, followed by a $2.5 billioninvestment by SoftBank, the world’s largest tech-nology firm, for a 20% stake, valuing Flipkart atover $12.5 billion. Flipkart has received total $7billion in funding. As part of the deal Flipkart ac-quired the Indian operations of eBay in 2017.
Flipkart has strongly defended its leadership usingmobile defense strategy to cover all categories, pre-emptive defense strategy to match Amazon’s moves,and counter offensive defense to neutralize theimpact of Amazon’s promotional strategy. The hugefunding has rejuvenated Flipkart, resulting in anadvertising and promotion blitz, which has led tosignificant onboarding of new customers, increasedbrand recall, high traffic flows to their app andwebsite, and increased frequency of shoppingamong customers. This strategy has helped Flipkartconsolidate their leadership in the electronics andfashion segment which together contribute to 68%of the online retail market, and are key drivers ofgrowth.
SoftBank 30% stake in China’s Alibaba is valuedat $140 billion, which gives it the leverage to in-vest big in online retail. SoftBank has promised toinvest $10 billion in India of which they have in-vested $6 billion so far. SoftBank has significantstakes in online retailer Snapdeal, online mediaplayer InMobi, taxi hailing app leader Ola, mes-senger app Hike, online housing playerHousing.com, online Hotel room leader Oyo and

53
AMAZON- INNOVATIONS FOR INDIA
Volume IX Issue (1) March 2018 Chetana’s R.K.I.M.R. ISSN – 0976-2000
online grocer Grofers all of whom are large playersin their own spaces. Snapdeal, InMobi, Ola, Hikeare all unicorns or startups with valuations above$1 billion each. In 2017 SoftBank pumped in $1.4billion in Paytm at a valuation of over $7 billion.Softbank could choose to merge Flipkart, PayTMand its investments in other online retailers to con-solidate Flipkart’s position and take on Amazon.With Softbank’s investments in India, the final fron-tier for the battle for global supremacy in onlineretail between Amazon and Alibaba could well beplayed out in India, and India will certainly not seea monopoly in the e-commerce market unlike inChina and the USA.
Amazon entry strategyAmazon made a late entry into a high growth marketwhere the well-funded Flipkart and Snapdeal hadinvested early and created market awareness aboutonline retail. Hence Amazon needed to invest increating own brand awareness, and building theirservice and logistics networks. But the well-fundedplayers were under pressure as they were spendingbig money on customer acquisition costs and suf-fering severe ‘burn rate’ or monthly losses. Ama-zon invested $2 billion of their own funds, andupped the ante with low prices, introductory offersand free shipping. To defend their share the incum-bents had to further increase their ‘burn rate’ thusexpanding their losses. Amazon entered with booksbut soon entered into mobile phones and electron-ics, which covered over 55% of Flipkart’s range.
“The beauty of the online model is there is no shelfspace. If some person in India has some need atany given point, and if you cover that need, youbuild trust. And, if you convince people that thereis a place where you can find anything you needand have it delivered fast, it becomes an everydayhabit, the holy grail of any commerce. Amazon has
based its business on the 3 pillars which customerscare for in online retail- selection, prices, fast de-livery5” Amit Agarwal CEO Amazon, India.
Amazon growth and innovation strategies
Amazon has grown and penetrated in India bymarrying their technology and innovation to theexisting infrastructure. Below are strategies thatenabled Amazon to emerge as a strong, high re-source challenger to Flipkart’s supremacy.
OnboardingThere is an apprehension on the part of vendors toenroll with online retailers as they are not sure ofthe benefits of selling their wares online and alsofear a decrease in commissions. To tide over this,Amazon organized Amazon Tatkal where theytravelled with their own trucks, across 30 cities inIndia and met over 10,000 sellers, educating, en-gaging, explaining and finally enrolling them assellers on Amazon. The trucks had professionals toclick snaps of the sellers products, prepare thecatalogue, list their products online, and imparttraining on the software and service essentials.
Amazon also set up mobile tea carts in the centralbusiness districts of key cities to connect to smallentrepreneurs who could be prospective partners.This initiative was called Big Chai = Big Profitinitiative. Amazon explained the details of theirbusiness proposal and onboarded sellers.
FulfillmentAmazon has globally perfected the Fulfillment byAmazon (FBA) model where Amazon owns hugewarehouses to stock products of sellers, and de-liver to customers using the Amazon network.Through these central shipping platforms, Amazonmanages the customer experience from order to

AMAZON- INNOVATIONS FOR INDIA
54 Volume IX Issue (1) March 2018 Chetana’s R.K.I.M.R. ISSN – 0976-2000
delivery, delighting the customers. The sheer scaleof operations results in economies of scale whichAmazon reinvests to lower costs. The fulfillmentstrategies of Amazon India are outlined in figure 1.
In the FBA model in India, Amazon has 41 fulfill-ment centers which largely cater to the metros, tierI, II, II cities. To penetrate deep within these areas,Amazon has innovatively adapted its technology toleverage the existing infrastructure in India. Theseller pays Amazon charges for stocking their prod-
ucts in the fulfillment center. On receiving the onlineorder, Amazon, packs and delivers to the customer.
In the Easy Ship model the seller stocks Amazonproducts, the seller packs on receipt of online or-der, intimates Amazon who schedule a pick up fromthe seller, and Amazon delivers to the customer.Easy ship targets shopkeepers who own shops, incurno fixed costs, and have spare space for holdingAmazon inventory.
Figure 1: Fulfillment strategies of Amazon in India
In the Sell on Amazon (SOA) model, the sellerstocks their own products, which are displayed onthe Amazon list. On receiving the online order, theseller delivers the order independently. The selleris usually given Amazon packing material so thatit appears to be delivered by Amazon.
Unorganized retail which accounts for around 90%of retail in India consists of 1.4 crore shops. These
shops are called mom and pop stores, which op-erate from a single location, have family membersmanaging the store, with minimum staff, generatea small business volume, and target local area cus-tomers. Kirana, chemists, pan wala, general stores,bakeries are typical examples. These stores arepreferred by local customers for their good service,long relationship, same day delivery and in manycases credit facilities. Amazon has tie ups with such

55
AMAZON- INNOVATIONS FOR INDIA
Volume IX Issue (1) March 2018 Chetana’s R.K.I.M.R. ISSN – 0976-2000
“neighbourhood” stores that offer extra businessand commission for sellers, convenience for buy-ers and extended reach for Amazon. Once the onlineorder is received Amazon picks up, packs anddelivers the order. Over 12,500 stores in 50 citieshave been onboarded by Amazon. This is calledthe Seller Flex model.
Amazon has also identified areas within large cit-ies where the residents do not have access to theinternet and hence potential Amazon customers areunder served. To reach such customers Amazonhas initiated “Udaan”6 offline stores where Ama-zon has tied up with local entrepreneurs to set upAmazon screens so that customers can visit thestore, browse the full selection, place the order,which is then delivered by Amazon to that store,and picked up by the customer. Amazon has started3500 stores in 7 cities across Maharsahtra, Rajasthanand Tamil Nadu, which will be scaled up to AllIndia. Amazon has tied up with Vakrangee whichhas built its retail network to affordably, reliablyand efficiently deliver banking and financial ser-vices products offered by the government and pri-vate companies, to rural and semi-urban India. Thisnetwork can then be extended by Amazon to pen-etrate deep into India and attain true last-mile con-nectivity, as well as help create local entrepreneurs.
Besides the innovative approaches to reach cus-tomers Amazon also uses traditional modes to reachcustomers including air, rail, road and bikes fordeliveries. However, for extra urban and rural reach,Amazon depends on India Posts the organisationwith the deepest presence in rural India. India Postshas 1.54 lakh post offices of which 1.39 lakh are inrural India. India Posts handles postal services,savings schemes and money orders, and are mosttrusted in India’s towns and villages. These compe-tencies make them an ideal firm to partner for lo-gistics in rural and urban India. Amazon identified
the potential of India Posts very early and is todaytheir largest e-commerce partner. Of India Poststurnover of Rs 12000 crores, nearly Rs 2000 croreswas through e-commerce delivering over 50,000parcels daily. Amazon now covers 97% of India’s39732 pin codes. Over 50% of Amazon’s sellerbase is from other than metro and tier I cities, whileover 60% of customers are from other than metroand tier I cities5. Amazon has enabled empower-ment through technology by allying with the localecosystem.
CloudtailThe FDI policy does not allow Amazon to selldirectly to the customer, but allows Amazon to selldirectly to corporates (B2B or Business to Busi-ness). Hence Amazon has formed a joint venturecalled Cloudtail with a company called Catama-ran7, promoted by the family of Narayana Murthy,the iconic founder of Infosys. Cloudtail8 is a sup-plier to Amazon, and is currently its largest sup-plier with a turnover exceeding Rs 5000 crores,specializing in electronics.
Amazon PrimeAmazon Prime offers special services to customersagainst subscription. Amazon Prime subscribers getfree shipping and faster delivery on most purchases,early access to special offers, and Prime Videostreaming service. Amazon Prime has emerged asa ley growth driver for Amazon as customers aredelighted to get free delivery and prefer only Ama-zon as they feel they have already paid for thegoods. Prime customers now account for over onethird of all Amazon shipments in India and feelthat Prime delivers higher value and superior ser-vice experience, which leads to higher loyalty fromthem. In India the Prime customer base is growingat 200%, while their spend on Amazon is growingat 100% and 75% new Prime customers are fromlow tier cities5.

AMAZON- INNOVATIONS FOR INDIA
56
In the USA in the last 12 months, Prime usersspent $2,500 through Amazon while non Primeusers spent only $544 on an average9. Hence byoffering the benefits of Prime at low cost, Amazoncultivates Prime members who are more likely tobuy high-end products more frequently, than nonPrime members. The Prime Video service is nowsecond to Neflix world wide but growing faster,and if Amazon keeps offering more goodies onPrime, they can convince more customers to hookon to Prime Video, thus narrowing the gap.
Amazon PromotionAmazon has used two key campaigns in the lastfour years to effectively communicate what Ama-zon stands for and can do for the customer in In-dia. Amazon used an integrated marketing commu-nication strategy using various media and a mix ofabove the line and below the line promotion strat-egies. Amazon largely invested in creative TV com-mercials which looked at slice of life situationsand which helped Amazon break the clutter. TheApni Dukaan and Aur Dikhao campaigns focusedon the wide range, choice, convenience, economy,ease of use, prompt delivery and genuine products,which brought Amazon into their consideration set,and convinced the customer to try the service. Byconsistently delivering a superior experience Ama-zon gained customer acceptance.
Traditionally Indians tend to make major retailpurchases during the festive Diwali season. Flipkartpioneered the Big Billion Day sale with huge dis-counts few weeks prior to Diwali to entice custom-ers to make their Diwali purchases on Flipkart.Amazon also followed suit by launching the Ama-zon Great Indian Festival sale in the same period.Leading newspapers reported that in 2017 Flipkartand Amazon generated sales of $1.5 billion (Rs10,000 crore) through these special festive sales10.In 2017 the Amazon sale offered 40,000 special
deals in 4 days in electronics, home appliances andfashion. Amazon tied up with leading credit cardcompanies to offer cashback of 10 percent of thepurchased value on the next purchases, which guar-antees future sale. Smartphones, large appliances,fashion and lifestyle, home and kitchenware, ac-counted for the highest sales, severely denting theDiwali sales of the organized physical retailers. Thesales also result in a spurt in ‘Prime’ subscribers asthey get an early access to the stuff on sale.
Payment ShiftFlipkart revolutionized online buying in India byoffering cash on delivery, but of late payment trendsare changing. Customers now prefer payment ondelivery. It is estimated that 50% of all paymentsare still pre-paid, but of the balance 50%, which ispayment on delivery, only 15% is cash on deliverywhile 35% is credit card payment on delivery5.Amazon is well geared for this change and has alsointroduced Amazon Pay, an e-wallet which con-tains a pre-paid balance which is paid for Amazonpurchases and on which customers get special dis-counts and cashback on the next purchase.
GroceriesIn the USA Amazon dominates the online retailspace in books, electronics and fashion but has alow presence in groceries which is the largest seg-ment in physical retail. In 2017 Amazon acquiredgrocer chain Whole Foods11 for $14 billion, whichhas close to 500 stores in the USA. This omni-channel (physical and digital) strategy will giveAmazon physical reach and these stores can serveas hubs for display, stocking and delivery forAmazon products as well as convenient pick uppoints for customers placing online orders. In In-dia also, groceries account for 40% of the totalretail spend, an area, where Amazon is not signifi-cant in. The FDI policy in India allows Amazon tostock and sell online food and groceries made or
Volume IX Issue (1) March 2018 Chetana’s R.K.I.M.R. ISSN – 0976-2000

57
AMAZON- INNOVATIONS FOR INDIA
produced in India. Amazon has invested over $500 million to build linkages with farmers, stor-age, trade and transport networks. Amazon hasintroduced Amazon Pantry for household items andgroceries and deliver fresh and fast in certain cit-ies. For express deliveries Amazon Pantry has beendeveloped which deals in 2 hour delivery slots forfresh foods. The Amazon Pantry advertisementhighlights the economy, convenience and ease ofordering online, which creates awareness and en-tices customers to try out the service. Amazon nowoffers two hours delivery in few cities for grocer-ies, and same day delivery for multiple categoriesin many cities.
INDIAN ONLINE RETAIL MARKET 2017
The Indian e-commerce market is said to be $25
billion but the actual online retail market is onlyaround $8 billion as 60-70% of the e-commercemarket includes online travel booking sites likeMakemytrip, Yatra and IRCTC, and none of thebig online retailers operate in the online travelbooking vertical12. However, there are perceptibleshifts in the online retail market in category pen-etration between 2013 and 2017 as shown in figure2. Electronics and lifestyle together account for 68%of the market and are growing. Online purchase ofbooks has reduced significantly while online pur-chase of beauty and personal care, home and liv-ing, healthcare products, baby products and foodand groceries have increased. These categorieswould be the next growth area for Amazon India.
Figure 2: Online retail categories % sales 2013 and 2017
Source: Click & Mortar, Economic Times, Mumbai, 10 August 2014; Indian Retail Industry, CARE Ratings, 2017.
Volume IX Issue (1) March 2018 Chetana’s R.K.I.M.R. ISSN – 0976-2000
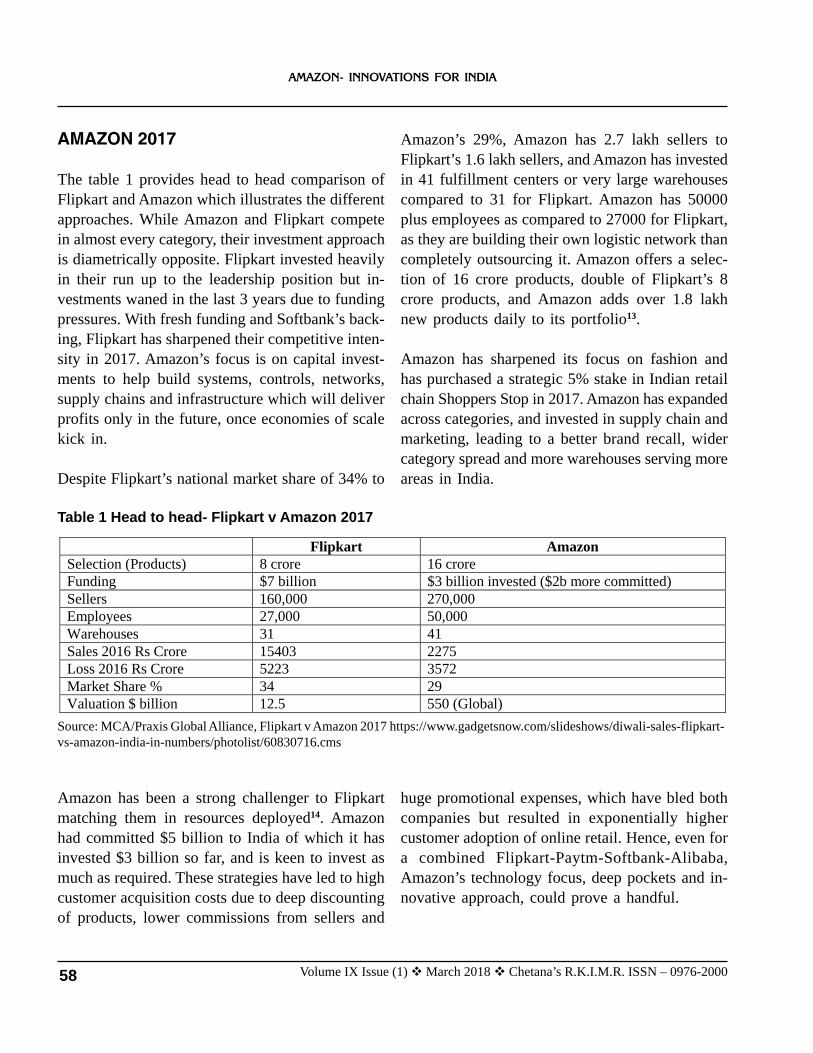
AMAZON- INNOVATIONS FOR INDIA
58
AMAZON 2017
The table 1 provides head to head comparison ofFlipkart and Amazon which illustrates the differentapproaches. While Amazon and Flipkart competein almost every category, their investment approachis diametrically opposite. Flipkart invested heavilyin their run up to the leadership position but in-vestments waned in the last 3 years due to fundingpressures. With fresh funding and Softbank’s back-ing, Flipkart has sharpened their competitive inten-sity in 2017. Amazon’s focus is on capital invest-ments to help build systems, controls, networks,supply chains and infrastructure which will deliverprofits only in the future, once economies of scalekick in.
Despite Flipkart’s national market share of 34% to
Amazon’s 29%, Amazon has 2.7 lakh sellers toFlipkart’s 1.6 lakh sellers, and Amazon has investedin 41 fulfillment centers or very large warehousescompared to 31 for Flipkart. Amazon has 50000plus employees as compared to 27000 for Flipkart,as they are building their own logistic network thancompletely outsourcing it. Amazon offers a selec-tion of 16 crore products, double of Flipkart’s 8crore products, and Amazon adds over 1.8 lakhnew products daily to its portfolio13.
Amazon has sharpened its focus on fashion andhas purchased a strategic 5% stake in Indian retailchain Shoppers Stop in 2017. Amazon has expandedacross categories, and invested in supply chain andmarketing, leading to a better brand recall, widercategory spread and more warehouses serving moreareas in India.
Table 1 Head to head- Flipkart v Amazon 2017
Flipkart Amazon Selection (Products) 8 crore 16 crore Funding $7 billion $3 billion invested ($2b more committed) Sellers 160,000 270,000 Employees 27,000 50,000 Warehouses 31 41 Sales 2016 Rs Crore 15403 2275 Loss 2016 Rs Crore 5223 3572 Market Share % 34 29 Valuation $ billion 12.5 550 (Global)
Source: MCA/Praxis Global Alliance, Flipkart v Amazon 2017 https://www.gadgetsnow.com/slideshows/diwali-sales-flipkart-vs-amazon-india-in-numbers/photolist/60830716.cms
Amazon has been a strong challenger to Flipkartmatching them in resources deployed14. Amazonhad committed $5 billion to India of which it hasinvested $3 billion so far, and is keen to invest asmuch as required. These strategies have led to highcustomer acquisition costs due to deep discountingof products, lower commissions from sellers and
huge promotional expenses, which have bled bothcompanies but resulted in exponentially highercustomer adoption of online retail. Hence, even fora combined Flipkart-Paytm-Softbank-Alibaba,Amazon’s technology focus, deep pockets and in-novative approach, could prove a handful.
Volume IX Issue (1) March 2018 Chetana’s R.K.I.M.R. ISSN – 0976-2000

59
AMAZON- INNOVATIONS FOR INDIA
EPILOGUE
As Amit Agarwal, CEO, Amazon India, finisheshis strategy presentation, Jeff Bezos, Founder andCEO of Amazon, is convinced that Amazon Indiais on track to achieve his vision and emerge asIndia’s largest online retailer by 2020.
The author would like readers to address followingquestions:
1. The strategies that Amazon needs to employ toascend to the leadership in the online retail mar-ket in India
2. With additional funding and the backing ofSoftbank and Alibaba, Flipkart would emergevery strong. How does Amazon counter them?
3. Should Amazon look at profitability before in-vesting more or look at leadership before profit-ability? Which approach would be right and why?
4. Should Amazon open physical stores in Indiawhich can complement the customers’ online ex-perience with the touch and feel of physical re-tail?
REFERENCES
1. Brand Finance Global 500 February 2017
2. Amazon Takes Over the World, WSJ, Scott Gal-loway 22Sep17.
3. ‘Amazon is eating the retail world’, retrieved 10December 2017. https://www.cnbc.com/2017/07/07/amazon-is-eating-the-retail-world.html
4. Click & Mortar, Economic Times, Mumbai, 10August 2014.
5. Interview Amit Agarwal CEO Amazon India, ETNow Brand Equity, Sonali Krishna 28 June 2017.
6. Amazon launches its offline project Udaan- JohnSarkar, Times of India, 10 November 2015.
7. h t tp : / /www. l ivemin t . com/Compan ies /1EdpKoAY7GoZLh57pXuwkO/Amazon-India-top-seller-Cloudtails-revenue-rises-fourfold-t.html
8. Amazon Opens Door for Family Merchants, Jul04 2017, Economic Times, Bangalore.
9. https://www.businessinsider.in/Amazon-keeps-giving-goodies-away-to-Prime-members-be-cause-it-pays-off-in-the-end/articleshow/54822047.cms
10. http://www.financialexpress.com/industry/missed-out-on-big-billion-days-and-great-indian-festival-sales-flipkart-amazon-may-soon-come-up-with-some-good-news-for-you/871437/
11. The Amazon–Whole Foods Deal Means EveryOther Retailer’s Three-Year Plan Is Obsolete,HBR, Darrell K. Rigby, JUNE 21, 2017
12. http://www.careratings.com/upload/NewsFiles/SplAnalysis/Indian%20Retail%20Industry%20-%20June%202017.pdf
13. Amazon adds 180,000 items for India every day!,Rediff.com, 10 May 2017.
14. How Amazon Adapted Its Business Model to In-dia, V Govindarajan and A Warren, Harvard Busi-ness Review, 20 July 2016.
Volume IX Issue (1) March 2018 Chetana’s R.K.I.M.R. ISSN – 0976-2000

FINANCIAL MODELLING AND PORTFOLIO MANAGEMENT SERVICES
60
* Sai Appala
* Sai Apurva Appala, MMS Batch 2016-18, CRKIMR
ISSN – 0976-2000 Vol IX Issue (1) (2018) : pp 60 - 67Chetana’s
Volume IX Issue (1) March 2018 Chetana’s R.K. Institute of Management and Research
Financial Modelling and Portfolio Management Services
This paper is submitted based on experience during the two month internship in an investment bankingcompany.
INTRODUCTION
When analyzing a company from an investment perspective it is important to assess it from both a qualitativeand a quantitative perspective.
Qualitative analysis means looking at the intangibles. The factors about a company that are not purely num-bers driven can be just as important as crunching the numbers.
Quantitative analysis means looking at different financial metrics and ratios, fundamental to the analysis.
A comprehensive analysis of a company should include looking at both the qualitative and quantitativefactors that would impact decision making. Common quantitative factors include calculating different ratios(debt/equity, current ratio) and considering different financial metrics (net income, net assets).
Qualitative analysis can be far more subjective and really depends on the company that is being looked at.
FINANCIAL MODELLING
Financial Modeling is a tool that can be used toforecast a picture of a security or a financialinstrument or a company’s future financialperformance based on the historical performanceof the entity. It is a tool that’s built in Excel toforecast a business’ financial performance into thefuture. The forecast is typically based on the
company’s historical performance and requirespreparing the income statement, balance sheet, cashflow statement and supporting schedules which isthen used for the purpose of decision making andfinancial statement analysis.Financial modeling shows whether, The organization is in need of additional funds
or not how a business will react to different financial

61
FINANCIAL MODELLING AND PORTFOLIO MANAGEMENT SERVICES
Volume IX Issue (1) March 2018 Chetana’s R.K.I.M.R. ISSN – 0976-2000
situations or market conditions In which company we should make investment
for better returns i.e. comparative analysis Analyzing and defining the risk level Has the company had a change in direction that
is loss of customers, expansion etc. Identifying of Strategic and Business Plans
through finding strengths and weaknesses. It’s a technique to value and analyze Firms,
IPOs and FPOs
PORTFOLIO MANAGEMENTSERVICES:
Portfolio Management Services (PMS), serviceoffered by the Portfolio Manager, is an investmentportfolio in stocks, fixed income, debt, cash,structured products and other individual securities,managed by a professional money manager thatcan potentially be tailored to meet specificinvestment objectives. When you invest in PMS,you own individual securities unlike a mutual fundinvestor, who owns units of the fund. You have thefreedom and flexibility to tailor your portfolio toaddress personal preferences and financial goals.Although portfolio managers may oversee hundredsof portfolios, your account may be unique.
Discretionary:Under these services, the choice as well as thetimings of the investment decisions rest solely withthe Portfolio Manager.
Non-Discretionary:Under these services, the portfolio manager onlysuggests the investment ideas. The choice as wellas the timings of the investment decisions rest solelywith the Investor. However the execution of tradeis done by the portfolio manager.
Advisory:Under these services, the portfolio manager onlysuggests the investment ideas. The choice as wellas the execution of the investment decisions restsolely with the Investor. Note: In India majorityof Portfolio Managers offer DiscretionaryServices.The Investment solutions provided by PMS caterto a niche segment of clients. The clients can beIndividuals or Institutions entities with high networth.
The offerings are usually ideal for investors: whoare looking to invest in asset classes like equity,fixed income, structured products etc ,who desirepersonalised investment solutions ,who desire long-term wealth creation ,who appreciate a high levelof service.
OBJECTIVES
1) To explain the business model.2) To check the viability of the project.3) To look at opportunities for investment for
multifold returns.4) To demonstrate the size of the market.
APPLICATIONSThe purpose of Financial Modeling is to build aFinancial Model which can enable a person to takebetter financial decision. The decision could beaffected by future cash flow projections, debtstructure for the company etc. All these factors mayaffect the viability for a project or investment in acompany. The Applications of Financial Modelingmainly includes the followings: Financial Modeling is used in Business
Valuation that is deciding the fair value for abusiness. Financial Modeling will help partici-pants to reach to a price they are willing to payor accept for the selling business.
FINANCIAL MODELLING AND PORTFOLIO MANAGEMENT SERVICES
62 Volume IX Issue (1) March 2018 Chetana’s R.K.I.M.R. ISSN – 0976-2000
It is also useful for Organization’s decisionmaking and scenario preparation. FinancialModeling is used by organizations for planning their long term goals according to differentsituations that may arise.
To decide the Cost of Capital – if a company isgoing to invest in a new project then FinancialModeling for it will give analysis for debt/equitystructure and expectation in return by investors,thus setting benchmarks for project to meet .
Capital Budgeting - Financial Modeling helpscompanies determine alloting resources formajor expenditure or investment.
The goal of an analyst is to forecast the futureearnings performance of a company. Numerousvaluation and forecast theories exist, and financialanalysts are able to test these theories by recreatingbusiness events in an interactive calculator referredto as a financial model.
A financial model tries to capture all the variablesin a particular event. It then quantifies the variablesand creates formulas around these variables. In theend, the model provides the analyst with amathematical depiction of particular business event.
USERS OF FINANCIAL MODEL
Financial models are used by the Investment bankersfor transactions involving capital structure.
Valuation advisors use models for valuationprojections. Credit analysts use models to determinethe ability to repay debt.
Buy/Sell side research analysts use financial modelsto determine a buy or sell rating on a particularsecurity.
BENEFITS OF FINANCIAL MODEL
1) It helps in studying how a company is managingits cash flows.
2) It helps in identifying financial risk and strategy.3) It helps in analyzing the quality of earnings.4) It helps in analysing the growth rate of the
company5) Based on the profitability ratios and valuation
ratios, it helps in effective decision making.
TYPES OF FINANCIAL MODELS
There are various kinds of financial models thatare used according to the purpose and need of doingit. Different financial models solve differentproblems. While majority of the financial modelsconcentrate on valuation, some are created tocalculate and predict risk, performance of portfolio,or economic trends within an industry or a region.The following are the different types of financialmodels:
1) Discounted Cash Flow modelAmong different types of Financial model, DCFModel is the most important. It is based upon thetheory that the value of a business is the sum of itsexpected future free cash flows, discounted at anappropriate rate. In other words this is a valuationmethod uses projected free cash flow and discountsthem to arrive at a present value which helps inevaluating the potential of an investment. Investorsparticularly use this method in order to estimatethe absolute value of a company.
2) Comparative Company Analysis modelAlso referred to as the “Comparable” or “Comps”,it is the one of the major company valuationanalyses that is used in the investmentbanking industry. In this method we undertake a

63
FINANCIAL MODELLING AND PORTFOLIO MANAGEMENT SERVICES
Volume IX Issue (1) March 2018 Chetana’s R.K.I.M.R. ISSN – 0976-2000
peer group analysis under which we compare thefinancial metrics of a company against similar firmsin industry. It is based on an assumption that similarcompanies would have similar valuations multiples,such as EV/EBITDA. The process would involveselecting the peer group of companies, compilingstatistics on the company under review, calculationof valuation multiples and then comparing themwith the peer group.
3) Sum-of-the-parts modelIt is also referred to as the break-up analysis. Thismodeling involves valuation of a company bydetermining the value of its divisions if they werebroken down and spun off or they were acquiredby another company.
4) Leveraged Buy Out (LBO) modelIncluded in the types of Financial model is the LBOModel. It involves acquiring another company usinga significant amount of borrowed funds to meet theacquisition cost. This kind of model is being usedmajorly in leveraged finance at bulge-bracketinvestment banks and sponsors like the PrivateEquity firms who want to acquire companies withan objective of selling them in the future at a profit.Hence it helps in determining if the sponsor canafford to shell out the huge chunk of money andstill get back an adequate return on its investment.
5) Merger & Acquisition (M&A) modelMerger & Acquisitions type of financial Modelincludes the accretion and dilution analysis. Theentire objective of merger modeling is to showclients the impact of an acquisition to the acquirer’sEPS and how the new EPS compares with the statusquo. In simple words we could say that in thescenario of the new EPS being higher, thetransaction will be called “accretive” while theopposite would be called “dilutive.”
6) Option pricing modelAs it is defined “Options are Derivative contractsthat give the holder the right, but not the obligation,to buy or sell the underlying instrument at aspecified price on or before a specified future date”.Option traders tend to utilize different option pricemodels to set a current theoretical value. OptionPrice Models use certain fixed knowns in thepresent (factors such as underlying price, strike anddays till expiration) and also forecasts (or assump-tions) for factors like implied volatility, to computethe theoretical value for a specific option at a certainpoint in time. Variables will fluctuate over the lifeof the option, and the option position’s theoreticalvalue will adapt to reflect these changes.
CHARACTERISTICS OF A GOODFINANCIAL MODEL
A good financial model should : Be relatively simple Focus on key cash flow drivers Clearly convey assumptions and conclusions Evaluate Risks
It is used in analyzing how a business will react todifferent economic situations or events, and inestimating the outcome of financial decisions beforecommitting any funds. A financial model generallyincludes revenue projects, cash flow projections,depreciation schedules, debt service, inventorylevels, rate of interest. It may also quantify thefinancial impact of the firm’s policies, and ofrestrictions imposed by investors and lenders.
The goal of an analyst is to forecast the futureearnings performance of a company. Numerousvaluation and forecast theories exist, and financialanalysts are able to test these theories by recreatingbusiness events in an interactive calculator referred

FINANCIAL MODELLING AND PORTFOLIO MANAGEMENT SERVICES
64 Volume IX Issue (1) March 2018 Chetana’s R.K.I.M.R. ISSN – 0976-2000
to as a financial model.
A financial model tries to capture all the variablesin a particular event. It then quantifies the variablesand creates formulas around these variables. In theend, the model provides the analyst with amathematical depiction of particular business event.
COMPONENTS OF A FINANCIAL MODEL
Common Financial Modeling ApproachesFinancial Modeling – Income Statement: Line ItemDrivers
a) Financial Modeling –Revenues Projections For most companies revenues are a fundamentaldriver of economic performance. A well designedand logical revenue model reflecting accurately thetype and amounts of revenue flows is extremelyimportant. There are as many ways to design arevenue schedule as there are businesses. Somecommon types include:1. Sales Growth: Sales growth assumption in each
period defines the change from the previous pe-riod. This is simple and commonly used method,but offers no insights into the components ordynamics of growth.
2. Inflationary and Volume/ Mix effects: Instead ofa simple growth assumption, a price inflationfactor and a volume factor are used. This usefulapproach allows modeling of fixed and variablecosts in multi product companies and takes intoaccount price v/s volume movements.
3. Unit Volume, Change in Volume, Average Priceand Change in Price: This method is appropriatefor businesses which have simple product mix;it permits analysis of the impact of several keyvariables.
4. Unit Market Size and Growth: This is more de-tailed than the preceding case and is useful whenpricing in the market is a key variable. (For acompany with a price-discounting strategy, forexample, or a best of breed premium priced nicheplayer) e.g. Luxury car market
5. Volume Capacity, Capacity Utilization and Av-erage Price: These assumptions can be importantfor businesses where production capacity isimportant to the decision. (In the purchase ofadditional capacity, for example, or to determinewhether expansion would require new invest-ments.)
6. Revenue driven by investment in capital, mar-keting or R&D.
b) Financial Modeling – Costs projections
Drivers include:1. Percentage of Revenues: Simple but offers no
insight into any leverage (economy of scale orfixed cost burden
2. Costs other than depreciation as a percent of rev-enues and depreciation from a separateschedule: This approach is really the minimumacceptable in most cases, and permits only par-tial analysis of operating leverage.
3. Variable costs based on revenue or volume, fixedcosts based on historical trends and depreciationfrom a separate schedule: This approach is theminimum necessary for sensitivity analysis ofprofitability based on multiple revenue scenarios
c) Financial Modeling – Operating expenses1. General and Administrative: Generally treated as
% of Revenues

65
FINANCIAL MODELLING AND PORTFOLIO MANAGEMENT SERVICES
2. Sales and Marketing: Generally modeled as %of Revenues. In some cases, it is actually a rev-enue driver and not driven by revenues. For ex-ample, brokerage business or pure plays tradingand marketing firms.
3. R&D: Generally R&D costs are treated as % ofrevenues.
d) Financial Modeling – Interest expense (or Netinterest expense):
1. This is one of the few income statement itemsthat is driven by balance sheet information. In-terest schedule is generally developedto i) calculate interest received on cash and shortterm investments and ii) calculate interest ex-penses arising from all types of debt. Interestrate assumptions are needed.
2. Ending balance of previous year can be used tocalculate interest expenses to avoid circular ref-erence in excel.
3. Average balance can be used as well.
e) Financial Modeling – Income taxes:1. Effective tax rate is generally used. Effective rate
is calculated as Taxes paid.
2. For future years, either the marginal tax rateequivalent to the country of incorporation is takenor if the effective rate is much lesser than themarginal tax rate then during the initial years,tax rate can be low but gradually would have tobe moved to marginal tax rate. For example, InIndia, marginal corporate tax rate is 33%.
Balance Sheet: Line Item Drivers (Assets) Cash and Cash Equivalents: Linked to cash from Cash Flow Statement
Accounts Receivable (Part of WorkingCapital Schedule): Generally modeled as Days SalesOutstanding; Receivables turnover = Receivables/Sales *365 A more detailed approach include aging orreceivables by business segment if thecollections vary widely by segments Receivables = Receivables turnover days/365*Revenues
Inventories (Part of Working Capital Schedule): Inventories are driven by costs ; Inventory turnover = Inventory / Net Sales
* 365 Assume an Inventory turnover number for
future years based on historical trend ormanagement guidance and then compute theInventory using the formula given below
Inventory = Inventory turnover days / 365*Net Sales;
Other Current Assets (Part of Working CapitalSchedule): Modeled as % of sales
Fixed Assets (Property, Plant and Equipment) Separate schedule is prepared taking into
account various components Ending Balance for PPE = Beginning
balance + Capex – Depreciation –Adjustment for Asset Sales
Balance Sheet: Line Item Drivers (Liabilities) Financial Modeling – Current Liabilities
Projections Accounts Payables (Part of Working Capital
Schedule): Payables turnover = Payables/Net Sales *
365
Volume IX Issue (1) March 2018 Chetana’s R.K.I.M.R. ISSN – 0976-2000

FINANCIAL MODELLING AND PORTFOLIO MANAGEMENT SERVICES
66
Assume Payables turnover days for futureyears based on historical trend ormanagement guidance and then compute theAccounts Payables using the formula givenbelow:
Accounts Payables = Payables turnover days/365*Net Sales
Short Term Debt: Usually modeled as partof debt schedule
Deferred taxes: Kept constant most often;Can be modeled as % of sales
Other Current Liabilities: Can be modeledas % of Sales
Long term Liabilities: Deferred taxes: Kept constant most often;
Can be modeled as % of sales Long term Debt: Usually modeled as part
of debt schedule. Key feature of the debt schedule is to use
the Revolver facility and how it works sothat the minimum cash balance is main-tained and ensures that the Cash accountdoes not become negative in case theoperating cash flow is negative (Companiesin investment phase who need lot of debt ininitial years of operation – for example :Telecom companies)
Overall range of Debt to equity ratio shouldbe maintained if there is any guidance bythe management
Debt balance can also be assumed to beconstant unless there is a need to increasethe debt
Notes to the accounts would give repaymentterms and conditions which need to beaccounted for while building the debtschedule
For some industries, like Airlines, Retail etcOperating Leases might have to capitalizedand converted to debt.
SKILLS REQUIRED TO PREPARE AFINANCIAL MODEL
1. A solid understanding of accounting2. Strong Excel skills3. Knowing how to link the 3 financial statements4. Understanding how to build a forecast5. A logical framework for problem solving6. Attention to detail7. Ability to distill large amounts of data into a
simple format8. An eye for design and esthetics
FINANCIAL MODELLING ANDPORTFOLIO MANAGEMENT SERVICES
Portfolio management services are the professionalservices provided by portfolio managers to helptheir clients in managing their portfolio efficientlyand taking required decisions swiftly. Portfoliomanagers consider the risk preferences and personalinvestment goals of their clients and manage theirmutual funds, stocks and bonds.
Before investing funds in any company, an analystconstructs a financial model to determine thefeasibility of investment into it. With the help ofthe financial model, he/she will analyse the keyratios of the company to judge the viability byforecasting its earnings for the next five years. Thismodel would be studied by the fund managers tocome to a decision.
Each PMS account is unique and the valuation andportfolio of each account may differ from oneanother. There is no NAV(Net asset value) for aPMS scheme; however the customer will get thevaluation of his portfolio on a daily basis from thePMS provider. Each PMS account is unique fromone another. Every PMS scheme has a modelportfolio and all the investments for a particular
Volume IX Issue (1) March 2018 Chetana’s R.K.I.M.R. ISSN – 0976-2000

67
FINANCIAL MODELLING AND PORTFOLIO MANAGEMENT SERVICES
investor are done in the Portfolio ManagementServices on the basis of model portfolio of thescheme. However the portfolio may differ frominvestor to investor. This is because of:
1. Entry of investors at different time.
2. Difference in amount of investments by the in-vestors
3. Redemptions/additional purchase done by inves-tor
4. Market scenario – Eg. If the model portfolio hasinvestment in Infosys, and the current view ofthe Fund Manager on Infosys is “HOLD”, a newinvestor may not have Infosys in his portfolio.
Under PMS schemes the fund manager interactionalso takes place. The frequency depends on thesize of the client portfolio and the PortfolioManagement Services provider. Bigger the portfolio,frequency of interaction is more. Generally, the PMS
provider arranges for fund manager interaction ona quarterly/half yearly basis.
CONCLUSION
Financial modeling is an important tool foranalyzing the prospects of company for investmentopportunities. It elaborately covers qualitative andquantitative aspects of the company and helps todiscover any drawbacks or negative factors whichwill hamper the growth. It enables an analyst totake an informed decision to advice portfolio clientsfor investment.
REFERENCES
1. www.investopedia.com2. www.icicibank.com3. www.motilaloswalmf.com4. economictimes.indiatimes.com5. www.businesstoday.in
Euromonitor International’ latest report on TOP 10 CONSUMER TRENDS OF 2018,Categorises Consumers on the basis of shifting consumer attitudes and behavior as :
1. CLEAN LIFERS
2. THE BORROWERS
3. CALL OUT CULTURE
4. IT’S IN THE DNA – I AM SO SPECIAL
5. ADAPTIVE ENTREPRENEURS
6. VIEW IN MY ROOMERS
7. SLEUTHY SHOPPERS
8. I-DESIGNERS
9. CO-LIVING
10. THE SURVIVORS
Volume IX Issue (1) March 2018 Chetana’s R.K.I.M.R. ISSN – 0976-2000
A STUDY OF THE IMPACT OF CURRY FESTIVAL TO PROMOTE AND PENETRATE MAGGI COCONUT MILK POWDER
68
* Nandita Yadav
* Nandita Yadav, PGDM Batch 2016-18, CIMR
ISSN – 0976-2000 Vol IX Issue (1) (2018) : pp 68 - 73Chetana’s
Volume IX Issue (1) March 2018 Chetana’s R.K. Institute of Management and Research
A Study of the Impact of Curry Festival to Promote and PenetrateMaggi Coconut Milk Powder
AbstractNestlé is the world’s largest food and Beverage Company with the presence in 191 countries around theworld. They’ve created Nestlé Professional; an organization dedicated to better serve the requirements of outof home channels that deal with bulk products. They launched 1 kg pack of Maggi coconut milk (MCMP) forthis channel but experienced serve competition from Real Coconut, Palmo, Cocomi, Renuka and Maggi Realin the market. Therefore to tackle this situation they initiated a special drive in the form of Curry Festival topromote the product and penetrate it into the market. This action is a Nestle initiative and is carried out as apublic relation activity.
They targeted restaurants, as their consumption is high and consistent compared to usage at home. Evenwithin restaurants they categorized the type of restaurants who will consume maximum product for theircuisine. So, they narrowed it down to Thai restaurants and South Indian restaurants as they make coconut-based dishes.
The notion behind the Festival is to make restaurants try the product and offer it to end consumers who willdevelop the taste for it and consumption of the product will obliquely increase. Also, the restaurants will startpreferring MCMP to other coconut powders in the market. This will lead to old customer retention and newbusiness development and will also help MCMP to stay relevant in the market and gain maximum marketshare.
Restaurants using MCMP are identified and are proposed with festival, while restaurants not using MCMPare offered a free demo of the product. When a restaurant agrees with the concept of the festival, trainedChefs are sent from Nestle to improvise their menu and festival date is fixed. All branding essentials areprovided by Nestle along with free Nestea ice tea for the festival.
The research focuses on analyzing the event at participant restaurants. The objective of this research is to findthe impact of this promotional activity and its benefit along with estimating market penetration of this prod-uct. The scope of the research is limited to interview and experiences know through restaurant feedback. Thearea covered is Mumbai western line. The finding suggests that there is an increase in consumption of MCMPdue to this festival and the restaurants are benefited through an increase in sales. Also, MCMP is the domi-nant player in the market. It is recommended that the company focus on logistics, recruiting right employeeand fill the communication gap between restaurant and them as success of the festival depends on productiv-ity and efficiency of the employees. So, committed chefs and logistic team is required to fulfill the company’sobjectives, as achievement of the destined goal is uncertain without them.
Keywords: Curry Festival, Promotional activity and Communication gap

69
A STUDY OF THE IMPACT OF CURRY FESTIVAL TO PROMOTE AND PENETRATE MAGGI COCONUT MILK POWDER
Volume IX Issue (1) March 2018 Chetana’s R.K.I.M.R. ISSN – 0976-2000
INTRODUCTION
To curb the competition, Nestle has been organiz-ing Curry Festival since 2007 and about 150+ suchevents are being organized. Other competitors likePalmo, Cocomi, Renuka and Maggi Real do notoffer such lucrative proposal.
It is always a big challenge for Nestle ProfessionalMumbai Team to retain business and get new busi-ness. This activity creates enough excitement forrestaurants to be loyal to the product. It also helpsto promote the brand Nestle.
At event, consumers ordering any item from thefestival menu, which is designed by trained Nestlechefs, are given Nestea iced tea free. The entirefestival menu is made using MCMP. Branding es-sentials like banners, standees, newspaper dropouts,tent cards are provided by Nestle. It helps the res-taurants to set buzz in the market. The restaurantcan decide which festival they would like to con-duct like Goan, Coastal, Thai, Oriental or Coconutcurry festival. The festival can be carried out for aweek or 15 days or even a month. In the past, therestaurants where curry festivals were conductedhave boosted sales of MCMP and hence Nestle hascontinued this strategy of maintaining and convert-ing potential clients. The company also understandsif the end consumer has accepted the product.
OBJECTIVES
1. To study the market penetration of the Maggicoconut milk powder
2. To observe the impact of Curry Festival3. To study benefits of organizing Curry Festival
LIMITATIONS
1. Respondents show reluctance in giving
information2. Findings are based on the responses of the re-
spondents3. Time Limitation of the project4. Late delivery of the products and branding ma-
terial5. Communication gap between the restaurant and
the company6. Meetings and demos were delayed due to Chef’s
busy schedule
LITERATURE REVIEW
Article titled, “PR Competencies Can ImproveROI from Your PR Firm”, dated August 16, 2017by Bobbie Wasserman in Business 2 communitywebsite states that PR is one prominent elementalongside marketing and it can not be ignored as ithelps to influence and gives better reach which inturn produces an ROI action for the company. Ithas not changed much since its inception and yetit’s offering more ways for companies to reach theirintended audience and resulting in a much widerarray of disciplines. Nestle is using Curry Festivalto establish long lasting relationship with restau-rants for keeping them loyal to the product andgain better penetration in the market. Also, they aretrying to understand mind-set of restaurants thatuse MCMP and gaining better insights of end con-sumers.
Article titled, “Right promotions prod thriftyconsumers into spending: Nielsen” dated Jan 17,2017 in The Money control website states that,traditionally, customers in India waited for the fes-tive season to make bulk purchases and premiumpurchases. Today however, shoppers are not limit-ing their enthusiasm to festivals alone but are alsomaking purchases at events created by retailers.Therefore, event created by the company in formof Curry Festival to promote MCMP is a smart

A STUDY OF THE IMPACT OF CURRY FESTIVAL TO PROMOTE AND PENETRATE MAGGI COCONUT MILK POWDER
70 Volume IX Issue (1) March 2018 Chetana’s R.K.I.M.R. ISSN – 0976-2000
ploy to outwit the competitor
Article titled, “A Public Relations Role in BrandMessaging” dated 18; October 2011By Ron Prindle in International Journal ofBusiness and Social Science states that it hasbecome increasingly important to communicate withconsumers as the marketplace has transition to aconsumer-driven place market. Also, there is in-creasing social consciousness among consumerswho now place more emphasis on what an organi-zation is about rather than simply what that orga-nization produces in the form of services or prod-ucts. So, engaging with consumers helps outplaycompetitors and gives an upper hand in the mar-ketplace. Nestle is also trying to achieve similarobjectives with its activities.
METHODOLOGY
The Nature of Research- Exploratory, ResearchMethodology- Quantitative, Data CollectionSources- Primary Data and Secondary Data, DataCollection Method- Interview, Data CollectionInstrument- Structured Questionnaire, PopulationUnderstudy: Thai restaurants and South Indianrestaurants, Sampling Method: Stratified RandomSampling, Sampling Frame: Thai restaurants andSouth Indian restaurants in Mumbai western linefrom Borivali to Churchgate, Sample Size – 100units each representing restaurants
List of participating restaurants:1. Go Panda2. Golden Dragon Chinese Point3. Kung Food4. Rola Rossa

71
A STUDY OF THE IMPACT OF CURRY FESTIVAL TO PROMOTE AND PENETRATE MAGGI COCONUT MILK POWDER
Volume IX Issue (1) March 2018 Chetana’s R.K.I.M.R. ISSN – 0976-2000

A STUDY OF THE IMPACT OF CURRY FESTIVAL TO PROMOTE AND PENETRATE MAGGI COCONUT MILK POWDER
72 Volume IX Issue (1) March 2018 Chetana’s R.K.I.M.R. ISSN – 0976-2000
Benefits the participates gained from the CurryFestival1. Go Panda: 17.64% increase in sales of Thai Cui-
sine2. Golden dragon Chinese point: 19.35% increase
in sales of Thai Cuisine3. Kung Food: 28.57% increase in sales Thai cui-
sine4. Rola Rossa: Stagnant sales of Coconut based cui-
sine
Completion of Data Analysis1. Through research it is understood that there is
utmost penetration of Maggi coconut milk pow-der in the market
2. Festival helped boost sales of Thai cuisine inThai festival but in coconut-based curry festivalstagnant sales were observed
3. According to the restaurants where curry festi-vals are organized, there is significant increasein the consumption of the product as they re-ceived more orders than usual
4. Restaurants are not aware Maggi is owned byNestle
5. Restaurants who use MCMP believe in superiorquality of the product
6. Restaurant believe their Thai dishes tastes betterwith MCMP
7. Many restaurant show reluctance in using MCMPbecause they think it will not give the authenticflavor
8. One of the major reasons why restaurants don’tbuy MCMP is because it is expensive
9. Restaurants who use other products like Cocomior Renuka are not brand loyal and buy the prod-uct according to the availability of the productsin the store.
10. Restaurants are not interested in carrying outCurry festival because their in-house drink saleswould tamper and they are also concerned withNestle overshadowing their own brand.

73
A STUDY OF THE IMPACT OF CURRY FESTIVAL TO PROMOTE AND PENETRATE MAGGI COCONUT MILK POWDER
CONCLUSIONS
It is observed from the research that therestaurants prefer MCMP rather than Cocomiand Renuka
End consumers likes dishes made from RealCoconut
As logistic team delayed delivery of Brandingessentials and Product, the restaurants were notsatisfied after completion of the festival andbenefit of the event couldn’t be optimized
There is a communication gap between therestaurants and the company
There was a significant increase in theconsumption of the product than usual duringthe festival
Packed schedule of Chefs delayed the festivaland lead to cancellation of demos
RECOMMENDATIONS
1. Improve logistics and recruit right candidate forthe job as success of the festival is solely depen-dent on the productivity and efficiency of theemployees i.e. Chef and logistic team
2. More newspaper handout should be given to therestaurants as minimum number of handoutswere given during fest, therefore entire areacouldn’t be covered, this hindered the awarenessof the festival
3. Standees should be provided with customer logoas well
4. Information of Curry Fest should also be pro-moted through Nestlé’s social media as signifi-cant buzz would be created
5. To fill the communication gap between the res-taurants and the company, regular update shouldto be taken.
REFERENCES
1. https://www.nestle.in/
2. http://www.moneycontrol.com/news/business/companies/right-promotions-prod-thrifty-con-sumers-into-spending-nielsen-945421.html
3. https://www.ibef.org/
4. Research Methodology: Methods and TechniquesBy C. R. Kothari, Chapter 1, Research Method-ology: An Introduction, P.1-6
5. Research Methodology, By D K Bhattacharyya,Unit 6, Sampling and Sampling distribution,P.79-110
6. h t t p : / / i j b s s n e t . c o m / j o u r n a l s /Vol_2_No_18_October_2011/5.pdf
7. http://www.business2community.com/public-re-lations/pr-competencies-can-improve-roi-pr-firm-01896919#IQP68850VuBZvKV0.97
Few Insightful Marketing Blogs/News Letters
1. Marketing Insider Group
2. Brands Take Stands
3. The Word Stream Blog
Volume IX Issue (1) March 2018 Chetana’s R.K.I.M.R. ISSN – 0976-2000

IMPACT OF INFLATION ON FMCG POWER AND INFRASTRUCTURE SECTOR
74
* Barkha Thakkar** Archit Padwe and Nitin Singh
* Barkha Thakkar, ** Archit Padwe and Nitin Singh, Students MMS Batch 2016-18, CRKIMR
ISSN – 0976-2000 Vol IX Issue (1) (2018) : pp 74 - 83Chetana’s
Volume IX Issue (1) March 2018 Chetana’s R.K. Institute of Management and Research
Impact of Inflation on FMCG Power and Infrastructure Sector
AbstractInflation is one of the biggest challenges to be faced in the growing economy like India which will be grow-ing at more than 7 percent in the coming years. In regular social discourse and everyday conversation Infla-tion is commonly referred as the synonymous index for the price hike of daily commodities. It is one of themajor factors that arrest the growth of economy. The root cause of inflation is too much money chasing toolittle resources such type inflation is known as Demand driven Inflation. Since inflation has impact on com-panies from various sectors it is important to analyze the impact of inflation on these companies. This paperanalyses the impact of inflation on various companies across Infrastructure, Power and FMCG sector inIndia.
1. INTRODUCTION
Inflation is a process of continuously rising pricesor equivalently continuously falling value of money.To put it simply, inflation is the long term rise inthe prices of goods and services caused by thedevaluation of currency. Inflationary problems arisewhen we experience unexpected inflation which isnot adequately matched by a rise in people’s in-comes. If incomes do not increase along with theprices of goods, everyone’s purchasing power hasbeen effectively reduced, which can in turn lead toa slowing or stagnant economy. Moreover, exces-sive inflation can also wreak havoc on retirementsavings as it reduces the purchasing power of the
money that savers and investors have squirreledaway.
2. MEASURES OF INFLATION
Methods which are associated in measuring infla-tion are Wholesale Price Index (WPI), ConsumerPrice Index (CPI) and GDP Deflator.
In this research paper we have measured inflationwith Wholesale Price Index (WPI) and it is com-pared with companies’ revenue and to determinethe impact of inflation on companies’ revenue. Abrief explanation about the wholesale price indexis given below.

75
IMPACT OF INFLATION ON FMCG POWER AND INFRASTRUCTURE SECTOR
Volume IX Issue (1) March 2018 Chetana’s R.K.I.M.R. ISSN – 0976-2000
Wholesale Price Index (WPI)- The WPI is pro-duced by the Indian Ministry of Commerce andIndustry. The data are collected at the first point ofbulk sale in the domestic market. The prices usedare ‘wholesale prices for primary articles, adminis-tered prices for fuel items and ex-factory prices formanufactured products’. That is, the WPI measuresthe prices of products at the factory or farm gate,prior to their sale to consumers in retail markets.One advantage of the WPI is that it has a longhistory, dating back to January 1942, which makes
it useful for assessing long-term trends in inflation.The WPI also covers a broad range of goods, fromraw materials to finished manufactures, but nota-bly excludes services. The WPI is calculated usingthe Laspeyres formula, which measures the changein the cost of purchasing the same basket of itemsin the current period as was purchased in a speci-fied earlier period. This technique is simpler thanother methods, since the weights are computed inthe base period and, until this is updated, eachsubsequent calculation requires only an update of
Source: RBI Bulletin; Chetana Research Source :Mrunal

IMPACT OF INFLATION ON FMCG POWER AND INFRASTRUCTURE SECTOR
76 Volume IX Issue (1) March 2018 Chetana’s R.K.I.M.R. ISSN – 0976-2000
prices. A disadvantage of this type of index is thatit will be biased if the composition of sales in thewholesale market is changing and the weights arenot regularly updated. This is more likely to be anissue for a fast-changing, emerging economy suchas India. As the Indian economy develops andhousehold incomes increase, we would expect non-food items and services to account for a larger shareof expenditure and the composition of productionto evolve reflecting changes in demand. The weightsfor components of the WPI are derived from theirshare of gross output in current price terms. Theweights for selected groups in the WPI changedsignificantly with each of the first two rebasing.Changes were relatively smaller at the latestrebasing in 2004/05. Over the past 40 years or so,a number of broad trends are apparent the weightof primary articles (especially food) has fallen andthe weight of manufactured items has increased.
3. DATA ANALYSIS & PROCESSING
To precede with the data processing and analysisextensive data collection was at forefront. Quarteron Quarter inflation was collected from RBIwebsite and corresponding revenue data of eachsector companies were collected from their respec-tive annual report.
Analysis is done on three sectors viz Power, Infra-structure and FMCG. Regression analysis is usedto find the relationship that exists between infla-tion with respect to all commodities and revenueof companies with respect to the above mentionedsector.
Inflation data was taken into consideration of allthe commodities as revenue is generated when isproduct is sold which in turn is dependent on cus-
tomers purchasing capacity thus inflation of all thecommodities have an impact on customers purchas-ing capacity.
Further it is also important to note that change ininflation will have an impact on the company’srevenue of the following month and not on thesame month and also inflation is one of the manyfactors which have an impact on the company’srevenue but it is not the only factor.
For analysis quarterly results from Dec-Marc 13-14 to Jun 16 - Sep 16 are taken for inflation andrevenue data. Analysis of same is done as follows:
A] FMCG Sector-
1. Hindustan Unilever Limited-Hindustan Unilever Limited is the leading FMCGCompany in India. It has its strong presence indifferent categories such as shampoo, oral care, andskin care. It also in the business of food and re-freshment.
Since the company produces products of daily useof individual and also has a lot brand appeal thecompany is able to pass the incremental price risedue inflation to the customers effectively.
Inflation analysis using regression method suggestthat 1% rise in inflation reduces revenue by 19crore rupee which less than ITC

77
IMPACT OF INFLATION ON FMCG POWER AND INFRASTRUCTURE SECTOR
Volume IX Issue (1) March 2018 Chetana’s R.K.I.M.R. ISSN – 0976-2000
Year Dec Mar 13 -14 Mar Jun 14 Jun Sep
14 Sep Dec 14
Dec Mar 14 - 15
Mar Jun 15
Jun Sept 15
Sept - Dec 15
Dec15 - Mar 16
Mar-16-Jun 16
Jun 16 - Sept 16
Revenue 6682.23 7278.23 7465.54 7555 7712.71 7,595.64 7,605.82 7,584.90 7,465.54 7,987.74 7697.55
Inflation (All Com) 0.3348% 1.5573% 1.3143% -2.8108% -2.0578% 1.4196% -1.1198% -0.4530% -1.5784% 4.2383% 0.4396%
2. Indian Tobacco Company-ITC is company which has its business in diverseareas such Hotels, Cigarettes, Agriculture.
Major portion of the company revenue come fromits Cigarettes business which is approximately 41%of the total revenue. Since cigarettes are addictive
a small increase in price will not hamper cigarettessales much but inflation in food articles is boundto hit agriculture business and also hotels business.
Inflation analysis conducted using regression sug-gest that 1% rise in inflation would bring the rev-enue of the company down by 22 crore rupees.

IMPACT OF INFLATION ON FMCG POWER AND INFRASTRUCTURE SECTOR
78 Volume IX Issue (1) March 2018 Chetana’s R.K.I.M.R. ISSN – 0976-2000
Year Dec Mar 13 -14
Mar Jun 14
Jun Sep 14
Sep Dec 14
Dec Mar 14 - 15
Mar Jun 15
Jun Sept 15
Sept - Dec 15
Dec15 - Mar 16
Mar-16-Jun 16
Jun 16 - Sept 16
Revenue 9145.14 9164.42 8930.32 8800.22 9188.25 9077.85 8699.36 8792.99 9650.35 9957.66 9535.47
Inflation (All Com) 0.33482% 1.55729% 1.31435% -2.81081% -2.05784% 1.41965% -1.11982% -0.45300% -1.57835% 4.23826% 0.43956%
3. Nestle India-Nestle is present in different categories such asMilk products and nutrition, Chocolate and Con-fectionery, Beverages, Prepared Dishes & CookingAids. Major source of their revenue comes fromMilk products and nutrition which contributes 55%of their revenue. Since the company has lot of brand
power and brand appeal particularly in Milk prod-ucts and nutrition category, prepared dishes andcooking aids it is able to pass on increase in pricesto its customer effectively. Regression analysissuggests that for 1% rise in inflation would notresult in any loss of revenue. Revenue remainspretty much stable with marginal increase of 7 crore.
Year Dec Mar 13 -14
Mar Jun 14
Jun Sep 14
Sep Dec 14
Dec Mar 14 - 15
Mar Jun 15
Jun Sept 15
Sept - Dec 15
Dec - Mar 15 - 16
Mar--Jun 15-16
Jun 16 - Sept 16
Revenue 2313.46 2418.91 2557.8 2516.1 2506.79 1,933.84 1,736.20 1,946.44 2,256.09 2,346.18 2,261.28 Inflation (All Com) 0.3348% 1.5573% 1.3143% -2.8108% -2.0578% 1.4196% -1.1198% -0.4530% -1.5784% 4.2383% 0.4396%
B] Power Sector -
1. Torrent Power -The company is present in power transmission,distribution and generation. The installed genera-
tion capacity of the company is 3125MW which isa mix of coal and gas based power plants. It is alsopresent in renewable energy generation with in-stalled capacity of 182MW.Company also has atransmission network of 232km and distributes

79
IMPACT OF INFLATION ON FMCG POWER AND INFRASTRUCTURE SECTOR
electricity in areas such as Bhiwandi, Ahmedabad,Surat ,Gandhinagar. Power tariffs in India are regu-lated by CERC which revises its tariff from time totime so any change in WPI inflation does haveimpact on revenue unless the tariffs are revised.
Regression findings suggest that 1% change ininflation will not affect the revenue drastically.Revenue increase for 1% change in inflation is16.29 crores which may be due to tariffs revision
Year Dec Mar 13 -14
Mar Jun 14
Jun Sep 14
Sep Dec 14
Dec Mar 14 - 15
Mar Jun 15
Jun Sept 15
Sept - Dec 15
Dec15 - Mar 16
Mar-16-Jun 16
Jun 16 - Sept 16
Revenue 2126.31 2492.9 2592.47 2449.5 2304.35 2,908.31 3,043.24 2,803.81 2,417.60 2,521.39 2,626.14
Inflation (All Com)
0.3348% 1.5573% 1.3143% -2.8108% -2.0578% 1.4196% -1.1198% -0.4530% -1.5784% 4.2383% 0.4396%
2. Tata power-The company is in mining, shipping and logistics,generation, transmission, distribution business.The total installed generation capacity is 8521 MWout of which 7647MW is the installed capacity ofthermal power plant. It has a 1200km of doublecircuit transmission lines.
The company distributes power in major metrocities such as Mumbai and Delhi.
It has 0.4 million customers in Mumbai and 1.2million customers in Delhi.
Power tariffs in India are regulated by CERC whichrevises its tariff from time to time so any change inWPI inflation does have impact on revenue unlessthe tariffs are revised.
Regression analysis suggest that 1% rise in infla-tion will result in loss of revenue of 31.6 crore.
Volume IX Issue (1) March 2018 Chetana’s R.K.I.M.R. ISSN – 0976-2000

IMPACT OF INFLATION ON FMCG POWER AND INFRASTRUCTURE SECTOR
80
Year Dec Mar 13 -14
Mar Jun 14
Jun Sep 14
Sep Dec 14
Dec Mar 14 - 15
Mar-Jun 15
Jun- Sept 15
Sept - Dec 15
Dec15 - Mar 16
Mar-16-Jun 16
Jun 16 - Sept 16
Revenue 1602 2169 1896 1908 1865 1,771 1,814 1,769 2,016 1,501 1,330
Inflation (All Com)
0.3348% 1.5573% 1.3143% -2.8108% -2.0578% 1.4196% -1.1198% -0.4530% -1.5784% 4.2383% 0.4396%
C] Infrastructure Sector:
1. Larsen & ToubroLarsen & Toubro is a major technology, engineer-ing, construction, manufacturing and financial ser-vices conglomerate, with global operations. L&Taddresses critical needs in key sectors - Hydrocar-bon, Infrastructure, Power, Process Industries and
Defense. The company operates in a very capitalintensive sector and inflation changes are bound toaffect this company.
Regression findings suggest that 1% rise in infla-tion will cause a loss of revenue of around 247crores for the company.
Volume IX Issue (1) March 2018 Chetana’s R.K.I.M.R. ISSN – 0976-2000

81
IMPACT OF INFLATION ON FMCG POWER AND INFRASTRUCTURE SECTOR
Year Dec Mar 13 -14
Mar Jun 14
Jun Sep 14
Sep Dec 14
Dec Mar 14 -15
Mar Jun 15
Jun Sep 15
Sep - Dec 15
Dec Mar 15-16
Mar-Jun 16
Jun- Sept 16
Revenue 20079.1 10337.62 12716.84
14995.02 18967.92 11299.3
1 14125.91
15732.77 20840.74 11972.7
1 14589.44
Inflation fluctuation (All Com)
0.33% 1.56% 1.31% -2.81% -2.06% 1.42% -1.12% -0.45% -1.58% 4.24% 0.44%
2. GMR Infrastructure
The GMR group is in the business of airports, trans-portation and urban infrastructure.GMR infra operates Airports
Indira Gandhi International Airport, Delhi Rajiv Gandhi International Airport, Hyderabad Mactan Cebu International Airport, Philippines
Almost 50% of the total revenue of the companycomes from Airport business and remaining fromenergy 45% and roads.
Since Airports business works on Build Operateand Transfer model quarterly fluctuation in infla-tion are least likely to affect it also power tariffs inIndia are regulated by CERC which revises its tar-iff from time to time so any change in WPI infla-tion does have impact on revenue unless the tariffsare revised.
Regression findings suggest that 1% rise inflationwill increase the revenue of the company margin-ally by 7 lakhs.
Year Dec Mar 13 -14
Mar Jun 14
Jun Sep 14
Sep Dec 14
Dec Mar 14 -15
Mar Jun 15
Jun Sep 15
Sep - Dec 15
Dec Mar 15-16
Mar-Jun 16
Jun- Sept 16
Revenue ( Crs ) 139.8 68.56 19.68 30.18 46.47 16.25 24.99 24.42 112.35 67.98 62.23 Inflation fluctuation (All Com) 0.33% 1.56% 1.31% -2.81% -2.06% 1.42% -1.12% -0.45% -1.58% 4.24% 0.44%
Volume IX Issue (1) March 2018 Chetana’s R.K.I.M.R. ISSN – 0976-2000
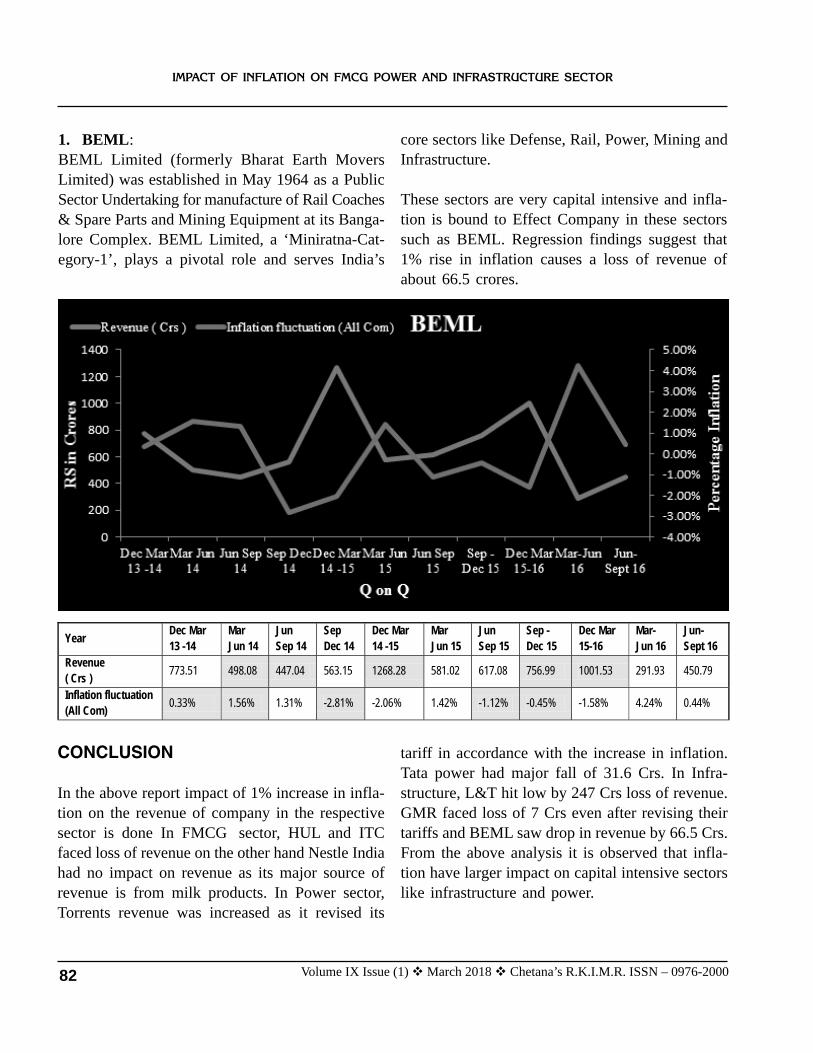
IMPACT OF INFLATION ON FMCG POWER AND INFRASTRUCTURE SECTOR
82
1. BEML:BEML Limited (formerly Bharat Earth MoversLimited) was established in May 1964 as a PublicSector Undertaking for manufacture of Rail Coaches& Spare Parts and Mining Equipment at its Banga-lore Complex. BEML Limited, a ‘Miniratna-Cat-egory-1’, plays a pivotal role and serves India’s
core sectors like Defense, Rail, Power, Mining andInfrastructure.
These sectors are very capital intensive and infla-tion is bound to Effect Company in these sectorssuch as BEML. Regression findings suggest that1% rise in inflation causes a loss of revenue ofabout 66.5 crores.
Year Dec Mar 13 -14
Mar Jun 14
Jun Sep 14
Sep Dec 14
Dec Mar 14 -15
Mar Jun 15
Jun Sep 15
Sep - Dec 15
Dec Mar 15-16
Mar-Jun 16
Jun- Sept 16
Revenue ( Crs ) 773.51 498.08 447.04 563.15 1268.28 581.02 617.08 756.99 1001.53 291.93 450.79
Inflation fluctuation (All Com) 0.33% 1.56% 1.31% -2.81% -2.06% 1.42% -1.12% -0.45% -1.58% 4.24% 0.44%
CONCLUSION
In the above report impact of 1% increase in infla-tion on the revenue of company in the respectivesector is done In FMCG sector, HUL and ITCfaced loss of revenue on the other hand Nestle Indiahad no impact on revenue as its major source ofrevenue is from milk products. In Power sector,Torrents revenue was increased as it revised its
tariff in accordance with the increase in inflation.Tata power had major fall of 31.6 Crs. In Infra-structure, L&T hit low by 247 Crs loss of revenue.GMR faced loss of 7 Crs even after revising theirtariffs and BEML saw drop in revenue by 66.5 Crs.From the above analysis it is observed that infla-tion have larger impact on capital intensive sectorslike infrastructure and power.
Volume IX Issue (1) March 2018 Chetana’s R.K.I.M.R. ISSN – 0976-2000

83
IMPACT OF INFLATION ON FMCG POWER AND INFRASTRUCTURE SECTOR
REFERENCES
1. https://www.rbi.org.in/scripts/BS_ViewBulletin.aspx
2. https://repository.up.ac.za
3. Capital Line
4. https://m.rbi.org.in//scripts/BS_ViewBulletin.aspx?Id=17448
5. https://www.nestle.in/investors/stockandfinan-cials/annualreports
6. https://www.hul.co.in/investor-relations/annual-reports/
7. https://www.tatapower.com/businesses/maithon/financials-annual-results.aspx
8. www.torrentpower.com/index.php/investors/financial?fy=2016-17
A VERY INTERESTING MANAGEMENT LESSONCHANGE THE LIFE
A father left 17 ducks as asset for his Three Sons. When the Father passed away, his sons openedup the will.
The Will of the Father stated that the Eldest son should get Half of 17 ducks,
The Middle Son should be given 1/3rd of 17 ducks,
Youngest Son should be given 1/9th of the 17 ducks.
As it is not possible to divide 17 into half or 17 by 3 or 17 by 9, the sons started to fight with eachother. So, they decided to go to a wise man who lives in a cave.
The wise man listened patiently about the Will. The wise man, after giving this thought, brought oneduck of his own & added the same to 17. That increased the total to 18 ducks. Now, he startedreading the deceased father’s will.
Half of 18 = 9.So he gave 9 ducks to the eldest son.
1/3rd of 18 = 6.So he gave 6 ducks to the middle son.
1/9th of 18 = 2.So he gave 2 ducks to the youngest son.
Now add this up :9 + 6 + 2 = 17This leaves 1 duck which the wise man took back.
MORAL: The attitude of negotiation & problem solving is to find the 18th duck i.e. the commonground. Once a person is able to find the common ground, the issue is resolved. It is difficult attimes.
However, to reach a solution, the first step is to believe that there is a solution. If we think that thereis no solution, we won’t be able to reach any.
Volume IX Issue (1) March 2018 Chetana’s R.K.I.M.R. ISSN – 0976-2000

TALENT ACQUISITION IN INSURANCE SECTOR
84
* Ashwini Ajgaonkar
* Ashwini Ajgaonkar, Student, MMS – Batch 2016 -18, CRKIMR
ISSN – 0976-2000 Vol IX Issue (1) (2018) : pp 84 - 91Chetana’s
Volume IX Issue (1) March 2018 Chetana’s R.K. Institute of Management and Research
Talent Acquisition in Insurance Sector
AbstractTalent acquisition and recruiting are undergoing rapid disruption. It is rightly said that “Change is the onlyCONSTANT thing in the world”, rightly so human beings or rather HUMAN RESOURCES are continuouslyevolving with respect to time. Employees of the organization are termed as Talent’s and every organization ishaving a deep urge to acquire the best of the best talents for their organization .With the emergence of newtrends and the introduction of new tools, the talent acquisition process is dynamically evolving. Talent acqui-sition has emerged as a key business imperative for organization for its role in sourcing the right talent toensure long term growth. This paper is about the study of Talent Acquisition process; and also about under-standing the Recruitment & Selection process and giving suitable recommendations to the company to stream-line the hiring process.
Keywords: Talent Acquisition, Recruiting, Hiring, Selection
INTRODUCTION
Talent in general terms refers to the capabilities,skills or the art, a person possess in a particularfield. It also refers to those people who have highpotential, scarce knowledge and skill or who cansuccessfully bring about transformation and changein the organization. Talent management refers tothe process of developing and integrating newworkers, developing and retaining current workers,and attracting highly skilled workers to work for acompany. Talent Acquisition takes a long-term viewof not only filling positions today, but also using
the candidates that come out of recruiting cam-paign as a means to fill similar positions in thefuture. Talent Acquisition involves all the sub pro-cesses around finding, attracting and engaginghighly talented individuals into your organization.The talent acquisition team within a company isresponsible for finding, acquiring, assessing, andhiring candidates to fill roles that are required tomeet company goals and fill project requirements.In today’s talent-hungry market scenario, one ofthe greatest challenges that organizations are fac-ing is to successfully attract, assess, train and re-tain talented employees. Talent Management en-

85
TALENT ACQUISITION IN INSURANCE SECTOR
Volume IX Issue (1) March 2018 Chetana’s R.K.I.M.R. ISSN – 0976-2000
compasses in itself the entire process of Planning,Recruiting, Developing, Managing, and Compen-sating employees throughout the organization. Or-ganizations have realized the need for talent man-agement and are now focusing to develop and re-tain the existing talent in their organization ratherthan trying to acquire a new talent because the costof identifying, developing and retaining the talentinternally is more cost effective instead of replac-ing the talent which is lost from external market.Every business unit is making sure that they canrespond and withstand the challenges of talent cri-sis by developing an effective talent managementstrategy like identifying the key talented people inthe organization, cultivating and developing the skillof their present workforce and retaining highly tal-ented employees by protecting them from competi-tors.
REVIEW OF LITERATURE
From the late 2000s, there was lot of research pro-ceedings which spoke on the challenges of TalentAcquisition. Dramatic shifts in the distribution,availability and nature of talent are taking placearound the world. Boldly stated: in the Westerndemocracies, workforce skills and skilled workersare in increasingly short supply. Conversely, in India,China, Korea and other Asian countries, there is anenormous and growing supply of workforce-readypeople, despite these gains in Asia, however, jobsacross all industries are becoming more complex,demanding ever-higher skill levels and pushing upthe demand for skilled workers.
Five- and 10-year strategic plans have to take intoaccount not only where the talent is now, but whereit will be in the future. Which countries have thestrongest pipeline of talent? What will change? Andwhat impact will it have on strategic planning for
the medium term? was the questions raised byFinancial Executive article written by Michele CHeid.
Srivastava and Bhatnagar in their case study ofMotorola in India, highlighted the impact of duediligence in talent acquisition which is the mostcrucial problem faced by the organizations in thepresent times. The practices which are usedinnovatively by one company become table stakessoon as they are followed by more or less impor-tant for the organizations to keep their own goalsand culture in mind, based upon which they shoulddesign their recruitment strategies. One strategy doesnot support every organization. Innovative ideas,strong execution, and a foundation of clear metricscan enable many more talent management profes-sionals to create a talent mindset that will preparetheir organizations to face the challenges ahead.Thiswas the conclusion of the team of researchers fromHewitt Associates in association with Human Capi-tal Institute who conducted Talent Practices ImpactSurvey in 2008.
Equally in late 2000s, papers indicating the trendsof Talent Acquisition and the cost factor and itsROI also started getting published which clearlyindicated that Talent Acquisition is becoming a verysizzling topic for research and discussion.
Taleo research, which is the talent managementresearch division of Taleo, provided the overviewof the cost related to the Talent Acquisition and theopportunities for cost reduction and improved cor-porate performance. Their comprehensive analysisof Talent Acquisition ROI revealed hidden costsand broad economic impact, as well as fresh op-portunities for improvement and better returns fromthe corporate workforce. broad economic impact,as well as fresh opportunities for improvement and

TALENT ACQUISITION IN INSURANCE SECTOR
86 Volume IX Issue (1) March 2018 Chetana’s R.K.I.M.R. ISSN – 0976-2000
better return from the corporate workforce.
Webster Buchanan Research did a detailed analy-sis on the changing dynamics of Talent Acquisi-tion. The research gave an insight on recruitmenttrends, marketing strategies and emerging softwareand services for HR Analytics. As recruitment strat-egies and tactics shift to meet today’s talent acqui-sition demands, so the metrics that high-perform-ing organisations use to monitor their recruitmentperformance are also evolving. The key operationalmetrics that have long been the staple diet of HRreporting remain unchanged. HR will continue toreport on statutory requirements such as workforcediversity, and efficiency metrics such as the num-ber of outstanding vacancies or days to hire.
At the same, however, there’s a growing need toshift away from measuring HR’s internal workingstowards a more business-focused stance, one whereeffectiveness is as important as efficiency. If days-to-hire is HR efficiency metric, for example, re-cruitment effectiveness might be measured in termsof the quality of people hired. Similarly, days-to-hire averages might be broken down by their busi-ness impact.
If the average hire is 70 days but it takes 180 daysto fill a senior position in sales that suggests re-cruitment resource could be better targeted.
Therefore, with so many HRM challenges, recruit-ment and selection of qualified employees hasbecome a very critical HRM function. The resource-based view (RBV) therefore becomes an integralpart in interpreting how talent acquisition can be-come a sustainable competitive advantage.
Thus Ms. Pramila Rao, in her paper titled ¯A re-source based analysis of recruitment and selection
practices of Indian Software companies conducteda qualitative study of 5 leading software firms ofIndia and concluded that Indian corporate housesneed to be aware of management practices in thechanging economies and need to identify how tomake their transitions smoother.
Marcom HR say-Second Survey on Talent Acqui-sition Challenges for 2011 highlighted that Assess-ing Leadership skill, Accurate Candidate to Jobmatching skills, assessing job skills are the 3 topmost challenges of Talent acquisition in 2011.Negotiating competitive offers was not seen thatmuch challenging as most of the companies wereready to offer an attractive package for the righttalent.
From 2011, the researchers focus shifted from thechallenges to the strategies and techniques of Tal-ent Acquisition. The starting point for a talent ac-quisition strategy is company’s business strategy. Ifcompany’s goals include cutting costs, then talentacquisition strategy should seek ways to cut agencyspend, change or renegotiate terms with vendors,increase recruiter productivity, reduce attrition, orother apply other cost saving strategies.
If the company’s goals are to bring in fresh ideas,strategy should seek ways to mitigate the brain-drain of retiring employees, on-campus recruitment,and begin networking within the world of that newtalent. If the goals are to add a new product line,talent acquisition strategy should include aworkforce plan that draws from competitive intel-ligence related to talent availability. It should de-velop sourcing capabilities in functional areas thatalign with the new product, and it should pipelinecandidates to reduce the time to hire. These arepractical examples of what it means to align talentacquisition strategy to corporate strategy.

87
TALENT ACQUISITION IN INSURANCE SECTOR
Volume IX Issue (1) March 2018 Chetana’s R.K.I.M.R. ISSN – 0976-2000
RESEARCH METHODOLOGY
This study is Descriptive in nature. It aims at cast-ing light on current issues and problems through aprocess of data collection that enables them todescribe the situation more completely. The data iscollected from the secondary sources through jour-nals, magazines and web sites.
OBJECTIVES OF STUDY
To understand the Internal Recruitment processof an Insurance sector
To identify the areas where there can be a scopefor improvement
To give suitable recommendations to streamlinethe Hiring Process
TALENT ACQUISITION PROCESS
DIFFERENCE BETWEEN RECRUITMENTAND TALENT ACQUISITION
According to Vinod Rai, Head-HR (Supply chainand vendors), Maruti Suzuki,
Talent Acquisition is a process that involves proac-
tive planning for the future, to avoid talent sur-pluses or shortages.”
“Recruitment is all about filling up job vacanciesas and when they occur. It is an ongoing process.According to Unmesh Rai, group head-talent ac-quisition, Piramal Enterprises,

TALENT ACQUISITION IN INSURANCE SECTOR
88 Volume IX Issue (1) March 2018 Chetana’s R.K.I.M.R. ISSN – 0976-2000
“Talent Acquisition assumes adequate pre planning,presumes that employers will invest in articulatingan employee value proposition, carefully identifiestalent niche and develops deep sourcing capabili-ties.”
“Recruitment can be linear and re-active. More oftenthan not, the pressure it creates can lead to impli-cations on cost and quality.
Talent Acquisition is a part of broader strategicapproach in the quest to gain and sustain a com-petitive advantage. Other aspects include talentdevelopment and retention which are primarilyinward facing, whilst the former is outward look-ing.
Recruitment or “vanilla recruitment” occurs whena vacancy arises when an individual resigns orretires or promoted. Panic sets in, if no suitableinternal candidate is found. The organization re-cruit under pressure. Compromised are made “un-der the bus syndrome”
Talent Acquisition is to get away from the “fill inthe box” thinking to one that is more pro-activeand much closer to building the skill sets requiredto achieve success.
Traditional recruitment is filling open positions.
Talent Acquisition takes a long-term view of notonly filling positions of today, but also identifytalents for future openings. These future positionsmay be identifiable by looking at the successionmanagement plan or by analyzing the attrition.
In highly advanced talent acquisition process, or-ganizations recruit today for positions that do noteven exist today but are expected to become avail-
able in the future.
NEED OF TALENT ACQUISITION ININSURANCE SECTOR
With over 2.5 million people now working in theinsurance industry, finding great talent is extremelydifficult. Employers recruiting insurance talent,experiences various challenges. The success of anyinsurance company largely depends on efficienthuman resource management, apart from operations,marketing and sales.
The hiring process is time consuming. Once youfound the person you wanted to hire, actually mak-ing the offer and getting an acceptance could takeanywhere from 3 weeks to 2 months. Many com-panies lose the candidate and they feel that theirhands are tied to make this process smoother. Themain roadblocks are full background checks, refer-ence checking, sign offs by multiple hiring manag-ers, assessment testing, multiple interviews (keepbringing the person back to meet multiple people)and delays in putting together compensation pack-ages that have an approval process. The TalentAcquisition manager have a tough time beingcompetitive, if the candidate doesn’t fit in thesalary grade of the company. This is not a newissue for insurance companies. What is new is thefact that many of our competitors are taking a se-rious look at this issue and “changing” the oldschool way of thinking. No, the salary grades arethe salary grades but what we have been told is the“years’ experience” rule being thrown out and re-ally valuing a candidate on what they bring to thetable. Also, Insurance sales jobs are hard to fill.Finding experienced or entry level insurance salesprofessionals is challenging and there is no “silverbullet” resource that can provide enough qualityhires. Insurance employers really have to be very

89
TALENT ACQUISITION IN INSURANCE SECTOR
strategic with their recruiting and hiring process tostay competitive.
Emergence of new private sector insurance compa-nies, competition and self-regulation has necessi-tated efficient talent acquisition process in insur-
ance companies. There are many changes in theinsurance sector on account of changes in the in-dustry due to the entry of new insurance compa-nies. Therefore, it has become a necessity to re-cruit, train people at all level efficiently, for betterperformance and success.
ROLES & RESPONSIBILTIES OF HR MANAGER IN INSURANCE SECTOR-WITHREFERENCE TO TALENT ACQUISITION
i. Proper Planning- Through planning, manage-ment strives to have the right number and rightkind of people at right places, at right time. Thiswill result in both the organization and the indi-vidual receiving maximum long-run benefits.He needs to determine the number of employ-ees to be employed at a new location, retainingthe highly skilled staff.
ii. Organizing resources- To be sure that appropri-
ate employees are hired. Also, to ensure that theemployees have the necessary skills for theworkplace.
iii. Job Analysis- A process to identify and deter-mine in detail the particular job duties and re-quirements. He can conduct job analysis throughinterviews with the supervisors, questionnaires,observations.
Volume IX Issue (1) March 2018 Chetana’s R.K.I.M.R. ISSN – 0976-2000

TALENT ACQUISITION IN INSURANCE SECTOR
90
iv. Recruitment- He has to determine the presentand future requirements of the people in an or-ganization. Also, to increase the pool of the can-didates at minimum cost, and search for talentglobally and not just within the company.
v. Selection- The purpose of selection is to pickup the most suitable candidate who would meetthe requirements of the job in an organization,to find out which job applicant will be success-ful, if hired.
vi. Induction- It involves familiarizing the new em-ployees with the company, the work environ-ment and existing employee’s so that the newpeople feel at home.
vii. Training- HR Manager is responsible to plan,organize and direct wide range of training ac-tivities. It will help the employees to maintainand improve their job skills and prepare for jobsrequiring greater skills.
viii. Compensation- It involves fair and equitableremuneration to employees for their contribu-tion to the attainment of organizational objec-tives. Also, the financial returns and tangibleservices and benefits employees receive as partof an employment relationship.
OBSERVATIONS AND COMMENTS
Maximum candidates in the insurance sector ap-plying for the profile of sales are males. The age-group ranges from 23-30yrs. The time frame be-tween the final interview and offer letter process-ing was more than 2 weeks; hence it should belesser than two weeks so that the candidates don’tleave the organization. It is being observed that theoffer letter processing is currently centralized inmost of the insurance companies, it should be de-
centralized i.e. the Talent Acquisition manager cando offer letter processing for Junior, Executive level,so that the offer letter processing can be done fastand the candidates don’t have to wait for long time.Because of centralized offer letter processing forall grades, there is a delay in the offer letter pro-cessing. It should be de-centralized to avoid delay.The candidate should be given a good experienceon onboarding should be provided with welcomekits on the date of joining.
Also, the vacancies approval should be properlysent to the HR department via emails by the re-spective hiring managers.
CONCLUSION:With the appearance of new trends and the openingof new tools, the talent acquisition process is con-tinuously evolving. Its future sits on technologyand third parties like consulting practices, searchfirms, recruitment process outsourcing, and more.We anticipate more aspect of talent acquisition tobe automated and outsourced in the coming future.Some of the functions that will be out sourced mayinclude payroll. We also see a trend for talent ac-quisition managers to take on more responsibilityfor the actual supervision and development of theiremployees besides their traditional role to help outemployees with the overall interpretation of HRpolicy.
Talent acquisition has emerged as a key businessimperative for organizations for its role in sourcingthe right talent to ensure long term growth. It isnow a long-term strategy for organizations and HRfunctions for their role in driving the overall cor-porate success and profitability of the organizations.Talent acquisition and talent retention are like thetwo sides of a same coin that are critical in the
Volume IX Issue (1) March 2018 Chetana’s R.K.I.M.R. ISSN – 0976-2000

91
TALENT ACQUISITION IN INSURANCE SECTOR
human capital management. Innovative technolo-gies are to be adopted to enhance the process oftalent management. Talent Acquisition can be un-derstood strategically through succession planningthat helps in identifying the key leaders and devel-oping them for future. With the dynamic situationprevailing in the global employability status, therole of human resource managers is very importantin maintaining the talent balance.
REFERENCES
1. https://www.linkedin.com/pulse/strategic-talent-acquisition-challenges-2015-india-abhay-sawant
2. http://talent.linkedin.com/blog/index.php/2013/06/top-u-s-talent-acquisition-trends-for-2013
3. http://hrkatha.com/
4. http://home.bersin.com/
5. https://www.recruiter.com/i/talent-acquisition/
6. https://www.peoplematters.in/article/talent-ac-quisition/the-state-of-talent-acquisition-in-india-14582?utm_source=peoplematters&utm_medium=interstitial&utm_campaign=learnings-of-the-day
7. https://www.centerfortalentreporting.org/talent-acquisition/
8. http://www.furstperson.com/blog/improve-your-talent-acquisition-process
9. https://en.wikipedia.org/wiki/Recruitment
10. https://hr.ucr.edu/recruitment/guidelines/process.html
11. http://www.yourarticlelibrary.com/recruitment/recruitment-process-5-steps-involved-in-recruit-ment-process-with-diagram/35261/
Indian Insurance Market
Market Opportunities: Other Than Life Insurance
1. Crop Insurance Markets
2. Micro Insurance Markets
3. Health Insurance Markets
4. Motor Insurance Markets
5. Low-Income Urban and Pension Markets
Volume IX Issue (1) March 2018 Chetana’s R.K.I.M.R. ISSN – 0976-2000

IGNITOR - THE NEW PRODUCT IN MARKET BY ARC MOTORS
92
* Tejas Narayan Patel
* Tejas Narayan Patel, Student, Mumbai University
ISSN – 0976-2000 Vol IX Issue (1) (2018) : pp 92 - 96Chetana’s
Volume IX Issue (1) March 2018 Chetana’s R.K. Institute of Management and Research
IGNITOR - The New product in market by Arc Motors
AbstractArc Motors is one of the most oldest and iconic two wheeler brand all over the world. This case is all aboutevents that happened during pre and post launch of their new product “IGNITOR 500”.
BACKGROUND
Arc Motors was formed in the year 1948 in India.It was bought to India by very well known Indianbusiness man “Jaypee Singh”. Originally it wasformed in 1902 as Arc engine factory by few germanengineers, at a small town in Germany. From manu-facturing single cylinder engine bikes to manufac-turing engines for various applications, this com-pany has travelled a long successful journey.
Arc motors portfolio consists of 25 successful bikesin 7 decades with multiple variants, all bikes be-long to a engine displacement range of 300 cc to999 cc. Arc motors specializes in cruiser bikes andis well known for one of the best engines and gearbox transmission systems. After dominating cruisersegment for more than 6 decades company CEOR.D. Singh and his team has decided to enter anew adventure tourer segment. There were manyevents that took place before and after the launchof new product IGNITOR 500 which are discussedfurther.
Industry overview:India is one of the country which is largest in termsof two wheeler manufacturing. Indian two wheelerindustry is well positioned economically as well asdemographically for consistent growth since 5 de-cades. An growth in working age population hascaused wider opportunities for two wheeler brandsdomestic as well as international. New entrants indomestic market and new product launches hassurged to increase in technology development , salesand volume production.
Marketers provide a wide range of products andservices choices to meet diverse consumer needs,consumers are much satisfied and their overallsatisfaction and quality of life are ultimately en-hanced. Hence market segmentation is a positiveforce for both consumers and marketers alike.
There are 3 major segments in two wheelers : Pre-mium segment, executive and economic segment.Out of theses 3 segments executive segment con-tributes maximum 60%, economic 22% and pre-

93
IGNITOR - THE NEW PRODUCT IN MARKET BY ARC MOTORS
Volume IX Issue (1) March 2018 Chetana’s R.K.I.M.R. ISSN – 0976-2000
mium 18%. refer figure 1.
Figure 1: Segment contribution
Indian two wheeler industry is now attracting for-eign two wheeler brands to enter the market as ithas a wide scope for new economic as well aspremium products. In past 2 decades there are nnumber of international two wheeler brands whichhas entered India and has been tremendously suc-cessful . Due to immense development in technol-ogy two wheelers are becoming more effective andefficient, there improving the mode of communica-tion.
About Arc motor company:Arc Motors is one of the oldest two wheeler brandin the world. Arc Motors Company was formed inthe year 1948 in India. Originally was founded bythe name Arc engine factory, Germany in 1902 .
Arc engine factory was started by few germanengineers, it all started with manufacturing singlecylinder engines, As the time passed, demand for
engines for various applications increased. Thiscaused Arc to venture in various applications en-gines. Arc engines were the finest engines made onearth due to its precision and performance. Brandwas well accepted by all over the world and it hadcreated its own performance benchmark.
Arc bikes were made of best quality iron and werestrong and powerful, Arc bikes had its own cruiserdesign which was much unique and attractive. Therewere very few models launched by this companybut all these models were unique. Arc ruled pre-mium bikes segment in european countries for 2decades. After 2 decades company started facingcompetition from other british, japanese and koreanbrands. Company was unable to sustain in thiscompetition due to lack of product development.Arc started facing losses in 2 wheeler business andit had no other options than to sell or shut.
By the end of 1947 company Arc founders decidedto sell of there two wheelers brand to and indianbusiness men Mr. Jaypee singh. Mr. Singh was into business of manufacturing gears, bearings andother industrial instruments. Mr. Singh’s was ownerof 16 motorcycles out of which 10 were Arc andthis show’s that his passion and love for bikescaused him to buy this company. In the year 1948Arc motors India was formed.
Arc motors portfolio consists of 21 successful bikesin 7 decades with multiple variants, all bikes be-long to a engine displacement range of 300cc to999 cc. Arc motors specializes in cruiser bikes andis well known for one of the best engines and gearbox transmission systems. Currently company ismanaged by Mr. R.D singh who is grand son ofJaypee Singh.
YEAR 2008 2009 2010 2011 2012 2013 2014 2015 SALES 56,021 62,538 75,098 85,475 89,546 150,694 240,750 356,055
Growth trend of Arc motor corporation:

IGNITOR - THE NEW PRODUCT IN MARKET BY ARC MOTORS
94 Volume IX Issue (1) March 2018 Chetana’s R.K.I.M.R. ISSN – 0976-2000
From figure 2. we can see that company has al-ways shown a positive growth due to its products,loyal services and unique marketing activities.
New product development:Arc motors consistently for 7 decades succeeded indomestic sales with their star products like RD 350,Tiger X 500, Thor 700, and the newest Street twin800. All these products were in the price range of1.6 lakhs to 6.5 lakhs.
The company has been successful in delivering bestcruiser bikes , and hence CEO R.D. Singh and themanagement team came to a decision to make aproduct specially for touring which can be used fordaily commute as well as for off road adventures.This segment in India was completely open for Arcas no other company had planned or entered be-fore.
Initially market was studied by the marketing teamand also by engineering team and they found thatthere had been many foriegn brand adventure tourerbikes in market but they were much expensive andthey were having a common design and features.
After 2 years of development, R & D team camewith a product named “IGNITOR”. It was a com-pletely different kind of bike as compared to all theother bikes in Arc’s portfolio till date.
IGNITOR was tested on all kinds of ways likebroken tarmac, sand, snow, wet roads, inclinedpaths, and even on the highest motor able road i.eHimalayas. CEO R.D. Singh was pretty much con-fident about his product as he himself had workedon and tested it multiple times. There were lot ofefforts, research, creativity had been put by hismanagement team, R&D team, production team.
Marketing Activities:Management team had came up with a set of stra-tegic steps which had to be executed in order tocreate awareness of product, which were as fol-lows
Prototype of IGNITOR was showcased at EICMA- Milan , MBE - Italy, Auto expo - Delhi, and manyother automobile events which created an interestand awareness among riders and automobile en-thusiasts.

95
IGNITOR - THE NEW PRODUCT IN MARKET BY ARC MOTORS
Volume IX Issue (1) March 2018 Chetana’s R.K.I.M.R. ISSN – 0976-2000
Before 30 days of the launch there were 30 sec-onds Audio visuals streamed on social media andtelevision which shown certain uniqueness of bikelike exhaust sound, off roading skills of bike andother adventures. Posters, hoardings, photos werealso used in order to create awareness.
At the launch CEO R.D Singh as well as manage-ment team were geared up as riders and came tothe event on IGNITOR. Most of the Motovloggersand automobile journalists were invited at the event.
IGNITOR was launched in Pune, India, on 21st
October, 2015 as it marked 67th anniversary of thecompany. IGNITOR being an adventure tourer hadan unique attractive design with a ground clear-ance of 200 mm. Having an engine displacementof 499 cc and a complete electric nature gave thisbike a unique identity.
Tough it was one of the lightest motorcycles(175Kgs) from Arc, but was well equipped with ad-vance digital console, ABS, 5 speed constant meshgearbox, and fuel injected engine. This bike hardlyhad any competitors in domestic market and henceit was launched at a price tag of 1.8 lakhs.
As company had already got 5 k + bookings beforelaunch, Hence deliveries started within two weeksof introduction. Bike had got good response fromall the automobile journalists, motovloggers, exist-ing ARC bike owners.
Product failure:Within 6 months of product use by domestic cus-tomers, around 20% of customers came with anegative feedback like the fuel injection system,engine oil leakages, unwanted vibrations, looselyfitted parts of bike, etc. A motovlogger during offroad test ride came across an unexpected accident
in which rear tyre was ripped of rim which causedhim a fracture and minor injuries.
Few customers who loved the bike initially, afterriding it for 10,000kms Onroad as well as offroad,came with an extreme dissatisfaction regardingfaults in engine and chasis fittings. All this causedthem to have a bad word of mouth about the prod-uct. All such kind of negative reviews about bikewere spreading like fire on social media. Suchnegative word of mouth caused a huge impact onpotential customers who were delaying their deci-sion to buy or were moving towards other brands,leading to decline in sales.
R.D Singh and management team was much un-happy with such response as this product was verymuch close to his heart. After having brief discus-sion, management came to a point that bikes shouldbe silently recalled and provided with services.
Following points were addressed by senior man-agement team to service stations allover India : Check crack in tyres and rims and replace tyres
if under warranty, Replace engine clutch system, Stop oil leakages from engine and other parts by
replacement or sealing, To have a complete test in order, not to have any
loosely fitted parts If any engine/exhaust/chassis changes or modi-
fication done in bike through external sources,then customer should not be entertained withabove points.
Above mentioned notice was forwarded to all theservice stations all over India with an command toimplement earliest.
Now it had been a 3 months as bikes were recalled

IGNITOR - THE NEW PRODUCT IN MARKET BY ARC MOTORS
96 Volume IX Issue (1) March 2018 Chetana’s R.K.I.M.R. ISSN – 0976-2000
and provided suitable services to bike and the cus-tomers had a moderate feedback about the bikes.
Though the problems mentioned above were solvedto certain extent by providing services. Even aftera 15 months of launch, new customers were com-ing up with the same problems in the bike. A cus-tomer was so annoyed with bike problems that hefiled a case against Arc motors India. Manage-ment was much worried as such events were im-pacting brand value and customers perception to-wards the brands loyalty.
The case writer is interested in getting answers toquestions:
What made company to come up with their newtype of product as they were already ace in mak-ing cruiser bikes? Was it the right decision, jus-tify?
Do you think that company had marketed theirproduct “IGNITOR” in well manner, if yes thenwhy and if no then suggest a marketing plan?
What reasons has caused failure of product?
What all actions company should had taken as itcame across multiple failures in bike ?
Top Five Digital Consumer Trends in 2018as per Euromonitor International
1. Digital life converges in super apps
2. Data as the new currency
3. Keeping the tab open
4. Mobile wallets going global
5. Outlets will get their tech injection

GUIDELINES TO AUTHORS
1) Quest: Journal of Management
2) The paper/article should be typed in MS-Word on A-4 size paper in double space with 1�⁄�”margin on the left side and 1/2” margin on the right side in New Times Roman Font in 12 pt font size.
3) The cover page of the paper must contain (a) Title of the article (b) Name(s) of author (s)(c) e-mail and affiliation of author (s). (d) An abstract of the paper in 100-150 words, (e) provide the title of the paper but it should not give the name of the author.
4) The paper/article should not exceed 15 typed pages including graphs/ tables/ appendices. The tables and figures should appear in the document near/after where they are refereed in the text. The paper/article should start with an introduction and should end with the conclusion summarizing the findings of the paper.
5) All notes must be serially numbered and may be given either at the end of the paper as notes or on every page as footnotes.
6) References should be complete and in Harvard style. They should contain full bibliographical details and journal titles should not be abbreviated. For multiple citations in the same year use a, b, c immediately following the year of publication. References should be shown within the text by giving the author's last name followed by comma and year of publication all in round brackets.
7) The first author of every published paper will be given one copy of the journal.
8) The views expressed in the articles are those of authors and do not represent the views of Chetana Management.
9) Every paper must be accompanied by a statement that the paper has not already been published nor submitted to any journal for publication.
10) All the papers/articles should be sent in electronic form.
The Editor,Journal of Management ResearchChenana's R. K. Institute of Management & Research,
Survey no. 341, Govt. Colony, Bandra (East) Mumbai 400 051, Maharashtra.
Tel.: (022)2651 3346 / 6643 Email: Website: [email protected] www.crkimr.in

Chetana’sRamprasad KhandelwalInstitute of Management & Research
Survey No. 341, Govt. Colony, Bandra (East), Mumbai - 400 051.
Tel.: (022)2651 3346 / 6643 | Email : [email protected] | Website : www.crkimr.in


![Sudhir Khandelwal Architectssudhirkhandelwal.com/NewsLetters.pdf · 13-7, Sector-2œ Noida India Z004-OS. Website. Email. . ]últhandelwa_l.com Alz.hitects E ARE PLEASED To ANNOUNCE](https://img.pdfslide.tips/doc/110x75/5f483f006fe8343e605bd744/sudhir-khandelwal-archit-13-7-sector-2-noida-india-z004-os-website-email-.jpg)