Embed Size (px)
Citation preview
7/31/2019 raportEduUEpe scurt
http://slidepdf.com/reader/full/raporteduuepe-scurt 1/8
1
Key Data on Education 2012
Developments in European education systems
over the last decade
Key Data on Education 2012 is a Eurydice flagship publication tracing the main developments of
European education systems over the last decade. The report combines statistical data withqualitative information to describe the organisation, management and functioning of 37 European
education systems from pre-primary to higher education.
The publication covers many of the priority areas for European cooperation in education and
training (ET 2020) and the broader European strategy for smart, sustainable and inclusive growth
over the coming decade (EU 2020). More specifically, the 95 indicators included in the report
address the following topics: Demographic Context, Educational Structures, Participation,
Resources, Teachers and Management staff , Educational Processes and Qualification Levels
and Transition to Employment .
In comparison to the previous edition, Key data on Education 2012 has been improved throughthe inclusion of longer time series, making it easier to identify specific developments affecting
aspects of education systems and to analyse the present situation in regard to the past.
Key Data on Education 2012 is a joint publication with Eurostat and based on data collected
through the National Units of the Eurydice Network, Eurostat, and the PISA 2009 international
survey. This leaflet provides a glance of some of the report's key findings.
What is Eurydice
The Eurydice Network provides information on and analyses of European education systems and
policies. As of 2011, it consists of 37 national units based in all 33 countries participating in the EU's
Lifelong Learning programme (EU Member States, EFTA countries, Croatia and Turkey) and is
coordinated and managed by the EU Education, Audiovisual and Culture Executive Agency in Brussels,
which drafts its publications and databases.
European Commission
7/31/2019 raportEduUEpe scurt
http://slidepdf.com/reader/full/raporteduuepe-scurt 2/8
2
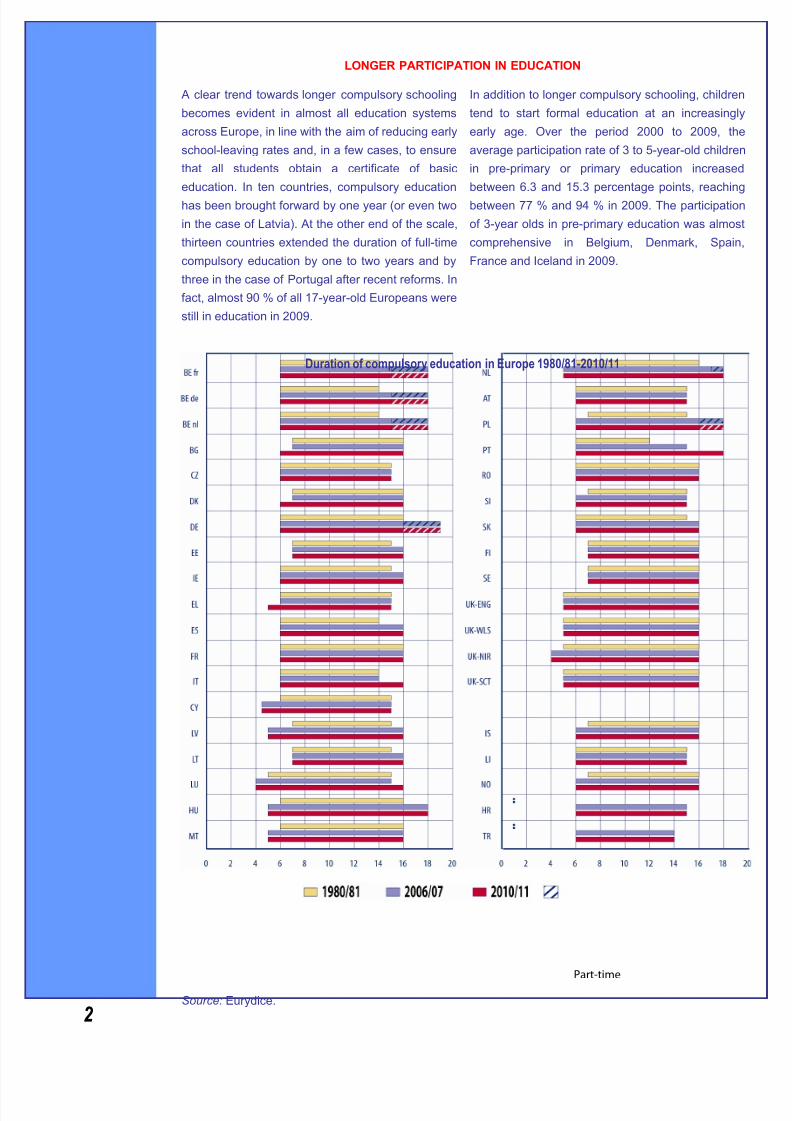
LONGER PARTICIPATION IN EDUCATION
A clear trend towards longer compulsory schooling
becomes evident in almost all education systems
across Europe, in line with the aim of reducing early
school-leaving rates and, in a few cases, to ensure
that all students obtain a certificate of basic
education. In ten countries, compulsory education
has been brought forward by one year (or even two
in the case of Latvia). At the other end of the scale,
thirteen countries extended the duration of full-time
compulsory education by one to two years and by
three in the case of Portugal after recent reforms. In
fact, almost 90 % of all 17-year-old Europeans were
still in education in 2009.
In addition to longer compulsory schooling, children
tend to start formal education at an increasingly
early age. Over the period 2000 to 2009, the
average participation rate of 3 to 5-year-old children
in pre-primary or primary education increased
between 6.3 and 15.3 percentage points, reaching
between 77 % and 94 % in 2009. The participation
of 3-year olds in pre-primary education was almost
comprehensive in Belgium, Denmark, Spain,
France and Iceland in 2009.
Duration of compulsory education in Europe 1980/81-2010/11
Part-time
Source: Eurydice.
7/31/2019 raportEduUEpe scurt
http://slidepdf.com/reader/full/raporteduuepe-scurt 3/8
3
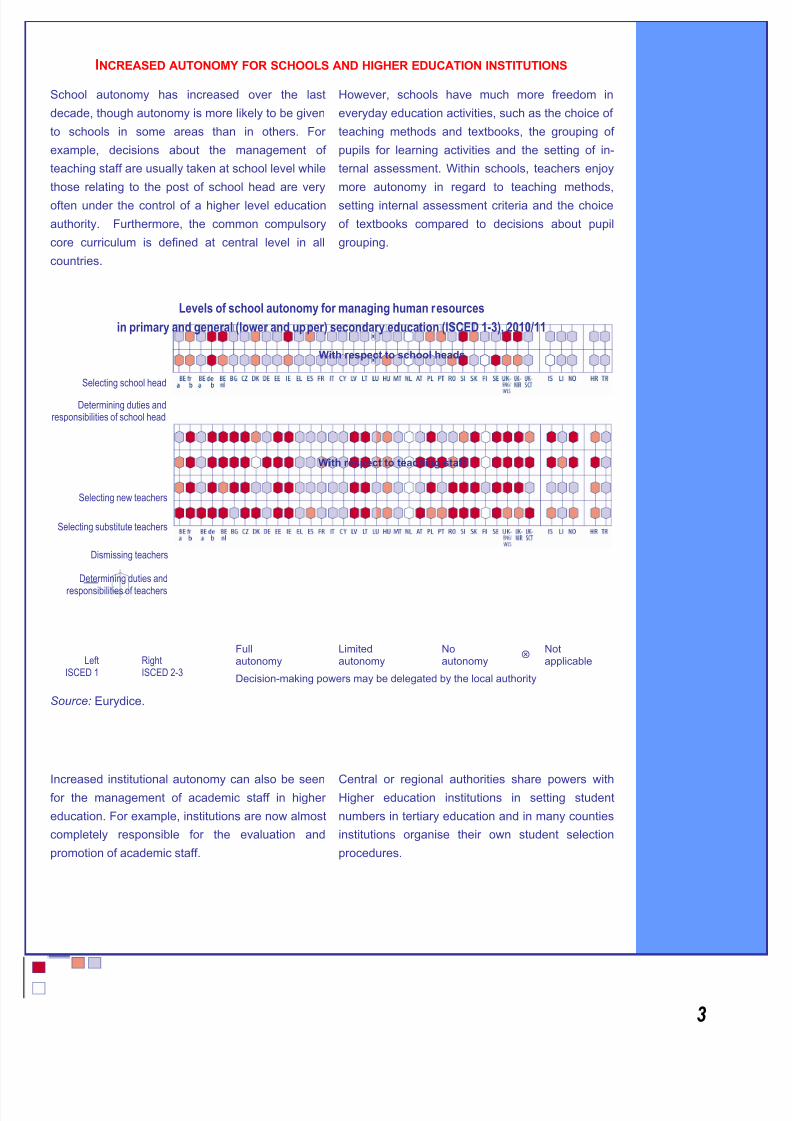
INCREASED AUTONOMY FOR SCHOOLS AND HIGHER EDUCATION INSTITUTIONS
School autonomy has increased over the last
decade, though autonomy is more likely to be given
to schools in some areas than in others. For
example, decisions about the management of
teaching staff are usually taken at school level while
those relating to the post of school head are very
often under the control of a higher level education
authority. Furthermore, the common compulsory
core curriculum is defined at central level in all
countries.
However, schools have much more freedom in
everyday education activities, such as the choice of
teaching methods and textbooks, the grouping of
pupils for learning activities and the setting of in-
ternal assessment. Within schools, teachers enjoy
more autonomy in regard to teaching methods,
setting internal assessment criteria and the choice
of textbooks compared to decisions about pupil
grouping.
Levels of school autonomy for managing human resources
in primary and general (lower and upper) secondary education (ISCED 1-3), 2010/11
With respect to school heads
Selecting school head
Determining duties andresponsibilities of school head
With respect to teaching staff
Selecting new teachers
Selecting substitute teachers
Dismissing teachers
Determining duties and
responsibilities of teachers
LeftISCED 1
RightISCED 2-3
Fullautonomy
Limitedautonomy
Noautonomy
Notapplicable
Decision-making powers may be delegated by the local authority
Source: Eurydice.
Increased institutional autonomy can also be seen
for the management of academic staff in higher
education. For example, institutions are now almost
completely responsible for the evaluation and
promotion of academic staff.
Central or regional authorities share powers with
Higher education institutions in setting student
numbers in tertiary education and in many counties
institutions organise their own student selection
procedures.
7/31/2019 raportEduUEpe scurt
http://slidepdf.com/reader/full/raporteduuepe-scurt 4/8
4
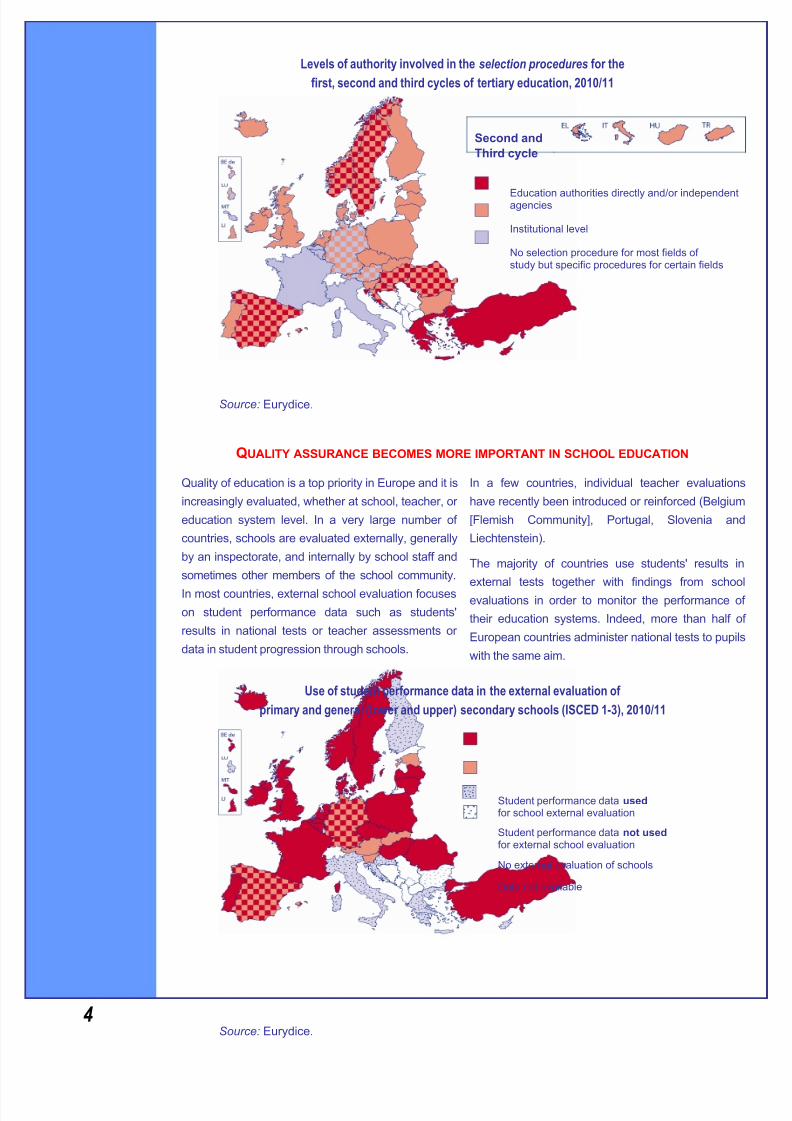
Levels of authority involved in the selection procedures for the
first, second and third cycles of tertiary education, 2010/11
Source: Eurydice.
QUALITY ASSURANCE BECOMES MORE IMPORTANT IN SCHOOL EDUCATION
Quality of education is a top priority in Europe and it is
increasingly evaluated, whether at school, teacher, or
education system level. In a very large number of
countries, schools are evaluated externally, generally
by an inspectorate, and internally by school staff and
sometimes other members of the school community.
In most countries, external school evaluation focuses
on student performance data such as students'
results in national tests or teacher assessments or
data in student progression through schools.
In a few countries, individual teacher evaluations
have recently been introduced or reinforced (Belgium
[Flemish Community], Portugal, Slovenia and
Liechtenstein).
The majority of countries use students' results in
external tests together with findings from school
evaluations in order to monitor the performance of
their education systems. Indeed, more than half of
European countries administer national tests to pupils
with the same aim.
Use of student performance data in the external evaluation of
primary and general (lower and upper) secondary schools (ISCED 1-3), 2010/11
Source: Eurydice.
Second and
Third cycle
Education authorities directly and/or independentagencies
Institutional level
No selection procedure for most fields of study but specific procedures for certain fields
Student performance data used for school external evaluation
Student performance data not used for external school evaluation
No external evaluation of schools
Data not available
7/31/2019 raportEduUEpe scurt
http://slidepdf.com/reader/full/raporteduuepe-scurt 5/8
5
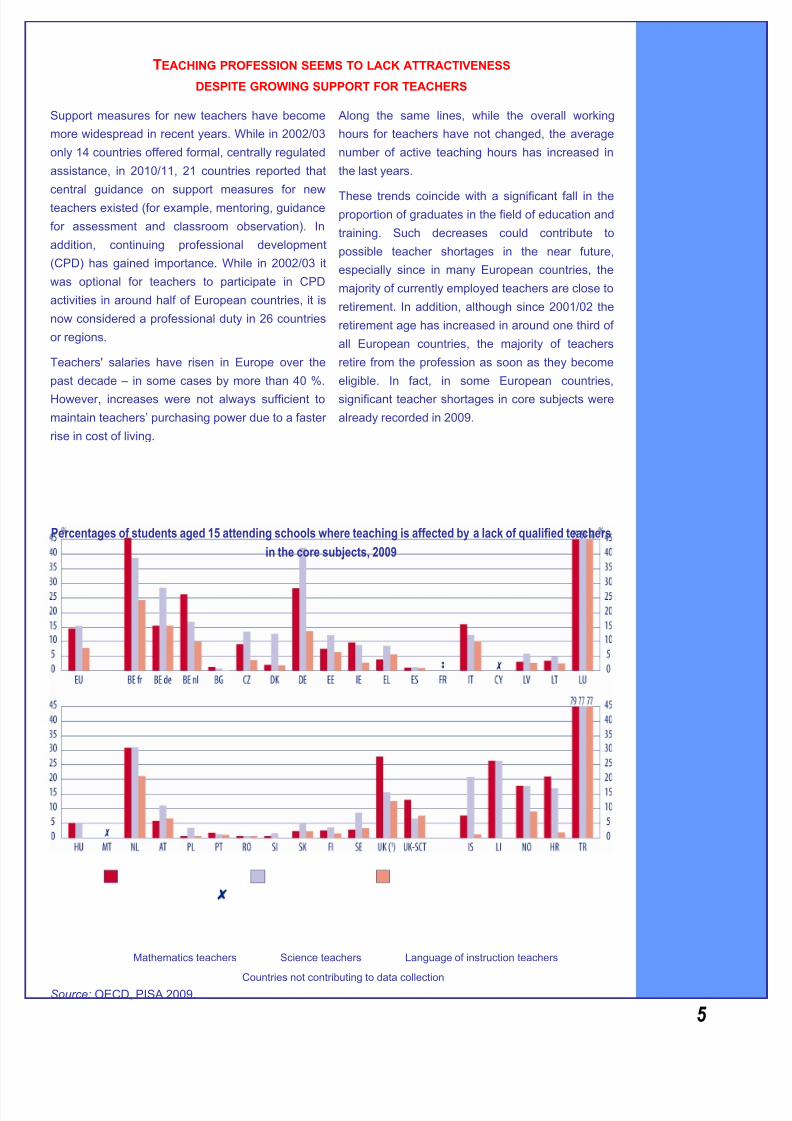
TEACHING PROFESSION SEEMS TO LACK ATTRACTIVENESS
DESPITE GROWING SUPPORT FOR TEACHERS
Support measures for new teachers have become
more widespread in recent years. While in 2002/03
only 14 countries offered formal, centrally regulated
assistance, in 2010/11, 21 countries reported that
central guidance on support measures for new
teachers existed (for example, mentoring, guidance
for assessment and classroom observation). In
addition, continuing professional development
(CPD) has gained importance. While in 2002/03 it
was optional for teachers to participate in CPD
activities in around half of European countries, it is
now considered a professional duty in 26 countries
or regions.
Teachers' salaries have risen in Europe over the
past decade – in some cases by more than 40 %.
However, increases were not always sufficient to
maintain teachers’ purchasing power due to a faster
rise in cost of living.
Along the same lines, while the overall working
hours for teachers have not changed, the average
number of active teaching hours has increased in
the last years.
These trends coincide with a significant fall in theproportion of graduates in the field of education and
training. Such decreases could contribute to
possible teacher shortages in the near future,
especially since in many European countries, the
majority of currently employed teachers are close to
retirement. In addition, although since 2001/02 the
retirement age has increased in around one third of
all European countries, the majority of teachers
retire from the profession as soon as they become
eligible. In fact, in some European countries,
significant teacher shortages in core subjects were
already recorded in 2009.
Percentages of students aged 15 attending schools where teaching is affected by a lack of qualified teachers
in the core subjects, 2009
Mathematics teachers Science teachers Language of instruction teachers
Countries not contributing to data collectionSource: OECD, PISA 2009.
7/31/2019 raportEduUEpe scurt
http://slidepdf.com/reader/full/raporteduuepe-scurt 6/8
6
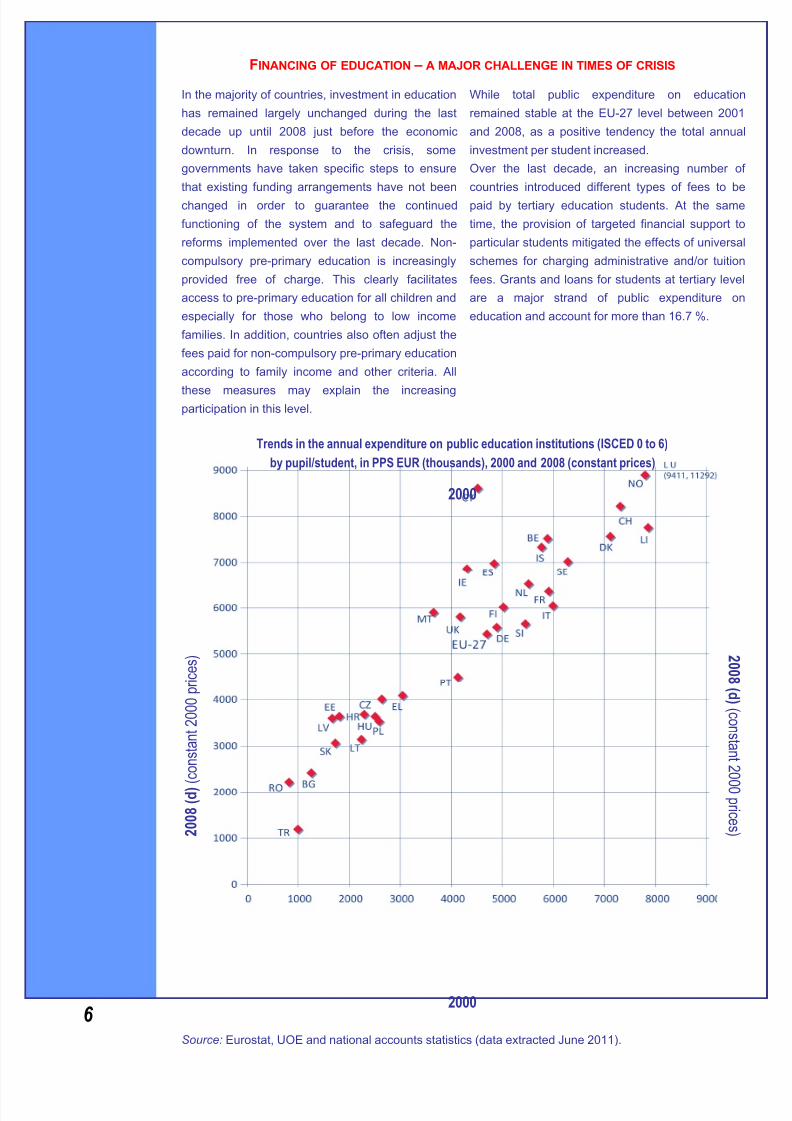
FINANCING OF EDUCATION – A MAJOR CHALLENGE IN TIMES OF CRISIS
In the majority of countries, investment in education
has remained largely unchanged during the last
decade up until 2008 just before the economic
downturn. In response to the crisis, some
governments have taken specific steps to ensure
that existing funding arrangements have not been
changed in order to guarantee the continued
functioning of the system and to safeguard the
reforms implemented over the last decade. Non-
compulsory pre-primary education is increasingly
provided free of charge. This clearly facilitates
access to pre-primary education for all children and
especially for those who belong to low income
families. In addition, countries also often adjust the
fees paid for non-compulsory pre-primary education
according to family income and other criteria. All
these measures may explain the increasingparticipation in this level.
While total public expenditure on education
remained stable at the EU-27 level between 2001
and 2008, as a positive tendency the total annual
investment per student increased.
Over the last decade, an increasing number of
countries introduced different types of fees to be
paid by tertiary education students. At the same
time, the provision of targeted financial support to
particular students mitigated the effects of universal
schemes for charging administrative and/or tuition
fees. Grants and loans for students at tertiary level
are a major strand of public expenditure on
education and account for more than 16.7 %.
Trends in the annual expenditure on public education institutions (ISCED 0 to 6)
by pupil/student, in PPS EUR (thousands), 2000 and 2008 (constant prices)
2000
2 0 0 8
( d )
( c o n s t a n t 2 0 0 0
p r i c e s )
2 0 0 8 ( d ) ( c o n s t a n t 2 0
0 0 p r i c e s )
2000 Source: Eurostat, UOE and national accounts statistics (data extracted June 2011).
7/31/2019 raportEduUEpe scurt
http://slidepdf.com/reader/full/raporteduuepe-scurt 7/8
7
TERTIARY EDUCATION GRADUATES FIND EMPLOYMENT TWO TIMES FASTER THAN
PEOPLE WITH LOWER QUALIFICATIONS
79 % of young people in Europe aged 20-24
successfully completed upper secondary education
in 2010, confirming the upward trend shown across
Europe since 2000. The EU average percentage of
persons with a tertiary qualification has increased
for all age groups since 2000, although imbalances
in student participation in the various academic
disciplines still exist. In science, mathematics and
computing, as well as in the field of education, for
example, the proportion of graduates has dropped.
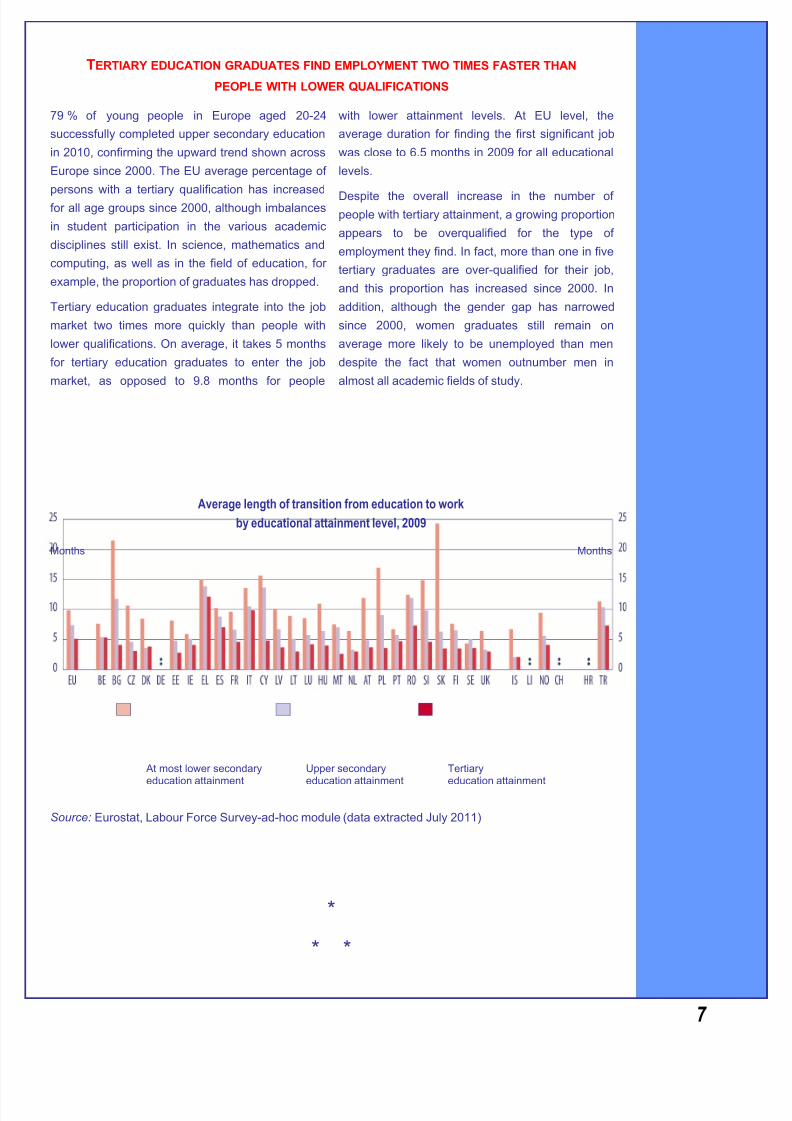
Tertiary education graduates integrate into the job
market two times more quickly than people with
lower qualifications. On average, it takes 5 months
for tertiary education graduates to enter the job
market, as opposed to 9.8 months for people
with lower attainment levels. At EU level, the
average duration for finding the first significant job
was close to 6.5 months in 2009 for all educational
levels.
Despite the overall increase in the number of people with tertiary attainment, a growing proportion
appears to be overqualified for the type of
employment they find. In fact, more than one in five
tertiary graduates are over-qualified for their job,
and this proportion has increased since 2000. In
addition, although the gender gap has narrowed
since 2000, women graduates still remain on
average more likely to be unemployed than men
despite the fact that women outnumber men in
almost all academic fields of study.
Average length of transition from education to work
by educational attainment level, 2009
Months Months
At most lower secondary
education attainment
Upper secondary
education attainment
Tertiary
education attainment
Source: Eurostat, Labour Force Survey-ad-hoc module (data extracted July 2011)
*
* *
7/31/2019 raportEduUEpe scurt
http://slidepdf.com/reader/full/raporteduuepe-scurt 8/8
8
The full study
Key Data on Education in Europe 2012
can be found in English, French and German on the Eurydice website:
http://eacea.ec.europa.eu/education/eurydice/key_data_en.php
Printed copies of the report
are available upon request at
Contact
Stanislav Ranguelov, Co-ordinating Author: [email protected]
Wim Vansteenkiste, Communication and Publications Sector: [email protected]