Embed Size (px)
Citation preview
Bachelor’s Thesis
Biotechnology and Food Technology
Biotechnology
2016
Juuso Haapoja
RECOVERY OF ENZYMES FROM INDUSTRIAL FERMENTATION AND DETERMINATION OF ACTIVITY ASSAY
OPINNÄYTETYÖ (AMK) | TIIVISTELMÄ
TURUN AMMATTIKORKEAKOULU
Bio- ja elintarviketekniikka | Biotekniikka
2016 | 33
Bas Romein, Kari Haajanen
Juuso Haapoja
ENTSYYMIEN TALTEENOTTO TEOLLISESSA FERMENTOINNISSA JA AKTIIVISUUSANALYYSIN MÄÄRITYS
Opinnäytetyön aiheena oli luoda MetGen Oy:n tuottamalle entsyymille standardoitu aktiivisuusanalyysi, johon määritettiin käytettävä lämpötila, pH, substraatti sekä puskuriliuos. Entsyymi tuotettiin kahdessa eri tilavuudessa: yhdessä litrassa sekä 250 litrassa. Jokainen fermentointi suoritettiin itsenäisesti alkuvalmisteluista tuotteen talteenottoon saakka. Lopulta analysoitavaksi kerättiin kuusi fermentoinnin lopputuotetta: neljä yhden litran ja kaksi 250 litran fermentoinneista.
Aktiivisuusanalyysi suoritettiin käyttämällä kolmea kaupallista ja kolmea itse valmistettua puskuriliuosta, joiden pH-arvot vaihtelivat välillä 4-6. Analyysin lämpötilana käytettiin kolmea vaihtoehtoa: huoneenlämpötila, 30 °C ja 40 °C. Analyysin substraattina toimi ABTS, jolla aikaansaatiin mitattava värireaktio, jonka absorbanssia mitattiin ajan funktiona. Näiden tulosten perusteella luotiin absorbanssin kasvukaaviot jokaiselle näytteelle sekä laskettiin vertaileva aktiivisuusarvo vertaamalla saatuja tuloksia tunnettuun standardiin.
Aktiivisuusanalyysi antoi selkeitä ja toistettavia tuloksia, joiden perusteella jokaiselle fermentoinnin lopputuotteelle laskettiin standardiin verrattu aktiivisuusarvo. Tuloksissa oli nähtävissä, miten erilaiset olosuhteet vaikuttivat entsyymin aktiivisuuteen. Kaikkien saatujen tulosten perusteella on tehty MetGen Oy:lle ehdotus mitatun entsyymin aktiivisuusanalyysin standardiolosuhteista. Yritykselle on myös tehty ehdotus jatkomittausten suoritusta varten, jotta analyysistä saadaan mahdollisimman tarkkoja vertailuarvoja entsyymin tuleviin käyttöolosuhteisiin verrattuna.
ASIASANAT:
Aktiivisuusmääritys, absorbanssi, entsyymi, entsyymiaktiivisuus, fermentointi

BACHELOR´S THESIS | ABSTRACT
TURKU UNIVERSITY OF APPLIED SCIENCES
Biotechnology and Food Technology | Biotechnology
2016 | 33
Kari Haajanen, Senior Lecturer; Bas Romein
Juuso Haapoja
RECOVERY OF ENZYMES FROM INDUSTRIAL FERMENTATION AND DETERMINATION OF ACTIVITY ASSAY
The aim of the experiment presented in this thesis was to create a standard enzyme activity assay for a produced enzyme. The enzyme was independently produced six times after learning the fermentation procedures and suitable parameters for the assay were defined based on the results of this experiment. The enzyme itself was produced in a mutated Escherichia coli in two different volumes: one liter and pilot-scale. The assay was conducted with final end of fermentation samples from all fermentations.
The activity assay was conducted with six different buffer solutions, three commercial and three self-prepared ones. The buffer solutions were adjusted to different pH, ranging from 4 to 6. In addition, three different temperatures were applied: room temperature, 30 °C and 40 °C. The substrate of the assay was ABTS. The assay was carried out in 96 well plates by measuring the absorbance of the samples. The green colored reaction of ABTS dissociation was measured at 405 nm wavelength, and an activity value was calculated by comparing the obtained values to a known standard.
The measurements gave clear and reproducible values, which were used to calculate the activity values. There was variation between different buffers, pH and temperatures, as expected, and based on these results, a suggestion for the oncoming assay parameters was made. It is recommended that the standard be replaced by more suitable standard for this enzyme. Also, a suggestion to conduct extra assays with other possible environmental factors, in which the enzyme can be applied to, has been given to MetGen.
KEYWORDS:
Activity assay, absorbance, enzyme, enzyme activity, fermentation
TABLE OF CONTENTS
GLOSSARY 6
1 INTRODUCTION 7
2 FERMENTATION 9
3 ENZYMES AND ACTIVITY ASSAYS 13
3.1 Enzyme assays and parameters 13
3.1.1 pH 16
3.1.2 Temperature 18
3.1.3 Solvents, substrates and cofactors 20
4 METHODS 22
4.1 Fermentation 22
4.2 Enzyme activity assay 25
5 RESULTS AND DISCUSSION 26
6 CONCLUSION 29
SOURCES 32
APPENDICES
Appendix 1. Graphs of the assay.
FIGURES
Figure 1. General representation of fermentation process. (Stanbury et al. 1995, 10) . 10 Figure 2. Progress curve of an enzyme reaction. (Bisswanger 2012, 44) .................... 16 Figure 3. The pH optimum curved based on the pKa values. (BBC 2011) ................... 17 Figure 4. Arrhenius diagram, depicting enzyme activity’s dependence over temperature. (Bisswanger 2012, 47) ........................................................................... 19 Figure 5. A picture of the two Sartorius 1 liter fermenters and their DCU. ................... 22 Figure 6. A picture of pilot-scale fermenter (left) and mobile tank unit (right). .............. 23 Figure 7. Sample 3 absorbance values at room temperature. ..................................... 26

Figure 8. Development of absorbance at different temperatures. ................................ 27 Figure 9. Sample 1 absorbance values at room temperature. ..................................... 33 Figure 10. Sample 1 absorbance values at 30 °C. ...................................................... 33 Figure 11. Sample 1 absorbance values at 40 °C. ...................................................... 34 Figure 12. Sample 2 absorbance values at room temperature. ................................... 34 Figure 13. Sample 2 absorbance values at 30 °C. ...................................................... 35 Figure 14. Sample 2 absorbance values at 40 °C. ...................................................... 35 Figure 15. Sample 3 absorbance values at room temperature. ................................... 36 Figure 16. Sample 3 absorbance values at 30 °C. ...................................................... 36 Figure 17. Sample 3 absorbance values at 40 °C. ...................................................... 37 Figure 18. Sample 4 absorbance values at room temperature. ................................... 37 Figure 19. Sample 4 absorbance values at 30 °C. ...................................................... 38 Figure 20. Sample 4 absorbance values at 40 °C. ...................................................... 38 Figure 21. Sample 5 absorbance values at room temperature. ................................... 39 Figure 22. Sample 5 absorbance values at 30 °C. ...................................................... 39 Figure 23. Sample 5 absorbance values at 40 °C. ...................................................... 40 Figure 24. Sample 6 absorbance values at room temperature. ................................... 40 Figure 25. Sample 6 absorbance values at 30 °C. ...................................................... 41 Figure 26. Sample 6 absorbance values at 40 °C. ...................................................... 41 Figure 27. Positive control (MetZyme) absorbance values at room temperature. ........ 42 Figure 28. Positive control (MetZyme) absorbance values at 30 °C. ........................... 42 Figure 29. Positive control (MetZyme) absorbance values at 40 °C. ........................... 43 Figure 30. Golden Standard III absorbance values at room temperature. ................... 43 Figure 31. Golden Standard III absorbance values at 30 °C. ...................................... 44 Figure 32. Golden Standard III absorbance values at 40 °C. ...................................... 44
GLOSSARY
ABTS 2,2’-azino-bis(3-ethylbenzothiazoline-6-sulphonic acid)
DO Dissolved oxygen
GSIII Golden Standard III, a known enzymatic standard for en-zyme activity assays
MZ MetZyme®, general product name for MetGen’s enzymes, refers to enzyme used as a positive control in the thesis
OD Optical density
7
TURUN AMK:N OPINNÄYTETYÖ | Juuso Haapoja
1 INTRODUCTION
The research in this thesis aimed to produce an enzyme with MetGen’s fer-
menters and to create a standard protocol on its activity assay. Within the as-
say, certain factors will be set based on the results
This study was conducted at MetGen, a biotechnology company located in Kaa-
rina. MetGen is a company that produces enzymes for industrial use, e.g. for
the wood and paper industry. (MetGen 2016)
Commercial-use enzymes are produced from animal, plant and microbial
sources. Microbial enzymes have an advantage over the other two groups in
that larger-scale production is easier with current fermentation technology. It is
also easier to improve their enzyme production compared to animal or plant
based enzymes. Thanks to recombinant technology, it is now possible to pro-
duce more difficult animal and plant source enzymes much easier. Recombi-
nant techniques have made it easier to change the producing cell to focus on
the production of the desired enzyme. Improving the enzyme producing strain is
one of the most important phases in production improvement. (Stanbury et al.
1995, 2)
Enzyme activity assays are methods for visualizing the activity of the enzymes.
In recent years, a multitude of assays has been developed for research and
industrial use. (Reymond et al. 2008, 34) The assays always aim to determine
the amount of enzyme or identify the enzyme’s presence in a sample. This
means that they are either quantitative or identification assays. Enzymes are
easy to determine by their reactions and the components they produce. This is
used in assay planning to develop a suitable assay for a particular enzyme.
(Bisswanger 2014, 42)
The aim of this study was to produce an enzyme for industrial use at two differ-
ent scales: 1 liter and pilot-scale ferment volumes. Samples from the fermenta-
tions will be analyzed with enzyme activity assay to determine the enzyme’s
activity. The focus was on the assay factors producing the most reliable and

8
TURUN AMK:N OPINNÄYTETYÖ | Juuso Haapoja
reproducible results for both absorbance values and comparable activity values.
With the results, standard factors were determined for future assays of this en-
zyme.
9
TURUN AMK:N OPINNÄYTETYÖ | Juuso Haapoja
2 FERMENTATION
The term fermentation comes from the Latin word fervere which means to boil.
Currently in industrial microbiology, fermentation can mean any kind of produc-
tion by micro-organism mass culture. Fermentation can be divided into five dif-
ferent groups based on what the end product is: production of microbial cells or
biomass, production of enzymes, production of microbial metabolites, produc-
tion of recombinant products and modification of an added product - or trans-
formation process. (Stanbury et al. 1995, 1)
Using fermentation to produce a product has certain advantages. Some com-
plex molecules and optically active compounds, such as vitamins, amino acids
or enzymes, are impossible to manufacture chemically due to economic as-
pects. Producing food industry products (e.g. beer) is considered better to use
fermentation procedures over chemical production. Fermentations mostly use
renewable materials and rarely petrochemicals. This usually makes it more
economical choice for production. However, there are also some disadvantages
on using fermentation in production. Even if the fermentation waste products
are not toxic, they require extensive waste treatment, which requires a lot of
resources. In microbial fermentations, contamination by a competitive strain
may occur, sterilization is required and the process must be contained to avoid
contamination. This is a risk that can in worst case ruin large quantities of prod-
uct and cause significant economic losses. The recovery of the fermented prod-
uct is often laborious and expensive compared to chemically produced prod-
ucts. Also, environmental factors (pH, temperature, nutrient levels, etc.) must be
strictly controlled when microorganisms are used. Otherwise these factors may
slow the process or, in the worst case, kill the organisms. (Reddy et al. 2012, 7-
8)
Microbial, animal and plant sources have been used for commercial production
of enzymes. Of these three groups, microbial enzymes have an advantage as
they are easy to produce in large amounts with current fermentation techniques.
It is also much easier to enhance the yield of a microbial system than that of an
10
TURUN AMK:N OPINNÄYTETYÖ | Juuso Haapoja
animal or plant system. With the development of recombinant DNA technology,
it has become possible to synthesize animal origin enzymes into the microor-
ganisms. This has considerably facilitated the production of animal based en-
zymes. The production of the enzymes in the microorganisms is closely con-
trolled and to improve productivity, these controls are altered to find the best
combination. Strain improvement is extremely important in the improvement of
the production. (Stanbury et al. 1995, 2-3)
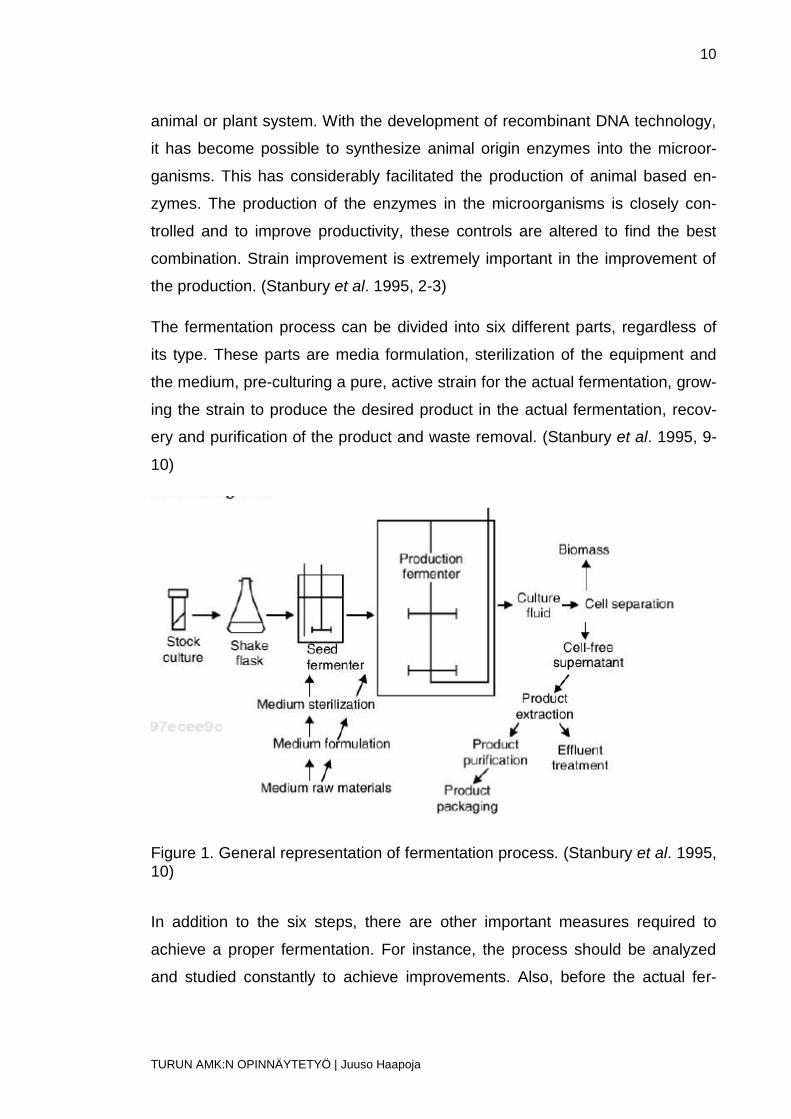
The fermentation process can be divided into six different parts, regardless of
its type. These parts are media formulation, sterilization of the equipment and
the medium, pre-culturing a pure, active strain for the actual fermentation, grow-
ing the strain to produce the desired product in the actual fermentation, recov-
ery and purification of the product and waste removal. (Stanbury et al. 1995, 9-
10)
Figure 1. General representation of fermentation process. (Stanbury et al. 1995, 10)
In addition to the six steps, there are other important measures required to
achieve a proper fermentation. For instance, the process should be analyzed
and studied constantly to achieve improvements. Also, before the actual fer-
11
TURUN AMK:N OPINNÄYTETYÖ | Juuso Haapoja
mentation process starts, the production organism must be identified, isolated
and to produce the enzyme in industrial quantities. The process for extracting
the final product must be ready before starting the production. The whole pro-
cess must be thought through and continual improvement should be aimed at
throughout the process. (Stanbury et al. 1995, 10)
The culture fermenters are classified into three groups based on their operation.
These groups are batch, fed-batch and continuous operation. In the batch pro-
cess, all required nutrients and other necessities for cell growth are present in
the medium before inoculation. The only added components are oxygen by aer-
ation and acid and base for pH regulation. The fermentation ends when the lim-
iting nutrient is completely consumed and the growth ceases. Batch processes
are mostly used in research and development when the growth and the limiting
nutrients are studied but they are also used in production. Fed-batch fermenta-
tion resembles batch fermentation but one or more nutrients are added during
the fermentation, either continuously or at certain time intervals. Fed-batch pro-
cesses enable longer fermentations than batch processes, as the added nutri-
ents usually are the limiting ones that run out during batch processes. This
means better growth and higher productivity. In a continuous process, the me-
dium is pumped into the fermentation at a constant rate and the cultured medi-
um is pumped out so that the volume remains constant inside the vessel. A con-
tinuous process can increase growth and productivity even better than a fed-
batch process. Its drawback, however, is the great space it needs due to all the
piping. Also, it is inevitable that at some point, the continuous process is con-
taminated, as more and more material moves through the reactor, multiplying
the risk of contamination. This is why fed-batch operation is usually preferred to
continuous operation, especially if space is a limiting factor for the user. (Vogel
& Todaro 2014, 3-5)
Fermentation performance can be influenced by a number of different factors,
e.g., pH, dissolved oxygen and carbon dioxide, temperature, medium composi-
tion, choice of operation, shear rates inside the fermenter and mixing. Changes
in these factors affect the fermentation rate, yield of product, product properties

12
TURUN AMK:N OPINNÄYTETYÖ | Juuso Haapoja
(smell, taste, texture, etc.) and toxin generation. This is why formulating the
medium is important, as it is vital to have an appropriate medium with function-
ing instruments to control the various factors. Even with good control of said
factors, if the medium is not suitable, the yield will be affected by it. The medi-
um’s priority is to provide the growing compound with enough nutrients (e.g.
vitamins, nitrogen, and carbon). Some fermentation may need some specific
sources for these nutrients and the ratio between nitrogen and carbon must be
fixed and controlled. Only by understanding the biochemistry of the fermentation
can the optimal medium formulation be achieved. Otherwise, changes in the
medium will affect the growth in a negative way. The concentrations of some
nutrients may have to vary during the fermentation, whereas avoiding some
concentrations is needed. Also economic reasons, such as cost and availability,
have an impact on the choice of medium. (Batt & Tortorello 1999, 664)
13
TURUN AMK:N OPINNÄYTETYÖ | Juuso Haapoja
3 ENZYMES AND ACTIVITY ASSAYS
In 2014, the worldwide market of enzymes was valued at 4.2 billion U.S. dollars
(MarketsAndMarkets 2015). Enzymes function as biological catalysts for many
important chemical reactions. Their purpose is to catalyze the reaction and to
control the rate of the reaction. Mostly this means accelerating a reaction which
would otherwise be slow. As enzymes catalyze and thus change the rate of the
reaction, the enzymes themselves stay intact. They are proteins that have the
ability to change the velocity of a specific chemical reaction. The substance
which is affected by the enzyme is called substrate. For example, trypsin is a
protein that catalyzes peptide bond hydrolysis of proteins and polypeptides. In
this example, the polypeptides are the substrates for trypsin. (Mathews et al.
2000, 360-361)
3.1 Enzyme assays and parameters
Assays are tools for visualizing the activity of an enzyme. Many different assays
have been developed in recent years. Many of these assays are intended for
the use of the “white biotechnology”. There, the need for selective enzymes has
been great to achieve environmentally and economically friendly processes.
(Reymond et al. 2008, 34)
The purpose of an enzyme activity assay is normally either to determine the
enzyme amount in a sample or to identify a certain enzyme; its absence or
presence in the sample. To determine the amount of the enzyme, quantitative
methods must produce as accurate data as possible, whereas for identification,
a simple positive/negative end result is enough. Enzymes can be easily distin-
guished from each other and other components by their reactions and the prod-
ucts they produce. Usually the amount of end product exceeds the amount of
the enzyme and this can cause difficulties when attempting to reverse the reac-
tion back to the amount of enzyme. (Bisswanger 2012, 42)
14
TURUN AMK:N OPINNÄYTETYÖ | Juuso Haapoja
There are many different enzyme assay procedures recorded in databases and
books, but even with recorded observations of a procedure, the result of an as-
say is not guaranteed. The activity of a particular enzyme depends on a multi-
tude of factors. Understanding these factors is of fundamental importance for
reliable results. In 1913, Leonor Michaelis and Maud Menten showed that the
activity of an enzyme is dependent on pH and temperature and the strength of
the ions. The only way to compare different assays is to pay careful attention to
these factors. However, the vast diversity of enzymes makes this extremely dif-
ficult. Enzymes themselves are very sensitive substances. They are naturally
not found in high amounts and their activity is often detected only in their most
favorable conditions. Most enzymes work best within an average physiological
range but there are some which require extreme conditions to work properly,
e.g. high temperature or high/low pH. (Bisswanger 2012, 42)
Whereas most of the required conditions can be found in the literature, it is al-
ways important to tune these conditions based on the enzyme and the observa-
tions of that particular enzyme. This must be taken to consideration especially
when a new assay for a new enzyme is developed. Still, what is most important
in enzyme activity assays is that they enable simple observation of the reaction.
Enzymes turn substrate into a product and usually by monitoring the amount of
product formed the enzyme activity against the time consumed can be meas-
ured. As with the formation of the product, also its decline can be a measured
sign during the reaction. When there are two products formed or more than one
substrate involved, only one reaction component, which is most likely to be the
easiest to determine, is sufficient for measurement. (Bisswanger 2012, 43)
The detection of the enzyme reaction can, at its simplest, be an observation of
color change in the sample. This will give the advantage of getting results with-
out any measuring instruments. However, this way no data is obtained, nor ex-
periment reproducibility. An instrument will enable the data and the reproducibil-
ity. The instrument, e.g. a photometer or a colorimeter, will determine the inten-
sity of the color and thus give data about the reaction. Spectrophotometers are
commonly used in determining enzymes as they have a broad spectrum of dif-
15
TURUN AMK:N OPINNÄYTETYÖ | Juuso Haapoja
ferent wavelengths of light, especially in the UV range, and most of them are
user-friendly and easy to handle. They are also very resistant to disturbances
during measurement. Fluorimetry is another way to measure and it is much
more sensitive and accurate, but there are only a few substrates that emit fluo-
rescence. The instruments themselves require expertise from the user as they
are more difficult to use compared to a regular spectrophotometer. Other optical
possibilities are turbidimetry (e.g. starch particle degradation) and luminometry
(ATP reactions). Besides optical methods, electrochemical methods can also be
used, especially pH dependent reactions, e.g. the forming of an acid or base.
As the enzymes’ optimum pH range is narrow, the process of electrochemical
determination must be controlled by countering the increase or decrease of the
pH by appropriate solution. By following the addition of this neutralizing solution,
the progress of the reaction can be monitored. (Bisswanger 2012, 44)
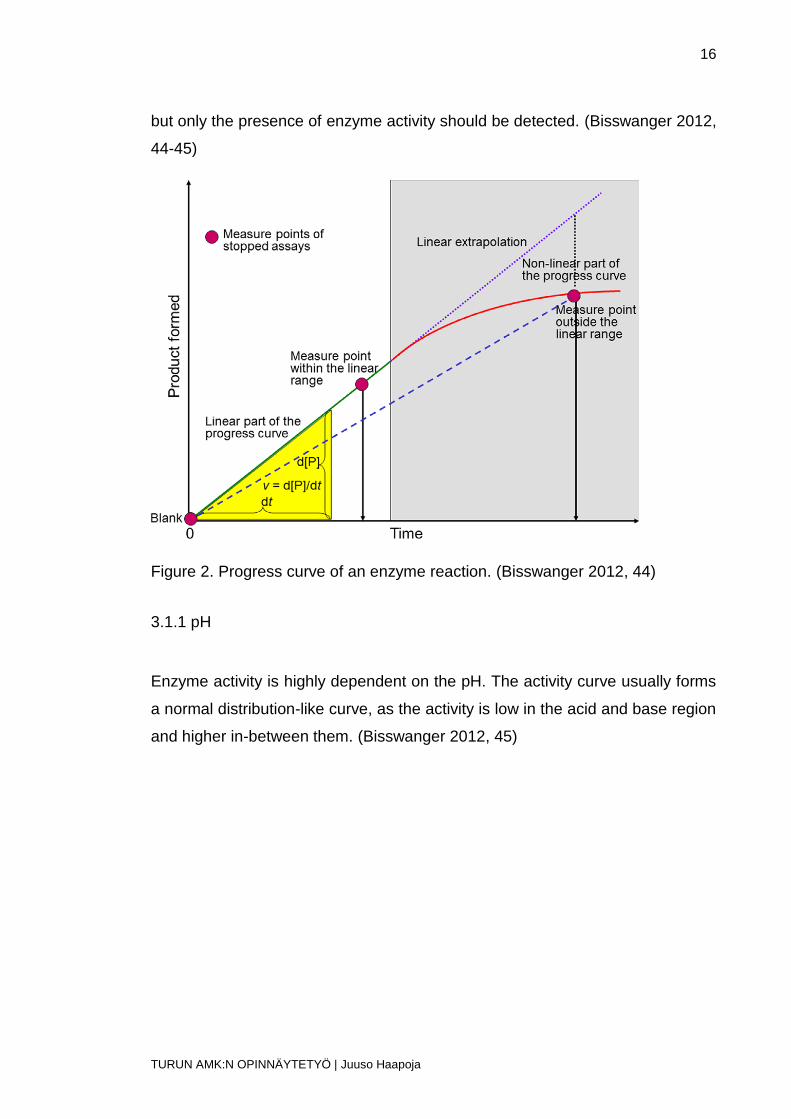
The mentioned methods all allow continuous, time-dependent enzyme reaction
monitoring. For that, they are termed continuous assays. Continuity is important
when determining enzyme activity and the rate of the reaction. It also permits to
observe influences and disturbances caused by other molecules and chemical
reactions. With it, controlling the course of the reaction (progress curve) is pos-
sible. As the substrates deplete during the later stage of the reaction, the reac-
tion itself slows down and, at some point, ends. That is why, when calculating
the velocity, only the linear part of the curve should be taken into account. To
determine reaction velocity, the reaction itself must be stopped when a certain
time point is reached and the amount of formed product analyzed with an ap-
propriate method, e.g. HPLC (stopped assay). Compared to the continuous as-
says, stopped assays give only a single measured point and the curve velocity
is calculated from the slope of the curve, connecting to the point of a blank be-
fore the start of the reaction. In this method, it is not guaranteed that the meas-
urement is on the linear part of the curve and that is why control values must be
measured at different time points during the reaction. This kind of procedure is
time consuming, laborious which is why continuous assays are preferred.
Stopped assays are as good as continuous assays in qualitative measurement,
16
TURUN AMK:N OPINNÄYTETYÖ | Juuso Haapoja
but only the presence of enzyme activity should be detected. (Bisswanger 2012,
44-45)
Figure 2. Progress curve of an enzyme reaction. (Bisswanger 2012, 44)
3.1.1 pH
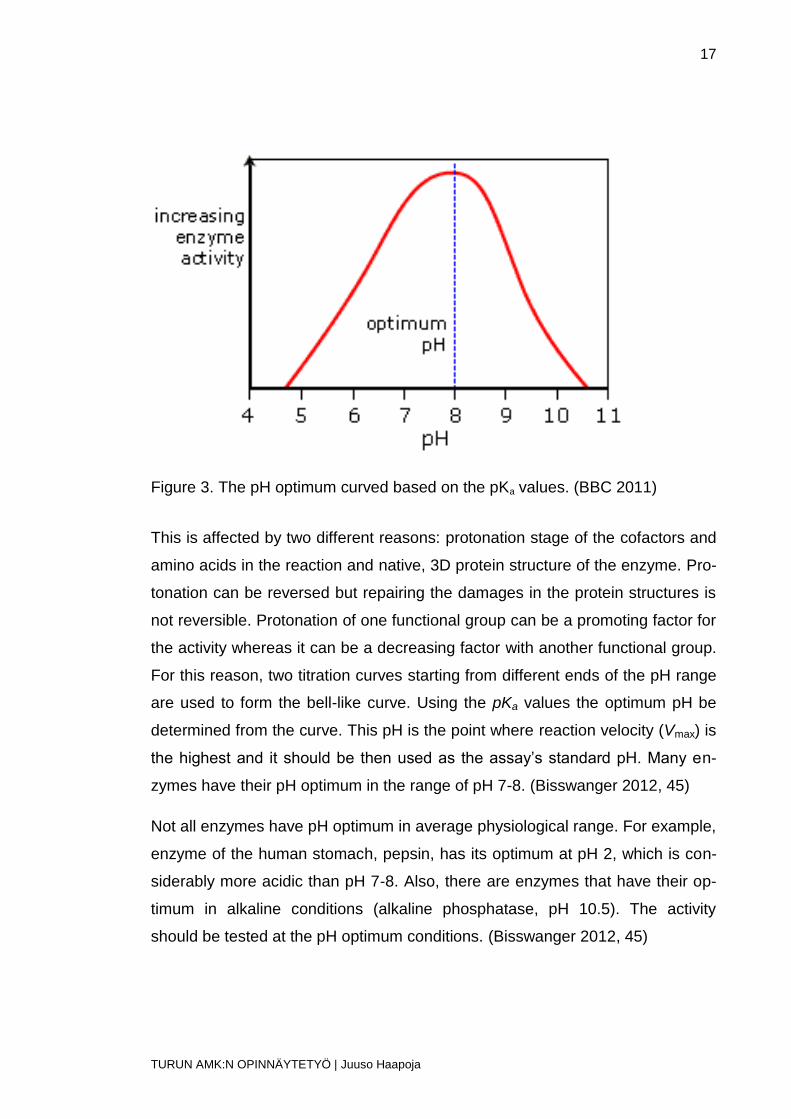
Enzyme activity is highly dependent on the pH. The activity curve usually forms
a normal distribution-like curve, as the activity is low in the acid and base region
and higher in-between them. (Bisswanger 2012, 45)
17
TURUN AMK:N OPINNÄYTETYÖ | Juuso Haapoja
Figure 3. The pH optimum curved based on the pKa values. (BBC 2011)
This is affected by two different reasons: protonation stage of the cofactors and
amino acids in the reaction and native, 3D protein structure of the enzyme. Pro-
tonation can be reversed but repairing the damages in the protein structures is
not reversible. Protonation of one functional group can be a promoting factor for
the activity whereas it can be a decreasing factor with another functional group.
For this reason, two titration curves starting from different ends of the pH range
are used to form the bell-like curve. Using the pKa values the optimum pH be
determined from the curve. This pH is the point where reaction velocity (Vmax) is
the highest and it should be then used as the assay’s standard pH. Many en-
zymes have their pH optimum in the range of pH 7-8. (Bisswanger 2012, 45)
Not all enzymes have pH optimum in average physiological range. For example,
enzyme of the human stomach, pepsin, has its optimum at pH 2, which is con-
siderably more acidic than pH 7-8. Also, there are enzymes that have their op-
timum in alkaline conditions (alkaline phosphatase, pH 10.5). The activity
should be tested at the pH optimum conditions. (Bisswanger 2012, 45)

18
TURUN AMK:N OPINNÄYTETYÖ | Juuso Haapoja
The enzymes should be stored, as well as tested, at the optimum pH, as they
are usually stable in those conditions. The pH must be maintained as the opti-
mum, or close to it, when the enzyme sample is taken from storage to be pre-
pared for the assay. Extreme pH conditions should be avoided, as in such con-
ditions, the enzymes tertiary structure is damaged irreversibly. This is a time-
dependent reaction, but when pH reaches values less than three or above 11,
the reaction is almost instantaneous. (Bisswanger 2012, 45)
3.1.2 Temperature
The effect of the temperature to the enzymes activity is considerable. When
temperatures rise, the activity increases. When the temperature reaches and
passes the maximum value, the enzyme activity decreases. This behavior is
called temperature optimum, but this does not mean that there exists an opti-
mum temperature for enzyme activity. Normally, all chemical reaction velocities
tend to increase with higher temperature, two to three times per 10 °C rise can
be used as an empirically received rule. This rule applies to the enzyme activi-
ties as well. The only limiting factor to this progress is the denaturation tempera-
ture. What also needs to be taken into consideration is the 3D structure of the
enzymes. The structures themselves are sensitive and are destabilized at high
temperatures and, by that, causing denaturation. This factor limits the velocity
and is the reason for velocity decrease at high temperatures. The denaturation
is dependent on both time and temperature, so no accurate temperature can be
determined for enzyme denaturation, but the higher the temperature, the faster
the denaturation is. Also, the pretreatment of the enzymes affects the maximum
temperature. (Bisswanger 2012, 47)
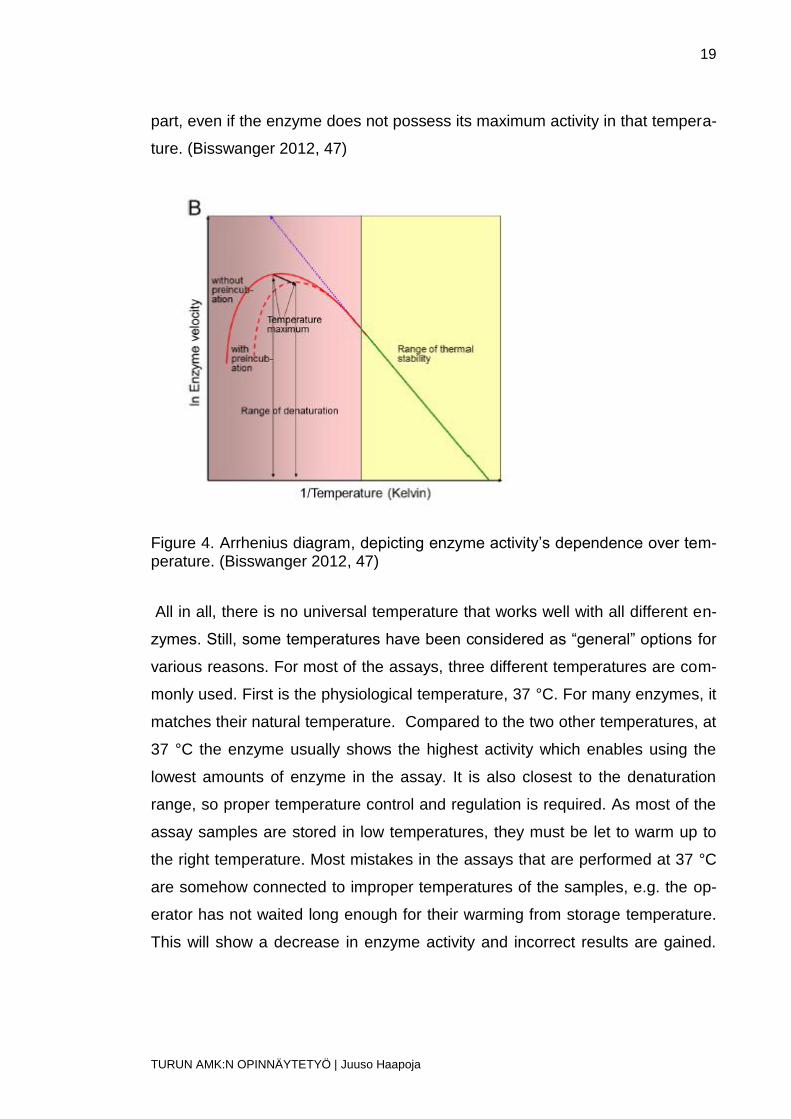
Testing the enzyme activity’s correlation against temperature is needed to es-
tablish correct assay temperature. By using the Arrhenius diagram (Figure 4)
with the enzyme and temperature, a line should show linearity in lower tempera-
tures, indicating stability, and in denaturation temperatures and close to that,
divergence from the line. The assay temperature must be on the line’s linear
19
TURUN AMK:N OPINNÄYTETYÖ | Juuso Haapoja
part, even if the enzyme does not possess its maximum activity in that tempera-
ture. (Bisswanger 2012, 47)
Figure 4. Arrhenius diagram, depicting enzyme activity’s dependence over tem-perature. (Bisswanger 2012, 47)
All in all, there is no universal temperature that works well with all different en-
zymes. Still, some temperatures have been considered as “general” options for
various reasons. For most of the assays, three different temperatures are com-
monly used. First is the physiological temperature, 37 °C. For many enzymes, it
matches their natural temperature. Compared to the two other temperatures, at
37 °C the enzyme usually shows the highest activity which enables using the
lowest amounts of enzyme in the assay. It is also closest to the denaturation
range, so proper temperature control and regulation is required. As most of the
assay samples are stored in low temperatures, they must be let to warm up to
the right temperature. Most mistakes in the assays that are performed at 37 °C
are somehow connected to improper temperatures of the samples, e.g. the op-
erator has not waited long enough for their warming from storage temperature.
This will show a decrease in enzyme activity and incorrect results are gained.
20
TURUN AMK:N OPINNÄYTETYÖ | Juuso Haapoja
For this reason, a separate system for heating is recommended to heat the
samples. (Bisswanger 2012, 47-48)
By using room temperature, the required heating is eliminated from the assay
process. However, the room temperature is not a constant value, as it differs
between different spaces and also in the same room with the changes of win-
dow or door opening/closing, air conditioning and sunlight radiation. Because of
these reasons, a slightly higher temperature, 25 °C, is considered a better op-
tion. Temperature maintenance is easier and faster, and the changes in tem-
perature do not show high variations from the actual results. Compared to high-
er temperatures, the activity is clearly lower and the amounts of enzymes re-
quired are higher, but its convenience and robustness are the reasons why this
25 °C is recommended for most assays, as long as there are enough enzymes
to use. (Bisswanger 2012, 48)
Third frequent temperature is 30 °C. This temperature is somewhat of a com-
promise between 37 °C and 25 °C. The temperature gives higher activity results
than at 25 °C but with less temperature regulation than at 37 °C. And in some
cases, none of these three are applicable, as some of the enzymes are only
active in very high temperatures. These thermophilic enzymes show low results
in the range of aforementioned temperatures, so their testing should be execut-
ed in their natural temperatures. Even if these enzymes do work in extreme
temperatures, they also have a denaturation point, and that should be taken into
consideration during testing the enzyme. Using high temperatures provide a
series of obstacles for the assay. Finding thermostable reagents for the assay
can be difficult and the oxidation is accelerated in those temperatures.
(Bisswanger 2012, 48)
3.1.3 Solvents, substrates and cofactors
For most of the assays, water is appropriate solvent. Some enzymes require
organic solvents when their crucial component is insoluble to water. Then a sol-
vent that is miscible with water must be used, e.g. acetone or ethanol. The mix-
21
TURUN AMK:N OPINNÄYTETYÖ | Juuso Haapoja
ture’s aliquot is added to the assay, and is should stay dissolved. To avoid any
precipitation, the amount of the non-water-dissolving component should be as
low as possible or the amount of the organic solvent should be high enough to
keep the substrate soluble. The solubility is connected to the temperature, so by
manipulating the temperature, the component can be dissolved. This is a prob-
lem if the component is dissolved in the assay temperature, but precipitated in
storage temperature. Also, the concentration of the organic solvent will affect
the enzyme itself. Either it can denature the enzyme completely or it can affect
its activity. If organic solvents are used in the assays, their concentrations must
always be kept constant to avoid any deviations in the results because of their
concentration variations. (Bisswanger 2012, 46-47)
Substrates, cofactors and co-substrates are, besides the enzyme itself, the
most important parts of the activity assay. Their quality and stability are ex-
tremely important and these must be demanded by the operator. In many cas-
es, substrates are not defined to specified enzyme. Most enzymes are not spe-
cific to one substrate, but accept others as well. The same goes for cofactors.
Essential parts of the covalent reactions are divalent cations, and they can be
replaced by other divalent cations. Physiological substrates are changed into
artificial ones, if the physiological one is not stable enough for the assay. When
enzyme accepts multiple substrates, the most optimum one must be chosen. As
results with different substrates are not comparable, the Km value of the sub-
strates must be compared. The lower this value is the better. Sometimes, the
optimum substrate is not chosen, as the other substrate can be more stable,
soluble, accessible and available for the assay. To get comparable data, the
same substrates must be used every time. The only time this may be changed
is if the assay is tested with another substrate, e.g. if the new substrate is more
stable or economical for the assay. (Bisswanger 2012, 48)
22
TURUN AMK:N OPINNÄYTETYÖ | Juuso Haapoja
4 METHODS
The process of the work can be divided roughly into two separate sections: fer-
mentation and enzyme activity analysis. Both fermenter sizes used Medium 1
(same consistency in reagents) in the fermentations.
4.1 Fermentation
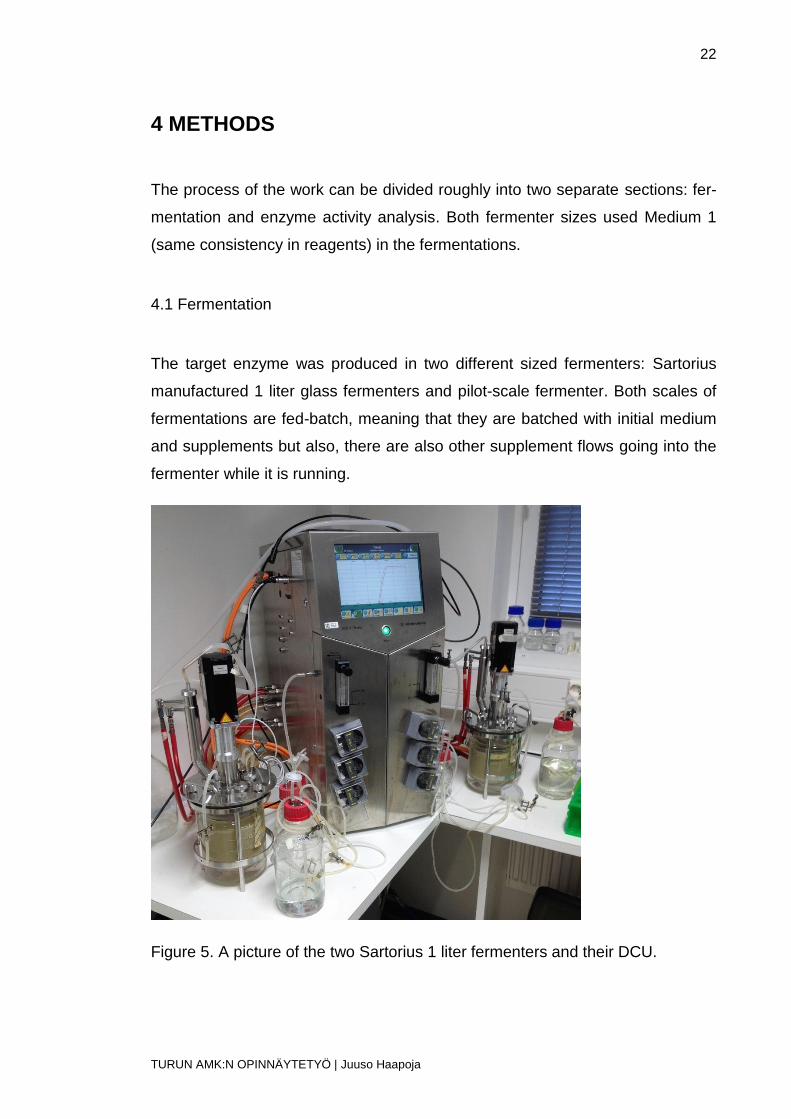
The target enzyme was produced in two different sized fermenters: Sartorius
manufactured 1 liter glass fermenters and pilot-scale fermenter. Both scales of
fermentations are fed-batch, meaning that they are batched with initial medium
and supplements but also, there are also other supplement flows going into the
fermenter while it is running.
Figure 5. A picture of the two Sartorius 1 liter fermenters and their DCU.
23
TURUN AMK:N OPINNÄYTETYÖ | Juuso Haapoja
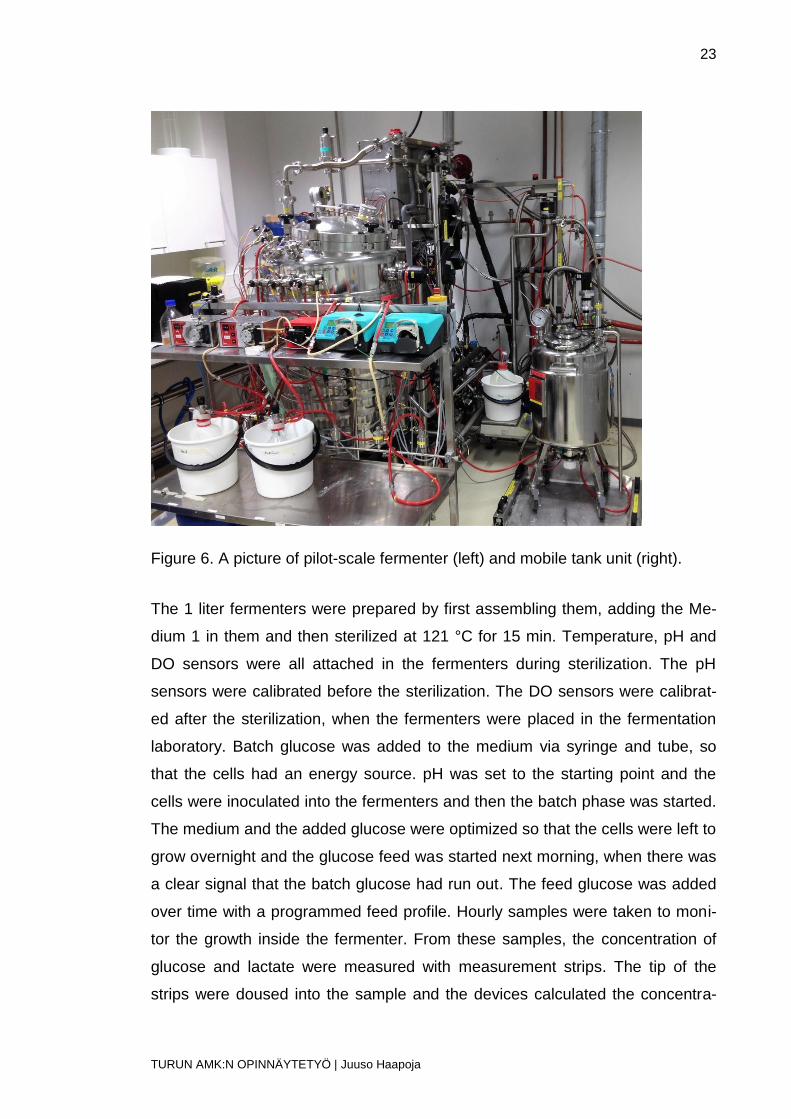
Figure 6. A picture of pilot-scale fermenter (left) and mobile tank unit (right).
The 1 liter fermenters were prepared by first assembling them, adding the Me-
dium 1 in them and then sterilized at 121 °C for 15 min. Temperature, pH and
DO sensors were all attached in the fermenters during sterilization. The pH
sensors were calibrated before the sterilization. The DO sensors were calibrat-
ed after the sterilization, when the fermenters were placed in the fermentation
laboratory. Batch glucose was added to the medium via syringe and tube, so
that the cells had an energy source. pH was set to the starting point and the
cells were inoculated into the fermenters and then the batch phase was started.
The medium and the added glucose were optimized so that the cells were left to
grow overnight and the glucose feed was started next morning, when there was
a clear signal that the batch glucose had run out. The feed glucose was added
over time with a programmed feed profile. Hourly samples were taken to moni-
tor the growth inside the fermenter. From these samples, the concentration of
glucose and lactate were measured with measurement strips. The tip of the
strips were doused into the sample and the devices calculated the concentra-
24
TURUN AMK:N OPINNÄYTETYÖ | Juuso Haapoja
tions from the liquid. Also, the optical density was measured with spectropho-
tometer. Small samples were stored in a cold room for further testing. After the
fermentation, lysis buffer was added into the fermenters. The buffer was left to
affect the medium overnight in a shaker and the next morning it was heat treat-
ed, cooled and harvested. Formulation buffer was added to the end products
and then they were stored in + 4 °C cold room for analysis.
With pilot-scale fermenter, the preparations were started by sterilizing the mo-
bile feed tank which was batched with the feed glucose. Simultaneously, the
fermenter’s pH sensors were calibrated and the fermenter was batched with hot
water and the Medium 1 reagents. While the medium was mixing, supplements
were connected to the supplement lines of the fermenter. When all the supple-
ments were attached, the fermenter was sterilized. After the sterilization, a small
amount of glucose was pumped from the mobile tank to the fermenter to act as
the batch glucose. The DO sensor was calibrated and the pH adjusted to match
the starting pH of the fermentation. Before starting the fermentation, the PID-
control values were checked from the control computer.
The inoculation of the cells was performed in the evening to time the start of the
feed phase to early next morning. The cells used in the pilot-scale were culti-
vated in shake flasks. The shake flasks were shaken with 250 rpm at 30 °C.
The inoculation was performed with syringe via septum.
The feed phase was started when the glucose in the fermenter had run out, as
in the smaller fermenters. The glucose was added according to the pro-
grammed feed profile. Hourly samples and measurements were performed as
with the 1 liter fermenters. After the fermentation, lysis buffer was added into the
fermenter and it was left there overnight. Next morning, the solution was heat
treated, cooled and then ultra-filtrated to get the end product into smaller, more
concentrated volume. Formulation buffer was added into the concentrated
product and then it was stored in + 4 °C cold room for analysis.
25
TURUN AMK:N OPINNÄYTETYÖ | Juuso Haapoja
4.2 Enzyme activity assay
The assay was performed with two different buffer sets: commercial produced
Britton & Robinson buffer and Sodium acetate buffer prepared at MetGen. With
Britton & Robinson, three solutions with different pH were used: pH 4, 5 and 6.
With Sodium acetate solutions, used pH values were 4, 4.8 and 5. The pH 4
and 5 Sodium acetates were 25 mM solutions and the pH 4.8 a 50 mM solution.
The pH range was decided based on initial pH testing done by MetGen’s Genet-
ic Department. The substrate of the assay was ABTS. GSIII and MZ were used
as a standard and a positive control. The lysis buffer used in the samples was
the negative control.
Each sample was centrifuged at 7500 g for 5 min. Then, a 4 ml of the superna-
tant was pipetted to be used in the experiment. For the pilot-scale samples, a
1:10 dilution was used, as they had been concentrated with ultra-filtration. For
the positive control, a 1:50 dilution was used, as its known activity was high.
The rest of the samples were used as undiluted. All samples were let to reach
the room temperature before pipetting them to the plates. A total of six samples
were used, plus a standard, positive and negative control.
When all buffers and samples were pipetted, the plates were sealed with seal-
ing plastic and transferred to incubation at appropriate temperatures. Room
temperature samples were left on the laboratory table and the 30 °C and 40 °C
samples were put into incubators.
The room temperature samples were transferred to analysis after 30 min of in-
cubation. ABTS was added to the plates with row pipette. Plates were then
placed into the spectrophotometer and absorbance was measured every 30
seconds starting from 30 sec after adding the ABTS and ending at 5 min after
ABTS addition. The 30 °C and 40 °C samples were let to incubate for 60 min
and then they were transferred to the ABTS addition and spectrophotometer.
The spectrophotometer was heated up to match the temperatures the plates
were incubated in. After all measurements, the results were exported into a
flash drive and analyzed.
26
TURUN AMK:N OPINNÄYTETYÖ | Juuso Haapoja
5 RESULTS AND DISCUSSION
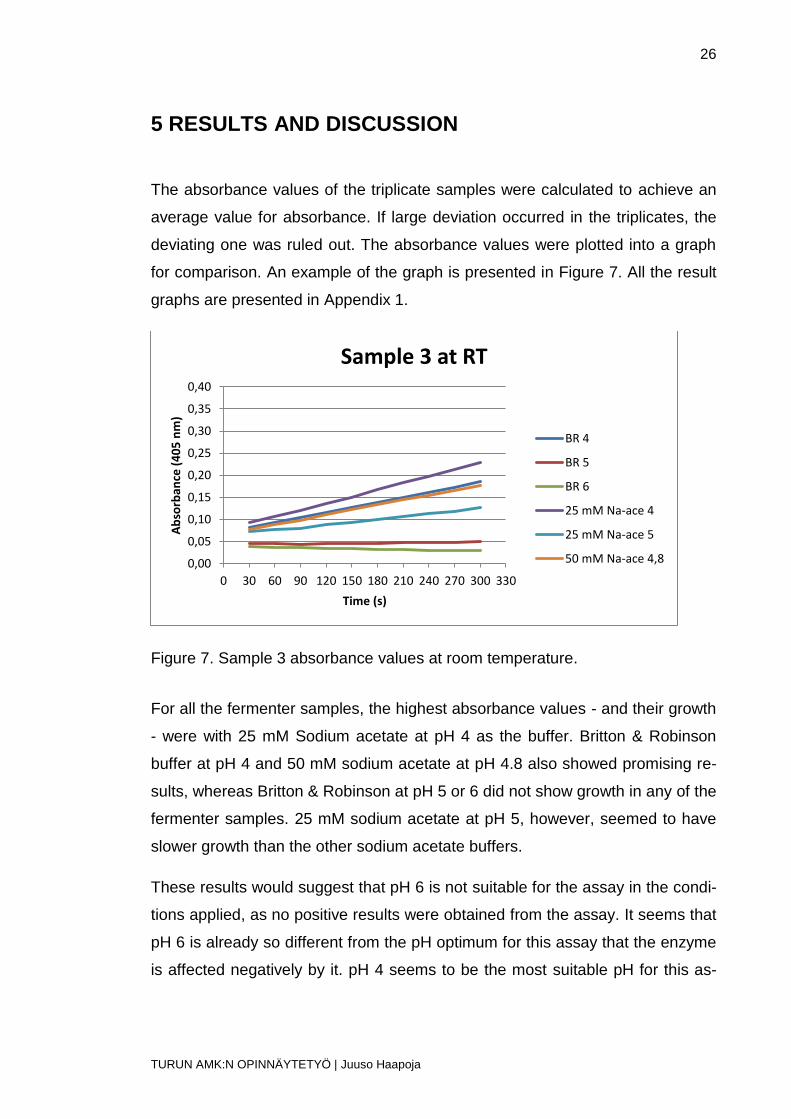
The absorbance values of the triplicate samples were calculated to achieve an
average value for absorbance. If large deviation occurred in the triplicates, the
deviating one was ruled out. The absorbance values were plotted into a graph
for comparison. An example of the graph is presented in Figure 7. All the result
graphs are presented in Appendix 1.
Figure 7. Sample 3 absorbance values at room temperature.
For all the fermenter samples, the highest absorbance values - and their growth
- were with 25 mM Sodium acetate at pH 4 as the buffer. Britton & Robinson
buffer at pH 4 and 50 mM sodium acetate at pH 4.8 also showed promising re-
sults, whereas Britton & Robinson at pH 5 or 6 did not show growth in any of the
fermenter samples. 25 mM sodium acetate at pH 5, however, seemed to have
slower growth than the other sodium acetate buffers.
These results would suggest that pH 6 is not suitable for the assay in the condi-
tions applied, as no positive results were obtained from the assay. It seems that
pH 6 is already so different from the pH optimum for this assay that the enzyme
is affected negatively by it. pH 4 seems to be the most suitable pH for this as-
0,00
0,05
0,10
0,15
0,20
0,25
0,30
0,35
0,40
0 30 60 90 120 150 180 210 240 270 300 330
Ab
sorb
ance
(4
05
nm
)
Time (s)
Sample 3 at RT
BR 4
BR 5
BR 6
25 mM Na-ace 4
25 mM Na-ace 5
50 mM Na-ace 4,8
27
TURUN AMK:N OPINNÄYTETYÖ | Juuso Haapoja
say, as with both sodium acetate and Britton &Robinson buffers, the develop-
ment of the absorbance during the assay is desirable. In addition, the 50 mM
sodium acetate at pH 4.8 showed almost as good results as the pH 4 buffers
but the pH 5 Britton & Robinson buffer, on the other hand, was not. It could be
that the change of 0.2 units in pH is within the area where the activity starts to
decrease rapidly, as depicted in Figure 3. Furthermore, the composition of the
two different buffers may have different effects on the activity. That, however,
seems unlikely, because absorbance values of the pH 4 Britton & Robinson and
25 mM sodium acetate were still quite close to each other. What is more, the
higher concentration of the pH 4.8 sodium acetate compared to the pH 5 sodi-
um acetate may be the factor that explains the better results. This could be veri-
fied with further testing.
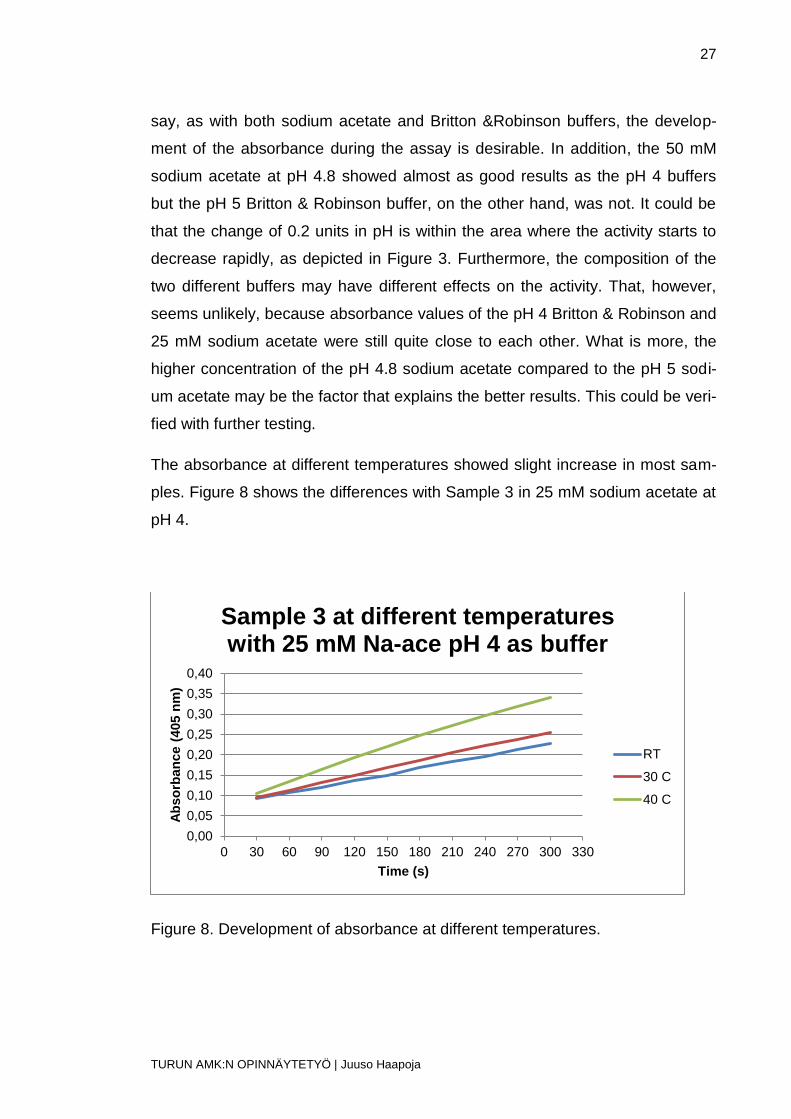
The absorbance at different temperatures showed slight increase in most sam-
ples. Figure 8 shows the differences with Sample 3 in 25 mM sodium acetate at
pH 4.
Figure 8. Development of absorbance at different temperatures.
0,00
0,05
0,10
0,15
0,20
0,25
0,30
0,35
0,40
0 30 60 90 120 150 180 210 240 270 300 330
Ab
so
rban
ce (
405 n
m)
Time (s)
Sample 3 at different temperatures with 25 mM Na-ace pH 4 as buffer
RT
30 C
40 C
28
TURUN AMK:N OPINNÄYTETYÖ | Juuso Haapoja
Few of the samples had quite similar results at room temperature and 30 °C.
This is because during the assay phase, the room temperatures varied between
23 °C and 25 °C, which is a smaller difference to the 30 °C than the difference
between 30 °C and 40 °C. Still, the fluctuation in room temperature during the
assay is notable. This can be seen clearly as small differences in the results.
From the average absorbance values, a slope (OD/s) was calculated for the
samples. From these slope values, a comparison to the GSIII slope was calcu-
lated. With the calculated ratio and the standard’s known activity, standard-
relative activity values were calculated for each sample. All graphs are present-
ed in Appendix 1.
The results show that the activity is highest with the two sodium acetate buffers:
the 25 mM at pH 4 and 50 mM at pH 4.8. The Britton & Robinson at pH 4 shows
the next highest values, but it is still much lower. The rest of the buffers exhibit-
ed smaller activity results. Of course, these values are compared to the stand-
ard, so it cannot be said that there is no activity at all in those conditions. This is
proven with the increase of the absorbance values with other buffers except the
Britton & Robinson with pH 6.
There are substantial differences between different temperatures, which even
more confirms the fact that enzyme activity is dependent on ambient tempera-
ture (Bisswanger 2012). The activity in the 50 mM sodium acetate buffer seems
to increase linearly, doubling the activity from room temperature to 40 °C. With
25 mM sodium acetate, the difference between room temperature and 30 °C is
not so high, with only a 12 % difference, but at 40 °C, the activity had increased
substantially. From the calculated results, it can be interpreted that the en-
zyme’s activity is highest at 40 °C. Further experiments should be conducted to
see if the activity would rise further at higher temperatures.
29
TURUN AMK:N OPINNÄYTETYÖ | Juuso Haapoja
6 CONCLUSION
The aim of this experiment was to study the fermentation processes used in
MetGen Oy and with that knowledge perform a wide range enzyme activity as-
say for the produced enzyme. Based on that assay, standard factors were cre-
ated for prospective assays.
The beginning of this experiment started with studying how to operate the fer-
menters. As there was no prior experience from using fermenters other than as
a part of one laboratory course, the process to get familiarized with the ma-
chines and protocols took time. Eventually, enough experience was achieved to
operate both fermenter scales and became adept to produce independently any
desired enzyme. It was time consuming and an important part of this experi-
ment and unfortunately it is not easily presented on paper.
All six fermentations that were included in the experiment were successful, as
the measurements conducted during the fermentation (OD, concentrations of
glucose and lactate) suggested that proper cell growth and enzyme production
were achieved. By analyzing the fermentation samples, the production of the
enzyme was shown to have been on a good level. The analytical part of the
study was conducted by using a ready-made protocol basis for the experiment.
However, some alterations were made because the experiment was broader
than what the protocol provided instructions for. Otherwise, the protocol was
followed.
The risk of errors occurring during the experiment is quite limited because the
fermenters and the spectrophotometer were automated machines. The greatest
error factor may be the operator. The timing of the assay measurements was up
to the operator, so the small deviations in the times between each measure-
ment may differ due to the human reaction time factor. Also, during the prepara-
tion of the assay samples, errors in the heterogenetic composition of the sam-
ples may affect the results. The pipetted volumes were tens of microliters, and
thus, even a small change in the sample composition could have had an impact
30
TURUN AMK:N OPINNÄYTETYÖ | Juuso Haapoja
to the results. Errors might also have occurred in the calculations. There was a
great deal of results to analyze and multiple calculations were performed. There
could have been a miscalculation during the analysis of the numbers, which
could have affected the final results. (Hiltunen et al. 2011, 38-42)
These factors were limited to a minimum with precise actions. Each of the as-
say samples was prepared and pipetted from the supernatant of the fermenter
samples. The samples were centrifuged at 7500 g for 10 min before pipetting,
which should have cleared the supernatant enough such that no cell debris was
present in the assay samples. In pipetting, automatic pipettes and reverse pipet-
ting were used to ensure the right volume of liquid into the assay mix. This
should have excluded pipetting error during the preparation of the samples. Al-
so, the pipettes were properly calibrated and maintained. (Hänninen et al. 2010,
66-67)
From the tested pH, temperatures and buffers, different results were calculated.
Based on the results, the assay was evaluated and standard factors for oncom-
ing assays of this enzyme are proposed:
As the reaction buffer, the 25 mM sodium acetate is recommended. Even if the
50 mM solution gave equally high or higher comparable enzyme activity values,
the 25 mM solution showed better results on the absorbance values. It is better
to work with clearly increasing absorbance and then convert to activity values. A
pH value of 4 is now recommended as the standard pH for the assay. Absorb-
ance in both pH 4 buffers showed clear increase in absorbance and ease con-
verting that into an activity value. The temperature for the assay is to be 30 °C.
It requires less energy to maintain during the assay than 40 °C and there will be
less fluctuation percentage-wise if there is contact with room temperature. 30 °C
also removes the effects of the temperature variations that are present at room
temperature. The substrate of the assay will be ABTS as clear and measurable
color reaction was obtained with it. It also did not seem to affect the assay
negatively in any way so there is currently no need to change it.

31
TURUN AMK:N OPINNÄYTETYÖ | Juuso Haapoja
The experiment itself was challenging because many new things needed to be
learnt from the preparation of the fermentation medium and operating the fer-
menters to calculating the activity values. Still, the experiment was successful
and allowed the determination of standard factors for the activity assay. During
the experiment, important guidance was provided by Bas Romein. I would like
to thank him for everything he did to enable this experiment, Taina Lahtinen for
help with the fermenters and also MetGen Oy in general for the opportunity to
work on this Bachelor’s Thesis in their facilities.

32
TURUN AMK:N OPINNÄYTETYÖ | Juuso Haapoja
SOURCES
Batt, C.A. and Tortorello, M.-L., 1999. Encyclopedia of Food Microbiology, second edition. Ref-
erenced 23.03.2016 http://www.sciencedirect.com/science/referenceworks/9780122270703
BBC 2011, referenced 19.5.2016
http://www.bbc.co.uk/schools/gcsebitesize/science/add_aqa_pre_2011/enzymes/enzymes1.sht
ml
Bisswanger, H., 2012. Enzyme assays. Referenced 21.03.2016
http://www.sciencedirect.com/science/article/pii/S2213020914000068
Elsevier.
Hänninen, H., Ruismäki, M., Seikola, A. & Slöör, S. 2010. Laboratoriotyön perusteet, first-second edition. Edita Publishing Oy.
Hiltunen, E.,Linko, L., Hemminki, S., Hägg, M., Järvenpää, E., Saarinen, P., Simonen, S. & Kärhä, P. 2011. Laadukkaan mittaamisen perusteet. Centre of Metrology MIKES.
MarketsAndMarkets 2015, referenced 18.04.2016 http://www.marketsandmarkets.com/Market-
Reports/industrial-enzymes-market-237327836.html
Mathews, C. Van Holde, K. & Ahern, K. 2000. Biochemistry, third edition. Benjamin/Cummings, San Francisco.
MetGen, 2016. Referenced 17.04.2016 http://www.metgen.com/
Reddy, S.M., Reddy, Ram S., & Babu, G. Narendra, 2012. Basic industrial biotechnology. New Age International, New Delhi. Referenced 29.03.2016 http://site.ebrary.com.ezproxy.turkuamk.fi/lib/turkuamk/detail.action?docID=10594268
Reymond, J.-L., Fluxà, V.S. & Maillard, N., 2008. Enzyme assays. Referenced 27.03.2016
http://gdb.unibe.ch/publications/148.pdf
Stanbury, P.F., Whitaker, A. and Hall, S.J., 1995. Principles of Fermentation Technology, sec-
ond edition. Butterman-Heinemann, UK. Referenced 03.04.2016
https://biokamikazi.files.wordpress.com/2013/09/principles_of_fermentation_technology-
stanburry_whittaker.pdf
Vogel, H. & Todaro, C. 2014. Fermentation and Biochemical Engineering Handbook. Oxford.

Appendix 1
TURUN AMK:N OPINNÄYTETYÖ | Juuso Haapoja
Graphs of the assay
Figure 9. Sample 1 absorbance values at room temperature.
Figure 10. Sample 1 absorbance values at 30 °C.
0,00
0,10
0,20
0,30
0,40
0,50
0,60
0 30 60 90 120 150 180 210 240 270 300 330
Ab
so
rban
ce (
405 n
m)
Time (s)
Sample 1 at RT
BR 4
BR 5
BR 6
25 mM Na-ace 4
25 mM Na-ace 5
50 mM Na-ace 4,8
0,00
0,10
0,20
0,30
0,40
0,50
0,60
0 30 60 90 120 150 180 210 240 270 300 330
Ab
so
rban
ce (
405 n
m)
Time (s)
Sample 1 at 30 °C
BR 4
BR 5
BR 6
25 mM Na-ace 4
25 mM Na-ace 5
50 mM Na-ace 4,8
Appendix 1
TURUN AMK:N OPINNÄYTETYÖ | Juuso Haapoja
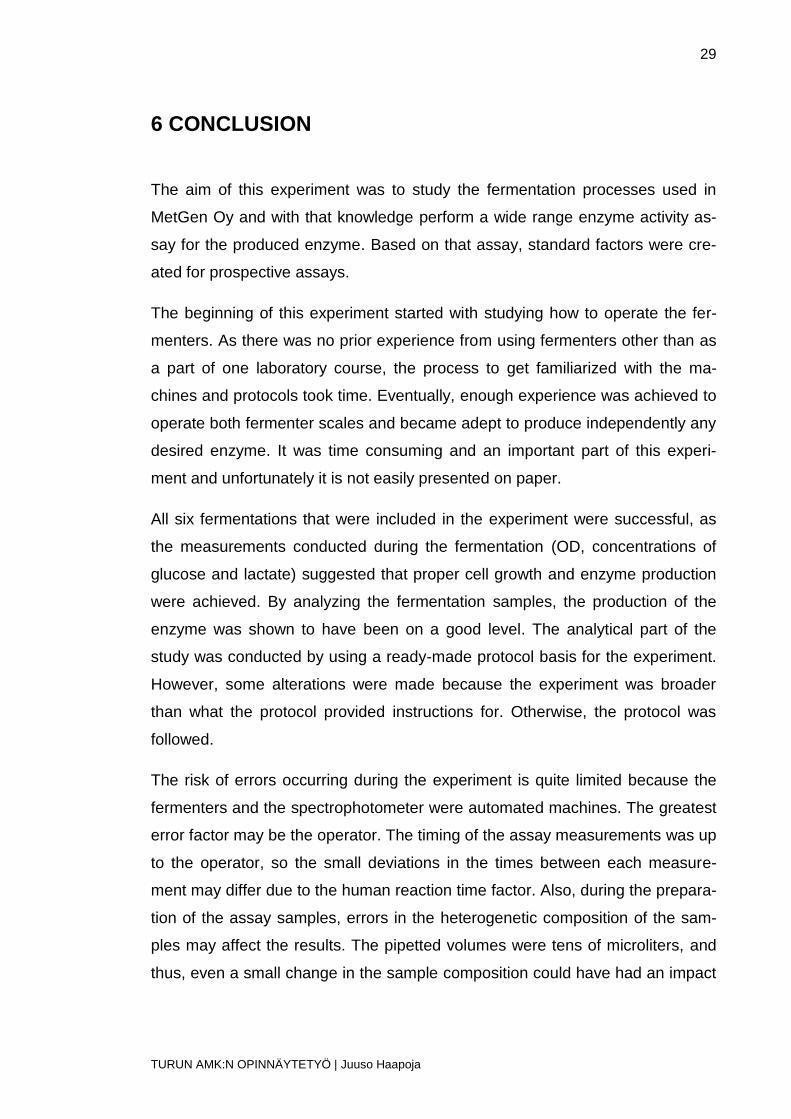
Figure 11. Sample 1 absorbance values at 40 °C.
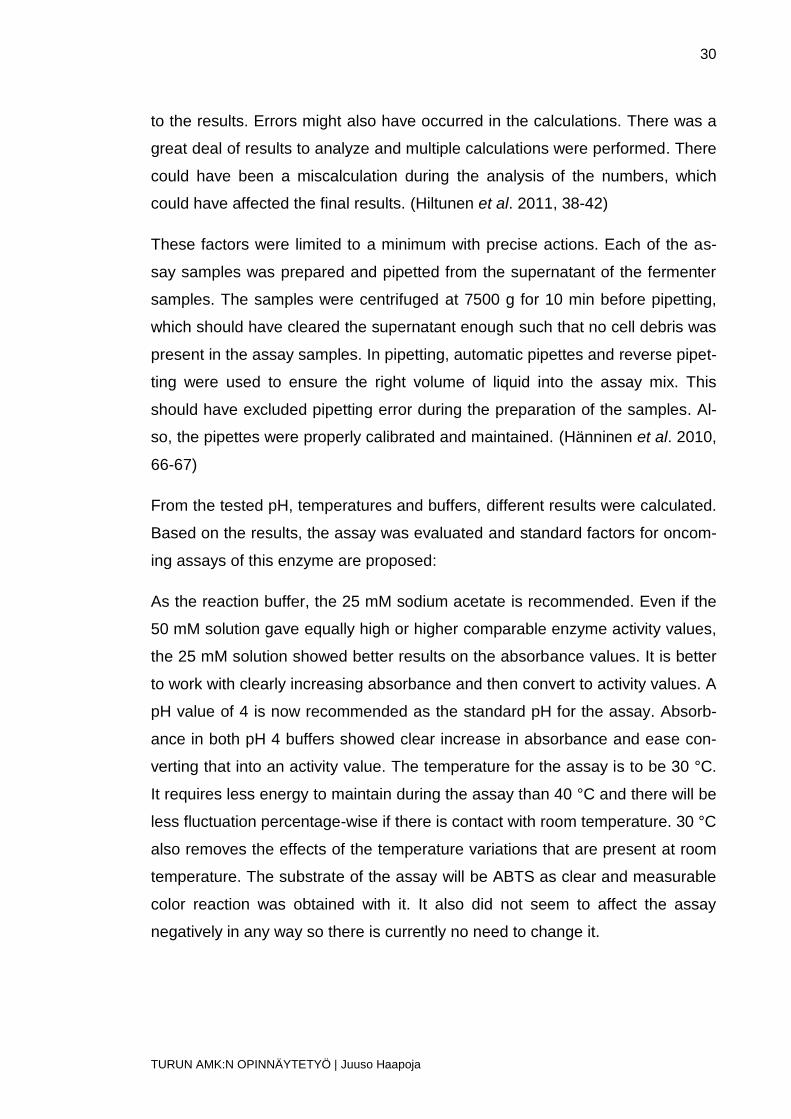
Figure 12. Sample 2 absorbance values at room temperature.
0,00
0,10
0,20
0,30
0,40
0,50
0,60
0 30 60 90 120 150 180 210 240 270 300 330
Ab
so
rban
ce (
405 n
m)
Time (s)
Sample 1 at RT
BR 4
BR 5
BR 6
25 mM Na-ace 4
25 mM Na-ace 5
50 mM Na-ace 4,8
0,00
0,10
0,20
0,30
0,40
0,50
0,60
0,70
0,80
0 30 60 90 120 150 180 210 240 270 300 330
Ab
so
rban
ce (
405 n
m)
Time (s)
Sample 2 at RT
BR 4
BR 5
BR 6
25 mM Na-ace 4
25 mM Na-ace 5
50 mM Na-ace 4,8
Appendix 1
TURUN AMK:N OPINNÄYTETYÖ | Juuso Haapoja
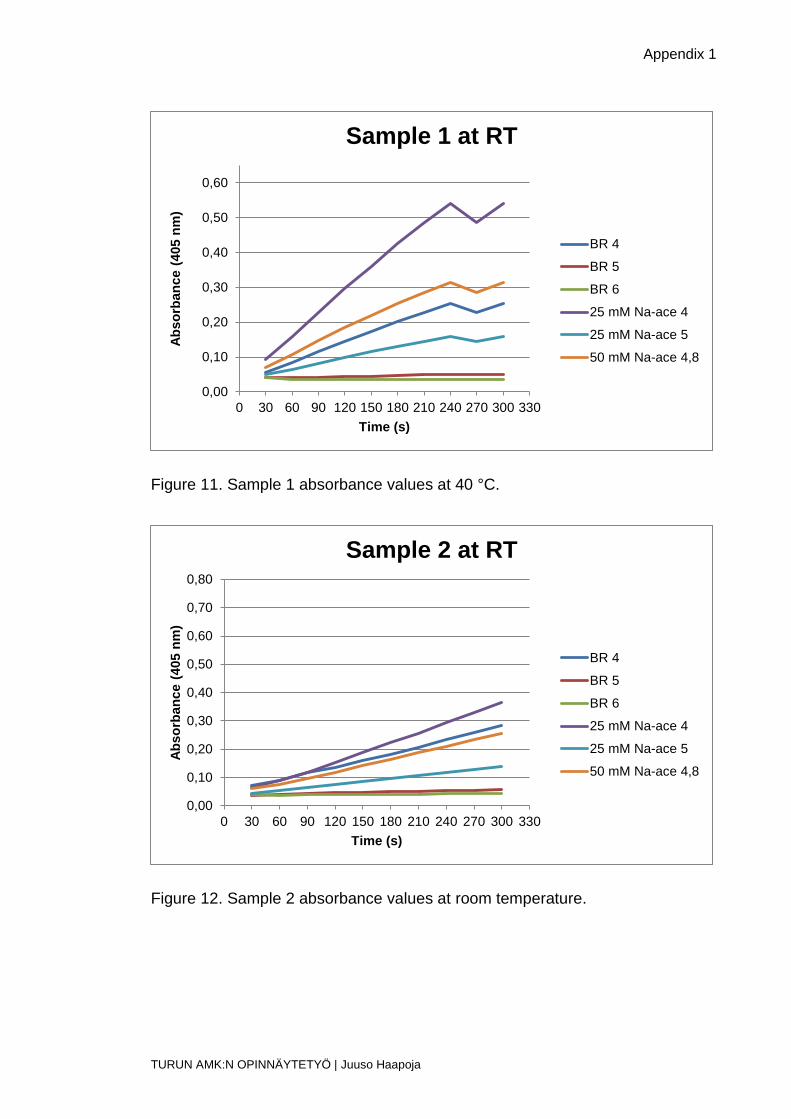
Figure 13. Sample 2 absorbance values at 30 °C.
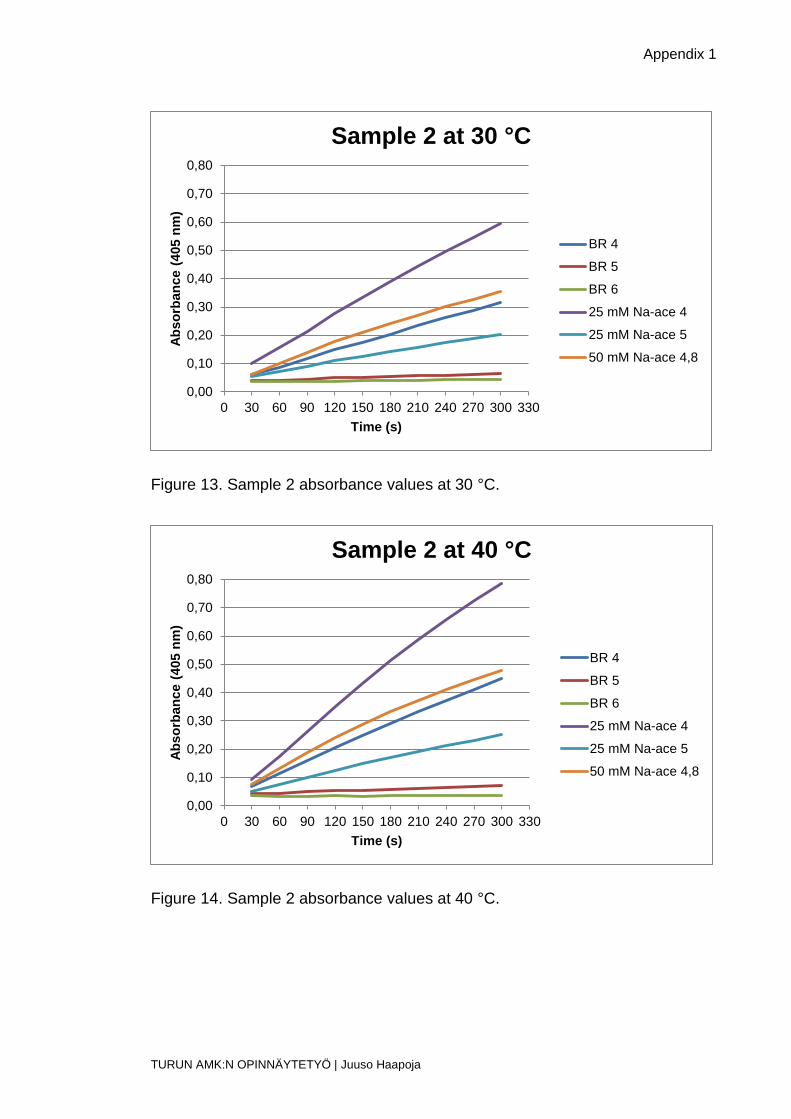
Figure 14. Sample 2 absorbance values at 40 °C.
0,00
0,10
0,20
0,30
0,40
0,50
0,60
0,70
0,80
0 30 60 90 120 150 180 210 240 270 300 330
Ab
so
rban
ce (
405 n
m)
Time (s)
Sample 2 at 30 °C
BR 4
BR 5
BR 6
25 mM Na-ace 4
25 mM Na-ace 5
50 mM Na-ace 4,8
0,00
0,10
0,20
0,30
0,40
0,50
0,60
0,70
0,80
0 30 60 90 120 150 180 210 240 270 300 330
Ab
so
rban
ce (
405 n
m)
Time (s)
Sample 2 at 40 °C
BR 4
BR 5
BR 6
25 mM Na-ace 4
25 mM Na-ace 5
50 mM Na-ace 4,8

Appendix 1
TURUN AMK:N OPINNÄYTETYÖ | Juuso Haapoja
Figure 15. Sample 3 absorbance values at room temperature.
Figure 16. Sample 3 absorbance values at 30 °C.
0,00
0,05
0,10
0,15
0,20
0,25
0,30
0,35
0,40
0 30 60 90 120 150 180 210 240 270 300 330
Ab
so
rban
ce (
405 n
m)
Time (s)
Sample 3 at RT
BR 4
BR 5
BR 6
25 mM Na-ace 4
25 mM Na-ace 5
50 mM Na-ace 4,8
0,00
0,05
0,10
0,15
0,20
0,25
0,30
0,35
0,40
0 30 60 90 120 150 180 210 240 270 300 330
Ab
so
rban
ce (
405 n
m)
Time (s)
Sample 3 at 30 °C
BR 4
BR 5
BR 6
25 mM Na-ace 4
25 mM Na-ace 5
50 mM Na-ace 4,8
Appendix 1
TURUN AMK:N OPINNÄYTETYÖ | Juuso Haapoja
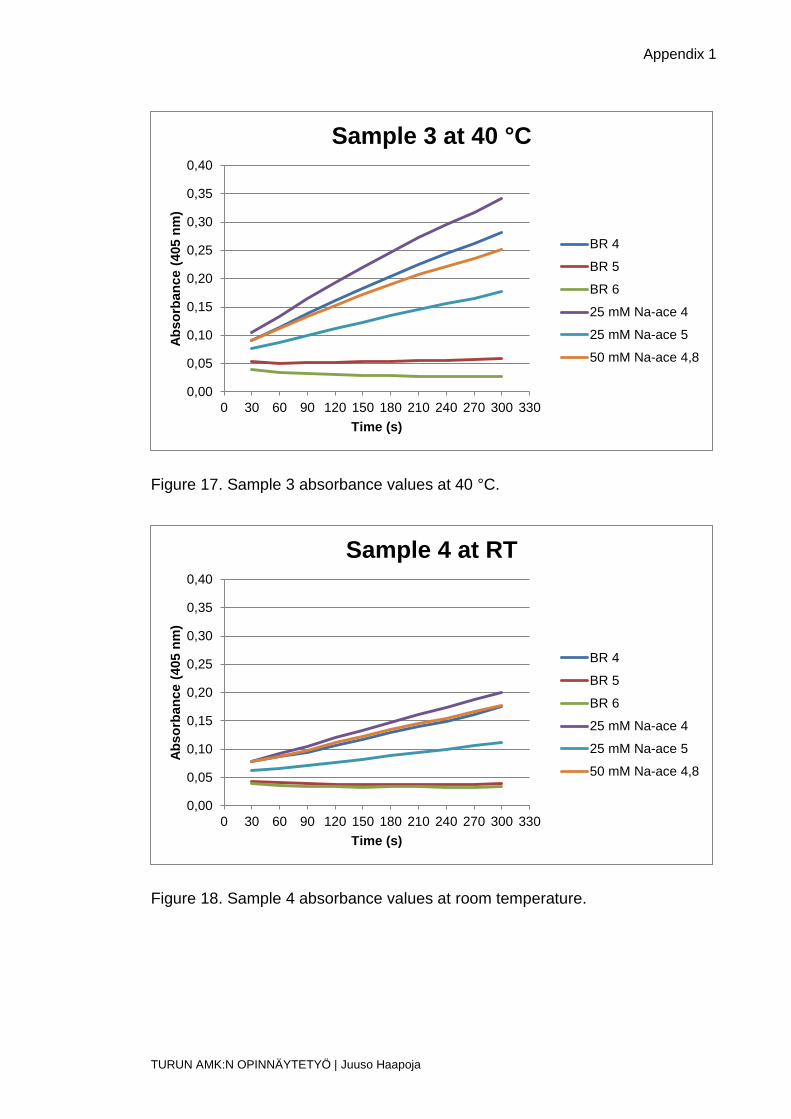
Figure 17. Sample 3 absorbance values at 40 °C.
Figure 18. Sample 4 absorbance values at room temperature.
0,00
0,05
0,10
0,15
0,20
0,25
0,30
0,35
0,40
0 30 60 90 120 150 180 210 240 270 300 330
Ab
so
rban
ce (
405 n
m)
Time (s)
Sample 3 at 40 °C
BR 4
BR 5
BR 6
25 mM Na-ace 4
25 mM Na-ace 5
50 mM Na-ace 4,8
0,00
0,05
0,10
0,15
0,20
0,25
0,30
0,35
0,40
0 30 60 90 120 150 180 210 240 270 300 330
Ab
so
rban
ce (
405 n
m)
Time (s)
Sample 4 at RT
BR 4
BR 5
BR 6
25 mM Na-ace 4
25 mM Na-ace 5
50 mM Na-ace 4,8
Appendix 1
TURUN AMK:N OPINNÄYTETYÖ | Juuso Haapoja
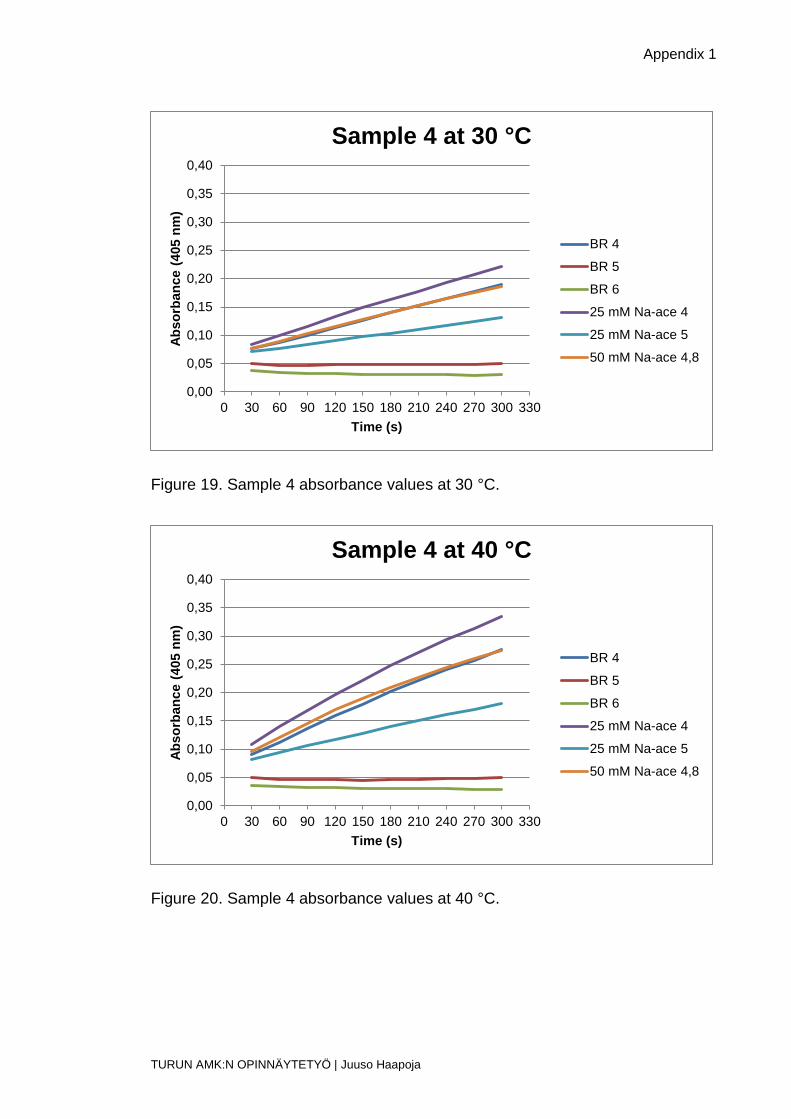
Figure 19. Sample 4 absorbance values at 30 °C.
Figure 20. Sample 4 absorbance values at 40 °C.
0,00
0,05
0,10
0,15
0,20
0,25
0,30
0,35
0,40
0 30 60 90 120 150 180 210 240 270 300 330
Ab
so
rban
ce (
405 n
m)
Time (s)
Sample 4 at 30 °C
BR 4
BR 5
BR 6
25 mM Na-ace 4
25 mM Na-ace 5
50 mM Na-ace 4,8
0,00
0,05
0,10
0,15
0,20
0,25
0,30
0,35
0,40
0 30 60 90 120 150 180 210 240 270 300 330
Ab
so
rban
ce (
405 n
m)
Time (s)
Sample 4 at 40 °C
BR 4
BR 5
BR 6
25 mM Na-ace 4
25 mM Na-ace 5
50 mM Na-ace 4,8
Appendix 1
TURUN AMK:N OPINNÄYTETYÖ | Juuso Haapoja
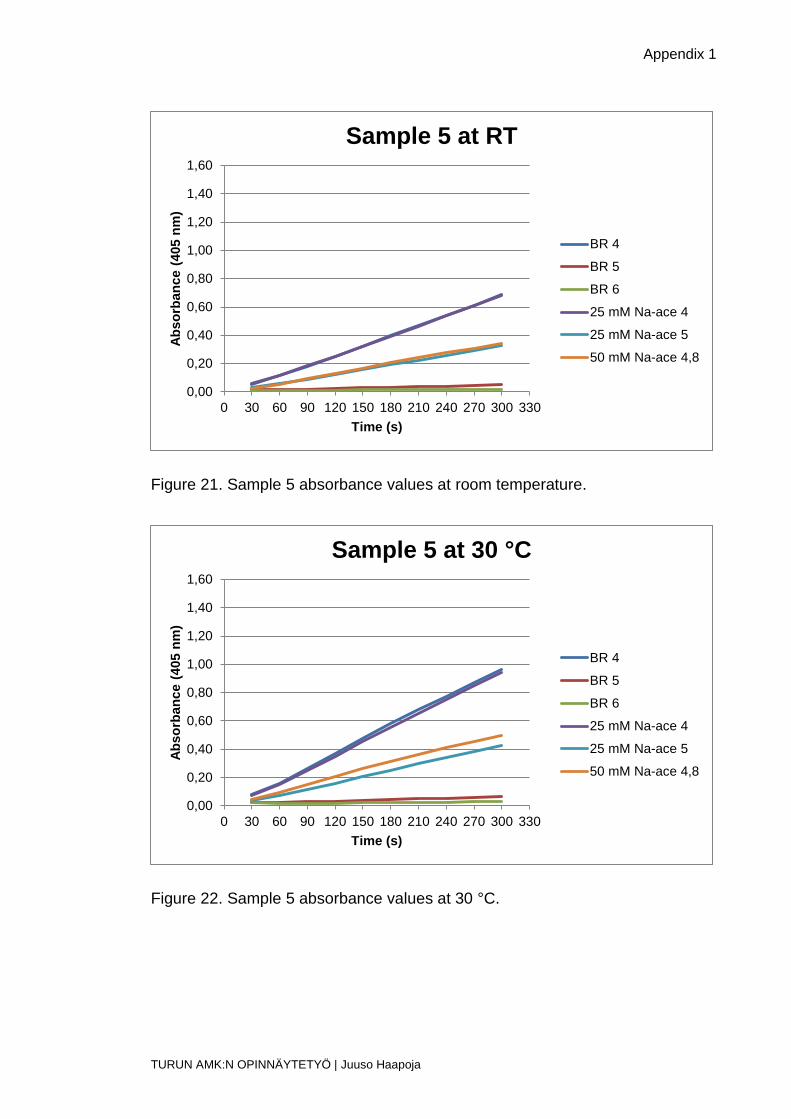
Figure 21. Sample 5 absorbance values at room temperature.
Figure 22. Sample 5 absorbance values at 30 °C.
0,00
0,20
0,40
0,60
0,80
1,00
1,20
1,40
1,60
0 30 60 90 120 150 180 210 240 270 300 330
Ab
so
rban
ce (
405 n
m)
Time (s)
Sample 5 at RT
BR 4
BR 5
BR 6
25 mM Na-ace 4
25 mM Na-ace 5
50 mM Na-ace 4,8
0,00
0,20
0,40
0,60
0,80
1,00
1,20
1,40
1,60
0 30 60 90 120 150 180 210 240 270 300 330
Ab
so
rban
ce (
405 n
m)
Time (s)
Sample 5 at 30 °C
BR 4
BR 5
BR 6
25 mM Na-ace 4
25 mM Na-ace 5
50 mM Na-ace 4,8
Appendix 1
TURUN AMK:N OPINNÄYTETYÖ | Juuso Haapoja
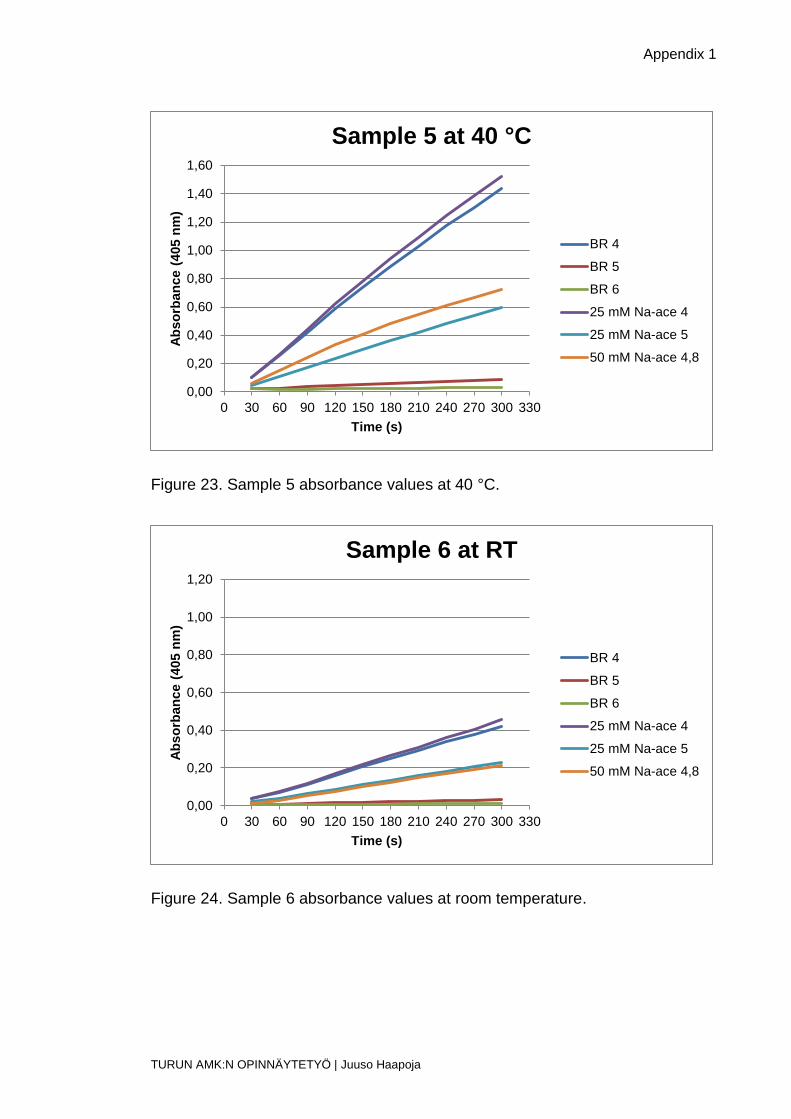
Figure 23. Sample 5 absorbance values at 40 °C.
Figure 24. Sample 6 absorbance values at room temperature.
0,00
0,20
0,40
0,60
0,80
1,00
1,20
1,40
1,60
0 30 60 90 120 150 180 210 240 270 300 330
Ab
so
rban
ce (
405 n
m)
Time (s)
Sample 5 at 40 °C
BR 4
BR 5
BR 6
25 mM Na-ace 4
25 mM Na-ace 5
50 mM Na-ace 4,8
0,00
0,20
0,40
0,60
0,80
1,00
1,20
0 30 60 90 120 150 180 210 240 270 300 330
Ab
so
rban
ce (
405 n
m)
Time (s)
Sample 6 at RT
BR 4
BR 5
BR 6
25 mM Na-ace 4
25 mM Na-ace 5
50 mM Na-ace 4,8
Appendix 1
TURUN AMK:N OPINNÄYTETYÖ | Juuso Haapoja
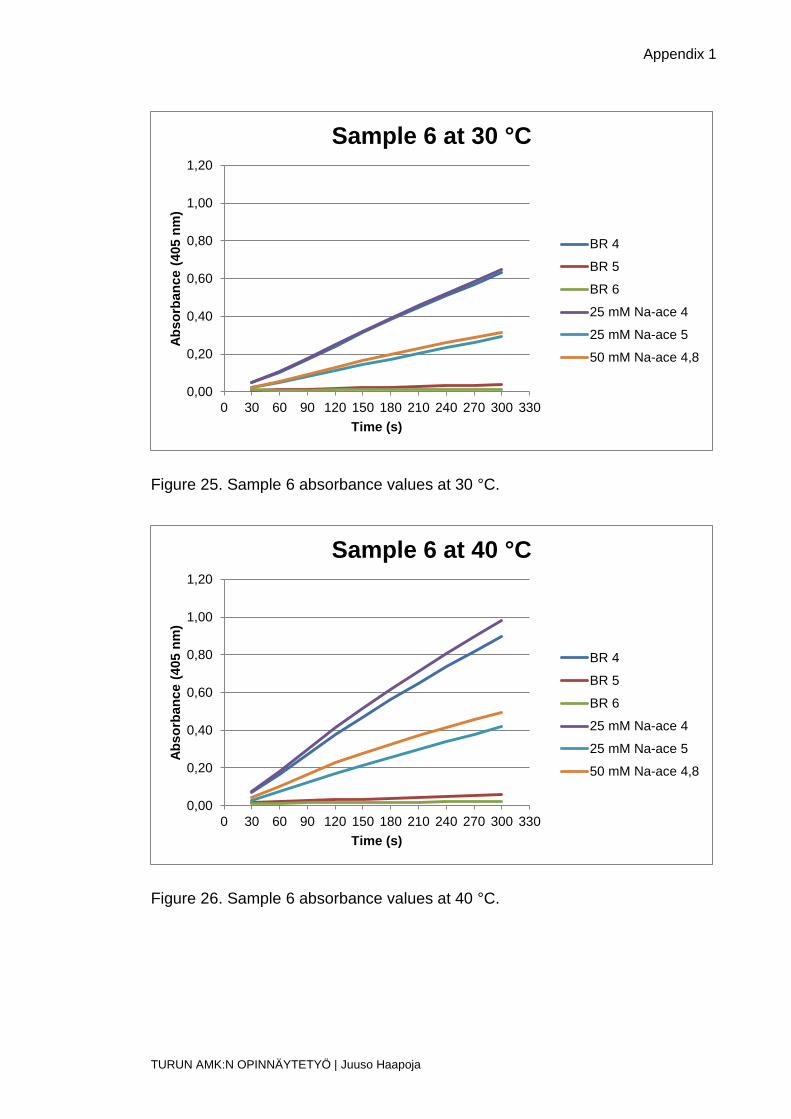
Figure 25. Sample 6 absorbance values at 30 °C.
Figure 26. Sample 6 absorbance values at 40 °C.
0,00
0,20
0,40
0,60
0,80
1,00
1,20
0 30 60 90 120 150 180 210 240 270 300 330
Ab
so
rban
ce (
405 n
m)
Time (s)
Sample 6 at 30 °C
BR 4
BR 5
BR 6
25 mM Na-ace 4
25 mM Na-ace 5
50 mM Na-ace 4,8
0,00
0,20
0,40
0,60
0,80
1,00
1,20
0 30 60 90 120 150 180 210 240 270 300 330
Ab
so
rban
ce (
405 n
m)
Time (s)
Sample 6 at 40 °C
BR 4
BR 5
BR 6
25 mM Na-ace 4
25 mM Na-ace 5
50 mM Na-ace 4,8
Appendix 1
TURUN AMK:N OPINNÄYTETYÖ | Juuso Haapoja
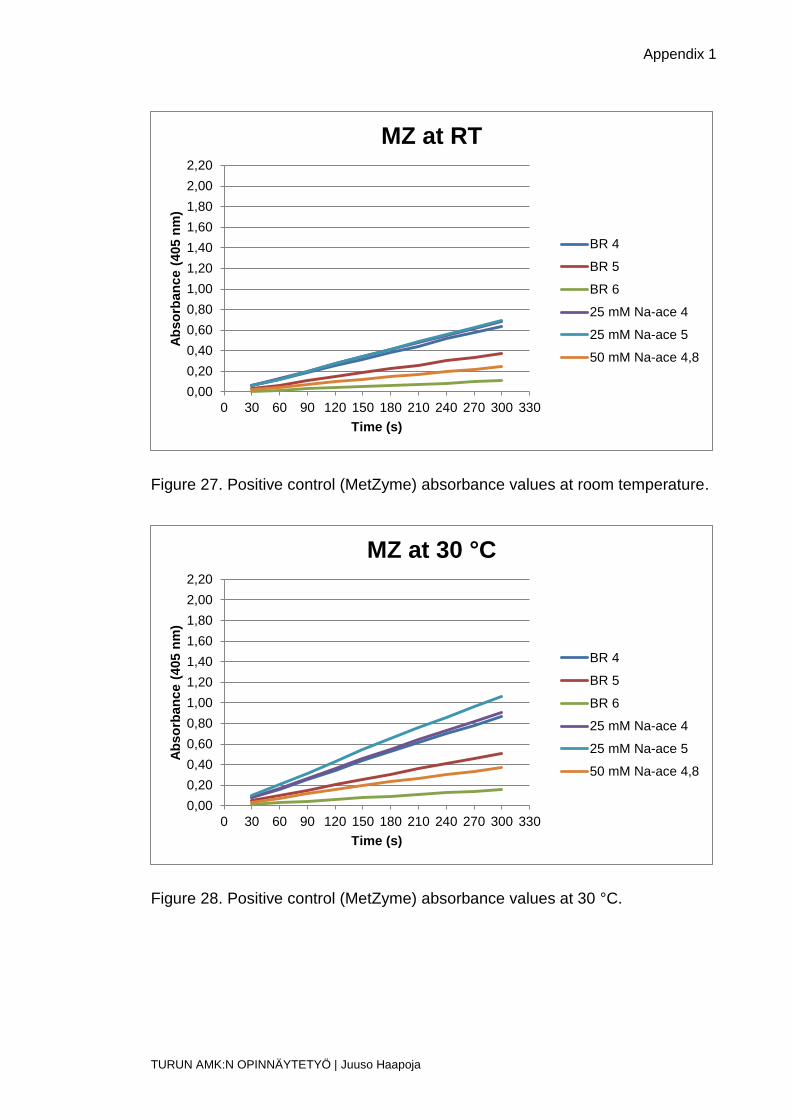
Figure 27. Positive control (MetZyme) absorbance values at room temperature.
Figure 28. Positive control (MetZyme) absorbance values at 30 °C.
0,00
0,20
0,40
0,60
0,80
1,00
1,20
1,40
1,60
1,80
2,00
2,20
0 30 60 90 120 150 180 210 240 270 300 330
Ab
so
rban
ce (
405 n
m)
Time (s)
MZ at RT
BR 4
BR 5
BR 6
25 mM Na-ace 4
25 mM Na-ace 5
50 mM Na-ace 4,8
0,00
0,20
0,40
0,60
0,80
1,00
1,20
1,40
1,60
1,80
2,00
2,20
0 30 60 90 120 150 180 210 240 270 300 330
Ab
so
rban
ce (
405 n
m)
Time (s)
MZ at 30 °C
BR 4
BR 5
BR 6
25 mM Na-ace 4
25 mM Na-ace 5
50 mM Na-ace 4,8
Appendix 1
TURUN AMK:N OPINNÄYTETYÖ | Juuso Haapoja
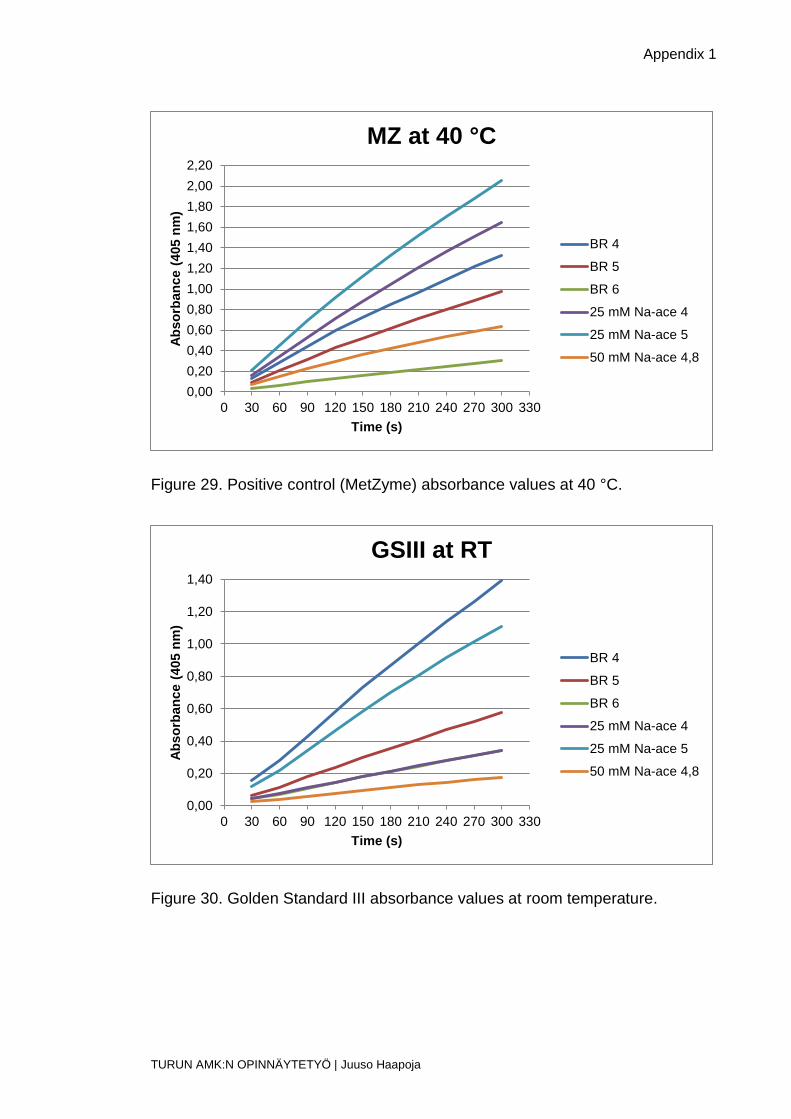
Figure 29. Positive control (MetZyme) absorbance values at 40 °C.
Figure 30. Golden Standard III absorbance values at room temperature.
0,00
0,20
0,40
0,60
0,80
1,00
1,20
1,40
1,60
1,80
2,00
2,20
0 30 60 90 120 150 180 210 240 270 300 330
Ab
so
rban
ce (
405 n
m)
Time (s)
MZ at 40 °C
BR 4
BR 5
BR 6
25 mM Na-ace 4
25 mM Na-ace 5
50 mM Na-ace 4,8
0,00
0,20
0,40
0,60
0,80
1,00
1,20
1,40
0 30 60 90 120 150 180 210 240 270 300 330
Ab
so
rban
ce (
405 n
m)
Time (s)
GSIII at RT
BR 4
BR 5
BR 6
25 mM Na-ace 4
25 mM Na-ace 5
50 mM Na-ace 4,8
Appendix 1
TURUN AMK:N OPINNÄYTETYÖ | Juuso Haapoja
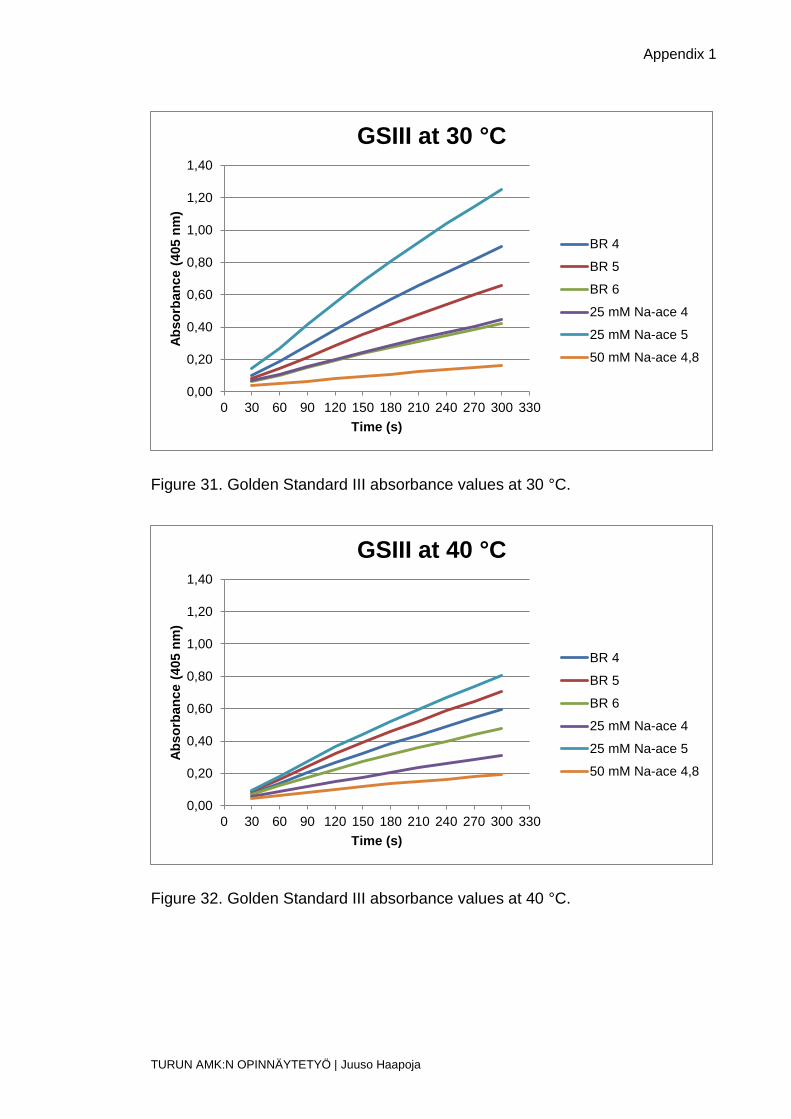
Figure 31. Golden Standard III absorbance values at 30 °C.
Figure 32. Golden Standard III absorbance values at 40 °C.
0,00
0,20
0,40
0,60
0,80
1,00
1,20
1,40
0 30 60 90 120 150 180 210 240 270 300 330
Ab
so
rban
ce (
405 n
m)
Time (s)
GSIII at 30 °C
BR 4
BR 5
BR 6
25 mM Na-ace 4
25 mM Na-ace 5
50 mM Na-ace 4,8
0,00
0,20
0,40
0,60
0,80
1,00
1,20
1,40
0 30 60 90 120 150 180 210 240 270 300 330
Ab
so
rban
ce (
405 n
m)
Time (s)
GSIII at 40 °C
BR 4
BR 5
BR 6
25 mM Na-ace 4
25 mM Na-ace 5
50 mM Na-ace 4,8