Embed Size (px)
Citation preview
RESEARCH AND POLICY NOTES 1 2102
Róbert Ambriško, Vítězslav Augusta, Dana Hájková, Petr Král, Pavla Netušilová, Milan Říkovský, Pavel Soukup:
Fiscal Discretion in the Czech Republic in 2001-2011: Has It Been Stabilizing?

RESEARCH AND POLICY NOTES
Fiscal Discretion in the Czech Republic in 2001-2011: Has It Been Stabilizing?
Róbert Ambriško Vítězslav Augusta
Dana Hájková Petr Král
Pavla Netušilová Milan Říkovský Pavel Soukup
1/2012
CNB RESEARCH AND POLICY NOTES The Research and Policy Notes of the Czech National Bank (CNB) are intended to disseminate the results of the CNB’s research projects as well as the other research activities of both the staff of the CNB and collaborating outside contributors, including invited speakers. The Notes aim to present topics related to strategic issues or specific aspects of monetary policy and financial stability in a less technical manner than the CNB Working Paper Series. The Notes are refereed internationally. The referee process is managed by the CNB Research Department. The Notes are circulated to stimulate discussion. The views expressed are those of the authors and do not necessarily reflect the official views of the CNB. Printed and distributed by the Czech National Bank. Available at http://www.cnb.cz.
Reviewed by: António Afonso (Technical University of Lisbon) Stephen Snudden (International Monetary Fund) Vít Bárta (Czech National Bank) Project Coordinator: Kamil Galuščák © Czech National Bank, September 2012 Róbert Ambriško, Vítězslav Augusta, Dana Hájková, Petr Král, Pavla Netušilová, Milan Říkovský, Pavel Soukup
Fiscal Discretion in the Czech Republic in 2001–2011:
Has It Been Stabilizing?
Róbert Ambriško, Vítězslav Augusta, Dana Hájková, Petr Král, Pavla Netušilová, Milan Říkovský, and Pavel Soukup*
Abstract
We survey discretionary measures of Czech fiscal policy in the period 2001–2011 and analyze their episodes and macroeconomic impacts. We use bottom-up and top-down methods to identify fiscal discretion and we compare the results with Kalman filtering. Fiscal discretion is found to be used frequently and to be large in several years. At the same time, the results signal that macroeconomic stabilisation has not been major aim of fiscal discretion measures. For example, in the years of economic recession 2010–2011, the government put emphasis on consolidation.
JEL Codes: H50, H62.
Keywords: Deficit, economic cycle, fiscal discretion, government expenditures, government revenues.
*Róbert Ambriško: Czech National Bank, Prague, Czech Republic; [email protected] Vítězslav Augusta: Czech National Bank, Prague, Czech Republic; [email protected] Dana Hájková: Czech National Bank, Prague, Czech Republic; [email protected] Petr Král: Czech National Bank, Prague, Czech Republic; [email protected] Pavla Netušilová: Czech National Bank, Prague, Czech Republic; [email protected] Milan Říkovský: Czech National Bank, Prague, Czech Republic; [email protected] Pavel Soukup: Czech National Bank, Prague, Czech Republic; [email protected] We thank Tomáš Holub, Jan Filáček, Luboš Komárek, António Afonso, Vít Bárta, and Stephen Snudden for valuable comments. Indispensable technical consultations and the Kalman filter estimates were provided by František Brázdik and Luboš Růžička. We also thank our colleagues from the Ministry of Finance of the Czech Republic for consultations on data adjustments. Any errors and omissions remain entirely our own. The views expressed herein are the views of the authors and do not necessarily represent the views of the affiliated institution.
2 R. Ambriško, V. Augusta, D. Hájková, P. Král, P. Netušilová, M. Říkovský, P. Soukup Nontechnical Summary
Fiscal policy influences the real economy through its institutional configuration and also by discretionary action if the government reacts to concurrent developments. In this paper, we document fiscal discretion in the Czech Republic in the years 2001–2011 based on macroeconomic data and on our own extensive survey of tax legislation changes that – to our knowledge - has not been conducted before in the context of Czech economy. We then suggest measures to capture the effects of fiscal discretion on the real economy. By fiscal discretion we mean deliberate changes to government revenue and expenditure parameters aimed at influencing macroeconomic developments beyond the regular and automatic effect of the basic fiscal policy set-up. We acknowledge that the empirical identification of fiscal discretion and the analysis of its impacts are complicated by the limited length of time series, by incomplete information, and by the presence of structural breaks. Therefore, we use three methods to evaluate fiscal discretion from different analytical angles:
(i) The bottom-up (direct) method summarizes the estimated effects of individual government revenue and expenditure discretionary measures. We collect a comprehensive database of tax legislation changes. The information on expenditure measures is incomplete, so we suggest two reasonable proxies for expenditure discretion.
(ii) The top-down (indirect) method measures fiscal discretion by the annual change in the ratio of the government budget balance to GDP.
(iii) As a verification tool, we use Kalman filtering to capture the macroeconomic effects of fiscal policy implicitly.
We use fiscal multipliers from the current literature to derive the macroeconomic effects of the discretion identified. These quantifications match the information about the main groups of fiscal measures adopted by the government. We describe these fiscal measures in the text.
In the second step, we use our fiscal discretion measures and macroeconomic data to investigate systematic features of fiscal policy conduct; we are mainly interested in whether, by using fiscal measures, governments targeted macroeconomic stabilization goals with short- and medium-term horizons (counter-cyclical effect) and/or long-term goals (consolidation of public finances).
Our results signal that macroeconomic stabilization has not been the major aim of fiscal discretion measures. We find a frequent occurrence of fiscal discretion and a large sized discretion in several years, with a pro-cyclical incidence in most cases. The pro-cyclical periods were also longer lasting than the counter-cyclical periods. This reflects different than stabilizing orientation of Czech fiscal policy, e.g. for 2010 and 2011, a government emphasis on consolidation in the years of economic recession.
Discretion in the Czech Republic in 2001-2011: Has It Been Stabilizing? 3
1. Introduction
In this paper, we conduct a large stock-taking exercise of fiscal discretion in the Czech Republic in the period 2001–2011. Being interested in the stabilization performance of Czech fiscal policy, we employ several methods to quantify fiscal discretion, and we put together detailed information about tax legislation changes introduced by the Czech governments.
We define fiscal discretion as deliberate changes to government revenue and expenditure parameters aimed at influencing macroeconomic developments beyond the regular and automatic effect of the basic fiscal policy set-up. Since fiscal discretion (e.g. changes in taxes and government expenditures) influences both trend and cyclical economic developments, it must be considered by the central bank when conducting monetary policy. In the CNB macroeconomic forecast, the expected fiscal discretion is quantified into fiscal impulse influencing private consumption, investment, the exchange rate, and productivity and technology trends.
Therefore, the motivation of the paper is to use the benefit of hindsight and to evaluate the influence of fiscal discretion on macroeconomic activity. This backward-looking analysis of the impacts of past fiscal measures provides useful insights into the characteristics of Czech fiscal policy. We are interested, above all, in the frequency and size of fiscal discretion and the stabilization performance of fiscal policy.
From the historical and global perspective, the use of fiscal policy for the purpose of macroeconomic stabilization has changed significantly, depending not only on economic conditions, but also on the development of economic theory. Recently, the importance of national fiscal policies increased in the euro area countries in the context of the introduction of the single currency. In the presence of asymmetric shocks, the transfer of monetary policy authority from national to supranational level became an argument for fiscal discretion to compensate for the loss of national autonomy over monetary and exchange rate policies to reduce the impacts of idiosyncratic external shocks.
Although the traditional Keynesian tool – the state budget – has not been systematically used to smooth the business cycle since the 1970s, the evidence from developed countries indicates that “permanent stimulation” of the economy via deficit financing of government expenditure has been omnipresent. The recent debt crisis has markedly limited the room for counter-cyclical fiscal policy in many countries. Fiscal discretion under these circumstances has often balanced between debt consolidation and macroeconomic stabilization. The focal problem has become to formulate economic policy so as to enable fiscal consolidation without substantial real costs, or to safeguard economic recovery without fiscal deterioration.
The optimality of pro-growth fiscal policy has been widely researched. The conventional belief is that the applicability and effectiveness of discretionary fiscal measures are limited by inadequate real-time information and by the existence of implementation delays. The effectiveness of short-term fiscal measures in the economy depends on idiosyncratic conditions and on the composition of the measures adopted. The benefits of discretionary fiscal policy are also uncertain due to “government failure” (McKean, 1965), inadequate measurement of the future benefits of public goods and of preferences for them, and crowding out of elementary public services (Tanzi, 1997).
4 R. Ambriško, V. Augusta, D. Hájková, P. Král, P. Netušilová, M. Říkovský, P. Soukup Empirical research shows that fiscal policy is often pro-cyclical (Ilzetzki and Vegh, 2008; Manasse, 2006; Talvi and Vegh, 2005); this pro-cyclicality appears in good times and causes a deficit bias of public budgets. Although the standard Keynesian view would expect anti-growth effects of fiscal savings, one strand of research shows that there may be expansionary fiscal consolidation (Afonso, 2010; Alesina and Ardagna, 1998; Giavazzi and Pagano, 1996). These studies come to the opinion that the short-term impacts of expenditure cuts can be stimulating for the economy and that the stimulating impacts happen because of Ricardian behavior of households and/or a decrease in the country’s risk premium. However, empirical literature on the expansionary effects of fiscal consolidation comes to mixed conclusions (Hemming, Kell, and Mahfouz, 2002; Prammer, 2004). Coenen et al. (2010) model fiscal consolidation for the euro area and conclude that in the given conditions fiscal consolidation had a positive long-term impact on macroeconomic variables (through lower interest debt costs), but simultaneously generated significant short-term costs (as a result of Keynesian effects on the consumption decisions and labor supply of non-Ricardian households).
There are several possible approaches to describing the size and effects of fiscal discretion. The real effects of fiscal policy changes are usually correlated with changes in government revenues and expenditures, so analysis may be performed on the aggregate level. Aggregate data can, however, hide structural changes, in which case analysis on the level of individual fiscal measures is preferable. This, in turn, may be hindered by insufficient availability of data and the fiscal policy impact must also be inferred from other evidence.
Therefore, in our analysis, we also employ a bottom-up approach, and construct a comprehensive database of information about discretionary changes in fiscal variables. To our knowledge, such an extensive survey has not been conducted before in the context of Czech economy. Since government expenditure measures are less documented, we propose reasonable proxies for expenditure discretion.
The text is structured as follows. Section 2 reviews empirical findings about the influence of Czech fiscal policy on real economic activity, Section 3 quantifies and describes Czech fiscal discretion, Section 4 analyzes the economic impacts of fiscal discretion, and Section 5 summarizes and concludes.
2. A Review of Relevant Literature for the Czech Republic
The empirical literature analyzing the impacts of fiscal policy in the Czech Republic includes the standard approaches used in this context and provides several estimates of fiscal multipliers. In general, empirical analysis of the impact of fiscal measures in the Czech Republic is complicated by the shortness of the relevant time series and by the presence of structural breaks in these series, and by the economic conditions in general.
Barrel et al. (2004) examined the real impacts of economic policies in selected (at that time candidate) EU countries, including the Czech Republic. The authors used macroeconomic analysis of panel data implemented in a global econometric model. Their results imply that the
Discretion in the Czech Republic in 2001-2011: Has It Been Stabilizing? 5
effectiveness of fiscal policy decreases with increasing openness. The estimated value of the fiscal multiplier for the Czech Republic is 0.4.
Král, Říkovský, and Hřebíček (2005) used regression analysis and structural simulation in order to explore the impact of fiscal policy on the Czech economy. In their paper, the channels of fiscal discretion and automatic stabilizers are analyzed together. The authors estimated that a permanent change in the demand-relevant government balance1 by one percentage point of GDP induces higher annual growth of GDP by 0.61 percentage point. The effectiveness of fiscal measures was further analyzed by Radkovský and Štiková (2008) using a structural VEC model. The authors find empirical support for the Keynesian propagation mechanism of fiscal policy. The positive effect of increased government expenditure on private GDP culminates in the second year of operation at approximately 0.2% of GDP, and the negative effect of increasing government revenues culminates in the first year and affects “private GDP” by approximately -0.4%.2
Current estimates of fiscal multipliers based on several specifications of structural VAR models were delivered by Ambriško, Babecký, and Valenta (2011) for the period 1996–2010. Their five-equation models indicate fiscal multiplier values of between 0.3 and 0.6 during the first year after the fiscal shock (the three-equation models imply the largest influence in the second to third year, reaching 0.6). The quantification of the multiplier effects of fiscal policy in a VAR model was examined by Prušvic (2010), who determined the expenditure multiplier at the level of 0.47 and the revenue multiplier at the level of -0.25 in the second year.
Štork and Závacká (2010) worked with a DSGE model of the Czech economy used by the Czech Ministry of Finance. In their paper, they extended the sectors of households3 and government within the core model in order to analyze the impact of individual fiscal measures on the real economy. The authors worked with aggregated fiscal variables, such as taxes on wages and consumption, government consumption, and transfers to households. The analysis was primarily focused on the transmission of fiscal measures to economic sectors and macroeconomic variables, with no explicit comments on fiscal multipliers.
A DSGE model was also applied by Klyuev and Snudden (2011)4 in order to estimate the tax and expenditure multipliers for the Czech economy. The authors simulated the impacts on the Czech economy for different consolidation measures. Selected impacts are listed in Table 1, expressed as deviations of real GDP from the baseline scenario during the first 5 years of temporary and permanent fiscal consolidation equal to 1% of GDP. The last column of the table indicates the long-term, steady-state impact on GDP.
1 The demand-relevant balance is defined in this paper as the difference between those government revenues and
expenditures in ESA95 methodology which are directly linked to revenue-expenditure circulation related to the creation, distribution, and use of gross domestic product. For example, subsidies to transformation institutions, fiscal transfers abroad, and income from the sale of telecommunication frequencies are excluded.
2 The fact that the expenditure multiplier is lower than the revenue multiplier can be partly attributed to the methodological approach. The authors state that in the case of analyzing the impact of government expenditure on total GDP, as the fiscal multiplier is normally understood, the impact would apparently be higher, as government consumption – as one component of government expenditure – is a part of overall GDP.
3 The model distinguishes between Ricardian and non-Ricardian households. Non-Ricardian households have no access to capital markets and therefore use all their income for consumption only (rule-of-thumb agents).
4 The IMF’s GIMF (Global Integrated Monetary and Fiscal) model was calibrated for the Czech economy.
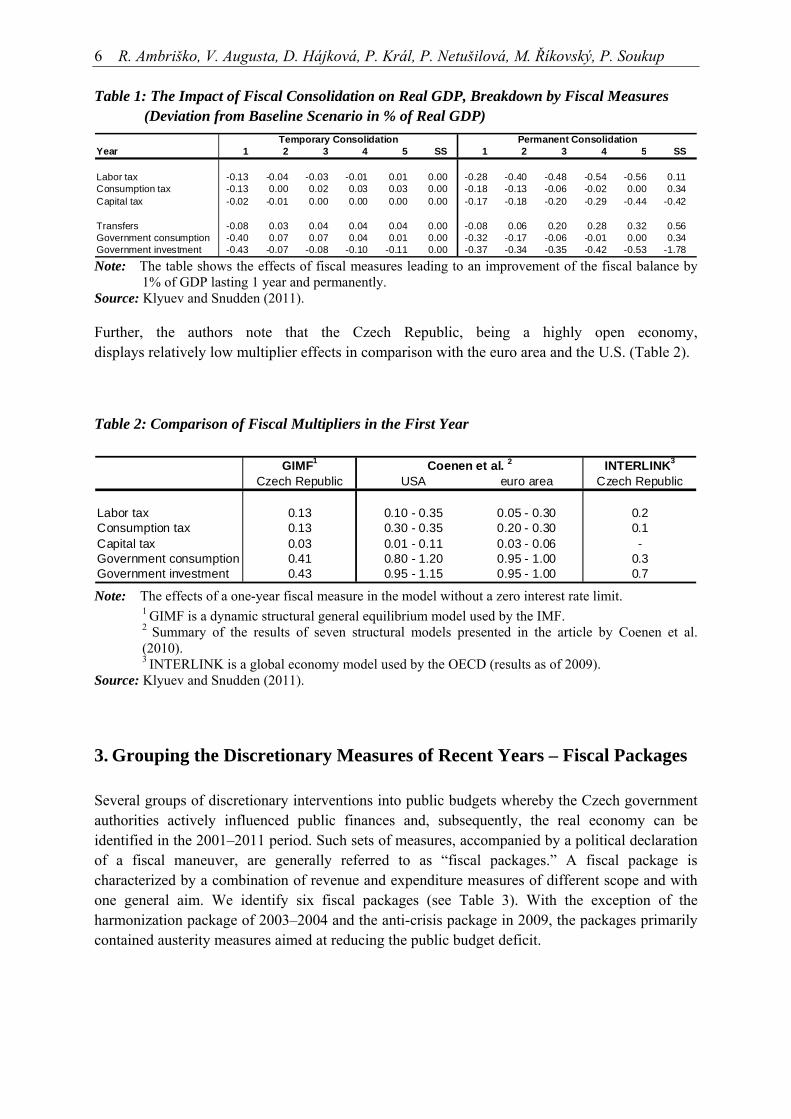
6 R. Ambriško, V. Augusta, D. Hájková, P. Král, P. Netušilová, M. Říkovský, P. Soukup Table 1: The Impact of Fiscal Consolidation on Real GDP, Breakdown by Fiscal Measures (Deviation from Baseline Scenario in % of Real GDP)
Year 1 2 3 4 5 SS 1 2 3 4 5 SS
Labor tax -0.13 -0.04 -0.03 -0.01 0.01 0.00 -0.28 -0.40 -0.48 -0.54 -0.56 0.11Consumption tax -0.13 0.00 0.02 0.03 0.03 0.00 -0.18 -0.13 -0.06 -0.02 0.00 0.34Capital tax -0.02 -0.01 0.00 0.00 0.00 0.00 -0.17 -0.18 -0.20 -0.29 -0.44 -0.42
Transfers -0.08 0.03 0.04 0.04 0.04 0.00 -0.08 0.06 0.20 0.28 0.32 0.56Government consumption -0.40 0.07 0.07 0.04 0.01 0.00 -0.32 -0.17 -0.06 -0.01 0.00 0.34Government investment -0.43 -0.07 -0.08 -0.10 -0.11 0.00 -0.37 -0.34 -0.35 -0.42 -0.53 -1.78
Temporary Consolidation Permanent Consolidation
Note: The table shows the effects of fiscal measures leading to an improvement of the fiscal balance by
1% of GDP lasting 1 year and permanently. Source: Klyuev and Snudden (2011). Further, the authors note that the Czech Republic, being a highly open economy, displays relatively low multiplier effects in comparison with the euro area and the U.S. (Table 2).
Table 2: Comparison of Fiscal Multipliers in the First Year
GIMF1 INTERLINK3
Czech Republic USA euro area Czech Republic
Labor tax 0.13 0.10 - 0.35 0.05 - 0.30 0.2Consumption tax 0.13 0.30 - 0.35 0.20 - 0.30 0.1Capital tax 0.03 0.01 - 0.11 0.03 - 0.06 -Government consumption 0.41 0.80 - 1.20 0.95 - 1.00 0.3Government investment 0.43 0.95 - 1.15 0.95 - 1.00 0.7
Coenen et al. 2
Note: The effects of a one-year fiscal measure in the model without a zero interest rate limit.
1 GIMF is a dynamic structural general equilibrium model used by the IMF. 2 Summary of the results of seven structural models presented in the article by Coenen et al. (2010). 3 INTERLINK is a global economy model used by the OECD (results as of 2009).
Source: Klyuev and Snudden (2011).
3. Grouping the Discretionary Measures of Recent Years – Fiscal Packages
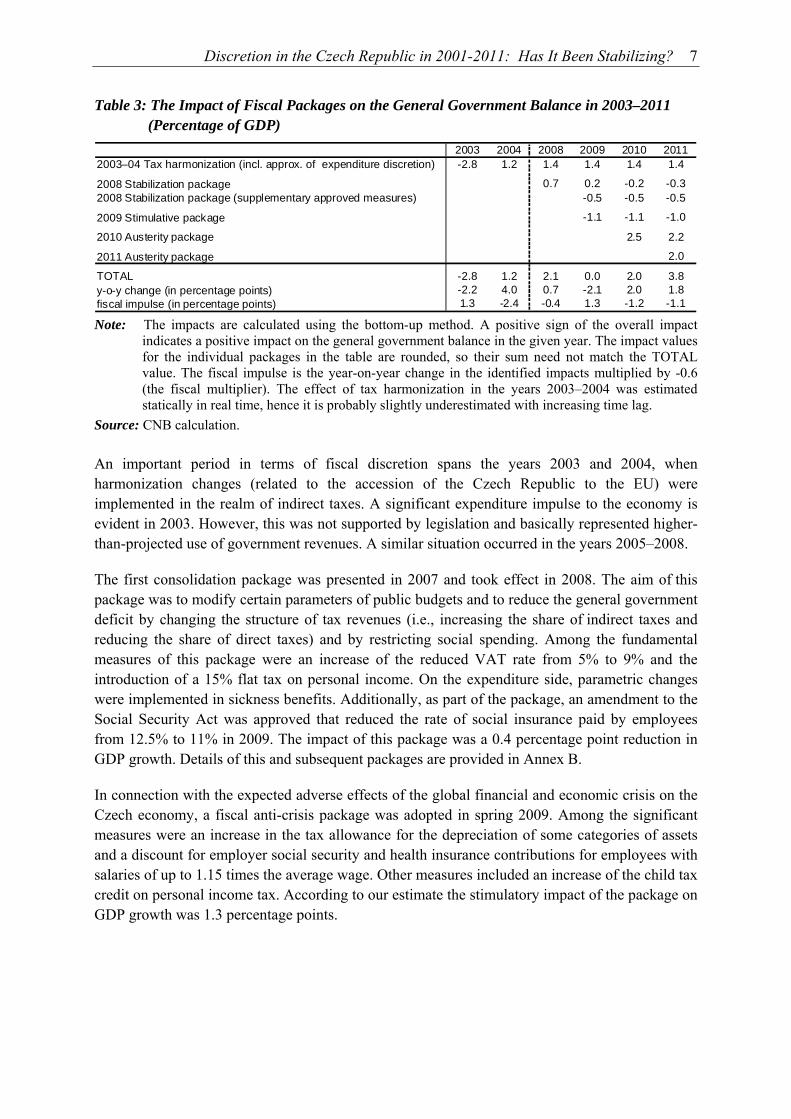
Several groups of discretionary interventions into public budgets whereby the Czech government authorities actively influenced public finances and, subsequently, the real economy can be identified in the 2001–2011 period. Such sets of measures, accompanied by a political declaration of a fiscal maneuver, are generally referred to as “fiscal packages.” A fiscal package is characterized by a combination of revenue and expenditure measures of different scope and with one general aim. We identify six fiscal packages (see Table 3). With the exception of the harmonization package of 2003–2004 and the anti-crisis package in 2009, the packages primarily contained austerity measures aimed at reducing the public budget deficit.
Discretion in the Czech Republic in 2001-2011: Has It Been Stabilizing? 7
Table 3: The Impact of Fiscal Packages on the General Government Balance in 2003–2011 (Percentage of GDP)
2003 2004 2008 2009 2010 20112003–04 Tax harmonization (incl. approx. of expenditure discretion) -2.8 1.2 1.4 1.4 1.4 1.4
2008 Stabilization package 0.7 0.2 -0.2 -0.32008 Stabilization package (supplementary approved measures) -0.5 -0.5 -0.5
2009 Stimulative package -1.1 -1.1 -1.0
2010 Austerity package 2.5 2.2
2011 Austerity package 2.0
TOTAL -2.8 1.2 2.1 0.0 2.0 3.8y-o-y change (in percentage points) -2.2 4.0 0.7 -2.1 2.0 1.8fiscal impulse (in percentage points) 1.3 -2.4 -0.4 1.3 -1.2 -1.1 Note: The impacts are calculated using the bottom-up method. A positive sign of the overall impact
indicates a positive impact on the general government balance in the given year. The impact values for the individual packages in the table are rounded, so their sum need not match the TOTAL value. The fiscal impulse is the year-on-year change in the identified impacts multiplied by -0.6 (the fiscal multiplier). The effect of tax harmonization in the years 2003–2004 was estimated statically in real time, hence it is probably slightly underestimated with increasing time lag.
Source: CNB calculation. An important period in terms of fiscal discretion spans the years 2003 and 2004, when harmonization changes (related to the accession of the Czech Republic to the EU) were implemented in the realm of indirect taxes. A significant expenditure impulse to the economy is evident in 2003. However, this was not supported by legislation and basically represented higher-than-projected use of government revenues. A similar situation occurred in the years 2005–2008.
The first consolidation package was presented in 2007 and took effect in 2008. The aim of this package was to modify certain parameters of public budgets and to reduce the general government deficit by changing the structure of tax revenues (i.e., increasing the share of indirect taxes and reducing the share of direct taxes) and by restricting social spending. Among the fundamental measures of this package were an increase of the reduced VAT rate from 5% to 9% and the introduction of a 15% flat tax on personal income. On the expenditure side, parametric changes were implemented in sickness benefits. Additionally, as part of the package, an amendment to the Social Security Act was approved that reduced the rate of social insurance paid by employees from 12.5% to 11% in 2009. The impact of this package was a 0.4 percentage point reduction in GDP growth. Details of this and subsequent packages are provided in Annex B.
In connection with the expected adverse effects of the global financial and economic crisis on the Czech economy, a fiscal anti-crisis package was adopted in spring 2009. Among the significant measures were an increase in the tax allowance for the depreciation of some categories of assets and a discount for employer social security and health insurance contributions for employees with salaries of up to 1.15 times the average wage. Other measures included an increase of the child tax credit on personal income tax. According to our estimate the stimulatory impact of the package on GDP growth was 1.3 percentage points.
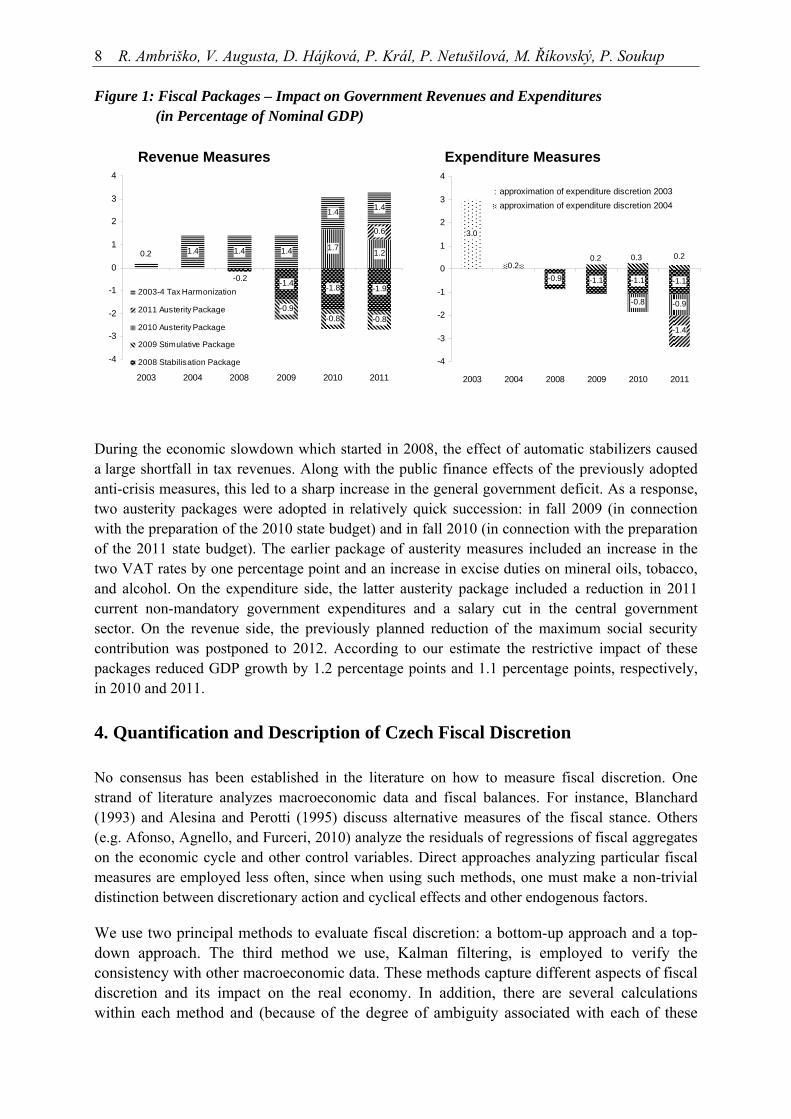
8 R. Ambriško, V. Augusta, D. Hájková, P. Král, P. Netušilová, M. Říkovský, P. Soukup Figure 1: Fiscal Packages – Impact on Government Revenues and Expenditures (in Percentage of Nominal GDP) Revenue Measures
-1.4 -1.8 -1.9
-0.9-0.8 -0.8
1.7 1.2
0.6
1.4 1.4 1.4
1.4 1.4
-0.2
0.2
-4
-3
-2
-1
0
1
2
3
4
2003 2004 2008 2009 2010 2011
2003-4 Tax Harmonization
2011 Austerity Package
2010 Austerity Package
2009 Stimulative Package
2008 Stabilisation Package
Expenditure Measures
-0.9 -1.1 -1.1 -1.1
-0.8 -0.9
-1.4
0.2
3.0
0.2 0.3 0.2
-4
-3
-2
-1
0
1
2
3
4
2003 2004 2008 2009 2010 2011
approximation of expenditure discretion 2003approximation of expenditure discretion 2004
During the economic slowdown which started in 2008, the effect of automatic stabilizers caused a large shortfall in tax revenues. Along with the public finance effects of the previously adopted anti-crisis measures, this led to a sharp increase in the general government deficit. As a response, two austerity packages were adopted in relatively quick succession: in fall 2009 (in connection with the preparation of the 2010 state budget) and in fall 2010 (in connection with the preparation of the 2011 state budget). The earlier package of austerity measures included an increase in the two VAT rates by one percentage point and an increase in excise duties on mineral oils, tobacco, and alcohol. On the expenditure side, the latter austerity package included a reduction in 2011 current non-mandatory government expenditures and a salary cut in the central government sector. On the revenue side, the previously planned reduction of the maximum social security contribution was postponed to 2012. According to our estimate the restrictive impact of these packages reduced GDP growth by 1.2 percentage points and 1.1 percentage points, respectively, in 2010 and 2011.
4. Quantification and Description of Czech Fiscal Discretion
No consensus has been established in the literature on how to measure fiscal discretion. One strand of literature analyzes macroeconomic data and fiscal balances. For instance, Blanchard (1993) and Alesina and Perotti (1995) discuss alternative measures of the fiscal stance. Others (e.g. Afonso, Agnello, and Furceri, 2010) analyze the residuals of regressions of fiscal aggregates on the economic cycle and other control variables. Direct approaches analyzing particular fiscal measures are employed less often, since when using such methods, one must make a non-trivial distinction between discretionary action and cyclical effects and other endogenous factors.
We use two principal methods to evaluate fiscal discretion: a bottom-up approach and a top-down approach. The third method we use, Kalman filtering, is employed to verify the consistency with other macroeconomic data. These methods capture different aspects of fiscal discretion and its impact on the real economy. In addition, there are several calculations within each method and (because of the degree of ambiguity associated with each of these
Discretion in the Czech Republic in 2001-2011: Has It Been Stabilizing? 9
methods) we place an emphasis on the robustness of the indicators. This approach provides a broad base for making inferences on the economic effects of fiscal policy while leaving enough room for expert evaluation.
As stated earlier, by fiscal discretion we mean deliberate changes to government revenue and expenditure parameters aimed at influencing macroeconomic developments beyond the regular and automatic effect of the basic fiscal policy set-up. The data used in the following analysis are from the national accounts as of April 2012.
4.1 Bottom-up Approach (Direct Method)
The bottom-up approach summarizes the estimated size of individual fiscal measures implemented on the revenue or the expenditure side of public budgets in nominal terms.
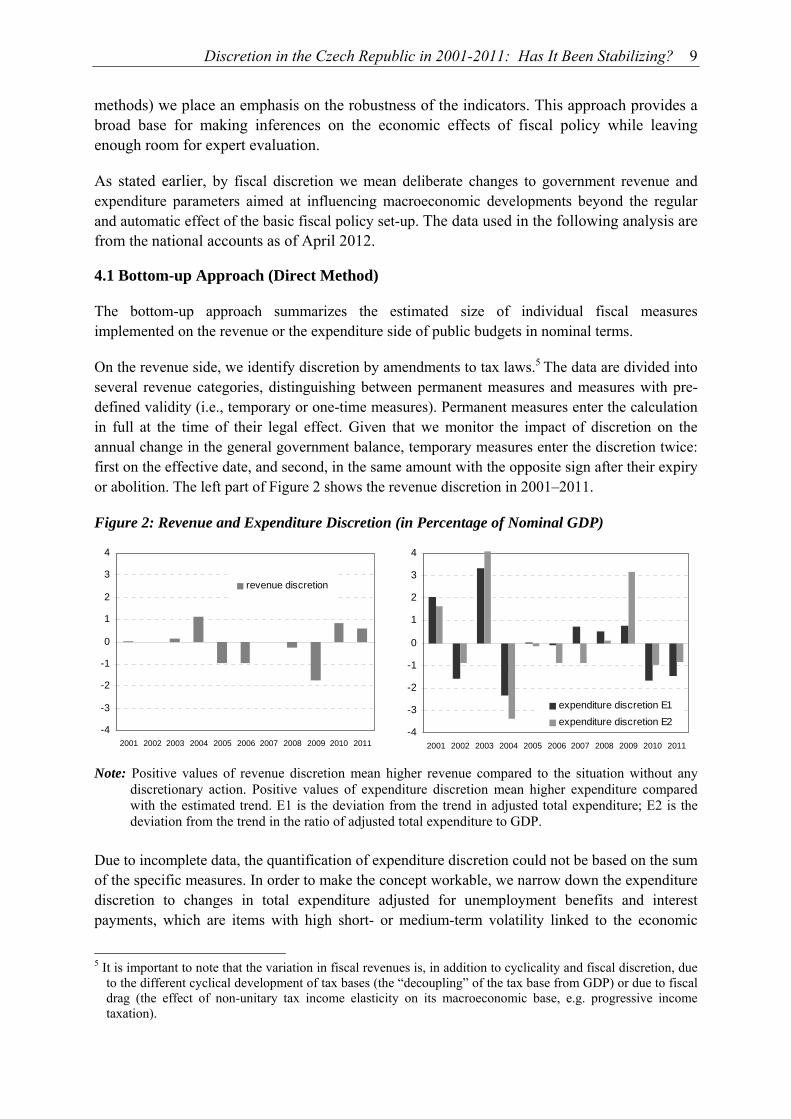
On the revenue side, we identify discretion by amendments to tax laws.5 The data are divided into several revenue categories, distinguishing between permanent measures and measures with pre-defined validity (i.e., temporary or one-time measures). Permanent measures enter the calculation in full at the time of their legal effect. Given that we monitor the impact of discretion on the annual change in the general government balance, temporary measures enter the discretion twice: first on the effective date, and second, in the same amount with the opposite sign after their expiry or abolition. The left part of Figure 2 shows the revenue discretion in 2001–2011.
Figure 2: Revenue and Expenditure Discretion (in Percentage of Nominal GDP)
-4
-3
-2
-1
0
1
2
3
4
2001 2002 2003 2004 2005 2006 2007 2008 2009 2010 2011
revenue discretion
-4
-3
-2
-1
0
1
2
3
4
2001 2002 2003 2004 2005 2006 2007 2008 2009 2010 2011
expenditure discretion E1expenditure discretion E2
Note: Positive values of revenue discretion mean higher revenue compared to the situation without any discretionary action. Positive values of expenditure discretion mean higher expenditure compared with the estimated trend. E1 is the deviation from the trend in adjusted total expenditure; E2 is the deviation from the trend in the ratio of adjusted total expenditure to GDP.
Due to incomplete data, the quantification of expenditure discretion could not be based on the sum of the specific measures. In order to make the concept workable, we narrow down the expenditure discretion to changes in total expenditure adjusted for unemployment benefits and interest payments, which are items with high short- or medium-term volatility linked to the economic
5 It is important to note that the variation in fiscal revenues is, in addition to cyclicality and fiscal discretion, due
to the different cyclical development of tax bases (the “decoupling” of the tax base from GDP) or due to fiscal drag (the effect of non-unitary tax income elasticity on its macroeconomic base, e.g. progressive income taxation).
10 R. Ambriško, V. Augusta, D. Hájková, P. Král, P. Netušilová, M. Říkovský, P. Soukup cycle, and to economic developments in general.6 Consequently, we model two versions of autonomous expenditure: (i) the trend in adjusted total expenditure, and (ii) the trend in the ratio of adjusted total expenditure to GDP.7 Finally, the size of fiscal discretion is approximated by the deviation of the value of adjusted total expenditure from the level of autonomous expenditure in levels (i) and GDP ratio (ii). Both versions of the expenditure discretion are displayed in the right part of Figure 2. Expenditure discretion as quantified by the variation in the GDP ratio indicates a more variable effect of fiscal policy on the economy than the variations in the simple level. This is due to a more stable trend in the ratio of expenditure to GDP compared to the trend in expenditure itself. The difference between the revenue and expenditure discretions gives the total bottom-up fiscal discretion.
4.2 Top-down Approach (Indirect Method)
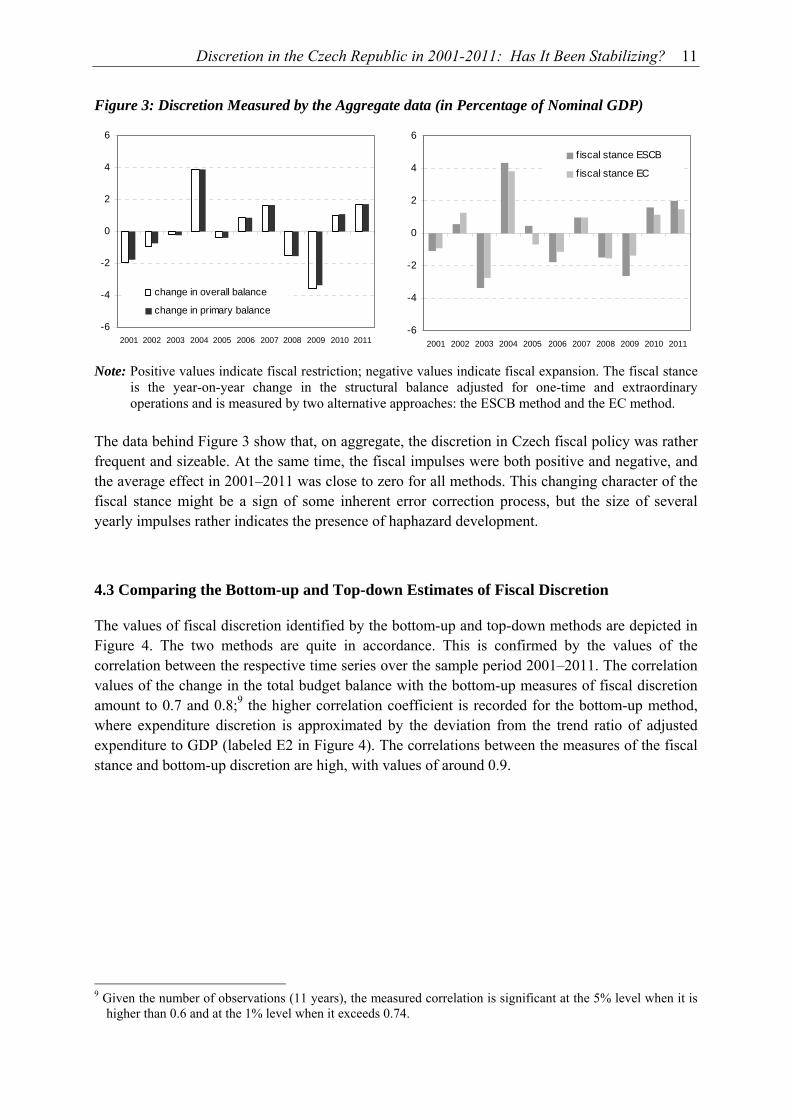
Using the top-down approach, we measure fiscal discretion from the macroeconomic point of view through year-on-year changes in government budget balances. This method assumes that in the absence of discretion, public finances would have a stable balance determined by the long-term set-up of fiscal policy. Changes in the total balance of public budgets, the primary balance, and the structural balance are analyzed. Changes in the structural balance are usually called the fiscal stance; positive values of the fiscal stance represent tight fiscal policy. The resulting discretions measured by the top-down approach are depicted in Figure 3.
By using the structural balance, one relaxes the rather strict assumption formulated above; the effects of the economic cycle influencing the total government budget balance are eliminated. The structural balance is obtained by taking the total balance and subtracting the effects of the economic cycle and the value of one-off and extraordinary operations (i.e., operations that are not regular flows and record considerable fluctuations over time – privatization proceeds, one-off non-tax and capital revenues, subsidies to transformation institutions, and guarantee installments) that have no bearing on the fiscal stance. We employ two methods for calculating the effects of the economic cycle: the first method (labeled “EC”) assumes that public finances are sensitive to changes in the output gap. The other method (labeled “ESCB”) links the individual components of government revenues and expenditure to their relevant macroeconomic bases and the sum of these components is assumed to be the total effect of the economic cycle.8 Both methods are described in detail in Annex A.
Figure 3 reveals that the effects of the economic cycle may obscure the evaluation of the fiscal stance. In 2002 and 2006, for instance, changes in the total and primary balances signal an opposite economic influence of fiscal policy than the measures based on the structural balance. Different approaches to the structural balance computation may also, however, yield different results (cf. 2005). We are aware of these caveats and interpret the indicators accordingly.
6 In addition, we exclude one-off expenditures in the form of capital transfers to the Czech Consolidation
Agency and a significant expenditure increase in 2003 (with an accompanying increase in capital revenues in the same year), because these expenditures are assumed not to have an effect on current demand.
7 Details of the calculation are provided in Annex A. 8 The “EC” label stands for the European Commission, since this method is used by the European Commission
in the framework of EU budgetary surveillance. The “ESCB” label stands for the European System of Central Banks, since this method is used for the needs of the ECB and ESCB.
Discretion in the Czech Republic in 2001-2011: Has It Been Stabilizing? 11
Figure 3: Discretion Measured by the Aggregate data (in Percentage of Nominal GDP)
-6
-4
-2
0
2
4
6
2001 2002 2003 2004 2005 2006 2007 2008 2009 2010 2011
change in overall balance
change in primary balance
-6
-4
-2
0
2
4
6
2001 2002 2003 2004 2005 2006 2007 2008 2009 2010 2011
fiscal stance ESCB
fiscal stance EC
Note: Positive values indicate fiscal restriction; negative values indicate fiscal expansion. The fiscal stance
is the year-on-year change in the structural balance adjusted for one-time and extraordinary operations and is measured by two alternative approaches: the ESCB method and the EC method.
The data behind Figure 3 show that, on aggregate, the discretion in Czech fiscal policy was rather frequent and sizeable. At the same time, the fiscal impulses were both positive and negative, and the average effect in 2001–2011 was close to zero for all methods. This changing character of the fiscal stance might be a sign of some inherent error correction process, but the size of several yearly impulses rather indicates the presence of haphazard development.
4.3 Comparing the Bottom-up and Top-down Estimates of Fiscal Discretion
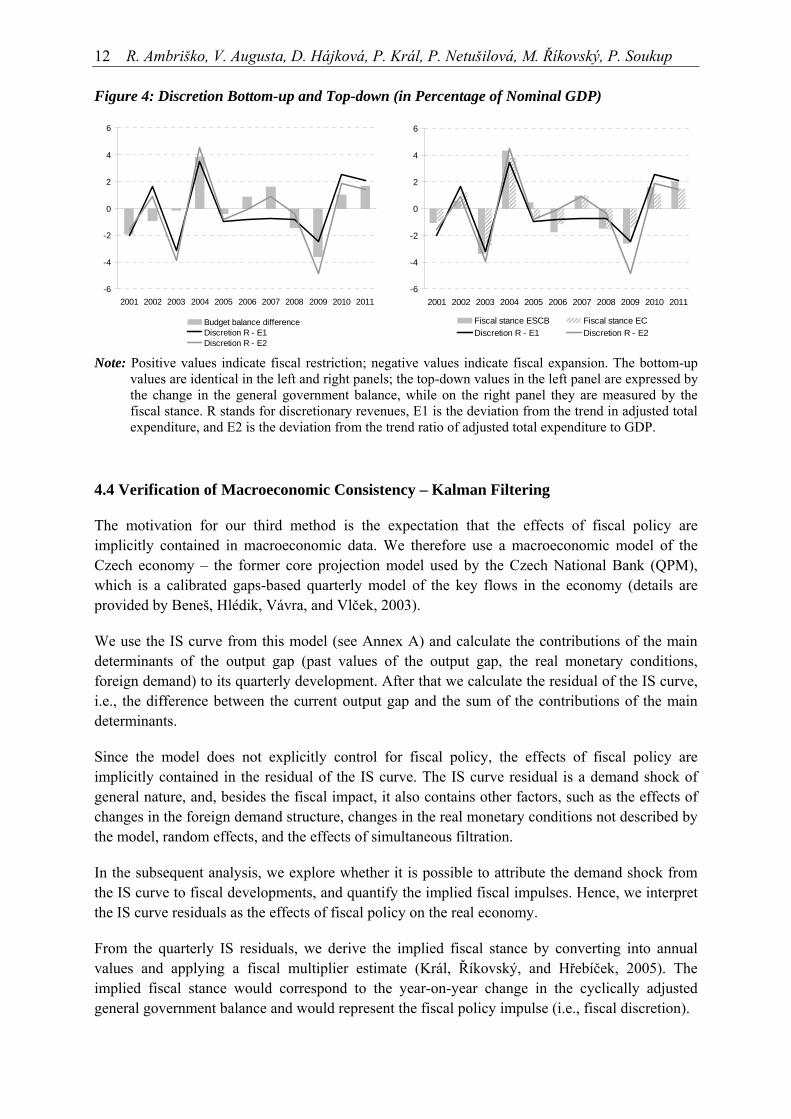
The values of fiscal discretion identified by the bottom-up and top-down methods are depicted in Figure 4. The two methods are quite in accordance. This is confirmed by the values of the correlation between the respective time series over the sample period 2001–2011. The correlation values of the change in the total budget balance with the bottom-up measures of fiscal discretion amount to 0.7 and 0.8;9 the higher correlation coefficient is recorded for the bottom-up method, where expenditure discretion is approximated by the deviation from the trend ratio of adjusted expenditure to GDP (labeled E2 in Figure 4). The correlations between the measures of the fiscal stance and bottom-up discretion are high, with values of around 0.9.
9 Given the number of observations (11 years), the measured correlation is significant at the 5% level when it is
higher than 0.6 and at the 1% level when it exceeds 0.74.
12 R. Ambriško, V. Augusta, D. Hájková, P. Král, P. Netušilová, M. Říkovský, P. Soukup Figure 4: Discretion Bottom-up and Top-down (in Percentage of Nominal GDP)
-6
-4
-2
0
2
4
6
2001 2002 2003 2004 2005 2006 2007 2008 2009 2010 2011
Budget balance differenceDiscretion R - E1Discretion R - E2
-6
-4
-2
0
2
4
6
2001 2002 2003 2004 2005 2006 2007 2008 2009 2010 2011
Fiscal stance ESCB Fiscal stance ECDiscretion R - E1 Discretion R - E2
Note: Positive values indicate fiscal restriction; negative values indicate fiscal expansion. The bottom-up values are identical in the left and right panels; the top-down values in the left panel are expressed by the change in the general government balance, while on the right panel they are measured by the fiscal stance. R stands for discretionary revenues, E1 is the deviation from the trend in adjusted total expenditure, and E2 is the deviation from the trend ratio of adjusted total expenditure to GDP.
4.4 Verification of Macroeconomic Consistency – Kalman Filtering
The motivation for our third method is the expectation that the effects of fiscal policy are implicitly contained in macroeconomic data. We therefore use a macroeconomic model of the Czech economy – the former core projection model used by the Czech National Bank (QPM), which is a calibrated gaps-based quarterly model of the key flows in the economy (details are provided by Beneš, Hlédik, Vávra, and Vlček, 2003).
We use the IS curve from this model (see Annex A) and calculate the contributions of the main determinants of the output gap (past values of the output gap, the real monetary conditions, foreign demand) to its quarterly development. After that we calculate the residual of the IS curve, i.e., the difference between the current output gap and the sum of the contributions of the main determinants.
Since the model does not explicitly control for fiscal policy, the effects of fiscal policy are implicitly contained in the residual of the IS curve. The IS curve residual is a demand shock of general nature, and, besides the fiscal impact, it also contains other factors, such as the effects of changes in the foreign demand structure, changes in the real monetary conditions not described by the model, random effects, and the effects of simultaneous filtration.
In the subsequent analysis, we explore whether it is possible to attribute the demand shock from the IS curve to fiscal developments, and quantify the implied fiscal impulses. Hence, we interpret the IS curve residuals as the effects of fiscal policy on the real economy.
From the quarterly IS residuals, we derive the implied fiscal stance by converting into annual values and applying a fiscal multiplier estimate (Král, Říkovský, and Hřebíček, 2005). The implied fiscal stance would correspond to the year-on-year change in the cyclically adjusted general government balance and would represent the fiscal policy impulse (i.e., fiscal discretion).
Discretion in the Czech Republic in 2001-2011: Has It Been Stabilizing? 13
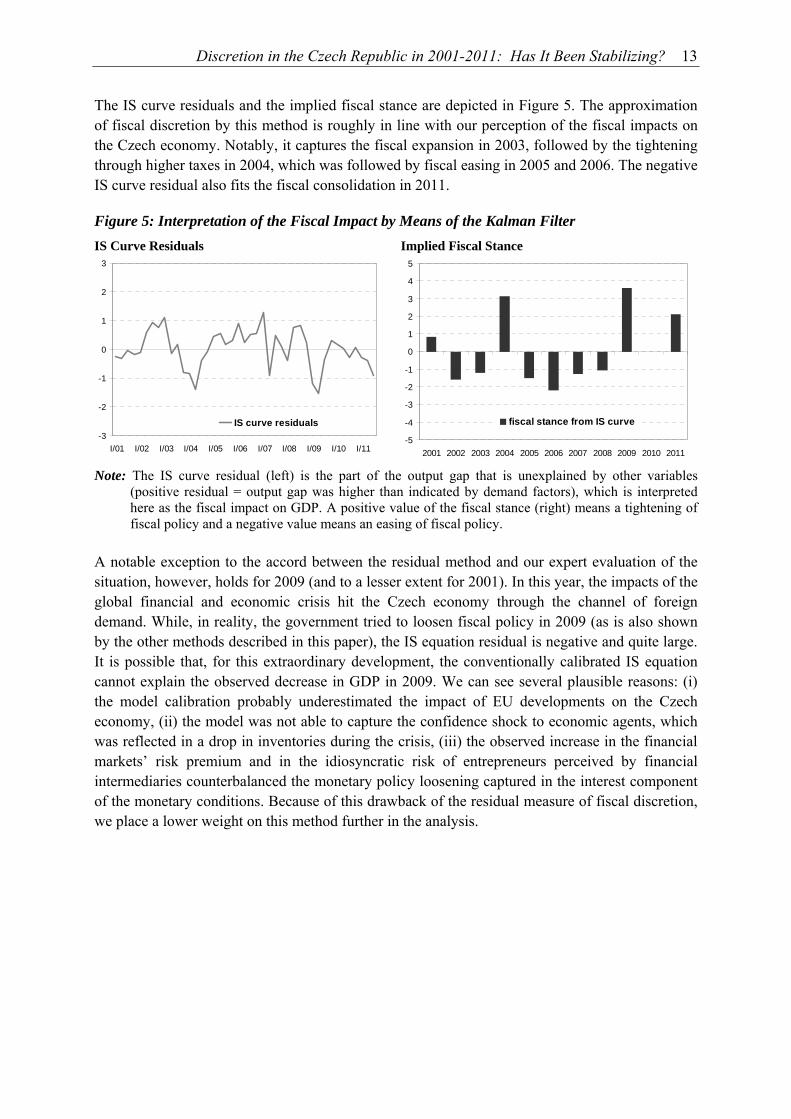
The IS curve residuals and the implied fiscal stance are depicted in Figure 5. The approximation of fiscal discretion by this method is roughly in line with our perception of the fiscal impacts on the Czech economy. Notably, it captures the fiscal expansion in 2003, followed by the tightening through higher taxes in 2004, which was followed by fiscal easing in 2005 and 2006. The negative IS curve residual also fits the fiscal consolidation in 2011.
Figure 5: Interpretation of the Fiscal Impact by Means of the Kalman Filter IS Curve Residuals Implied Fiscal Stance
-3
-2
-1
0
1
2
3
I/01 I/02 I/03 I/04 I/05 I/06 I/07 I/08 I/09 I/10 I/11
IS curve residuals
-5
-4
-3
-2
-1
0
1
2
3
4
5
2001 2002 2003 2004 2005 2006 2007 2008 2009 2010 2011
fiscal stance from IS curve
Note: The IS curve residual (left) is the part of the output gap that is unexplained by other variables
(positive residual = output gap was higher than indicated by demand factors), which is interpreted here as the fiscal impact on GDP. A positive value of the fiscal stance (right) means a tightening of fiscal policy and a negative value means an easing of fiscal policy.
A notable exception to the accord between the residual method and our expert evaluation of the situation, however, holds for 2009 (and to a lesser extent for 2001). In this year, the impacts of the global financial and economic crisis hit the Czech economy through the channel of foreign demand. While, in reality, the government tried to loosen fiscal policy in 2009 (as is also shown by the other methods described in this paper), the IS equation residual is negative and quite large. It is possible that, for this extraordinary development, the conventionally calibrated IS equation cannot explain the observed decrease in GDP in 2009. We can see several plausible reasons: (i) the model calibration probably underestimated the impact of EU developments on the Czech economy, (ii) the model was not able to capture the confidence shock to economic agents, which was reflected in a drop in inventories during the crisis, (iii) the observed increase in the financial markets’ risk premium and in the idiosyncratic risk of entrepreneurs perceived by financial intermediaries counterbalanced the monetary policy loosening captured in the interest component of the monetary conditions. Because of this drawback of the residual measure of fiscal discretion, we place a lower weight on this method further in the analysis.
14 R. Ambriško, V. Augusta, D. Hájková, P. Král, P. Netušilová, M. Říkovský, P. Soukup
5. The Impacts of Fiscal Discretion
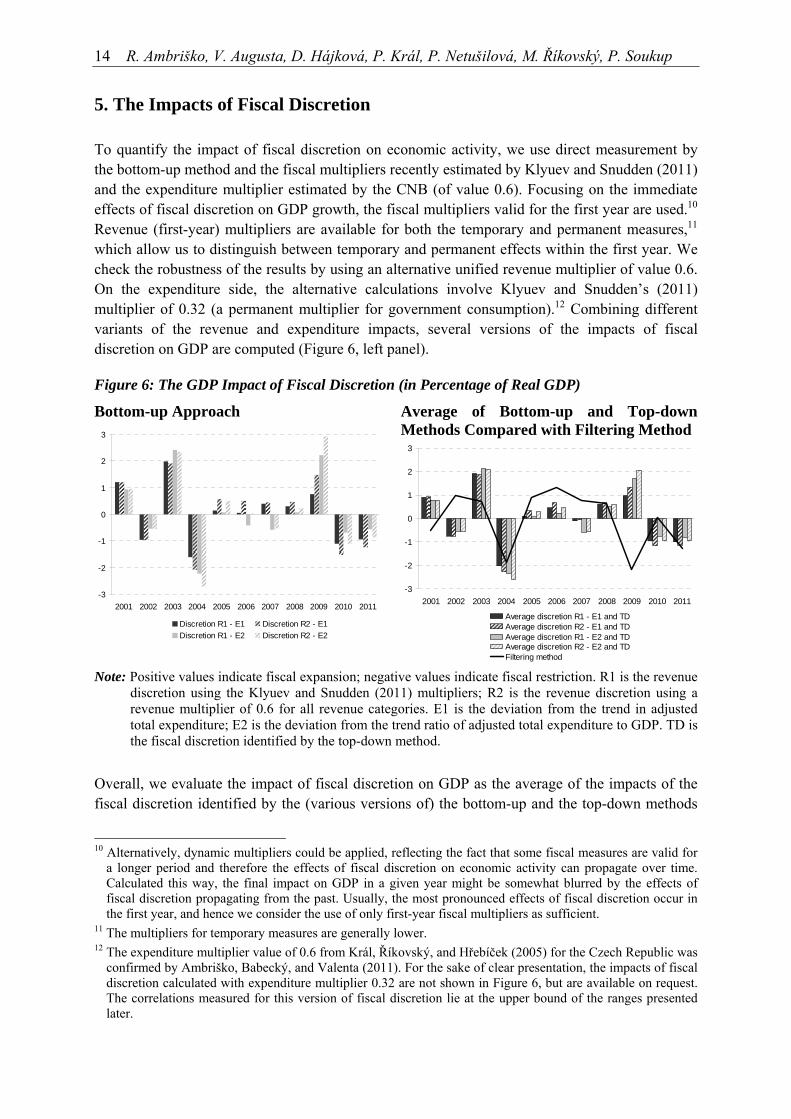
To quantify the impact of fiscal discretion on economic activity, we use direct measurement by the bottom-up method and the fiscal multipliers recently estimated by Klyuev and Snudden (2011) and the expenditure multiplier estimated by the CNB (of value 0.6). Focusing on the immediate effects of fiscal discretion on GDP growth, the fiscal multipliers valid for the first year are used.10 Revenue (first-year) multipliers are available for both the temporary and permanent measures,11 which allow us to distinguish between temporary and permanent effects within the first year. We check the robustness of the results by using an alternative unified revenue multiplier of value 0.6. On the expenditure side, the alternative calculations involve Klyuev and Snudden’s (2011) multiplier of 0.32 (a permanent multiplier for government consumption).12 Combining different variants of the revenue and expenditure impacts, several versions of the impacts of fiscal discretion on GDP are computed (Figure 6, left panel).
Figure 6: The GDP Impact of Fiscal Discretion (in Percentage of Real GDP)
Bottom-up Approach
-3
-2
-1
0
1
2
3
2001 2002 2003 2004 2005 2006 2007 2008 2009 2010 2011
Discretion R1 - E1 Discretion R2 - E1Discretion R1 - E2 Discretion R2 - E2
Average of Bottom-up and Top-down Methods Compared with Filtering Method
-3
-2
-1
0
1
2
3
2001 2002 2003 2004 2005 2006 2007 2008 2009 2010 2011
Average discretion R1 - E1 and TDAverage discretion R2 - E1 and TDAverage discretion R1 - E2 and TDAverage discretion R2 - E2 and TDFiltering method
Note: Positive values indicate fiscal expansion; negative values indicate fiscal restriction. R1 is the revenue discretion using the Klyuev and Snudden (2011) multipliers; R2 is the revenue discretion using a revenue multiplier of 0.6 for all revenue categories. E1 is the deviation from the trend in adjusted total expenditure; E2 is the deviation from the trend ratio of adjusted total expenditure to GDP. TD is the fiscal discretion identified by the top-down method.
Overall, we evaluate the impact of fiscal discretion on GDP as the average of the impacts of the fiscal discretion identified by the (various versions of) the bottom-up and the top-down methods
10 Alternatively, dynamic multipliers could be applied, reflecting the fact that some fiscal measures are valid for
a longer period and therefore the effects of fiscal discretion on economic activity can propagate over time. Calculated this way, the final impact on GDP in a given year might be somewhat blurred by the effects of fiscal discretion propagating from the past. Usually, the most pronounced effects of fiscal discretion occur in the first year, and hence we consider the use of only first-year fiscal multipliers as sufficient.
11 The multipliers for temporary measures are generally lower. 12 The expenditure multiplier value of 0.6 from Král, Říkovský, and Hřebíček (2005) for the Czech Republic was
confirmed by Ambriško, Babecký, and Valenta (2011). For the sake of clear presentation, the impacts of fiscal discretion calculated with expenditure multiplier 0.32 are not shown in Figure 6, but are available on request. The correlations measured for this version of fiscal discretion lie at the upper bound of the ranges presented later.
Discretion in the Czech Republic in 2001-2011: Has It Been Stabilizing? 15
(Figure 6, right panel). The impact of the top-down identified fiscal discretion is calculated as the average of the fiscal stance values shown in Figure 3 (right panel) multiplied by -0.6.13 The GDP impacts resulting from the respective versions of fiscal discretion give a similar picture and are consistent with our perceptions regarding the fiscal packages described in Section 3. For instance, in 2009, when the so called “anti-crisis” package took effect, the impact of fiscal discretion was 1.0–2.1% of GDP; in 2010 the estimated impact of fiscal discretion was between -0.8 and -1.2% of GDP; and in 2011 the impact of further fiscal consolidation is estimated in the range of -0.8 to -1.1% of GDP.14
Comparing the impacts of fiscal discretion with the residuals of the IS curve of the macroeconomic model (presented in Section 4.4) we verify the macroeconomic consistency of our estimates. In most of the period under review the yearly residuals derived from the IS curve, which are partly driven by fiscal policy developments, are in line with our estimates of the impacts of fiscal discretion. To be more specific, in 2003–2006, 2008, and 2011, the estimates stay in line with the residuals. However, there is an obvious divergence in 2009, as commented on previously, where the residuals of the IS curve imply fiscal (or, more generally, demand) restriction, whereas the “anti-crisis” package recorded positive contributions of fiscal discretion.
The correlation between the fiscal impact derived from the IS curve and our explicit estimates of the impacts of fiscal discretion are low and statistically insignificant in the period under review, reaching values of between 0.2 and 0.3 for the respective versions of fiscal discretion. Disregarding the most problematic year 2009, the correlations rise toward 0.6, which is a statistically significant value for the given sample.15 For the versions of fiscal discretion using the IMF’s revenue multipliers, the statistical significance is at the 10% level, and for the remaining versions of fiscal discretion (those using the unified revenue multiplier of 0.6) it is at the 5% level. In this light, we continue to consider the ex post residuals of the IS curve as a useful instrument for inference. As mentioned earlier, the residuals contain relevant information about public finance, but are partly blurred by other factors which are not captured by the model. Therefore, we assess the results, after the removal of 2009, as quite satisfactory.
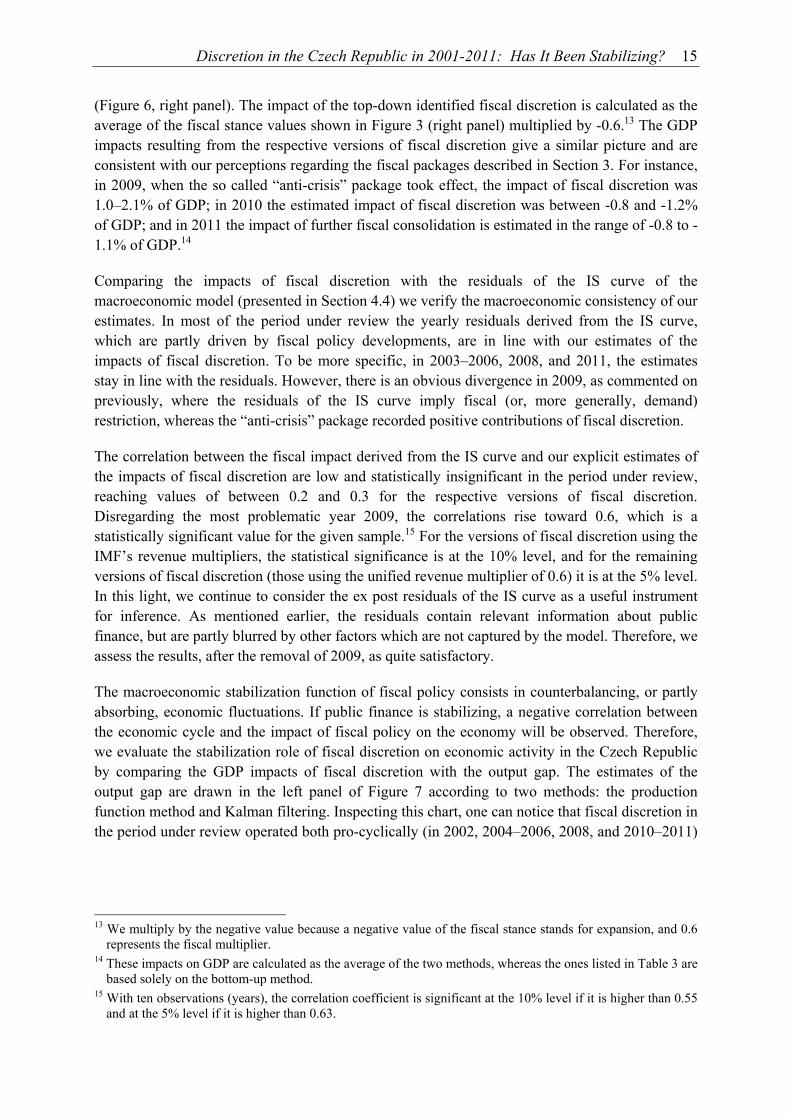
The macroeconomic stabilization function of fiscal policy consists in counterbalancing, or partly absorbing, economic fluctuations. If public finance is stabilizing, a negative correlation between the economic cycle and the impact of fiscal policy on the economy will be observed. Therefore, we evaluate the stabilization role of fiscal discretion on economic activity in the Czech Republic by comparing the GDP impacts of fiscal discretion with the output gap. The estimates of the output gap are drawn in the left panel of Figure 7 according to two methods: the production function method and Kalman filtering. Inspecting this chart, one can notice that fiscal discretion in the period under review operated both pro-cyclically (in 2002, 2004–2006, 2008, and 2010–2011)
13 We multiply by the negative value because a negative value of the fiscal stance stands for expansion, and 0.6
represents the fiscal multiplier. 14 These impacts on GDP are calculated as the average of the two methods, whereas the ones listed in Table 3 are
based solely on the bottom-up method. 15 With ten observations (years), the correlation coefficient is significant at the 10% level if it is higher than 0.55
and at the 5% level if it is higher than 0.63.
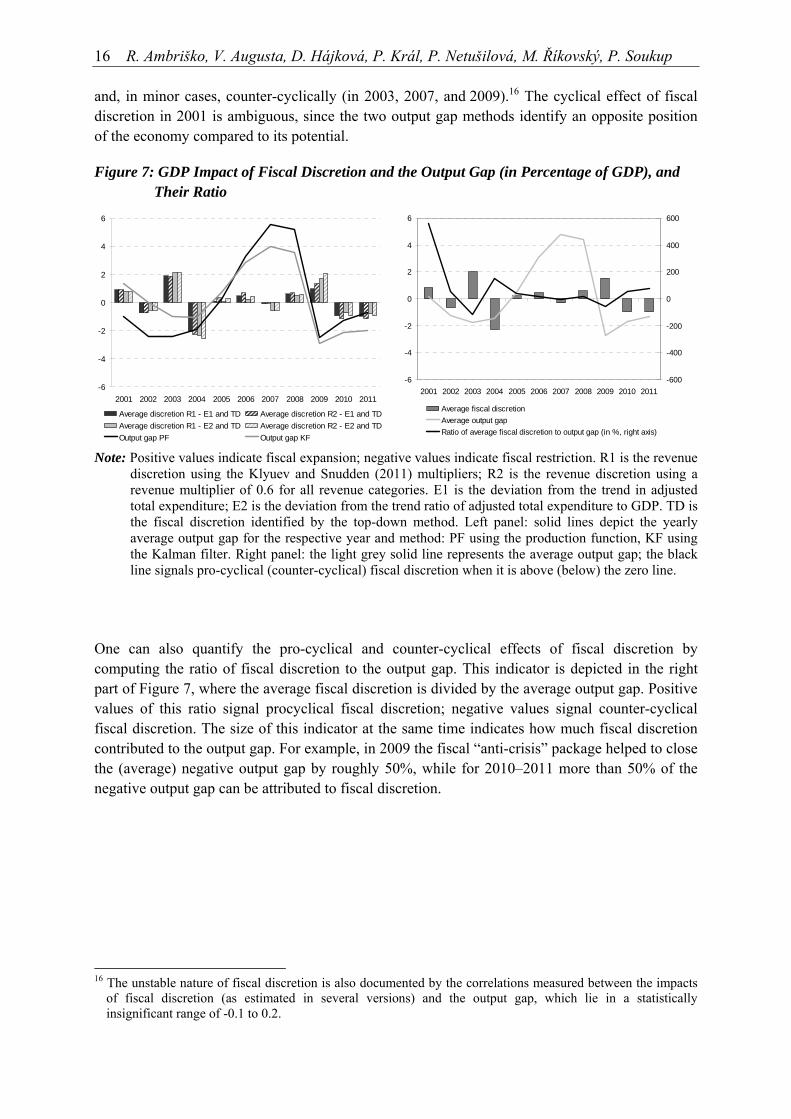
16 R. Ambriško, V. Augusta, D. Hájková, P. Král, P. Netušilová, M. Říkovský, P. Soukup and, in minor cases, counter-cyclically (in 2003, 2007, and 2009).16 The cyclical effect of fiscal discretion in 2001 is ambiguous, since the two output gap methods identify an opposite position of the economy compared to its potential.
Figure 7: GDP Impact of Fiscal Discretion and the Output Gap (in Percentage of GDP), and Their Ratio
-6
-4
-2
0
2
4
6
2001 2002 2003 2004 2005 2006 2007 2008 2009 2010 2011
Average discretion R1 - E1 and TD Average discretion R2 - E1 and TDAverage discretion R1 - E2 and TD Average discretion R2 - E2 and TDOutput gap PF Output gap KF
-6
-4
-2
0
2
4
6
2001 2002 2003 2004 2005 2006 2007 2008 2009 2010 2011-600
-400
-200
0
200
400
600
Average fiscal discretionAverage output gapRatio of average fiscal discretion to output gap (in %, right axis)
Note: Positive values indicate fiscal expansion; negative values indicate fiscal restriction. R1 is the revenue discretion using the Klyuev and Snudden (2011) multipliers; R2 is the revenue discretion using a revenue multiplier of 0.6 for all revenue categories. E1 is the deviation from the trend in adjusted total expenditure; E2 is the deviation from the trend ratio of adjusted total expenditure to GDP. TD is the fiscal discretion identified by the top-down method. Left panel: solid lines depict the yearly average output gap for the respective year and method: PF using the production function, KF using the Kalman filter. Right panel: the light grey solid line represents the average output gap; the black line signals pro-cyclical (counter-cyclical) fiscal discretion when it is above (below) the zero line.
One can also quantify the pro-cyclical and counter-cyclical effects of fiscal discretion by computing the ratio of fiscal discretion to the output gap. This indicator is depicted in the right part of Figure 7, where the average fiscal discretion is divided by the average output gap. Positive values of this ratio signal procyclical fiscal discretion; negative values signal counter-cyclical fiscal discretion. The size of this indicator at the same time indicates how much fiscal discretion contributed to the output gap. For example, in 2009 the fiscal “anti-crisis” package helped to close the (average) negative output gap by roughly 50%, while for 2010–2011 more than 50% of the negative output gap can be attributed to fiscal discretion.
16 The unstable nature of fiscal discretion is also documented by the correlations measured between the impacts
of fiscal discretion (as estimated in several versions) and the output gap, which lie in a statistically insignificant range of -0.1 to 0.2.
Discretion in the Czech Republic in 2001-2011: Has It Been Stabilizing? 17
6. Conclusion
Our paper investigates the stabilization role of fiscal policy in the Czech Republic in the years 2001–2011. We approach this issue by constructing several measures of fiscal discretion. Besides the standard measures of fiscal stance (which are all-inclusive, but can hide some structural changes), we assess fiscal discretion by a bottom-up method, i.e. we investigate information on the level of individual fiscal measures. To this end, we construct a unique dataset of fiscal discretionary measures based on tax legislation changes, and expenditure discretion proxies.
Our analysis shows that fiscal discretion was used rather intensively in the Czech Republic in the period 2001–2011, involving intentional changes to the parameters of government revenues and expenditures. In several years it had a significant impact on the real economy. In the analyzed period, we found both pro-cyclical and counter-cyclical effects of fiscal policy; the periods of desired counter-cyclical effects were short, while the periods of destabilizing pro-cyclical effects were in some cases longer lasting. This is due, among other things, to relatively abrupt changes between periods of loose and tight fiscal policy (“boom-bust” policy) without a significant and stable link to the economic cycle. These findings indicate that macroeconomic stability was not the major aim of fiscal discretion in the analyzed period.
In the aftermath of the global economic crisis, and at a time of subdued economic activity, the Czech fiscal policy had to respond to high general government deficits and to consolidate public finances in a pro-cyclical manner. Similarly as many other EU member countries, Czech fiscal policy did not accumulate sufficient budgetary reserves in the pre-crisis years, which limited the use of automatic stabilizers.
In this paper we show that it is useful to use several methods to quantify fiscal discretion. We are aware that there might be some inaccuracy in each of the measures used in our analysis, due mainly to general data limitations, and because of the often vague boundary between rules and discretion. The good accord of several of the measures with our expert knowledge and priors, however, provides a solid footing for our conclusions.
18 R. Ambriško, V. Augusta, D. Hájková, P. Král, P. Netušilová, M. Říkovský, P. Soukup
References
AFONSO, A. (2010): “Expansionary Fiscal Consolidations in Europe: New Evidence.” Applied Economics Letter 17(2), pp. 105–109.
AFONSO, A., L. AGNELLO, AND D. FURCERI (2010): “Fiscal Policy Responsiveness, Persistence, and Discretion.” Public Choice 145(3), pp. 503–530.
ALESINA, A. AND S. ARDAGNA (1998): “Tales of Fiscal Contractions.” Economic Policy 27, pp. 487–545.
ALESINA, A. AND R. PEROTTI (1995): “Fiscal Expansions and Fiscal Adjustments in OECD Countries.” Economic Policy 21, pp. 205–248.
AMBRIŠKO, R., J. BABECKÝ, AND V. VALENTA (2011): “A Tool for Assessing the Impact of Fiscal Measures on the Economy.” CNB interim seminar project D2/10.
BARREL, R., D. HOLLAND, N. PAIN, M. A. KOVACS, Z. JAKAB, K. ŠMÍDKOVÁ, U. SEPP, AND U. CUFER (2004): “An Econometric Macro-model of Transition: Policy Choices in the Pre-Accession Period.” Macroeconomics 0403004, EconWPA.
BENEŠ, J., T. HLÉDIK, D.VÁVRA, AND J. VLČEK (2003): “The Quarterly Projection Model and its Properties”, in: Coats W., D. Laxton and D. Rose (eds.), The Czech National Bank’s Forecasting System, Czech National Bank.
BLANCHARD, O. (1993): “Suggestions for a New Set of Fiscal Indicators”, in Vebor, H. A. A., and F. A. A. M van Winden (eds.), The Political Economy of Government Debt, North-Holland, Elsevier Science Publishers, pp. 307–325.
COENEN, G., C. ERCEG, C. FREEDMAN, D. FURCERI, M. KUMHOF, R. LALONDE, D. LAXTON, J. LINDÉ, A. MOUROUGANE, D. MUIR, S. MURSULA, C. DE RESENDE, J. ROBERTS, W. ROEGER, S. SNUDDEN, M. TRABANDT, AND J. VELD (2010): “Effects of Fiscal Stimulus in Structural Models.” American Economic Journal: Macroeconomics 4(1), pp. 22-68.
COENEN, G., M. MOHR, AND R. STRAUB (2008): “Fiscal Consolidation in the Euro Area: Long-run Benefits and Short-run Costs.” Economic Modelling 25(5), pp. 912–932.
GIAVAZZI, F., AND M. PAGANO (1996): “Non-Keynesian Effects of Fiscal Policy Changes: International Evidence and the Swedish Experience.” Swedish Economic Policy Review 3(1), pp. 67–103.
HEMMING, R., M. KELL, AND S. MAHFOUZ (2002): “The Effectiveness of Fiscal Policy in Stimulating Economic Activity – A Review of the Literature.” IMF Working Paper WP/02/208.
ILZETZKI, E. AND C. A.VEGH (2008): “Procyclical Fiscal Policy in Developing Countries: Truth or Fiction?” NBER Working Papers 14191.
KLYUEV, V. AND S. SNUDDEN (2011): “Effects of Fiscal Consolidation in the Czech Republic.” Czech Journal of Economics and Finance 61(4), pp. 306–324.
Discretion in the Czech Republic in 2001-2011: Has It Been Stabilizing? 19
KRÁL, P., M. ŘÍKOVSKÝ, AND H. HŘEBÍČEK (2005): “Aktualizace propočtu fiskálního impulzu.”
Czech National Bank, mimeo.
MANASSE, P. (2006): “Procyclical Fiscal Policy: Shocks, Rules, and Institutions – A View from MARS.” IMF Working Paper WP/06/27.
MCKEAN, R. N. (1965): “The Unseen Hand in Government.” American Economic Review 55(3), pp. 496–506.
PRAMMER, D. (2004): “Expansionary Fiscal Consolidations? An Appraisal of the Literature on Non-Keynesian Effects of Fiscal Policy and a Case Study for Austria.” Monetary Policy and the Economy, Oesterreichische Nationalbank 3, pp. 35–52.
PRUŠVIC, D. (2010): “Fiscal Stimuli and Fiscal Multipliers in Small Open Economies: The Case for the Czech Republic”, presented at the 40th Conference on Medium-Term Assessment, September 23–25, 2010, Luxembourg.
RADKOVSKÝ, Š. AND R. ŠTIKOVÁ (2008): “Kvantifikace účinků fiskální politiky v ČR pomocí modelu SVEC.” Internal Discussion Paper 4/2008, Czech National Bank, mimeo.
ŠTORK, Z. AND J. ZÁVACKÁ (2010): “Macroeconomic Implications of Fiscal Policy Measures in DSGE.” Ministry of Finance of the Czech Republic Working Paper 1/2010.
TANZI, V. (1997): “The Changing Role of the State in the Economy: A Historical Perspective.” IMF Working Paper WP/97/114.
TALVI, E. AND C. A. VEGH (2005): “Tax Base Variability and Procyclical Fiscal Policy in Developing Countries.” Journal of Development Economics 78(1), pp. 156–190.
20 R. Ambriško, V. Augusta, D. Hájková, P. Král, P. Netušilová, M. Říkovský, P. Soukup
Appendix A: Evaluating Fiscal Discretion – Methods in Detail
We define fiscal discretion as deliberate changes to government revenue and expenditure parameters aimed at influencing economic developments beyond the regular and automatic effect of the basic fiscal policy set-up. The measurement of fiscal direction is complicated by several factors: (i) one has to decide whether fiscal discretion is measured ex ante or ex post; while ex-ante or real-time data probably influenced the expectations of economic agents, ex-post data can capture the real impulse of fiscal policy to the economy; (ii) the availability of some data is scarce; for example, expenditure discretion is not systematically documented; (iii) some measures are designed to have a permanent effect, while others are temporary.
To evaluate fiscal discretion as robustly as possible we use a variety of methods. Two methods – a bottom-up approach and a top-down approach – are used in the regular CNB fiscal forecasts. We verify these core methods by filtering macroeconomic data, which allows us to see fiscal discretion in an economic context.
A.1: Bottom-up Approach: Data
The bottom-up approach summarizes the estimated impact of individual fiscal measures implemented on the revenue or the expenditure side of public budgets.
Discretionary measures on the revenue side are rather easily identified by amendments to tax laws. The main sources of information about revenue discretion are hence the explanatory memoranda that are submitted along with proposed legislation. These explanatory memoranda usually contain an ex ante quantification of the budgetary implications of the proposed measures. The actual impact of the individual measures, however, can deviate from the ex ante expectations; the estimates in the explanatory memoranda of legislative measures may vary (and in the past have indeed varied) from the actual impact of these changes on public finances, mainly due to unforeseen macroeconomic developments, changes in the behavior of economic agents, or errors in the estimate. Our analysis therefore employs an ex post adjustment of the initial quantifications, taking into account the real economic developments.17
The definition of expenditure discretion is more difficult because the principle of discretion is to some extent obscured by the existence of legal and contractual obligations under the jurisdiction of the appropriations of budgetary chapters. The database of discretionary expenditure measures is small, and probably incomplete, and detailed documentation is not available for them ex post. At the same time, one cannot simply consider non-mandatory expenditure variables (investment, government intermediate consumption, subsidies, and, to some extent, even compensation of employees) as discretion a priori. Therefore, in this paper, expenditure discretion is understood to mean changes in mandatory expenditure and the deviation from the non-mandatory expenditure trend.
17 These adjustments relate primarily to indirect taxes. Actual tax revenues indicated to what extent the
parametrical tax change affected tax revenues compared to previously estimated tax yields.
Discretion in the Czech Republic in 2001-2011: Has It Been Stabilizing? 21
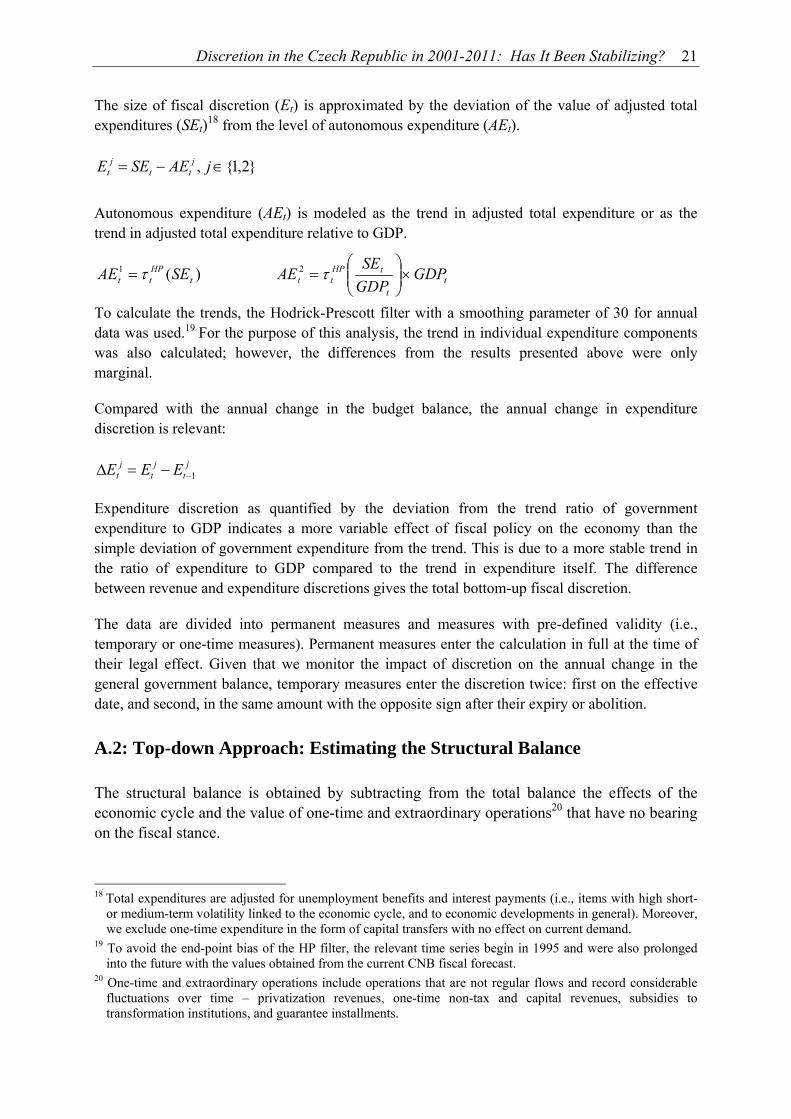
The size of fiscal discretion (Et) is approximated by the deviation of the value of adjusted total expenditures (SEt)18 from the level of autonomous expenditure (AEt).
Autonomous expenditure (AEt) is modeled as the trend in adjusted total expenditure or as the trend in adjusted total expenditure relative to GDP.
To calculate the trends, the Hodrick-Prescott filter with a smoothing parameter of 30 for annual data was used.19 For the purpose of this analysis, the trend in individual expenditure components was also calculated; however, the differences from the results presented above were only marginal.
Compared with the annual change in the budget balance, the annual change in expenditure discretion is relevant:
Expenditure discretion as quantified by the deviation from the trend ratio of government expenditure to GDP indicates a more variable effect of fiscal policy on the economy than the simple deviation of government expenditure from the trend. This is due to a more stable trend in the ratio of expenditure to GDP compared to the trend in expenditure itself. The difference between revenue and expenditure discretions gives the total bottom-up fiscal discretion.
The data are divided into permanent measures and measures with pre-defined validity (i.e., temporary or one-time measures). Permanent measures enter the calculation in full at the time of their legal effect. Given that we monitor the impact of discretion on the annual change in the general government balance, temporary measures enter the discretion twice: first on the effective date, and second, in the same amount with the opposite sign after their expiry or abolition.
A.2: Top-down Approach: Estimating the Structural Balance
The structural balance is obtained by subtracting from the total balance the effects of the economic cycle and the value of one-time and extraordinary operations20 that have no bearing on the fiscal stance.
18 Total expenditures are adjusted for unemployment benefits and interest payments (i.e., items with high short-
or medium-term volatility linked to the economic cycle, and to economic developments in general). Moreover, we exclude one-time expenditure in the form of capital transfers with no effect on current demand.
19 To avoid the end-point bias of the HP filter, the relevant time series begin in 1995 and were also prolonged into the future with the values obtained from the current CNB fiscal forecast.
20 One-time and extraordinary operations include operations that are not regular flows and record considerable fluctuations over time – privatization revenues, one-time non-tax and capital revenues, subsidies to transformation institutions, and guarantee installments.
)(1t
HPtt SEAE τ= t
t
tHPtt GDP
GDPSE
AE ×⎟⎟⎠
⎞⎜⎜⎝
⎛= τ2
}2,1{ , ∈−= jAESEE jtt
jt
jt
jt
jt EEE 1−−=∆
22 R. Ambriško, V. Augusta, D. Hájková, P. Král, P. Netušilová, M. Říkovský, P. Soukup
We employ two methods for calculating the effects of the economic cycle: the first method (labeled “EC”) assumes that public finances are sensitive to changes in the output gap. The other method (labeled “ESCB”) links the individual components of government revenues and expenditure to their relevant macroeconomic bases and the sum of these components is assumed to be the total effect of the economic cycle.
In more detail, the EC method, used in the framework of EU budgetary surveillance,21 derives the cyclically adjusted balance (CAB) as follows:
ttttt OGBBCCBBCAB ⋅−=−= ε
where tBB is the nominal budget balance in year t, tCC is the cyclical component in year t, ε is the budgetary sensitivity parameter, and tOG is the output gap in year t. The output gap represents the economy’s cyclical position (the difference between actual and potential output). The output gap is estimated using the Cobb-Douglas production function.
The overall sensitivity parameter ε is obtained by aggregating the elasticities of the individual budgetary items: four tax items (personal and corporate income tax, indirect taxes, and social contributions) and one expenditure category (unemployment benefits). The individual revenue elasticities ( iR,η ) are aggregated into an overall revenue elasticity, using the share of each in total current taxes ( RRi / ) as the weight:
RRi
iiRR ∑
=
=4
1,ηη
As for the expenditure elasticity ( Gη ), it can be expressed as:
GGU
UGG ,ηη =
where UG,η is the elasticity of unemployment benefits and GGU / is their share in current primary expenditure.
Both elasticities UR ηη , are transformed into sensitivity parameters as follows:
YR
RR ηε = , YG
GG ηε =
where YR / is the share of current taxes in GDP and YG / is the share of primary expenditure in GDP. The difference between the sensitivity parameters yields the overall sensitivity parameter of the budget balance (ε ) used in the equation defining the CAB.
However, the ESCB has elaborated a completely different method for estimating the cyclical component ( tCC ). While the EC method estimates are based on output gap calculations, the ESCB approach to cyclical adjustment takes into account the composition effects originating from unbalanced growth of the economy when the cyclical behavior of macroeconomic bases for the
21 This method for assessing fiscal policy is used by the European Commission, the OECD, and the IMF.
Discretion in the Czech Republic in 2001-2011: Has It Been Stabilizing? 23
main revenues and expenditures is not in phase with real GDP. In the ESCB method, the revenue and expenditure categories are adjusted individually on the basis of the deviation from the trend of their relevant macroeconomic bases in real terms. The respective trends are estimated using the HP filter.22 The following budgetary items are adjusted (with corresponding macroeconomic bases in brackets):
- direct taxes paid by households (average compensation of employees and employment in the private sector),
- direct taxes paid by corporations (operating surplus),
- social contributions paid in the private sector (average compensation of employees and employment in the private sector)
- indirect taxes (private consumption)
- unemployment-related expenditure (number of unemployed persons).
The individual cyclical component of a specific budgetary category is calculated by applying a constant elasticity to the trend deviation and then the CAB is calculated as follows:
)_____( ttttttttt CXUCRICRFCRSPCRHPBBCCBBCAB −+++−=−=
where tCRHP _ is the cyclical component of direct taxes paid by households, tCRSP _ is the cyclical component of direct taxes paid by corporations, tCRF _ is the cyclical component of social contributions paid in the private sector, tCRI _ is the cyclical component of indirect taxes, and tCXU _ is the cyclical component of unemployment-related expenditure.
A.3: Verification of Macroeconomic Consistency – Kalman Filter The filtering method infers the size of fiscal discretion from other economic data and provides a useful view on the link between fiscal policy and the economic cycle (although it must be used with caution).
The method uses a macroeconomic model of the Czech economy – the former core projection model of the Czech National Bank (QPM). This is a calibrated gaps-based quarterly model of the key flows in the economy (details are provided by Beneš et al., 2003).
We use the IS curve from this model (see Equation 1) and calculate the contributions to the quarterly development of the output gap by its main determinants.
tEU
tGAPtGAPtGAPtGAP eyRMCIyy ++−= −− ,1,1,, *4,0*9,0 , (Equation 1)
22 The HP filter is applied to the macroeconomic bases over the period 1995–2018. The macroeconomic bases
for 2012–2018 were extended according to the current CNB macroeconomic forecast in order to eliminate the end-point bias of the HP filter.
24 R. Ambriško, V. Augusta, D. Hájková, P. Král, P. Netušilová, M. Říkovský, P. Soukup
where tGAPy , is the output gap, tGAPRMCI , is the real monetary conditions gap, EUtGAPy , is the
foreign output gap, and et is the residual.
Gaps in the variables are estimated in the first step by Kalman filtering, and are based on assumptions about equilibrium levels of interest rates and equilibrium real appreciation. RMCIGAP,t contains gaps in the real CZK/EUR exchange rate, in real annual rates on the interbank market, in real annual rates on the euro interbank market, and in real rates on newly granted loans.
The Kalman filter seeks the value of the output gap that corresponds to the development of demand factors (by Equation 1), and, at the same time, explains the development of inflation on top of cost and similar impacts (administered and import prices and other elements of the Phillips curve). Potential mis-calibration of the individual coefficients in the model can also be a source of errors. The residual therefore contains the effects of changes in domestic fiscal policy, the foreign demand structure, changes in the real monetary conditions not described by the model, random effects, and the effects of simultaneous filtration.
In the analysis, we look at the residuals as if they were driven solely by the fiscal policy effects on the output gap.
We derive the implied fiscal stance by converting the quarterly IS residuals into annual values taking into account the lag effects depicted in Equation 1. We thus obtain the annual effect of fiscal policy on the real economy. After that, we apply a reverse procedure to go from the effect of fiscal policy to the initial stimulus: we multiply the annual effect by the inverse of the fiscal multiplier (Král et al., 2005) and obtain a measure of the fiscal stance, which is a standard indicator of the fiscal stimulus for the economy. The implied fiscal stance would then correspond to the year-on-year change in the cyclically adjusted general government balance and would represent the fiscal policy impulse (i.e., fiscal discretion).
Discretion in the Czech Republic in 2001-2011: Has It Been Stabilizing? 25
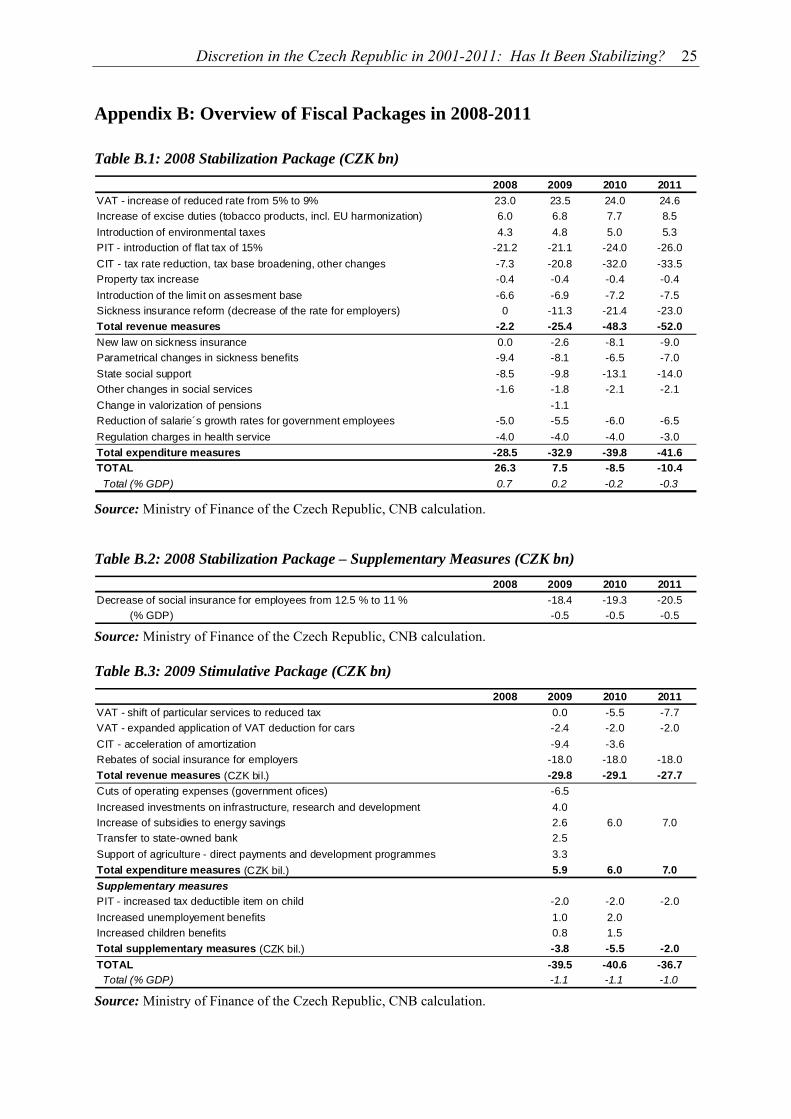
Appendix B: Overview of Fiscal Packages in 2008-2011
Table B.1: 2008 Stabilization Package (CZK bn) 2008 2009 2010 2011
VAT - increase of reduced rate from 5% to 9% 23.0 23.5 24.0 24.6Increase of excise duties (tobacco products, incl. EU harmonization) 6.0 6.8 7.7 8.5Introduction of environmental taxes 4.3 4.8 5.0 5.3PIT - introduction of flat tax of 15% -21.2 -21.1 -24.0 -26.0CIT - tax rate reduction, tax base broadening, other changes -7.3 -20.8 -32.0 -33.5Property tax increase -0.4 -0.4 -0.4 -0.4Introduction of the limit on assesment base -6.6 -6.9 -7.2 -7.5Sickness insurance reform (decrease of the rate for employers) 0 -11.3 -21.4 -23.0Total revenue measures -2.2 -25.4 -48.3 -52.0New law on sickness insurance 0.0 -2.6 -8.1 -9.0Parametrical changes in sickness benefits -9.4 -8.1 -6.5 -7.0State social support -8.5 -9.8 -13.1 -14.0Other changes in social services -1.6 -1.8 -2.1 -2.1Change in valorization of pensions -1.1Reduction of salarie´s growth rates for government employees -5.0 -5.5 -6.0 -6.5Regulation charges in health service -4.0 -4.0 -4.0 -3.0Total expenditure measures -28.5 -32.9 -39.8 -41.6TOTAL 26.3 7.5 -8.5 -10.4 Total (% GDP) 0.7 0.2 -0.2 -0.3 Source: Ministry of Finance of the Czech Republic, CNB calculation.
Table B.2: 2008 Stabilization Package – Supplementary Measures (CZK bn) 2008 2009 2010 2011
Decrease of social insurance for employees from 12.5 % to 11 % -18.4 -19.3 -20.5 (% GDP) -0.5 -0.5 -0.5 Source: Ministry of Finance of the Czech Republic, CNB calculation.
Table B.3: 2009 Stimulative Package (CZK bn) 2008 2009 2010 2011
VAT - shift of particular services to reduced tax 0.0 -5.5 -7.7VAT - expanded application of VAT deduction for cars -2.4 -2.0 -2.0CIT - acceleration of amortization -9.4 -3.6Rebates of social insurance for employers -18.0 -18.0 -18.0Total revenue measures (CZK bil.) -29.8 -29.1 -27.7Cuts of operating expenses (government ofices) -6.5Increased investments on infrastructure, research and development 4.0Increase of subsidies to energy savings 2.6 6.0 7.0Transfer to state-owned bank 2.5Support of agriculture - direct payments and development programmes 3.3Total expenditure measures (CZK bil.) 5.9 6.0 7.0Supplementary measures PIT - increased tax deductible item on child -2.0 -2.0 -2.0Increased unemployement benefits 1.0 2.0Increased children benefits 0.8 1.5Total supplementary measures (CZK bil.) -3.8 -5.5 -2.0TOTAL -39.5 -40.6 -36.7 Total (% GDP) -1.1 -1.1 -1.0 Source: Ministry of Finance of the Czech Republic, CNB calculation.
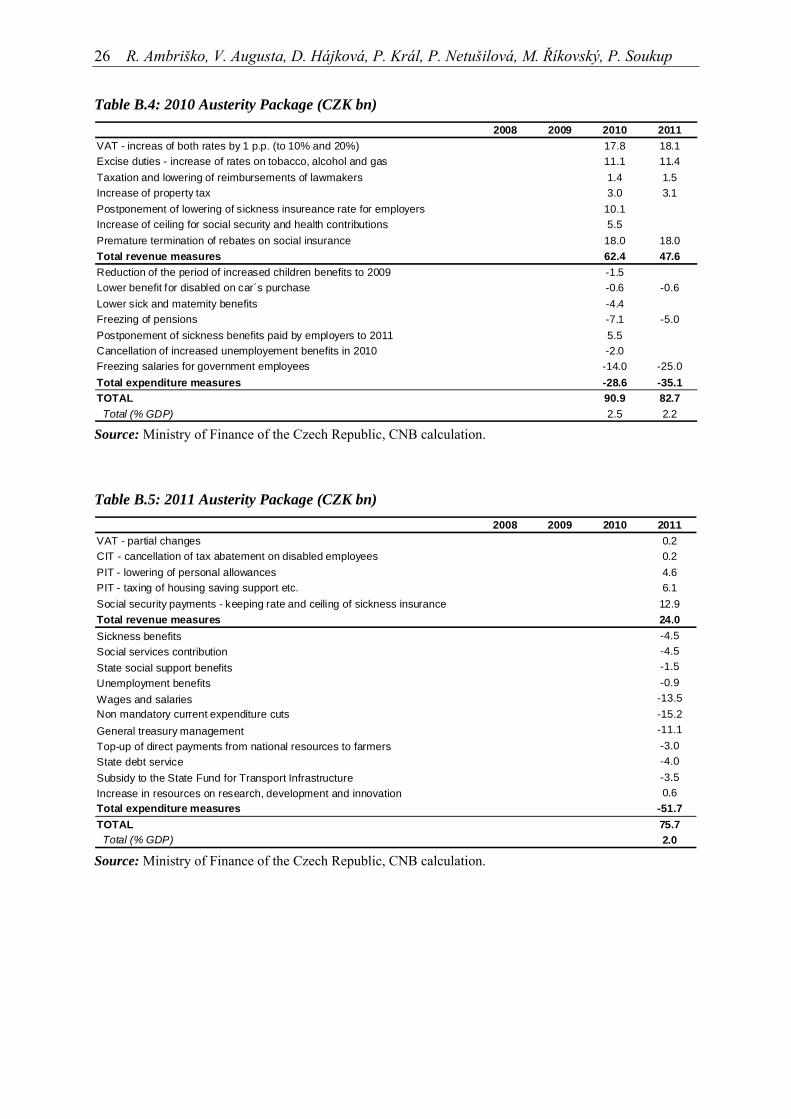
26 R. Ambriško, V. Augusta, D. Hájková, P. Král, P. Netušilová, M. Říkovský, P. Soukup
Table B.4: 2010 Austerity Package (CZK bn) 2008 2009 2010 2011
VAT - increas of both rates by 1 p.p. (to 10% and 20%) 17.8 18.1Excise duties - increase of rates on tobacco, alcohol and gas 11.1 11.4Taxation and lowering of reimbursements of lawmakers 1.4 1.5Increase of property tax 3.0 3.1Postponement of lowering of sickness insureance rate for employers 10.1Increase of ceiling for social security and health contributions 5.5Premature termination of rebates on social insurance 18.0 18.0Total revenue measures 62.4 47.6Reduction of the period of increased children benefits to 2009 -1.5Lower benefit for disabled on car´s purchase -0.6 -0.6Lower sick and maternity benefits -4.4Freezing of pensions -7.1 -5.0Postponement of sickness benefits paid by employers to 2011 5.5Cancellation of increased unemployement benefits in 2010 -2.0Freezing salaries for government employees -14.0 -25.0Total expenditure measures -28.6 -35.1TOTAL 90.9 82.7 Total (% GDP) 2.5 2.2 Source: Ministry of Finance of the Czech Republic, CNB calculation.
Table B.5: 2011 Austerity Package (CZK bn) 2008 2009 2010 2011
VAT - partial changes 0.2CIT - cancellation of tax abatement on disabled employees 0.2PIT - lowering of personal allowances 4.6PIT - taxing of housing saving support etc. 6.1Social security payments - keeping rate and ceiling of sickness insurance 12.9Total revenue measures 24.0Sickness benefits -4.5Social services contribution -4.5State social support benefits -1.5Unemployment benefits -0.9Wages and salaries -13.5Non mandatory current expenditure cuts -15.2General treasury management -11.1Top-up of direct payments from national resources to farmers -3.0State debt service -4.0Subsidy to the State Fund for Transport Infrastructure -3.5Increase in resources on research, development and innovation 0.6Total expenditure measures -51.7TOTAL 75.7 Total (% GDP) 2.0 Source: Ministry of Finance of the Czech Republic, CNB calculation.
CNB WORKING PAPER SERIES 6/2012 5/2012
Michal Franta Jan Libich Petr Stehlík
Roman Horváth Jakub Seidler Laurent Weill
Tracking monetary-fiscal interactions across time and space Bank capital and liquidity creation: Granger causality evidence
4/2012 Jaromír Baxa Miroslav Plašil Bořek Vašíček
Changes in inflation dynamics under inflation targeting? Evidence from Central European countries
3/2012 Soňa Benecká Tomáš Holub Narcisa Liliana Kadlčáková Ivana Kubicová
Does central bank financial strength matter for inflation? An empirical analysis
2/2012 Adam Geršl Petr Jakubík Dorota Kowalczyk Steven Ongena José-Luis Peydró Alcalde
Monetary conditions and banks’ behaviour in the Czech Republic
1/2012 Jan Babecký Kamil Dybczak
Real wage flexibility in the European Union: New evidence from the labour cost data
15/2011 Jan Babecký Kamil Galuščák Lubomír Lízal
Firm-level labour demand: Adjustment in good times and during the crisis
14/2011 Vlastimil Čadek Helena Rottová Branislav Saxa
Hedging behaviour of Czech exporting firms
13/2011 Michal Franta Roman Horváth Marek Rusnák
Evaluating changes in the monetary transmission mechanism in the Czech Republic
12/2011 Jakub Ryšánek Jaromír Tonner Osvald Vašíček
Monetary policy implications of financial frictions in the Czech Republic
11/2011 Zlatuše Komárková Adam Geršl Luboš Komárek
Models for stress testing Czech banks´ liquidity risk
10/2011 Michal Franta Jozef Baruník Roman Horváth Kateřina Šmídková
Are Bayesian fan charts useful for central banks? Uncertainty, forecasting, and financial stability stress tests
9/2011 Kamil Galuščák Lubomír Lízal
The impact of capital measurement error correction on firm-level production function estimation
8/2011 Jan Babecký Tomáš Havránek Jakub Matějů Marek Rusnák Kateřina Šmídková Bořek Vašíček
Early warning indicators of economic crises: Evidence from a panel of 40 developed countries
7/2011 Tomáš Havránek Zuzana Iršová
Determinants of horizontal spillovers from FDI: Evidence from a large meta-analysis
6/2011 Roman Horváth Jakub Matějů
How are inflation targets set?
5/2011 Bořek Vašíček Is monetary policy in the new EU member states asymmetric?
4/2011 Alexis Derviz Financial frictions, bubbles, and macroprudential policies
3/2011 Jaromír Baxa Roman Horváth Bořek Vašíček
Time-varying monetary-policy rules and financial stress: Does financial instability matter for monetary policy?
2/2011 Marek Rusnák Tomáš Havránek Roman Horváth
How to solve the price puzzle? A meta-analysis
1/2011 Jan Babecký Aleš Bulíř Kateřina Šmídková
Sustainable real exchange rates in the new EU member states: What did the Great Recession change?
15/2010 Ke Pang Pierre L. Siklos
Financial frictions and credit spreads
14/2010 Filip Novotný Marie Raková
Assessment of consensus forecasts accuracy: The Czech National Bank perspective
13/2010 Jan Filáček Branislav Saxa
Central bank forecasts as a coordination device
12/2010 Kateřina Arnoštová David Havrlant Luboš Růžička Peter Tóth
Short-term forecasting of Czech quarterly GDP using monthly indicators
11/2010 Roman Horváth Kateřina Šmídková Jan Zápal
Central banks´ voting records and future policy
10/2010 Alena Bičáková Zuzana Prelcová Renata Pašaličová
Who borrows and who may not repay?
9/2010 Luboš Komárek Jan Babecký Zlatuše Komárková
Financial integration at times of financial instability
8/2010 Kamil Dybczak Peter Tóth David Voňka
Effects of price shocks to consumer demand. Estimating the QUAIDS demand system on Czech Household Budget Survey data
7/2010 Jan Babecký Philip Du Caju Theodora Kosma Martina Lawless Julián Messina Tairi Rõõm
The margins of labour cost adjustment: Survey evidence from European firms
6/2010 Tomáš Havránek Roman Horváth Jakub Matějů
Do financial variables help predict macroeconomic environment? The case of the Czech Republic
5/2010 Roman Horváth Luboš Komárek Filip Rozsypal
Does money help predict inflation? An empirical assessment for Central Europe
4/2010 Oxana Babecká Kucharčuková Jan Babecký Martin Raiser
A gravity approach to modelling international trade in South-Eastern Europe and the Commonwealth of Independent States: The role of geography, policy and institutions
3/2010 Tomáš Havránek Zuzana Iršová
Which foreigners are worth wooing? A Meta-analysis of vertical spillovers from FDI
2/2010 Jaromír Baxa Roman Horváth Bořek Vašíček
How does monetary policy change? Evidence on inflation targeting countries
1/2010 Adam Geršl Petr Jakubík
Relationship lending in the Czech Republic
15/2009 David N. DeJong Roman Liesenfeld Guilherme V. Moura Jean-Francois Richard Hariharan Dharmarajan
Efficient likelihood evaluation of state-space representations
14/2009 Charles W. Calomiris Banking crises and the rules of the game 13/2009 Jakub Seidler
Petr Jakubík The Merton approach to estimating loss given default: Application to the Czech Republic
12/2009 Michal Hlaváček Luboš Komárek
Housing price bubbles and their determinants in the Czech Republic and its regions
11/2009 Kamil Dybczak Kamil Galuščák
Changes in the Czech wage structure: Does immigration matter?
10/2009 9/2009 8/2009 7/2009 6/2009
Jiří Böhm Petr Král Branislav Saxa
Alexis Derviz Marie Raková
Roman Horváth Anca Maria Podpiera
David Kocourek Filip Pertold
Nauro F. Campos Roman Horváth
Percepion is always right: The CNB´s monetary policy in the media Funding costs and loan pricing by multinational bank affiliates
Heterogeneity in bank pricing policies: The Czech evidence
The impact of early retirement incentives on labour market participation: Evidence from a parametric change in the Czech Republic
Reform redux: Measurement, determinants and reversals
5/2009 Kamil Galuščák Mary Keeney Daphne Nicolitsas Frank Smets Pawel Strzelecki Matija Vodopivec
The determination of wages of newly hired employees: Survey evidence on internal versus external factors
4/2009 Jan Babecký Philip Du Caju Theodora Kosma Martina Lawless Julián Messina Tairi Rõõm
Downward nominal and real wage rigidity: Survey evidence from European firms
3/2009 Jiri Podpiera Measuring excessive risk-taking in banking
Laurent Weill 2/2009 Michal Andrle
Tibor Hlédik Ondra Kameník Jan Vlček
Implementing the new structural model of the Czech National Bank
1/2009 Kamil Dybczak Jan Babecký
The impact of population ageing on the Czech economy
14/2008 Gabriel Fagan Vitor Gaspar
Macroeconomic adjustment to monetary union
13/2008 Giuseppe Bertola Anna Lo Prete
Openness, financial markets, and policies: Cross-country and dynamic patterns
12/2008 Jan Babecký Kamil Dybczak Kamil Galuščák
Survey on wage and price formation of Czech firms
11/2008 Dana Hájková The measurement of capital services in the Czech Republic 10/2008 Michal Franta Time aggregation bias in discrete time models of aggregate
duration data 9/2008 Petr Jakubík
Christian Schmieder Stress testing credit risk: Is the Czech Republic different from Germany?
8/2008 Sofia Bauducco Aleš Bulíř Martin Čihák
Monetary policy rules with financial instability
7/2008 Jan Brůha Jiří Podpiera
The origins of global imbalances
6/2008 Jiří Podpiera Marie Raková
The price effects of an emerging retail market
5/2008 Kamil Dybczak David Voňka Nico van der Windt
The effect of oil price shocks on the Czech economy
4/2008 Magdalena M. Borys Roman Horváth
The effects of monetary policy in the Czech Republic: An empirical study
3/2008 Martin Cincibuch Tomáš Holub Jaromír Hurník
Central bank losses and economic convergence
2/2008 Jiří Podpiera Policy rate decisions and unbiased parameter estimation in conventionally estimated monetary policy rules
1/2008
Balázs Égert Doubravko Mihaljek
Determinants of house prices in Central and Eastern Europe
17/2007 Pedro Portugal U.S. unemployment duration: Has long become longer or short become shorter?
16/2007 Yuliya Rychalovská Welfare-based optimal monetary policy in a two-sector small open economy
15/2007 Juraj Antal František Brázdik
The effects of anticipated future change in the monetary policy regime
14/2007 Aleš Bulíř Kateřina Šmídková Viktor Kotlán David Navrátil
Inflation targeting and communication: Should the public read inflation reports or tea leaves?
13/2007 Martin Cinncibuch Measuring the financial markets' perception of EMU enlargement:
Martina Horníková The role of ambiguity aversion 12/2007 Oxana Babetskaia-
Kukharchuk Transmission of exchange rate shocks into domestic inflation: The case of the Czech Republic
11/2007 Jan Filáček Why and how to assess inflation target fulfilment 10/2007 Michal Franta
Branislav Saxa Kateřina Šmídková
Inflation persistence in new EU member states: Is it different than in the Euro area members?
9/2007 Kamil Galuščák Jan Pavel
Unemployment and inactivity traps in the Czech Republic: Incentive effects of policies
8/2007 Adam Geršl Ieva Rubene Tina Zumer
Foreign direct investment and productivity spillovers: Updated evidence from Central and Eastern Europe
7/2007 Ian Babetskii Luboš Komárek Zlatuše Komárková
Financial integration of stock markets among new EU member states and the euro area
6/2007 Anca Pruteanu-Podpiera Laurent Weill Franziska Schobert
Market power and efficiency in the Czech banking sector
5/2007 Jiří Podpiera Laurent Weill
Bad luck or bad management? Emerging banking market experience
4/2007 Roman Horváth The time-varying policy neutral rate in real time: A predictor for future inflation?
3/2007 Jan Brůha Jiří Podpiera Stanislav Polák
The convergence of a transition economy: The case of the Czech Republic
2/2007 Ian Babetskii Nauro F. Campos
Does reform work? An econometric examination of the reform-growth puzzle
1/2007 Ian Babetskii Fabrizio Coricelli Roman Horváth
Measuring and explaining inflation persistence: Disaggregate evidence on the Czech Republic
13/2006 Frederic S. Mishkin Klaus Schmidt-Hebbel
Does inflation targeting make a difference?
12/2006 Richard Disney Sarah Bridges John Gathergood
Housing wealth and household indebtedness: Is there a household ‘financial accelerator’?
11/2006 Michel Juillard Ondřej Kameník Michael Kumhof Douglas Laxton
Measures of potential output from an estimated DSGE model of the United States
10/2006 Jiří Podpiera Marie Raková
Degree of competition and export-production relative prices when the exchange rate changes: Evidence from a panel of Czech exporting companies
9/2006 Alexis Derviz Jiří Podpiera
Cross-border lending contagion in multinational banks
8/2006 Aleš Bulíř Jaromír Hurník
The Maastricht inflation criterion: “Saints” and “Sinners”
7/2006 Alena Bičáková Jiří Slačálek
Fiscal implications of personal tax adjustments in the Czech Republic
Michal Slavík 6/2006 Martin Fukač
Adrian Pagan Issues in adopting DSGE models for use in the policy process
5/2006 Martin Fukač New Keynesian model dynamics under heterogeneous expectations and adaptive learning
4/2006 Kamil Dybczak Vladislav Flek Dana Hájková Jaromír Hurník
Supply-side performance and structure in the Czech Republic (1995–2005)
3/2006 Aleš Krejdl Fiscal sustainability – definition, indicators and assessment of Czech public finance sustainability
2/2006 Kamil Dybczak Generational accounts in the Czech Republic 1/2006 Ian Babetskii Aggregate wage flexibility in selected new EU member states
14/2005 Stephen G. Cecchetti The brave new world of central banking: The policy challenges posed by asset price booms and busts
13/2005 Robert F. Engle Jose Gonzalo Rangel
The spline GARCH model for unconditional volatility and its global macroeconomic causes
12/2005 Jaromír Beneš Tibor Hlédik Michael Kumhof David Vávra
An economy in transition and DSGE: What the Czech national bank’s new projection model needs
11/2005 Marek Hlaváček Michael Koňák Josef Čada
The application of structured feedforward neural networks to the modelling of daily series of currency in circulation
10/2005 Ondřej Kameník Solving SDGE models: A new algorithm for the sylvester equation 9/2005 Roman Šustek Plant-level nonconvexities and the monetary transmission
mechanism 8/2005 Roman Horváth Exchange rate variability, pressures and optimum currency
area criteria: Implications for the central and eastern european countries
7/2005 Balázs Égert Luboš Komárek
Foreign exchange interventions and interest rate policy in the Czech Republic: Hand in glove?
6/2005 Anca Podpiera Jiří Podpiera
Deteriorating cost efficiency in commercial banks signals an increasing risk of failure
5/2005 Luboš Komárek Martin Melecký
The behavioural equilibrium exchange rate of the Czech koruna
4/2005 Kateřina Arnoštová Jaromír Hurník
The monetary transmission mechanism in the Czech Republic (evidence from VAR analysis)
3/2005 Vladimír Benáček Jiří Podpiera Ladislav Prokop
Determining factors of Czech foreign trade: A cross-section time series perspective
2/2005 Kamil Galuščák Daniel Münich
Structural and cyclical unemployment: What can we derive from the matching function?
1/2005 Ivan Babouček Martin Jančar
Effects of macroeconomic shocks to the quality of the aggregate loan portfolio
10/2004 Aleš Bulíř Kateřina Šmídková
Exchange rates in the new EU accession countries: What have we learned from the forerunners
9/2004 Martin Cincibuch Jiří Podpiera
Beyond Balassa-Samuelson: Real appreciation in tradables in transition countries
8/2004 Jaromír Beneš David Vávra
Eigenvalue decomposition of time series with application to the Czech business cycle
7/2004 Vladislav Flek, ed. Anatomy of the Czech labour market: From over-employment to under-employment in ten years?
6/2004 Narcisa Kadlčáková Joerg Keplinger
Credit risk and bank lending in the Czech Republic
5/2004 Petr Král Identification and measurement of relationships concerning inflow of FDI: The case of the Czech Republic
4/2004 Jiří Podpiera Consumers, consumer prices and the Czech business cycle identification
3/2004 Anca Pruteanu The role of banks in the Czech monetary policy transmission mechanism
2/2004 Ian Babetskii EU enlargement and endogeneity of some OCA criteria: Evidence from the CEECs
1/2004 Alexis Derviz Jiří Podpiera
Predicting bank CAMELS and S&P ratings: The case of the Czech Republic
CNB RESEARCH AND POLICY NOTES 1/2012
Róbert Ambriško Vítězslav Augusta Dana Hájková Petr Král Pavla Netušilová Milan Říkovský Pavel Soukup
Fiscal discretion in the Czech Republic in 2001-2011: Has it been stabilizing?
3/2011 František Brázdik Michal Hlaváček Aleš Maršál
Survey of research on financial sector modeling within DSGE models: What central banks can learn from it
2/2011 Adam Geršl Jakub Seidler
Credit growth and capital buffers: Empirical evidence from Central and Eastern European countries
1/2011 Jiří Böhm Jan Filáček Ivana Kubicová Romana Zamazalová
Price-level targeting – A real alternative to inflation targeting?
1/2008 Nicos Christodoulakis Ten years of EMU: Convergence, divergence and new policy priorities
2/2007 Carl E. Walsh Inflation targeting and the role of real objectives 1/2007 Vojtěch Benda
Luboš Růžička Short-term forecasting methods based on the LEI approach: The case of the Czech Republic
2/2006 Garry J. Schinasi Private finance and public policy 1/2006 Ondřej Schneider The EU budget dispute – A blessing in disguise?
5/2005 Jan Stráský Optimal forward-looking policy rules in the quarterly projection model of the Czech National Bank
4/2005 Vít Bárta Fulfilment of the Maastricht inflation criterion by the Czech Republic: Potential costs and policy options
3/2005 Helena Sůvová Eva Kozelková David Zeman Jaroslava Bauerová
Eligibility of external credit assessment institutions
2/2005 Martin Čihák Jaroslav Heřmánek
Stress testing the Czech banking system: Where are we? Where are we going?
1/2005 David Navrátil Viktor Kotlán
The CNB’s policy decisions – Are they priced in by the markets?
4/2004 Aleš Bulíř External and fiscal sustainability of the Czech economy: A quick look through the IMF’s night-vision goggles
3/2004 Martin Čihák Designing stress tests for the Czech banking system 2/2004 Martin Čihák Stress testing: A review of key concepts 1/2004 Tomáš Holub Foreign exchange interventions under inflation targeting:
The Czech experience
CNB ECONOMIC RESEARCH BULLETIN
April 2012 Macroeconomic forecasting: Methods, accuracy and coordination November 2011 Macro-financial linkages: Theory and applications April 2011 Monetary policy analysis in a central bank November 2010 Wage adjustment in Europe May 2010 Ten years of economic research in the CNB November 2009 Financial and global stability issues May 2009 Evaluation of the fulfilment of the CNB’s inflation targets 1998–2007 December 2008 Inflation targeting and DSGE models April 2008 Ten years of inflation targeting December 2007 Fiscal policy and its sustainability August 2007 Financial stability in a transforming economy November 2006 ERM II and euro adoption August 2006 Research priorities and central banks November 2005 Financial stability May 2005 Potential output October 2004 Fiscal issues May 2004 Inflation targeting December 2003 Equilibrium exchange rate


Czech National Bank Economic Research Department Na Příkopě 28, 115 03 Praha 1
Czech Republic phone: +420 2 244 12 321
fax: +420 2 244 14 278 http://www.cnb.cz
e-mail: [email protected] ISSN 1803-7097