Embed Size (px)
Citation preview

2014
Modified Oct. 22, 2014
Right Care Initiative Data and Briefs Packet Cardiovascular, Hypertension and Diabetes Management and Prevention
Quality Indicators, Metrics and Promising Interventions

Table of Contents Right Care Initiative Project Brief…………………………………………………………………………………………………………..3
Key Quality Indicators for Cardiovascular Prevention Among CA Health Plans………………………………………5
CA vs. National Top 10 Performance Selected HEDIS Measures…………………………………………………………….9
Statistics Brief: California Publicly Available Data‐Heart Attack, Stroke
and Diabetes Care and Prevention……………………………………….13
Statistics Brief: Sacramento Publicly Available Data‐ Heart Attack, Stroke
and Diabetes Care and Prevention……………………………………….15
University of Best Practices Project Brief……………………………………………………………………………………………..19
Promising Intervention: Pharmacist on the Care Team……………………………………………………………………….21
Promising Intervention: Power of Home Blood Pressure Monitoring…………………………………………………..23
Promising Intervention: Cardio‐protective Medication Bundle Protocol………………………………………………25
Promising Intervention: Proactive Patients Improve Clinical Outcomes……………………………………………….27
San Diego Demonstration Project………………………………………………………………………………………………………..29

Contact: Hattie Rees Hanley, MPP, Right Care Initiative Director, [email protected]; [email protected] 916-323-2704; 510-289-7114 mobile
Key Partners: This collaborative, expert-based, public-private bridge project draws on leadership from key partners:
CA Dept. of Managed Health Care CA medical groups, clinics & health plans University of California schools of public health, pharmacy, and medicine
Stanford Clinical Excellence Research Center University of Southern California California Chronic Care Coalition Health Services Advisory Group QIO
Sierra Health Foundation American Medical Group Assoc. CA Office of the Patient Advocate CA Medi-Cal Program CA Dept. of Public Health (CDPH) Integrated Healthcare Assoc. (IHA) Pacific Business Group on Health US Department of Veteran’s Affairs
American College of Cardiology American Heart/Stroke Association California Endowment California Health Care Foundation Ralphs Grocery Company Novo Nordisk Genentech Boehringer-Ingelheim
Objective: Measurably improve patient outcomes through enhanced practice of patient-centered, evidence-based medicine.
Since 2007, The Right Care Initiative’s goal has been to apply scientific evidence and outcomes improvement strategies to reduce patient morbidity and mortality through a collaborative focus on achieving quality goals where performance metrics indicate that evidence-based, life-saving practices are not fully deployed. Data from the Integrated Health Care Association, the National Committee For Quality Assurance, the federal Agency for Health Care Quality and Research, the Commonwealth Foundation, CMS, and the Centers for Disease Control indicate two trouble spots where evidence-based patient management and clinical quality improvement will significantly enhance and save lives while preventing disability: cardiovascular disease, with particular emphasis on hypertension and lipid control; and diabetes, focused on heart attack and stroke prevention, and better management.
Current Focus: CDPH estimates Californians suffer approximately 72,000 deaths from cardiovascular disease (including heart attack and stroke) and 7,000 deaths from diabetes each year, many of them preventable according to CDC. NCQA conservatively estimates that improving California’s cardiovascular disease and diabetes measures to the national HEDIS 90th percentile could save 1,694 to 2,818 lives each year, while avoiding $118 million in yearly hospital costs, 766,401 sick days and $125.56 million in lost productivity. Heart disease, hypertension and diabetes are increasingly well understood scientifically, and ripe for best practices collaboration. Over the course of this project, California has outpaced the nation in improving health system performance on control of blood pressure, cholesterol and blood sugar, building on the “100,000 Lives” campaign for reducing medical errors and the Million Hearts™ national initiative launched in 2011.
California Statewide Goals—Preventing Heart Attacks, Strokes, and Diabetic Complications
Achieve National HEDIS 90th Percentile “A-grade” Targets (2013 Performance Year): 75% of hypertensive patients with blood pressure controlled: <140/90 mm Hg 70% of patients with cardiovascular conditions with lipids controlled: LDL-C < 100 mg/dL 69% of diabetic patients with blood sugar controlled: HbA1c <8 56% of diabetic patients with lipids controlled: LDL-C < 100 mg/dL 55% of diabetic patients with blood pressure controlled: <140/80 mm Hg
Current Activities: Right Care University of Best Practices in three metropolitan areas to share learning and encourage adoption of evi-
dence-based interventions for preventing heart attacks, strokes, and complications from diabetes (e.g., amputations, blindness, kidney failure). Practical presentations from benchmark performers are geared toward medical, pharmacy and quality improvement directors, coupled with free Continuing Medical Education in Sacramento and Los Angeles, to spur achievement of national “A-grade” performance.
Annual leadership summit to highlight newly released HEDIS & P4P performance data, award top performers and most improved, and promote adoption of strategies used by leading edge Triple Aim performers.
RIGHT CARE INITIATIVE Clinical Quality Improvement Leadership Collaborative

Implementation Action: DMHC publicly launched the Right Care Initiative with NCQA and the Deans of UC Berkeley and UCLA Schools of Public Health in March 2008 at the 1st annual Clinical Quality Improvement Leadership Summit. Since then, ten Right Care summits have been held around the state. Each Right Care gathering is a collaborative effort to close the gap between science and practice to improve patient outcomes working with medical directors, pharmacy and quality improvement directors, as well as thought leaders in evidence-based medicine.
State-Wide Right Care Technical Expert Steering Committee Chair and Co-Founders: Stephen Shortell, PhD, MPH, MBA, Professor and Dean Emeritus, University of California, Berkeley, School of Public Health Arnold Milstein, MD, MPH, Professor of Medicine and Director, Stanford University Clinical Excellence Research Center Jerry Penso, MD, MBA, Univ. of Best Practices Co-Founder and Chief Medical Officer, American Medical Group Association Cardiovascular Disease and Diabetes Research Team: Arnold Milstein, MD, MPH, Professor of Medicine and Director, Stanford University Clinical Excellence Research Center Mary Fermazin, MD, MPA, Chief Medical Officer, Health Services Advisory Group (CMS-designated Quality Improvement Organization) Susan L. Ivey, MD, MHSA, Di-rector of Research, Health Research for Action & Associate Professor, UC Berkeley School of Public Health Waimai (Amy) Tai, Stanford Medical Center Stroke Team and Clinical Assistant Professor, Neurology and Neurological Sciences, Stanford Neurology Clinic Carol Mangione, MD, MSPH, Professor of Medicine & Public Health, UCLA Schools of Public Health & Medicine Hector Rodriguez, PhD, MPH, Visiting Associate Professor, UC Berkeley School of Public Health Jan Hirsch, PhD, Assistant Professor of Clinical Pharmacy, UCSD Skaggs School of Pharmacy and Pharmaceutical Sciences Steve Chen, PharmD, Associate Professor of Clinical Pharmacy, USC
Thanks to an NIH GO grant (2009-July 2012), the Right Care Initiative received a special opportunity to launch a community-focused effort to reach the Right Care Initiative goals of preventing heart attacks, strokes and diabetic complications and piloted the first University of Best Practices in San Diego. Since then, a Right Care University of Best Practices has been launched in two additional metro areas: Sacramento in 2012 and Los Angeles in 2013. Each University of Best Practices is comprised of the major delivery systems of the region, including medical groups, health plans, community clinics, the V.A., Navy, and Air Force along with subject matter experts.
Los Angeles Right Care University of Best Practices Co-Chairs: Stephen C. Deutsch, MD, Chief Medical Officer, Cedars-Sinai Medical Foundation Robin Clarke, MD, MSHS, Medical Director for Quality, UCLA Faculty Practice Program (Hosted at USC School of Pharmacy) Sacramento Right Care University of Best Practices Co-Chairs: José Arévalo, MD FAAFP, Senior Medical Director, Sutter Independent Physicians Medical Group Dr. Alan R. Ertle, MD, MPH, MBA, Chief Medical Officer, Mercy Medical Group (Hosted at Sierra Health Foundation) San Diego Right Care University of Best Practices Co-Chairs: Anthony DeMaria, MD, Univ. of Best Practices Co-Chair; immediate past Editor-in-Chief, Journal of American College of Cardiology; Founding Director, UCSD Cardiovascular Center (Hosted at UC San Diego Scripps Forum)
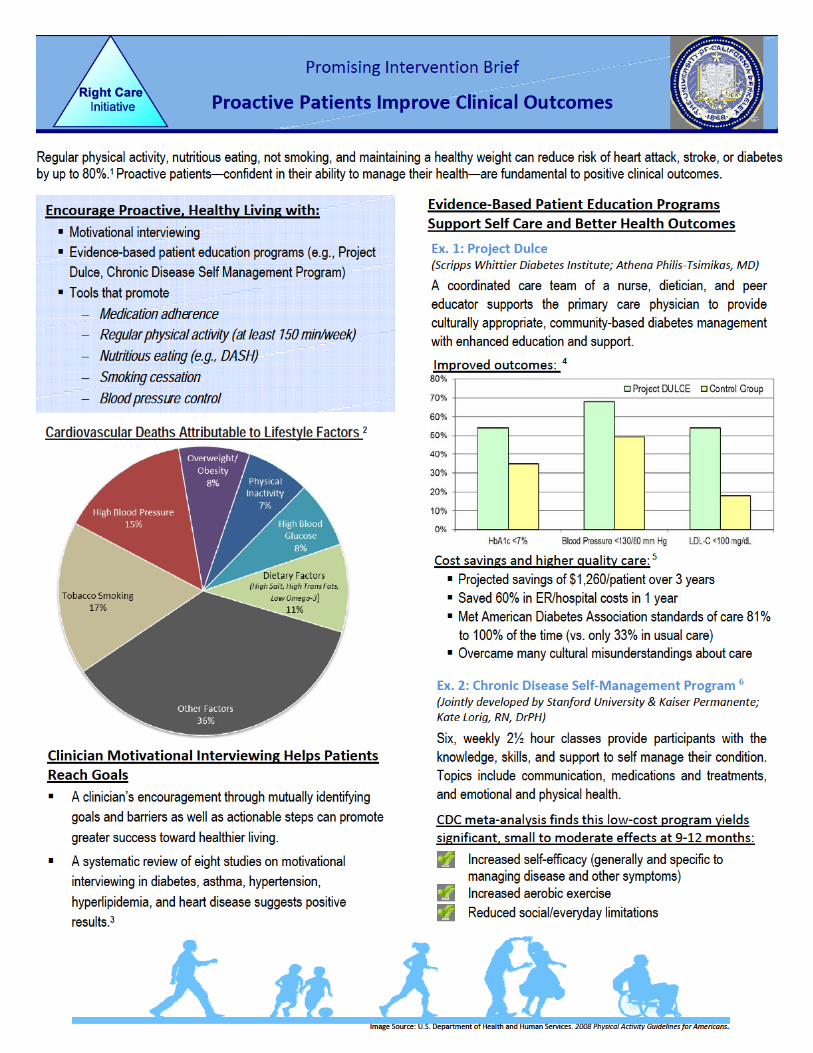
Patient Activation Motivate stress reduction, nutritious eating, physical activity, smoking cessation & medication adherence
Evidence-based patient education (e.g., Project DULCE; Stanford Patient Self-Management) Motivational interviewing and evidence-based media messaging
Promising Interventions to Reach HEDIS Control Targets for Heart Attack and Stroke Prevention
Clinical Pharmacists on Care Team
HRSA.gov/patientsafety Surgeon General’s Rpt.
Medical Home
Team-Based Un-blinded Performance Feedback
Web Supported High-Tech Enabled
Timely Continuous Care—Not Episodic Optimized Clinical Connectivity For Rapid Treatment
Patient Centered Practice Redesign
Medication Protocols Nationally Endorsed
Guidelines (AHA, ADA) European Union
Guidelines ALL/PHASE (Kaiser)
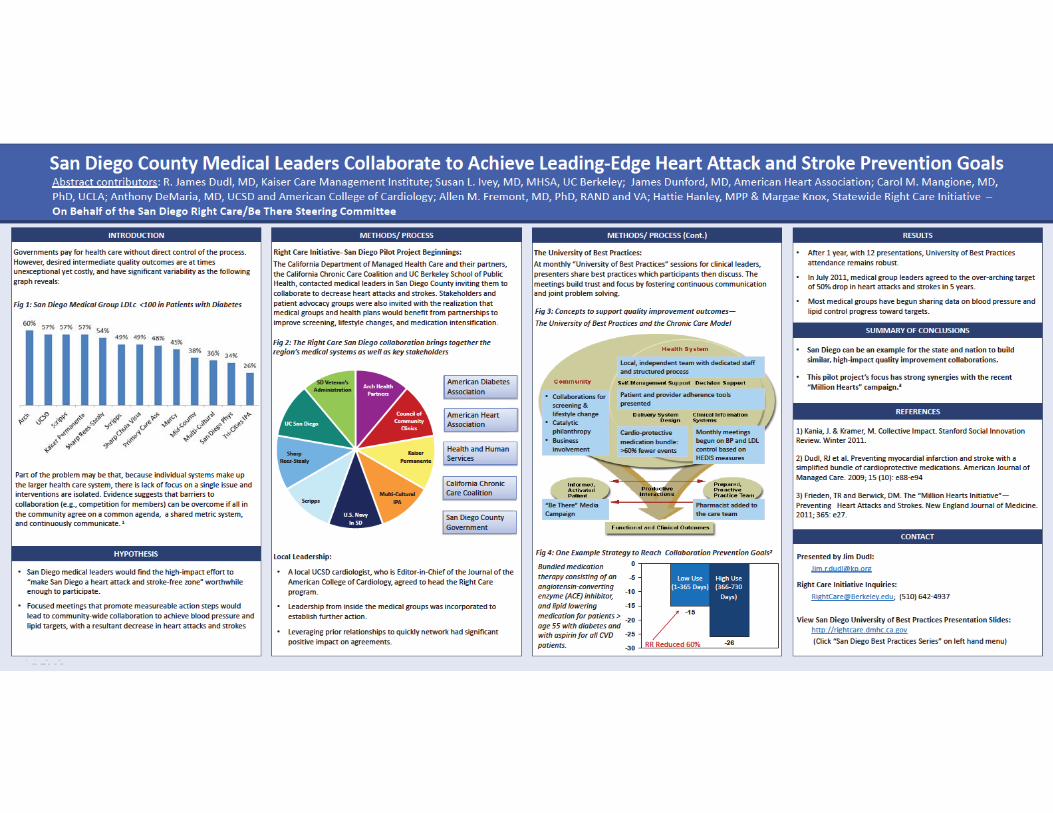
San Diego University of Best Practices steering committee medical directors came to con-sensus that heart attacks and strokes could be reduced by 50% in 5 years by implement-ing the interventions on the Right Care Triangle.
Research Questions: What are the promising inter-ventions for bringing patients into safe control?
How can implementation of evidence-based medicine be refined to quickly meet the Right Care goals and what are the barriers for doing so?
What strategies are needed to improve clinical outcomes in light of health disparities in California’s diverse population?
Resources: We wish to thank Right Care Initiative supporters: The Sierra Health Foundation, The CA Health Care Foundation, The
California Endowment, Judith and Jack White, The CA Office of the Patient Advocate, Novo Nordisk, Genentech, Boehringer-Ingelheim, Ralphs Grocery Company, Abbvie and The Health Services Advisory Group, which enables research and logistical support for the Right Care Initiative University of Best Practices and our annual leadership summits by the University of California.
Right Care Websites: http://www.rightcare.dmhc.ca.gov and http://rightcare.berkeley.edu
View medical group scores by county via the CA Office of the Patient Advocate: http://opa.ca.gov/report_card/medicalgroupcounty.aspx Last Updated: October 21, 2014
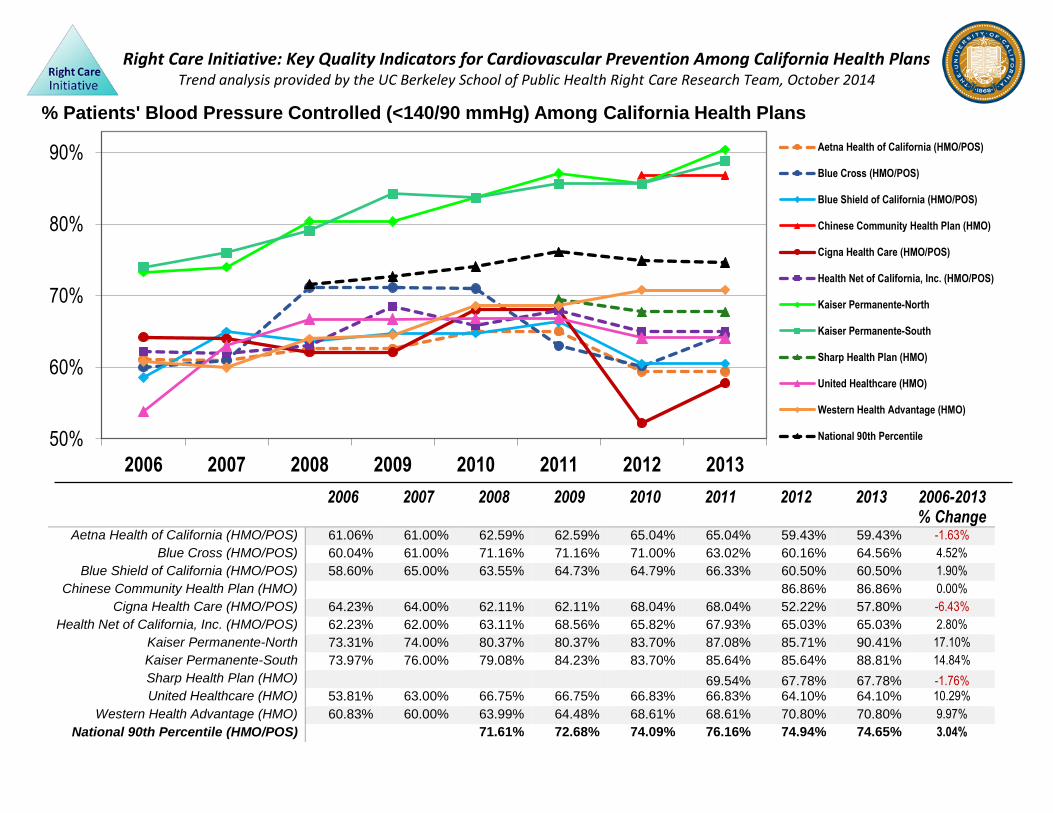
Right Care Initiative: Key Quality Indicators for Cardiovascular Prevention Among California Health Plans Trend analysis provided by the UC Berkeley School of Public Health Right Care Research Team, October 2014
2006 2007 2008 2009 2010 2011 2012 2013 2006-2013
% Change Aetna Health of California (HMO/POS) 61.06% 61.00% 62.59% 62.59% 65.04% 65.04% 59.43% 59.43% -1.63%
Blue Cross (HMO/POS) 60.04% 61.00% 71.16% 71.16% 71.00% 63.02% 60.16% 64.56% 4.52%
Blue Shield of California (HMO/POS) 58.60% 65.00% 63.55% 64.73% 64.79% 66.33% 60.50% 60.50% 1.90%
Chinese Community Health Plan (HMO) 86.86% 86.86% 0.00%
Cigna Health Care (HMO/POS) 64.23% 64.00% 62.11% 62.11% 68.04% 68.04% 52.22% 57.80% -6.43%
Health Net of California, Inc. (HMO/POS) 62.23% 62.00% 63.11% 68.56% 65.82% 67.93% 65.03% 65.03% 2.80%
Kaiser Permanente-North 73.31% 74.00% 80.37% 80.37% 83.70% 87.08% 85.71% 90.41% 17.10%
Kaiser Permanente-South 73.97% 76.00% 79.08% 84.23% 83.70% 85.64% 85.64% 88.81% 14.84%
Sharp Health Plan (HMO) 69.54% 67.78% 67.78% -1.76% United Healthcare (HMO) 53.81% 63.00% 66.75% 66.75% 66.83% 66.83% 64.10% 64.10% 10.29%
Western Health Advantage (HMO) 60.83% 60.00% 63.99% 64.48% 68.61% 68.61% 70.80% 70.80% 9.97%
National 90th Percentile (HMO/POS) 71.61% 72.68% 74.09% 76.16% 74.94% 74.65% 3.04%
50%
60%
70%
80%
90%
2006 2007 2008 2009 2010 2011 2012 2013
% Patients' Blood Pressure Controlled (<140/90 mmHg) Among California Health Plans
Aetna Health of California (HMO/POS)
Blue Cross (HMO/POS)
Blue Shield of California (HMO/POS)
Chinese Community Health Plan (HMO)
Cigna Health Care (HMO/POS)
Health Net of California, Inc. (HMO/POS)
Kaiser Permanente-North
Kaiser Permanente-South
Sharp Health Plan (HMO)
United Healthcare (HMO)
Western Health Advantage (HMO)
National 90th Percentile

Right Care Initiative: Key Quality Indicators for Cardiovascular Prevention Among California Health Plans Trend analysis provided by the UC Berkeley School of Public Health Right Care Research Team, October 2014
2006 2007 2008 2009 2010 2011 2012 2013 2006-2013 % Change
Aetna Health of California (HMO/POS) 40.77% 39.00% 46.89% 45.95% 54.69% 47.27% 42.27% 41.84% 1.07%
Blue Cross (HMO/POS) 42.17% 43.00% 53.86% 47.81% 45.07% 51.00% 51.00% 50.85% 8.68%
Blue Shield of California (HMO/POS) 44.55% 42.00% 48.58% 49.64% 49.64% 52.99% 46.91% 45.07% 0.52%
Chinese Community Health Plan (HMO) 56.20% 44.77% -11.43%
Cigna Health Care (HMO/POS) 40.63% 42.00% 53.04% 49.64% 49.64% 53.00% 48.66% 45.99% 5.36%
Health Net of California, Inc. (HMO/POS) 48.56% 49.00% 49.30% 54.50% 54.50% 47.51% 47.51% 45.50% -3.06%
Kaiser Permanente-North 54.68% 57.00% 62.77% 66.42% 66.42% 66.06% 68.72% 70.95% 16.27%
Kaiser Permanente-South 50.85% 50.00% 54.58% 62.57% 66.75% 62.14% 63.61% 62.77% 11.92%
Sharp Health Plan (HMO) 59.37% 59.37% 56.31% -3.06%
United Healthcare (HMO) 40.42% 45.00% 46.88% 50.94% 50.94% 51.26% 51.26% 47.49% 7.07%
Western Health Advantage (HMO) 41.36% 48.00% 47.93% 47.81% 50.73% 50.00% 50.00% 51.34% 9.98%
National 90th Percentile (HMO/POS) 52.61% 54.95% 57.18% 58.39% 59.12% 55.66% 3.05%
35%
40%
45%
50%
55%
60%
65%
70%
2006 2007 2008 2009 2010 2011 2012 2013
Diabetic Patients with Lipids Controlled (LDL-C<100) Among California Health Plans
Aetna Health of California (HMO/POS)
Blue Cross (HMO/POS)
Blue Shield of California (HMO/POS)
Chinese Community Health Plan (HMO)
Cigna Health Care (HMO/POS)
Health Net of California, Inc. (HMO/POS)
Kaiser Permanente-North
Kaiser Permanente-South
Sharp Health Plan (HMO)
United Healthcare (HMO)
Western Health Advantage (HMO)
National 90th Percentile

Right Care Initiative: Key Quality Indicators for Cardiovascular Prevention Among California Health Plans Trend analysis provided by the UC Berkeley School of Public Health Right Care Research Team, October 2014
2006 2007 2008 2009 2010 2011 2012 2013 2006-2013
% Change Aetna Health of California (HMO/POS) 61.16% 64.00% 60.53% 56.27% 59.62% 47.30% 62.26% 58.00% -3.16%
Blue Cross (HMO/POS) 65.74% 69.00% 69.00% 70.56% 70.56% 64.66% 64.66% 69.47% 3.73%
Blue Shield of California (HMO/POS) 62.58% 66.00% 62.16% 59.56% 59.56% 59.62% 59.95% 59.05% -3.53%
Chinese Community Health Plan (HMO) 65.91% 61.36% -4.55%
Cigna Health Care (HMO/POS) 64.48% 57.00% 60.55% 60.51% 60.51% 62.28% 62.28% 60.05% -4.43%
Health Net of California, Inc. (HMO/POS) 62.84% 65.00% 70.98% 69.87% 69.87% 67.40% 67.40% 64.75% 1.91%
Kaiser Permanente-North 66.04% 71.00% 72.84% 74.97% 74.17% 75.74% 78.04% 79.42% 13.38%
Kaiser Permanente-South 62.53% 70.00% 69.13% 72.87% 74.41% 78.94% 76.72% 76.72% 14.19%
Sharp Health Plan (HMO) 59.62% 65.23% 67.30% 7.68%
United Healthcare (HMO) 56.84% 63.00% 66.01% 62.98% 62.98% 65.11% 65.11% 60.51% 3.67%
Western Health Advantage (HMO) 59.87% 60.00% 60.44% 64.86% 64.86% 68.95% 68.95% 63.06% 3.19%
National 90th Percentile (HMO/POS) 69.04% 69.63% 71.97% 73.06% 73.06% 69.59% 0.55%
45%
50%
55%
60%
65%
70%
75%
80%
2006 2007 2008 2009 2010 2011 2012 2013
%Heart PatientswithLipids Controlled (LDL-Cholesterol<100) Among California Health Plans
Aetna Health of California (HMO/POS)
Blue Cross (HMO/POS)
Blue Shield of California (HMO/POS)
Chinese Community Health Plan (HMO)
Cigna Health Care (HMO/POS)
Health Net of California, Inc. (HMO/POS)
Kaiser Permanente-North
Kaiser Permanente-South
Sharp Health Plan (HMO)
United Healthcare (HMO)
Western Health Advantage (HMO)
National 90th Percentile

Right Care Initiative: Key Quality Indicators for Cardiovascular Prevention Among California Health Plans Trend analysis provided by the UC Berkeley School of Public Health Right Care Research Team, October 2014
2006 2007 2008 2009 2010 2011 2012 2013 2006-2013
% Change Aetna Health of California (HMO/POS) 69.78% 63.00% 70.02% 67.43% 73.47% 66.98% 62.56% 57.68% -12.10%
Blue Cross (HMO/POS) 69.88% 71.00% 75.50% 85.58% 85.58% 72.00% 72.00% 74.21% 4.33%
Blue Shield of California (HMO/POS) 75.30% 64.00% 71.56% 75.91% 75.91% 73.68% 72.91% 72.45% -2.85%
Chinese Community Health Plan (HMO) 82.48% 82.00% -0.48%
Cigna Health Care (HMO/POS) 71.53% 62.00% 71.29% 76.64% 76.64% 73.50% 74.45% 68.86% -2.67%
Health Net of California, Inc. (HMO/POS) 77.99% 63.00% 76.40% 78.42% 78.42% 75.13% 75.13% 73.24% -4.75%
Kaiser Permanente-North 77.45% 80.00% 79.01% 80.19% 81.39% 80.11% 80.11% 81.75% 4.30%
Kaiser Permanente-South 71.53% 79.00% 74.01% 76.24% 78.24% 78.02% 78.86% 79.02% 7.49%
Sharp Health Plan (HMO) 81.51% 81.51% 81.80% 0.29%
United Healthcare (HMO) 67.06% 67.00% 74.13% 74.96% 74.96% 74.55% 74.55% 69.93% 2.87%
Western Health Advantage (HMO) 65.94% 64.00% 71.05% 75.36% 77.01% 74.55% 78.47% 74.45% 8.51%
National 90th Percentile (HMO/POS) 80.46% 80.84% 83.21% 81.75% 81.82% 80.54% 0.08%
55%
60%
65%
70%
75%
80%
85%
2006 2007 2008 2009 2010 2011 2012 2013
Patients with Diabetes with Blood Sugar (HbA1c)<9 Among California Health Plans
Aetna Health of California (HMO/POS)
Blue Cross (HMO/POS)
Blue Shield of California (HMO/POS)
Chinese Community Health Plan (HMO)
Cigna Health Care (HMO/POS)
Health Net of California, Inc. (HMO/POS)
Kaiser Permanente-North
Kaiser Permanente-South
Sharp Health Plan (HMO)
United Healthcare (HMO)
Western Health Advantage (HMO)
National 90th Percentile
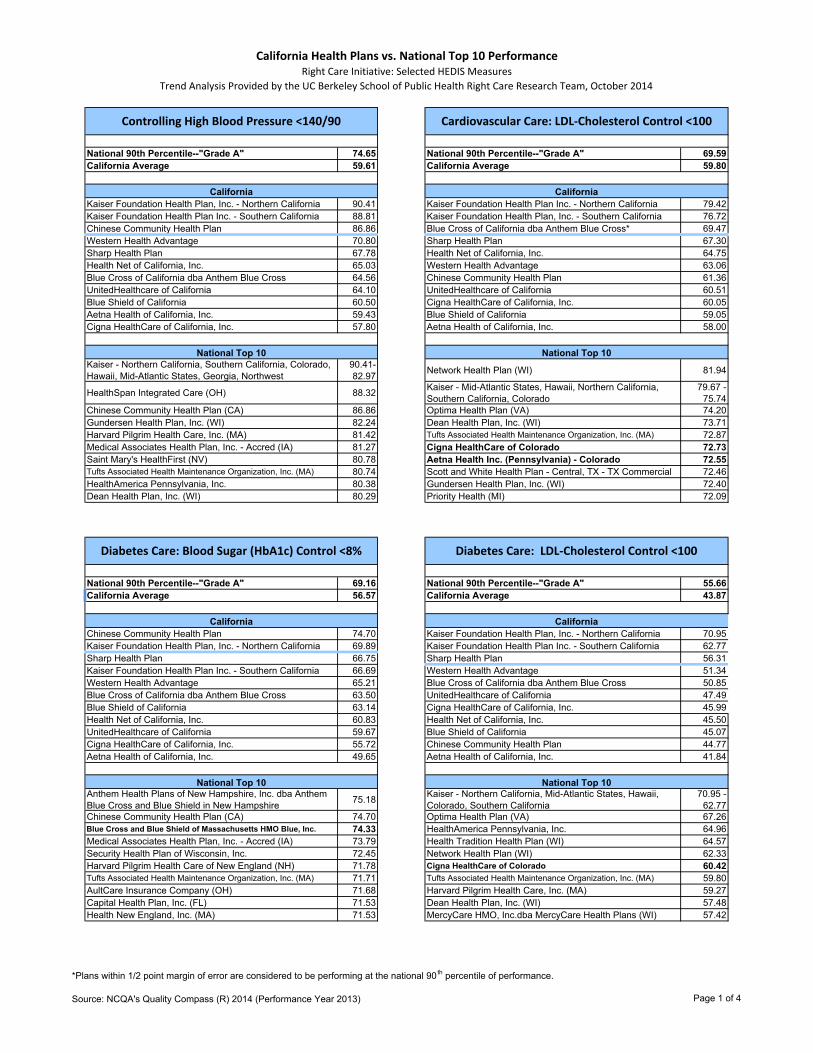
California Health Plans vs. National Top 10 PerformanceRight Care Initiative: Selected HEDIS Measures
Trend Analysis Provided by the UC Berkeley School of Public Health Right Care Research Team, October 2014
National 90th Percentile--"Grade A" 74.65 National 90th Percentile--"Grade A" 69.59California Average 59.61 California Average 59.80
Kaiser Foundation Health Plan, Inc. - Northern California 90.41 Kaiser Foundation Health Plan Inc. - Northern California 79.42Kaiser Foundation Health Plan Inc. - Southern California 88.81 Kaiser Foundation Health Plan, Inc. - Southern California 76.72Chinese Community Health Plan 86.86 Blue Cross of California dba Anthem Blue Cross* 69.47Western Health Advantage 70.80 Sharp Health Plan 67.30Sharp Health Plan 67.78 Health Net of California, Inc. 64.75Health Net of California, Inc. 65.03 Western Health Advantage 63.06Blue Cross of California dba Anthem Blue Cross 64.56 Chinese Community Health Plan 61.36UnitedHealthcare of California 64.10 UnitedHealthcare of California 60.51Blue Shield of California 60.50 Cigna HealthCare of California, Inc. 60.05Aetna Health of California, Inc. 59.43 Blue Shield of California 59.05Cigna HealthCare of California, Inc. 57.80 Aetna Health of California, Inc. 58.00
Kaiser - Northern California, Southern California, Colorado, Hawaii, Mid-Atlantic States, Georgia, Northwest
90.41-82.97 Network Health Plan (WI) 81.94
HealthSpan Integrated Care (OH) 88.32 Kaiser - Mid-Atlantic States, Hawaii, Northern California, Southern California, Colorado
79.67 - 75.74
Chinese Community Health Plan (CA) 86.86 Optima Health Plan (VA) 74.20Gundersen Health Plan, Inc. (WI) 82.24 Dean Health Plan, Inc. (WI) 73.71Harvard Pilgrim Health Care, Inc. (MA) 81.42 Tufts Associated Health Maintenance Organization, Inc. (MA) 72.87Medical Associates Health Plan, Inc. - Accred (IA) 81.27 Cigna HealthCare of Colorado 72.73Saint Mary's HealthFirst (NV) 80.78 Aetna Health Inc. (Pennsylvania) - Colorado 72.55Tufts Associated Health Maintenance Organization, Inc. (MA) 80.74 Scott and White Health Plan - Central, TX - TX Commercial 72.46HealthAmerica Pennsylvania, Inc. 80.38 Gundersen Health Plan, Inc. (WI) 72.40Dean Health Plan, Inc. (WI) 80.29 Priority Health (MI) 72.09
National 90th Percentile--"Grade A" 69.16 National 90th Percentile--"Grade A" 55.66California Average 56.57 California Average 43.87
Chinese Community Health Plan 74.70 Kaiser Foundation Health Plan, Inc. - Northern California 70.95Kaiser Foundation Health Plan, Inc. - Northern California 69.89 Kaiser Foundation Health Plan Inc. - Southern California 62.77Sharp Health Plan 66.75 Sharp Health Plan 56.31Kaiser Foundation Health Plan Inc. - Southern California 66.69 Western Health Advantage 51.34Western Health Advantage 65.21 Blue Cross of California dba Anthem Blue Cross 50.85Blue Cross of California dba Anthem Blue Cross 63.50 UnitedHealthcare of California 47.49Blue Shield of California 63.14 Cigna HealthCare of California, Inc. 45.99Health Net of California, Inc. 60.83 Health Net of California, Inc. 45.50UnitedHealthcare of California 59.67 Blue Shield of California 45.07Cigna HealthCare of California, Inc. 55.72 Chinese Community Health Plan 44.77Aetna Health of California, Inc. 49.65 Aetna Health of California, Inc. 41.84
Anthem Health Plans of New Hampshire, Inc. dba Anthem Blue Cross and Blue Shield in New Hampshire 75.18 Kaiser - Northern California, Mid-Atlantic States, Hawaii,
Colorado, Southern California70.95 -
62.77Chinese Community Health Plan (CA) 74.70 Optima Health Plan (VA) 67.26Blue Cross and Blue Shield of Massachusetts HMO Blue, Inc. 74.33 HealthAmerica Pennsylvania, Inc. 64.96Medical Associates Health Plan, Inc. - Accred (IA) 73.79 Health Tradition Health Plan (WI) 64.57Security Health Plan of Wisconsin, Inc. 72.45 Network Health Plan (WI) 62.33Harvard Pilgrim Health Care of New England (NH) 71.78 Cigna HealthCare of Colorado 60.42Tufts Associated Health Maintenance Organization, Inc. (MA) 71.71 Tufts Associated Health Maintenance Organization, Inc. (MA) 59.80AultCare Insurance Company (OH) 71.68 Harvard Pilgrim Health Care, Inc. (MA) 59.27Capital Health Plan, Inc. (FL) 71.53 Dean Health Plan, Inc. (WI) 57.48Health New England, Inc. (MA) 71.53 MercyCare HMO, Inc.dba MercyCare Health Plans (WI) 57.42
Cardiovascular Care: LDL‐Cholesterol Control <100
National Top 10
California
National Top 10
Controlling High Blood Pressure <140/90
California
Diabetes Care: LDL‐Cholesterol Control <100
National Top 10
California California
Diabetes Care: Blood Sugar (HbA1c) Control <8%
National Top 10
*Plans within 1/2 point margin of error are considered to be performing at the national 90th percentile of performance.
Source: NCQA's Quality Compass (R) 2014 (Performance Year 2013) Page 1 of 4

California Health Plans vs. National Top 10 PerformanceRight Care Initiative: Selected HEDIS Measures
Trend Analysis Provided by the UC Berkeley School of Public Health Right Care Research Team, October 2014
National 90th Percentile--"Grade A" 54.59 National 90th Percentile--"Grade A" 19.46California Average 39.01 California Average 32.96
Kaiser Foundation Health Plan Inc. - Southern California 67.39 Chinese Community Health Plan 18.00Kaiser Foundation Health Plan, Inc. - Northern California 63.70 Sharp Health Plan 18.20Chinese Community Health Plan 53.53 Kaiser Foundation Health Plan Inc. - Northern California 18.25Sharp Health Plan 52.43 Kaiser Foundation Health Plan Inc. - Southern California 20.98Blue Cross of California dba Anthem Blue Cross 46.96 Western Health Advantage 25.55Western Health Advantage 46.72 Blue Cross of California dba Anthem Blue Cross 25.79Health Net of California, Inc. 41.85 Health Net of California, Inc. 26.76Aetna Health of California, Inc. 39.95 Blue Shield of California 27.55UnitedHealthcare of California 39.14 UnitedHealthcare of California 30.07Cigna HealthCare of California, Inc. 37.96 Cigna HealthCare of California, Inc. 31.14Blue Shield of California 37.23 Aetna Health of California, Inc. 42.32
Kaiser - Mid-Atlantic States, Southern California, Northwest, Northern California, Hawaii, Colorado, Georgia
68.27-59.78
Blue Cross and Blue Shield of Massachusetts HMO Blue, Inc. 12.22
Dean Health Plan, Inc. (WI) 66.42 Health New England, Inc. (MA) 14.23
HealthSpan Integrated Care (OH) 64.48 Anthem Health Plans of New Hampshire, Inc. dba Anthem Blue Cross and Blue Shield in New Hampshire 14.36
Network Health Plan (WI) 59.66 Medical Associates Health Plan, Inc. - Accred (IA) 14.37Health Tradition Health Plan (WI) 59.05 Security Health Plan of Wisconsin, Inc. 16.06Harvard Pilgrim Health Care, Inc. (MA) 59.02 Sanford Health Plan (SD) 16.42Gundersen Health Plan, Inc. (WI) 58.59 HealthAmerica Pennsylvania, Inc. 16.61Martin's Point US Family Health Plan (ME) 58.39 Harvard Pilgrim Health Care, Inc. (MA) 16.83Health New England, Inc. (MA) 57.48 Cigna HealthCare of Colorado 17.19Unity Health Plans Insurance Corporation (WI) 57.33 Network Health Plan (WI) 17.59
National 90th Percentile--"Grade A" 90.63 National 90th Percentile--"Grade A" 91.72California Average 88.22 California Average 78.36
Kaiser Foundation Health Plan, Inc. - Northern California 96.27 Kaiser Foundation Health Plan, Inc. - Northern California 89.77Kaiser Foundation Health Plan, Inc. - Southern California 95.62 Kaiser Foundation Health Plan, Inc. - Southern California 89.16Chinese Community Health Plan 93.18 Aetna Health of California, Inc. 84.30Blue Cross of California dba Anthem Blue Cross 90.79 UnitedHealthcare of California 83.33Sharp Health Plan* 90.57 Blue Shield of California 80.58Aetna Health of California, Inc.* 90.25 Health Net of California, Inc. 79.06Health Net of California, Inc. 89.62 Blue Cross of California dba Anthem Blue Cross 76.08United Healthcare of California 88.97 Cigna HealthCare of California, Inc. 75.00Western Health Advantage 88.89 Chinese Community Health Plan NACigna Health Care of California 88.40 Sharp Health Plan NABlue Shield of California 86.68 Western Health Advantage NA
Kaiser - Hawaii, Northern California, Mid-Atlantic States, Southern California, Northwest, Georgia
97.45 - 94.47 Kaiser Foundation Health Plan of Colorado 98.18
Network Health Plan (WI) 95.81 Johns Hopkins US Family Health Plan (MD) 97.87HealthSpan Integrated Care (OH) 94.65 Health Alliance Medical Plans (IL) 97.48AultCare Insurance Company (OH) 94.59 Geisinger Health Plan (PA) 96.15Grand Valley Health Plan, Inc. (MI) 94.05 Scott and White Health Plan - Central, TX - TX Commercial 95.29Harvard Pilgrim Health Care, Inc. (MA) 93.73 Aetna Health Inc. (Connecticut) 95.00Federal Plan 87 (HI) 93.57 Health New England, Inc. (MA) 93.33Chinese Community Health Plan (CA) 93.18 Security Health Plan of Wisconsin, Inc. 92.73Tufts Associated Health Maintenance Organization, Inc. (MA) 92.99 HealthPlus of Michigan, Inc. 92.31Fallon Health (MA) 92.98 MD - Individual Practice Association, Inc. (NY) 92.11
California California
Diabetes Care: Poor Blood Sugar (HbA1c) Control (>9%)
California
National Top 10 National Top 10
(Lower Score Indicates Better Performance)
California
National Top 10 National Top 10
Persistence of Beta Blocker Treatment After a Heart AttackCardiovascular LDL‐Cholesterol Screening
Diabetes Care: Blood Pressure Control <140/80
*Plans within 1/2 point margin of error are considered to be performing at the national 90th percentile of performance.
Source: NCQA's Quality Compass (R) 2014 (Performance Year 2013) Page 2 of 4
California Health Plans vs. National Top 10 PerformanceRight Care Initiative: Selected HEDIS Measures
Trend Analysis Provided by the UC Berkeley School of Public Health Right Care Research Team, October 2014
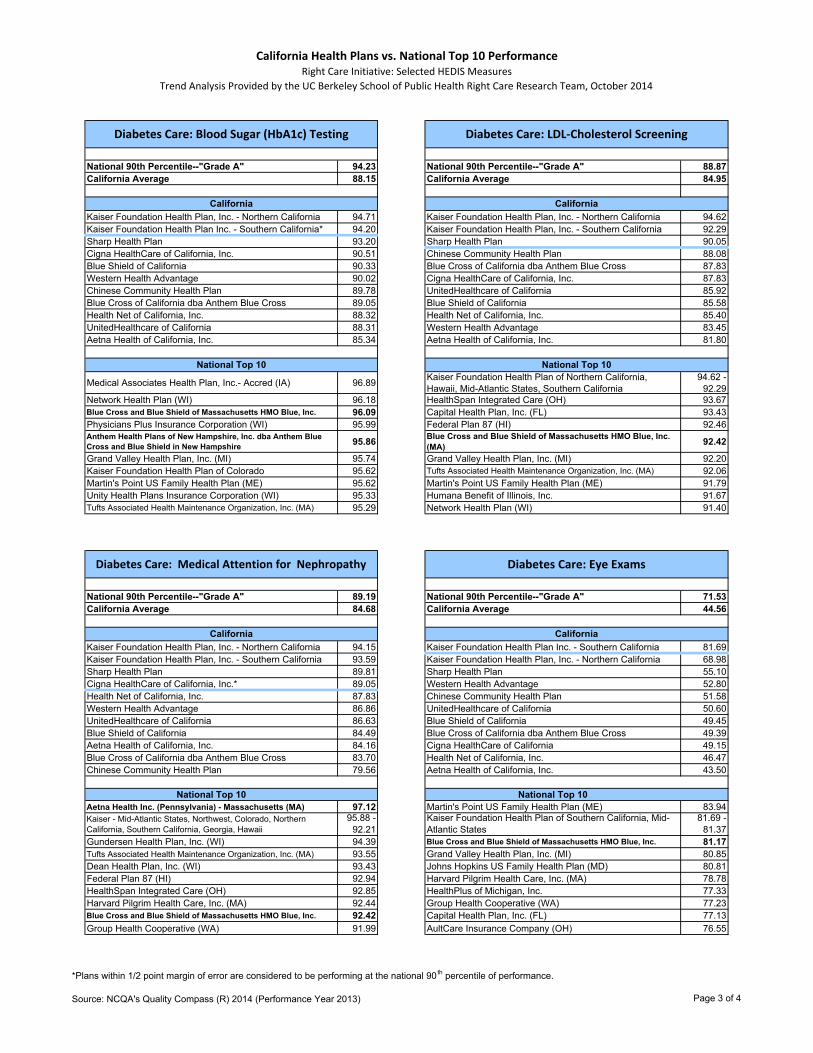
National 90th Percentile--"Grade A" 94.23 National 90th Percentile--"Grade A" 88.87California Average 88.15 California Average 84.95
Kaiser Foundation Health Plan, Inc. - Northern California 94.71 Kaiser Foundation Health Plan, Inc. - Northern California 94.62Kaiser Foundation Health Plan Inc. - Southern California* 94.20 Kaiser Foundation Health Plan, Inc. - Southern California 92.29Sharp Health Plan 93.20 Sharp Health Plan 90.05Cigna HealthCare of California, Inc. 90.51 Chinese Community Health Plan 88.08Blue Shield of California 90.33 Blue Cross of California dba Anthem Blue Cross 87.83Western Health Advantage 90.02 Cigna HealthCare of California, Inc. 87.83Chinese Community Health Plan 89.78 UnitedHealthcare of California 85.92Blue Cross of California dba Anthem Blue Cross 89.05 Blue Shield of California 85.58Health Net of California, Inc. 88.32 Health Net of California, Inc. 85.40UnitedHealthcare of California 88.31 Western Health Advantage 83.45Aetna Health of California, Inc. 85.34 Aetna Health of California, Inc. 81.80
Medical Associates Health Plan, Inc.- Accred (IA) 96.89 Kaiser Foundation Health Plan of Northern California, Hawaii, Mid-Atlantic States, Southern California
94.62 - 92.29
Network Health Plan (WI) 96.18 HealthSpan Integrated Care (OH) 93.67Blue Cross and Blue Shield of Massachusetts HMO Blue, Inc. 96.09 Capital Health Plan, Inc. (FL) 93.43Physicians Plus Insurance Corporation (WI) 95.99 Federal Plan 87 (HI) 92.46Anthem Health Plans of New Hampshire, Inc. dba Anthem Blue Cross and Blue Shield in New Hampshire 95.86 Blue Cross and Blue Shield of Massachusetts HMO Blue, Inc.
(MA) 92.42
Grand Valley Health Plan, Inc. (MI) 95.74 Grand Valley Health Plan, Inc. (MI) 92.20Kaiser Foundation Health Plan of Colorado 95.62 Tufts Associated Health Maintenance Organization, Inc. (MA) 92.06Martin's Point US Family Health Plan (ME) 95.62 Martin's Point US Family Health Plan (ME) 91.79Unity Health Plans Insurance Corporation (WI) 95.33 Humana Benefit of Illinois, Inc. 91.67Tufts Associated Health Maintenance Organization, Inc. (MA) 95.29 Network Health Plan (WI) 91.40
National 90th Percentile--"Grade A" 89.19 National 90th Percentile--"Grade A" 71.53California Average 84.68 California Average 44.56
Kaiser Foundation Health Plan, Inc. - Northern California 94.15 Kaiser Foundation Health Plan Inc. - Southern California 81.69Kaiser Foundation Health Plan, Inc. - Southern California 93.59 Kaiser Foundation Health Plan, Inc. - Northern California 68.98Sharp Health Plan 89.81 Sharp Health Plan 55.10Cigna HealthCare of California, Inc.* 89.05 Western Health Advantage 52.80Health Net of California, Inc. 87.83 Chinese Community Health Plan 51.58Western Health Advantage 86.86 UnitedHealthcare of California 50.60UnitedHealthcare of California 86.63 Blue Shield of California 49.45Blue Shield of California 84.49 Blue Cross of California dba Anthem Blue Cross 49.39Aetna Health of California, Inc. 84.16 Cigna HealthCare of California 49.15Blue Cross of California dba Anthem Blue Cross 83.70 Health Net of California, Inc. 46.47Chinese Community Health Plan 79.56 Aetna Health of California, Inc. 43.50
National Top 10 National Top 10 Aetna Health Inc. (Pennsylvania) - Massachusetts (MA) 97.12 Martin's Point US Family Health Plan (ME) 83.94Kaiser - Mid-Atlantic States, Northwest, Colorado, Northern California, Southern California, Georgia, Hawaii
95.88 - 92.21
Kaiser Foundation Health Plan of Southern California, Mid-Atlantic States
81.69 - 81.37
Gundersen Health Plan, Inc. (WI) 94.39 Blue Cross and Blue Shield of Massachusetts HMO Blue, Inc. 81.17Tufts Associated Health Maintenance Organization, Inc. (MA) 93.55 Grand Valley Health Plan, Inc. (MI) 80.85Dean Health Plan, Inc. (WI) 93.43 Johns Hopkins US Family Health Plan (MD) 80.81Federal Plan 87 (HI) 92.94 Harvard Pilgrim Health Care, Inc. (MA) 78.78HealthSpan Integrated Care (OH) 92.85 HealthPlus of Michigan, Inc. 77.33Harvard Pilgrim Health Care, Inc. (MA) 92.44 Group Health Cooperative (WA) 77.23Blue Cross and Blue Shield of Massachusetts HMO Blue, Inc. 92.42 Capital Health Plan, Inc. (FL) 77.13Group Health Cooperative (WA) 91.99 AultCare Insurance Company (OH) 76.55
Diabetes Care: LDL‐Cholesterol Screening
National Top 10
California
National Top 10
California
California California
Diabetes Care: Medical Attention for Nephropathy Diabetes Care: Eye Exams
Diabetes Care: Blood Sugar (HbA1c) Testing
*Plans within 1/2 point margin of error are considered to be performing at the national 90th percentile of performance.
Source: NCQA's Quality Compass (R) 2014 (Performance Year 2013) Page 3 of 4
California Health Plans vs. National Top 10 PerformanceRight Care Initiative: Selected HEDIS Measures
Trend Analysis Provided by the UC Berkeley School of Public Health Right Care Research Team, October 2014
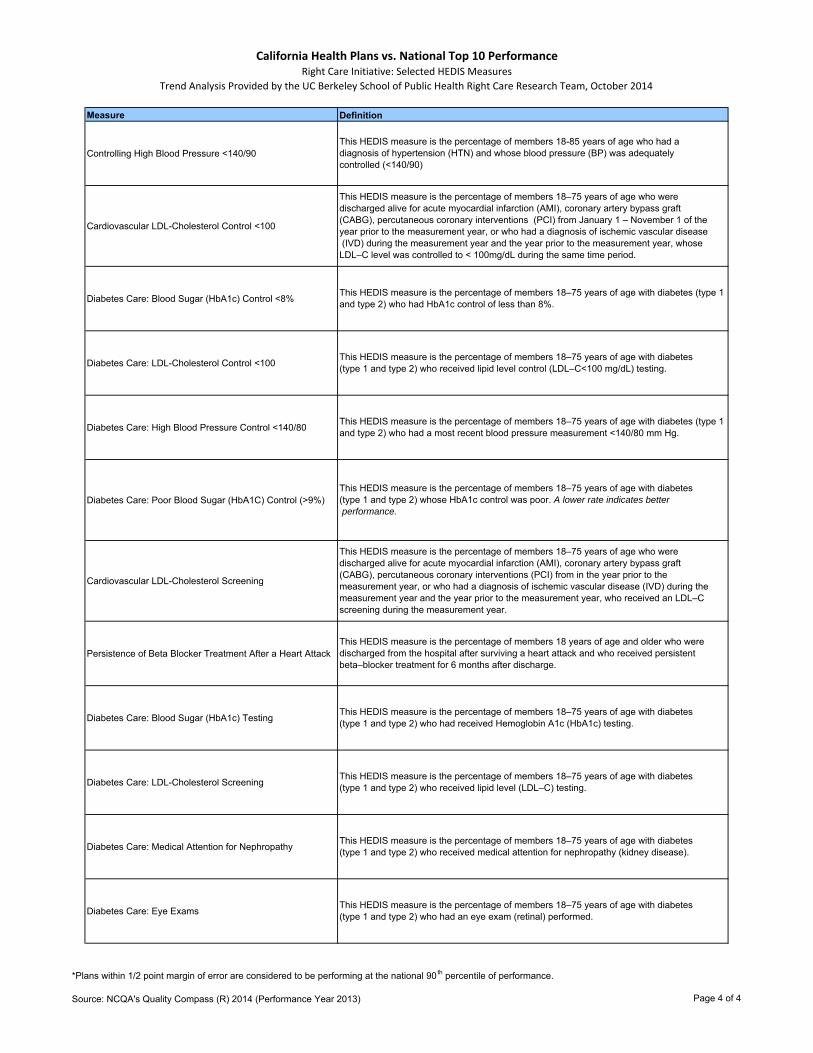
Measure
Controlling High Blood Pressure <140/90
Cardiovascular LDL-Cholesterol Control <100
Diabetes Care: Blood Sugar (HbA1c) Control <8%
Diabetes Care: LDL-Cholesterol Control <100
Diabetes Care: High Blood Pressure Control <140/80
Diabetes Care: Poor Blood Sugar (HbA1C) Control (>9%)
Cardiovascular LDL-Cholesterol Screening
Persistence of Beta Blocker Treatment After a Heart Attack
Diabetes Care: Blood Sugar (HbA1c) Testing
Diabetes Care: LDL-Cholesterol Screening
Diabetes Care: Medical Attention for Nephropathy
Diabetes Care: Eye Exams
Definition
This HEDIS measure is the percentage of members 18–75 years of age with diabetes (type 1 and type 2) who had an eye exam (retinal) performed.
This HEDIS measure is the percentage of members 18–75 years of age with diabetes (type 1 and type 2) whose HbA1c control was poor. A lower rate indicates better performance.
This HEDIS measure is the percentage of members 18–75 years of age who were discharged alive for acute myocardial infarction (AMI), coronary artery bypass graft (CABG), percutaneous coronary interventions (PCI) from in the year prior to themeasurement year, or who had a diagnosis of ischemic vascular disease (IVD) during the measurement year and the year prior to the measurement year, who received an LDL–C screening during the measurement year.
This HEDIS measure is the percentage of members 18 years of age and older who were discharged from the hospital after surviving a heart attack and who received persistent beta–blocker treatment for 6 months after discharge.
This HEDIS measure is the percentage of members 18–75 years of age with diabetes (type 1 and type 2) who had received Hemoglobin A1c (HbA1c) testing.
This HEDIS measure is the percentage of members 18–75 years of age with diabetes (type 1 and type 2) who received lipid level (LDL–C) testing.
This HEDIS measure is the percentage of members 18–75 years of age with diabetes (type 1 and type 2) who received medical attention for nephropathy (kidney disease).
This HEDIS measure is the percentage of members 18-85 years of age who had a diagnosis of hypertension (HTN) and whose blood pressure (BP) was adequatelycontrolled (<140/90)
This HEDIS measure is the percentage of members 18–75 years of age who were discharged alive for acute myocardial infarction (AMI), coronary artery bypass graft (CABG), percutaneous coronary interventions (PCI) from January 1 – November 1 of the year prior to the measurement year, or who had a diagnosis of ischemic vascular disease (IVD) during the measurement year and the year prior to the measurement year, whose LDL–C level was controlled to < 100mg/dL during the same time period.
This HEDIS measure is the percentage of members 18–75 years of age with diabetes (type 1 and type 2) who had HbA1c control of less than 8%.
This HEDIS measure is the percentage of members 18–75 years of age with diabetes (type 1 and type 2) who received lipid level control (LDL–C<100 mg/dL) testing.
This HEDIS measure is the percentage of members 18–75 years of age with diabetes (type 1 and type 2) who had a most recent blood pressure measurement <140/80 mm Hg.
*Plans within 1/2 point margin of error are considered to be performing at the national 90th percentile of performance.
Source: NCQA's Quality Compass (R) 2014 (Performance Year 2013) Page 4 of 4
A D h P Y i CA d Di b S k d C
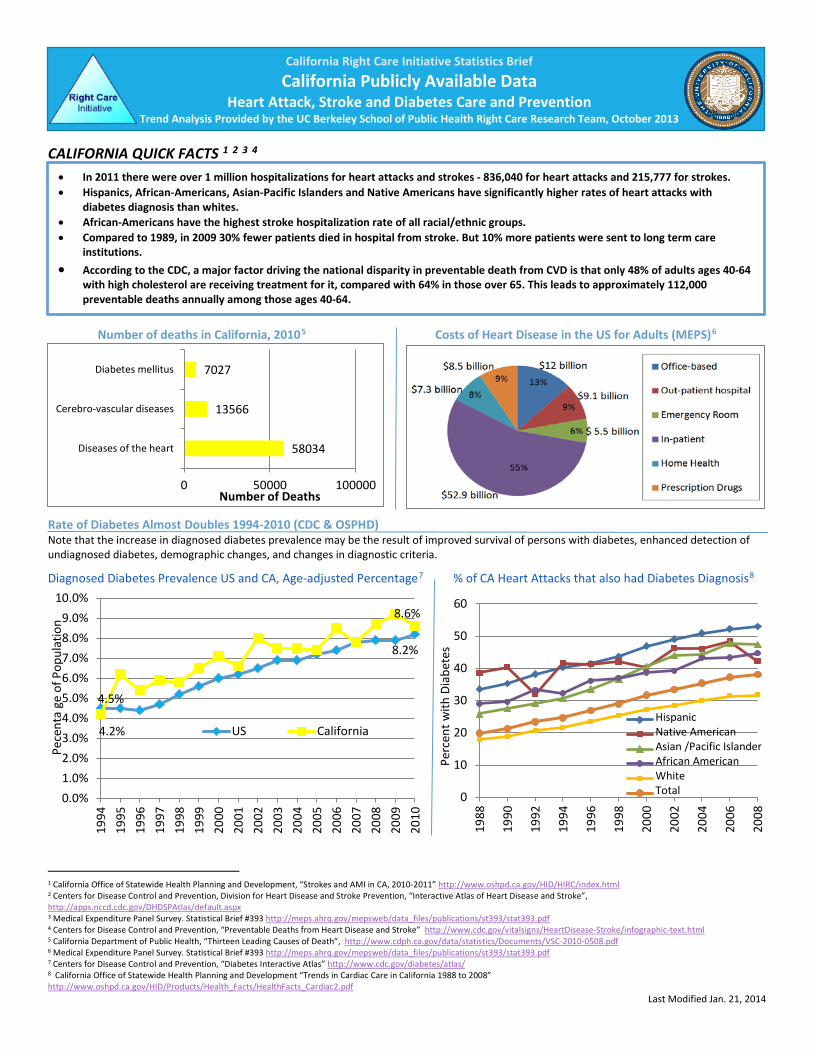
CALIFORNIA QUICK FACTS 1 2 3 4
Number of deaths in California, 20105 Costs of Heart Disease in the US for Adults (MEPS)6
Rate of Diabetes Almost Doubles 1994-2010 (CDC & OSPHD) Note that the increase in diagnosed diabetes prevalence may be the result of improved survival of persons with diabetes, enhanced detection of undiagnosed diabetes, demographic changes, and changes in diagnostic criteria.
Diagnosed Diabetes Prevalence US and CA, Age-adjusted Percentage7 % of CA Heart Attacks that also had Diabetes Diagnosis8
1 California Office of Statewide Health Planning and Development, “Strokes and AMI in CA, 2010-2011” http://www.oshpd.ca.gov/HID/HIRC/index.html 2 Centers for Disease Control and Prevention, Division for Heart Disease and Stroke Prevention, “Interactive Atlas of Heart Disease and Stroke”, http://apps.nccd.cdc.gov/DHDSPAtlas/default.aspx 3 Medical Expenditure Panel Survey. Statistical Brief #393 http://meps.ahrq.gov/mepsweb/data_files/publications/st393/stat393.pdf 4 Centers for Disease Control and Prevention, “Preventable Deaths from Heart Disease and Stroke” http://www.cdc.gov/vitalsigns/HeartDisease-Stroke/infographic-text.html 5 California Department of Public Health, “Thirteen Leading Causes of Death”, http://www.cdph.ca.gov/data/statistics/Documents/VSC-2010-0508.pdf 6 Medical Expenditure Panel Survey. Statistical Brief #393 http://meps.ahrq.gov/mepsweb/data_files/publications/st393/stat393.pdf 7 Centers for Disease Control and Prevention, “Diabetes Interactive Atlas” http://www.cdc.gov/diabetes/atlas/ 8 California Office of Statewide Health Planning and Development “Trends in Cardiac Care in California 1988 to 2008” http://www.oshpd.ca.gov/HID/Products/Health_Facts/HealthFacts_Cardiac2.pdf
• In 2011 there were over 1 million hospitalizations for heart attacks and strokes - 836,040 for heart attacks and 215,777 for strokes. • Hispanics, African-Americans, Asian-Pacific Islanders and Native Americans have significantly higher rates of heart attacks with
diabetes diagnosis than whites. • African-Americans have the highest stroke hospitalization rate of all racial/ethnic groups. • Compared to 1989, in 2009 30% fewer patients died in hospital from stroke. But 10% more patients were sent to long term care
institutions. • According to the CDC, a major factor driving the national disparity in preventable death from CVD is that only 48% of adults ages 40-64
with high cholesterol are receiving treatment for it, compared with 64% in those over 65. This leads to approximately 112,000 preventable deaths annually among those ages 40-64.
4.5%
8.2%
4.2%
8.6%
0.0%1.0%2.0%3.0%4.0%5.0%6.0%7.0%8.0%9.0%
10.0%
1994
1995
1996
1997
1998
1999
2000
2001
2002
2003
2004
2005
2006
2007
2008
2009
2010
Pece
nta
ge o
f Pop
ulat
ion
US California
0
10
20
30
40
50
60
1988
1990
1992
1994
1996
1998
2000
2002
2004
2006
2008
Perc
ent w
ith D
iabe
tes
HispanicNative AmericanAsian /Pacific IslanderAfrican AmericanWhiteTotal
California Right Care Initiative Statistics Brief
California Publicly Available Data Heart Attack, Stroke and Diabetes Care and Prevention
Trend Analysis Provided by the UC Berkeley School of Public Health Right Care Research Team, October 2013
58034
13566
7027
0 50000 100000
Diseases of the heart
Cerebro-vascular diseases
Diabetes mellitus
Number of Deaths
Last Modified Jan. 21, 2014

Preventable Cardiovascular Disease Deaths (US)1
CA Health Disparities by Race and Gender (CDC) _
CA Heart Disease Death Rate, Under Age 75, 2008-109 CA Stroke Death Rate, Under Age 75, 2008-109
Costs of California’s Stroke, Heart Attack, and Diabetes Patients (OSPHD & CMS) _ Total Medicare Hospitalizations in CA (2011) 10 Stroke or Heart Attack Patients in CA by Payer Type (2011) 11
9 Centers for Disease Control and Prevention, Centers for Heart Disease and Stroke Prevention- http://nccd.cdc.gov/DHDSPAtlas/# 10 Centers for Medicare and & Medicaid Services, “Medicare Provider Charge Data” (DRG codes 064-066, 280-282, 638), http://www.cms.gov/Research-Statistics-Data-and-Systems/Statistics-Trends-and-Reports/Medicare-Provider-Charge-Data/index.html 11 California Office of Statewide Health Planning and Development, “Strokes and AMI in CA, 2010-2011” http://www.oshpd.ca.gov/HID/HIRC/index.html 12Centers for Disease Control and Prevention, “Preventable Deaths from Heart Disease and Stroke” http://www.cdc.gov/vitalsigns/HeartDisease-Stroke/infographic-text.html
68.5%11.1%
15.2%
2.3% 1.4% 1.4%MedicareMedi-CalPrivate CoverageSelf PayIndigent ProgramsOther
Medicare Patients Hospitalized for:
Total Discharges
Total Payments
Strokes 16823 $ 194,239,764
Heart Attacks, Discharged Alive
7746 $ 98,032,756
Diabetes with Comorbidity
3299 $ 24,639,213
California Right Care Initiative Statistics Brief
California Publicly Available Data Heart Attack, Stroke and Diabetes Care and Prevention Trend Analysis Provided by the UC Berkeley School of Public Health Right Care Research Team, October 2013 (Page 2)
020406080
100120140160
Heart DiseaseDeath Rate per100,000 MEN
Heart DiseaseDeath Rate per100,000 WOMEN
05
1015202530
Stroke Death Rateper 100,000 MEN
Stroke Death Rateper 100,000WOMEN
Last Modified Jan. 21, 2014


Sources:
1. California Office of Statewide Health Planning and Development, “Strokes and AMI in Sacramento, 2010-2011” http://www.oshpd.ca.gov/HID/HIRC/index.html
2. California Office of the Patient Advocate, “Sacramento Medical Group Ratings (2014 Edition)” http://www.opa.ca.gov/Pages/reportcard.aspx
3. California Department of Public Health, “County Health Status Profiles, 2012” http://www.cdph.ca.gov/pubsforms/Pubs/OHIRProfiles2012.pdf
4. US Dept. of Health and Human Services, “2020 Topics & Objectives: Heart Disease and Stroke” http://www.healthypeople.gov/2020/topicsobjectives2020/nationaldata.aspx?topicId=21
5. Centers for Disease Control and Prevention, “National Diabetes Surveillance System” http://www.cdc.gov/diabetes/statistics/prev/national/figageadult.htm, http://www.cdc.gov/diabetes/atlas/countydata/atlas.html
Last Modified: 1/31/2014
California Right Care Initiative Statistics Brief
Sacramento Publicly Available Data Heart Attack, Stroke and Diabetes Care and Prevention Trend Analysis Provided by the UC Berkeley School of Public Health Right Care Research Team, October 2013 (Page 4)

Purpose Share ways to replicate successful strategies by
catalyzing the uptake of best practices with presentations by expert speakers experienced in achieving benchmark outcomes
Provide an educational, interactive setting for exchanging proven clinical quality strategies
Build esprit de corps and enthusiasm among medical directors, pharmacy directors and quality improvement teams across a region to meet the goals for preventing heart attacks, strokes, and diabetic complications
Participants Include: All major health delivery systems, representing more than
80% of medical care provided in a given metro area Medical, quality improvement and pharmacy directors from
medical groups and pharmacies (and, in Sacramento and LA, from health plans)
Community clinics The Veterans Administration and military medical centers Government officials:
− The CA Department of Managed Health Care − CA Department of Health Care Services (Medi-Cal);
OPA and CA Department of Public Health − County Health Officials
Right Care research team (UC Berkeley, UCLA, UCSD, RAND, and USC)
Examples of UBP Presentations Include:
Treatment Disparities in Women’s Cardiovascular Disease (Data from one Health Plan) – Chloe E. Bird, PhD, MA, Senior Sociologist, RAND Corporation, Professor of Sociology and Policy Analysis Pardee RAND Graduate School Kaiser’s Approach to Reducing Disparities in Controlling
Blood Pressure, HbA1C and Cholesterol – Winston F. Wong, MD, MS, Medical Director, Community Benefits; Director, Disparities Improvement and Quality Initiatives, Kaiser Permanente Bringing it All Together: Evidence-Based Prevention and
Treatment of Atherosclerotic Cardiovascular Disease – Gregg C. Fonarow, MD FACC, FAHA, Eliot Corday Professor of Cardiovascular Medicine and Science. Director, Ahmanson-UCLA Cardiomyopathy Center. Co-Director Preventative Cardiology Program and Clinical Co-Chief Division of Cardiology at David Geffen School of Medicine at UCLA “Measure Up, Pressure Down” AMGA Hypertension
Management Campaign – Jerry Penso, MD, MBA, Chief Medical Officer, American Medical Group Association How the American Heart Association and Emergency Medical
Services Can Help You Save Lives and Money—Jim Dunford, MD, City EMS Medical Director and President of the Board of the Greater SD American Heart Association Kaiser ALL Medication Protocol - Proactive Reduction of Risk
of Heart Attack and Stroke for Diabetes and Heart Disease Patients—Jim Dudl, MD, National Community Benefits and Diabetes Clinical Lead, Kaiser Permanente Care Management Institute San Diego Beacon Community Grant to Strengthen Health
Information Technology—Ted Chan, MD & Anupam Goel, MD, Principal Investigators of the Beacon Project UCSD & SD Achieving Benchmark Results through Collaboration with
Pharmacists—Jan Hirsch, RPh, PhD, Associate Professor of Clinical Pharmacy, UC San Diego & Rebecca Cupp, RPh, Vice President of Pharmacy, Ralphs Grocery Company Patient Centered Care: Practical Lessons—Diane
Stollenwerk, MPP, VP of Community Alliances, National Quality Forum Quality Improvement for Diverse Populations: Place and Race
Matters—Rodney Hood, MD, Chief Medical Officer, Multicultural Primary Care Medical Group San Diego Strategies to Improve the Care of Patients with Diabetes and
Vascular Disease--Dr. Bruce D. McCarthy, MD, MPH, President, Physician Division Columbia-St. Mary's Ascension Health
View these presentations and more at http://www.dmhc.ca.gov/healthplans/gen/gen_rci_sdbps.aspx
The Right Care Initiative has worked since 2007 to improve clinical outcomes by catalyzing uptake of patient-centered, evidence-based best practices among medical groups, clinics, and health plans. This public-private partnership includes clinicians, health systems, patients, the University of California, USC, Stanford Clinical Excellence Research Center, Health Services Advisory Group (CMS QIO), the Chronic Care Coalition; RAND; and the CA Department of Managed Health Care. We collaborate intensively with local leaders in three major metro areas to work on improving critical metrics for heart attack, stroke and diabetes complications prevention. Speakers are invited from organizations with breakthrough clinical quality success to share their strategies for improving patient outcomes. The first University of Best Practices (UBP) launched in San Diego in 2011, the second in Sacramento in 2012, and the third in Los Angeles in 2013.
California Right Care Initiative Program Description
University of Best Practices Colloquium
Right Care Initiative

California Right Care Initiative Program Description
The University of Best Practices Colloquium Page 2 The University of Best Practices in More Detail Monthly Meetings
Clinical quality benchmark performer and/or expert presents for the first hour
A break out session or discussion in the round follows in the second hour to consider how to apply the speaker’s ideas in the local setting and to problem-solve how to overcome barriers
Lessons Learned A collaborative, “non-combat zone” spirit among local clinical
leaders is the essential ingredient, following the Warren principle: In this room we compete against disease, not against each other
Lecture should be scheduled for 50% or less of allotted time to allow for sufficient discussion on achievable, locally applicable action plans
Informal time before and after the formal schedule facilitates one-on-one conversations and builds cohesive relationships
Many hours of behind-the-scenes planning and organizing are needed for a successful collaborative
Resources An NIH-GO (National Institutes of Health - Grand Opportunity)
grant, awarded to the Right Care research team in 2009, supported launch of the initial University of Best Practices in San Diego by the UC Berkeley research team
Charitable contributions are continuing this important endeavor now that the NIH-GO grant is concluded
The California Health Care Quality Report Card The California Health Care Quality Report Card compares performance for the largest California health plans and over 220 medical groups. It is published each spring by the CA Office of the Patient Advocate. These HEDIS and pay for performance metrics provide key benchmarks for the Right Care Initiative’s quality improvement effort. See example for San Diego here. San Diego Medical Group Cholesterol Control for People with Heart Disease (Based on the California Health Care Quality Report Card 2009 & 2014 Editions—data from performance years 2007 & 2012)
Right Care Measures for Preventing Heart Attacks, Strokes, and Diabetic Complications
Hypertension control (<140/90 mmHg) Cholesterol control for heart care patients (LDL-C <100) Cholesterol control for diabetes care patients (LDL-C <100) Blood sugar control for diabetes care patients (HbA1c <8) Blood pressure control for diabetes care patients (<140/90 mmHg)
Looking Forward The learnings from the University of Best Practices
dedicated to prevention of heart attack and stroke are expected to be spread statewide as they evolve
Steering committee medical directors from the San Diego University of Best Practices came to consensus that heart attacks and strokes could be reduced by 50% in 5 years by implementing the interventions on the Right Care Triangle (see Right Care Initiative Project Brief)
58%
72%
61% 60%67% 61% 58% 56%
40%
82% 79% 76%71%
68% 64% 64% 63% 61% 58%52%
48%
20%
40%
60%
80%
UC San Diego Sharp Rees-Stealy
Kasier- S. CA ScrippsCoastal
Scripps Clinic Primary CareAssociates
SharpCommunity
MercyPhysicians
Arch HealthPartners
Greater Tri-Cities
San DiegoPhysicians
Multi-CulturalPrimary Care
Performance Year 2007 Performance Year 2012
This program description was written by the Right Care Initiative team at the University of California, Berkeley, with support from the California Office of the Patient Advocate—Last updated July 23, 2014 For more information visit: rightcare.berkeley.edu
73%= 90th Percentile HMO/POS Performance for Heart Disease Patient Cholesterol Control in 2012

Successful chronic care management begins with an activated patient.
A Need for Pharmacy Medication Management Approximately 25% of patients given a new prescription experienced an adverse drug event in a study of four primary-care practices1. A pharmacist on the care team can help prevent and ameliorate adverse drug events and optimize medication therapy.
The Asheville Project (City of Asheville, NC) The Asheville quasi-experimental, longitudinal cohort studies provided initial evidence of pharmacist on care team benefits.
Asheville Cardiovascular (CV) Events and Costs: Category Before After Rate of CV events 77 per 1,000 38 per 1,000 CV-related medical costs $1,362 PPPY $734 PPPY
Outcomes for Cardiovascular Pharmacy Management2
Outcomes for Diabetes Pharmacy Management3
Typical “Pharmacist on the Care Team” Services
60-minute initial patient interview and counseling session with telephone follow up and future 20-30 minute sessions
Comprehensive review of lab results and medications (including over-the-counter medications)
Determination of drug interactions, how to improve medication therapy, and cost savings alternatives
Interactive communication with physician Point of care testing (e.g., blood pressure)
Promising Intervention Brief
Pharmacist on the Care Team
Recent Studies Bolster Evidence for Pharmacy Care Randomized controlled trials since the Asheville project are adding to the evidence of clinical and economic benefits.
HealthPartners Medical Group: Home BP Telemonitoring and Pharmacist Management Intervention (HyperLink)6
(Home BP telemonitors transmitted patient measurements to clinic-based pharmacists, who then adjust hypertensive therapy.)
Category Intervention Usual Care BP Control After 12-month Intervention 71.2% 52.8%
BP Reduction From Baseline 6 Months Post-Intervention 21.3% 14.7%
Ralph’s Pharmacy Intervention Clinical Outcomes5
Baseline
Mean Final Mean % Change in
Mean Heart Patients BP Systolic 136.1 129.5 -4.85% BP Diastolic 83.5 79.3 -5.03% LDL 104.1 97.2 -6.63% Diabetes Patients HbA1C 7.9 7.1 -10.1% BP Systolic 136.1 130.4 -4.2% BP Diastolic 81.0 76.3 -5.8% LDL 91.6 84.0 -8.3%
Ralph’s Pharmacy Intervention Claims-Related Outcomes (Hypertensive patients, 12 months post-intervention)
Intervention Group
% Change
Control Group
% Change
Total Costs (Mean ±SD)
$1792 ±3847 -15.2% $1968
±5112 -2.63%
Office Visits $111 ±129 +21.6% $97
±106 +14.8%
ER Visits $54 ±229 -39.2% $83 ±475 -16.0% Inpatient Visits
$584 ±3122 -38.5% $1108
±5025 -3.1%
Pharmacy Claims
$505 ±550 +14.3% $402 ±495 +6.0%
Coaching Program
$495 ±256 N/A N/A N/A
The Agency for Healthcare Research and Quality (AHRQ) Innovations Exchange awards the Pharmacist on the Care Team intervention a “strong” evidence rating: The results of the evaluation(s) show consistent direct evidence of the effectiveness of the innovation.5
Questions a Pharmacist Can Review
Is the medication dose appropriate to the patient’s age or other conditions and medications?
How can medication therapy be changed to improve patient compliance or address side effects?
Are all prescribed medications necessary? What time of day should patients take medications? With what should (or should not) a medication be
taken? Are less expensive, equivalent medications available?
California Right Care Initiative Promising Intervention Project Brief
Pharmacists on the Clinical Care Team Page 2
Works Cited 1) Gandhi TK, Weingart SN, Borus J, et al. “Adverse Drug Events in
Ambulatory Care.” New England Journal of Medicine. 348, no. 16 (2003): 1556-1564.
2) Bunting BA, Smith BH, and Sutherland SE. “The Asheville Project: Clinical and economic outcomes of a community-based long-term medication therapy management program for hypertension and dyslipidemia.” Journal of the American Pharmacists Association. 48, no. 1 (2008): 23-31.
3) Cranor CW, Bunting BA, and Christensen DB. “The Asheville Project: Long-Term Clinical and Economic Outcomes of a Community Pharmacy Diabetes Care Program.” Journal of the American Pharmaceutical Association. 43, no. 2 (2003): 173-184.
4) Wertz D, Hou L, DeVries A, et al. “Clinical and Economic Outcomes of the Cincinnati Pharmacy Coaching Program for Diabetes and Hypertension. Managed Care. (March 2012): 44-55.
5) AHRQ Health Care Innovations Exchange. “Pharmacists Monitor Hypertensive Patients and Make Recommendations to Physicians, Leading to Better Blood Pressure Control and Increased Physician Adherence to Established Guidelines.” 2005.
6) Margolis KL, Asche SE, Bergdall AR, et al. “Effect of home blood pressure telemonitoring and pharmacist management on blood pressure control: a cluster randomized clinical trial.” JAMA. 2013;310(1):46-56.
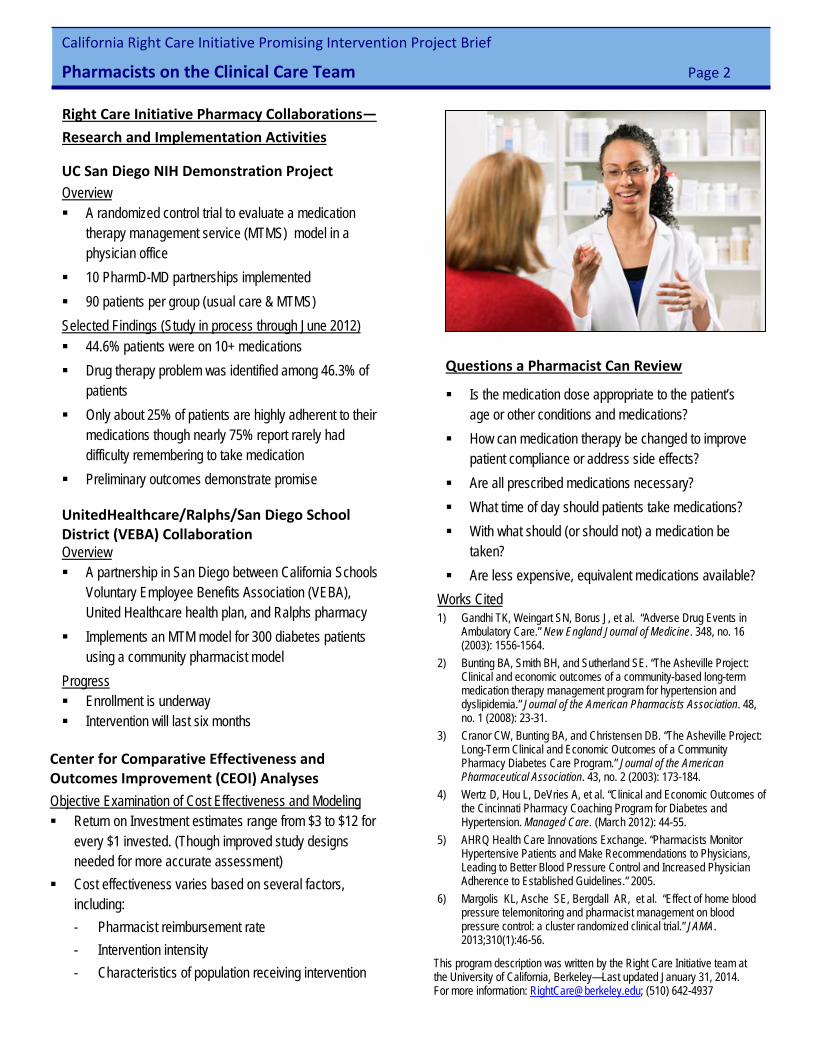
UC San Diego NIH Demonstration Project Overview A randomized control trial to evaluate a medication
therapy management service (MTMS) model in a physician office
10 PharmD-MD partnerships implemented 90 patients per group (usual care & MTMS) Selected Findings (Study in process through June 2012) 44.6% patients were on 10+ medications Drug therapy problem was identified among 46.3% of
patients Only about 25% of patients are highly adherent to their
medications though nearly 75% report rarely had difficulty remembering to take medication
Preliminary outcomes demonstrate promise
UnitedHealthcare/Ralphs/San Diego School District (VEBA) Collaboration Overview A partnership in San Diego between California Schools
Voluntary Employee Benefits Association (VEBA), United Healthcare health plan, and Ralphs pharmacy
Implements an MTM model for 300 diabetes patients using a community pharmacist model
Progress Enrollment is underway Intervention will last six months
This program description was written by the Right Care Initiative team at the University of California, Berkeley—Last updated January 31, 2014. For more information: [email protected]; (510) 642-4937
Center for Comparative Effectiveness and Outcomes Improvement (CEOI) Analyses
Objective Examination of Cost Effectiveness and Modeling Return on Investment estimates range from $3 to $12 for
every $1 invested. (Though improved study designs needed for more accurate assessment)
Cost effectiveness varies based on several factors, including: - Pharmacist reimbursement rate - Intervention intensity - Characteristics of population receiving intervention
Right Care Initiative Pharmacy Collaborations— Research and Implementation Activities