Embed Size (px)
Citation preview
VYSOKÉ UČENÍ TECHNICKÉ V BRNĚ BRNO UNIVERSITY OF TECHNOLOGY FAKULTA PODNIKATELSKÁ ÚSTAV EKONOMIKY FACULTY OF BUSINESS AND MANAGEMENT INSTITUT OF ECONOMICS
ROLE EVROPSKÝCH FONDŮ PŘI INVESTICÍCH V MALÝCH A STŘEDNÍCH PODNICÍCH NA MADEIŘE ROLE OF THE EU FUNDS IN INVESTMENTS IN MADEIRA’S SME DIPLOMOVÁ PRÁCE MASTER’S THESIS AUTOR PRÁCE Bc. Martin Hudek AUTHOR VEDOUCÍ PRÁCE doc. Ing. Marek ZINECKER, Ph.D. SUPERVISOR BRNO 2015
Brno University of Technology Academic year: 2014/2015 Faculty of Business and Management Institute of Economics
MASTER THESIS ASSIGNMENT
Hudek Martin, Bc.
European Business and Finance (6208T150)
Pursuant to Act. No. 111/1998 Coll., on Higher Education Institutions, and in accordance with the Rules for Studies and Examinations of the Brno University of Technology a Dean’s Directive on Realization of Bachelor and Master Degree Programs, the director of the Institute of is submitting you a master's thesis of the following title:
The Role of EU Funds in Investments in Madeira’s SME
In Czech language:
Role evropských fondů při investicích v malých a středních podnicích na Madeiře
Instruction for writing: Introduction Targets and Methodology Theoretical Background��Analysis of the Current Statement Recommendations��Conclusion��References��Appendices Pursuant to Act no. 121/2000 Coll., Section 60 (author act) as amended, this project is a „School Work“. The use of this project is governed by the legal regulations of the author act. Citation licences must be granted by the BUT Faculty of Business and Management.
List of literature: D’ OREY, João, Cristina ALMEIDA, Manuel PITA a Natacha PEREIRA. Estratégia para a Qualidade na Região Autónoma da Madeira (2014-2020). Funchal: DRCIE, 2014. ISBN 978-989-96202-1-6. MATEUS, Augusto. 25 anos de Portugal europeu: a economia, a sociedade e os fundos estruturais. Ffms, 2013, 557 pages. ISBN 978-989-8662-071. MCGIFFEN, Steven Paul. The European Union: a critical guide. New and updated ed. Ann Arbor, Mich.: Pluto Press, 2005, xvii, 222 p. ISBN 9781849643146. TARTA, M. EU regional policy and the structural funds. Annals of the University of Oradea, Economic Science Series. 2008, 17/1, s. 510-515. ISSN 1582 – 5949. The supervisor of master's thesis: doc. Ing. Marek Zinecker, Ph.D. Deadline for submission master's thesis is given by the Schedule of the Academic Year 2014/2015.
L.S.
_______________________________ _______________________________ doc. Ing. Tomáš Meluzín, Ph.D. doc. Ing. et Ing. Stanislav Škapa, Ph.D.
Director of the Institute Dean of Faculty
Brno, 31.3.2015
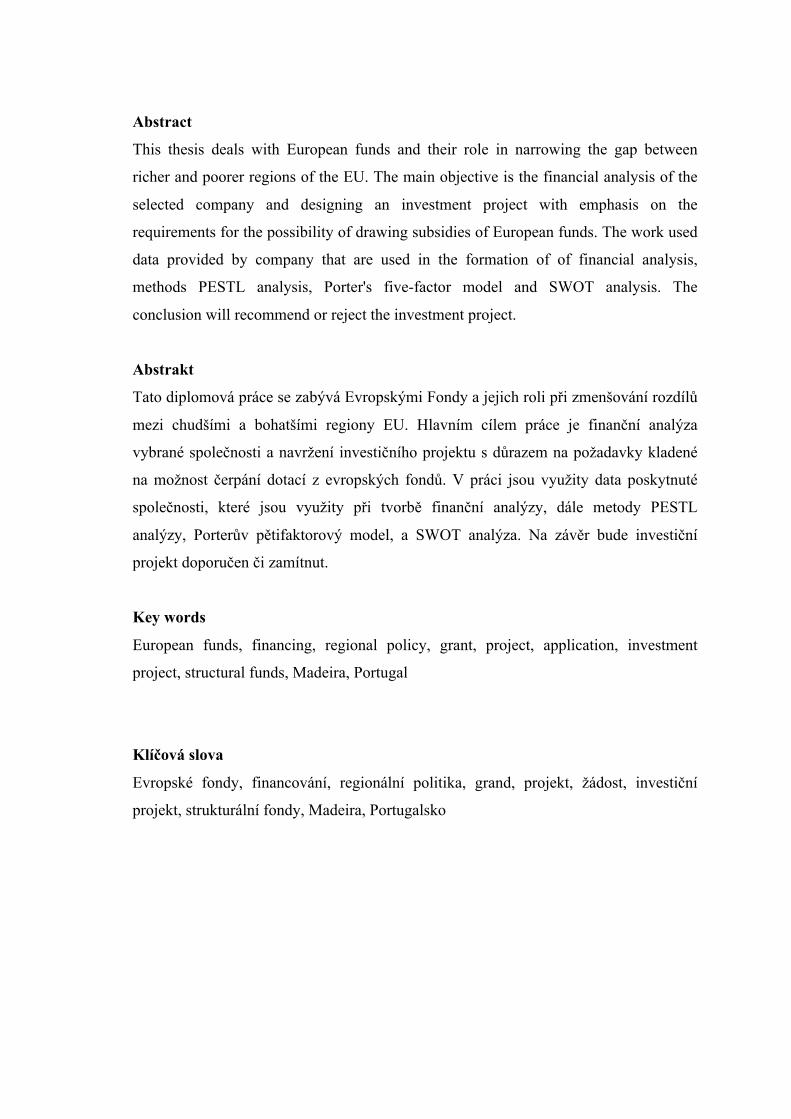
Abstract
This thesis deals with European funds and their role in narrowing the gap between
richer and poorer regions of the EU. The main objective is the financial analysis of the
selected company and designing an investment project with emphasis on the
requirements for the possibility of drawing subsidies of European funds. The work used
data provided by company that are used in the formation of of financial analysis,
methods PESTL analysis, Porter's five-factor model and SWOT analysis. The
conclusion will recommend or reject the investment project.
Abstrakt
Tato diplomová práce se zabývá Evropskými Fondy a jejich roli při zmenšování rozdílů
mezi chudšími a bohatšími regiony EU. Hlavním cílem práce je finanční analýza
vybrané společnosti a navržení investičního projektu s důrazem na požadavky kladené
na možnost čerpání dotací z evropských fondů. V práci jsou využity data poskytnuté
společnosti, které jsou využity při tvorbě finanční analýzy, dále metody PESTL
analýzy, Porterův pětifaktorový model, a SWOT analýza. Na závěr bude investiční
projekt doporučen či zamítnut.
Key words
European funds, financing, regional policy, grant, project, application, investment
project, structural funds, Madeira, Portugal
Klíčová slova
Evropské fondy, financování, regionální politika, grand, projekt, žádost, investiční
projekt, strukturální fondy, Madeira, Portugalsko

BIBLIOGRAPHIC CITATION
HUDEK, M. Role of the EU funds in investments in Madeira’s SME. Brno: Brno
University of Technology, Faculty of Business and Management, 2015. 86 p. Master’s
thesis. Supervisor doc. Ing. Marek Zinecker, Ph.D..
!
!
!
!
!
!
!
!
!
!
!
!
!
!
!
!
!
!
!
!
DECLARATION
I declare that this master's thesis is original and has been written independently. I also
declare that the list of references is complete and that I did not breach of copyright in
the sense of Act No.121/200 Coll. on Copyright Law and Rights Related to Copyright
and on the Amendment of Certain Legislative Acts.
Brno, 31st August 2015
………………………………………
Bc. Martin Hudek

ACKNOWLEDGEMENTS
I would like to thank my supervisor doc. Ing. Marek Zinecker, Ph.D. for his
professional guidance that helped me in writing this thesis. Furthermore, I would also
like to thank Dr. Sérgio Silva and Dr. Nelson Abreu for his constructive comments and
providing needed information. Finally, I would like to express my immense gratitude to
my family and my closest friends for their patience and support throughout my studies.!
CONTENT
!Introduction ..................................................................................................................... 10!Targets and methodology ................................................................................................ 11! 1! Theoretical part ....................................................................................................... 13!
1.1! Motive of the European funds ......................................................................... 13!1.2! The European Cohesion Policy ....................................................................... 13!
1.2.1! The evaluation of EU Cohesion Policy in historical perspective ........... 13!1.2.2! Cohesion Policy of the EU in the period 2014-2020 .............................. 16!1.2.3! The NUTS classification ......................................................................... 17!
1.2.3.1! NUTS in Portugal ............................................................................... 18!1.3! The European Structural and Investment Funds (ESIF) ................................. 19!
1.3.1! European Regional Development Fund (ERDF) .................................... 20!1.3.2! Cohesion Fund (CF) ................................................................................ 20!1.3.3! European Social Fund (ESF) .................................................................. 20!
1.4! Operational Programmes Portugal .................................................................. 22!1.5! Portuguese regional policy – Madeira ............................................................ 23!
1.5.1! Financial information - Madeira ............................................................. 24!1.5.2! National authorities ................................................................................. 25!1.5.3! National authority of Portugal ................................................................ 26!1.5.4! Instituto de Desenvolvimento Empresarial (IDE, IP-RAM) ................... 27!
1.6! Internationalizar 2020 ..................................................................................... 28!1.7! Eligibility criteria for beneficiaries ................................................................. 29!1.8! Definition small medium enterprise ................................................................ 30!
2! Current statement analysis ...................................................................................... 31!2.1! Company introduction .................................................................................... 31!2.2! Choice of the project ....................................................................................... 32!2.3! PESTL Analysis .............................................................................................. 33!
2.3.1! PESTL Analysis Spain ............................................................................ 33!2.3.1.1! Political ............................................................................................... 34!2.3.1.2! Economic ............................................................................................ 36!2.3.1.3! Social ................................................................................................... 37!2.3.1.4! Technological ...................................................................................... 38!2.3.1.5! Legal ................................................................................................... 38!
2.3.2! PESTL Analysis Peru ............................................................................. 39!2.3.2.1! Political ............................................................................................... 40!2.3.2.2! Economic ............................................................................................ 42!2.3.2.3! Social ................................................................................................... 43!2.3.2.4! Technological ...................................................................................... 44!2.3.2.5! Legal ................................................................................................... 44!
2.3.3! PESTL Analysis Columbia ..................................................................... 45!2.3.3.1! Political ............................................................................................... 45!2.3.3.2! Economic ............................................................................................ 47!2.3.3.3! Social ................................................................................................... 48!2.3.3.4! Technological ...................................................................................... 48!2.3.3.5! Legal ................................................................................................... 49!
2.3.4! PESTL analysis summary ....................................................................... 49!2.4! Porter five forces model .................................................................................. 50!
2.4.1! Bargaining Power Of Suppliers .............................................................. 50!2.4.2! Threat of substitutes ................................................................................ 51!2.4.3! Rivalry of existing competitors ............................................................... 51!2.4.4! Threat of new entrants ............................................................................ 52!2.4.5! Bargaining power of buyers .................................................................... 52!
2.5! Financial analysis ............................................................................................ 52!2.5.1! Horizontal analysis .................................................................................. 52!2.5.2! Vertical analysis ...................................................................................... 55!
2.6! Financial indicators ......................................................................................... 57!2.6.1! profitability ratios .................................................................................... 58!2.6.2! Liquidity indicators ................................................................................. 59!2.6.3! Activity indicators ................................................................................... 60!2.6.4! Summary ................................................................................................. 61!
2.7! SWOT ANALYSIS ........................................................................................ 61!3! Proposed solution .................................................................................................... 63!
3.1! Project characteristic ....................................................................................... 63!3.1.1! Presence in Spain .................................................................................... 64!3.1.2! The Business Development Plan ............................................................ 64!
3.1.2.1! Content Management System ............................................................. 65!3.1.2.2! Lead management and opportunities .................................................. 66!
3.2! The strategy and goals of project .................................................................... 66!3.3! Project outputs ................................................................................................ 67!3.4! Project risks ..................................................................................................... 68!3.5! Financial analysis of project ........................................................................... 68!
3.5.1! Classification list of project components and schedule .......................... 68!3.5.2! Project assumptions ................................................................................ 70!3.5.3! Financing sources .................................................................................... 70!3.5.4! Profit and Loss account ........................................................................... 71!3.5.5! Cash flow ................................................................................................ 73!3.5.6! Payback ................................................................................................... 74!3.5.7! IRR .......................................................................................................... 75!3.5.8! NPV ........................................................................................................ 75!
Conclusion ...................................................................................................................... 76!Resources ........................................................................................................................ 78!List of Figures ................................................................................................................. 84!List of Pictures ................................................................................................................ 84!List of Tables .................................................................................................................. 84!Appendices ...................................................................................................................... 85!Appendix A ..................................................................................................................... 85!
Appendix A1 ........................................................................................................... 85!Appendix A2 – Map 1 ............................................................................................. 86!
10
Introduction
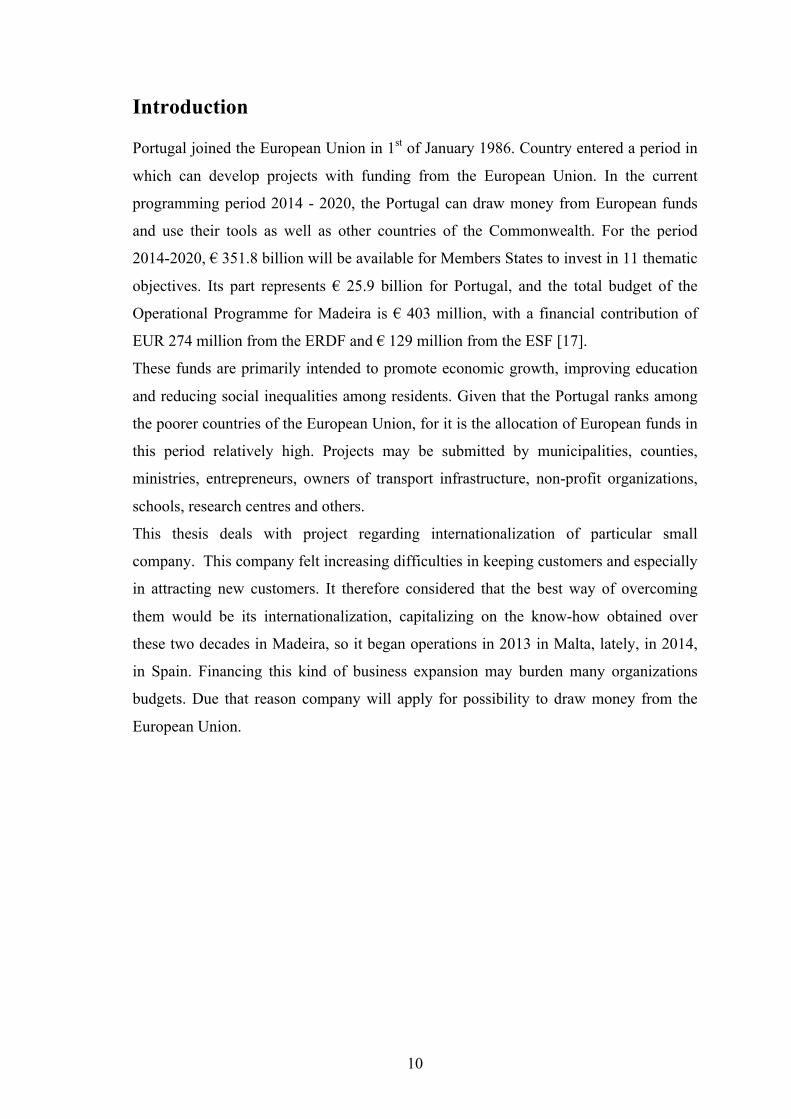
Portugal joined the European Union in 1st of January 1986. Country entered a period in
which can develop projects with funding from the European Union. In the current
programming period 2014 - 2020, the Portugal can draw money from European funds
and use their tools as well as other countries of the Commonwealth. For the period
2014-2020, € 351.8 billion will be available for Members States to invest in 11 thematic
objectives. Its part represents € 25.9 billion for Portugal, and the total budget of the
Operational Programme for Madeira is € 403 million, with a financial contribution of
EUR 274 million from the ERDF and € 129 million from the ESF [17].
These funds are primarily intended to promote economic growth, improving education
and reducing social inequalities among residents. Given that the Portugal ranks among
the poorer countries of the European Union, for it is the allocation of European funds in
this period relatively high. Projects may be submitted by municipalities, counties,
ministries, entrepreneurs, owners of transport infrastructure, non-profit organizations,
schools, research centres and others.
This thesis deals with project regarding internationalization of particular small
company. This company felt increasing difficulties in keeping customers and especially
in attracting new customers. It therefore considered that the best way of overcoming
them would be its internationalization, capitalizing on the know-how obtained over
these two decades in Madeira, so it began operations in 2013 in Malta, lately, in 2014,
in Spain. Financing this kind of business expansion may burden many organizations
budgets. Due that reason company will apply for possibility to draw money from the
European Union.
11
Targets and methodology
Aim of this thesis is to assess the current financial situation of chosen enterprise with
emphasis on the requirements for the possibility of drawing subsidies from European
funds and investment project design. The paper deals with problem of the particular
Madeira’s company, difficulties to keeping customers and to attract new ones. Due that
company considered to set up new investment project with the intention be financed
with the help of European Union.
To fulfil the requirements of the aim of the thesis is needed to build up qualified
theoretical background. In that theoretical part of the thesis, is discussed history of
Cohesion Policy of the European Union and its evolution ensued the current Cohesion
Policy in the new period 2014-2020, followed by the regional and structural policy of
the European Union together with the subchapter describing the financing of projects
from EU funds. Particular attention is paid to the funds in Portugal and concretely
Madeira region, where the company is headquartered.
In analytical part the company is briefly described. After that is discussed the project
idea and followed by description of the environment of the potential countries expand
to, the investment project idea is focused to extend markets, where the company ABC
Ltd. operates. An indispensable part of the thesis is financial analysis of the company,
to create a comprehensive picture of the company.
The final part of thesis consists the proposed project solution, where the project
description is, followed particular parts of project ended with evaluation of
effectiveness.
The methods used in the thesis are following:
•! PESTL Analysis
•! Porter five forces
•! Financial Analysis
a.! Vertical financial analysis
b.! Horizontal financial analysis
c.! Analysis by using the common finance ratios
• SWOT analysis
• Evaluation of the effectiveness of the project
-! Net Present Value (NPV)

12
-! Internal rate of return (IRR)
-! Payback period of investment
The name of subject organization has been changed to “ABC, Ltd.” for concealment
reasons.
! !
13
1 !Theoretical part
1.1 ! Motive of the European funds
As McGiffen pointed out [34], the original idea of the EU was to create economically
strength community, but only with the admission of Ireland was first member state
classified not as industrialized, developed and relatively well off accepted. Since this
the former EC was growth to 15 member states, included relatively poorly Spain,
Portugal and Greece.
By regional analysis over the year 1986-96 was founded the income of the poorest 25
regions was rising by very little (from the 53% of the average EU to 55%).
With the Greece, Spain and Portugal joined the EU in 1981 resp. 1986, the European
area (EU9 to EU12) increased by 48%, population increased by 22% whereas its GDP
per capita decreased by 6% [9].
The income diversity has obviously widened and its social effects becoming ever more
visible. Due possibility of just such developments in the European Union the regional
policy was set up by Single European Act.
Although was felt necessary to complete the single market and establish the mechanism
allowing to transfer of relatively large amounts of money between different regions
despite the fact of possible increasing regional disparities,
McGriffen claims [34], this approach is controversial, due increasing the degree to
which taxpayers in the rich member states were asked to subsidise people in poorer
areas. Removal of barriers to movement goods, services and capital could lead to
greater concentrations of wealth in areas already well-favoured
for such things as transport and financial infrastructure. Single market also requires
certain countries, in most cases the poor ones, to invest in expensive improvements to
meet such demands.
1.2 ! The European Cohesion Policy
1.2.1 ! The evaluation of EU Cohesion Policy in historical perspective
14
In 1957, when Treaty of Rome was founded, for the six founding members (Belgium,
France, Italy, Luxembourg, the Netherlands and West Germany) with the similar level
of development, economic and social cohesion was not the cohesion policy a major
concern. Nevertheless, the Treaty already set out “the Community shall aim at reducing
the disparities between the levels of development of the various regions “. However,
successive enlargements of the European Community brought a steady widening of
economic and social disparities. The growing importance of regional policy was
obvious. Also EC (EU) wants to actively act and prevent the widening of disparities
between Member States and regions and to allow benefit every territory from Europe’s
economic integration [37].
On the other hand, Manzella and Mendez [36] claim, at 50’s the European Commission
(later EU) regional issues more or less ignored. Despite the recognition of existence
some of them at the Messina convention in 1955, attention to regional policy in the
Treaty of Rome of 1957 was minimal. In the preamble is declared “decreasing the
differences between the various regions and the backwardness of the less favoured
regions”. There was declared also in the Article 2, the goals of the European
Community, “harmonious development of economic activities” and “a continuous and
balanced expansion”. However, in the main body of Treaty, the regional issues were
addressed indirectly, only the European Investment Bank was created to directly
promote regional development and also granting loans “which facilitate the financing of
projects for developing less developed regions”.
The inadequacy regarding regional policy became evident soon. The first step was in
1961 to organize a “Conference on Regional Economies”. According that conference,
attended by national administrators and experts in the field, was setting up of working
groups comparing different experiences and methods, the commissioning of territorial
studies, and the promotion of exchanges of experience among national governments.
The output of this effort was officially recognized in 1964 in the Community’s First
Medium-Term Economic Policy Programme. The document argued for the creation of a
comprehensive regional policy as coordination of national initiatives on the basis of
regional development programmes. According this document, the Community also
sought to increase direct contact with local and regional administrations through a series
of meetings and the diffusion of information.
15
At the beginning of 70’s was the regional policy firmly on the EC agenda. In Paris,
1972, the policy initiation stage was launched with the approval of a resolution at the
Conference of Heads of State. At that time, Member States declared “give top priority
to correcting the structural and regional imbalances in the Community which could
hinder the achievement of the Economic and Monetary Union.” Commission was
invited to prepare a report analysing regional problems and to put forward a proposal
for the creation of a Regional Development Fund. The legislative proposals were
subsequently submitted by the Commission finally in July of 1973 [17].
In 1975 the European Regional Development Fund (ERDF) was set up. Initially was
testing period 3 years. Due limitation of co-financing predetermined projects in the
member states, with little European influence, member states had to apply for support at
project level on an annual basis [44].
Agreed budget for the period 1975-78 for the Fund was 1.3 billion European Units,
which represents 5% of the Community budget [36].
MARZINOTTO argued [37], that agreed regional policy in 1970’s and set up European
Regional Development Fund (ERDF) in 1975, shifted the focus of attention from
countries to regions and aimed at providing compensations or side-payments to
“potential losers”.
However, the trend over the first half of 1980’s was following, from a Member State
controlled model, where the Commission’s role was effectively restricted, the policy
moved to became more grounded on Community objectives, priorities and
experimentation, at least for part of the Cohesion policy budget. More importantly, the
regulatory reforms, along with the agreement on the IMPs (Integrated Mediterranean
Programmes), were to provide lessons, if not a blueprint, for some of the principles
which were to underpin the landmark reforms of 1988 [44].
The Cohesion Policy of the EU as we know it came into existence in 1988 shortly after
the enlargement of the EC to Spain, Portugal and Greece. It was meant to complement
the project for the completion of the Single European Market (1987-92) [37].
The European Council allocated ECU 64 billion to Structural Funds over five years and
the Council adopted the first regulation integrating the Structural Funds [36].
In February 1988 that new Cohesion policy were agreed under the Delors-I package, in
which the heads of government gave their approval to the key strategic decisions for
16
implementing the Single European Act. That provided a major cash injection by
doubling their budget over 1989-1993 period.
In 1992, the Maastricht Treaty was founded. The Treaty was marked as a new age of
European integration by providing for the establishment of Economic and Monetary
Union (EMU). To co-finance infrastructure projects in the poorer Member States
(Greece, Ireland, Spain and Portugal) was founded the new fund, Cohesion Fund. This
fund supports the poorer Member States to fulfil the EMU convergence criteria.
By increased attached to cohesion in the Treaty was reflected in significant financial
boost. Due to Delors-II package at European Council in December 1992, doubled the
resources allocated to Cohesion policy over the 1994-1999.
Further reform took place in 1999 to cover next programming period 2000-2006. These
agreement was reached during the Berlin European Council, allocating € 213 billion to
Cohesion policy, € 39.6 billion of which was accounted for by post accession assistance
[44].
As MacGiffen [34] pointed out a major aspect of reform of planning document named
Agenda 2000 was the reduction in the number of objectives from seven to three (will be
describe further). There was also a reduction in the number of Community Initiatives
from thirteen to four (INTERREG, EQUAL, LEADER AND URBAN) and a
corresponding cut in their budgetary allocation (to 5.35 percent of total resources).
In the April 2006 was set up the budget for the next programming period 2007-2013,
which was set at €347 billion, representing 35.7 percent of the EU budget. This
regulatory package was approved in July 2006, embodying the most radical reform of
the policy since 1988. The main aim was centered on the Lisbon strategy and involving
a new planning framework.
New updated EU Cohesion policy replaced previous Objectives 1, 2 and 3 by new three
Objectives, named: Convergence, Regional Competitiveness and Employment and
Territorial Cooperation. The majority which continued focused on less-developed
regions with a GDP per head of less than 75 percent of the EU average [44].
1.2.2 ! Cohesion Policy of the EU in the period 2014-2020
After two years of negotiation the new legislation governing the European Structural
and Investment Funds in 2014-20 was agreed in December 2013.
17
Financial allocations by geographical eligibility for the new programme were confirmed
in February and April 2014. Followed by financial allocations to Member States in
Table 1.
Countries are divided into following groups (see Appendix A2):
!! Less-developed countries will cover 25 percent of the EU population, down
from 31.7 percent in 2007-13. Germany will cease to have any LDR regions,
Spain will see LDR coverage significantly reduced (Extremadura only), while
Malta loses Convergence status. The capital cities in Poland, Romania and
Slovenia will also lose less-developed region status, while Croatia will have
LDR status in its entirety following a reconfiguration of the NUTS 2 regions.
!! Transition regions coverage will increase from 7.3 percent to 13.5 percent of
the EU population, but the eligible regions are heavily concentrated in certain
countries, notably Germany, Spain, France and the United Kingdom.
!! More-developed countries cover the remaining regions as was the case under
the former RCE category. Importantly, it includes four regions which had
Convergence status in 2007-13 – namely Galicia (ES), the Warsaw region
Mazowieckie (PL), Bucharesti-Ilfov (RO) and the Ljubljana region, Zahodna
Slovenija (SI).
!! Cohesion fund eligibility will mainly impact on Cyprus which loses eligibility
and Croatia which qualifies for the Cohesion Fund following accession [41].
For the period 2014-2020, € 351.8 billion will be available for MS to invest in 11
thematic objectives, all stemming from the Europe 2020 strategy e.g.: research, ICT,
sustainable transport, SMEs, renewable energy and energy efficiency, environment,
employment and education [19].
1.2.3 ! The NUTS classification
According to Eurostat [18], at the beginning of the 1970s, Eurostat set up the NUTS
(Nomenclature of Territorial Units for Statistics) classification as a single, coherent
system for dividing up the EU's territory in order to produce regional statistics for the
Community. For around thirty years, implementation and updating of the NUTS
classification was managed under a series of "gentlemen's agreements" between the
18
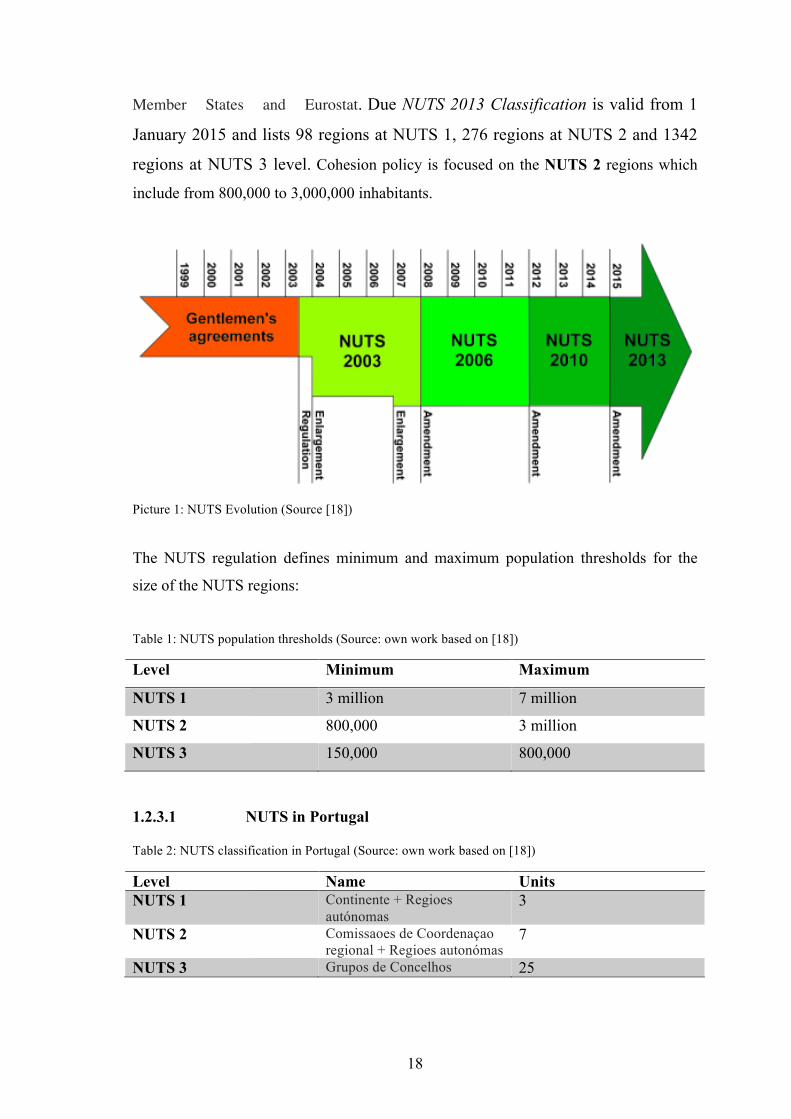
Member States and Eurostat. Due NUTS 2013 Classification is valid from 1
January 2015 and lists 98 regions at NUTS 1, 276 regions at NUTS 2 and 1342
regions at NUTS 3 level. Cohesion policy is focused on the NUTS 2 regions which
include from 800,000 to 3,000,000 inhabitants.
Picture 1: NUTS Evolution (Source [18])
The NUTS regulation defines minimum and maximum population thresholds for the
size of the NUTS regions:
Table 1: NUTS population thresholds (Source: own work based on [18])
Level Minimum Maximum
NUTS 1 3 million 7 million
NUTS 2 800,000 3 million
NUTS 3 150,000 800,000
1.2.3.1! NUTS in Portugal
Table 2: NUTS classification in Portugal (Source: own work based on [18])
Level Name Units NUTS 1 Continente + Regioes
autónomas 3
NUTS 2 Comissaoes de Coordenaçao regional + Regioes autonómas
7
NUTS 3 Grupos de Concelhos 25
19
According to Decreto-lei no. 46/891 has defined three levels of the Nomenclature of
Territorial Units for Statistics (NUTS) for Portuguese territorial units. These levels
describe the statistical sub-regions which divides the Portuguese territory, in accordance
with Regulation (EC) No 1059/2003 of the European Parliament and of the Council of
26 May 20032. Classification of territorial units corresponding to NUTS 2 had its last
amendment to Decree-Law 244/20023, while the NUTS 3 was being changed from
Decree-Law No. 46/89 to the last change performed by Law No. 21/20104.
1.3 ! The European Structural and Investment Funds (ESIF)
According to the “Guidance for beneficiaries” [17], the ESIF are jointly managed by
European Commission and the Members States. That means the EU will not take any
action unless it is more effective than decision taken in the national, regional or local
level. There exist various types of criteria, should be fulfil. For instance:
•! limited time period which operations and expenditures can take place
•! scope of activities that can be co-financed
•! cost categories: certain cost categories are excluded
•! only certain geographical locations are eligible
•! durability of operations: investments may have to be maintained for a
minimum period after the operation is completed
•! certain Types of beneficiaries are eligible for support
The European Commission and Member States have agreed; priorities are set out by
national or regional programmes. In practise, Member States may choose to emphasise
different activities in different regions.
Member States and the European Commission decided what can be funded by the ESIF.
Priorities are set out within national or regional multi-annual programmes. In practice,
1 Diário da República Portuguesa (15 Fevereiro 1989). Decreto-Lei n.º 46/89. (pp. 590 - 594) 2 Jornal Oficial da União Europeia - Parlamento Europeu (26 Maio 2003). Regulamento (CE) n.º 1059/2003 3 Diário da República Portuguesa (5 Novembro 2002). Decreto-Lei n.º 244/2002. (pp. 7101 - 7103) 4 Diário da República Portuguesa (23 Agosto 2010). Lei n.º 21/2010. (pp. 3661 - 3662)!
20
Member States may choose to emphasise different activities in different regions of the
EU; eligibility therefore depends on the scope of the programme in each region or
country.
1.3.1 ! European Regional Development Fund (ERDF)
ERDF aims to strengthen regional economic and social cohesion by investing in
growth-enhancing sectors to improve competitiveness and create jobs. The ERDF also
finances cross-border cooperation projects.
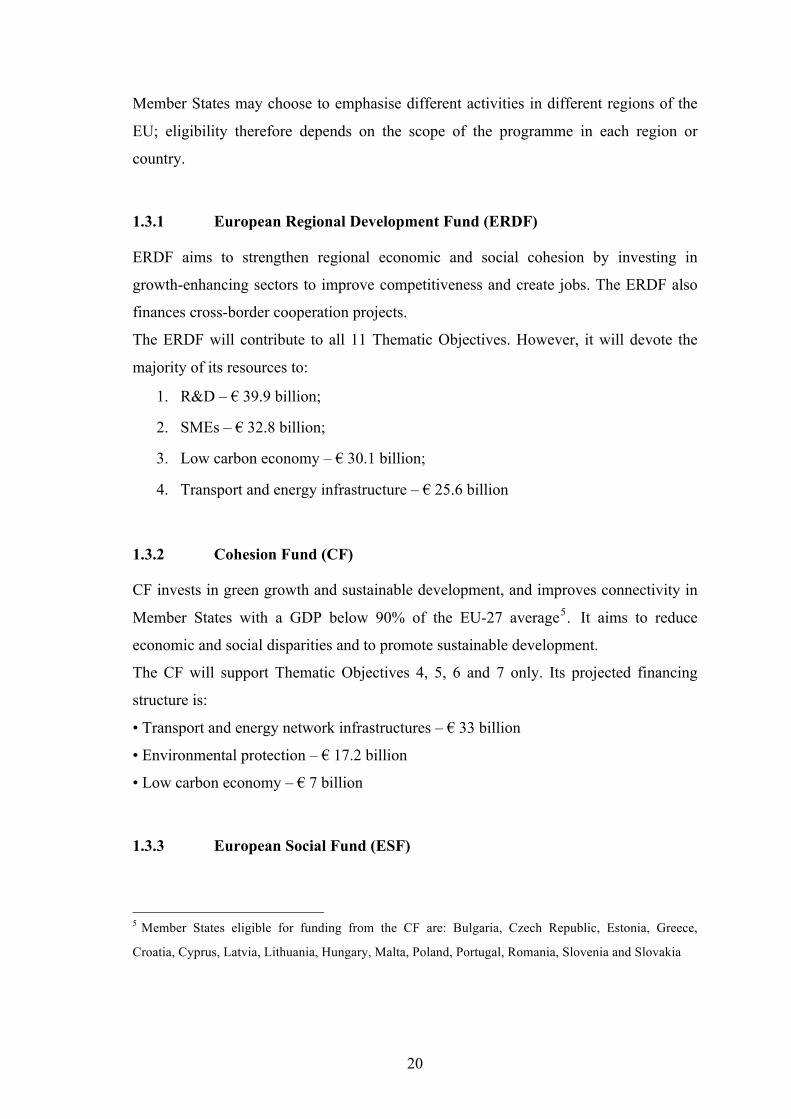
The ERDF will contribute to all 11 Thematic Objectives. However, it will devote the
majority of its resources to:
1.! R&D ‒ € 39.9 billion; �
2.! SMEs ‒ € 32.8 billion; �
3.! Low carbon economy ‒ € 30.1 billion; �
4.! Transport and energy infrastructure ‒ € 25.6 billion �
1.3.2 ! Cohesion Fund (CF)
CF invests in green growth and sustainable development, and improves connectivity in
Member States with a GDP below 90% of the EU-27 average5. It aims to reduce
economic and social disparities and to promote sustainable development.
The CF will support Thematic Objectives 4, 5, 6 and 7 only. Its projected financing
structure is:
• Transport and energy network infrastructures ‒ € 33 billion
• Environmental protection ‒ € 17.2 billion
• Low carbon economy ‒ € 7 billion
1.3.3 ! European Social Fund (ESF)
5 Member States eligible for funding from the CF are: Bulgaria, Czech Republic, Estonia, Greece,
Croatia, Cyprus, Latvia, Lithuania, Hungary, Malta, Poland, Portugal, Romania, Slovenia and Slovakia �
!
21
ESF invests in people, with a focus on improving employment and education
opportunities. It also aims to help disadvantaged people at risk of poverty or social
exclusion. The ESF will focus on a limited number of priorities in order to make a real
impact in addressing Member States’ key challenges, which are:
• Employment ‒ EUR 30 billion;
• Education ‒ EUR 26 billion;
• Social inclusion ‒ EUR 21.3 billion;
• Institutional capacity ‒ EUR 3.6 billion.
Together with the EUR 3.2 billion special allocation for the Youth Employment
Initiative, this means that more than EUR 86 billion 9 will be invested in Europe’s
people over the next seven years [17].
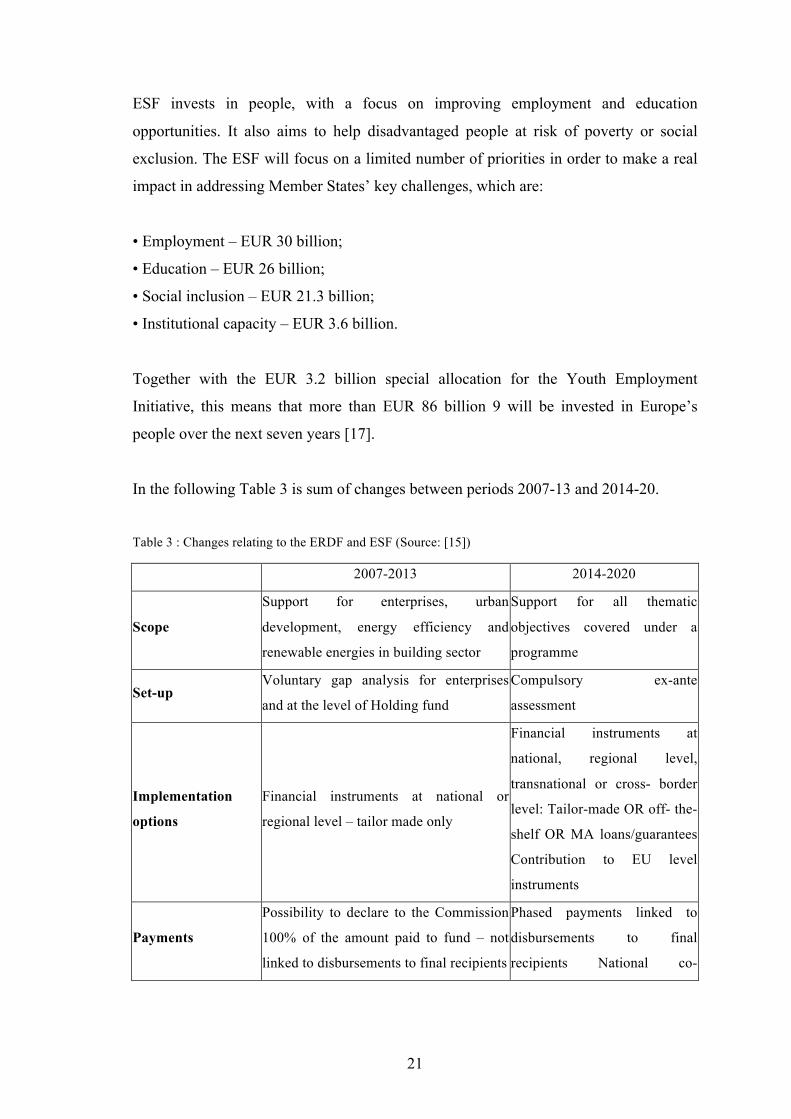
In the following Table 3 is sum of changes between periods 2007-13 and 2014-20.
Table 3 : Changes relating to the ERDF and ESF (Source: [15])
2007-2013 2014-2020
Scope Support for enterprises, urban
development, energy efficiency and
renewable energies in building sector
Support for all thematic
objectives covered under a
programme
Set-up Voluntary gap analysis for enterprises
and at the level of Holding fund Compulsory ex-ante
assessment
Implementation
options Financial instruments at national or
regional level – tailor made only
Financial instruments at
national, regional level,
transnational or cross- border
level: Tailor-made OR off- the-
shelf OR MA loans/guarantees
Contribution to EU level
instruments
Payments Possibility to declare to the Commission
100% of the amount paid to fund – not
linked to disbursements to final recipients
Phased payments linked to
disbursements to final
recipients National co-
22
financing which is expected to
be paid can be included in the
request for the interim payment
Management costs
and fees, interest,
resources returned,
legacy
Legal basis set out in successive
amendments of the regulations and
recommendations/interpretations set out
in three COCOF notes
Full provisions set out from
outset in basic, delegated and
implementing acts
Reporting Compulsory reporting only from 2011
onwards, on a limited range of indicators
Compulsory reporting from the
outset, on a range of indicators
linked to the financial
regulation.
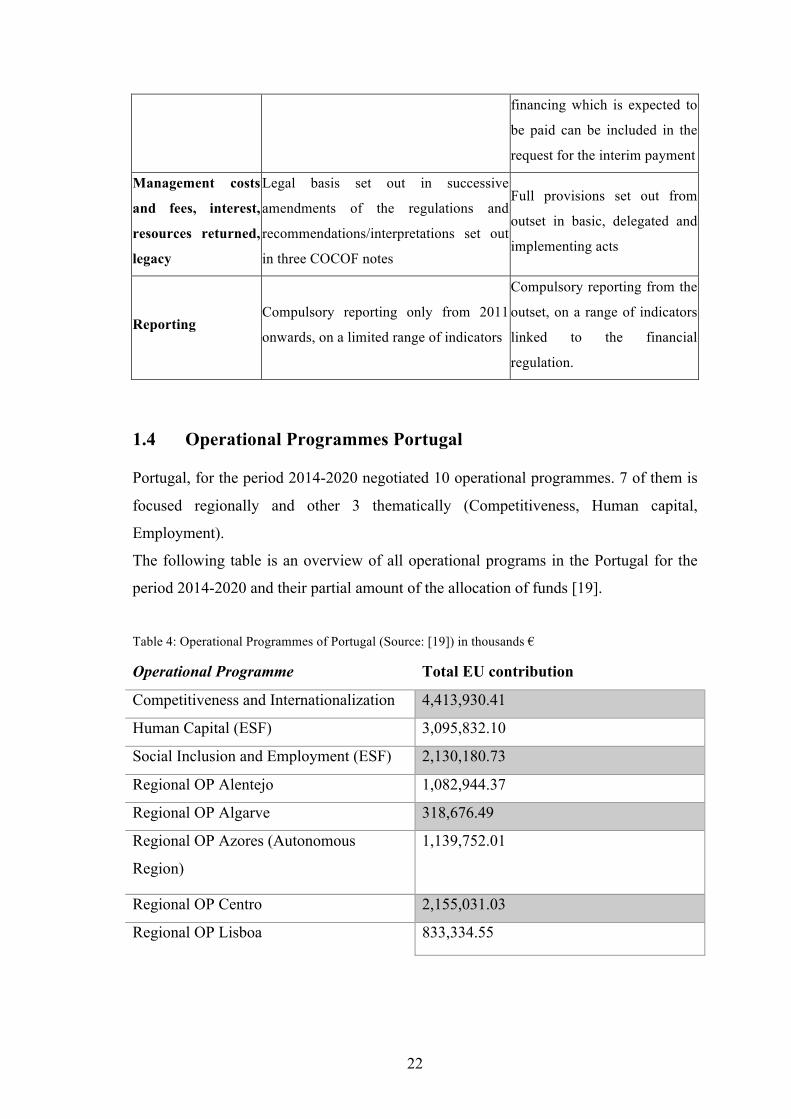
1.4 ! Operational Programmes Portugal
Portugal, for the period 2014-2020 negotiated 10 operational programmes. 7 of them is
focused regionally and other 3 thematically (Competitiveness, Human capital,
Employment).
The following table is an overview of all operational programs in the Portugal for the
period 2014-2020 and their partial amount of the allocation of funds [19].
Table 4: Operational Programmes of Portugal (Source: [19]) in thousands €
Operational Programme Total EU contribution
Competitiveness and Internationalization 4,413,930.41
Human Capital (ESF) 3,095,832.10
Social Inclusion and Employment (ESF) 2,130,180.73
Regional OP Alentejo 1,082,944.37
Regional OP Algarve 318,676.49
Regional OP Azores (Autonomous
Region)
1,139,752.01
Regional OP Centro 2,155,031.03
Regional OP Lisboa 833,334.55
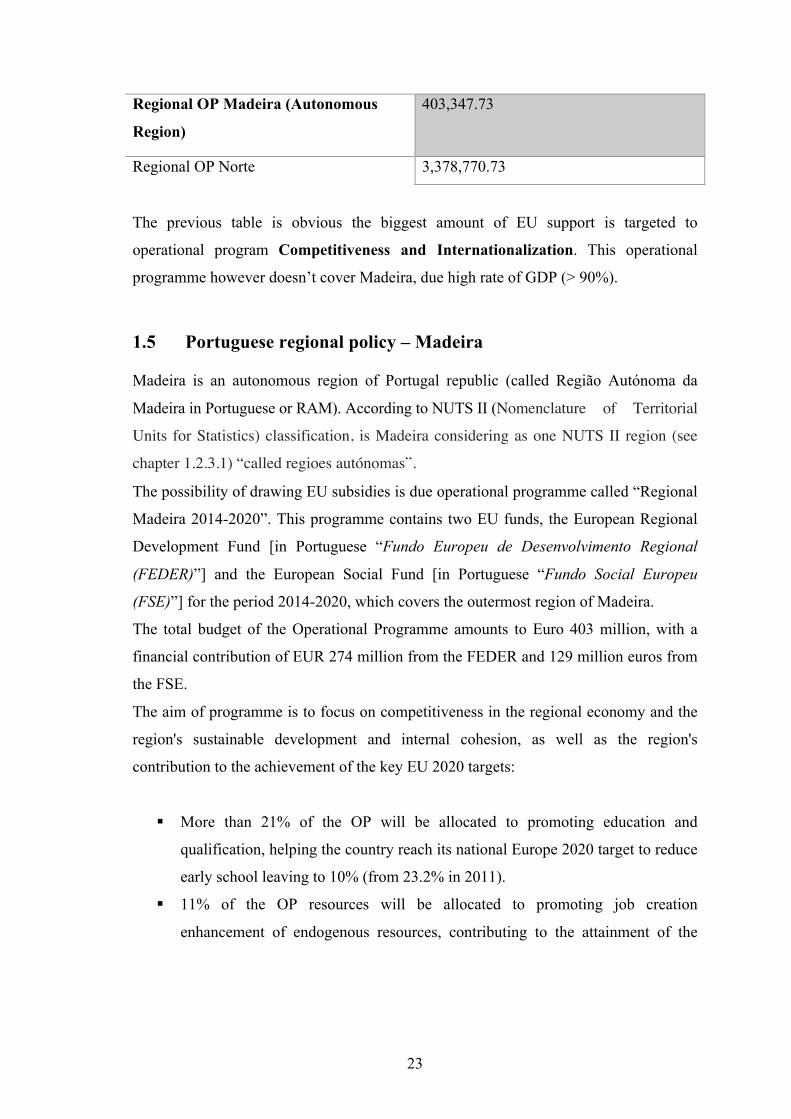
23
Regional OP Madeira (Autonomous
Region)
403,347.73
Regional OP Norte 3,378,770.73
The previous table is obvious the biggest amount of EU support is targeted to
operational program Competitiveness and Internationalization. This operational
programme however doesn’t cover Madeira, due high rate of GDP (> 90%).
1.5 ! Portuguese regional policy – Madeira
Madeira is an autonomous region of Portugal republic (called Região Autónoma da
Madeira in Portuguese or RAM). According to NUTS II (Nomenclature of Territorial
Units for Statistics) classification, is Madeira considering as one NUTS II region (see
chapter 1.2.3.1) “called regioes autónomas”.
The possibility of drawing EU subsidies is due operational programme called “Regional
Madeira 2014-2020”. This programme contains two EU funds, the European Regional
Development Fund [in Portuguese “Fundo Europeu de Desenvolvimento Regional
(FEDER)”] and the European Social Fund [in Portuguese “Fundo Social Europeu
(FSE)”] for the period 2014-2020, which covers the outermost region of Madeira.
The total budget of the Operational Programme amounts to Euro 403 million, with a
financial contribution of EUR 274 million from the FEDER and 129 million euros from
the FSE.
The aim of programme is to focus on competitiveness in the regional economy and the
region's sustainable development and internal cohesion, as well as the region's
contribution to the achievement of the key EU 2020 targets:
!! More than 21% of the OP will be allocated to promoting education and
qualification, helping the country reach its national Europe 2020 target to reduce
early school leaving to 10% (from 23.2% in 2011).
!! 11% of the OP resources will be allocated to promoting job creation
enhancement of endogenous resources, contributing to the attainment of the
24
national Europe 2020 target of 75% of 20-64 year-olds to be employed (69.1 %
in 2011).
!! About 10% of the OP resources will be allocated to supporting competitiveness
and innovation in enterprises.
!! For boost research and technical development (RTD) will be allocated 8% and
for innovation as well, helping the country reach its national Europe 2020 target
by increasing its GDP spend on RTD from 2.7% to 3.3 % (it was 1.5% in 2011).
In particular, the OP contribution is expected to foster RTD and innovation
knowledge transfer to enterprises.
!! For support the shift towards a low-carbon economy OP will allocate almost 5%
of all allocations. This support will be cover energy efficiency investments and
sustainable urban mobility in order to ensure the sustainable development of the
energy sector; these funds will contribute to Portugal's national Europe 2020
target of 31% of energy deriving from renewable sources (27.3 % in 2011).
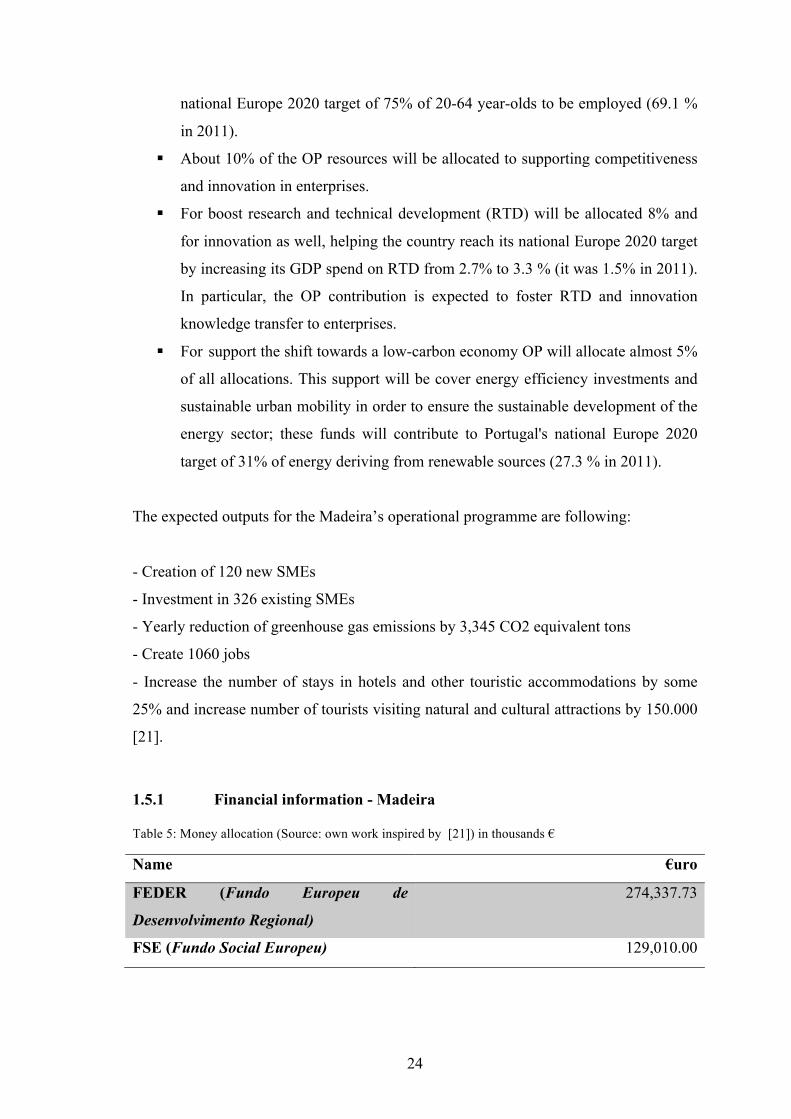
The expected outputs for the Madeira’s operational programme are following:
- Creation of 120 new SMEs
- Investment in 326 existing SMEs
- Yearly reduction of greenhouse gas emissions by 3,345 CO2 equivalent tons
- Create 1060 jobs
- Increase the number of stays in hotels and other touristic accommodations by some
25% and increase number of tourists visiting natural and cultural attractions by 150.000
[21].
1.5.1 ! Financial information - Madeira
Table 5: Money allocation (Source: own work inspired by [21]) in thousands €
Name €uro
FEDER (Fundo Europeu de
Desenvolvimento Regional)
274,337.73
FSE (Fundo Social Europeu) 129,010.00
25
Total OP budget 474,526.75
Total EU contribution 403,347.73
1.5.2 ! National authorities
National authorities are responsible for managing the actual programmes. The Member
States, their regions and accredited agencies manage the programmes, implement them
by selecting individual projects, control and assess them. The Commission is involved
in programme monitoring, commits and pays out approved expenditure and verifies the
control systems. Together with monitoring committees6, they are in charge of:
• drawing up and applying selection procedures and eligibility criteria;
• providing information to potential beneficiaries such as, the minimum or maximum
size of the project, the financing plan and time-frame;
• ensuring that projects fall within the scope of the Funds concerned;
• the financial management and control of the programmes.
If applied for funding, the subjects have to submit the applications to the national or
regional authority managing the relevant programme. Before applying for a grant,
potential beneficiaries should check the investment priorities, eligibility criteria and
application procedure of the programmes in their region and country Contact details for
all the relevant managing/national authorities [17].
6 Monitoring committees are usually made�of competent regional and local authorities including
competent public authorities, economic and social partners, relevant bodies representing civil society,
including environmental partners, NGOs, bodies responsible for promoting social inclusion, gender
equality and non-discrimination, in accordance with each Member State's institutional and legal
framework.
!
26
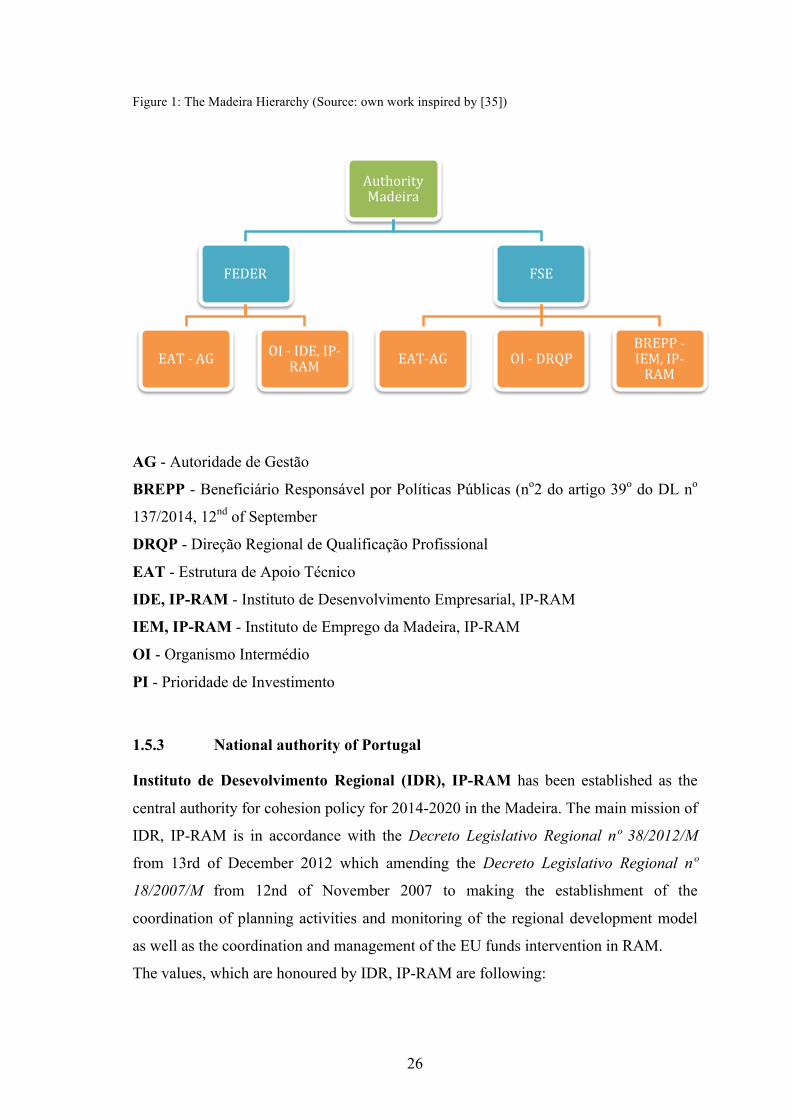
Figure 1: The Madeira Hierarchy (Source: own work inspired by [35])
!
AG - Autoridade de Gestão
BREPP - Beneficiário Responsável por Políticas Públicas (no2 do artigo 39o do DL no
137/2014, 12nd of September
DRQP - Direção Regional de Qualificação Profissional
EAT - Estrutura de Apoio Técnico
IDE, IP-RAM - Instituto de Desenvolvimento Empresarial, IP-RAM
IEM, IP-RAM - Instituto de Emprego da Madeira, IP-RAM
OI - Organismo Intermédio
PI - Prioridade de Investimento
1.5.3 ! National authority of Portugal
Instituto de Desevolvimento Regional (IDR), IP-RAM has been established as the
central authority for cohesion policy for 2014-2020 in the Madeira. The main mission of
IDR, IP-RAM is in accordance with the Decreto Legislativo Regional nº 38/2012/M
from 13rd of December 2012 which amending the Decreto Legislativo Regional nº
18/2007/M from 12nd of November 2007 to making the establishment of the
coordination of planning activities and monitoring of the regional development model
as well as the coordination and management of the EU funds intervention in RAM.
The values, which are honoured by IDR, IP-RAM are following:
Authority!Madeira
FEDER
EAT!3 AG OI!3 IDE,!IP3RAM
FSE
EAT3AG OI!3 DRQPBREPP!3IEM, IP3RAM
27
!! accuracy
!! transparency
!! objectivity
!! impartiality
The aim is to display the way IDR, IP-RAM want to been seen and how they see them
self in the future. Their vision is to be an institution in the context of regional
government, which is recognized for the quality of service it provides to its customers.
IDR, IP-RAM is the support body for the Regional Secretariat of Planning and Finance
and has the task of coordinating the planning activities and monitoring of the regional
development model as well as coordination and management of the intervention of
Community funds in RAM.
The most important attributions of IDR, IP-RAM:
-! Carry out regional interlocutor functions of the European Regional Development
Fund (ERDF), the European Social Fund (ESF) and the Cohesion Fund, before
the national authorities and the European Commission, within their competence
and within the framework of representation mechanisms together of these
bodies.
-! To ensure the representation of the region in the framework of the organs of
National Strategic Reference Framework (NSRF), where they are given such
powers.
-! Ensure the functions of technical, administrative and financial support to actions
co-financed by ERDF and the Cohesion Fund and the ESF [31].
1.5.4 ! Instituto de Desenvolvimento Empresarial (IDE, IP-RAM)
Assuming as a coordinating body of all support to secondary and tertiary sectors of our
economy, by any other agencies for specialist consultation.
The IDE bet on an integrated management tools to support the business sector,
particularly as regards investment, the financing and operation.
Enhancing effective sustained growth shape of our economy, we focus on, among
others, the following areas: Entrepreneurship, Business Innovation, Technological
Development, Knowledge Society, Information and Communication Technologies,
28
Quality, Environment and Energy, Internationalisation, Funding investment Structuring,
Creation of a financial innovation environment and compensate for additional costs
(OR's).
The motto is "Compete, diversify, internationalize".
The mission is to promote the development, competitiveness and modernization of
companies in the secondary and tertiary sectors of the Autonomous Region of Madeira,
especially for micro, small and medium enterprises, aimed at strengthening innovation,
entrepreneurship and in business investment [30].
1.6 ! Internationalizar 2020
The internationalize 2020 is the programme provided by Instituto de Desenovimento
Empresarial (IDE, IP-RAM) aims to strengthen the entrepreneurship and strengthen the
presence of regional companies on international markets by taking advantage of the
economic opportunities and challenges offered by the demanding global market. It also
intends to provide an increase in competitiveness and external awareness of products
and businesses of Madeira.
Companies of any kind and in any legal form, with bracketed activities of the secondary
and tertiary sector to promote projects aimed at producing goods and tradable services
and internationalize or contributing to the value chain of the same and do not relate to
service general economic interest.
Types of projects
In the form of individual projects, are likely to finance the internationalization
promotion projects aimed at:
• Knowledge of foreign markets;
• A web presence through the digital economy, including in particular the launch of
virtual catalogues of goods and services;
• The development and promotion of international brands;
• The exploration and presence in international markets;
• The international marketing;
• The introduction of new organizational method in business practices or external
relations;
29
• Specific certifications for foreign markets.
In the form of simplified design (internationalization Valley) - the application takes the
form of individual project limited to SMEs which are initiated its internationalization
process and aims to support small business initiatives in the acquisition of consulting
services to duly accredited entities, with the objective of strengthening corporate
training companies, through knowledge of markets and interface with relevant
economic agents in foreign markets.
Form, amount and limits of incentive
The support granted to individual projects under that system takes the form of non-
refundable incentive, with a limit of € 250,000.
In projects promoted by large companies, the incentives to be granted can not exceed
the limit laid down in the de minimum aid scheme.
Internationalization Valley for the support takes the form of non-refundable incentive
and is limited to € 15,000 per project.
Financing rates
The incentive to be given to individual projects is calculated by applying to the eligible
costs of a base rate of 30%, which may be supplemented by the following increases:
• 10% for projects presented by SMEs;
• 10% for projects that contribute to increasing international awareness of the RAM
while tourist region.
For Internationalization Valley, the rate is 75% [30].
1.7 ! Eligibility criteria for beneficiaries
Beneficiaries must cumulatively fulfill the following eligibility criteria (shortened) [5]:
a)! Be located in the autonomous region of Madeira;
b)! To be legally constituted;
c)! To comply with the necessary conditions for the exercise of activity, if
applicable;
30
d)! Have solved the tax and contribution debts to the tax office and social security
payers and incentives, including the situation regularized with regard to
reimbursements in projects supported with co-financing of FEEI (EU funds);
e)! Organized financial accounts in accordance with the applicable accounting
standards;
f)! Possess or ensure the technical, physical and financial means and human
resources needed to develop the project;
g)! Not be a firm in difficulty;
h)! Have a balanced economic and financial situation
i)! Completion of the projects previously approved under this instrument for the
same project type;
j)! Do not detain or have owned capital in a percentage higher than 50%;
k)! Declaring that has no wage arrears.
Before starting the project, it is advisable to carry out financial and economic analysis
to demonstrate that the benefits of the project outweigh its costs.
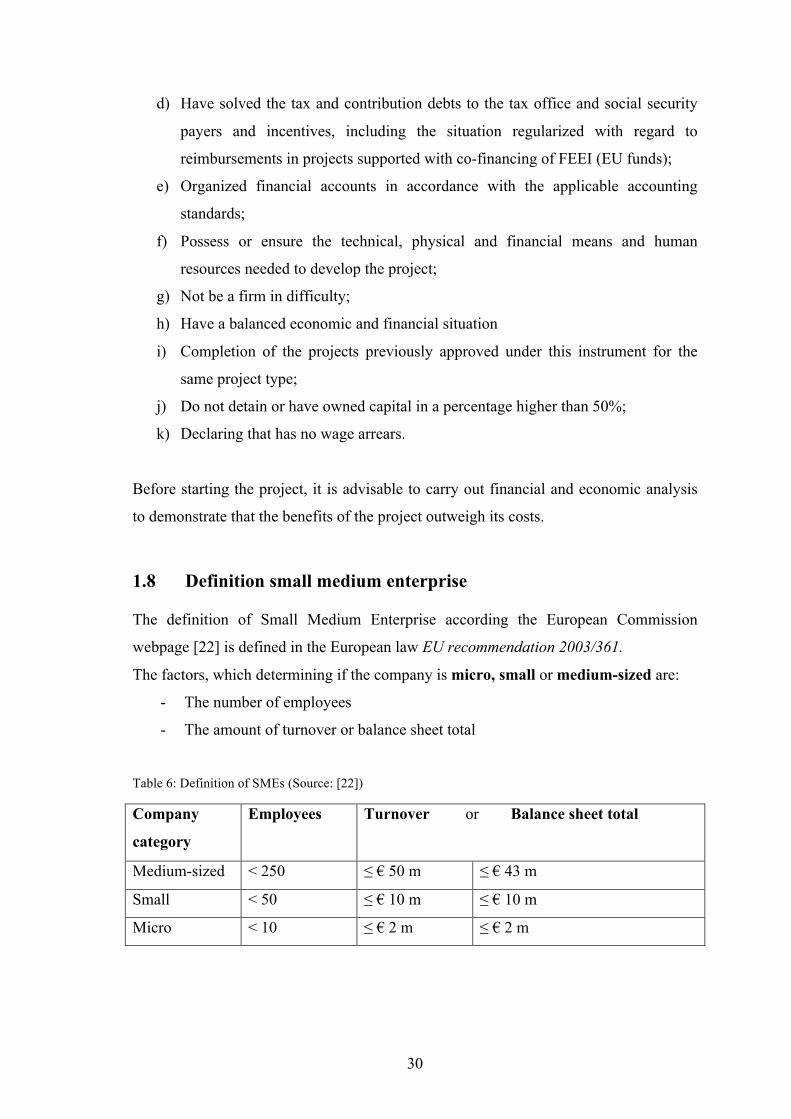
1.8 ! Definition small medium enterprise
The definition of Small Medium Enterprise according the European Commission
webpage [22] is defined in the European law EU recommendation 2003/361.
The factors, which determining if the company is micro, small or medium-sized are:
-! The number of employees
-! The amount of turnover or balance sheet total
Table 6: Definition of SMEs (Source: [22])
Company
category
Employees Turnover or Balance sheet total
Medium-sized < 250 ≤ € 50 m ≤ € 43 m
Small < 50 ≤ € 10 m ≤ € 10 m
Micro < 10 ≤ € 2 m ≤ € 2 m
31
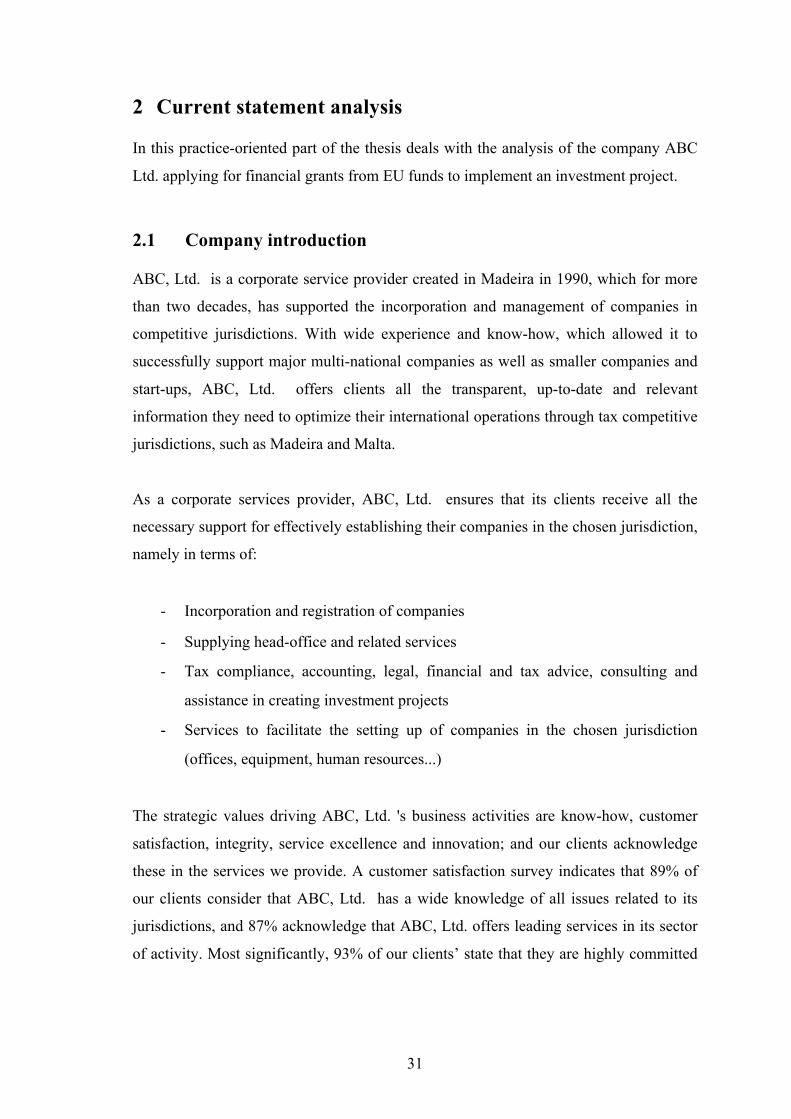
2 !Current statement analysis
In this practice-oriented part of the thesis deals with the analysis of the company ABC
Ltd. applying for financial grants from EU funds to implement an investment project.
2.1 ! Company introduction
ABC, Ltd. is a corporate service provider created in Madeira in 1990, which for more
than two decades, has supported the incorporation and management of companies in
competitive jurisdictions. With wide experience and know-how, which allowed it to
successfully support major multi-national companies as well as smaller companies and
start-ups, ABC, Ltd. offers clients all the transparent, up-to-date and relevant
information they need to optimize their international operations through tax competitive
jurisdictions, such as Madeira and Malta.
As a corporate services provider, ABC, Ltd. ensures that its clients receive all the
necessary support for effectively establishing their companies in the chosen jurisdiction,
namely in terms of:
-! Incorporation and registration of companies �
-! Supplying head-office and related services �
-! Tax compliance, accounting, legal, financial and tax advice, consulting and
assistance in creating investment projects �
-! Services to facilitate the setting up of companies in the chosen jurisdiction
(offices, equipment, human resources...) �
The strategic values driving ABC, Ltd. 's business activities are know-how, customer
satisfaction, integrity, service excellence and innovation; and our clients acknowledge
these in the services we provide. A customer satisfaction survey indicates that 89% of
our clients consider that ABC, Ltd. has a wide knowledge of all issues related to its
jurisdictions, and 87% acknowledge that ABC, Ltd. offers leading services in its sector
of activity. Most significantly, 93% of our clients’ state that they are highly committed
32
to recommending our company to their peers and partners. The majority of our clients
highlighted pro-activity, honesty, efficiency and professionalism.
ABC, Ltd. provides assistance and essential services to facilitate the incorporation of
any type of business, big or small, in Madeira and Malta. As such, our services
comprise not only the incorporation and management of companies, assistance with
legal and tax compliance obligations, but also, a wide array of professional services that
are necessary for the incorporation of any successful business structure in the selected
jurisdiction. Additionally, ABC, Ltd. also provide support in all areas of the integration
process of investors and their families in Portugal and Malta.
The company has three shareholders:
1.! Frederico Gouveia e Silva (capital share 45%)
2.! Paulo Gouveia e Silva (capital share 45%)
3.! Jorge Veiga França (capital share 10%)
Number of total employees is 16.
2.2 ! Choice of the project
According to communication with company and considering all circumstances, the
project is based of the internationalization of ABC, Ltd. company. Company will attract
new clients in good developed countries with potential growth. These countries have
usually high tax rates and are suitable for management of tax efficiency, which can
mean a considerable increase in net profit for any investor with an international
business, regardless of its size.
Based on that, company has valuable contacts in two Latin American countries,
Colombia and Peru. Due that, the work is targeted on the three countries. Spain, where
the company recently started operate, Colombia and Peru.
The project is seen by author and company as good opportunities to maintain further
growth.
!
33
2.3 ! PESTL Analysis
Based of the result of the previous chapter, the PESTL analysis of the Spain, Peru and
Colombia is drawn up. PESTL Analysis will be divided on the three parts. First part
will contain PESTL analysis about the Spain, second one will be about Peru and the last
one about the Colombia. I will consider pros and cons each analysis and will suggest
recommendation. PESTL Analysis is useful tool for understanding the wide picture of
the environment in which company operate or is willing to operate in the other
environments.
2.3.1 ! PESTL Analysis Spain
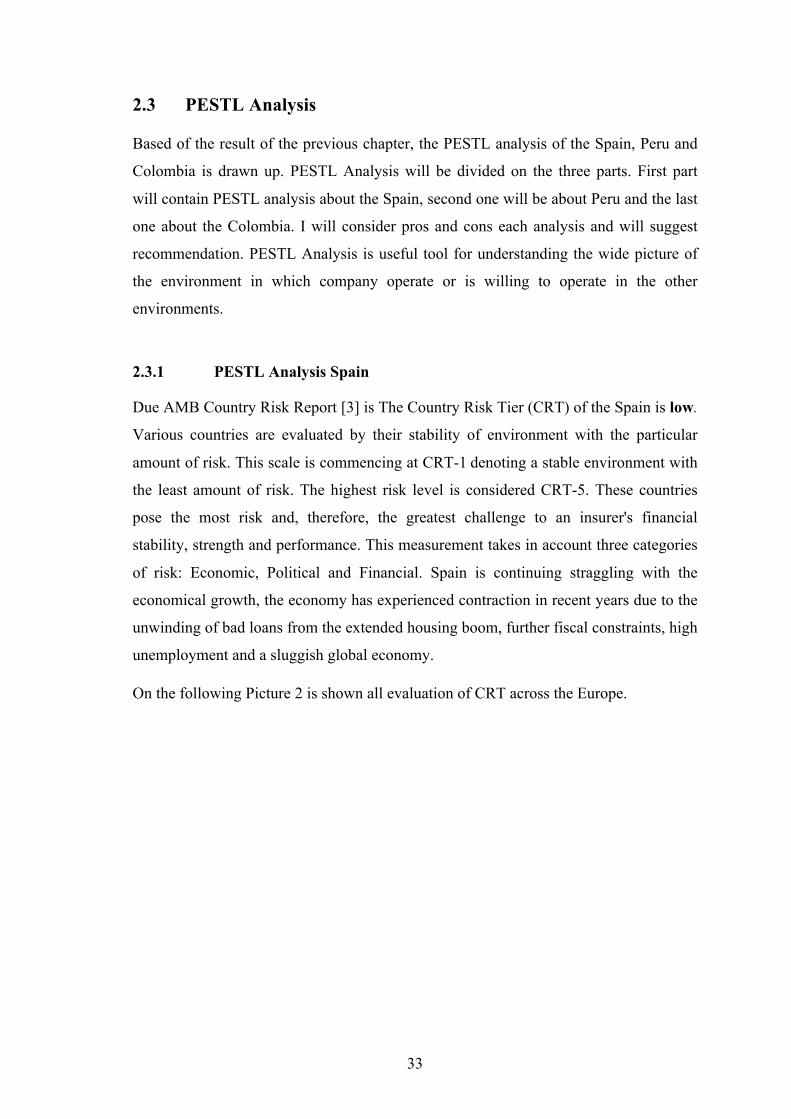
Due AMB Country Risk Report [3] is The Country Risk Tier (CRT) of the Spain is low.
Various countries are evaluated by their stability of environment with the particular
amount of risk. This scale is commencing at CRT-1!denoting a stable environment with
the least amount of risk. The highest risk level is considered CRT-5. These countries
pose the most risk and, therefore, the greatest challenge to an insurer's financial
stability, strength and performance. This measurement takes in account three categories
of risk: Economic, Political and Financial. Spain is continuing straggling with the
economical growth, the economy has experienced contraction in recent years due to the
unwinding of bad loans from the extended housing boom, further fiscal constraints, high
unemployment and a sluggish global economy.
On the following Picture 2 is shown all evaluation of CRT across the Europe.
34
Picture 2: Country Risk Tier - Europe (Source: [3])
2.3.1.1! Political
Although Spain is considered as stable and advanced country, the labour flexibility is
limited due continuing unemployment rate 22.5%. After the Greece are Spaniards the
second most unemployment in the EU [20]. Spanish government reversed spending and
put in place fiscal austerity measures to counter the large fiscal deficit. Anti-austerity
strikes have continued in response to national and regional cost cutting plans. This
35
disruption could increase as education and health care become affected by the cuts. As
well corruption allegations have become a major challenge for the ruling party in the
past year [3]. Corruption and nepotism remain problematic. Political risk of Spain is
low.
Spain is also placed in the 33rd place, in the newest report of Doingbusiness.org [13]. The placement presents the Ease of Doing Business rank (out of 189 economies). Spain
made in past year few improvements of business environment. Running own business is
easier, by introducing an electronic system linking several public agencies thereby
simplifying business registration. The corporate income tax rate was reduced, also by
reducing was reformed property transfer tax rate. The process of resolving insolvency
was made easier by introducing new rules for out-of-court restructuring, introducing
provisions applicable to pre-packaged reorganizations and making insolvency
proceedings more public.
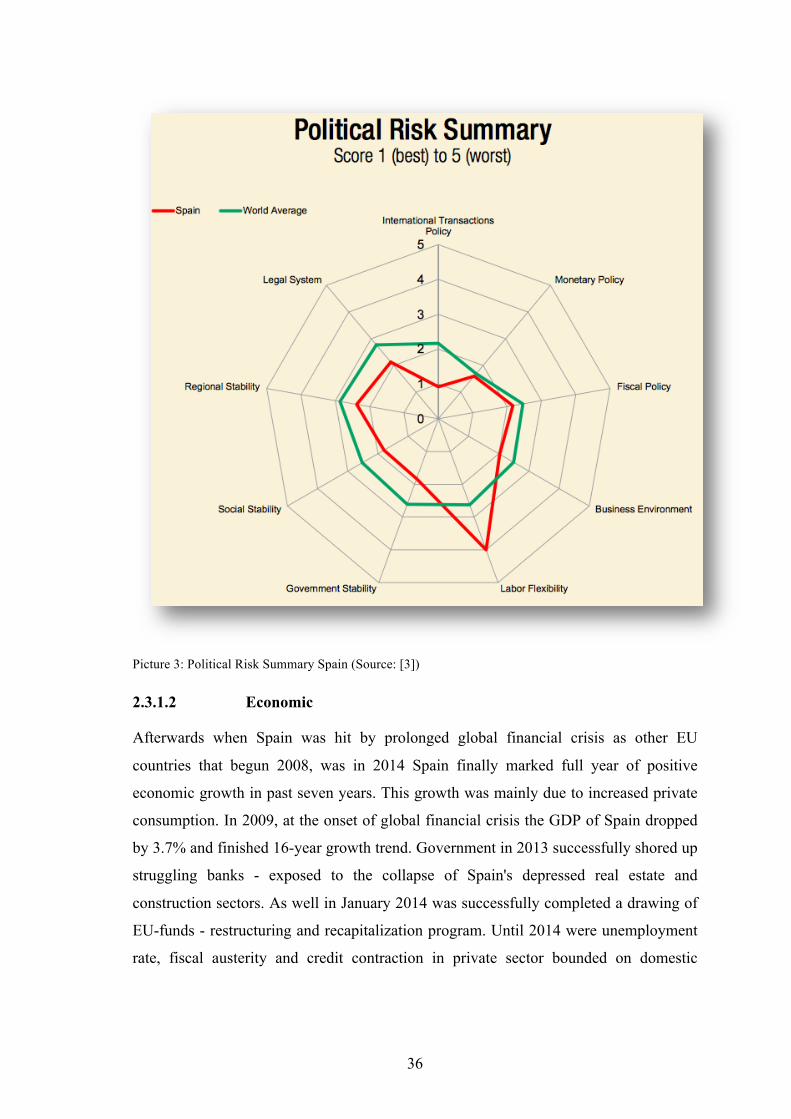
In the following picture are shown various aspects of the summary of the political risk
in Spain. Obviously the biggest problem of these years for Spain is labour flexibility. In
that aspect is the biggest risk. Other fields stay better than the world’s average.
36
Picture 3: Political Risk Summary Spain (Source: [3])
2.3.1.2! Economic
Afterwards when Spain was hit by prolonged global financial crisis as other EU
countries that begun 2008, was in 2014 Spain finally marked full year of positive
economic growth in past seven years. This growth was mainly due to increased private
consumption. In 2009, at the onset of global financial crisis the GDP of Spain dropped
by 3.7% and finished 16-year growth trend. Government in 2013 successfully shored up
struggling banks - exposed to the collapse of Spain's depressed real estate and
construction sectors. As well in January 2014 was successfully completed a drawing of
EU-funds - restructuring and recapitalization program. Until 2014 were unemployment
rate, fiscal austerity and credit contraction in private sector bounded on domestic
37
consumption and investment. Between years 2008-2013 the unemployment rate rose
from a low about 8% more than three times to more than 26% in 2013. High
unemployment strained Spain's public finances, as spending on social benefits increased
while tax revenues fell. Spain’s budget deficit in 2010 was peaked at 11.4% of GDP,
however next years was dropping just under 7% in years 2013-2014. That level was
slightly higher than the level 6.5% negotiated between the Spain and EU. On the other
hand, the public debt has dramatically increased from 60.1% of GDB in 2010 to more
than 97% in 2014. Regarding the exports, were resilient, compared with the rest of
economy, the exports helped to bring to the Spain’s current account into the surplus in
2013 first time since 1986. In the 2014 situation stayed remained. Labor productivity is
rising, also internal devaluation resulting from moderating labor cost and lower inflation
helped to improve foreign investments and positive affected FDI7 flows. Due upcoming
of the national parliamentary elections in November 2015 were the government's efforts
to implement labor, pension, health, tax, and education reforms have become
overshadowed. Inflation has dropped sharply from the 2013’s 1.5% to the nearly flat in
2014. The Spain’s budget for 2015 was published September 2014, rolls back some
recently imposed taxes and keep the same level of VAT regime. The amount of generate
income from the VAT is significantly lower than EU average [8].
Following AMB Country Risk Report [3], the economic risk of Spain is low. The
GDP’s growth severely declined during the global economic crisis, however sovereign
funding has been restored through low interest rates and increased investor confidence.
While the ECB is committed to providing a backstop to member states, Spain remains
susceptible to further disruption in the Eurozone - potentially driving up bond yields
and borrowing costs and causing financial market disruption.
2.3.1.3! Social
The population of the Spain is 46.44 million inhabitants. The trend was last measured at
-0.24 in 2013, while the trend is decreasing last years. The population is composite of
Mediterranean and Nordic types. Spanish language (Castellano) speak 74%, Catalan 7 FDI - Foreign Direct Investment is known as “Investment from one country into another (normally by
companies rather than governments) that involves establishing operations or acquiring tangible assets,
including stakes in other businesses.” [33]
38
17%, Galician 7% and Basque 2%. According to the royal decree-law the government
initiate major reforms to help the highly rigid labor market to make labor force more
competitiveness and flexible. The median age of the population is 41.6 years [8]. As
2014, the GINI coefficient (a measure of income inequity) by Eurostat [16] of
household disponible income stood 34.7% , one of the highest in OECD nations. The
Gini coefficient score of zero corresponds to complete equality while a score of one
corresponds to complete inequality.
2.3.1.4! Technological
The level of Research and Development dropped due to Thelocal.es [43] on the levels
2006. Under Socialist Prime Minister José Luis Rodríguez Zapatero the level of R&D
investments was growing until 1.4% of GDP and was targeting to catch up the
European Union average. Although austerity policies under Zapatero and then the
current Popular Party administration of Mariano Rajoy have seen that investment
subside on the 1.24% of the GDP, mentioned above, is the lowest level since 2006. The
OECD said Spain that needs to urgently improve quality of human resources on all
levels and also needs to help small innovative companies to grow.
According to Macro Economy Meter [40] Spain’s Internet users equals to 71.6 per 100
people with a global rank 44 compared to Portugal’s Internet users equals to 62.1 per
100 people with a global rank of 63. In Spain the trend of growing was lately followed
Portugal’s one, although since 2002 significantly boosted in compare with Portugal.
Due to Spain doesn’t innovate, the amount of the registered patents is low. The number
of patents is 789, compared with the France or Germany, 6691 and 16550 patents
respectively [48].
2.3.1.5! Legal
The legal system in Spain is considered as stable and respected although is expected
update the system by current political party.
Due to Index of Economic Freedom [27], an annual guide published by The Wall Street
Journal and The Heritage Foundation, which is the Index, which covers 10 freedoms,
39
from property rights to entrepreneurship – in 186 countries, Spain has ranked on the
49’s place with it’s 67.6 points.
Spain was growing about 0.4 point since last year. Is the first growth after 5 years. It
reflecting improvement 6 of 10 economic freedoms. Its driven by driven by investment
freedom, monetary freedom, and the management of government spending, that
outweigh declines in freedom from corruption and fiscal freedom. The Europe region’s
evaluation of Spain is ranked 21st of 43 countries, means overall score is above the
world average. In past 5 years, due to declines in the management of government
spending and financial freedom, the economic freedom was dropping about 2.6 point
and it has pushed the economy into the “moderately free” category. Nevertheless, the
rule of law is respected, and export growth is encouraged by an open trade and
investment framework.
According to Corruption Perceptions Index 2014 made by Transparency International
[14], Spain ranked with 60 points from 100 in 37th place (right After Taiwan and Israel)
of total 174 countries studied. The average country score is 43/100, “indicating a
serious corruption problem”. Compared with Portugal, which is placed with 63 points
from 100 ranked in 31rd place.
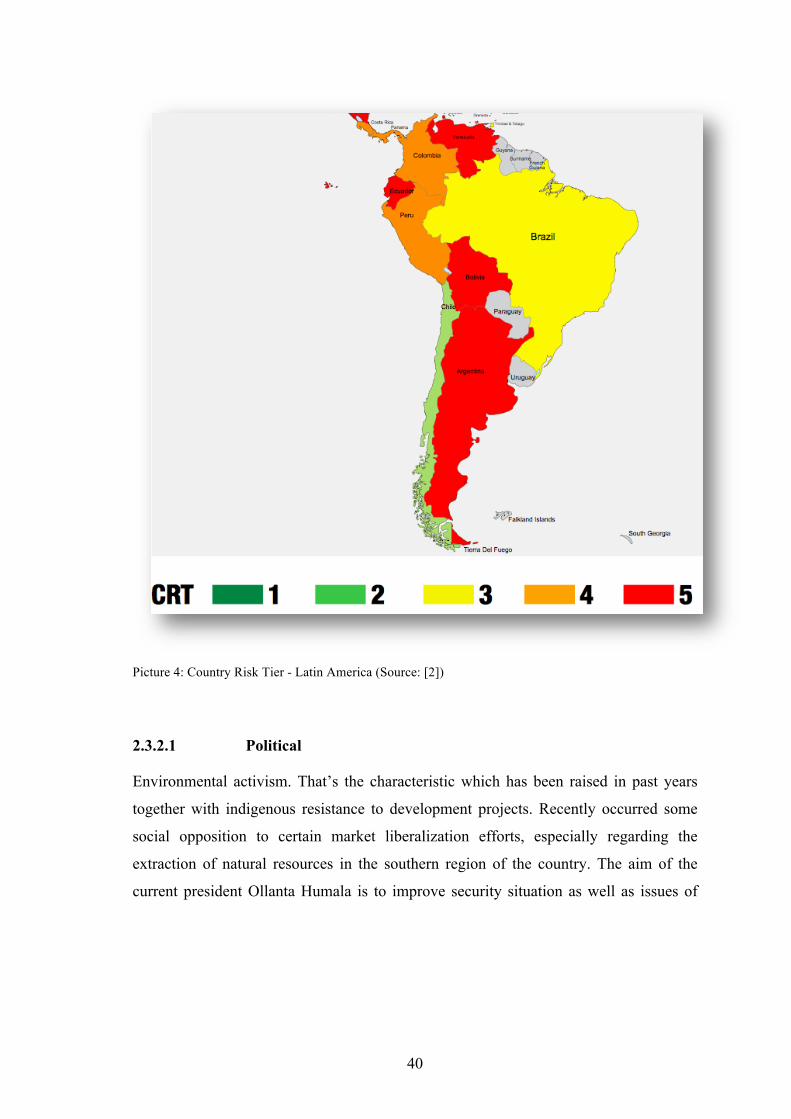
2.3.2 ! PESTL Analysis Peru
Due to AMB Country List Report [2] is Peru evaluated with Country Risk Tier CRT-4
(moderate). As mentioned above, the CRT scale has 5 levels, whereas CRT-1 is the
best evaluation, and CRT-5 is the worst one. The Peru’s economy after its slowdown in
2009 has recovered and expanding between 6-9% yearly. The growth 5-6% is
forecasted if the country will continue in investments and increasing global demand for
the country’s exports. The CRT evaluation of the whole South America region is
followed on the Picture 4.
40
Picture 4: Country Risk Tier - Latin America (Source: [2])
2.3.2.1! Political
Environmental activism. That’s the characteristic which has been raised in past years
together with indigenous resistance to development projects. Recently occurred some
social opposition to certain market liberalization efforts, especially regarding the
extraction of natural resources in the southern region of the country. The aim of the
current president Ollanta Humala is to improve security situation as well as issues of
41
educations, health and inequity in the VRAE8 region as well to crack down on drug
violence and corruption. Although weak infrastructure and lengthy business procedures
continue to present challenges [2]. Political risk of Peru is moderate.
Peru is also placed in the 35rd place, in the newest report of Doingbusiness.org [12]. It’s
just 2 positions worse result than Spain. Compared to last year, Peru offended one
place. Peru didn’t make any reform compared with Spain, therefore its position is
stable. The placement presents the Ease of Doing Business rank (out of 189
economies).
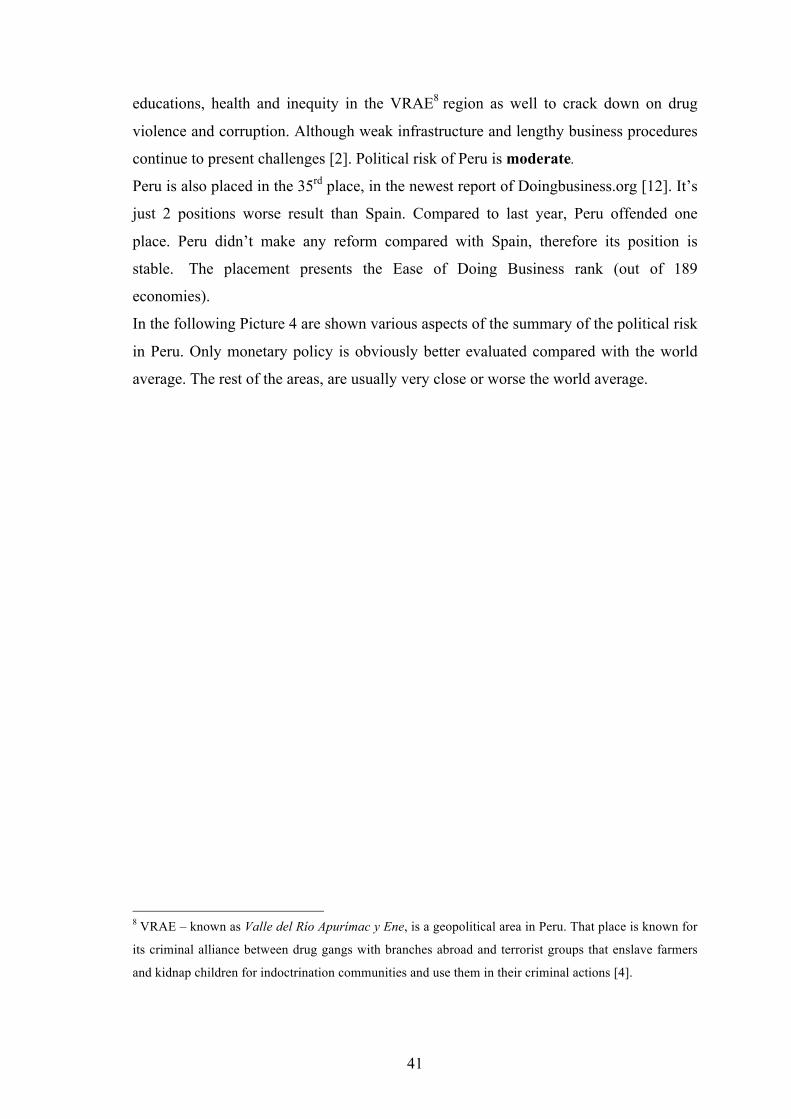
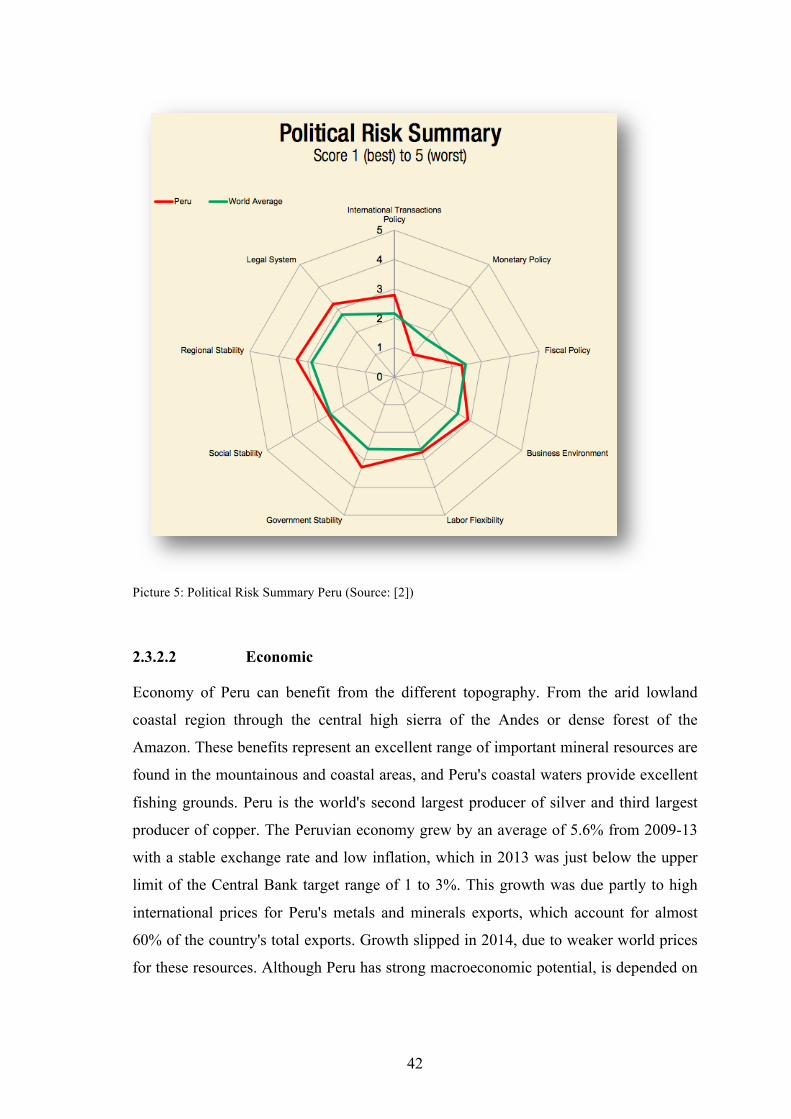
In the following Picture 4 are shown various aspects of the summary of the political risk
in Peru. Only monetary policy is obviously better evaluated compared with the world
average. The rest of the areas, are usually very close or worse the world average.
8 VRAE – known as Valle del Río Apurímac y Ene, is a geopolitical area in Peru. That place is known for
its criminal alliance between drug gangs with branches abroad and terrorist groups that enslave farmers
and kidnap children for indoctrination communities and use them in their criminal actions [4].
42
Picture 5: Political Risk Summary Peru (Source: [2])
2.3.2.2! Economic
Economy of Peru can benefit from the different topography. From the arid lowland
coastal region through the central high sierra of the Andes or dense forest of the
Amazon. These benefits represent an excellent range of important mineral resources are
found in the mountainous and coastal areas, and Peru's coastal waters provide excellent
fishing grounds. Peru is the world's second largest producer of silver and third largest
producer of copper. The Peruvian economy grew by an average of 5.6% from 2009-13
with a stable exchange rate and low inflation, which in 2013 was just below the upper
limit of the Central Bank target range of 1 to 3%. This growth was due partly to high
international prices for Peru's metals and minerals exports, which account for almost
60% of the country's total exports. Growth slipped in 2014, due to weaker world prices
for these resources. Although Peru has strong macroeconomic potential, is depended on
43
the export of mineral and metals and imported foodstuffs makes the economy
vulnerable to fluctuations in world prices. Also the bad infrastructure in the Peru’s non-
coastal areas hinders the spread of growth. Through the rapid expansion coupled with
cash transfers and other programs have helped to reduce the national poverty rate by 28
percentage points since 2002. Although the social inequity still persists. That is
challenging for the Ollanta Humala administration, which has championed a policy of
social inclusion and a more equitable distribution of income. Under the Humala
administration Peru’s free trade policy continued. Since 2006 country has signed trade
deals with the US, Canada, Singapore, China, Korea, Mexico, Japan, the EU, the
European Free Trade Association, Chile, Thailand, Costa Rica, Colombia, Panama,
Venezuela, concluded negotiations with Guatemala, and begun trade talks with
Honduras, El Salvador, India, Indonesia, Turkey and the Trans-Pacific Partnership.
Also his cabinet passed several economic stimulation packages in 2014 to economic
recovery, including reforms to environmental regulations in order to spur investment in
Peru’s lucrative mining sector. Country has signed trade pact between Mexico, Chile
and Columbia about integration of services, capital, investment and movement of
people called Pacific Alliance. Since that, when the pact entered into the force in
2/2009, total trade between Peru and the United States has doubled [7].
Economic risk of Peru is moderate. As mentioned Peru’s economy was growing past
years 5-9% driven growing consumer demand and increasing investments. Although the
GDP per capita is low, USD 6,674.00, it continues to growth. Economy has benefited
from market liberalization reforms in recent years and the poverty have improved from
48.5% in 2004 to 23.9% in 2013. However extreme income inequity continues. Peru
rely on its commodity export such a gold, copper and silver as well as oil and gas and
mineral deposits. Foreign direct investment inflows into mining and energy projects are
strong [2].
2.3.2.3! Social
Peru is a representative republic divided on 25 regions. The population of Peru is 31.4
million inhabitants. Peru’s population growth rate is 0.99% (2014 est.). Country has in
1960 just 9.93 million inhabitants, significant population growing is obvious. The
ethnics groups in Peru - 45% of population are Amerindian, 37% are mestizo (mix of
44
the Amerindian and white), 15% of population is white, black, Japanese, Chinese, and
other 3%. The official languages are – Spanish (84.1%), Quechua (13%) and Aymara
(1.7%). Median age is, compared with Spain, very young, 27 years. Life expectancy at
the birth is 73.48 years. Capital city of Peru is Lima. The greatest success in the social
realm was decreasing the national poverty rate from 53% to 31% in the last decade [7].
According the GINNY coefficient of equivalised disposable income of household
disponible income stood 45.3% (in 2012), one of the top highest in OECD nations. The
Gini coefficient score of zero corresponds to complete equality while a score of one
corresponds to complete inequality [10].
2.3.2.4! Technological
With investments to the mining and gas industries underway Peru’s infrastructure is
growing rapidly although Peru has already an extensive transportation system of
highways and ports, railroads and airports to handle increased traffic.
Peru is increasing its telecom capacity rapidly as well. Success started in 1993 when the
industry was privatized and now is experiencing growth from internet to radio and TV.
According to Macro Economy Meter [39] Peru’s Internet users equals to 39.2 per 100
people with a global rank 107 compared to Portugal’s Internet users equals to 62.1 per
100 people with a global rank of 63. In Peru is the trend of growing since 2010 slightly
decreased in compare with Portugal.
2.3.2.5! Legal
Peru ranked in the Index of economic freedom on the 47th freest place with it’s 67.7
points, whereas the world average is 60.4. Its overall score is 0.3 points better than last
year with improvements in freedom from corruption, labor freedom, and monetary
freedom outweighing declines in business freedom, the management of government
spending, and fiscal freedom. In the South and Central America/Caribbean region is
Peru placed on the 8th place out of 29th position. In Peru economic freedom has declined
by 0.9 points since 2011, in case of fiscal freedom, the management of government
spending, business freedom, and labor freedom. The judiciary is vulnerable to political
interference, and corruption remains pervasive [26].
45
According to Transparency International [14], compared with the Spain, Peru ranked
with 38 points from 100 in 85th place (right After Jamaica and India) of total 174
countries studied. The average country score is 43/100, “indicating a serious corruption
problem”. Compared with Portugal, which is placed with 63 points from 100 ranked in
31rd place.
2.3.3 ! PESTL Analysis Columbia
Due to AMB Country List Report [2] is Colombia evaluated with Country Risk Tier
CRT-4 (moderate). As mentioned above, the CRT scale has 5 levels, whereas CRT-1 is
the best evaluation, and CRT-5 is the worst one. The GDP past years has rebounded
since 2009 growing y 4.3% in 2013 with expectation 4.5% in 2014. Estimated rate for
the near future is 4-5% growth.
2.3.3.1! Political
Political risk of Colombia is high. The government and president Santos, who win his
second four term in 6/2014, has to face high poverty rates (32.7% of the population),
extreme poverty rates (10.4% of the population) and lack of adequate housing. Also
included unemployment, weak infrastructure and inequity are challenging topics for the
government. The security remains a concern. Mainly due insurgent group called
FARC9. Recent peace negotiations with the FARC rebels have resulted in 3 of 5 points
on the agenda and after 50 years of terror the end seems likely. Colombia signed a free
trade contract with the United States in 10/2011 which boosted the growth and trade. In
2013, 31.8% of exports and 27.7% of imports came from the United States [1].
Colombia is also placed in the 34th place, in the newest report of Doingbusiness.org
[11]. It’s just 1 position worse result than Spain. Compared to last year, Colombia did
significant reforms of the particular business procedures and improved from the 53rd
position to the current 34th. First improvement is elimination of the need for a
provisional registration in the case of registering property. The second improvement is
9 FARC - Fuerzas Armadas Revolucionarias de Colombia is Colombian rebel ultra-left organization,
which since the sixties lead a guerrilla war against the local government and paramilitary fronts (AUC).
In the 80 years of their activities, joined the drug trade, which finance their activities [42].
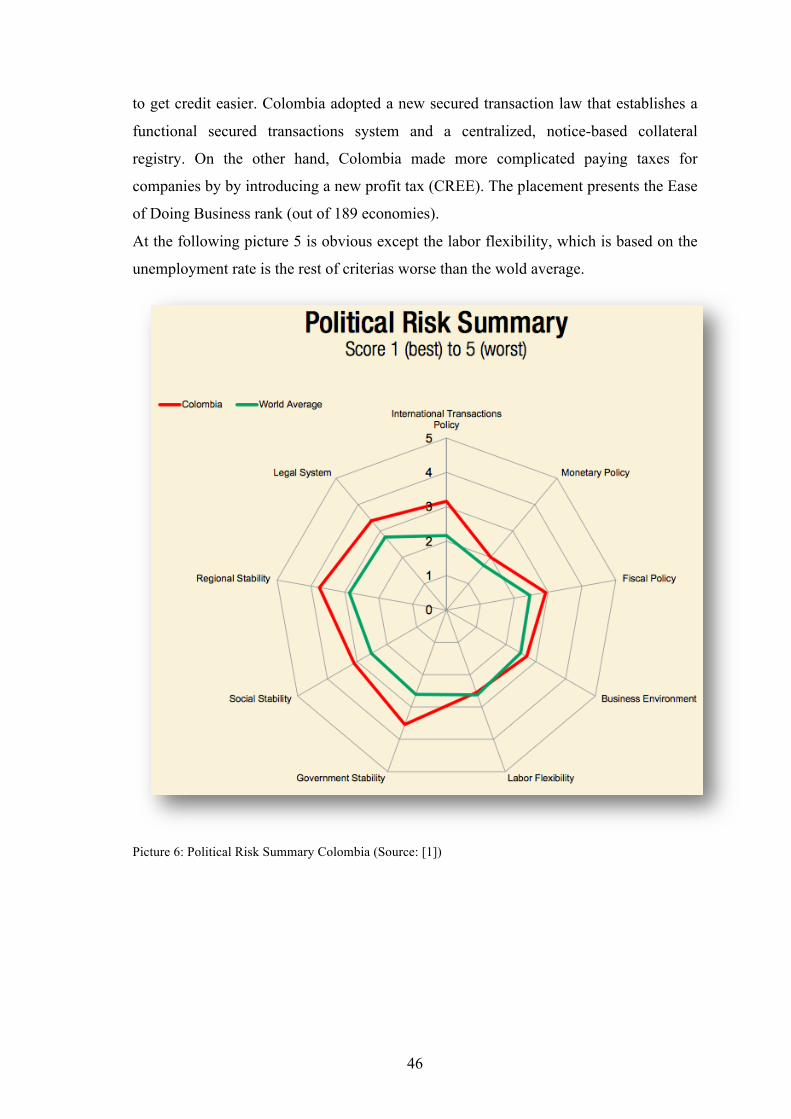
46
to get credit easier. Colombia adopted a new secured transaction law that establishes a
functional secured transactions system and a centralized, notice-based collateral
registry. On the other hand, Colombia made more complicated paying taxes for
companies by by introducing a new profit tax (CREE). The placement presents the Ease
of Doing Business rank (out of 189 economies).
At the following picture 5 is obvious except the labor flexibility, which is based on the
unemployment rate is the rest of criterias worse than the wold average.
Picture 6: Political Risk Summary Colombia (Source: [1])
47
2.3.3.2! Economic
Columbia benefits of consistently sound economic policy and very good and aggressive
free trade agreements promotion in recent years. Also the GDP level is growing past
four years and means almost decade of strong economic performance. The three major
ratings agencies have upgraded Columbia’s government debt to investment grade, what
represent big opportunity to attract record investments, mostly in the hydrocarbons
sector. As mentioned above, Columbia is heavily depended on energy and mining
exports, making it vulnerable to a drop in commodity prices. Colombia is the fourth
largest coal exporter in Latin America and the fourth largest oil producer. Due security
situation, narco-trafficking, poverty, inequity and inadequate infrastructure is stymied
economical development. However, the unemployment rate is still one of the highest in
Latin America, 9.2% in 2014. Colombia as well as Peru signed Free Trade Agreement
about the reducing the trade barriers which is important fact for economy. The US-
Colombia FTA went into force on May 2012. In 2012 was Colombia founding member
of the Pacific Alliance as mentioned above, their members are Peru, Mexico and Chile.
In 2013 Colombia starts to its ascension process to the OECD. In 2014, Columbia made
a tax bill reform to offset the lost revenue from the dropping oil prices. The SANTOS
administration is also using tax reform to help finance implementation of a peace deal,
in the event FARC and the government reach an agreement in 2015. Colombian
officials estimate an economic growth by almost 2% [6].
Although the political risk is high, the economical risk according to A.M. Best Country
Risk Report [1] the economical risk is moderate. Columbia’s economy is driven by
export market, especially petroleum, coffee and cut flowers. The domestic demand has
increased recent years, it reduced Columbia’s vulnerability to global economic
conditions and changes in demand. As mentioned Colombia since economic slowdown
in 2009 is experiencing an economic recovery. It grew by 4.3% in 2013 and is expected
growing at 4-5%, driven the increased domestic demand and expansion in the oil and
mining sectors as global demand recovers. Colombia policy of supporting an open
markets and the strong private sector is applied. Also enhancing flows of investment
and encouraging entrepreneurship is implemented. Foreign direct investment has been
slowly increasing, despite occasional setbacks due to volatile inflows into oil and
mining.
48
2.3.3.3! Social
Colombian population is 47.66 million inhabitants with stable growth over 1%
annually. The major ethnic group are mestizo and white 84.2%, Afro-Colombian
(includes multatto, Raizal, and Palenquero) 10.4%, Amerindian 3.4%, Roma <.01,
unspecified 2.1%. Spoken language is Spanish. As of 2014, 68.14% of the Colombian
population belonged to the 15–64 age group and 24.94% to the 0–14 age group. The
median age was 28.9 years in 2014, indicating that the country has a demographic
advantage in terms of the number of people of working age. Colombian society is
highly inequitable, as 1% of the population holds nearly 40% of the country's wealth.
Nearly 34% of Colombians live below the poverty line. The main problem of Columbia
is facing legal and illegal economic emigration. The beginning is dated in 1960’s.
Forced displacement remains prevalent because of violence among guerrillas,
paramilitary groups, and Colombian security forces. The estimated number of emigrants
is 400,000 of whom live primarily in Venezuela and Ecuador. However, the main host
countries continue to be Venezuela and the United States. Historically, Colombia also
has one of the world's highest levels of forced disappearances. About 30,000 cases have
been recorded over the last four decades - although the number is likely to be much
higher [6].
2.3.3.4! Technological
According to Macro Economy Meter [38] Colombia’s Internet users equals to 51.7 per
100 people with a global rank 82 compared to Portugal’s Internet users equals to 62.1
per 100 people with a global rank of 63. In Colombia is the trend of growing last years
slightly faster in compare with Portugal.
Research and development expenditure (% of GDP) in Colombia was 0.17 as of 2012.
Its highest value over the past 16 years was 0.30 in 1996, while its lowest value was
0.11 in 2000 [32].
Columbian manufacturing innovation survey claims [29], only 9% of the manufacturing
companies has Research and Development departure and only 1% of total
manufacturing work force is employed in Research and Development related activities.
49
2.3.3.5! Legal
Due to Index of Economic Freedom [25], an annual guide published by The Wall Street
Journal and The Heritage Foundation, which is the Index, which covers 10 freedoms,
from property rights to entrepreneurship – in 186 countries, Colombia has ranked on the
28’s place with it’s 71.7 points. Compared with the world average, it’s result is 60.4
points. Its overall score is 1.0 point higher than last year, with the improvement in six of
the ten economic freedoms. Over the past 5 years the economic freedom has been risen
by 3.7 points. The biggest improvement was an 8,0-point improvement in trade
freedom. Colombia was evaluated as 2nd freest of 29 countries in South and Central
America. Due to conflict with FARC rebels continuing to erode institutions. Corruption
occurred on the different levels of public institutions. Although the courts have
demonstrated a degree of independence from the executive, but the justice system
remains compromised by corruption and extortion.
According to Transparency International [14] and compared with the Spain and Peru,
Columbia ranked with 37 points from 100 in 94th place (right with Armenia and Egypt)
of total 174 countries studied. The average country score is 43/100, “indicating a
serious corruption problem”. Compared with Portugal, which is placed with 63 points
from 100 ranked in 31rd place.
2.3.4 ! PESTL analysis summary
The most obvious is the level of comparism of political risk in South America. Peru and
Colmbia are not very stable countries nevertheless with time passing situation getting
better. Still Columbia is having problems with FARC (see above), drug cartel who is
controlling the country, kidnapp, kill people and affect state institutions and executive
power. On the other hand, Peru political risk is only moderate, Peru struggling with
problems in VRAE (see above) region, where are lot of problems with drug violence
and corruption. Spain is except conflicts with Catalan region politically stable. Spain
straggle with issue of unemployment, which is one of the highest in European Union.
On the other hand, Spain made significant changes to run business easier and placed in
33rd place in the report of Doingbusiness.org [13]. That sight possibility to the future
more potential customers, due more business units in Spain. Latin countries, Colombia
50
and Peru experience almost permanent economic growth past half of decade, also
caused free trade zone established between other countries Latin America (see the list
above). Even though according doingbusiness.org [11][12] Peru and Colombia have
potential as Spain set up businesses (as placed on 35th respectively 34th place of 189,
which is one place after Spain). Especially Colombia improved by particular business
reforms. According legal environment, Spain was evaluated as moderately free
economy. As placed 49th of 186 countries, thanks to monetary freedom, investment
freedom and government spending, the result was growing first time after five years.
Spain as South American is struggling with corruption. Peru and Colombia are placed
47th respectively on 28th place. Columbia improved a lot in trade freedom and also
Columbia was placed on 2nd place in whole South and Central America. Although the
courts have demonstrated a degree of independence from the executive, the justice
system remains compromised by corruption and extortion. GDP is growing rapidly in
the case of South American Peru and Colombia (approx. 5% yearly), Spain’s economy
after the 2009 drop is struggling however in 2014 finally marked full year of positive
economic growth in past seven years. Regarding all particular information, author
consider that except South American political uncertainty can be evaluated as
interesting, possible growing market with investment possibilities. On the other hand,
Spain was politically and economically struggling past years, however Portuguese and
Spanish environment has certain similarities and could be predicted similar behaviour
of the local customers as in Portugal.
2.4 ! Porter five forces model
In this five forces model is analysed the microeconomic environment of the company.
Analysis would be reflected in this report in order to provide a view which value is
created and divided among existing and potential industry participants.
2.4.1 ! Bargaining Power Of Suppliers
In the case of ABC Ltd., due company is providing services and consultancy according
establishment of companies in jurisdictions where company operate, the company is
depended on the getting the license from license provider, in this case is it SDM
51
Madeira (Sociedade de Desenvolvimento da Madeira, S.A.) [28]. As a part of
responsibility, the SDM receiving and issues, in cooperation with the Regional
Government of Madeira, the licences for companies to operate within Madeira's IBC.!In
addition, it collects the registration and annual licence fees that are due to the
Autonomous Region of Madeira by companies licensed and by ships registered.
Although the company scope is wider than just establish and manage new companies,
the bargaining threat could be assume as high.
2.4.2 ! Threat of substitutes
As substitute of establish a company in Madeira, could be considered to establish a
company in any tax heaven jurisdiction. The advantage of tax heaven jurisdictions is
minimal tax burden compare with the tax policy in the most countries. Although these
jurisdictions are usually discriminated by other “common” tax countries. With this point
of view is establish a company in Madeira 100% legal and agreed with the European
Union. It would be responsibly to say there is low threat of substitutes.
2.4.3 ! Rivalry of existing competitors
The level of rivalry threat is assumed as moderate. On the Madeira’s market operate
over twenty management companies. The ABC Ltd., is considered as one of the “big
three”. The oldest one, Dixcart is providing international business support services for
over forty years (approximately twenty years on Madeira). Company operate in other
ten jurisdictions with headquarters in UK. Madeira Management is one of the oldest
companies in Madeira set up in 1989 and is considered to be a leader on the market.
ABC Ltd. has stable client basement, thanks a clients satisfaction with services
provides10 (see chapter 2.1). No one of these companies is not attracting the clients in
South America yet. For ABC Ltd. could means a competitive advantage.
10 Internal research of the company
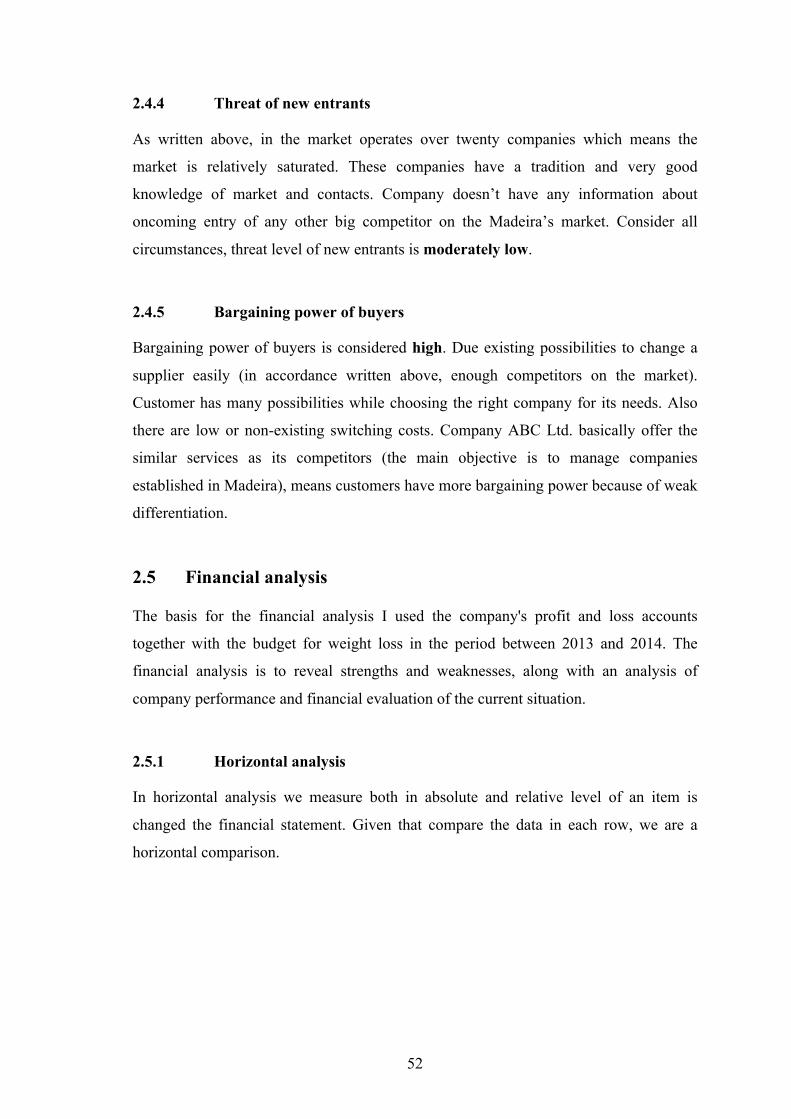
52
2.4.4 ! Threat of new entrants
As written above, in the market operates over twenty companies which means the
market is relatively saturated. These companies have a tradition and very good
knowledge of market and contacts. Company doesn’t have any information about
oncoming entry of any other big competitor on the Madeira’s market. Consider all
circumstances, threat level of new entrants is moderately low.
2.4.5 ! Bargaining power of buyers
Bargaining power of buyers is considered high. Due existing possibilities to change a
supplier easily (in accordance written above, enough competitors on the market).
Customer has many possibilities while choosing the right company for its needs. Also
there are low or non-existing switching costs. Company ABC Ltd. basically offer the
similar services as its competitors (the main objective is to manage companies
established in Madeira), means customers have more bargaining power because of weak
differentiation.
2.5 ! Financial analysis
The basis for the financial analysis I used the company's profit and loss accounts
together with the budget for weight loss in the period between 2013 and 2014. The
financial analysis is to reveal strengths and weaknesses, along with an analysis of
company performance and financial evaluation of the current situation.
2.5.1 ! Horizontal analysis
In horizontal analysis we measure both in absolute and relative level of an item is
changed the financial statement. Given that compare the data in each row, we are a
horizontal comparison.
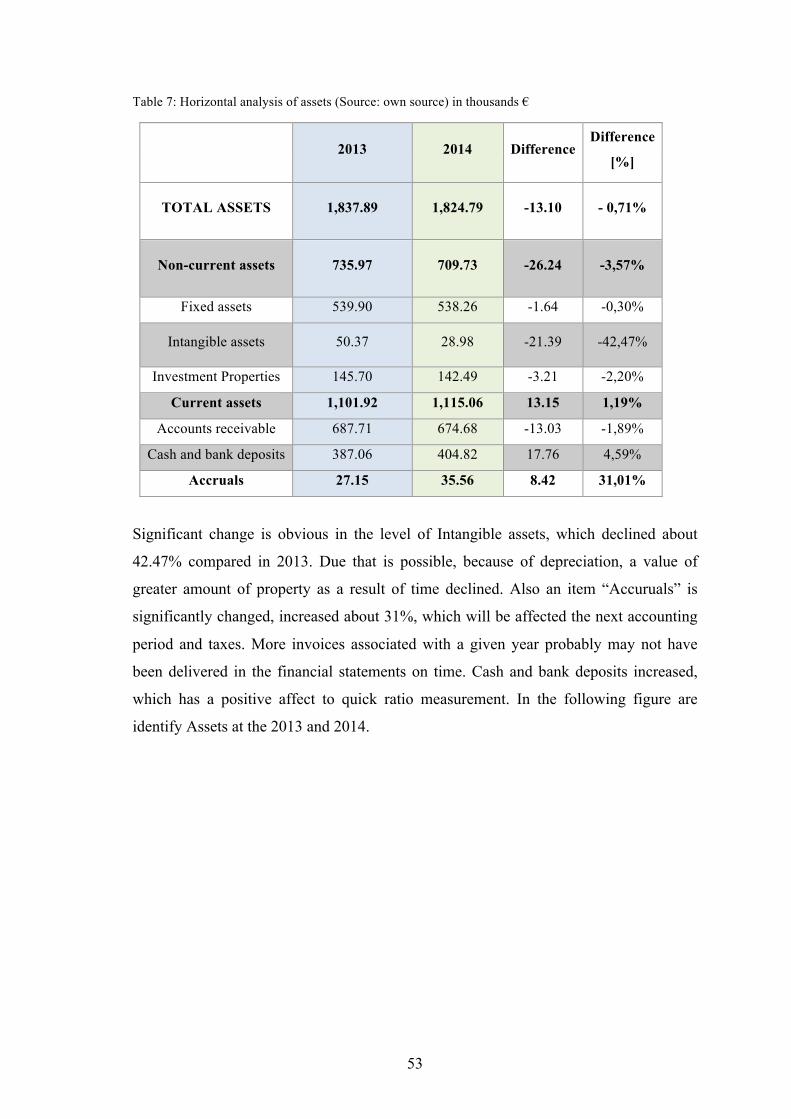
53
Table 7: Horizontal analysis of assets (Source: own source) in thousands €
2013 2014 Difference Difference
[%]
TOTAL ASSETS 1,837.89 1,824.79 -13.10 - 0,71%
Non-current assets 735.97 709.73 -26.24 -3,57%
Fixed assets 539.90 538.26 -1.64 -0,30%
Intangible assets 50.37 28.98 -21.39 -42,47%
Investment Properties 145.70 142.49 -3.21 -2,20%
Current assets 1,101.92 1,115.06 13.15 1,19%
Accounts receivable 687.71 674.68 -13.03 -1,89%
Cash and bank deposits 387.06 404.82 17.76 4,59%
Accruals 27.15 35.56 8.42 31,01% !
Significant change is obvious in the level of Intangible assets, which declined about
42.47% compared in 2013. Due that is possible, because of depreciation, a value of
greater amount of property as a result of time declined. Also an item “Accuruals” is
significantly changed, increased about 31%, which will be affected the next accounting
period and taxes. More invoices associated with a given year probably may not have
been delivered in the financial statements on time. Cash and bank deposits increased,
which has a positive affect to quick ratio measurement. In the following figure are
identify Assets at the 2013 and 2014. !
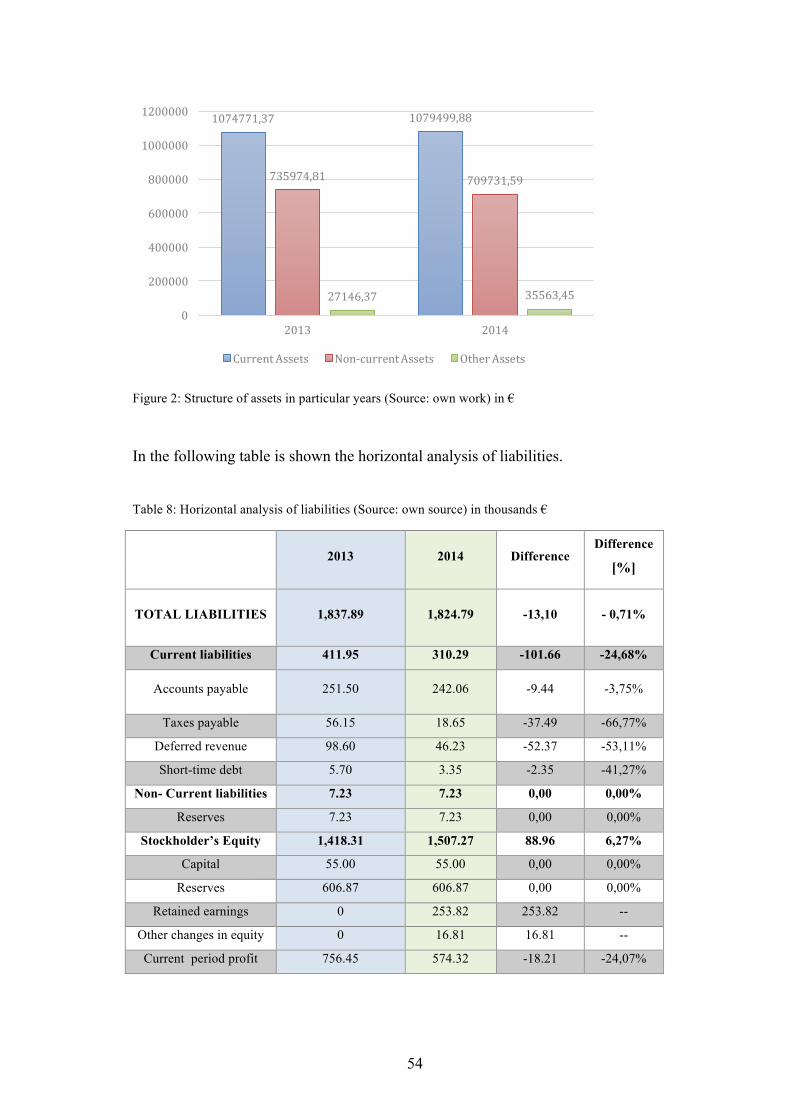
54
Figure 2: Structure of assets in particular years (Source: own work) in €
In the following table is shown the horizontal analysis of liabilities.
Table 8: Horizontal analysis of liabilities (Source: own source) in thousands €
2013 2014 Difference Difference
[%]
TOTAL LIABILITIES 1,837.89 1,824.79 -13,10 - 0,71%
Current liabilities 411.95 310.29 -101.66 -24,68%
Accounts payable 251.50 242.06 -9.44 -3,75%
Taxes payable 56.15 18.65 -37.49 -66,77%
Deferred revenue 98.60 46.23 -52.37 -53,11%
Short-time debt 5.70 3.35 -2.35 -41,27%
Non- Current liabilities 7.23 7.23 0,00 0,00%
Reserves 7.23 7.23 0,00 0,00%
Stockholder’s Equity 1,418.31 1,507.27 88.96 6,27%
Capital 55.00 55.00 0,00 0,00%
Reserves 606.87 606.87 0,00 0,00%
Retained earnings 0 253.82 253.82 --
Other changes in equity 0 16.81 16.81 --
Current period profit 756.45 574.32 -18.21 -24,07%
1074771,37 1079499,88
735974,81 709731,59
27146,37 35563,45
0
200000
400000
600000
800000
1000000
1200000
2013 2014
Current!Assets Non3current!Assets Other!Assets
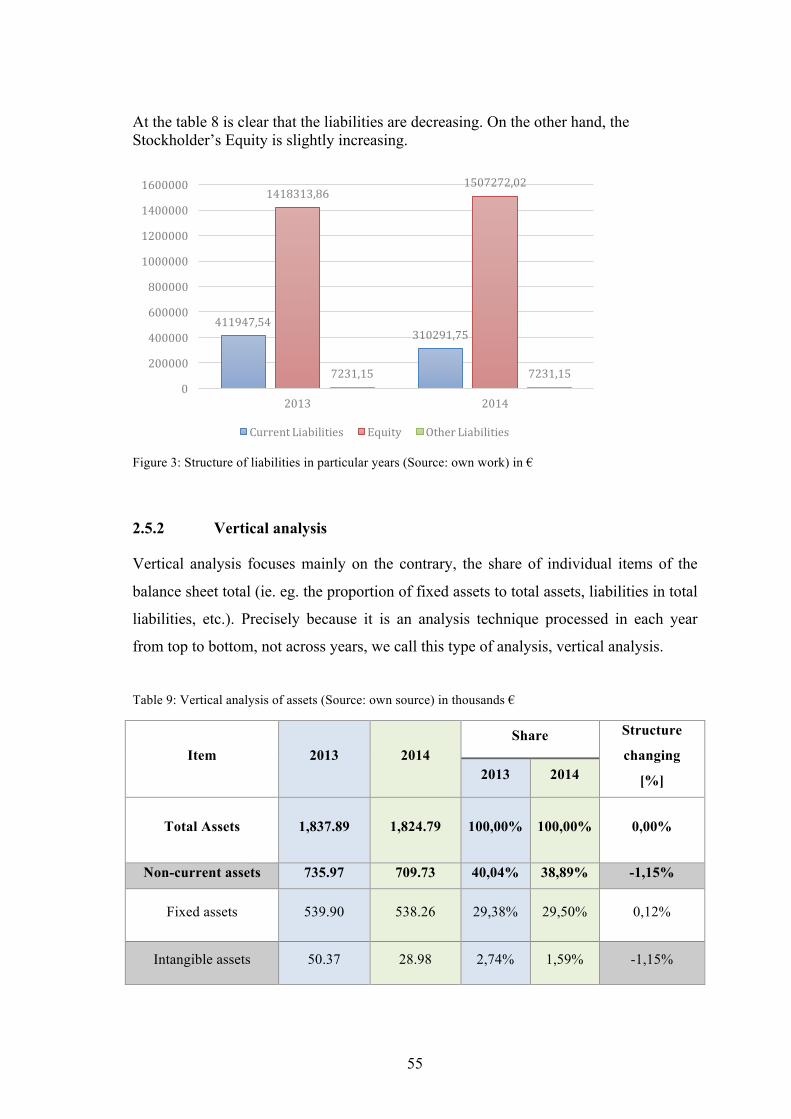
55
At the table 8 is clear that the liabilities are decreasing. On the other hand, the Stockholder’s Equity is slightly increasing.
Figure 3: Structure of liabilities in particular years (Source: own work) in €
2.5.2 ! Vertical analysis
Vertical analysis focuses mainly on the contrary, the share of individual items of the
balance sheet total (ie. eg. the proportion of fixed assets to total assets, liabilities in total
liabilities, etc.). Precisely because it is an analysis technique processed in each year
from top to bottom, not across years, we call this type of analysis, vertical analysis.
Table 9: Vertical analysis of assets (Source: own source) in thousands €
Item 2013 2014 Share Structure
changing
[%] 2013 2014
Total Assets 1,837.89 1,824.79 100,00% 100,00% 0,00%
Non-current assets 735.97 709.73 40,04% 38,89% -1,15%
Fixed assets 539.90 538.26 29,38% 29,50% 0,12%
Intangible assets 50.37 28.98 2,74% 1,59% -1,15%
411947,54310291,75
1418313,861507272,02
7231,15 7231,150
200000
400000
600000
800000
1000000
1200000
1400000
1600000
2013 2014
Current!Liabilities Equity Other!Liabilities
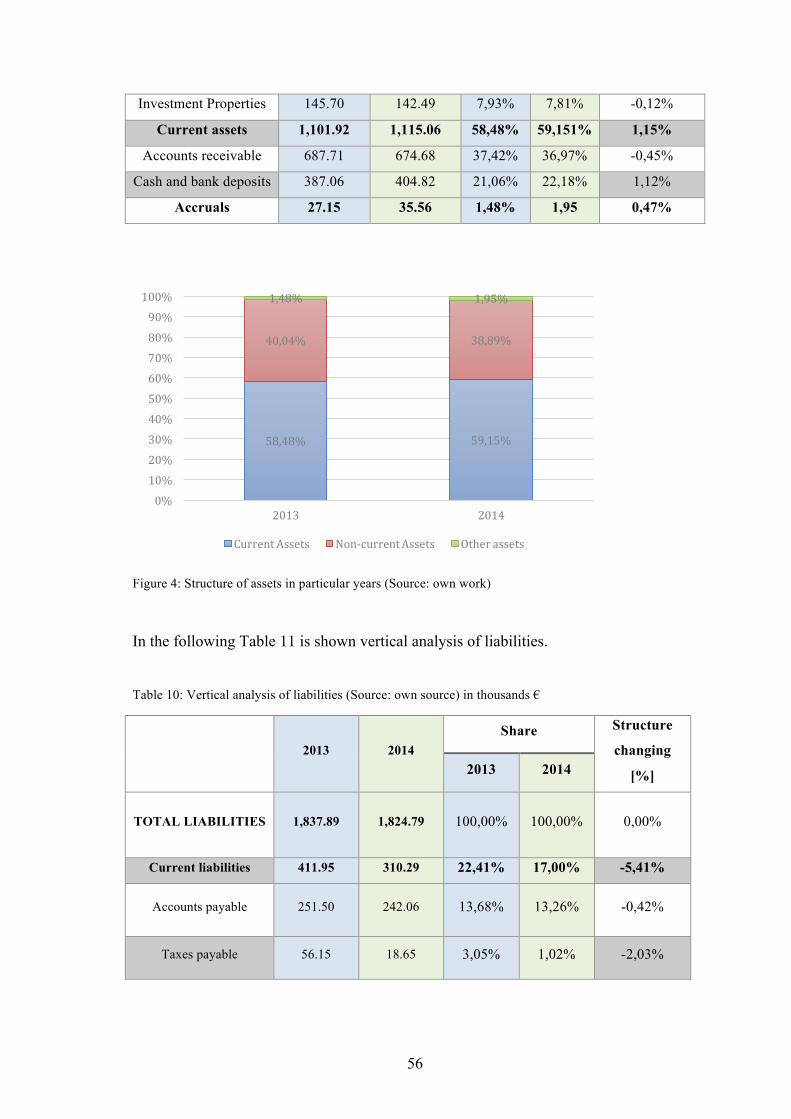
56
Investment Properties 145.70 142.49 7,93% 7,81% -0,12%
Current assets 1,101.92 1,115.06 58,48% 59,151% 1,15%
Accounts receivable 687.71 674.68 37,42% 36,97% -0,45%
Cash and bank deposits 387.06 404.82 21,06% 22,18% 1,12%
Accruals 27.15 35.56 1,48% 1,95 0,47%
Figure 4: Structure of assets in particular years (Source: own work)
In the following Table 11 is shown vertical analysis of liabilities.
Table 10: Vertical analysis of liabilities (Source: own source) in thousands €
2013 2014 Share Structure
changing
[%] 2013 2014
TOTAL LIABILITIES 1,837.89 1,824.79 100,00% 100,00% 0,00%
Current liabilities 411.95 310.29 22,41% 17,00% -5,41%
Accounts payable 251.50 242.06 13,68% 13,26% -0,42%
Taxes payable 56.15 18.65 3,05% 1,02% -2,03%
58,48% 59,15%
40,04% 38,89%
1,48% 1,95%
0%
10%
20%
30%
40%
50%
60%
70%
80%
90%
100%
2013 2014
Current!Assets Non3current!Assets Other!assets
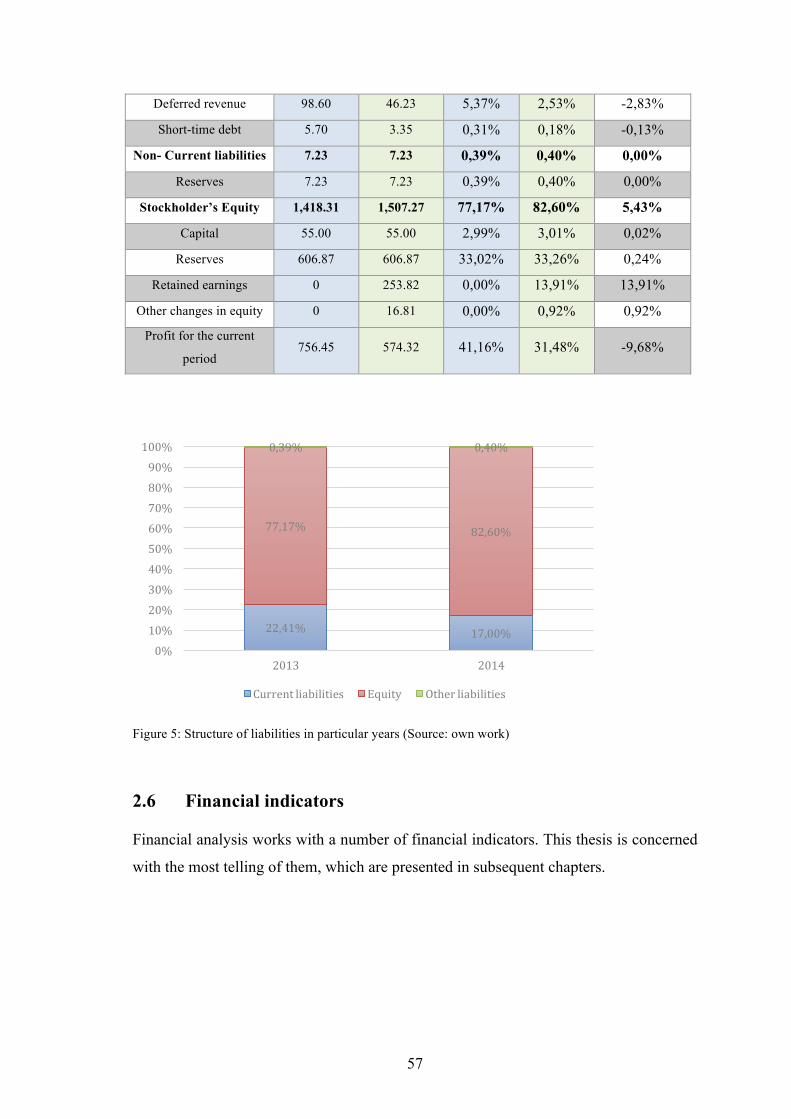
57
Deferred revenue 98.60 46.23 5,37% 2,53% -2,83%
Short-time debt 5.70 3.35 0,31% 0,18% -0,13%
Non- Current liabilities 7.23 7.23 0,39% 0,40% 0,00%
Reserves 7.23 7.23 0,39% 0,40% 0,00%
Stockholder’s Equity 1,418.31 1,507.27 77,17% 82,60% 5,43%
Capital 55.00 55.00 2,99% 3,01% 0,02%
Reserves 606.87 606.87 33,02% 33,26% 0,24%
Retained earnings 0 253.82 0,00% 13,91% 13,91%
Other changes in equity 0 16.81 0,00% 0,92% 0,92%
Profit for the current
period 756.45 574.32 41,16% 31,48% -9,68%
Figure 5: Structure of liabilities in particular years (Source: own work)
2.6 ! Financial indicators
Financial analysis works with a number of financial indicators. This thesis is concerned
with the most telling of them, which are presented in subsequent chapters.
22,41% 17,00%
77,17% 82,60%
0,39% 0,40%
0%
10%
20%
30%
40%
50%
60%
70%
80%
90%
100%
2013 2014
Current!liabilities Equity Other!liabilities
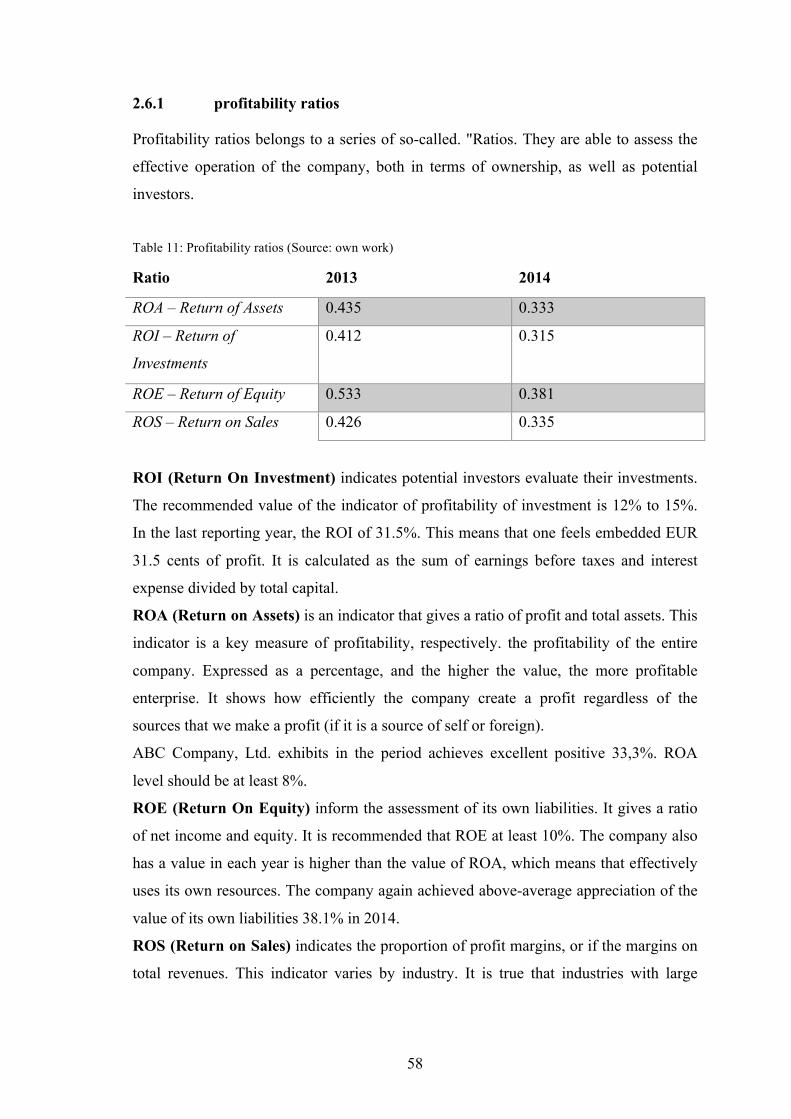
58
2.6.1 ! profitability ratios
Profitability ratios belongs to a series of so-called. "Ratios. They are able to assess the
effective operation of the company, both in terms of ownership, as well as potential
investors.
Table 11: Profitability ratios (Source: own work)
Ratio 2013 2014
ROA – Return of Assets 0.435 0.333
ROI – Return of
Investments
0.412 0.315
ROE – Return of Equity 0.533 0.381
ROS – Return on Sales 0.426 0.335
ROI (Return On Investment) indicates potential investors evaluate their investments.
The recommended value of the indicator of profitability of investment is 12% to 15%.
In the last reporting year, the ROI of 31.5%. This means that one feels embedded EUR
31.5 cents of profit. It is calculated as the sum of earnings before taxes and interest
expense divided by total capital.
ROA (Return on Assets) is an indicator that gives a ratio of profit and total assets. This
indicator is a key measure of profitability, respectively. the profitability of the entire
company. Expressed as a percentage, and the higher the value, the more profitable
enterprise. It shows how efficiently the company create a profit regardless of the
sources that we make a profit (if it is a source of self or foreign).
ABC Company, Ltd. exhibits in the period achieves excellent positive 33,3%. ROA
level should be at least 8%.
ROE (Return On Equity) inform the assessment of its own liabilities. It gives a ratio
of net income and equity. It is recommended that ROE at least 10%. The company also
has a value in each year is higher than the value of ROA, which means that effectively
uses its own resources. The company again achieved above-average appreciation of the
value of its own liabilities 38.1% in 2014.
ROS (Return on Sales) indicates the proportion of profit margins, or if the margins on
total revenues. This indicator varies by industry. It is true that industries with large
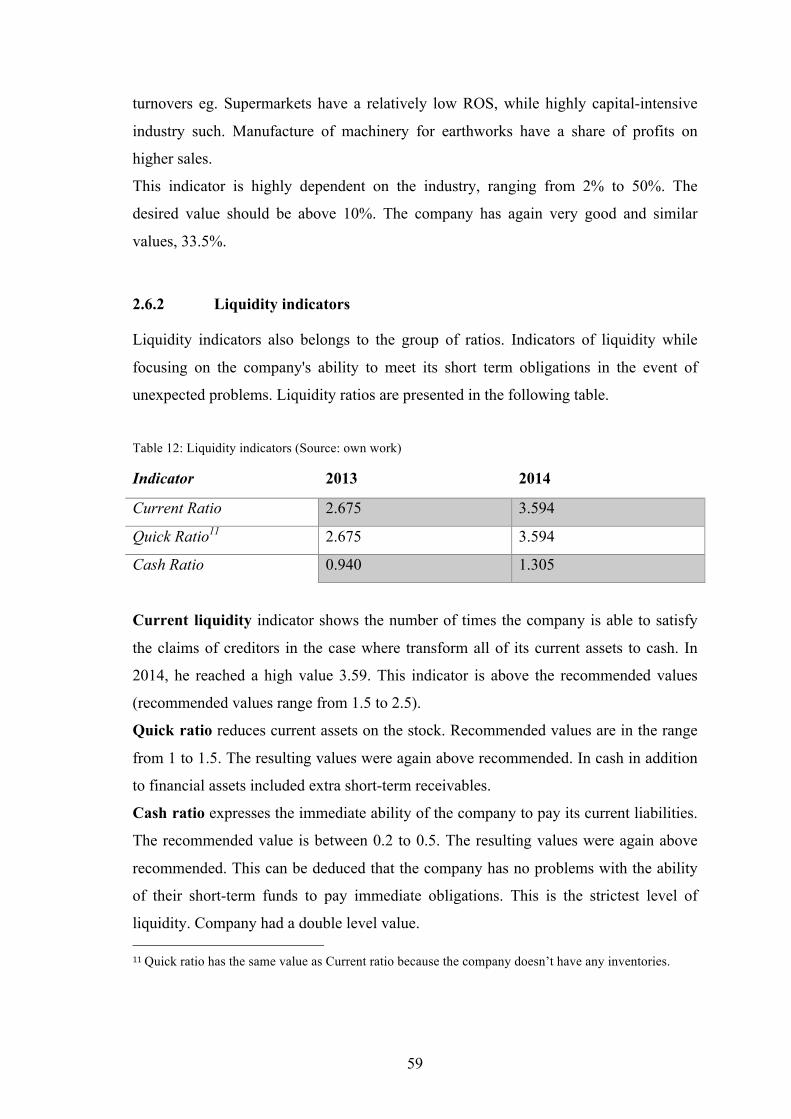
59
turnovers eg. Supermarkets have a relatively low ROS, while highly capital-intensive
industry such. Manufacture of machinery for earthworks have a share of profits on
higher sales.
This indicator is highly dependent on the industry, ranging from 2% to 50%. The
desired value should be above 10%. The company has again very good and similar
values, 33.5%.
2.6.2 ! Liquidity indicators
Liquidity indicators also belongs to the group of ratios. Indicators of liquidity while
focusing on the company's ability to meet its short term obligations in the event of
unexpected problems. Liquidity ratios are presented in the following table.
Table 12: Liquidity indicators (Source: own work)
Indicator 2013 2014
Current Ratio 2.675 3.594
Quick Ratio11 2.675 3.594
Cash Ratio 0.940 1.305
Current liquidity indicator shows the number of times the company is able to satisfy
the claims of creditors in the case where transform all of its current assets to cash. In
2014, he reached a high value 3.59. This indicator is above the recommended values
(recommended values range from 1.5 to 2.5).
Quick ratio reduces current assets on the stock. Recommended values are in the range
from 1 to 1.5. The resulting values were again above recommended. In cash in addition
to financial assets included extra short-term receivables.
Cash ratio expresses the immediate ability of the company to pay its current liabilities.
The recommended value is between 0.2 to 0.5. The resulting values were again above
recommended. This can be deduced that the company has no problems with the ability
of their short-term funds to pay immediate obligations. This is the strictest level of
liquidity. Company had a double level value. 11!Quick ratio has the same value as Current ratio because the company doesn’t have any inventories. !
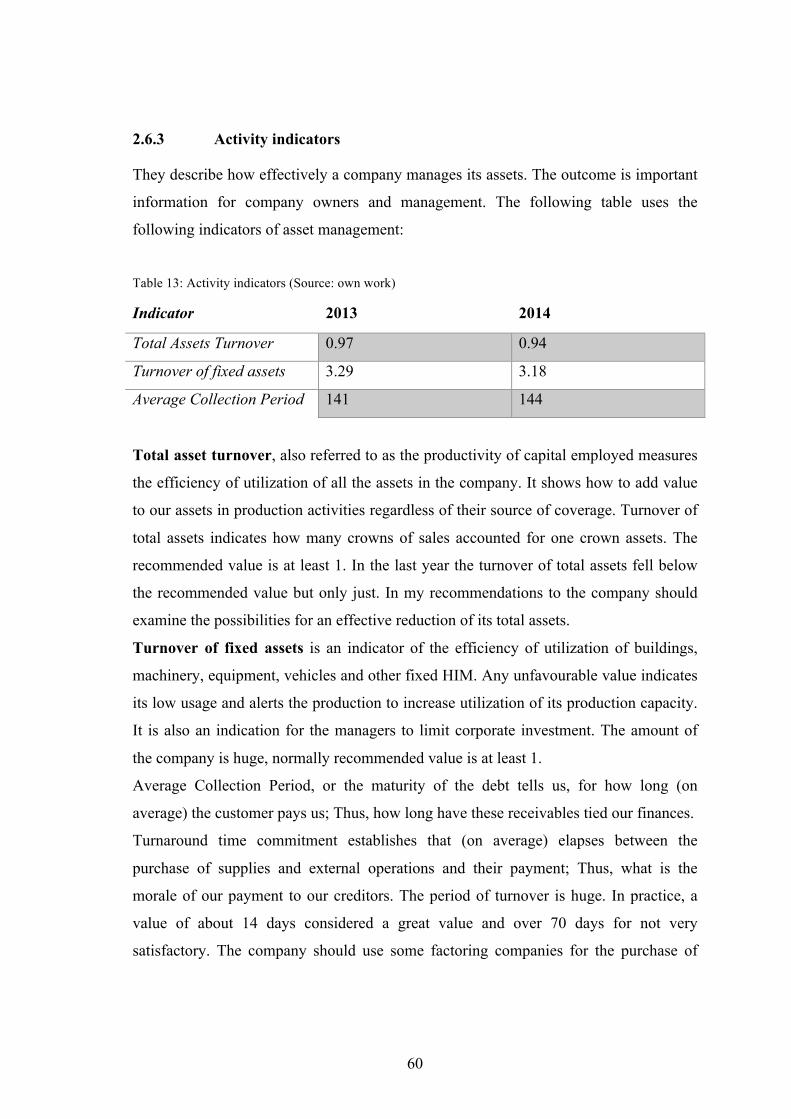
60
2.6.3 ! Activity indicators
They describe how effectively a company manages its assets. The outcome is important
information for company owners and management. The following table uses the
following indicators of asset management:
Table 13: Activity indicators (Source: own work)
Indicator 2013 2014
Total Assets Turnover 0.97 0.94
Turnover of fixed assets 3.29 3.18
Average Collection Period 141 144
Total asset turnover, also referred to as the productivity of capital employed measures
the efficiency of utilization of all the assets in the company. It shows how to add value
to our assets in production activities regardless of their source of coverage. Turnover of
total assets indicates how many crowns of sales accounted for one crown assets. The
recommended value is at least 1. In the last year the turnover of total assets fell below
the recommended value but only just. In my recommendations to the company should
examine the possibilities for an effective reduction of its total assets.
Turnover of fixed assets is an indicator of the efficiency of utilization of buildings,
machinery, equipment, vehicles and other fixed HIM. Any unfavourable value indicates
its low usage and alerts the production to increase utilization of its production capacity.
It is also an indication for the managers to limit corporate investment. The amount of
the company is huge, normally recommended value is at least 1.
Average Collection Period, or the maturity of the debt tells us, for how long (on
average) the customer pays us; Thus, how long have these receivables tied our finances.
Turnaround time commitment establishes that (on average) elapses between the
purchase of supplies and external operations and their payment; Thus, what is the
morale of our payment to our creditors. The period of turnover is huge. In practice, a
value of about 14 days considered a great value and over 70 days for not very
satisfactory. The company should use some factoring companies for the purchase of
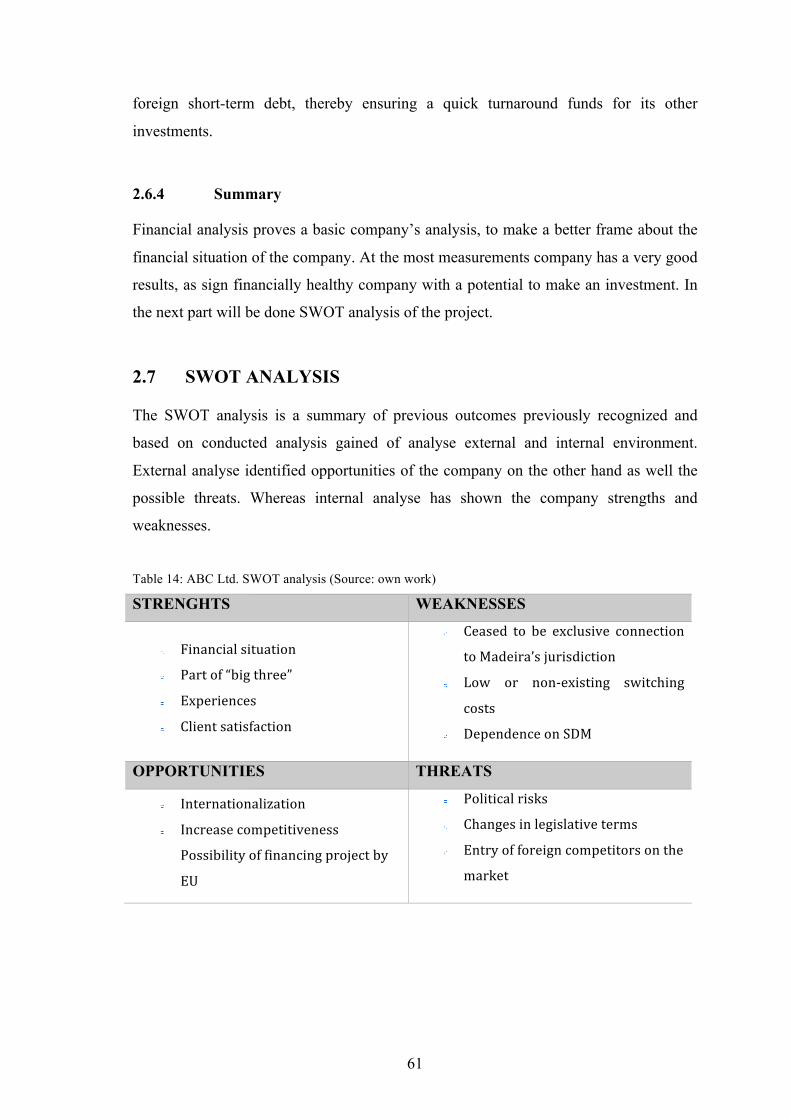
61
foreign short-term debt, thereby ensuring a quick turnaround funds for its other
investments.
2.6.4 ! Summary
Financial analysis proves a basic company’s analysis, to make a better frame about the
financial situation of the company. At the most measurements company has a very good
results, as sign financially healthy company with a potential to make an investment. In
the next part will be done SWOT analysis of the project.
2.7 ! SWOT ANALYSIS
The SWOT analysis is a summary of previous outcomes previously recognized and
based on conducted analysis gained of analyse external and internal environment.
External analyse identified opportunities of the company on the other hand as well the
possible threats. Whereas internal analyse has shown the company strengths and
weaknesses.
Table 14: ABC Ltd. SWOT analysis (Source: own work) STRENGHTS WEAKNESSES
! Financial!situation!
! Part!of!“big!three”!
! Experiences!
! Client!satisfaction!
! Ceased! to! be! exclusive! connection!
to!Madeira’s!jurisdiction!
! Low! or! non3existing! switching!
costs!
! Dependence!on!SDM!
OPPORTUNITIES THREATS
! Internationalization!
! Increase!competitiveness!
! Possibility!of!financing!project!by!
EU!
! Political!risks!
! Changes!in!legislative!terms!
! Entry!of!foreign!competitors!on!the!
market!
62
Based on this standard method, used for the presentation of analytical tools can be
identified Strengths, Weaknesses, Opportunities and Threats of the ABC, Ltd.
Company. The mutual evaluation of factors strengths and weaknesses on one side with
respect to the opportunities and dangers on the other hand, we get a new qualitative
information that characterize and evaluate the level of their mutual conflict.
SWOT analysis of the above can be seen that the company has the potential to expand
its operations to other countries and cause of ceased to be exclusive connection to
Madeira’s jurisdiction company need to take steps to prevent stagnation or decline of
orders. Company has long experience in the market and once foreign markets
penetrated. Financial situation is stable and company has own equity to realize project
without necessity of foreign capital. Company has to pay attention on political risks in
South America and possible changes in legislative terms. And because of company is
ceased to be exclusive connection to Madeira’s jurisdiction, as a potential seems
internationalization with the support of EU subsidies. By expansion company will
eliminate risks of concentration of operations on single market.
!!
63
3 !Proposed solution
In this part of my thesis is processed own designs project plan. I focused on a detailed
description of the project (design cycle and the actual output of the project) and to the
financial aspects of the project.
3.1 ! Project characteristic
The ABC, Ltd. is a management company established over 20 years ago to provide
services to customers of the International Business Centre of Madeira (IBC).
Throughout these two decades, the company has gained much experience and
credibility in the management of companies in the IBC, currently being one of the three
largest management companies in the region.
Due to progressive obstacles and conditionalities that the IBC has been subject in recent
years (which have been reducing the competitiveness of jurisdiction), the ABC, Ltd.
felt increasing difficulties in keeping customers and especially in attracting new
customers. It therefore considered that the best way of overcoming them would be its
internationalization, capitalizing on the know-how obtained over these two decades in
Madeira, so it began operations in 2013 in Malta, another low-tax jurisdiction.
The first phase of the ABC, Ltd. internationalization strategy had as main objective the
company gained notoriety and market share in a new jurisdiction, while adjusting to a
new product, new communication tools and a more global dimension. To this end, the
company created a global brand has adopted an innovative and aggressive marketing
strategy, more customer-focused, based on a strong brand, sophisticated systems and
modern communication tools, such as webinars, online meetings, promotional videos
(demos) and social networks.
However, with the experience gained during this first phase, the ABC, Ltd. understood
that international markets were so competitive and sophisticated, that way of success
depended not only a strong brand and modern communication tools. In these markets,
there are not only many more competitors, as customers are demanding and are well
64
prepared to analyse the supply of available services, constantly being addressed with
alternative proposals from different service providers. Therefore, to succeed
internationally, it is necessary to ensure ABC, Ltd. to your target customers a close, not
only in terms of physical availability as understanding of their needs, to provide timely
and relevant information, ongoing monitoring of opportunities for ensure its
implementation, and further support to ensure satisfaction with the services purchased
and maximize the recommendation of probabilities and use more services. This
closeness is possible only through a continuous presence in select international markets,
in this case Spain and Latin American markets, and the adoption of very sophisticated
tools to identify and manage new business opportunities.
3.1.1 ! Presence in Spain
In February 2014, the ABC, Ltd. started offering all available information on the site
and the blog in a third language, Spanish. However, the mere provision of information
in one language is not enough to arouse interest among our target customers, let alone to
generate real business opportunities. Similarly, the timely organization of promotional
activities in this market, although providing a personal contact highly valued by
potential customers, it has proven insufficient to achieve these objectives.
In this sense, ABC, Ltd. plan to hire in Spain the services of a specialist consultant,
who has a deep knowledge of the market and target customer needs, so being able to
identify potential customers and respective needs, define appropriate solutions, produce
timely information and relevant, generating a consistent flow of new business
opportunities and follow up different opportunities in order to enhance its
implementation.
In parallel, ABC, Ltd. will implement an aggressive Business Development Plan
directed to this market, to maximize the generation of new business opportunities,
complementing and enhancing the work of the consultant in Spain.
3.1.2 ! The Business Development Plan
To achieve its goals, the international business development plan of ABC, Ltd. is
divided into two areas, taking place simultaneously and in an integrated manner: a
65
content management plan and a lead generation plan and opportunity management
business.
3.1.2.1! Content Management System
Through its content management plan, ABC, Ltd. will involve all its contacts, current
and potential, in a conversation that takes place throughout the year through the
different communication channels (blog, website, social networks). By creating quality
content, ABC, Ltd. will attract potential clients, educating them to the different
opportunities offered by the jurisdictions in which it operates and stimulating personal
contacts that result later on real business opportunities.
This Content Management System is rooted in a "marketing automation" tool, Pardot,
which allows us to identify the best quality leads from your online activity, creating
customized and targeted emails, based on the behavior of leads, accelerate the pipeline
sales and better identify the ROI of our online marketing actions. The Pardot
interconnects with Customer Relationship Manament system used by ABC, Ltd., the
Salesforce.com, which mainly supports the management of business opportunities, in
this platform is that register all interactions with leads already prone to conversion.
The ABC, Ltd. content management plan involves the preparation of articles, alerts,
relevant news, relevant and timely transmitted as well as the production of promotional
materials (digital brochures, webinars, demos, infographics) adapted to international
markets and designed taking into account the new tools and digital platforms.
On the other hand, once created, the content has to be encouraged in appropriate
platforms, and its disclosure should be maximized through Search Engine Optimization
and Search Engine Advertising tools as well as positioned in thematic areas and
discussion groups related to subjects in order to precisely reach the intended targets. To
this extent, the promotional campaigns professional social networks, such as the
LinkedIn, should be target of additional investment in view of its higher efficacy.
66
3.1.2.2! Lead management and opportunities
Effective management of the international business development plan implies a good
impression of management capability on the part of "sales" Team ABC, Ltd.,
management that becomes more difficult and complex when the team is physically
distant headquarters as the case. To this extent, and to better coordinate and evaluate the
work of the expert consultant in Spain, it is essential that ABC, Ltd. refer to new
technologies designed specifically to optimize the management of such activities, and it
is therefore essential enlargement of users and tasks within of Salesforce.com, as well
as the adoption of a new analysis tool and reporting, the Insightsquared, which
integrates with Salesforce and allows a reliable and quality reporting, both in historical
terms as prospective.
3.2 ! The strategy and goals of project
As written above, the ABC, Ltd. already entered in Spanish marked in 2014, but
understood thereafter, that just provide information in the local language is not enough
to attract new clients. It is necessary to ensure ABC, Ltd. will be closer to the target
customers. Understanding their needs is crucial, to provide quality and relevant
information, ongoing monitoring of opportunities for ensure its implementation, to
ensure the future satisfaction with the services provided for their clients and maximize
the recommendation of probabilities and use more services. This closeness is possible
only through a continuous presence in select international markets, in this case Spain
and Latin American markets. Thanks highly motivated experts will be company closer
and define appropriate solutions, produce timely information and relevant, generating a
consistent flow of new business opportunities and follow up different opportunities in
order to enhance its implementation. Company will also starts marketing campaign
mainly focused on social networks such as the LinkedIn, which should be additional
target in view of its higher efficacy.
Goals of project:
67
! Growth of competitiveness.
! Improving market position.
! Attract new clients.
! Increase in sales.
! Gain notoriety and market share in a new Jurisdiction
3.3 ! Project outputs
From the output of the project will be met key strategic objectives and sub-specific
objectives set out in section 3.2 Partial results of the project:
The promoter of the company intends to operate in the following markets:
-! Spain
-! Colombia
-! Peru
It estimates that in the first year the unbilled amounts are:
-! 50,000.00 (Spain)
-! 25,000.00 (Columbia)
-! 25,000.00 (Peru)
In the second year the values will increase with the forecast as follows:
-! 100,000.00 (Spain)
-! 50,000.00 (Columbia)
-! 50,000.00 (Peru)
In the third year forecast as follows:
-! 150,000.00 (Spain)
-! 75,000.00 (Columbia)
-! 75,000.00 (Peru)
68
The company will also increase assets and create new jobs for two new employees in
the current office in Madeira. These employees will care about the new clients and
provide them professional consultancy service and do an administrative work. Their
salary will be € 1.500,00/month.
3.4 ! Project risks
Each project is also to be reckoned with negative influences that may threaten the
viability of the project plan. It is necessary to identify these effects in advance and to
ensure appropriate measures to eliminate them. The following points are intended to
identify individual risks:
-! hiring under-qualified workforce
-! The impact of competitive companies in the region
-! rejection of the subsidy requested from the EU funds
-! lack of interest in the services offered
-! risk activities associated with the timing of the project
-! legislative changes
-! political stability
-! cost increasing
3.5 ! Financial analysis of project
It is an essential part of every project. There are basic economic indicators of the project
plan, including investment costs for the project, and at the end of subchapter is given
calculation of operating costs and project revenues.
3.5.1 ! Classification list of project components and schedule
The table below shows a summary of the investment costs for the acquisition every
single items necessary for the operation of the project. Table 15: Project components and schedule (Source: own work)
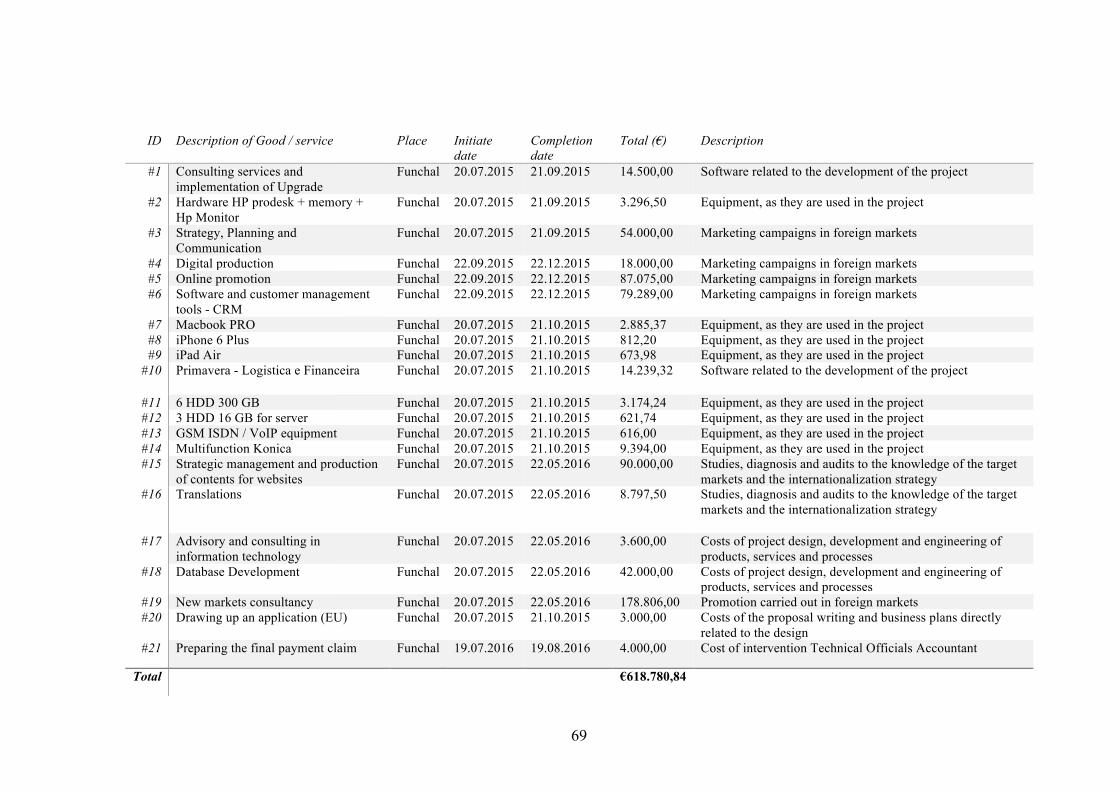
69
ID Description of Good / service Place Initiate date
Completion date
Total (€) Description
#1 Consulting services and implementation of Upgrade
Funchal 20.07.2015 21.09.2015 14.500,00 Software related to the development of the project
#2 Hardware HP prodesk + memory + Hp Monitor
Funchal 20.07.2015 21.09.2015 3.296,50 Equipment, as they are used in the project
#3 Strategy, Planning and Communication
Funchal 20.07.2015 21.09.2015 54.000,00 Marketing campaigns in foreign markets
#4 Digital production Funchal 22.09.2015 22.12.2015 18.000,00 Marketing campaigns in foreign markets #5 Online promotion Funchal 22.09.2015 22.12.2015 87.075,00 Marketing campaigns in foreign markets #6 Software and customer management
tools - CRM Funchal 22.09.2015 22.12.2015 79.289,00 Marketing campaigns in foreign markets
#7 Macbook PRO Funchal 20.07.2015 21.10.2015 2.885,37 Equipment, as they are used in the project #8 iPhone 6 Plus Funchal 20.07.2015 21.10.2015 812,20 Equipment, as they are used in the project #9 iPad Air Funchal 20.07.2015 21.10.2015 673,98 Equipment, as they are used in the project
#10 Primavera - Logistica e Financeira Funchal 20.07.2015 21.10.2015 14.239,32 Software related to the development of the project
#11 6 HDD 300 GB Funchal 20.07.2015 21.10.2015 3.174,24 Equipment, as they are used in the project #12 3 HDD 16 GB for server Funchal 20.07.2015 21.10.2015 621,74 Equipment, as they are used in the project #13 GSM ISDN / VoIP equipment Funchal 20.07.2015 21.10.2015 616,00 Equipment, as they are used in the project #14 Multifunction Konica Funchal 20.07.2015 21.10.2015 9.394,00 Equipment, as they are used in the project #15 Strategic management and production
of contents for websites Funchal 20.07.2015 22.05.2016 90.000,00 Studies, diagnosis and audits to the knowledge of the target
markets and the internationalization strategy #16 Translations Funchal 20.07.2015 22.05.2016 8.797,50 Studies, diagnosis and audits to the knowledge of the target
markets and the internationalization strategy
#17 Advisory and consulting in information technology
Funchal 20.07.2015 22.05.2016 3.600,00 Costs of project design, development and engineering of products, services and processes
#18 Database Development Funchal 20.07.2015 22.05.2016 42.000,00 Costs of project design, development and engineering of products, services and processes
#19 New markets consultancy Funchal 20.07.2015 22.05.2016 178.806,00 Promotion carried out in foreign markets #20 Drawing up an application (EU) Funchal 20.07.2015 21.10.2015 3.000,00 Costs of the proposal writing and business plans directly
related to the design #21 Preparing the final payment claim Funchal 19.07.2016 19.08.2016 4.000,00 Cost of intervention Technical Officials Accountant
Total €618.780,84
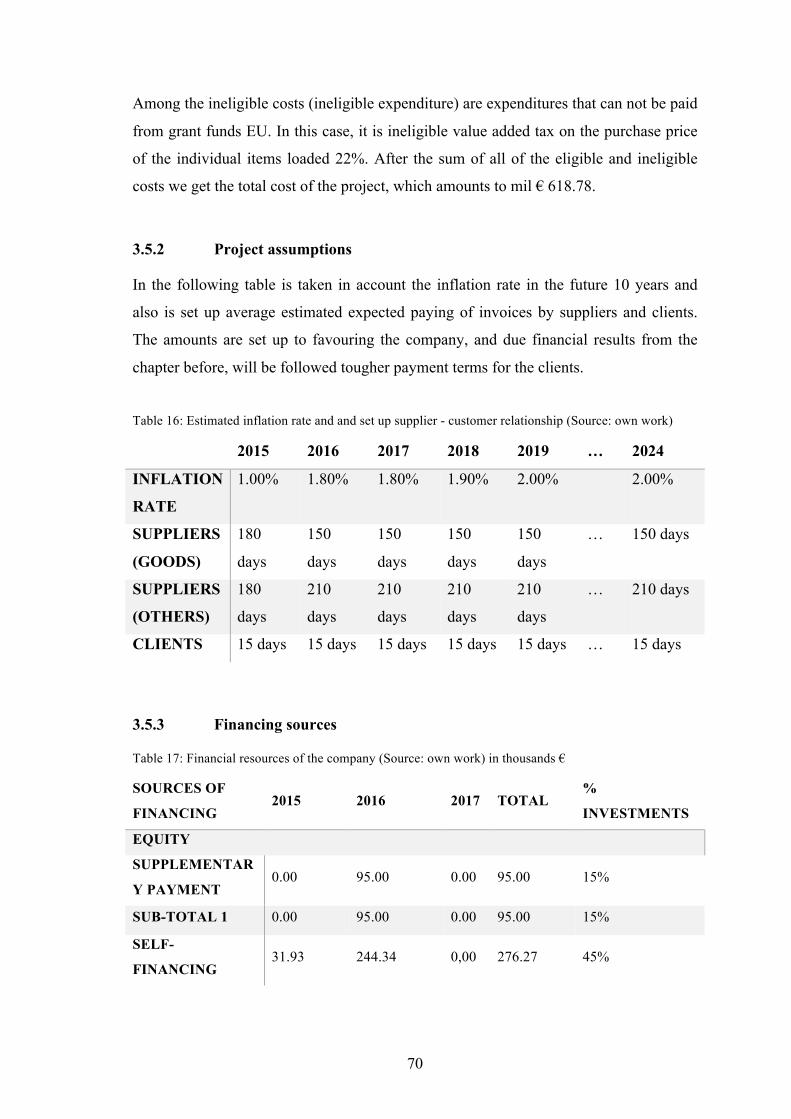
70
Among the ineligible costs (ineligible expenditure) are expenditures that can not be paid
from grant funds EU. In this case, it is ineligible value added tax on the purchase price
of the individual items loaded 22%. After the sum of all of the eligible and ineligible
costs we get the total cost of the project, which amounts to mil € 618.78.
3.5.2 ! Project assumptions
In the following table is taken in account the inflation rate in the future 10 years and
also is set up average estimated expected paying of invoices by suppliers and clients.
The amounts are set up to favouring the company, and due financial results from the
chapter before, will be followed tougher payment terms for the clients.
Table 16: Estimated inflation rate and and set up supplier - customer relationship (Source: own work)
2015 2016 2017 2018 2019 … 2024
INFLATION
RATE
1.00% 1.80% 1.80% 1.90% 2.00% 2.00%
SUPPLIERS
(GOODS)
180
days
150
days
150
days
150
days
150
days
… 150 days
SUPPLIERS
(OTHERS)
180
days
210
days
210
days
210
days
210
days
… 210 days
CLIENTS 15 days 15 days 15 days 15 days 15 days … 15 days
3.5.3 ! Financing sources
Table 17: Financial resources of the company (Source: own work) in thousands €
SOURCES OF
FINANCING 2015 2016 2017 TOTAL
%
INVESTMENTS
EQUITY
SUPPLEMENTAR
Y PAYMENT 0.00 95.00 0.00 95.00 15%
SUB-TOTAL 1 0.00 95.00 0.00 95.00 15%
SELF-
FINANCING 31.93 244.34 0,00 276.27 45%
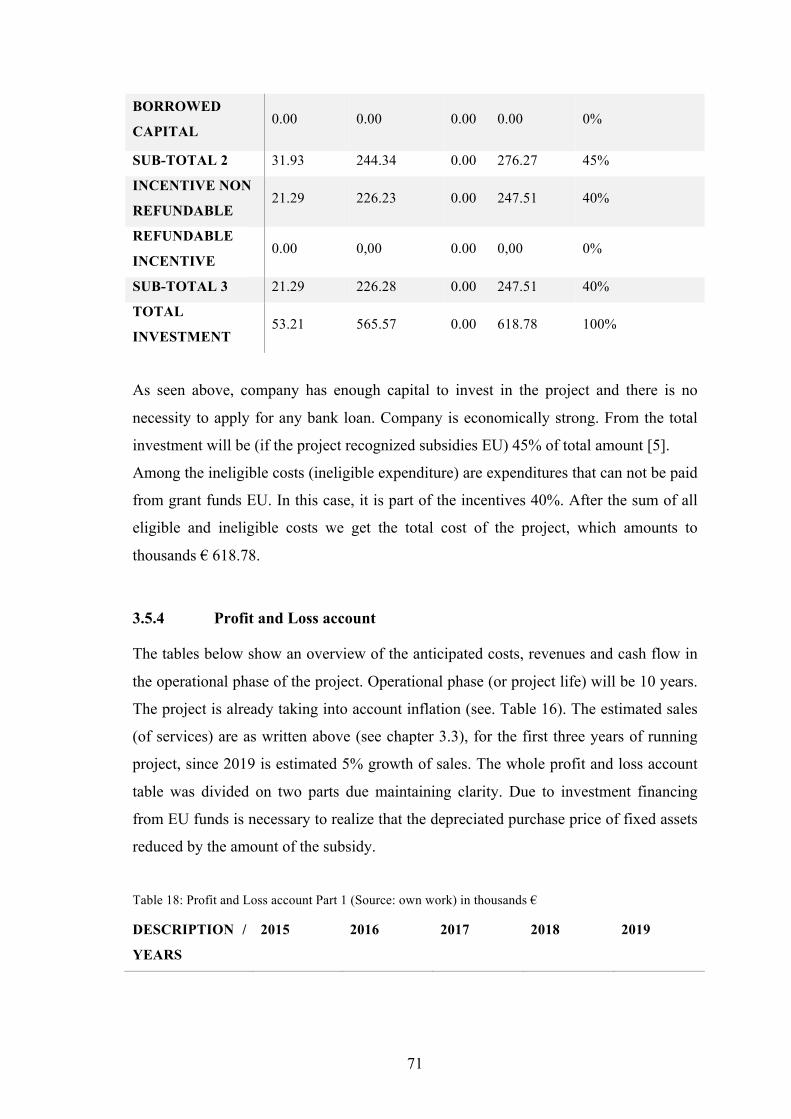
71
BORROWED
CAPITAL 0.00 0.00 0.00 0.00 0%
SUB-TOTAL 2 31.93 244.34 0.00 276.27 45%
INCENTIVE NON
REFUNDABLE 21.29 226.23 0.00 247.51 40%
REFUNDABLE
INCENTIVE 0.00 0,00 0.00 0,00 0%
SUB-TOTAL 3 21.29 226.28 0.00 247.51 40%
TOTAL
INVESTMENT 53.21 565.57 0.00 618.78 100%
As seen above, company has enough capital to invest in the project and there is no
necessity to apply for any bank loan. Company is economically strong. From the total
investment will be (if the project recognized subsidies EU) 45% of total amount [5].
Among the ineligible costs (ineligible expenditure) are expenditures that can not be paid
from grant funds EU. In this case, it is part of the incentives 40%. After the sum of all
eligible and ineligible costs we get the total cost of the project, which amounts to
thousands € 618.78.
3.5.4 ! Profit and Loss account
The tables below show an overview of the anticipated costs, revenues and cash flow in
the operational phase of the project. Operational phase (or project life) will be 10 years.
The project is already taking into account inflation (see. Table 16). The estimated sales
(of services) are as written above (see chapter 3.3), for the first three years of running
project, since 2019 is estimated 5% growth of sales. The whole profit and loss account
table was divided on two parts due maintaining clarity. Due to investment financing
from EU funds is necessary to realize that the depreciated purchase price of fixed assets
reduced by the amount of the subsidy.
Table 18: Profit and Loss account Part 1 (Source: own work) in thousands €
DESCRIPTION /
YEARS
2015 2016 2017 2018 2019
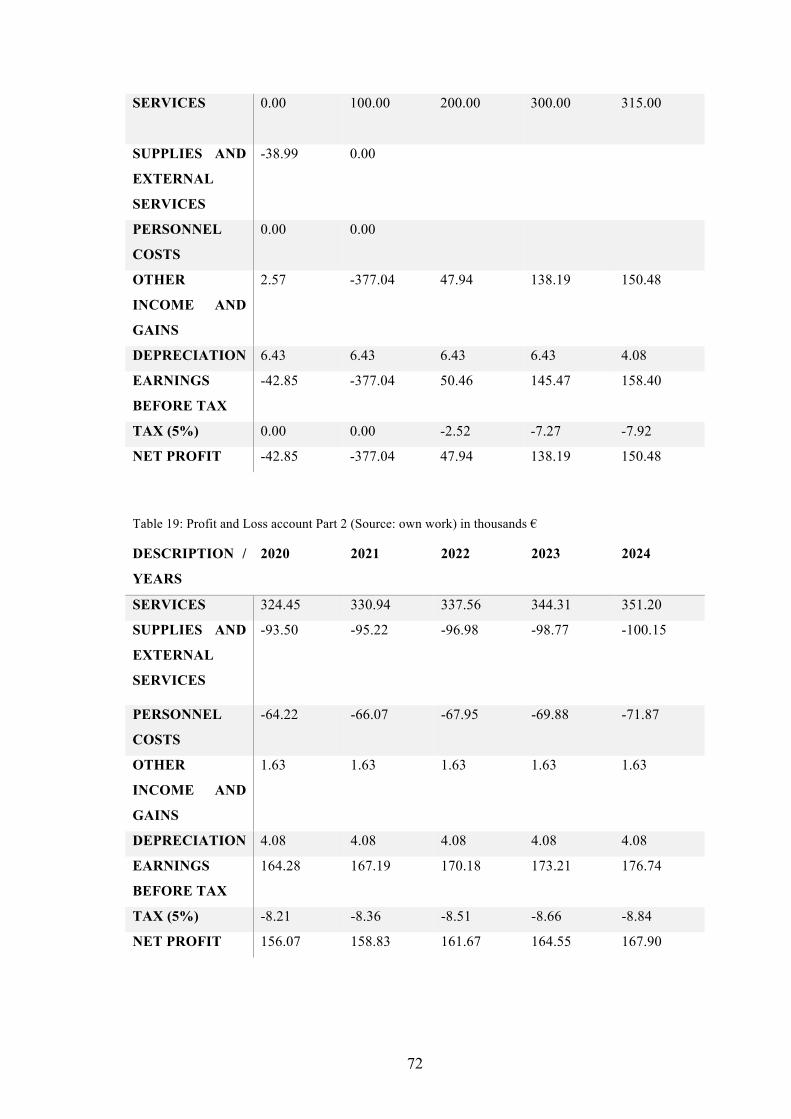
72
SERVICES 0.00
100.00 200.00 300.00 315.00
SUPPLIES AND
EXTERNAL
SERVICES
-38.99 0.00
PERSONNEL
COSTS
0.00
0.00
OTHER
INCOME AND
GAINS
2.57
-377.04 47.94 138.19 150.48
DEPRECIATION 6.43 6.43 6.43 6.43 4.08
EARNINGS
BEFORE TAX
-42.85 -377.04 50.46 145.47 158.40
TAX (5%) 0.00 0.00 -2.52 -7.27 -7.92
NET PROFIT -42.85 -377.04 47.94 138.19 150.48
Table 19: Profit and Loss account Part 2 (Source: own work) in thousands €
DESCRIPTION /
YEARS
2020 2021 2022 2023 2024
SERVICES 324.45 330.94 337.56 344.31 351.20
SUPPLIES AND
EXTERNAL
SERVICES
-93.50 -95.22 -96.98 -98.77 -100.15
PERSONNEL
COSTS
-64.22 -66.07 -67.95 -69.88 -71.87
OTHER
INCOME AND
GAINS
1.63 1.63 1.63 1.63 1.63
DEPRECIATION 4.08 4.08 4.08 4.08 4.08
EARNINGS
BEFORE TAX
164.28 167.19 170.18 173.21 176.74
TAX (5%) -8.21 -8.36 -8.51 -8.66 -8.84
NET PROFIT 156.07 158.83 161.67 164.55 167.90
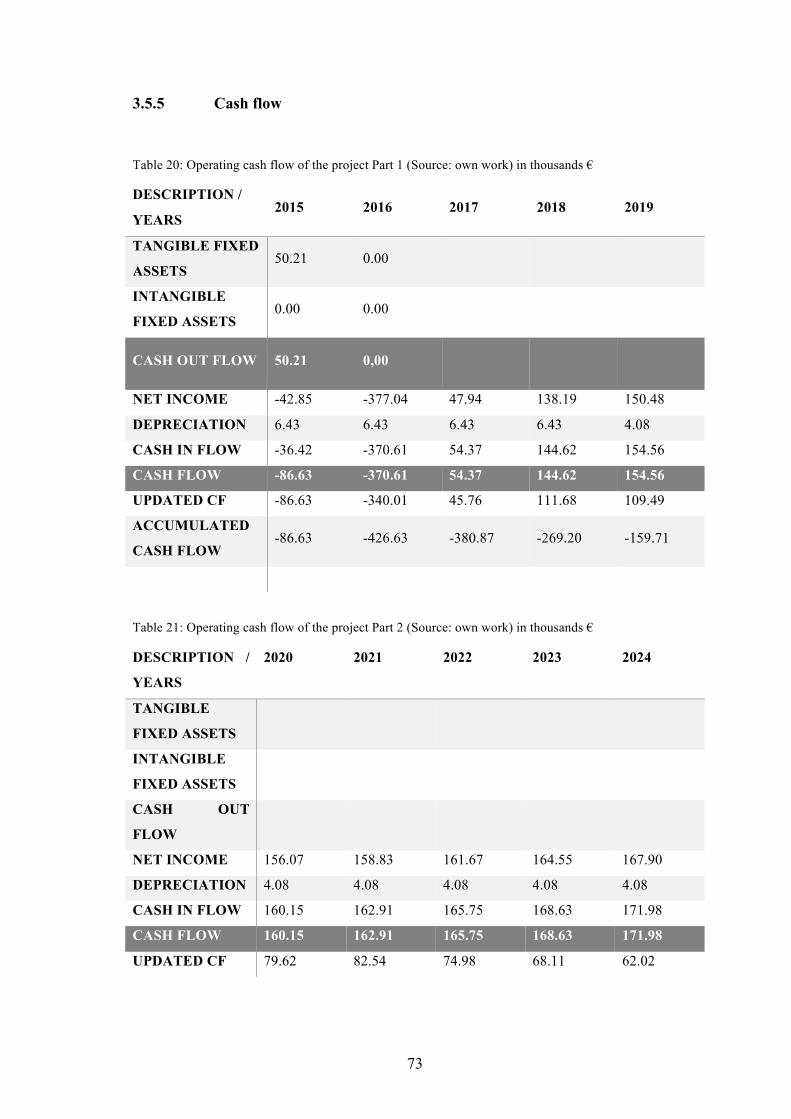
73
3.5.5 ! Cash flow
Table 20: Operating cash flow of the project Part 1 (Source: own work) in thousands €
DESCRIPTION /
YEARS 2015 2016 2017 2018 2019
TANGIBLE FIXED
ASSETS 50.21 0.00
INTANGIBLE
FIXED ASSETS 0.00 0.00
CASH OUT FLOW 50.21 0,00
NET INCOME -42.85 -377.04 47.94 138.19 150.48
DEPRECIATION 6.43 6.43 6.43 6.43 4.08
CASH IN FLOW -36.42 -370.61 54.37 144.62 154.56
CASH FLOW -86.63 -370.61 54.37 144.62 154.56
UPDATED CF -86.63 -340.01 45.76 111.68 109.49
ACCUMULATED
CASH FLOW -86.63 -426.63 -380.87 -269.20 -159.71
Table 21: Operating cash flow of the project Part 2 (Source: own work) in thousands €
DESCRIPTION /
YEARS
2020 2021 2022 2023 2024
TANGIBLE
FIXED ASSETS
INTANGIBLE
FIXED ASSETS
CASH OUT
FLOW
NET INCOME 156.07 158.83 161.67 164.55 167.90
DEPRECIATION 4.08 4.08 4.08 4.08 4.08
CASH IN FLOW 160.15 162.91 165.75 168.63 171.98
CASH FLOW 160.15 162.91 165.75 168.63 171.98
UPDATED CF 79.62 82.54 74.98 68.11 62.02
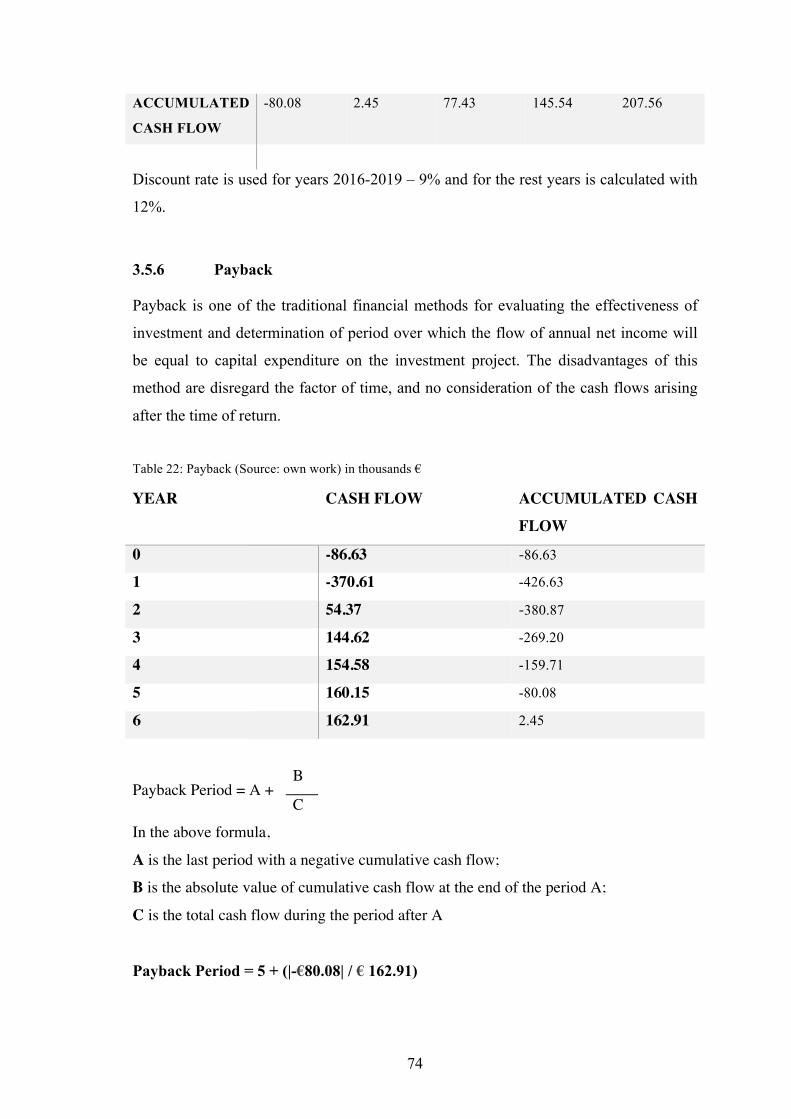
74
ACCUMULATED
CASH FLOW
-80.08 2.45 77.43 145.54 207.56
Discount rate is used for years 2016-2019 – 9% and for the rest years is calculated with
12%.
3.5.6 ! Payback
Payback is one of the traditional financial methods for evaluating the effectiveness of
investment and determination of period over which the flow of annual net income will
be equal to capital expenditure on the investment project. The disadvantages of this
method are disregard the factor of time, and no consideration of the cash flows arising
after the time of return.
Table 22: Payback (Source: own work) in thousands €
YEAR CASH FLOW ACCUMULATED CASH FLOW
0 -86.63 -86.63
1 -370.61 -426.63
2 54.37 -380.87
3 144.62 -269.20
4 154.58 -159.71
5 160.15 -80.08
6 162.91 2.45
Payback Period = A + B
C
In the above formula,
A is the last period with a negative cumulative cash flow;
B is the absolute value of cumulative cash flow at the end of the period A;
C is the total cash flow during the period after A
Payback Period = 5 + (|-€80.08| / € 162.91)
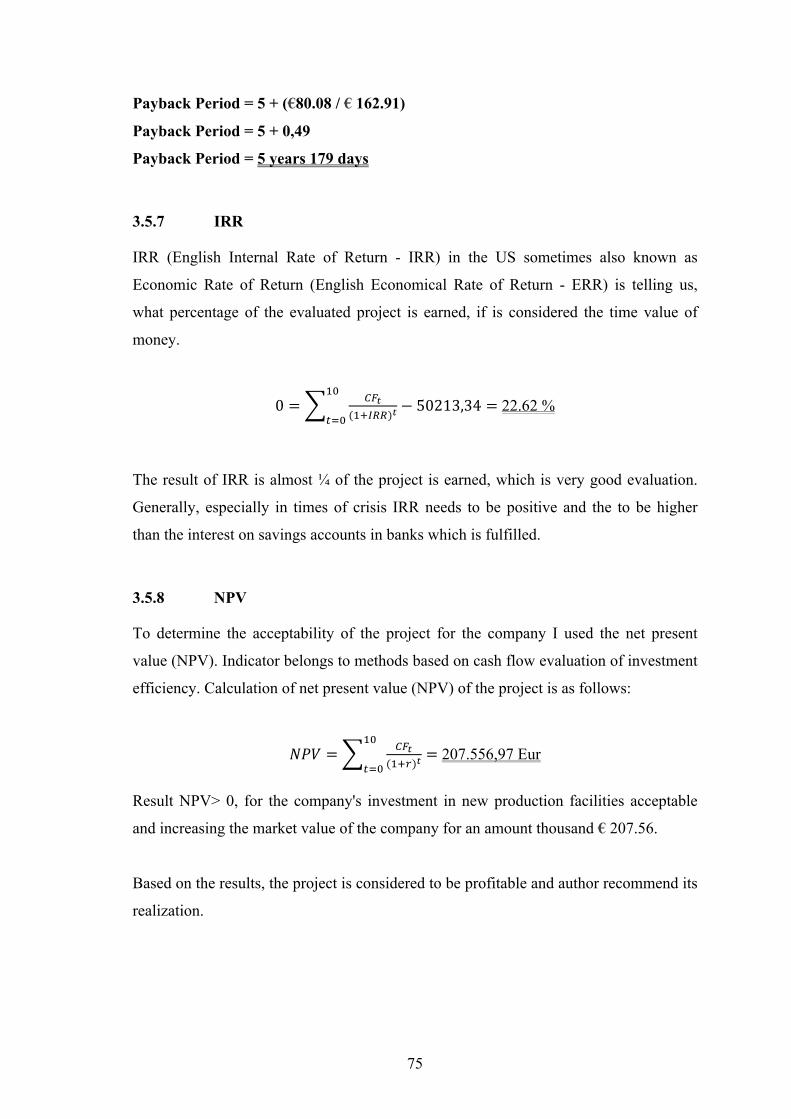
75
Payback Period = 5 + (€80.08 / € 162.91)
Payback Period = 5 + 0,49
Payback Period = 5 years 179 days
3.5.7 ! IRR
IRR (English Internal Rate of Return - IRR) in the US sometimes also known as
Economic Rate of Return (English Economical Rate of Return - ERR) is telling us,
what percentage of the evaluated project is earned, if is considered the time value of
money.
0 = #$%('()**)% − 50213,34 =
'3
453 22.62 %
The result of IRR is almost ¼ of the project is earned, which is very good evaluation.
Generally, especially in times of crisis IRR needs to be positive and the to be higher
than the interest on savings accounts in banks which is fulfilled.
3.5.8 ! NPV
To determine the acceptability of the project for the company I used the net present
value (NPV). Indicator belongs to methods based on cash flow evaluation of investment
efficiency. Calculation of net present value (NPV) of the project is as follows:
678 = #$%('(9)% =
'3
453 207.556,97 Eur
Result NPV> 0, for the company's investment in new production facilities acceptable
and increasing the market value of the company for an amount thousand € 207.56.
Based on the results, the project is considered to be profitable and author recommend its
realization.
76
Conclusion
The purpose of this thesis is to analyse the issue of subsidies from European Union
funds, specifically on the Portuguese and island of Madeira. The aim of this thesis was
with the help of knowledge from the theoretical part of the drafting of a possible project
financed from EU funds in the current programming period 2014 - 2020. The thesis
proposed project plan along with financing options for the processing needs of the
company ABC Ltd. Furthermore, the financial analysis of the company is made and
surveys the current state and financially evaluates the project and its return.
In the first part of the thesis, the theoretical part, are theoretical basis used, as well as
critical analysis of the problems of drawing EU subsidies since the establishment of
funds until to the current programming period 2014-2020. The paper describes the
theoretical basis of operational program firstly in general and than specifically aiming to
Portugal and Madeira.
In the second, analytical part, the author deals with the introduction of the company,
based in Madeira, as well as a PESTL analysis of the company. On the basis of this
draft is created PESTL analysis of selected countries where the company is going to
operate and present itself. These countries were selected on the purpose based on
communication with ABC, Ltd. Spain, Peru and Colombia. These countries, especially
Peru and Colombia, experienced nearly constant economic growth and represent
potential markets for the company. The realization of this investment project falls into
consideration the opportunity to use subsidies from EU funds, which builds on the last
part. Porter five forces analysis is also realized to make a framework of
microenvironment of the company. Thanks SWOT analysis and evaluation of the
various aspects of communication with the company author concludes the possibility of
stagnation clientele company, the company should consider entry into other markets.
Furthermore, it is followed by section, where is presented an outline of the project. At
the end of the chapter are calculated financial analysis of the company, to provide a full
framework of the company.
In the last part, the recommendation part, the work contains its own draft project plan.
After a financial analysis it became clear that the company has a solid capital and is
ready to meet all the requirements to meet specific operational program ERDF
(European Regional Development Fund), namely the program

77
INTERNACIONALIZAR 2020, when this program is exactly what the company aims
to increase competitiveness and increase sales and attract more clients. Chapter also
contains a description of the project through concrete investment proposals, the time
period and anal for financing through the use of subsidies. There are also quantifying
the objective indicators of project eligibility on the basis of methods based on the
criteria of profit and cash flow. Project funding of achievements are positive for the
company, and therefore recommend the project for its implementation.
78
Resources
[1]!A.M. Best, (2014). COLOMBIA - Best's Credit Ratings & Analysis. [online]
Available at: http://www3.ambest.com/ratings/cr/reports/Colombia.pdf
[Accessed 13 Aug. 2015].
[2]!A.M. Best, (2014). PERU - Best's Credit Ratings & Analysis. [online] Available
at: http://www3.ambest.com/ratings/cr/reports/Peru.pdf [Accessed 13 Aug.
2015].
[3]!A.M. Best, (2014). SPAIN - Best's Credit Ratings & Analysis. [online].
Available via: http://www3.ambest.com/ratings/cr/reports/Spain.pdf [Accessed
8 Aug. 2015].
[4]!Andina.com.pe, (2015). La ofensiva social en el VRAEM. [online] Available at:
http://www.andina.com.pe/agencia/noticia-la-ofensiva-social-el-vraem-
418431.aspx [Accessed 13 Aug. 2015].
[5]!Artigo 9. (2015). JORNAL OFICIAL-Quinta-feira, 26 de março de 2015,
[online] Número 52(Série I). Available at: http://www.ideram.pt/files/ISerie-
052-2015-03-26.pdf [Accessed 25 Aug. 2015].
[6]!Cia.gov, (2015). The World Factbook. [online] Available at:
https://www.cia.gov/library/publications/the-world-factbook/geos/co.html
[Accessed 15 Aug. 2015].
[7]!Cia.gov, (2015). The World Factbook. [online] Available at:
https://www.cia.gov/library/publications/the-world-factbook/geos/pe.html
[Accessed 14 Aug. 2015].
[8]!Cia.gov, (2015). The World Factbook. [online] Available at:
https://www.cia.gov/library/publications/the-world-factbook/geos/sp.html
[Accessed 13 Aug. 2015].
[9]!Dall’Erba, S. (2003). European Regional Development Policies: History and
Current Issues. [online] Available at:
http://www.euc.illinois.edu/_includes/docs/dallerba2.pdf [Accessed 19 Aug.
2015].
[10]! Data.worldbank.org, (2015). GINI index (World Bank estimate) | Data |
Table. [online] Available at: http://data.worldbank.org/indicator/SI.POV.GINI
[Accessed 17 Aug. 2015].
79
[11]! Doingbusiness.org, (2015). Doing Business in Colombia - World Bank
Group. [online] Available at:
http://www.doingbusiness.org/data/exploreeconomies/colombia [Accessed 14
Aug. 2015].
[12]! Doingbusiness.org, (2015). Doing Business in Peru - World Bank Group.
[online] Available at: http://www.doingbusiness.org/data/exploreeconomies/peru
[Accessed 13 Aug. 2015].
[13]! Doingbusiness.org, (2015). Doing Business in Spain - World Bank
Group. [online] Available at:
http://www.doingbusiness.org/data/exploreeconomies/spain [Accessed 12 Aug.
2015].
[14]! E.V., Transparency International (2015). How corrupt is your country?.
[online] Transparency.org. Available at:
http://www.transparency.org/cpi2014/results [Accessed 08 Aug. 2015].
[15]! Ec.europa.eu, (2014). Financial instruments in ESIF programmes 2014-
2020. [online] Available at:
http://ec.europa.eu/regional_policy/sources/thefunds/fin_inst/pdf/fi_esif_2014_2
020.pdf [Accessed 19 Aug. 2015].
[16]! Ec.europa.eu, (2015). Gini coefficient of equivalised disposable income.
[online] Available at:
http://ec.europa.eu/eurostat/tgm/table.do?tab=table&language=en&pcode=tessi1
90 [Accessed 16 Aug. 2015].
[17]! Ec.europa.eu, (2014). Guidance for beneficiaries of European Structural
and Investment Funds and related EU instruments. [online] Available from:
http://ec.europa.eu/contracts_grants/pdf/synergies_beneficiaries_en.pdf
[Accessed 19 August 2015].
[18]! Ec.europa.eu, (2015). History of NUTS - Eurostat. [online] Available at:
http://ec.europa.eu/eurostat/web/nuts/history [Accessed 24 Aug. 2015].
[19]! Ec.europa.eu, (2015). Investing in regions: The reformed EU Cohesion
Policy 2014-2020. [online] Available at:
http://ec.europa.eu/regional_policy/sources/docoffic/official/regulation/pdf/2014
/presentation_final_en.ppt [Accessed 24 Aug. 2015].
80
[20]! Ec.europa.eu, (2015). Unemployment rates, seasonally adjusted, June
2015. [online] Available at: http://ec.europa.eu/eurostat/statistics-
explained/index.php/File:Unemployment_rates,_seasonally_adjusted,_June_201
5.png [Accessed 12 Aug. 2015].
[21]! Ec.europa.eu, (2015). Regional Madeira 2014-2020. [online] Available
at: http://ec.europa.eu/regional_policy/EN/atlas/programmes/2014-
2020/portugal/2014pt16m2op006 [Accessed 25 Aug. 2015].
[22]! Ec.europa.eu, (2014). What is an SME? - Small and medium sized
enterprises (SME) - Enterprise and Industry. [online] Available at:
http://ec.europa.eu/enterprise/policies/sme/facts-figures-analysis/sme-
definition/index_en.htm [Accessed 26 Aug. 2015].
[23]! Eur-lex.europa.eu, (2015). EUR-Lex - xy0027 - EN - EUR-
Lex. [online] Available at: http://eur-lex.europa.eu/legal-
content/EN/TXT/?uri=URISERV:xy0027 [Accessed 23 Jul. 2015].
[24]! Eurostat - European Commission, (2011). Regions in the European
Union. Nomenclature of territorial units for statistics. NUTS 2010/EU-27.
[online] Available at: http://epp.eurostat.ec.europa.eu/cache/ITY_OFFPUB/KS-
RA-11-011/EN/KS-RA-11-011-EN.PDF [Accessed 24 Aug. 2015].
[25]! Heritage.org, (2015). Colombia Economy: Population, GDP, Inflation,
Business, Trade, FDI, Corruption. [online] Available at:
http://www.heritage.org/index/country/colombia [Accessed 15 Aug. 2015].
[26]! Heritage.org, (2015). Peru Economy: Population, GDP, Inflation,
Business, Trade, FDI, Corruption. [online] Available at:
http://www.heritage.org/index/country/peru [Accessed 15 Aug. 2015].
[27]! Heritage.org, (2015). Spain Economy: Facts, Population,
Unemployment, GDP, Business, Trade. [online] Available at:
http://www.heritage.org/index/country/spain [Accessed 16 Aug. 2015].
[28]! Ibc-madeira.com, (2015). SDM - Sociedade de Desenvolvimento da
Madeira, S.A.. [online] Available at: http://www.ibc-
madeira.com/about_sdm.aspx?ID=52 [Accessed 4 Aug. 2015].
[29]! Idbdocs.iadb.org, (2015). Innovation and Productivity in the Colombian
Service Industry. [online] Available at:
81
http://idbdocs.iadb.org/wsdocs/getdocument.aspx?docnum=37835794 [Accessed
15 Aug. 2015].
[30]! Ideram.pt, (2015). IDE - Instituto de Desenvolvimento Empresarial.
[online] Available at: http://www.ideram.pt [Accessed 25 Aug. 2015].
[31]! Idr.gov-madeira.pt, (2015). Missão, Valores e Visão - IDR - Instituto de
Desenvolvimento Reginal, IP-RAM. [online] Available at: http://www.idr.gov-
madeira.pt/portal/Conteudo.aspx?IDMenu=1&IDSubMenu=138&Path=138&jm
enu=1 [Accessed 25 Aug. 2015].
[32]! Indexmundi.com, (2015). Colombia - Research and development
expenditure. [online] Available at:
http://www.indexmundi.com/facts/colombia/research-and-development-
expenditure [Accessed 15 Aug. 2015].
[33]! Lexicon.ft.com, (2015). Foreign Direct Investment
Definition from Financial Times Lexicon. [online] Available at:
http://lexicon.ft.com/Term?term=foreign-direct-investment [Accessed 13 Aug.
2015].
[34]! MacGiffen, Steven P, 2005, The European Union. London [u.a.] : Pluto
Press.
[35]! M1420.gov-madeira.pt, (2015). Programa Madeira 14-20. [online]
Available at: http://www.m1420.gov-madeira.pt/ [Accessed 26 Aug. 2015].
[36]! Manzella, Gian Paolo and Mendez, Carlos, 2009, The turning points of
EU Cohesion policy [online]. [Accessed 19 August 2015]. Available from:
http://ec.europa.eu/regional_policy/archive/policy/future/pdf/8_manzella_final-
formatted.pdf
[37]! Marzinotto, Benedicta, 2012, THE GROWTH EFFECTS OF EU
COHESION POLICY: A META-ANALYSIS. Bruegel - The Brussels-based
economic think tank [online]. 2012. [Accessed 20 August 2015]. Available from:
http://bruegel.org/wp-
content/uploads/imported/publications/WP_2012_14_cohesion__2_.pdf
[38]! MECOMeter - Macro Economy Meter, (2015). Internet users -
Comparison between Colombia and Portugal. [online] Available at:
82
http://mecometer.com/compare/colombia+portugal/internet-users/ [Accessed 15
Aug. 2015].
[39]! MECOMeter - Macro Economy Meter, (2015). Internet users -
Comparison between Peru and Portugal. [online] Available at:
http://mecometer.com/compare/peru+portugal/internet-users/ [Accessed 16 Aug.
2015].
[40]! MECOMeter - Macro Economy Meter, (2015). Internet users -
Comparison between Spain and Portugal. [online] Available at:
http://mecometer.com/compare/portugal+spain/internet-users/ [Accessed 16
Aug. 2015].
[41]! Mendez, C. and Bachtler, J. (2015). Prospects for Cohesion Policy in
2014-20 and Beyond: Progress with Programming and Reflections on the
Future. 1st ed. [ebook] Glasgow: European Policies Research Centre. Available
at: http://www.eprc.strath.ac.uk/eprc/documents/PDF_files/EPRP_88.pdf
[Accessed 24 Aug. 2015].
[42]! Pike, J. (2015). Revolutionary Armed Forces of Colombia (FARC).
[online] Globalsecurity.org. Available at:
http://www.globalsecurity.org/military/world/para/farc.htm [Accessed 14 Aug.
2015].
[43]! Thelocal.es, (2014). Spain's R&D spending falls to 2006 levels - The
Local. [online] Available at: http://www.thelocal.es/20141113/spains-rd-
spending-falls-to-2006-level [Accessed 16 Aug. 2015].
[44]! The future of EU cohesion policy as seen by regions and cities.
Luxembourg: Publications Office, 2012. ISBN 978-92-895-0576-5.
[45]! Tradingeconomics.com, (2015). Colombia. [online] Available at:
http://www.tradingeconomics.com/colombia [Accessed 15 Aug. 2015].
[46]! Tradingeconomics.com, (2015). Peru. [online] Available at:
http://www.tradingeconomics.com/peru/population [Accessed 15 Aug. 2015].
[47]! Tradingeconomics.com, (2015). Spain. [online] Available at:
http://www.tradingeconomics.com/spain/population [Accessed 15 Aug. 2015].
[48]! Uspto.gov, (2015). PATENT COUNTS BY ORIGIN AND TYPE, CY
2014. [online] Available at:

83
http://www.uspto.gov/web/offices/ac/ido/oeip/taf/st_co_14.htm [Accessed 16
Aug. 2015]. !
84
List of Figures
Figure 1: The Madeira Hierarchy (Source: own work inspired by [35]) ........................ 26!Figure 2: Structure of assets in particular years (Source: own work) in € ...................... 54!Figure 3: Structure of liabilities in particular years (Source: own work) in € ................ 55!Figure 4: Structure of assets in particular years (Source: own work) ............................. 56!Figure 5: Structure of liabilities in particular years (Source: own work) ....................... 57!
List of Pictures
Picture 1: NUTS Evolution (Source [18]) ...................................................................... 18!Picture 2: Country Risk Tier - Europe (Source: [3]) ....................................................... 34!Picture 3: Political Risk Summary Spain (Source: [3]) .................................................. 36!Picture 4: Country Risk Tier - Latin America (Source: [2]) ........................................... 40!Picture 5: Political Risk Summary Peru (Source: [2]) .................................................... 42!Picture 6: Political Risk Summary Colombia (Source: [1]) ............................................ 46!Picture 7: NUTS map of Portugal (Source: [24]) ........................................................... 85!Picture 8: Map 1 - Structural Funds (ERDF and ESF) (Source: [19]) ............................ 86!
List of Tables
Table 1: NUTS population thresholds (Source: own work based on [18]) ..................... 18!Table 2: NUTS classification in Portugal (Source: own work based on [18]) ............... 18!Table 3 : Changes relating to the ERDF and ESF (Source: [15]) ................................... 21!Table 4: Operational Programmes of Portugal (Source: [19]) in thousands € ................ 22!Table 5: Money allocation (Source: own work inspired by [21]) in thousands € .......... 24!Table 6: Definition of SMEs (Source: [22]) ................................................................... 30!Table 7: Horizontal analysis of assets (Source: own source) in thousands € ................. 53!Table 8: Horizontal analysis of liabilities (Source: own source) in thousands € ............ 54!Table 9: Vertical analysis of assets (Source: own source) in thousands € ...................... 55!Table 10: Vertical analysis of liabilities (Source: own source) in thousands € .............. 56!Table 11: Profitability ratios (Source: own work) .......................................................... 58!Table 12: Liquidity indicators (Source: own work) ........................................................ 59!Table 13: Activity indicators (Source: own work) ......................................................... 60!Table 14: ABC Ltd. SWOT analysis (Source: own work) ............................................. 61!Table 15: Project components and schedule (Source: own work) .................................. 68!Table 16: Estimated inflation rate and and set up supplier - customer relationship
(Source: own work) ................................................................................................. 70!Table 17: Financial resources of the company (Source: own work) in thousands € ...... 70!Table 18: Profit and Loss account Part 1 (Source: own work) in thousands € ............... 71!Table 19: Profit and Loss account Part 2 (Source: own work) in thousands € ............... 72!Table 20: Operating cash flow of the project Part 1 (Source: own work) in thousands €
................................................................................................................................. 73!Table 21: Operating cash flow of the project Part 2 (Source: own work) in thousands €
................................................................................................................................. 73!Table 22: Payback (Source: own work) in thousands € .................................................. 74!
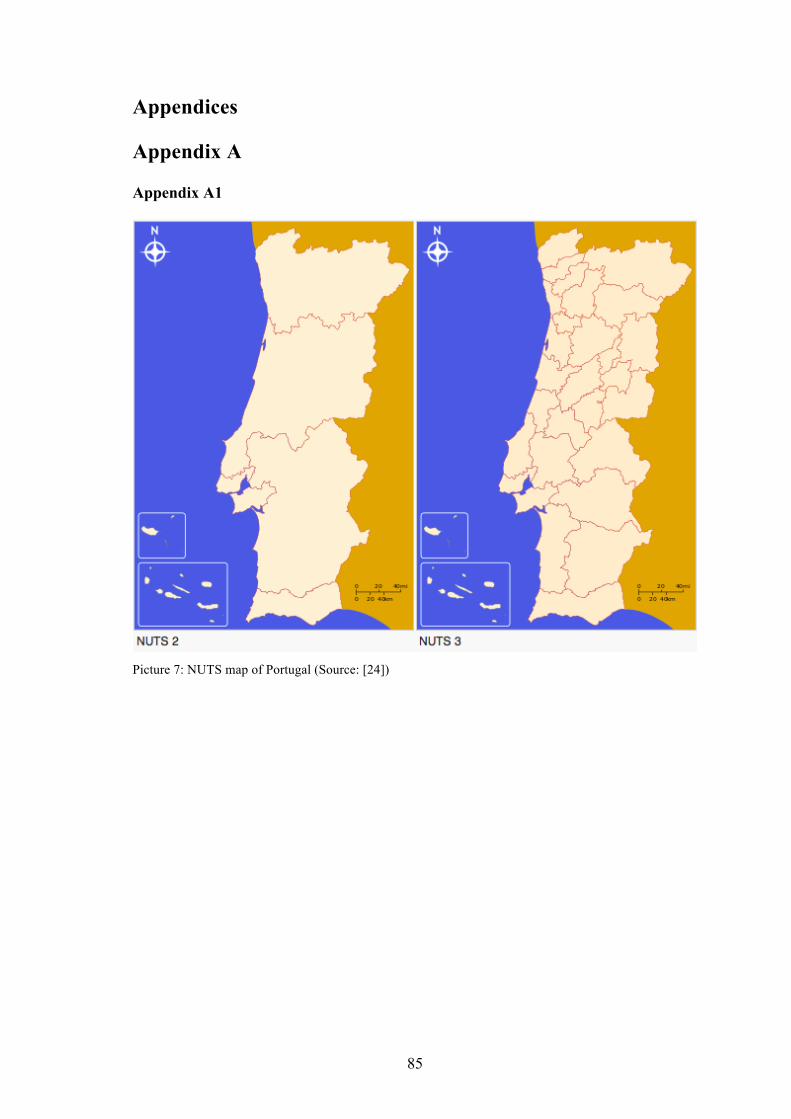
85
Appendices
Appendix A
Appendix A1
Picture 7: NUTS map of Portugal (Source: [24])
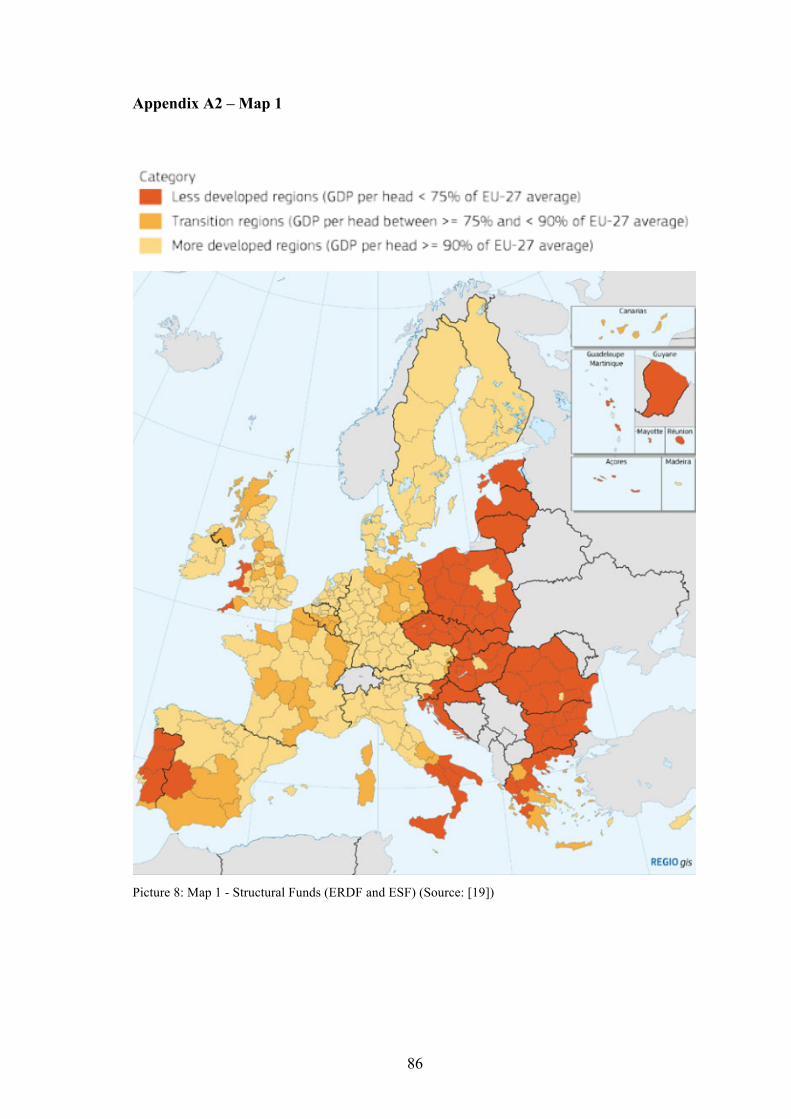
86
Appendix A2 – Map 1
Picture 8: Map 1 - Structural Funds (ERDF and ESF) (Source: [19])